Zip Codes with the Highest Percentage of Population Employed in Administrative & Support Services in Livonia, MI
RELATED REPORTS & OPTIONS
Administrative & Support Services
Livonia
Compare Zip Codes
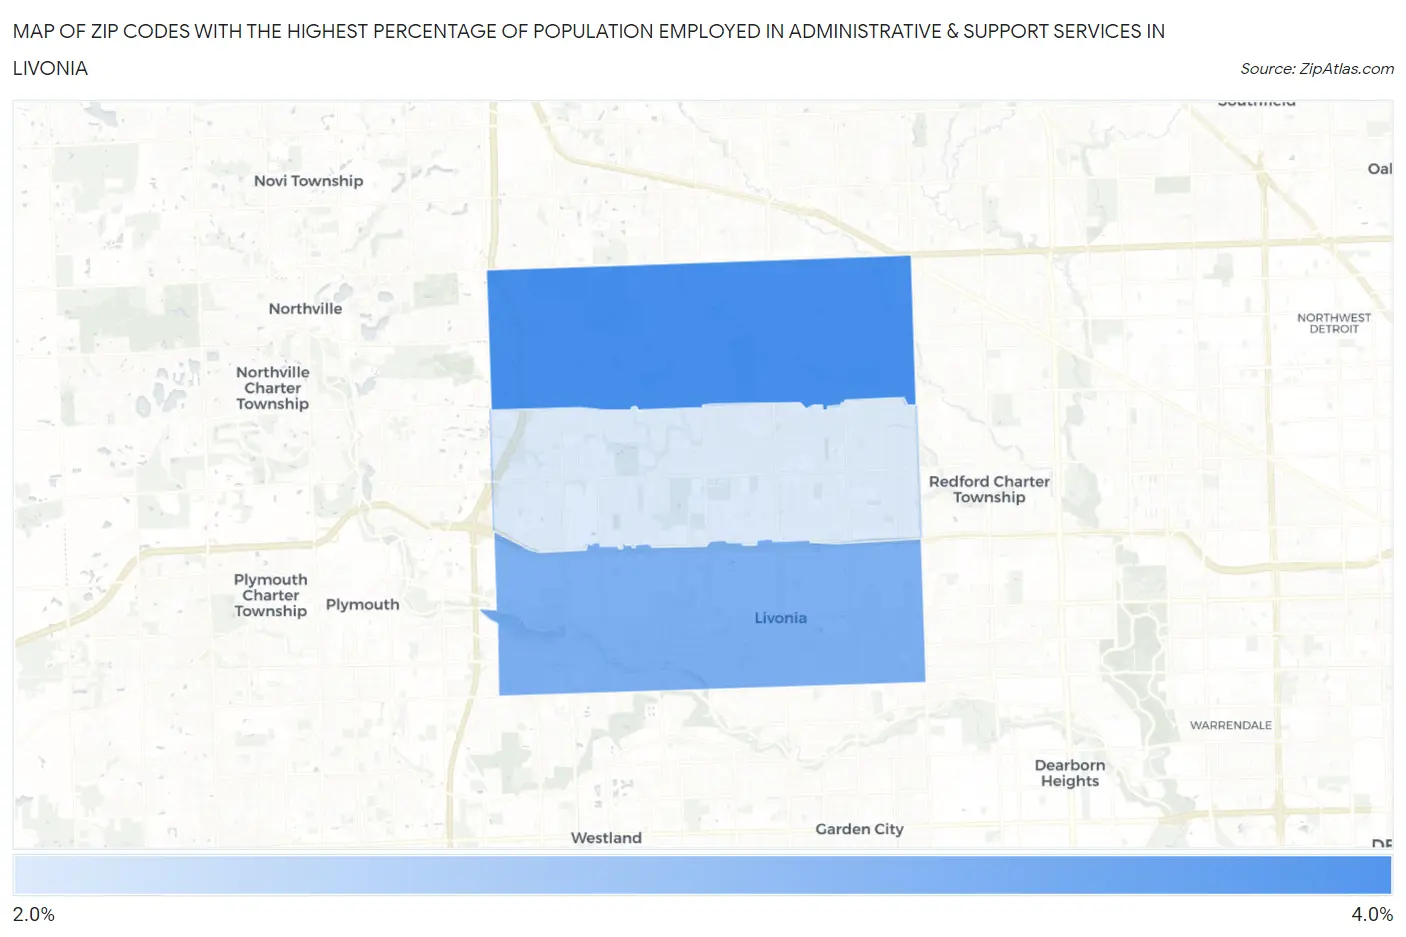
Map of Zip Codes with the Highest Percentage of Population Employed in Administrative & Support Services in Livonia
3.0%
3.5%
Zip Codes with the Highest Percentage of Population Employed in Administrative & Support Services in Livonia, MI
| Zip Code | % Employed | vs State | vs National | |
| 1. | 48152 | 3.5% | 3.7%(-0.232)#402 | 4.1%(-0.654)#12,994 |
| 2. | 48150 | 3.3% | 3.7%(-0.414)#450 | 4.1%(-0.836)#13,872 |
| 3. | 48154 | 3.0% | 3.7%(-0.749)#523 | 4.1%(-1.17)#15,583 |
1
Common Questions
What are the Top Zip Codes with the Highest Percentage of Population Employed in Administrative & Support Services in Livonia, MI?
Top Zip Codes with the Highest Percentage of Population Employed in Administrative & Support Services in Livonia, MI are:
What zip code has the Highest Percentage of Population Employed in Administrative & Support Services in Livonia, MI?
48152 has the Highest Percentage of Population Employed in Administrative & Support Services in Livonia, MI with 3.5%.
What is the Percentage of Population Employed in Administrative & Support Services in Livonia, MI?
Percentage of Population Employed in Administrative & Support Services in Livonia is 3.2%.
What is the Percentage of Population Employed in Administrative & Support Services in Michigan?
Percentage of Population Employed in Administrative & Support Services in Michigan is 3.7%.
What is the Percentage of Population Employed in Administrative & Support Services in the United States?
Percentage of Population Employed in Administrative & Support Services in the United States is 4.1%.