Plainwell, MI Map & Demographics
Plainwell Map
Plainwell Overview
$26,753
PER CAPITA INCOME
$61,750
AVG FAMILY INCOME
$61,086
AVG HOUSEHOLD INCOME
36.3%
WAGE / INCOME GAP [ % ]
63.7¢/ $1
WAGE / INCOME GAP [ $ ]
0.36
INEQUALITY / GINI INDEX
3,763
TOTAL POPULATION
1,868
MALE POPULATION
1,895
FEMALE POPULATION
98.58
MALES / 100 FEMALES
101.45
FEMALES / 100 MALES
39.5
MEDIAN AGE
2.8
AVG FAMILY SIZE
2.4
AVG HOUSEHOLD SIZE
1,783
LABOR FORCE [ PEOPLE ]
57.2%
PERCENT IN LABOR FORCE
5.8%
UNEMPLOYMENT RATE
Plainwell Zip Codes
Plainwell Area Codes
Income in Plainwell
Income Overview in Plainwell
Per Capita Income in Plainwell is $26,753, while median incomes of families and households are $61,750 and $61,086 respectively.
| Characteristic | Number | Measure |
| Per Capita Income | 3,763 | $26,753 |
| Median Family Income | 1,047 | $61,750 |
| Mean Family Income | 1,047 | $67,485 |
| Median Household Income | 1,498 | $61,086 |
| Mean Household Income | 1,498 | $64,015 |
| Income Deficit | 1,047 | $0 |
| Wage / Income Gap (%) | 3,763 | 36.30% |
| Wage / Income Gap ($) | 3,763 | 63.70¢ per $1 |
| Gini / Inequality Index | 3,763 | 0.36 |
Earnings by Sex in Plainwell
Average Earnings in Plainwell are $33,635, $45,435 for men and $28,944 for women, a difference of 36.3%.
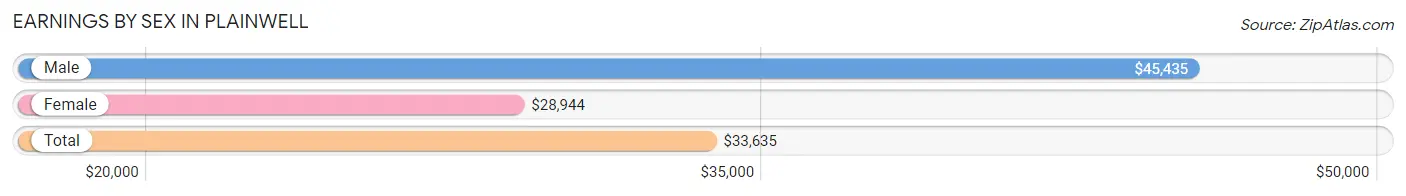
| Sex | Number | Average Earnings |
| Male | 904 (48.7%) | $45,435 |
| Female | 953 (51.3%) | $28,944 |
| Total | 1,857 (100.0%) | $33,635 |
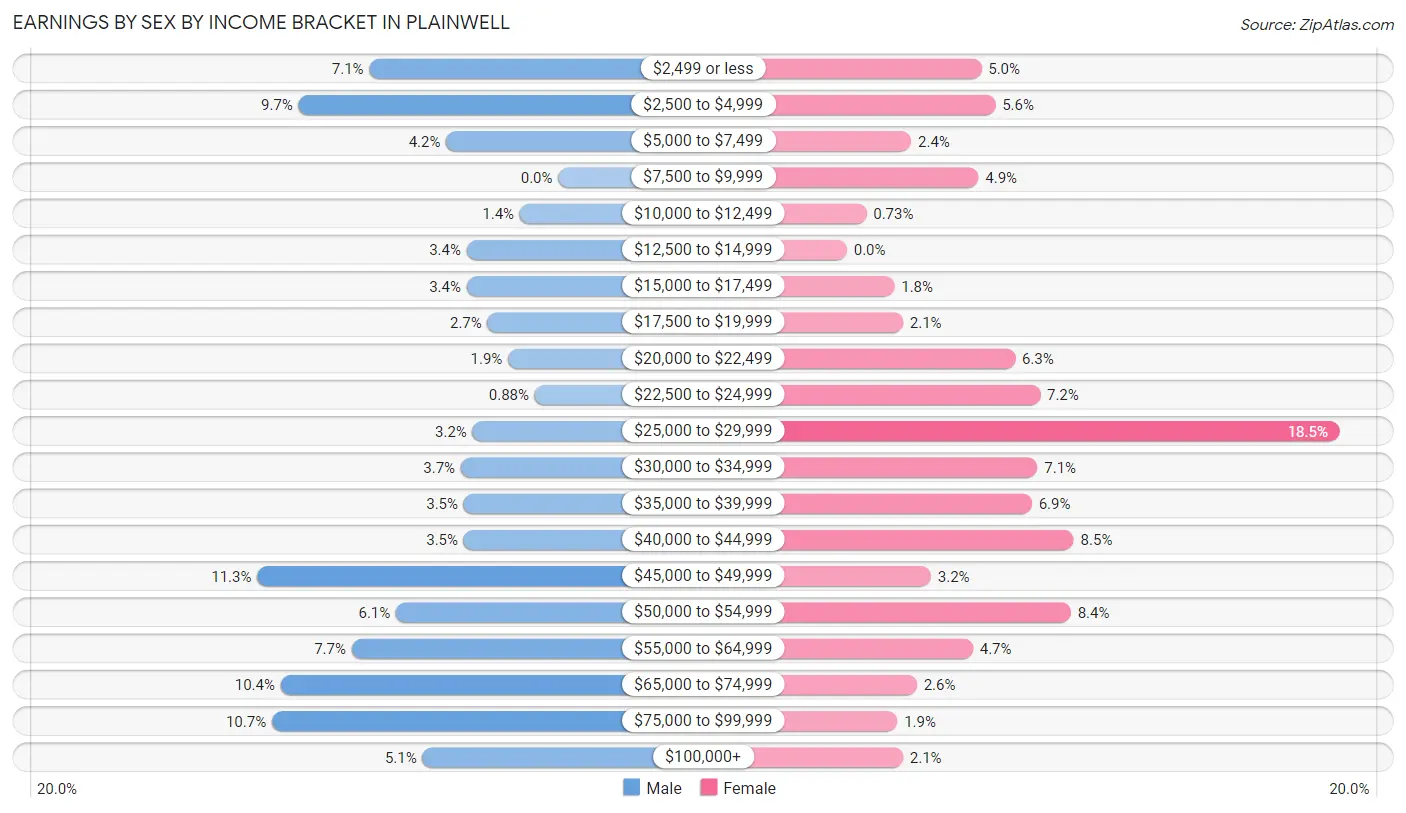
Earnings by Sex by Income Bracket in Plainwell
The most common earnings brackets in Plainwell are $45,000 to $49,999 for men (102 | 11.3%) and $25,000 to $29,999 for women (176 | 18.5%).
| Income | Male | Female |
| $2,499 or less | 64 (7.1%) | 48 (5.0%) |
| $2,500 to $4,999 | 88 (9.7%) | 53 (5.6%) |
| $5,000 to $7,499 | 38 (4.2%) | 23 (2.4%) |
| $7,500 to $9,999 | 0 (0.0%) | 47 (4.9%) |
| $10,000 to $12,499 | 13 (1.4%) | 7 (0.7%) |
| $12,500 to $14,999 | 31 (3.4%) | 0 (0.0%) |
| $15,000 to $17,499 | 31 (3.4%) | 17 (1.8%) |
| $17,500 to $19,999 | 24 (2.6%) | 20 (2.1%) |
| $20,000 to $22,499 | 17 (1.9%) | 60 (6.3%) |
| $22,500 to $24,999 | 8 (0.9%) | 69 (7.2%) |
| $25,000 to $29,999 | 29 (3.2%) | 176 (18.5%) |
| $30,000 to $34,999 | 33 (3.6%) | 68 (7.1%) |
| $35,000 to $39,999 | 32 (3.5%) | 66 (6.9%) |
| $40,000 to $44,999 | 32 (3.5%) | 81 (8.5%) |
| $45,000 to $49,999 | 102 (11.3%) | 30 (3.2%) |
| $50,000 to $54,999 | 55 (6.1%) | 80 (8.4%) |
| $55,000 to $64,999 | 70 (7.7%) | 45 (4.7%) |
| $65,000 to $74,999 | 94 (10.4%) | 25 (2.6%) |
| $75,000 to $99,999 | 97 (10.7%) | 18 (1.9%) |
| $100,000+ | 46 (5.1%) | 20 (2.1%) |
| Total | 904 (100.0%) | 953 (100.0%) |
Earnings by Sex by Educational Attainment in Plainwell
Average earnings in Plainwell are $48,030 for men and $29,794 for women, a difference of 38.0%. Men with an educational attainment of bachelor's degree enjoy the highest average annual earnings of $80,577, while those with college or associate's degree education earn the least with $45,199. Women with an educational attainment of graduate degree earn the most with the average annual earnings of $73,654, while those with high school diploma education have the smallest earnings of $28,627.
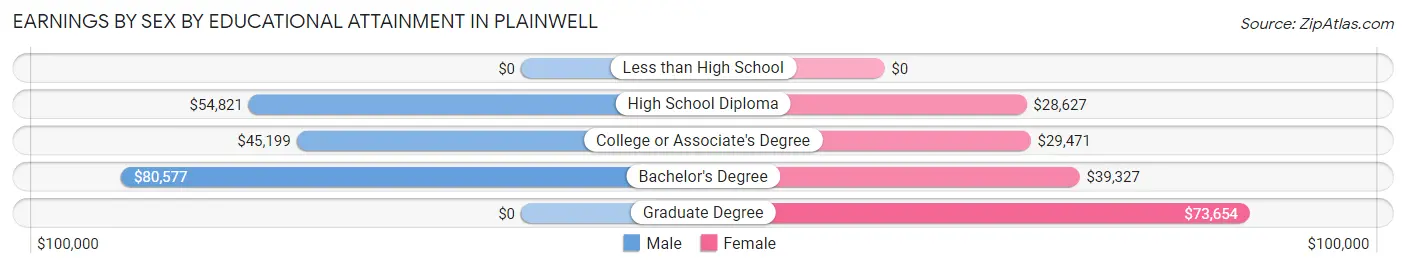
| Educational Attainment | Male Income | Female Income |
| Less than High School | - | - |
| High School Diploma | $54,821 | $28,627 |
| College or Associate's Degree | $45,199 | $29,471 |
| Bachelor's Degree | $80,577 | $39,327 |
| Graduate Degree | - | - |
| Total | $48,030 | $29,794 |
Family Income in Plainwell
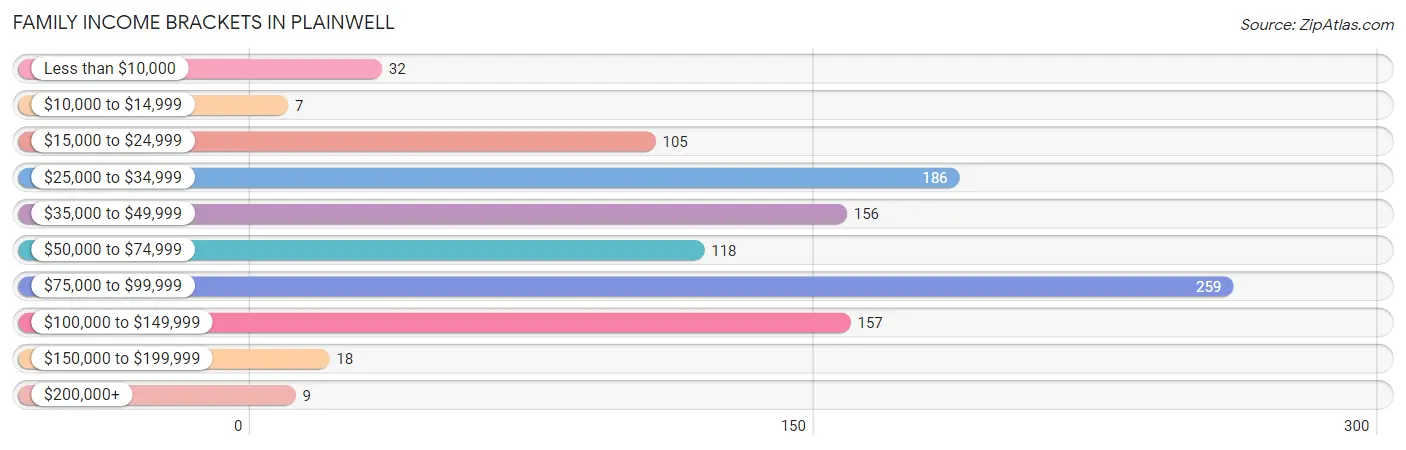
Family Income Brackets in Plainwell
According to the Plainwell family income data, there are 259 families falling into the $75,000 to $99,999 income range, which is the most common income bracket and makes up 24.7% of all families. Conversely, the $10,000 to $14,999 income bracket is the least frequent group with only 7 families (0.7%) belonging to this category.
| Income Bracket | # Families | % Families |
| Less than $10,000 | 32 | 3.1% |
| $10,000 to $14,999 | 7 | 0.7% |
| $15,000 to $24,999 | 105 | 10.0% |
| $25,000 to $34,999 | 186 | 17.8% |
| $35,000 to $49,999 | 156 | 14.9% |
| $50,000 to $74,999 | 118 | 11.3% |
| $75,000 to $99,999 | 259 | 24.7% |
| $100,000 to $149,999 | 157 | 15.0% |
| $150,000 to $199,999 | 18 | 1.7% |
| $200,000+ | 9 | 0.9% |
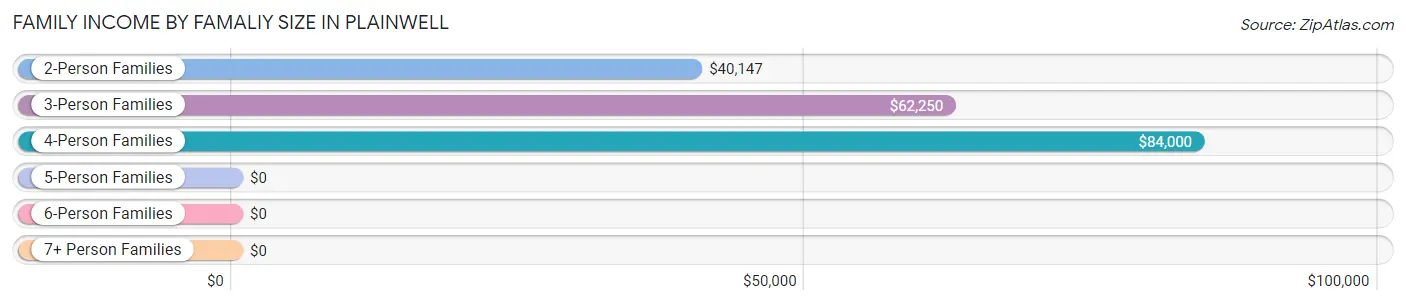
Family Income by Famaliy Size in Plainwell
4-person families (314 | 30.0%) account for the highest median family income in Plainwell with $84,000 per family, while 4-person families (314 | 30.0%) have the highest median income of $21,000 per family member.
| Income Bracket | # Families | Median Income |
| 2-Person Families | 508 (48.5%) | $40,147 |
| 3-Person Families | 217 (20.7%) | $62,250 |
| 4-Person Families | 314 (30.0%) | $84,000 |
| 5-Person Families | 8 (0.8%) | $0 |
| 6-Person Families | 0 (0.0%) | $0 |
| 7+ Person Families | 0 (0.0%) | $0 |
| Total | 1,047 (100.0%) | $61,750 |
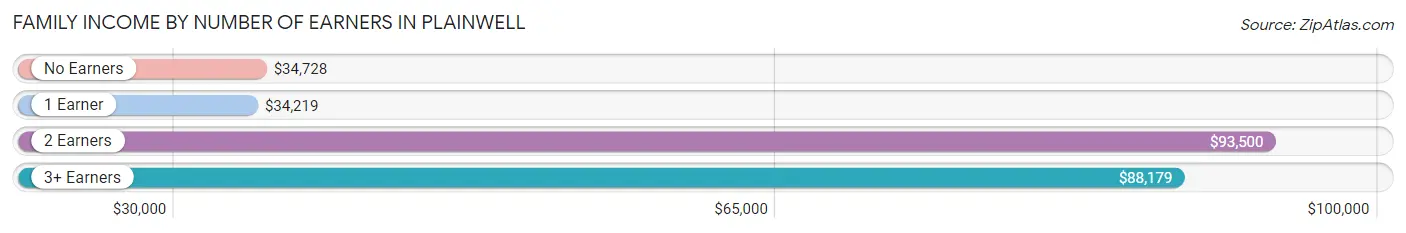
Family Income by Number of Earners in Plainwell
The median family income in Plainwell is $61,750, with families comprising 2 earners (234) having the highest median family income of $93,500, while families with 1 earner (361) have the lowest median family income of $34,219, accounting for 22.4% and 34.5% of families, respectively.
| Number of Earners | # Families | Median Income |
| No Earners | 251 (24.0%) | $34,728 |
| 1 Earner | 361 (34.5%) | $34,219 |
| 2 Earners | 234 (22.4%) | $93,500 |
| 3+ Earners | 201 (19.2%) | $88,179 |
| Total | 1,047 (100.0%) | $61,750 |
Household Income in Plainwell
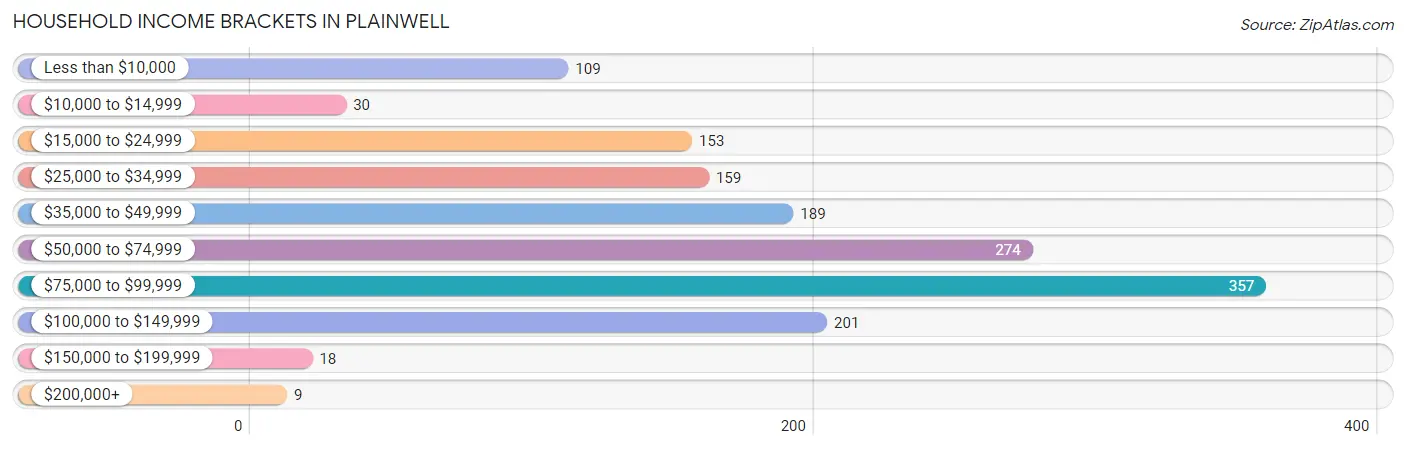
Household Income Brackets in Plainwell
With 357 households falling in the category, the $75,000 to $99,999 income range is the most frequent in Plainwell, accounting for 23.8% of all households. In contrast, only 9 households (0.6%) fall into the $200,000+ income bracket, making it the least populous group.
| Income Bracket | # Households | % Households |
| Less than $10,000 | 109 | 7.3% |
| $10,000 to $14,999 | 30 | 2.0% |
| $15,000 to $24,999 | 153 | 10.2% |
| $25,000 to $34,999 | 159 | 10.6% |
| $35,000 to $49,999 | 189 | 12.6% |
| $50,000 to $74,999 | 274 | 18.3% |
| $75,000 to $99,999 | 357 | 23.8% |
| $100,000 to $149,999 | 201 | 13.4% |
| $150,000 to $199,999 | 18 | 1.2% |
| $200,000+ | 9 | 0.6% |
Household Income by Householder Age in Plainwell
The median household income in Plainwell is $61,086, with the highest median household income of $78,774 found in the 25 to 44 years age bracket for the primary householder. A total of 596 households (39.8%) fall into this category. Meanwhile, the 65+ years age bracket for the primary householder has the lowest median household income of $44,643, with 448 households (29.9%) in this group.
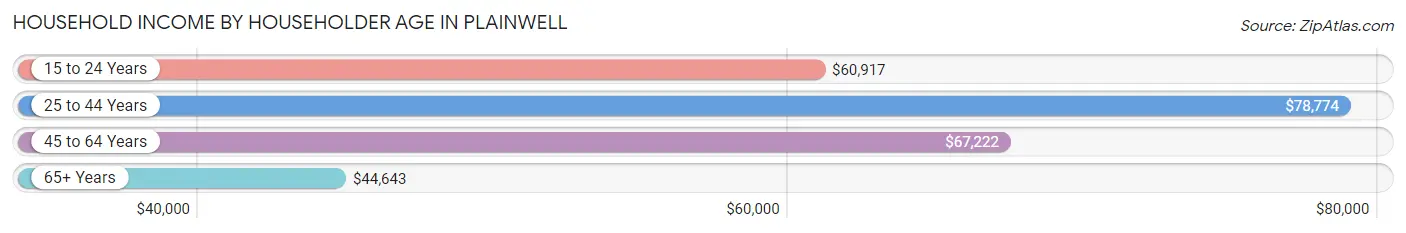
| Income Bracket | # Households | Median Income |
| 15 to 24 Years | 58 (3.9%) | $60,917 |
| 25 to 44 Years | 596 (39.8%) | $78,774 |
| 45 to 64 Years | 396 (26.4%) | $67,222 |
| 65+ Years | 448 (29.9%) | $44,643 |
| Total | 1,498 (100.0%) | $61,086 |
Poverty in Plainwell
Income Below Poverty by Sex and Age in Plainwell
With 9.6% poverty level for males and 12.9% for females among the residents of Plainwell, 75 year old and over males and 55 to 64 year old females are the most vulnerable to poverty, with 19 males (46.3%) and 66 females (31.9%) in their respective age groups living below the poverty level.
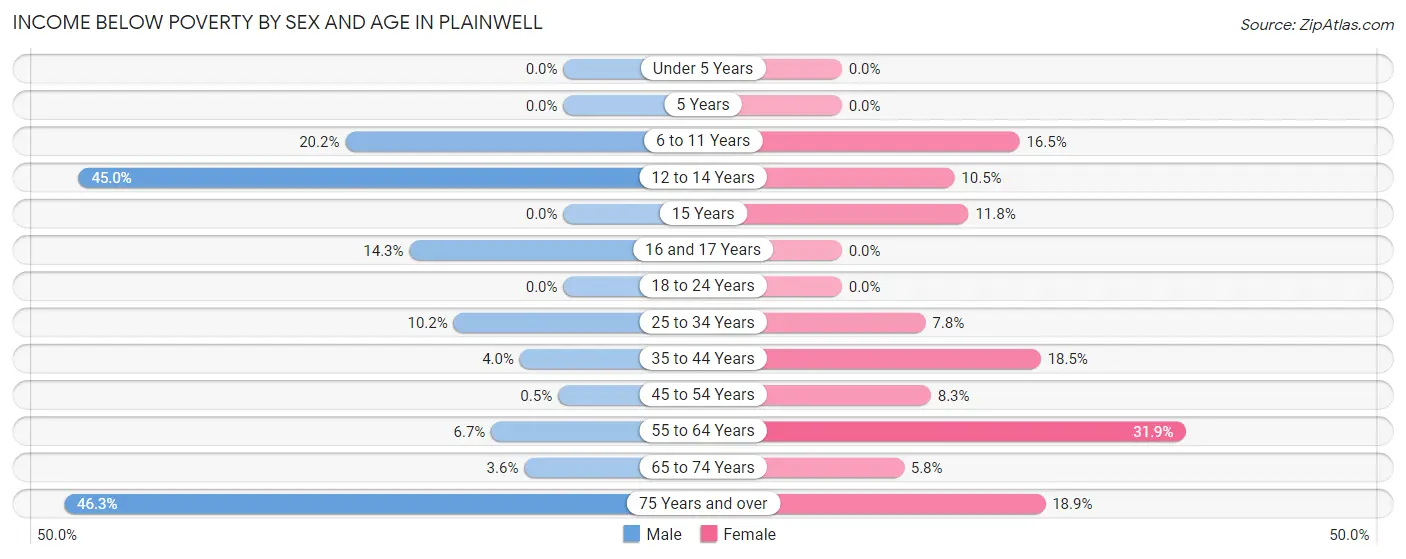
| Age Bracket | Male | Female |
| Under 5 Years | 0 (0.0%) | 0 (0.0%) |
| 5 Years | 0 (0.0%) | 0 (0.0%) |
| 6 to 11 Years | 17 (20.2%) | 16 (16.5%) |
| 12 to 14 Years | 72 (45.0%) | 14 (10.4%) |
| 15 Years | 0 (0.0%) | 4 (11.8%) |
| 16 and 17 Years | 4 (14.3%) | 0 (0.0%) |
| 18 to 24 Years | 0 (0.0%) | 0 (0.0%) |
| 25 to 34 Years | 27 (10.2%) | 19 (7.8%) |
| 35 to 44 Years | 13 (4.0%) | 67 (18.5%) |
| 45 to 54 Years | 1 (0.5%) | 9 (8.3%) |
| 55 to 64 Years | 13 (6.7%) | 66 (31.9%) |
| 65 to 74 Years | 9 (3.6%) | 13 (5.8%) |
| 75 Years and over | 19 (46.3%) | 27 (18.9%) |
| Total | 175 (9.6%) | 235 (12.9%) |
Income Above Poverty by Sex and Age in Plainwell
According to the poverty statistics in Plainwell, males aged under 5 years and females aged under 5 years are the age groups that are most secure financially, with 100.0% of males and 100.0% of females in these age groups living above the poverty line.
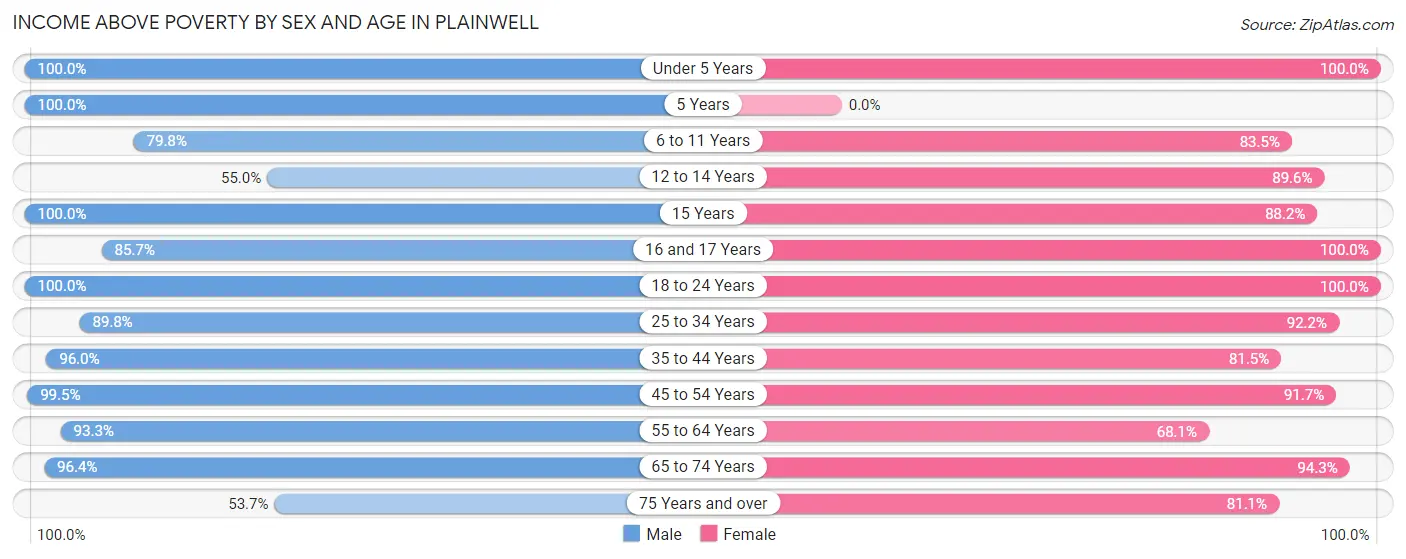
| Age Bracket | Male | Female |
| Under 5 Years | 51 (100.0%) | 63 (100.0%) |
| 5 Years | 8 (100.0%) | 0 (0.0%) |
| 6 to 11 Years | 67 (79.8%) | 81 (83.5%) |
| 12 to 14 Years | 88 (55.0%) | 120 (89.5%) |
| 15 Years | 14 (100.0%) | 30 (88.2%) |
| 16 and 17 Years | 24 (85.7%) | 40 (100.0%) |
| 18 to 24 Years | 211 (100.0%) | 166 (100.0%) |
| 25 to 34 Years | 238 (89.8%) | 226 (92.2%) |
| 35 to 44 Years | 309 (96.0%) | 296 (81.5%) |
| 45 to 54 Years | 199 (99.5%) | 100 (91.7%) |
| 55 to 64 Years | 181 (93.3%) | 141 (68.1%) |
| 65 to 74 Years | 239 (96.4%) | 213 (94.3%) |
| 75 Years and over | 22 (53.7%) | 116 (81.1%) |
| Total | 1,651 (90.4%) | 1,592 (87.1%) |
Income Below Poverty Among Married-Couple Families in Plainwell
The poverty statistics for married-couple families in Plainwell show that 5.2% or 34 of the total 652 families live below the poverty line. Families with 1 or 2 children have the highest poverty rate of 5.6%, comprising of 14 families. On the other hand, families with 3 or 4 children have the lowest poverty rate of 0.0%, which includes 0 families.
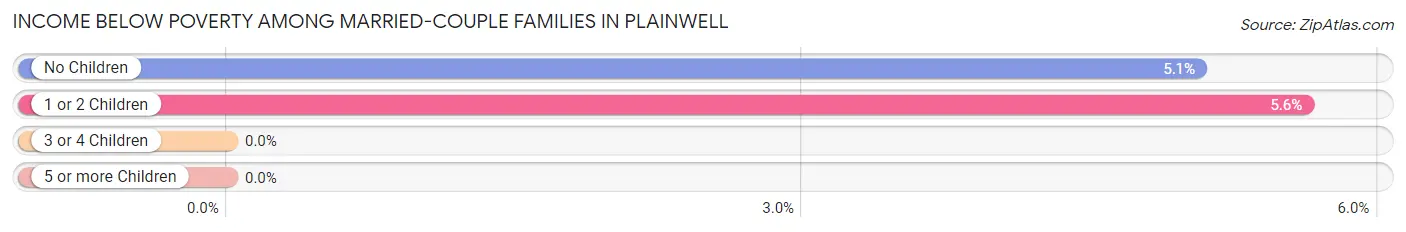
| Children | Above Poverty | Below Poverty |
| No Children | 375 (94.9%) | 20 (5.1%) |
| 1 or 2 Children | 235 (94.4%) | 14 (5.6%) |
| 3 or 4 Children | 8 (100.0%) | 0 (0.0%) |
| 5 or more Children | 0 (0.0%) | 0 (0.0%) |
| Total | 618 (94.8%) | 34 (5.2%) |
Income Below Poverty Among Single-Parent Households in Plainwell
According to the poverty data in Plainwell, 11.8% or 13 single-father households and 23.9% or 68 single-mother households are living below the poverty line. Among single-father households, those with 1 or 2 children have the highest poverty rate, with 13 households (11.8%) experiencing poverty. Likewise, among single-mother households, those with 1 or 2 children have the highest poverty rate, with 68 households (30.6%) falling below the poverty line.
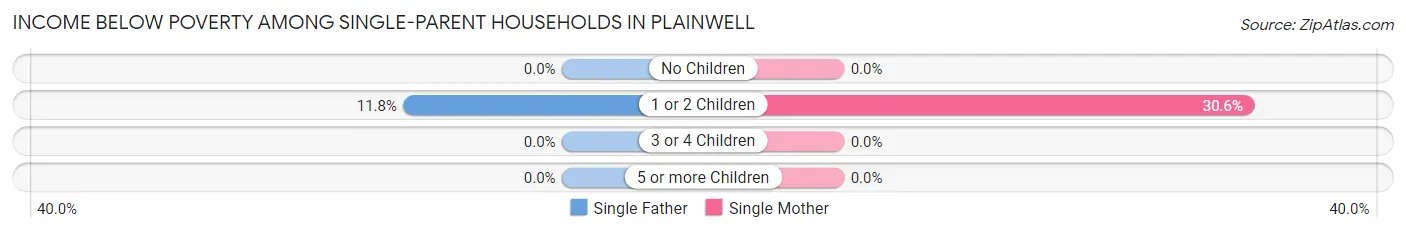
| Children | Single Father | Single Mother |
| No Children | 0 (0.0%) | 0 (0.0%) |
| 1 or 2 Children | 13 (11.8%) | 68 (30.6%) |
| 3 or 4 Children | 0 (0.0%) | 0 (0.0%) |
| 5 or more Children | 0 (0.0%) | 0 (0.0%) |
| Total | 13 (11.8%) | 68 (23.9%) |
Income Below Poverty Among Married-Couple vs Single-Parent Households in Plainwell
The poverty data for Plainwell shows that 34 of the married-couple family households (5.2%) and 81 of the single-parent households (20.5%) are living below the poverty level. Within the married-couple family households, those with 1 or 2 children have the highest poverty rate, with 14 households (5.6%) falling below the poverty line. Among the single-parent households, those with 1 or 2 children have the highest poverty rate, with 81 household (24.4%) living below poverty.
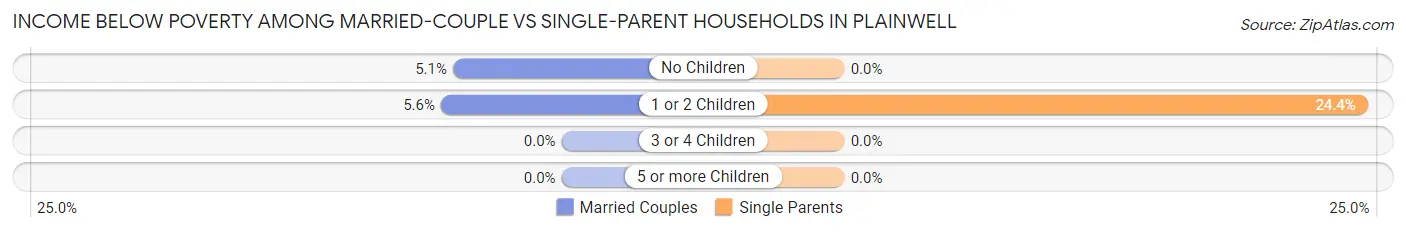
| Children | Married-Couple Families | Single-Parent Households |
| No Children | 20 (5.1%) | 0 (0.0%) |
| 1 or 2 Children | 14 (5.6%) | 81 (24.4%) |
| 3 or 4 Children | 0 (0.0%) | 0 (0.0%) |
| 5 or more Children | 0 (0.0%) | 0 (0.0%) |
| Total | 34 (5.2%) | 81 (20.5%) |
Race in Plainwell
The most populous races in Plainwell are White / Caucasian (3,485 | 92.6%), Hispanic or Latino (475 | 12.6%), and Two or more Races (153 | 4.1%).
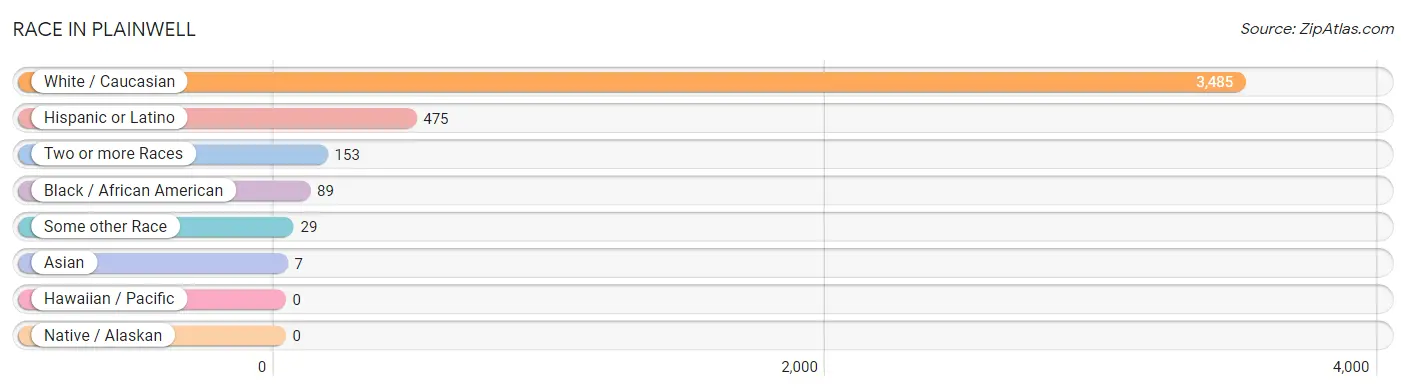
| Race | # Population | % Population |
| Asian | 7 | 0.2% |
| Black / African American | 89 | 2.4% |
| Hawaiian / Pacific | 0 | 0.0% |
| Hispanic or Latino | 475 | 12.6% |
| Native / Alaskan | 0 | 0.0% |
| White / Caucasian | 3,485 | 92.6% |
| Two or more Races | 153 | 4.1% |
| Some other Race | 29 | 0.8% |
| Total | 3,763 | 100.0% |
Ancestry in Plainwell
The most populous ancestries reported in Plainwell are German (671 | 17.8%), Mexican (471 | 12.5%), English (444 | 11.8%), Dutch (443 | 11.8%), and Irish (345 | 9.2%), together accounting for 63.1% of all Plainwell residents.
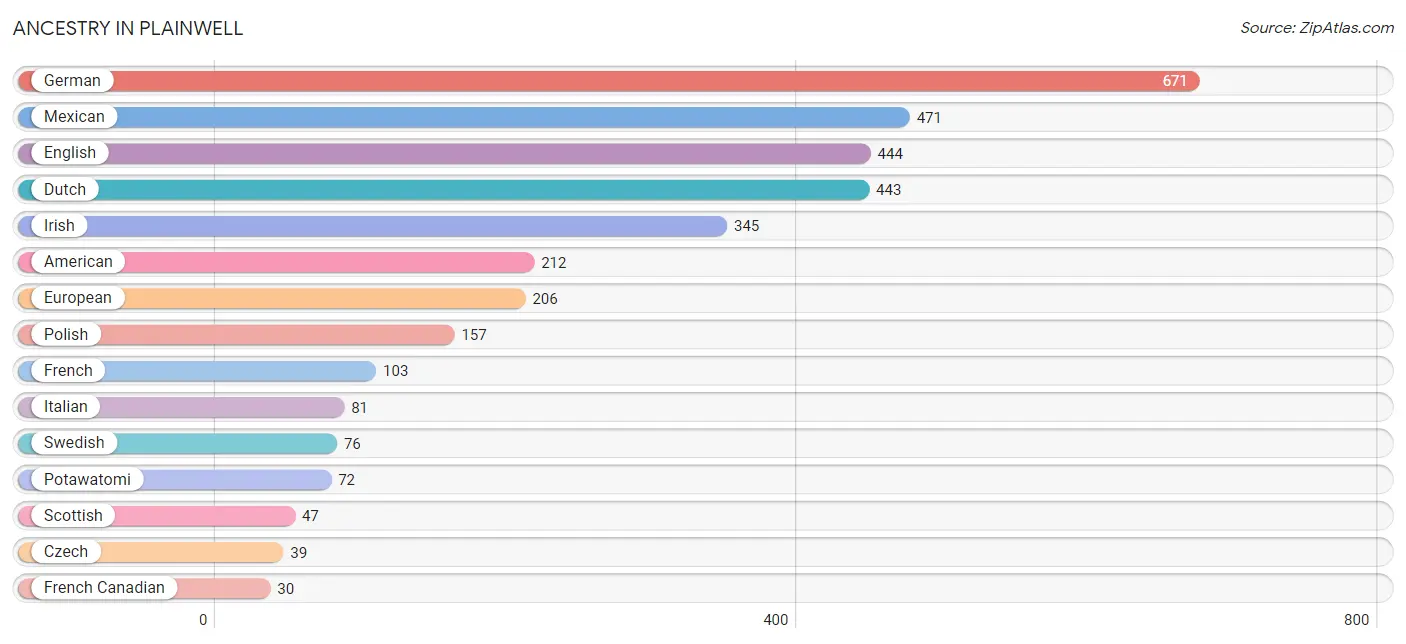
| Ancestry | # Population | % Population |
| American | 212 | 5.6% |
| British | 10 | 0.3% |
| Canadian | 17 | 0.4% |
| Celtic | 6 | 0.2% |
| Czech | 39 | 1.0% |
| Danish | 10 | 0.3% |
| Dutch | 443 | 11.8% |
| English | 444 | 11.8% |
| European | 206 | 5.5% |
| Finnish | 11 | 0.3% |
| French | 103 | 2.7% |
| French Canadian | 30 | 0.8% |
| German | 671 | 17.8% |
| Greek | 17 | 0.4% |
| Indian (Asian) | 7 | 0.2% |
| Irish | 345 | 9.2% |
| Italian | 81 | 2.1% |
| Lithuanian | 4 | 0.1% |
| Malaysian | 20 | 0.5% |
| Mexican | 471 | 12.5% |
| Pennsylvania German | 10 | 0.3% |
| Polish | 157 | 4.2% |
| Potawatomi | 72 | 1.9% |
| Scandinavian | 10 | 0.3% |
| Scotch-Irish | 8 | 0.2% |
| Scottish | 47 | 1.3% |
| Swedish | 76 | 2.0% |
| Thai | 30 | 0.8% | View All 28 Rows |
Immigrants in Plainwell
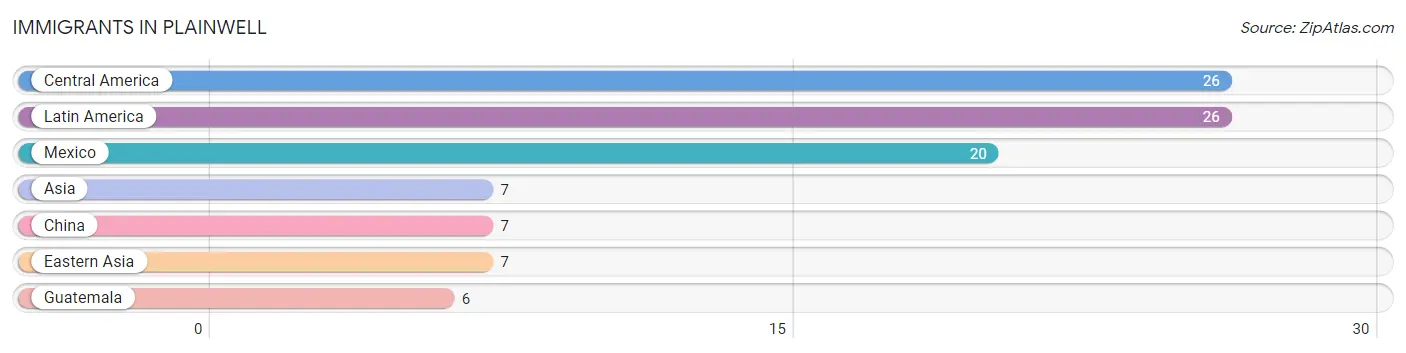
The most numerous immigrant groups reported in Plainwell came from Central America (26 | 0.7%), Latin America (26 | 0.7%), Mexico (20 | 0.5%), Asia (7 | 0.2%), and China (7 | 0.2%), together accounting for 2.3% of all Plainwell residents.
| Immigration Origin | # Population | % Population |
| Asia | 7 | 0.2% |
| Central America | 26 | 0.7% |
| China | 7 | 0.2% |
| Eastern Asia | 7 | 0.2% |
| Guatemala | 6 | 0.2% |
| Latin America | 26 | 0.7% |
| Mexico | 20 | 0.5% | View All 7 Rows |
Sex and Age in Plainwell
Sex and Age in Plainwell
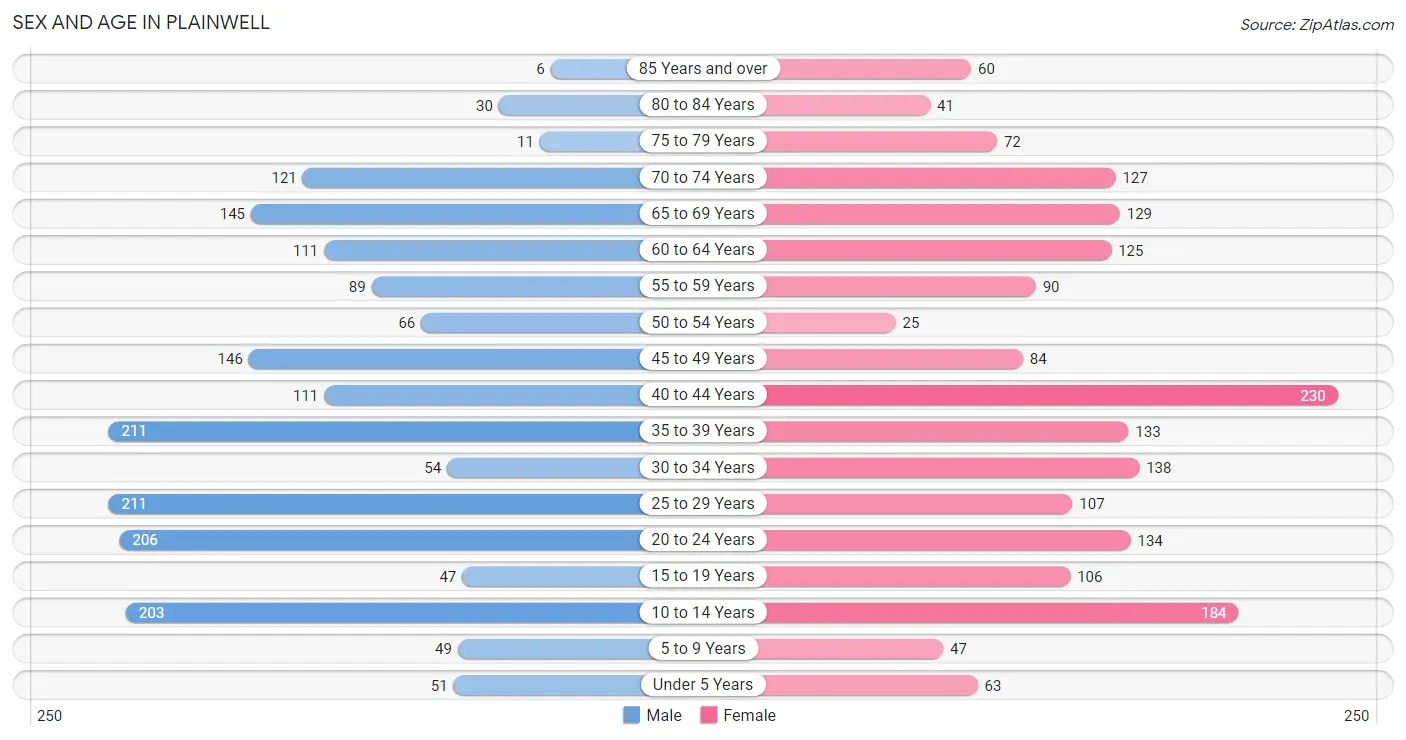
The most populous age groups in Plainwell are 25 to 29 Years (211 | 11.3%) for men and 40 to 44 Years (230 | 12.1%) for women.
| Age Bracket | Male | Female |
| Under 5 Years | 51 (2.7%) | 63 (3.3%) |
| 5 to 9 Years | 49 (2.6%) | 47 (2.5%) |
| 10 to 14 Years | 203 (10.9%) | 184 (9.7%) |
| 15 to 19 Years | 47 (2.5%) | 106 (5.6%) |
| 20 to 24 Years | 206 (11.0%) | 134 (7.1%) |
| 25 to 29 Years | 211 (11.3%) | 107 (5.7%) |
| 30 to 34 Years | 54 (2.9%) | 138 (7.3%) |
| 35 to 39 Years | 211 (11.3%) | 133 (7.0%) |
| 40 to 44 Years | 111 (5.9%) | 230 (12.1%) |
| 45 to 49 Years | 146 (7.8%) | 84 (4.4%) |
| 50 to 54 Years | 66 (3.5%) | 25 (1.3%) |
| 55 to 59 Years | 89 (4.8%) | 90 (4.8%) |
| 60 to 64 Years | 111 (5.9%) | 125 (6.6%) |
| 65 to 69 Years | 145 (7.8%) | 129 (6.8%) |
| 70 to 74 Years | 121 (6.5%) | 127 (6.7%) |
| 75 to 79 Years | 11 (0.6%) | 72 (3.8%) |
| 80 to 84 Years | 30 (1.6%) | 41 (2.2%) |
| 85 Years and over | 6 (0.3%) | 60 (3.2%) |
| Total | 1,868 (100.0%) | 1,895 (100.0%) |
Families and Households in Plainwell
Median Family Size in Plainwell
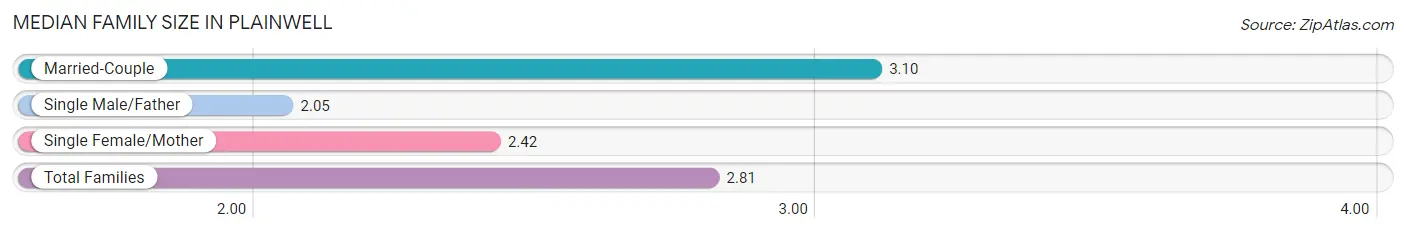
The median family size in Plainwell is 2.81 persons per family, with married-couple families (652 | 62.3%) accounting for the largest median family size of 3.1 persons per family. On the other hand, single male/father families (110 | 10.5%) represent the smallest median family size with 2.05 persons per family.
| Family Type | # Families | Family Size |
| Married-Couple | 652 (62.3%) | 3.10 |
| Single Male/Father | 110 (10.5%) | 2.05 |
| Single Female/Mother | 285 (27.2%) | 2.42 |
| Total Families | 1,047 (100.0%) | 2.81 |
Median Household Size in Plainwell
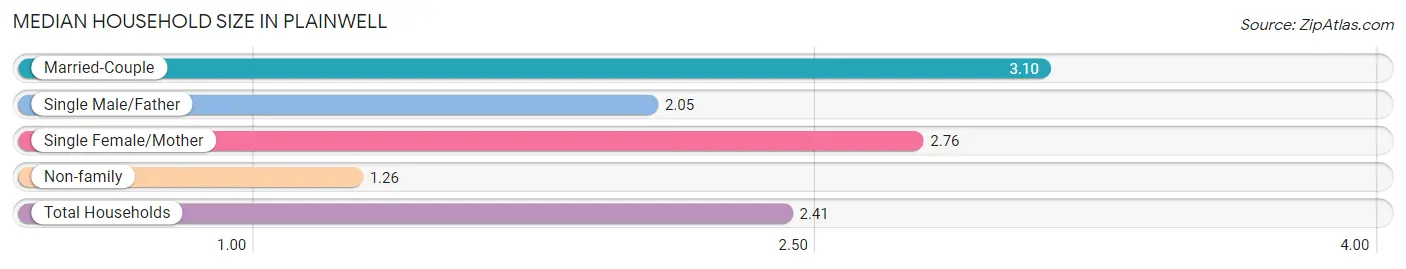
The median household size in Plainwell is 2.41 persons per household, with married-couple households (652 | 43.5%) accounting for the largest median household size of 3.1 persons per household. non-family households (451 | 30.1%) represent the smallest median household size with 1.26 persons per household.
| Household Type | # Households | Household Size |
| Married-Couple | 652 (43.5%) | 3.10 |
| Single Male/Father | 110 (7.3%) | 2.05 |
| Single Female/Mother | 285 (19.0%) | 2.76 |
| Non-family | 451 (30.1%) | 1.26 |
| Total Households | 1,498 (100.0%) | 2.41 |
Household Size by Marriage Status in Plainwell
Out of a total of 1,498 households in Plainwell, 1,047 (69.9%) are family households, while 451 (30.1%) are nonfamily households. The most numerous type of family households are 2-person households, comprising 421, and the most common type of nonfamily households are 1-person households, comprising 347.
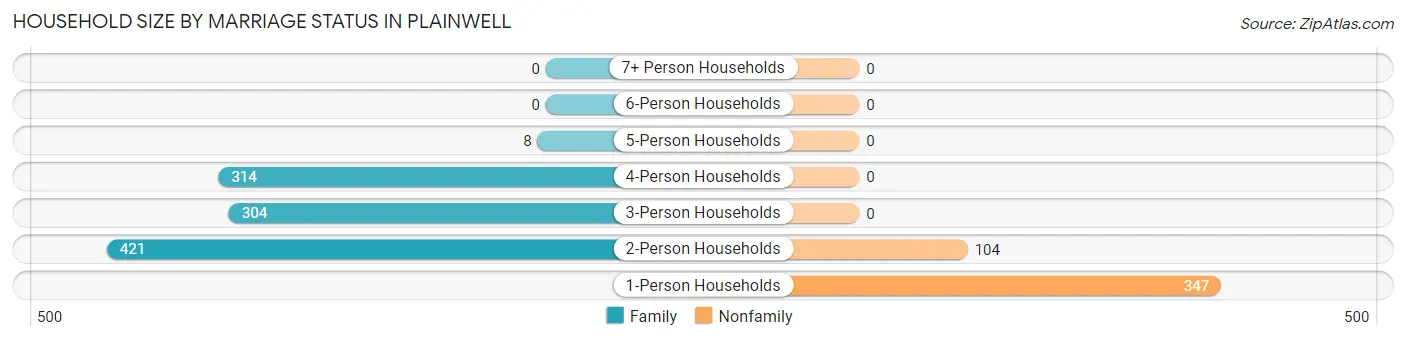
| Household Size | Family Households | Nonfamily Households |
| 1-Person Households | - | 347 (23.2%) |
| 2-Person Households | 421 (28.1%) | 104 (6.9%) |
| 3-Person Households | 304 (20.3%) | 0 (0.0%) |
| 4-Person Households | 314 (21.0%) | 0 (0.0%) |
| 5-Person Households | 8 (0.5%) | 0 (0.0%) |
| 6-Person Households | 0 (0.0%) | 0 (0.0%) |
| 7+ Person Households | 0 (0.0%) | 0 (0.0%) |
| Total | 1,047 (69.9%) | 451 (30.1%) |
Female Fertility in Plainwell
Fertility by Age in Plainwell
Average fertility rate in Plainwell is 28.0 births per 1,000 women. Women in the age bracket of 20 to 34 years have the highest fertility rate with 47.0 births per 1,000 women. Women in the age bracket of 20 to 34 years acount for 69.2% of all women with births.
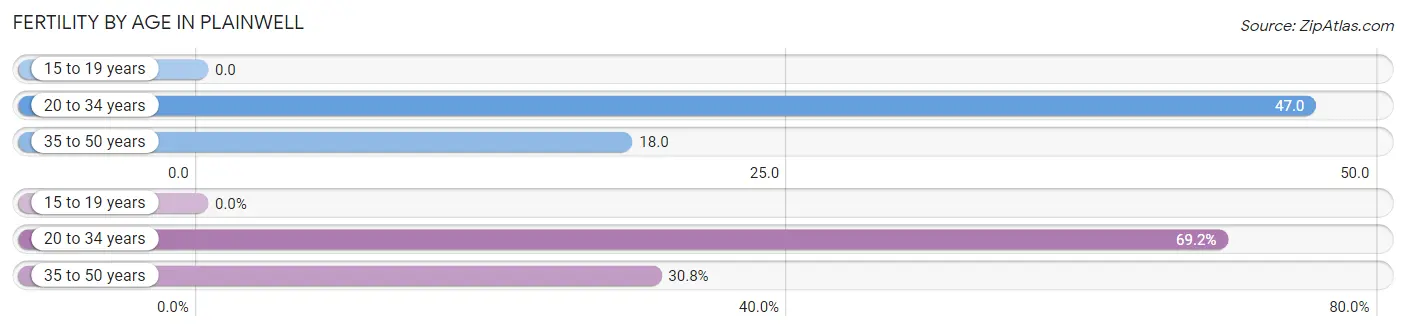
| Age Bracket | Women with Births | Births / 1,000 Women |
| 15 to 19 years | 0 (0.0%) | 0.0 |
| 20 to 34 years | 18 (69.2%) | 47.0 |
| 35 to 50 years | 8 (30.8%) | 18.0 |
| Total | 26 (100.0%) | 28.0 |
Fertility by Age by Marriage Status in Plainwell
69.2% of women with births (26) in Plainwell are married. The highest percentage of unmarried women with births falls into 35 to 50 years age bracket with 100.0% of them unmarried at the time of birth, while the lowest percentage of unmarried women with births belong to 20 to 34 years age bracket with 0.0% of them unmarried.
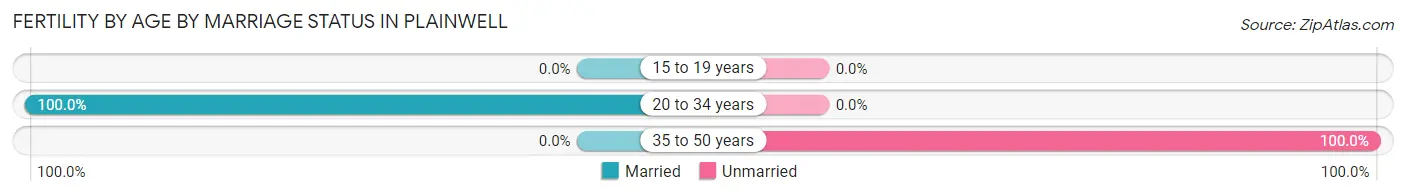
| Age Bracket | Married | Unmarried |
| 15 to 19 years | 0 (0.0%) | 0 (0.0%) |
| 20 to 34 years | 18 (100.0%) | 0 (0.0%) |
| 35 to 50 years | 0 (0.0%) | 8 (100.0%) |
| Total | 18 (69.2%) | 8 (30.8%) |
Fertility by Education in Plainwell
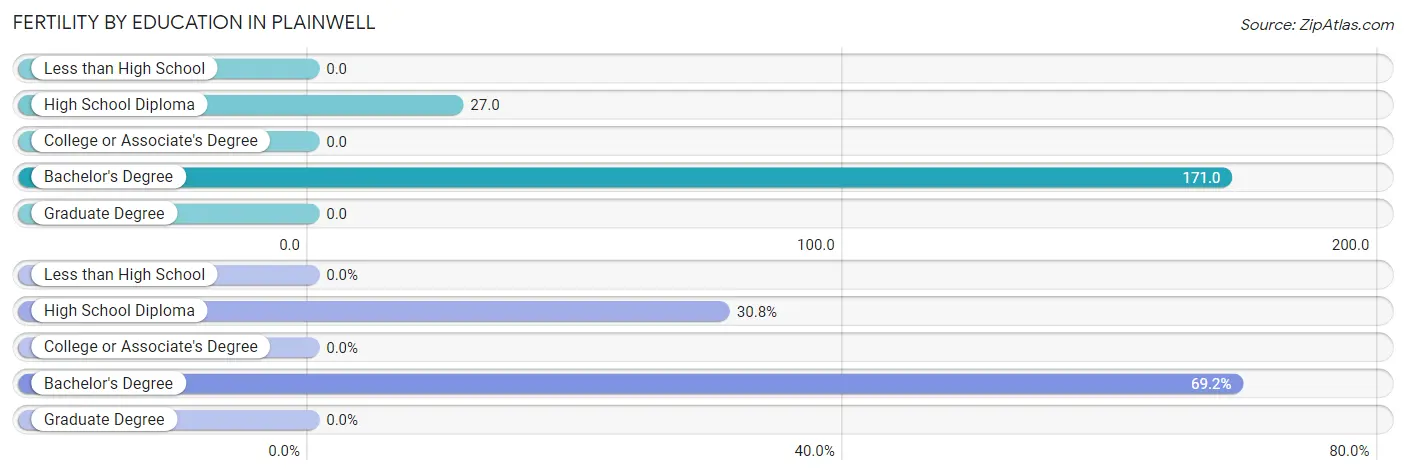
| Educational Attainment | Women with Births | Births / 1,000 Women |
| Less than High School | 0 (0.0%) | 0.0 |
| High School Diploma | 8 (30.8%) | 27.0 |
| College or Associate's Degree | 0 (0.0%) | 0.0 |
| Bachelor's Degree | 18 (69.2%) | 171.0 |
| Graduate Degree | 0 (0.0%) | 0.0 |
| Total | 26 (100.0%) | 28.0 |
Fertility by Education by Marriage Status in Plainwell
30.8% of women with births in Plainwell are unmarried. Women with the educational attainment of bachelor's degree are most likely to be married with 100.0% of them married at childbirth, while women with the educational attainment of high school diploma are least likely to be married with 100.0% of them unmarried at childbirth.
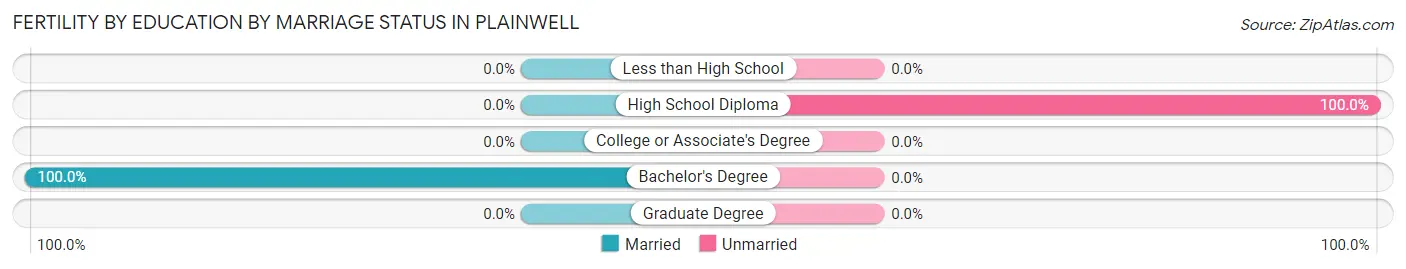
| Educational Attainment | Married | Unmarried |
| Less than High School | 0 (0.0%) | 0 (0.0%) |
| High School Diploma | 0 (0.0%) | 8 (100.0%) |
| College or Associate's Degree | 0 (0.0%) | 0 (0.0%) |
| Bachelor's Degree | 18 (100.0%) | 0 (0.0%) |
| Graduate Degree | 0 (0.0%) | 0 (0.0%) |
| Total | 18 (69.2%) | 8 (30.8%) |
Employment Characteristics in Plainwell
Employment by Class of Employer in Plainwell
Among the 1,580 employed individuals in Plainwell, private company employees (1,202 | 76.1%), not-for-profit organizations (138 | 8.7%), and local government employees (122 | 7.7%) make up the most common classes of employment.
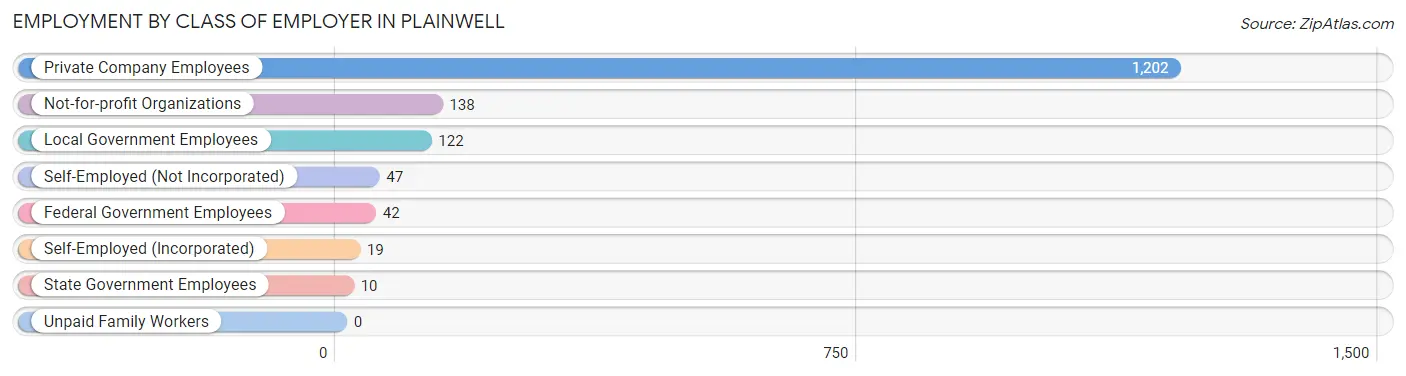
| Employer Class | # Employees | % Employees |
| Private Company Employees | 1,202 | 76.1% |
| Self-Employed (Incorporated) | 19 | 1.2% |
| Self-Employed (Not Incorporated) | 47 | 3.0% |
| Not-for-profit Organizations | 138 | 8.7% |
| Local Government Employees | 122 | 7.7% |
| State Government Employees | 10 | 0.6% |
| Federal Government Employees | 42 | 2.7% |
| Unpaid Family Workers | 0 | 0.0% |
| Total | 1,580 | 100.0% |
Employment Status by Age in Plainwell
According to the labor force statistics for Plainwell, out of the total population over 16 years of age (3,118), 57.2% or 1,783 individuals are in the labor force, with 5.8% or 103 of them unemployed. The age group with the highest labor force participation rate is 25 to 29 years, with 99.4% or 316 individuals in the labor force. Within the labor force, the 30 to 34 years age range has the highest percentage of unemployed individuals, with 14.0% or 24 of them being unemployed.
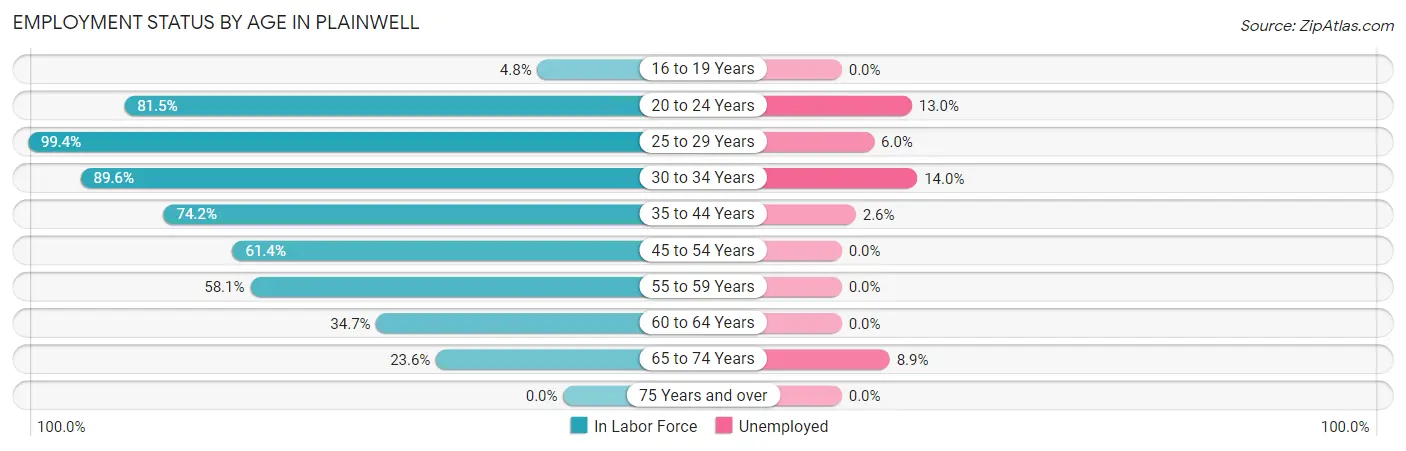
| Age Bracket | In Labor Force | Unemployed |
| 16 to 19 Years | 5 (4.8%) | 0 (0.0%) |
| 20 to 24 Years | 277 (81.5%) | 36 (13.0%) |
| 25 to 29 Years | 316 (99.4%) | 19 (6.0%) |
| 30 to 34 Years | 172 (89.6%) | 24 (14.0%) |
| 35 to 44 Years | 508 (74.2%) | 13 (2.6%) |
| 45 to 54 Years | 197 (61.4%) | 0 (0.0%) |
| 55 to 59 Years | 104 (58.1%) | 0 (0.0%) |
| 60 to 64 Years | 82 (34.7%) | 0 (0.0%) |
| 65 to 74 Years | 123 (23.6%) | 11 (8.9%) |
| 75 Years and over | 0 (0.0%) | 0 (0.0%) |
| Total | 1,783 (57.2%) | 103 (5.8%) |
Employment Status by Educational Attainment in Plainwell
According to labor force statistics for Plainwell, 71.4% of individuals (1,379) out of the total population between 25 and 64 years of age (1,931) are in the labor force, with 4.1% or 57 of them being unemployed. The group with the highest labor force participation rate are those with the educational attainment of bachelor's degree or higher, with 83.1% or 325 individuals in the labor force. Within the labor force, individuals with bachelor's degree or higher education have the highest percentage of unemployment, with 7.4% or 24 of them being unemployed.
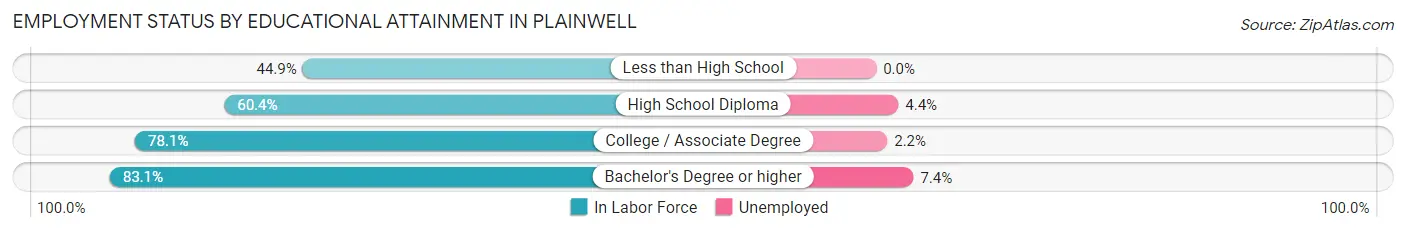
| Educational Attainment | In Labor Force | Unemployed |
| Less than High School | 31 (44.9%) | 0 (0.0%) |
| High School Diploma | 431 (60.4%) | 31 (4.4%) |
| College / Associate Degree | 592 (78.1%) | 17 (2.2%) |
| Bachelor's Degree or higher | 325 (83.1%) | 29 (7.4%) |
| Total | 1,379 (71.4%) | 79 (4.1%) |
Employment Occupations by Sex in Plainwell
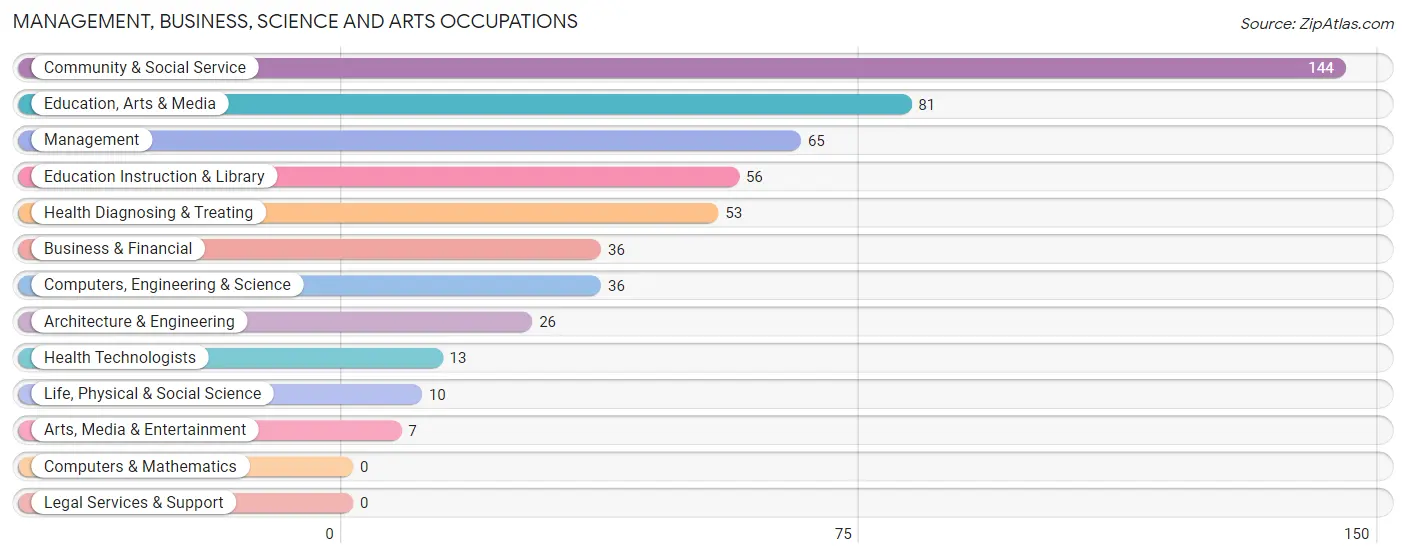
Management, Business, Science and Arts Occupations
The most common Management, Business, Science and Arts occupations in Plainwell are Community & Social Service (144 | 8.6%), Education, Arts & Media (81 | 4.8%), Management (65 | 3.9%), Education Instruction & Library (56 | 3.3%), and Health Diagnosing & Treating (53 | 3.2%).
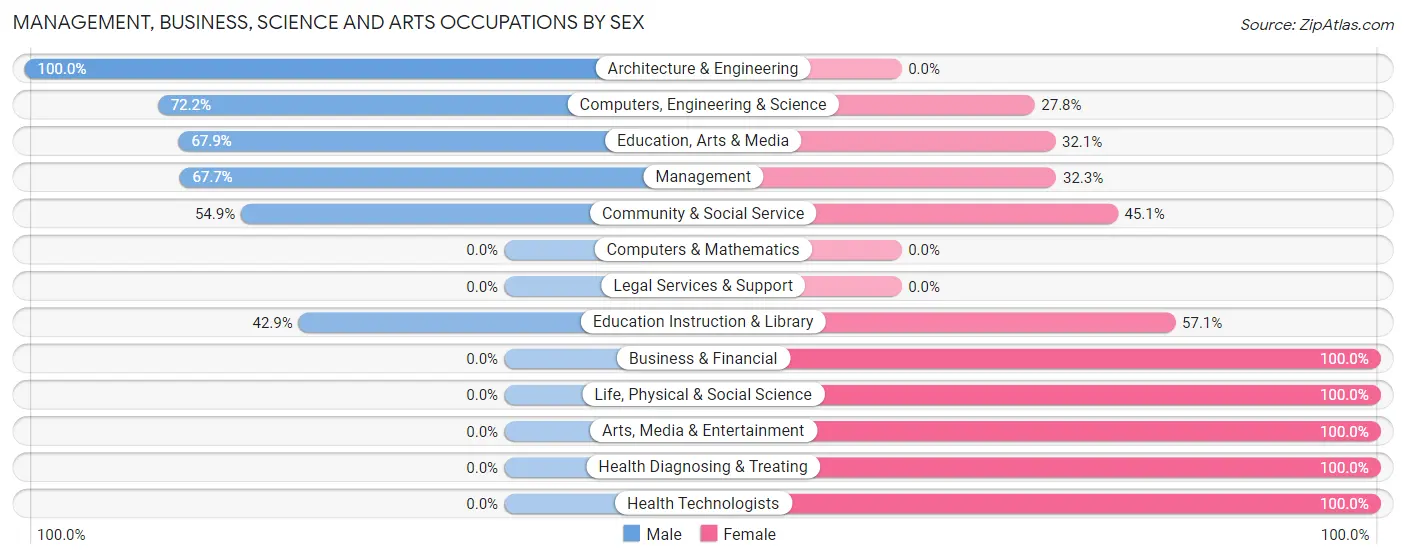
Management, Business, Science and Arts Occupations by Sex
Within the Management, Business, Science and Arts occupations in Plainwell, the most male-oriented occupations are Architecture & Engineering (100.0%), Computers, Engineering & Science (72.2%), and Education, Arts & Media (67.9%), while the most female-oriented occupations are Business & Financial (100.0%), Life, Physical & Social Science (100.0%), and Arts, Media & Entertainment (100.0%).
| Occupation | Male | Female |
| Management | 44 (67.7%) | 21 (32.3%) |
| Business & Financial | 0 (0.0%) | 36 (100.0%) |
| Computers, Engineering & Science | 26 (72.2%) | 10 (27.8%) |
| Computers & Mathematics | 0 (0.0%) | 0 (0.0%) |
| Architecture & Engineering | 26 (100.0%) | 0 (0.0%) |
| Life, Physical & Social Science | 0 (0.0%) | 10 (100.0%) |
| Community & Social Service | 79 (54.9%) | 65 (45.1%) |
| Education, Arts & Media | 55 (67.9%) | 26 (32.1%) |
| Legal Services & Support | 0 (0.0%) | 0 (0.0%) |
| Education Instruction & Library | 24 (42.9%) | 32 (57.1%) |
| Arts, Media & Entertainment | 0 (0.0%) | 7 (100.0%) |
| Health Diagnosing & Treating | 0 (0.0%) | 53 (100.0%) |
| Health Technologists | 0 (0.0%) | 13 (100.0%) |
| Total (Category) | 149 (44.6%) | 185 (55.4%) |
| Total (Overall) | 842 (50.1%) | 839 (49.9%) |
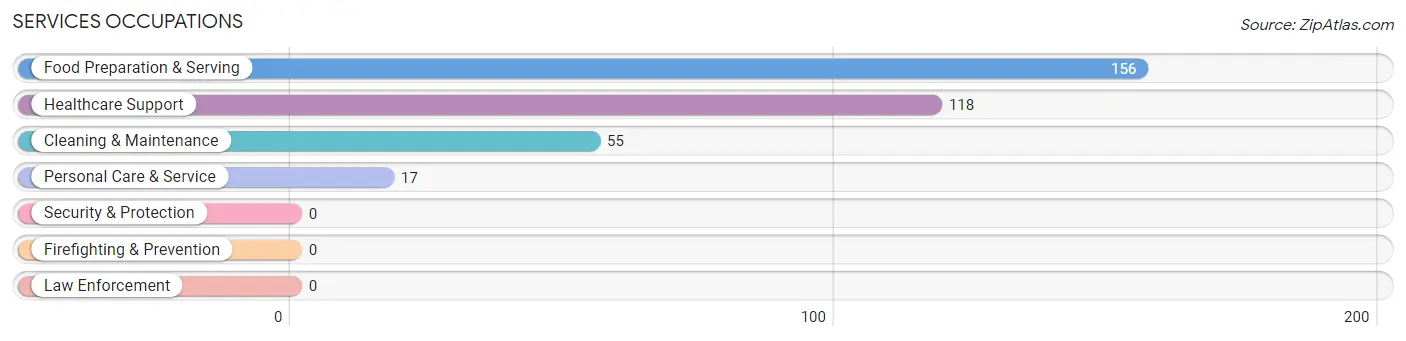
Services Occupations
The most common Services occupations in Plainwell are Food Preparation & Serving (156 | 9.3%), Healthcare Support (118 | 7.0%), Cleaning & Maintenance (55 | 3.3%), and Personal Care & Service (17 | 1.0%).
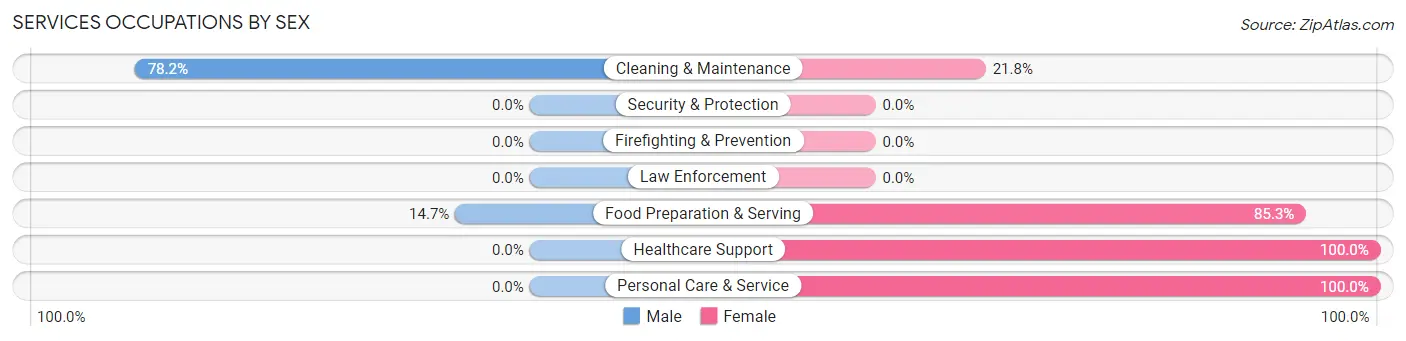
Services Occupations by Sex
Within the Services occupations in Plainwell, the most male-oriented occupations are Cleaning & Maintenance (78.2%), and Food Preparation & Serving (14.7%), while the most female-oriented occupations are Healthcare Support (100.0%), Personal Care & Service (100.0%), and Food Preparation & Serving (85.3%).
| Occupation | Male | Female |
| Healthcare Support | 0 (0.0%) | 118 (100.0%) |
| Security & Protection | 0 (0.0%) | 0 (0.0%) |
| Firefighting & Prevention | 0 (0.0%) | 0 (0.0%) |
| Law Enforcement | 0 (0.0%) | 0 (0.0%) |
| Food Preparation & Serving | 23 (14.7%) | 133 (85.3%) |
| Cleaning & Maintenance | 43 (78.2%) | 12 (21.8%) |
| Personal Care & Service | 0 (0.0%) | 17 (100.0%) |
| Total (Category) | 66 (19.1%) | 280 (80.9%) |
| Total (Overall) | 842 (50.1%) | 839 (49.9%) |
Sales and Office Occupations
The most common Sales and Office occupations in Plainwell are Sales & Related (266 | 15.8%), and Office & Administration (172 | 10.2%).

Sales and Office Occupations by Sex
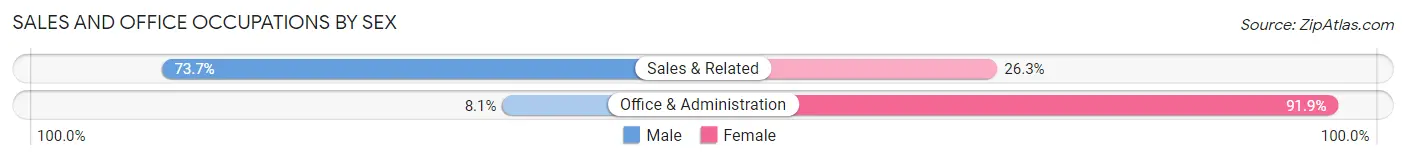
| Occupation | Male | Female |
| Sales & Related | 196 (73.7%) | 70 (26.3%) |
| Office & Administration | 14 (8.1%) | 158 (91.9%) |
| Total (Category) | 210 (47.9%) | 228 (52.0%) |
| Total (Overall) | 842 (50.1%) | 839 (49.9%) |
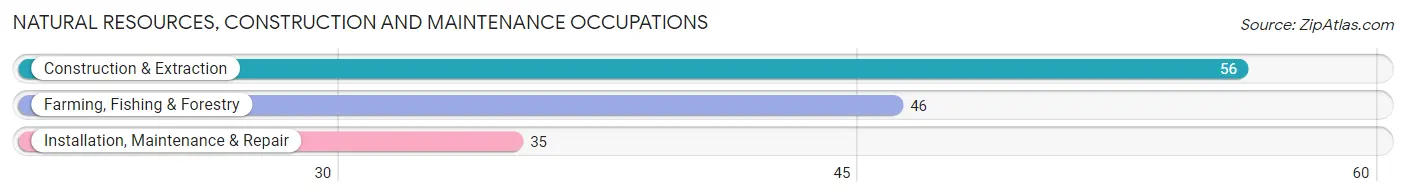
Natural Resources, Construction and Maintenance Occupations
The most common Natural Resources, Construction and Maintenance occupations in Plainwell are Construction & Extraction (56 | 3.3%), Farming, Fishing & Forestry (46 | 2.7%), and Installation, Maintenance & Repair (35 | 2.1%).
Natural Resources, Construction and Maintenance Occupations by Sex
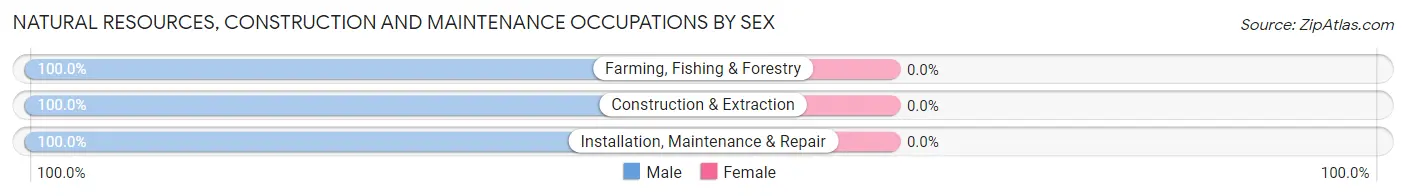
| Occupation | Male | Female |
| Farming, Fishing & Forestry | 46 (100.0%) | 0 (0.0%) |
| Construction & Extraction | 56 (100.0%) | 0 (0.0%) |
| Installation, Maintenance & Repair | 35 (100.0%) | 0 (0.0%) |
| Total (Category) | 137 (100.0%) | 0 (0.0%) |
| Total (Overall) | 842 (50.1%) | 839 (49.9%) |
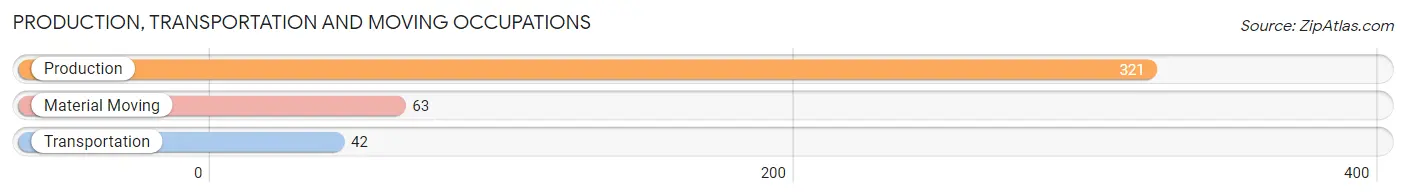
Production, Transportation and Moving Occupations
The most common Production, Transportation and Moving occupations in Plainwell are Production (321 | 19.1%), Material Moving (63 | 3.7%), and Transportation (42 | 2.5%).
Production, Transportation and Moving Occupations by Sex
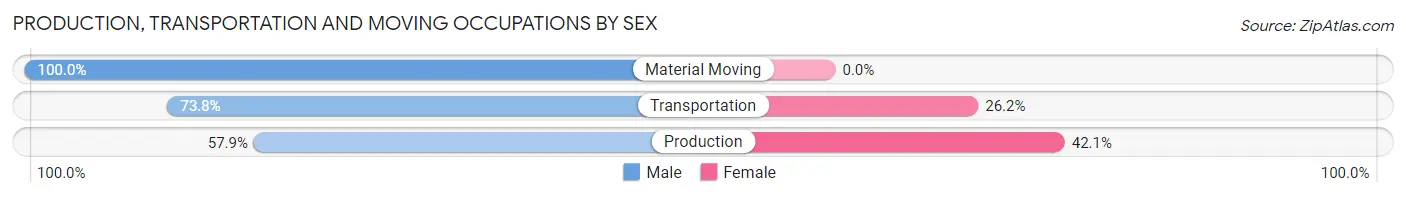
| Occupation | Male | Female |
| Production | 186 (57.9%) | 135 (42.1%) |
| Transportation | 31 (73.8%) | 11 (26.2%) |
| Material Moving | 63 (100.0%) | 0 (0.0%) |
| Total (Category) | 280 (65.7%) | 146 (34.3%) |
| Total (Overall) | 842 (50.1%) | 839 (49.9%) |
Employment Industries by Sex in Plainwell
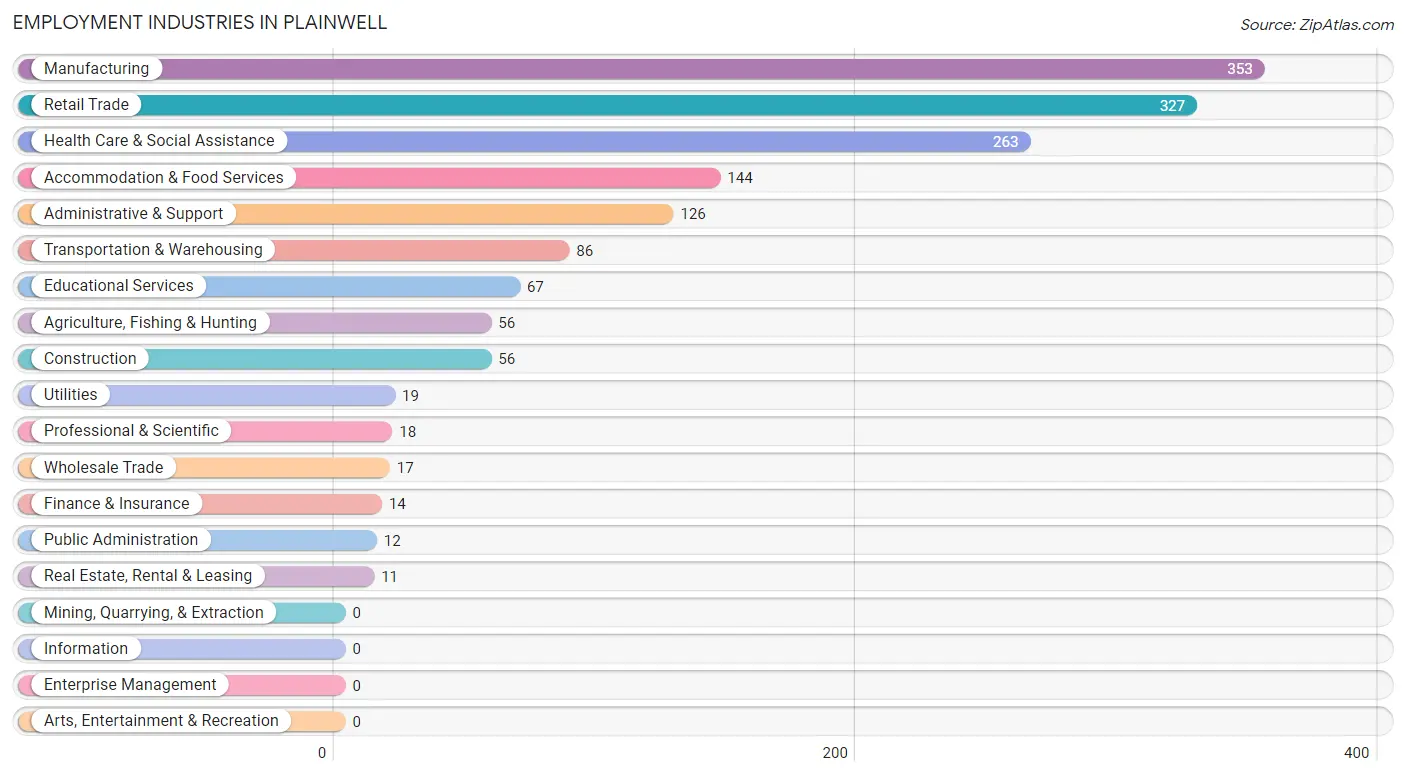
Employment Industries in Plainwell
The major employment industries in Plainwell include Manufacturing (353 | 21.0%), Retail Trade (327 | 19.5%), Health Care & Social Assistance (263 | 15.7%), Accommodation & Food Services (144 | 8.6%), and Administrative & Support (126 | 7.5%).
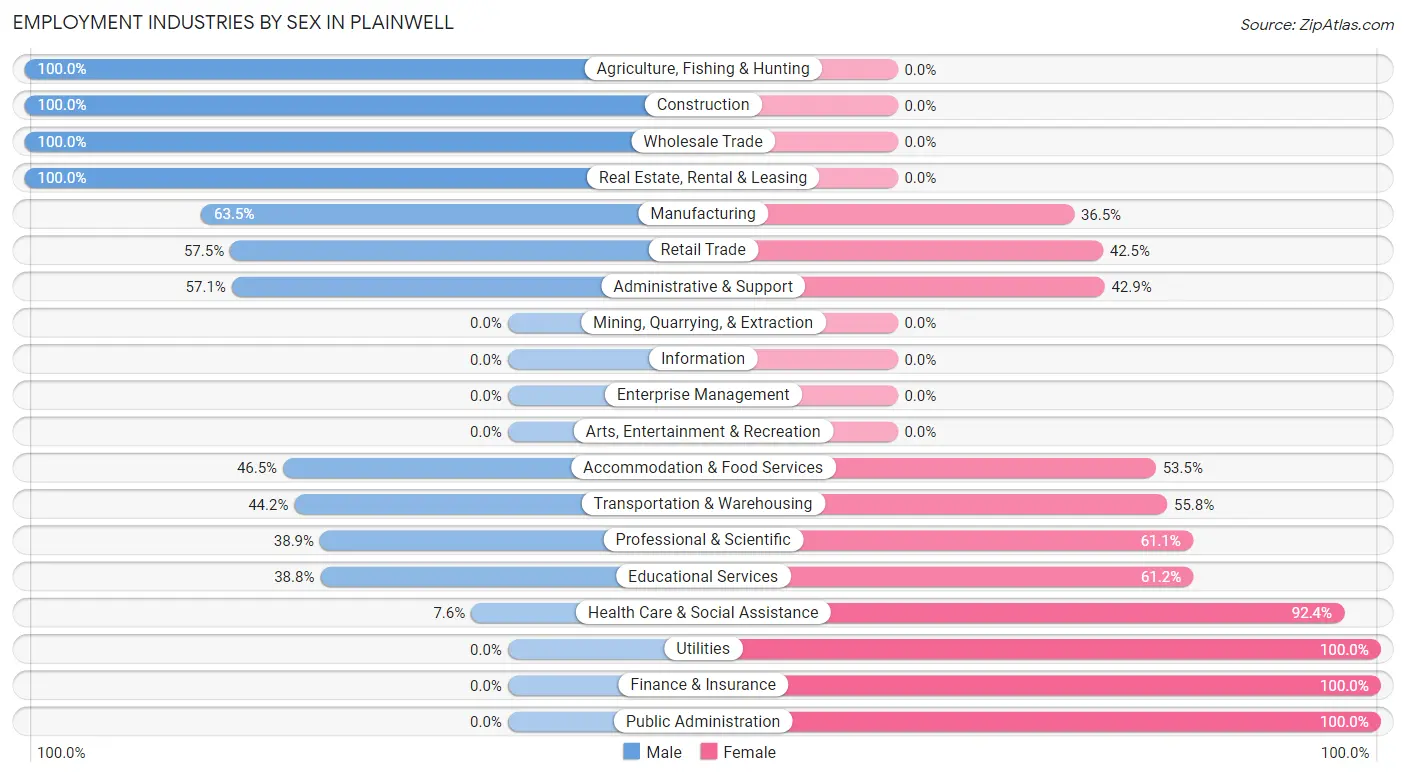
Employment Industries by Sex in Plainwell
The Plainwell industries that see more men than women are Agriculture, Fishing & Hunting (100.0%), Construction (100.0%), and Wholesale Trade (100.0%), whereas the industries that tend to have a higher number of women are Utilities (100.0%), Finance & Insurance (100.0%), and Public Administration (100.0%).
| Industry | Male | Female |
| Agriculture, Fishing & Hunting | 56 (100.0%) | 0 (0.0%) |
| Mining, Quarrying, & Extraction | 0 (0.0%) | 0 (0.0%) |
| Construction | 56 (100.0%) | 0 (0.0%) |
| Manufacturing | 224 (63.5%) | 129 (36.5%) |
| Wholesale Trade | 17 (100.0%) | 0 (0.0%) |
| Retail Trade | 188 (57.5%) | 139 (42.5%) |
| Transportation & Warehousing | 38 (44.2%) | 48 (55.8%) |
| Utilities | 0 (0.0%) | 19 (100.0%) |
| Information | 0 (0.0%) | 0 (0.0%) |
| Finance & Insurance | 0 (0.0%) | 14 (100.0%) |
| Real Estate, Rental & Leasing | 11 (100.0%) | 0 (0.0%) |
| Professional & Scientific | 7 (38.9%) | 11 (61.1%) |
| Enterprise Management | 0 (0.0%) | 0 (0.0%) |
| Administrative & Support | 72 (57.1%) | 54 (42.9%) |
| Educational Services | 26 (38.8%) | 41 (61.2%) |
| Health Care & Social Assistance | 20 (7.6%) | 243 (92.4%) |
| Arts, Entertainment & Recreation | 0 (0.0%) | 0 (0.0%) |
| Accommodation & Food Services | 67 (46.5%) | 77 (53.5%) |
| Public Administration | 0 (0.0%) | 12 (100.0%) |
| Total | 842 (50.1%) | 839 (49.9%) |
Education in Plainwell
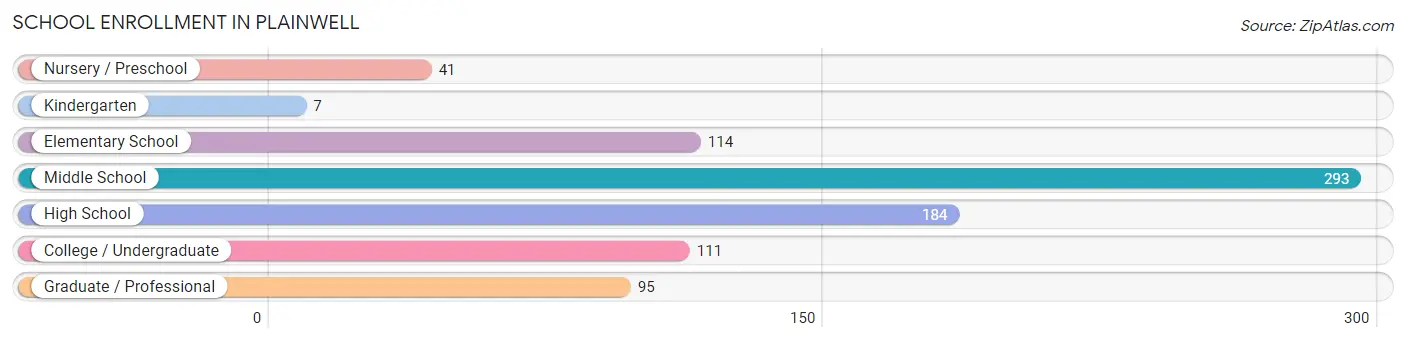
School Enrollment in Plainwell
The most common levels of schooling among the 845 students in Plainwell are middle school (293 | 34.7%), high school (184 | 21.8%), and elementary school (114 | 13.5%).
| School Level | # Students | % Students |
| Nursery / Preschool | 41 | 4.9% |
| Kindergarten | 7 | 0.8% |
| Elementary School | 114 | 13.5% |
| Middle School | 293 | 34.7% |
| High School | 184 | 21.8% |
| College / Undergraduate | 111 | 13.1% |
| Graduate / Professional | 95 | 11.2% |
| Total | 845 | 100.0% |
School Enrollment by Age by Funding Source in Plainwell
Out of a total of 845 students who are enrolled in schools in Plainwell, 85 (10.1%) attend a private institution, while the remaining 760 (89.9%) are enrolled in public schools. The age group of 35 years and over has the highest likelihood of being enrolled in private schools, with 67 (76.1% in the age bracket) enrolled. Conversely, the age group of 5 to 9 year old has the lowest likelihood of being enrolled in a private school, with 96 (100.0% in the age bracket) attending a public institution.
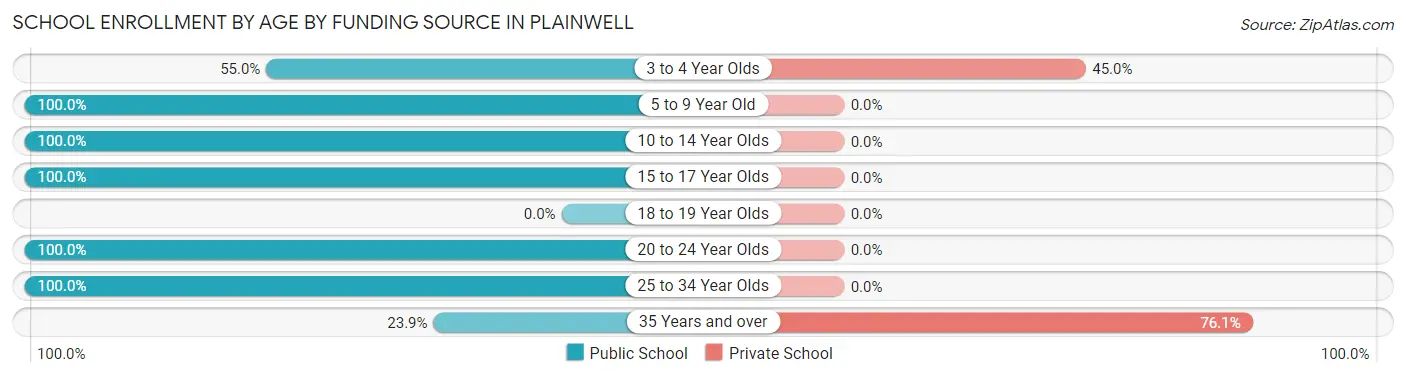
| Age Bracket | Public School | Private School |
| 3 to 4 Year Olds | 22 (55.0%) | 18 (45.0%) |
| 5 to 9 Year Old | 96 (100.0%) | 0 (0.0%) |
| 10 to 14 Year Olds | 387 (100.0%) | 0 (0.0%) |
| 15 to 17 Year Olds | 116 (100.0%) | 0 (0.0%) |
| 18 to 19 Year Olds | 0 (0.0%) | 0 (0.0%) |
| 20 to 24 Year Olds | 89 (100.0%) | 0 (0.0%) |
| 25 to 34 Year Olds | 29 (100.0%) | 0 (0.0%) |
| 35 Years and over | 21 (23.9%) | 67 (76.1%) |
| Total | 760 (89.9%) | 85 (10.1%) |
Educational Attainment by Field of Study in Plainwell
Business (134 | 24.8%), arts & humanities (93 | 17.2%), social sciences (64 | 11.8%), science & technology (60 | 11.1%), and engineering (36 | 6.7%) are the most common fields of study among 541 individuals in Plainwell who have obtained a bachelor's degree or higher.
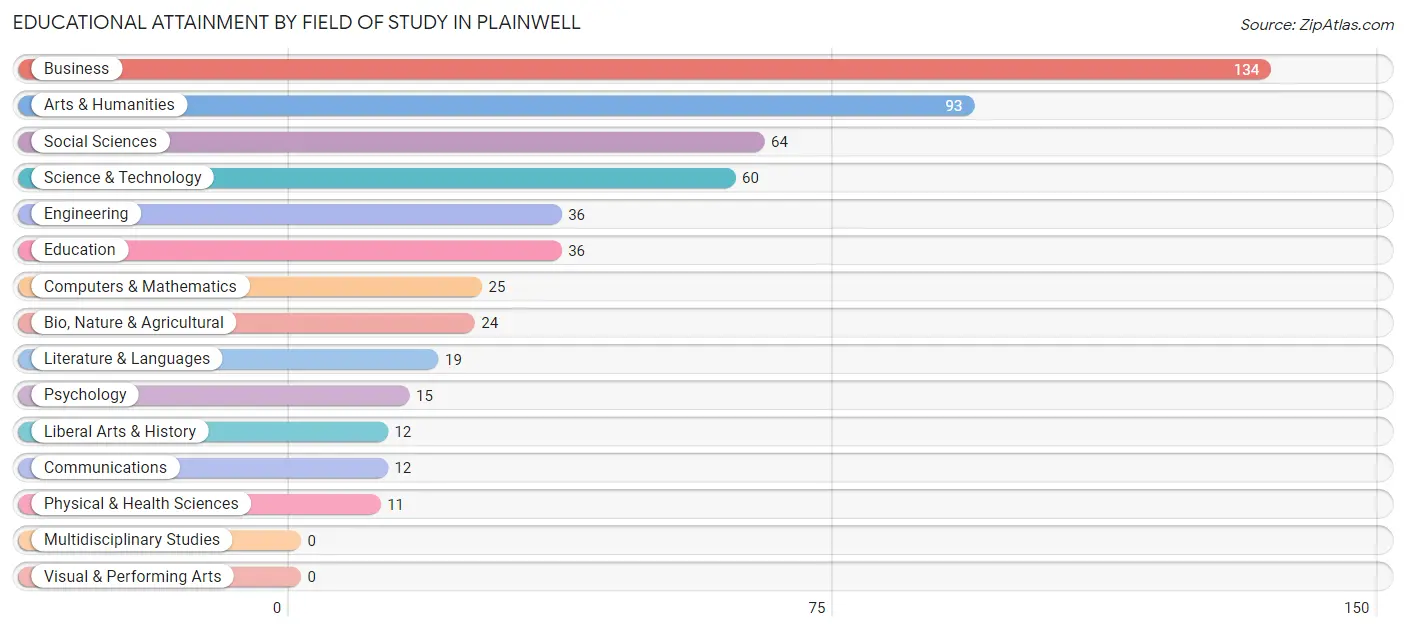
| Field of Study | # Graduates | % Graduates |
| Computers & Mathematics | 25 | 4.6% |
| Bio, Nature & Agricultural | 24 | 4.4% |
| Physical & Health Sciences | 11 | 2.0% |
| Psychology | 15 | 2.8% |
| Social Sciences | 64 | 11.8% |
| Engineering | 36 | 6.7% |
| Multidisciplinary Studies | 0 | 0.0% |
| Science & Technology | 60 | 11.1% |
| Business | 134 | 24.8% |
| Education | 36 | 6.7% |
| Literature & Languages | 19 | 3.5% |
| Liberal Arts & History | 12 | 2.2% |
| Visual & Performing Arts | 0 | 0.0% |
| Communications | 12 | 2.2% |
| Arts & Humanities | 93 | 17.2% |
| Total | 541 | 100.0% |
Transportation & Commute in Plainwell
Vehicle Availability by Sex in Plainwell
The most prevalent vehicle ownership categories in Plainwell are males with 2 vehicles (335, accounting for 40.7%) and females with 2 vehicles (308, making up 45.4%).
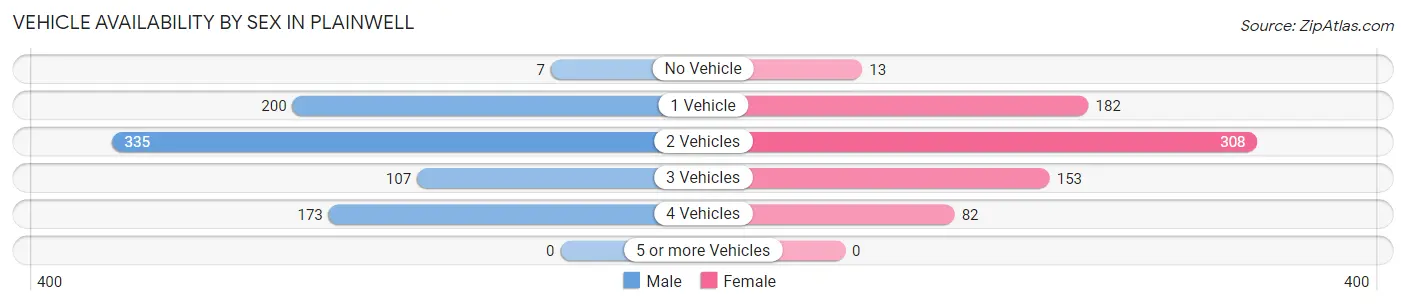
| Vehicles Available | Male | Female |
| No Vehicle | 7 (0.9%) | 13 (1.8%) |
| 1 Vehicle | 200 (24.3%) | 182 (24.7%) |
| 2 Vehicles | 335 (40.7%) | 308 (41.7%) |
| 3 Vehicles | 107 (13.0%) | 153 (20.7%) |
| 4 Vehicles | 173 (21.0%) | 82 (11.1%) |
| 5 or more Vehicles | 0 (0.0%) | 0 (0.0%) |
| Total | 822 (100.0%) | 738 (100.0%) |
Commute Time in Plainwell
The most frequently occuring commute durations in Plainwell are 20 to 24 minutes (356 commuters, 23.7%), 30 to 34 minutes (301 commuters, 20.0%), and 5 to 9 minutes (211 commuters, 14.0%).
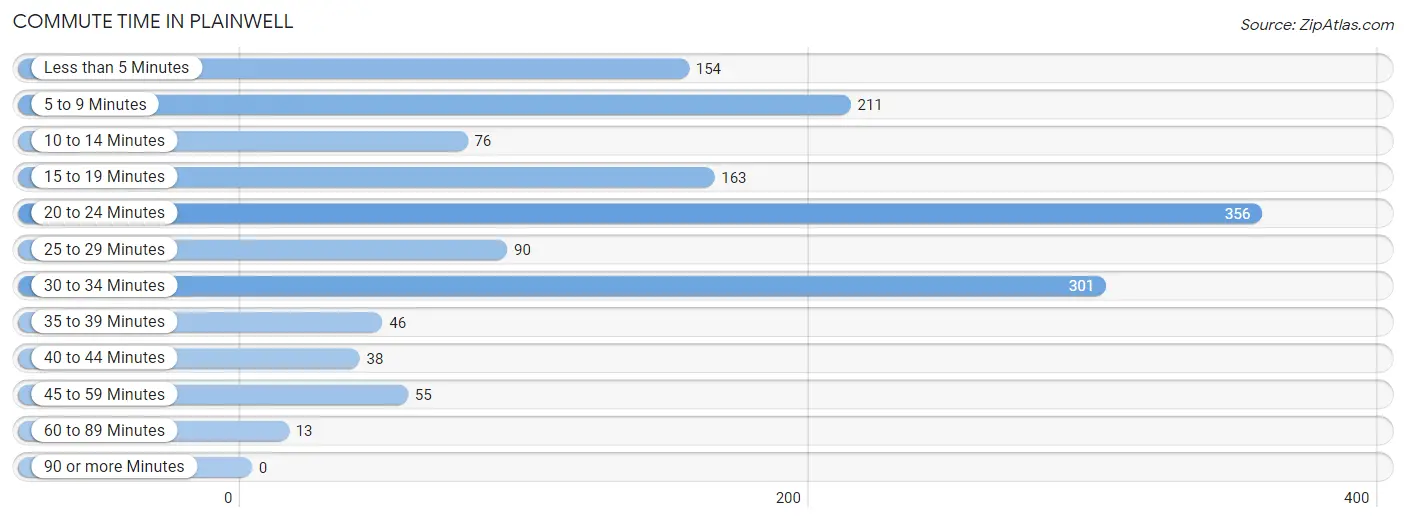
| Commute Time | # Commuters | % Commuters |
| Less than 5 Minutes | 154 | 10.2% |
| 5 to 9 Minutes | 211 | 14.0% |
| 10 to 14 Minutes | 76 | 5.1% |
| 15 to 19 Minutes | 163 | 10.8% |
| 20 to 24 Minutes | 356 | 23.7% |
| 25 to 29 Minutes | 90 | 6.0% |
| 30 to 34 Minutes | 301 | 20.0% |
| 35 to 39 Minutes | 46 | 3.1% |
| 40 to 44 Minutes | 38 | 2.5% |
| 45 to 59 Minutes | 55 | 3.7% |
| 60 to 89 Minutes | 13 | 0.9% |
| 90 or more Minutes | 0 | 0.0% |
Commute Time by Sex in Plainwell
The most common commute times in Plainwell are 20 to 24 minutes (202 commuters, 25.8%) for males and 30 to 34 minutes (186 commuters, 25.8%) for females.
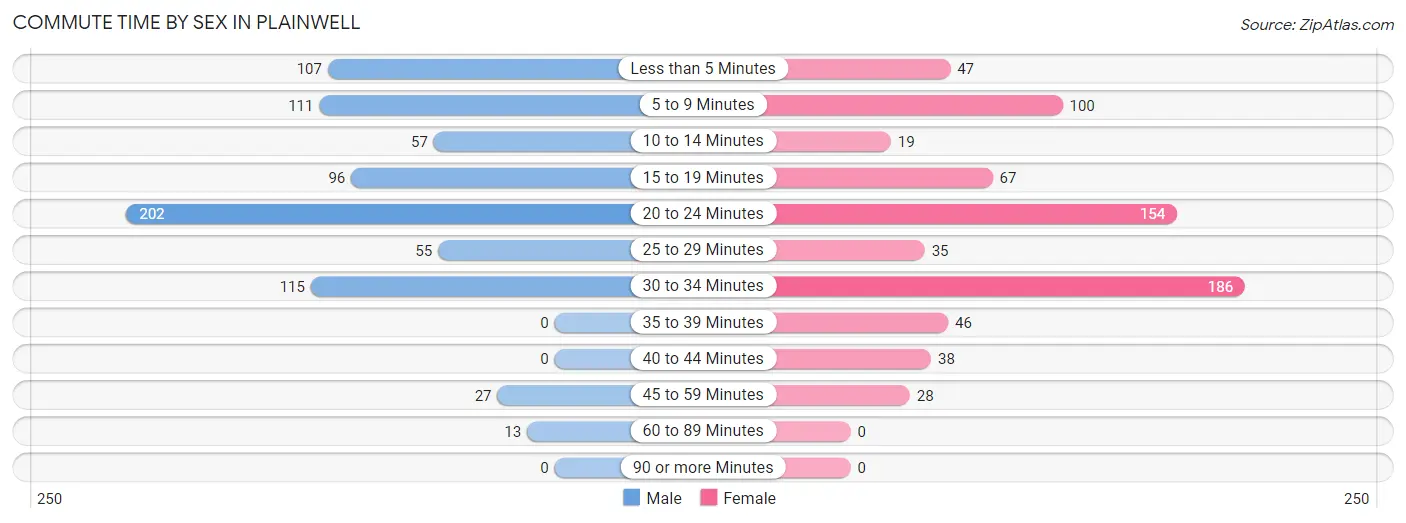
| Commute Time | Male | Female |
| Less than 5 Minutes | 107 (13.7%) | 47 (6.5%) |
| 5 to 9 Minutes | 111 (14.2%) | 100 (13.9%) |
| 10 to 14 Minutes | 57 (7.3%) | 19 (2.6%) |
| 15 to 19 Minutes | 96 (12.3%) | 67 (9.3%) |
| 20 to 24 Minutes | 202 (25.8%) | 154 (21.4%) |
| 25 to 29 Minutes | 55 (7.0%) | 35 (4.9%) |
| 30 to 34 Minutes | 115 (14.7%) | 186 (25.8%) |
| 35 to 39 Minutes | 0 (0.0%) | 46 (6.4%) |
| 40 to 44 Minutes | 0 (0.0%) | 38 (5.3%) |
| 45 to 59 Minutes | 27 (3.5%) | 28 (3.9%) |
| 60 to 89 Minutes | 13 (1.7%) | 0 (0.0%) |
| 90 or more Minutes | 0 (0.0%) | 0 (0.0%) |
Time of Departure to Work by Sex in Plainwell
The most frequent times of departure to work in Plainwell are 6:00 AM to 6:29 AM (144, 18.4%) for males and 7:00 AM to 7:29 AM (121, 16.8%) for females.
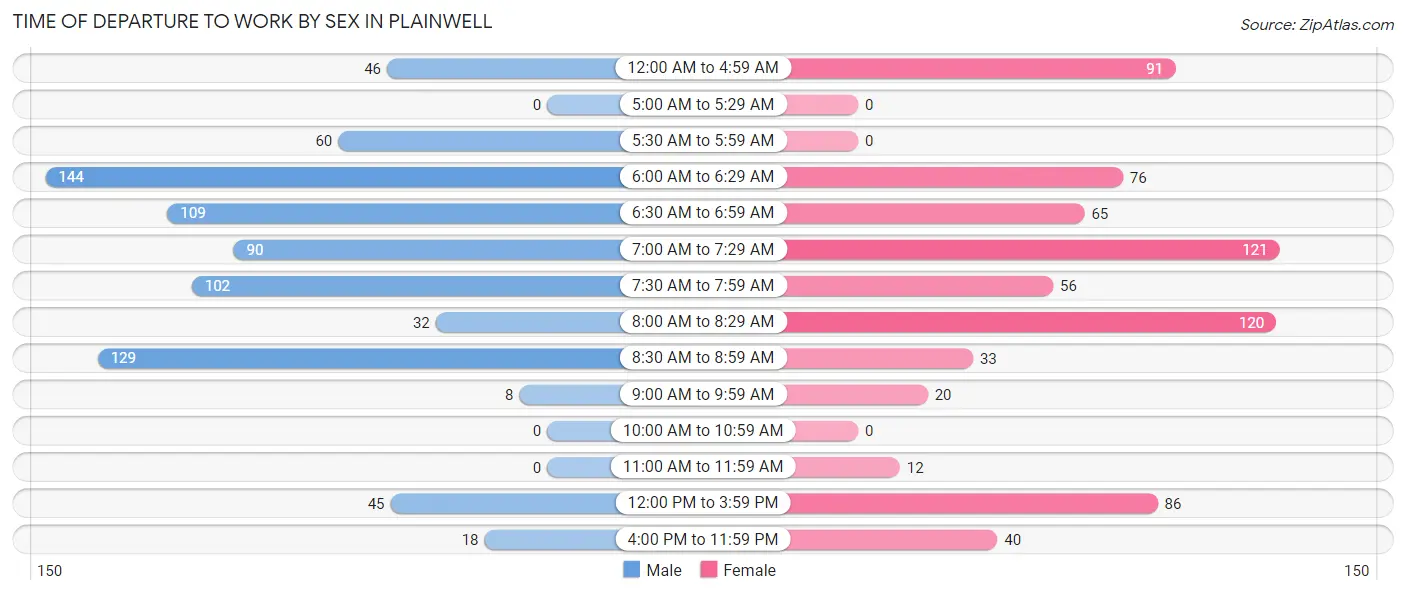
| Time of Departure | Male | Female |
| 12:00 AM to 4:59 AM | 46 (5.9%) | 91 (12.6%) |
| 5:00 AM to 5:29 AM | 0 (0.0%) | 0 (0.0%) |
| 5:30 AM to 5:59 AM | 60 (7.7%) | 0 (0.0%) |
| 6:00 AM to 6:29 AM | 144 (18.4%) | 76 (10.6%) |
| 6:30 AM to 6:59 AM | 109 (13.9%) | 65 (9.0%) |
| 7:00 AM to 7:29 AM | 90 (11.5%) | 121 (16.8%) |
| 7:30 AM to 7:59 AM | 102 (13.0%) | 56 (7.8%) |
| 8:00 AM to 8:29 AM | 32 (4.1%) | 120 (16.7%) |
| 8:30 AM to 8:59 AM | 129 (16.5%) | 33 (4.6%) |
| 9:00 AM to 9:59 AM | 8 (1.0%) | 20 (2.8%) |
| 10:00 AM to 10:59 AM | 0 (0.0%) | 0 (0.0%) |
| 11:00 AM to 11:59 AM | 0 (0.0%) | 12 (1.7%) |
| 12:00 PM to 3:59 PM | 45 (5.8%) | 86 (11.9%) |
| 4:00 PM to 11:59 PM | 18 (2.3%) | 40 (5.6%) |
| Total | 783 (100.0%) | 720 (100.0%) |
Housing Occupancy in Plainwell
Occupancy by Ownership in Plainwell
Of the total 1,498 dwellings in Plainwell, owner-occupied units account for 1,021 (68.2%), while renter-occupied units make up 477 (31.8%).
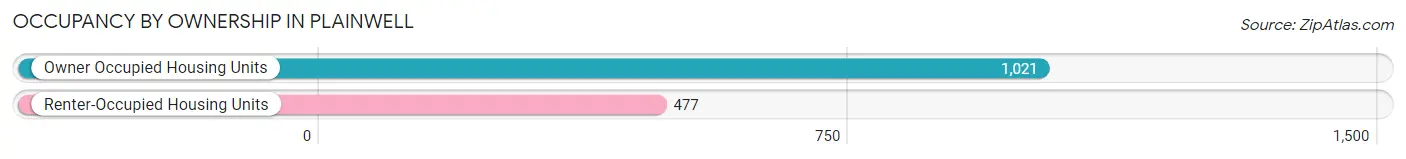
| Occupancy | # Housing Units | % Housing Units |
| Owner Occupied Housing Units | 1,021 | 68.2% |
| Renter-Occupied Housing Units | 477 | 31.8% |
| Total Occupied Housing Units | 1,498 | 100.0% |
Occupancy by Household Size in Plainwell
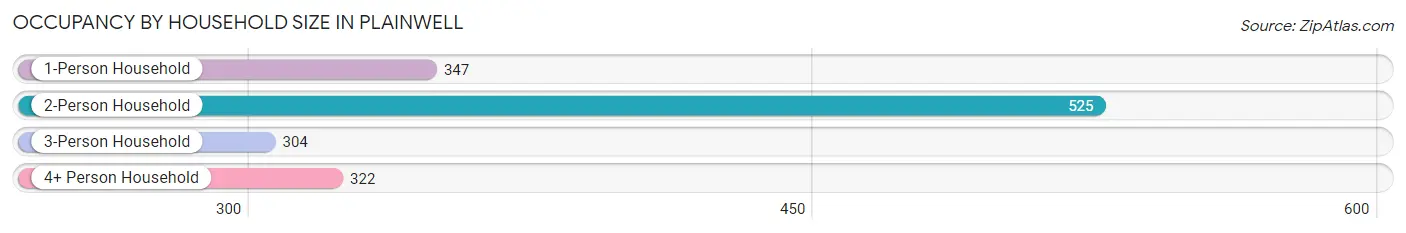
| Household Size | # Housing Units | % Housing Units |
| 1-Person Household | 347 | 23.2% |
| 2-Person Household | 525 | 35.0% |
| 3-Person Household | 304 | 20.3% |
| 4+ Person Household | 322 | 21.5% |
| Total Housing Units | 1,498 | 100.0% |
Occupancy by Ownership by Household Size in Plainwell
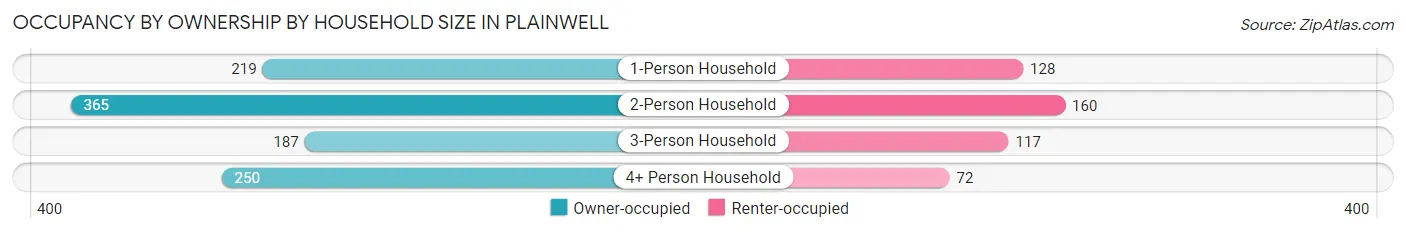
| Household Size | Owner-occupied | Renter-occupied |
| 1-Person Household | 219 (63.1%) | 128 (36.9%) |
| 2-Person Household | 365 (69.5%) | 160 (30.5%) |
| 3-Person Household | 187 (61.5%) | 117 (38.5%) |
| 4+ Person Household | 250 (77.6%) | 72 (22.4%) |
| Total Housing Units | 1,021 (68.2%) | 477 (31.8%) |
Occupancy by Educational Attainment in Plainwell
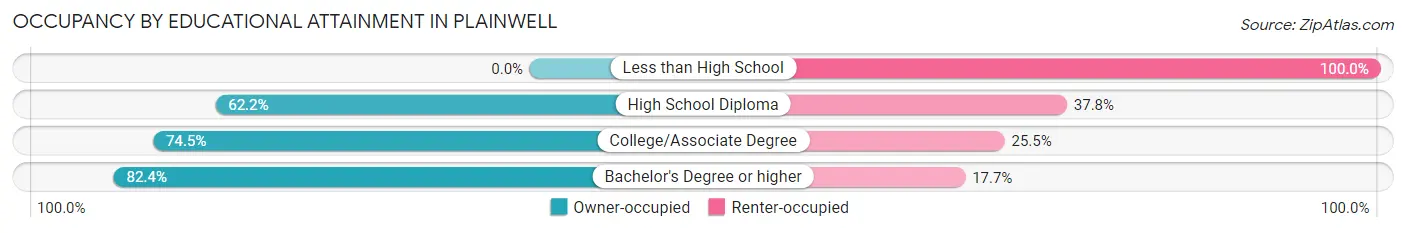
| Household Size | Owner-occupied | Renter-occupied |
| Less than High School | 0 (0.0%) | 63 (100.0%) |
| High School Diploma | 352 (62.2%) | 214 (37.8%) |
| College/Associate Degree | 445 (74.5%) | 152 (25.5%) |
| Bachelor's Degree or higher | 224 (82.4%) | 48 (17.6%) |
Occupancy by Age of Householder in Plainwell
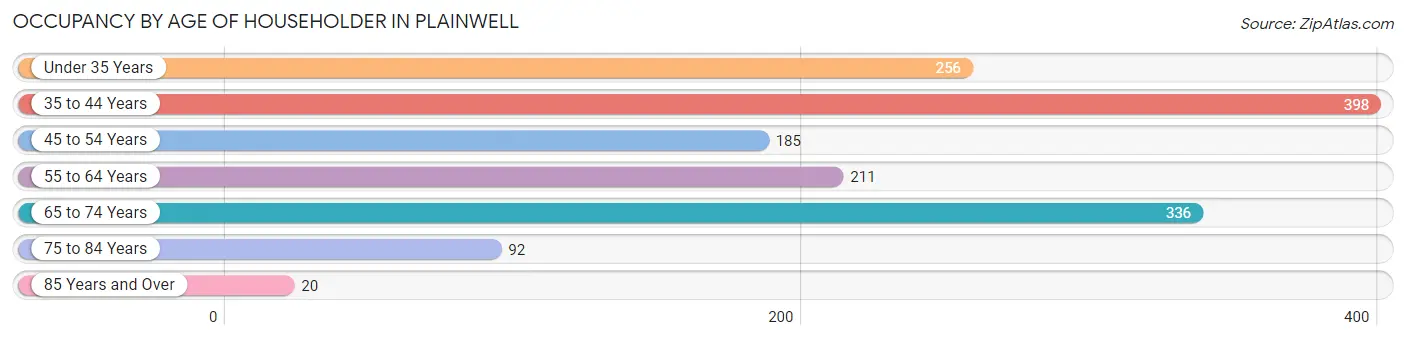
| Age Bracket | # Households | % Households |
| Under 35 Years | 256 | 17.1% |
| 35 to 44 Years | 398 | 26.6% |
| 45 to 54 Years | 185 | 12.3% |
| 55 to 64 Years | 211 | 14.1% |
| 65 to 74 Years | 336 | 22.4% |
| 75 to 84 Years | 92 | 6.1% |
| 85 Years and Over | 20 | 1.3% |
| Total | 1,498 | 100.0% |
Housing Finances in Plainwell
Median Income by Occupancy in Plainwell
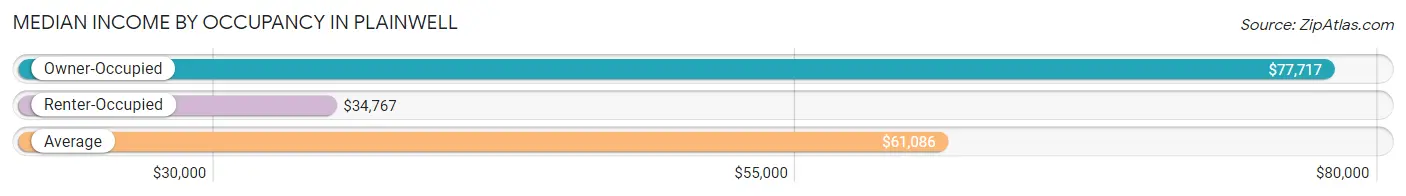
| Occupancy Type | # Households | Median Income |
| Owner-Occupied | 1,021 (68.2%) | $77,717 |
| Renter-Occupied | 477 (31.8%) | $34,767 |
| Average | 1,498 (100.0%) | $61,086 |
Occupancy by Householder Income Bracket in Plainwell
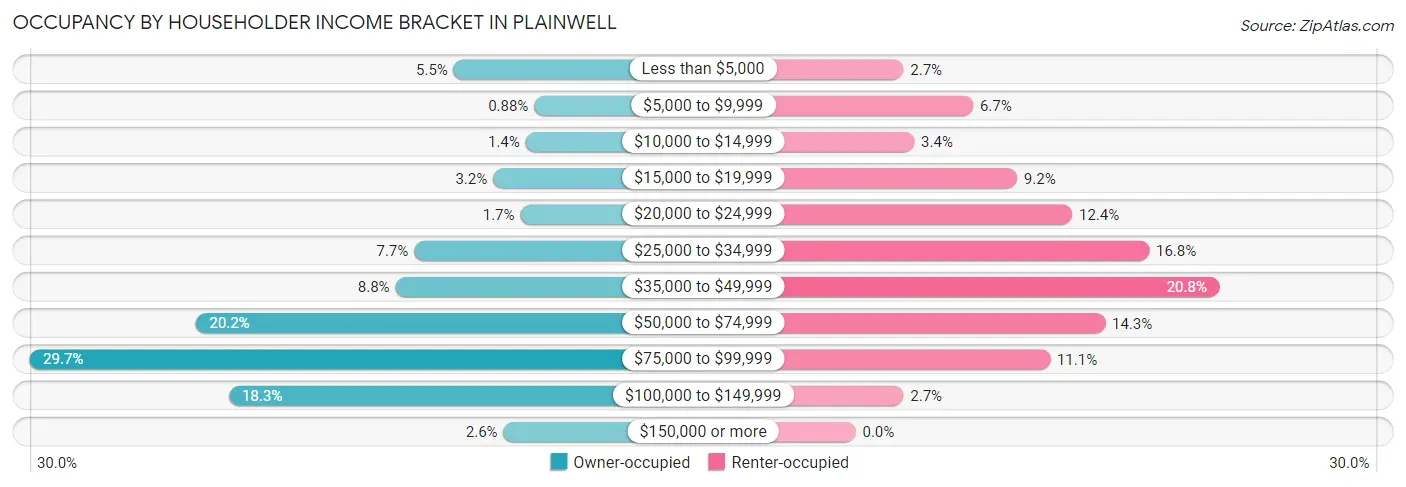
| Income Bracket | Owner-occupied | Renter-occupied |
| Less than $5,000 | 56 (5.5%) | 13 (2.7%) |
| $5,000 to $9,999 | 9 (0.9%) | 32 (6.7%) |
| $10,000 to $14,999 | 14 (1.4%) | 16 (3.4%) |
| $15,000 to $19,999 | 33 (3.2%) | 44 (9.2%) |
| $20,000 to $24,999 | 17 (1.7%) | 59 (12.4%) |
| $25,000 to $34,999 | 79 (7.7%) | 80 (16.8%) |
| $35,000 to $49,999 | 90 (8.8%) | 99 (20.7%) |
| $50,000 to $74,999 | 206 (20.2%) | 68 (14.3%) |
| $75,000 to $99,999 | 303 (29.7%) | 53 (11.1%) |
| $100,000 to $149,999 | 187 (18.3%) | 13 (2.7%) |
| $150,000 or more | 27 (2.6%) | 0 (0.0%) |
| Total | 1,021 (100.0%) | 477 (100.0%) |
Monthly Housing Cost Tiers in Plainwell
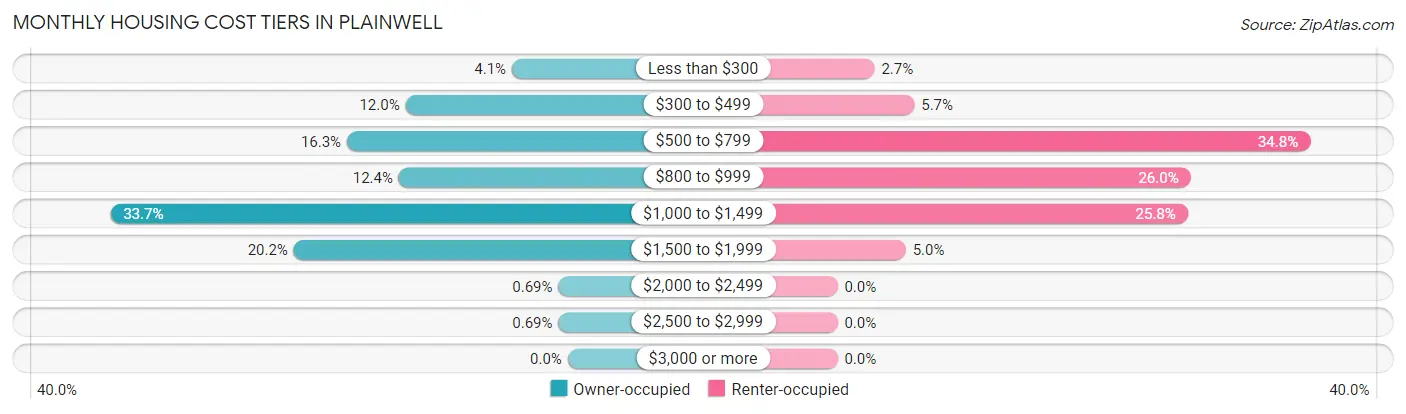
| Monthly Cost | Owner-occupied | Renter-occupied |
| Less than $300 | 42 (4.1%) | 13 (2.7%) |
| $300 to $499 | 122 (11.9%) | 27 (5.7%) |
| $500 to $799 | 166 (16.3%) | 166 (34.8%) |
| $800 to $999 | 127 (12.4%) | 124 (26.0%) |
| $1,000 to $1,499 | 344 (33.7%) | 123 (25.8%) |
| $1,500 to $1,999 | 206 (20.2%) | 24 (5.0%) |
| $2,000 to $2,499 | 7 (0.7%) | 0 (0.0%) |
| $2,500 to $2,999 | 7 (0.7%) | 0 (0.0%) |
| $3,000 or more | 0 (0.0%) | 0 (0.0%) |
| Total | 1,021 (100.0%) | 477 (100.0%) |
Physical Housing Characteristics in Plainwell
Housing Structures in Plainwell
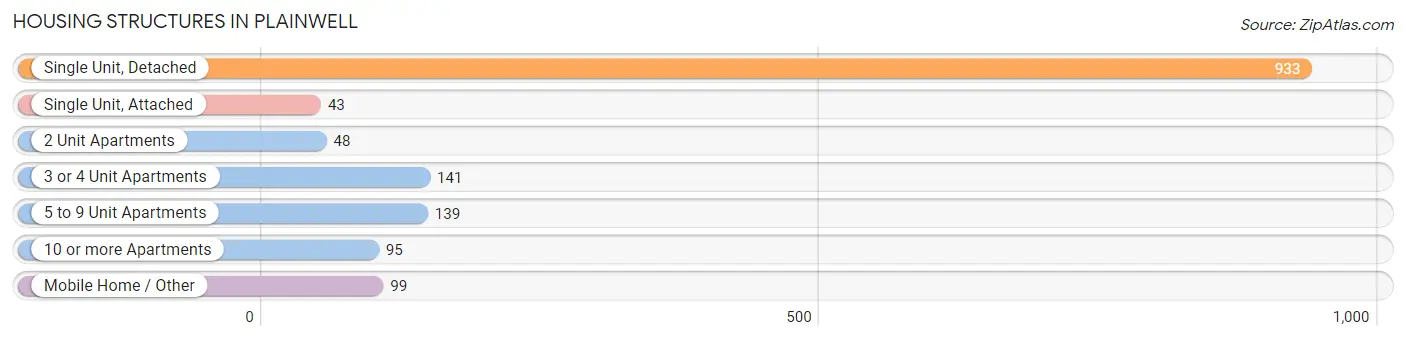
| Structure Type | # Housing Units | % Housing Units |
| Single Unit, Detached | 933 | 62.3% |
| Single Unit, Attached | 43 | 2.9% |
| 2 Unit Apartments | 48 | 3.2% |
| 3 or 4 Unit Apartments | 141 | 9.4% |
| 5 to 9 Unit Apartments | 139 | 9.3% |
| 10 or more Apartments | 95 | 6.3% |
| Mobile Home / Other | 99 | 6.6% |
| Total | 1,498 | 100.0% |
Housing Structures by Occupancy in Plainwell
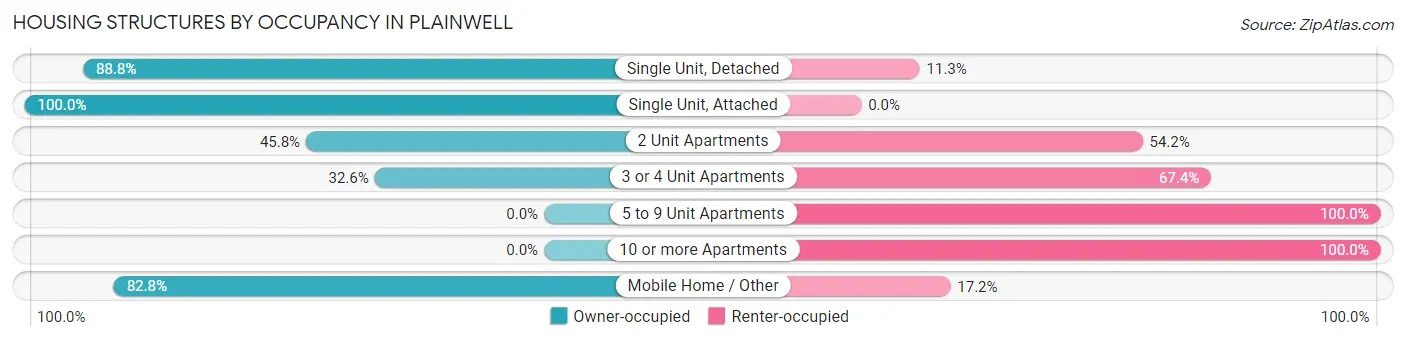
| Structure Type | Owner-occupied | Renter-occupied |
| Single Unit, Detached | 828 (88.7%) | 105 (11.3%) |
| Single Unit, Attached | 43 (100.0%) | 0 (0.0%) |
| 2 Unit Apartments | 22 (45.8%) | 26 (54.2%) |
| 3 or 4 Unit Apartments | 46 (32.6%) | 95 (67.4%) |
| 5 to 9 Unit Apartments | 0 (0.0%) | 139 (100.0%) |
| 10 or more Apartments | 0 (0.0%) | 95 (100.0%) |
| Mobile Home / Other | 82 (82.8%) | 17 (17.2%) |
| Total | 1,021 (68.2%) | 477 (31.8%) |
Housing Structures by Number of Rooms in Plainwell
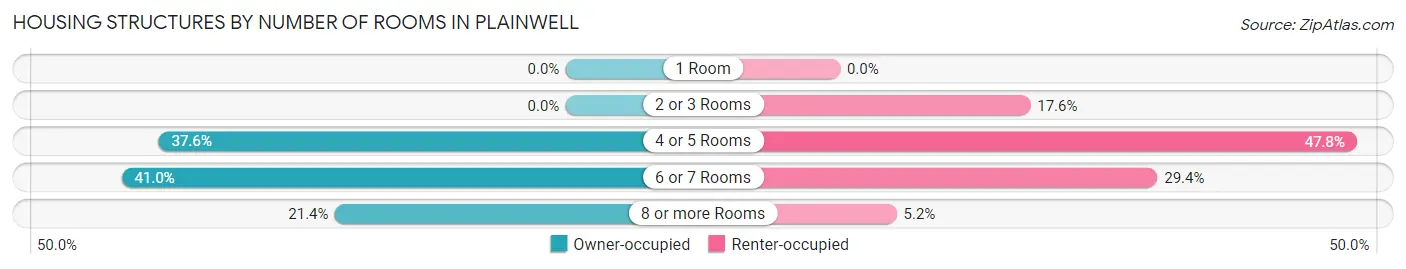
| Number of Rooms | Owner-occupied | Renter-occupied |
| 1 Room | 0 (0.0%) | 0 (0.0%) |
| 2 or 3 Rooms | 0 (0.0%) | 84 (17.6%) |
| 4 or 5 Rooms | 384 (37.6%) | 228 (47.8%) |
| 6 or 7 Rooms | 419 (41.0%) | 140 (29.3%) |
| 8 or more Rooms | 218 (21.3%) | 25 (5.2%) |
| Total | 1,021 (100.0%) | 477 (100.0%) |
Housing Structure by Heating Type in Plainwell
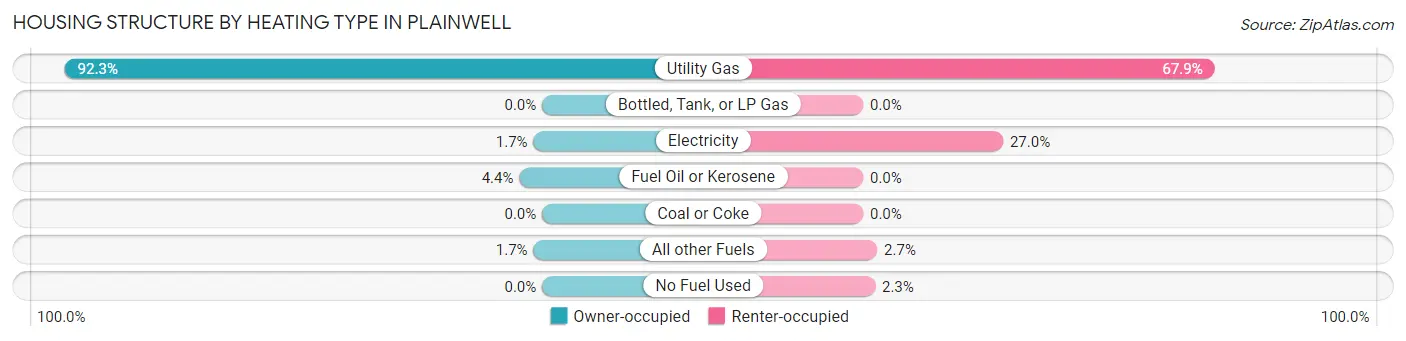
| Heating Type | Owner-occupied | Renter-occupied |
| Utility Gas | 942 (92.3%) | 324 (67.9%) |
| Bottled, Tank, or LP Gas | 0 (0.0%) | 0 (0.0%) |
| Electricity | 17 (1.7%) | 129 (27.0%) |
| Fuel Oil or Kerosene | 45 (4.4%) | 0 (0.0%) |
| Coal or Coke | 0 (0.0%) | 0 (0.0%) |
| All other Fuels | 17 (1.7%) | 13 (2.7%) |
| No Fuel Used | 0 (0.0%) | 11 (2.3%) |
| Total | 1,021 (100.0%) | 477 (100.0%) |
Household Vehicle Usage in Plainwell
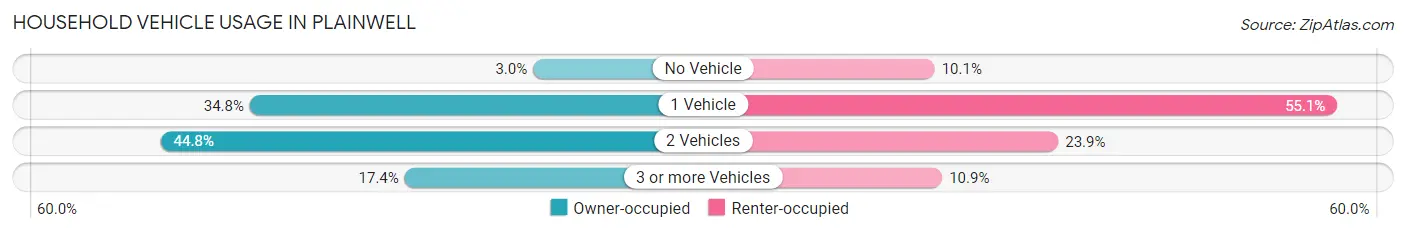
| Vehicles per Household | Owner-occupied | Renter-occupied |
| No Vehicle | 31 (3.0%) | 48 (10.1%) |
| 1 Vehicle | 355 (34.8%) | 263 (55.1%) |
| 2 Vehicles | 457 (44.8%) | 114 (23.9%) |
| 3 or more Vehicles | 178 (17.4%) | 52 (10.9%) |
| Total | 1,021 (100.0%) | 477 (100.0%) |
Real Estate & Mortgages in Plainwell
Real Estate and Mortgage Overview in Plainwell
| Characteristic | Without Mortgage | With Mortgage |
| Housing Units | 333 | 688 |
| Median Property Value | $150,600 | $173,300 |
| Median Household Income | $45,293 | $17 |
| Monthly Housing Costs | $512 | $0 |
| Real Estate Taxes | $3,140 | $29 |
Property Value by Mortgage Status in Plainwell
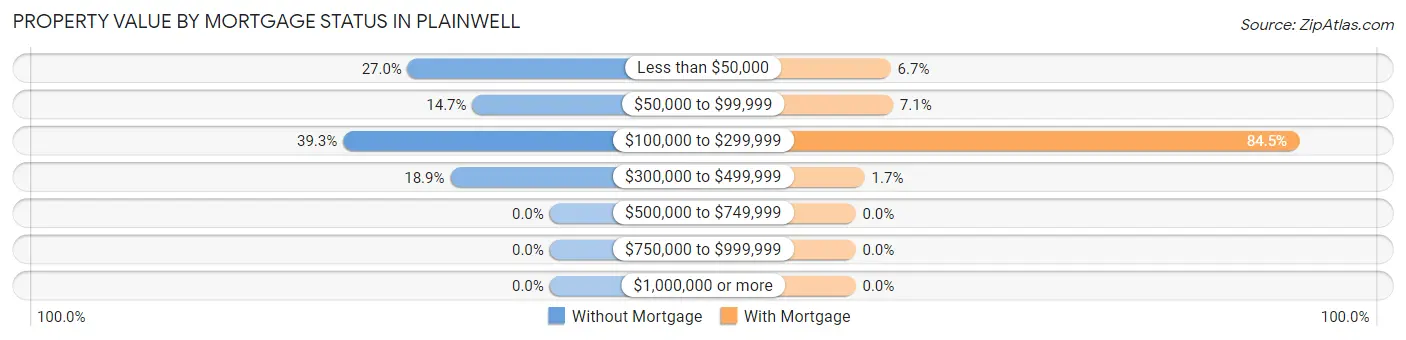
| Property Value | Without Mortgage | With Mortgage |
| Less than $50,000 | 90 (27.0%) | 46 (6.7%) |
| $50,000 to $99,999 | 49 (14.7%) | 49 (7.1%) |
| $100,000 to $299,999 | 131 (39.3%) | 581 (84.5%) |
| $300,000 to $499,999 | 63 (18.9%) | 12 (1.7%) |
| $500,000 to $749,999 | 0 (0.0%) | 0 (0.0%) |
| $750,000 to $999,999 | 0 (0.0%) | 0 (0.0%) |
| $1,000,000 or more | 0 (0.0%) | 0 (0.0%) |
| Total | 333 (100.0%) | 688 (100.0%) |
Household Income by Mortgage Status in Plainwell
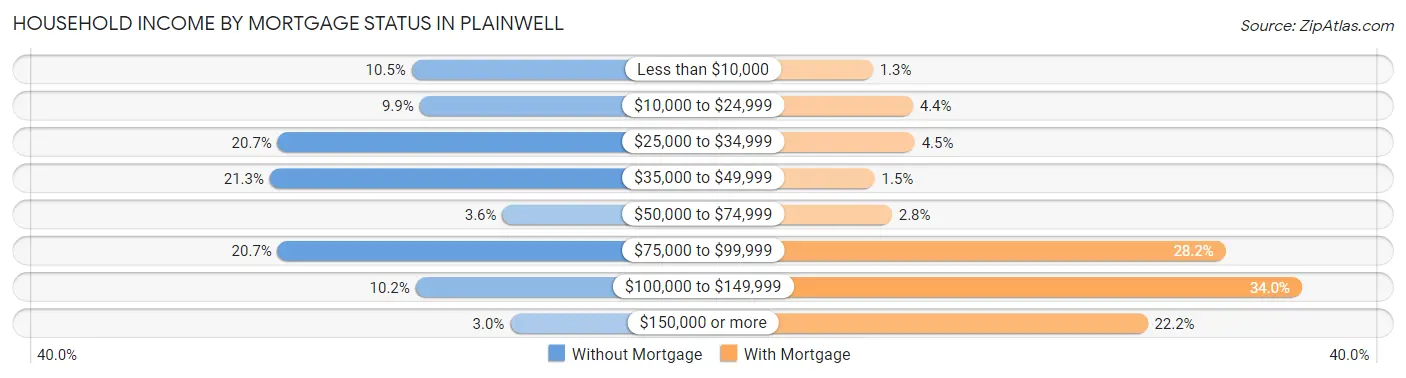
| Household Income | Without Mortgage | With Mortgage |
| Less than $10,000 | 35 (10.5%) | 9 (1.3%) |
| $10,000 to $24,999 | 33 (9.9%) | 30 (4.4%) |
| $25,000 to $34,999 | 69 (20.7%) | 31 (4.5%) |
| $35,000 to $49,999 | 71 (21.3%) | 10 (1.5%) |
| $50,000 to $74,999 | 12 (3.6%) | 19 (2.8%) |
| $75,000 to $99,999 | 69 (20.7%) | 194 (28.2%) |
| $100,000 to $149,999 | 34 (10.2%) | 234 (34.0%) |
| $150,000 or more | 10 (3.0%) | 153 (22.2%) |
| Total | 333 (100.0%) | 688 (100.0%) |
Property Value to Household Income Ratio in Plainwell
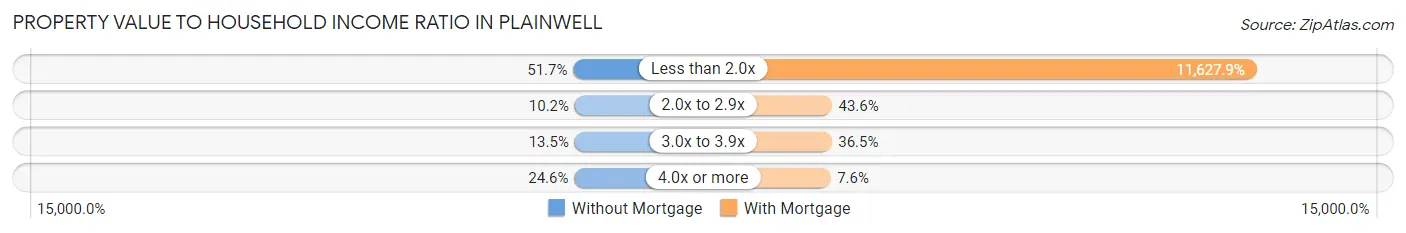
| Value-to-Income Ratio | Without Mortgage | With Mortgage |
| Less than 2.0x | 172 (51.6%) | 80,000 (11,627.9%) |
| 2.0x to 2.9x | 34 (10.2%) | 300 (43.6%) |
| 3.0x to 3.9x | 45 (13.5%) | 251 (36.5%) |
| 4.0x or more | 82 (24.6%) | 52 (7.6%) |
| Total | 333 (100.0%) | 688 (100.0%) |
Real Estate Taxes by Mortgage Status in Plainwell
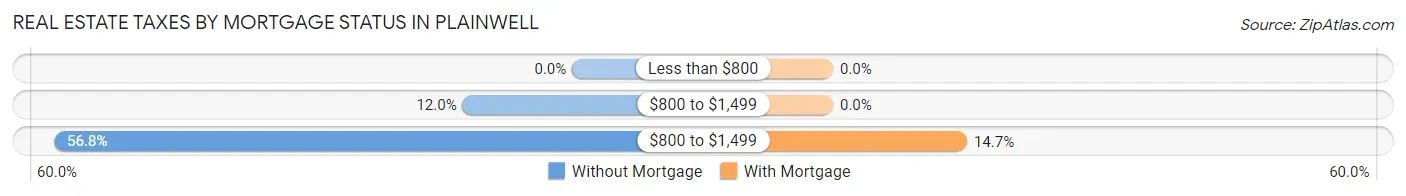
| Property Taxes | Without Mortgage | With Mortgage |
| Less than $800 | 0 (0.0%) | 0 (0.0%) |
| $800 to $1,499 | 40 (12.0%) | 0 (0.0%) |
| $800 to $1,499 | 189 (56.8%) | 101 (14.7%) |
| Total | 333 (100.0%) | 688 (100.0%) |
Health & Disability in Plainwell
Health Insurance Coverage by Age in Plainwell
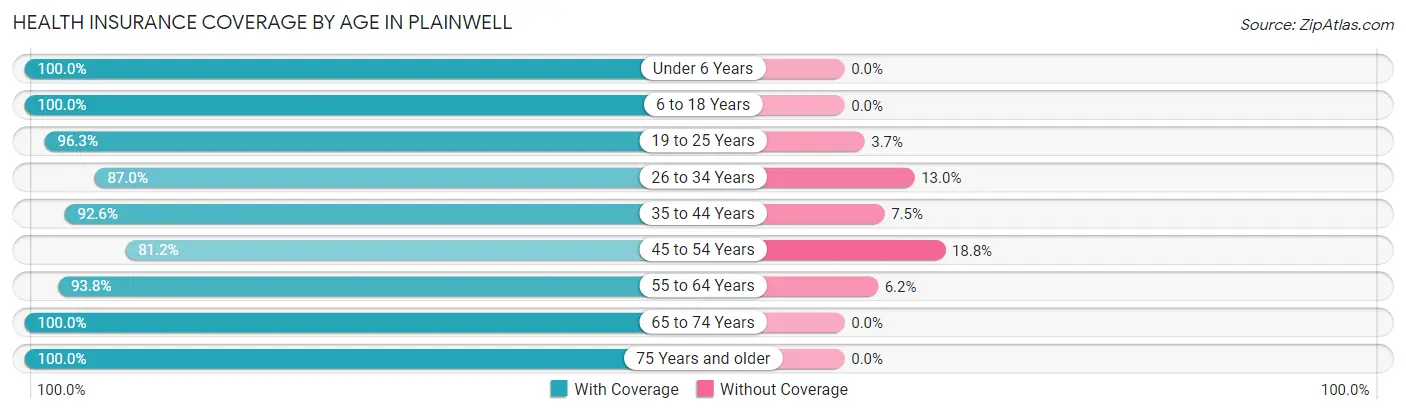
| Age Bracket | With Coverage | Without Coverage |
| Under 6 Years | 122 (100.0%) | 0 (0.0%) |
| 6 to 18 Years | 623 (100.0%) | 0 (0.0%) |
| 19 to 25 Years | 491 (96.3%) | 19 (3.7%) |
| 26 to 34 Years | 300 (87.0%) | 45 (13.0%) |
| 35 to 44 Years | 634 (92.5%) | 51 (7.4%) |
| 45 to 54 Years | 251 (81.2%) | 58 (18.8%) |
| 55 to 64 Years | 376 (93.8%) | 25 (6.2%) |
| 65 to 74 Years | 474 (100.0%) | 0 (0.0%) |
| 75 Years and older | 184 (100.0%) | 0 (0.0%) |
| Total | 3,455 (94.6%) | 198 (5.4%) |
Health Insurance Coverage by Citizenship Status in Plainwell
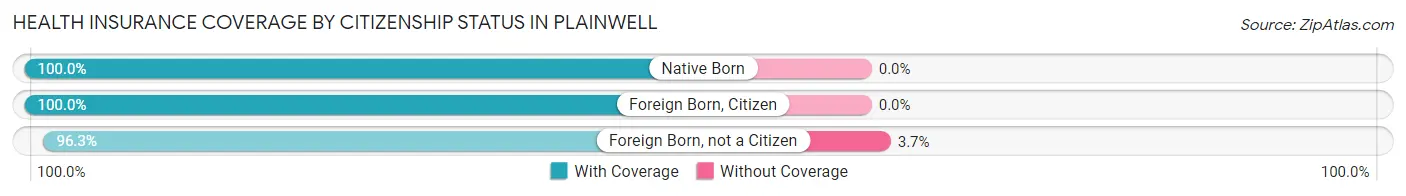
| Citizenship Status | With Coverage | Without Coverage |
| Native Born | 122 (100.0%) | 0 (0.0%) |
| Foreign Born, Citizen | 623 (100.0%) | 0 (0.0%) |
| Foreign Born, not a Citizen | 491 (96.3%) | 19 (3.7%) |
Health Insurance Coverage by Household Income in Plainwell
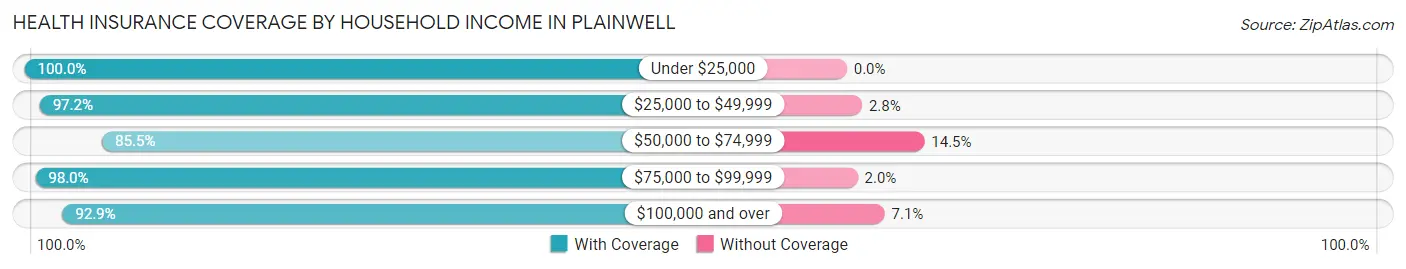
| Household Income | With Coverage | Without Coverage |
| Under $25,000 | 499 (100.0%) | 0 (0.0%) |
| $25,000 to $49,999 | 754 (97.2%) | 22 (2.8%) |
| $50,000 to $74,999 | 500 (85.5%) | 85 (14.5%) |
| $75,000 to $99,999 | 1,017 (98.0%) | 21 (2.0%) |
| $100,000 and over | 656 (92.9%) | 50 (7.1%) |
Public vs Private Health Insurance Coverage by Age in Plainwell
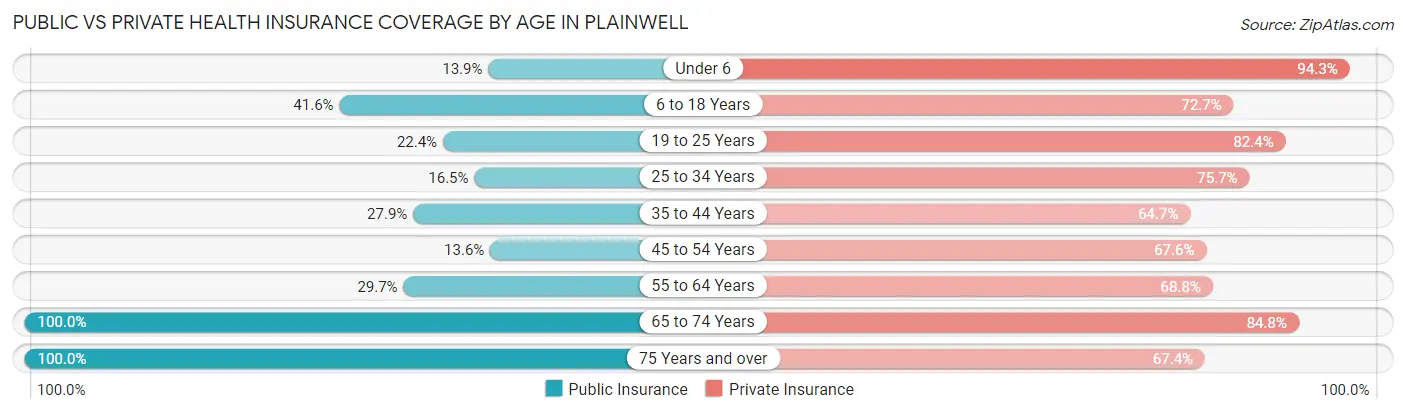
| Age Bracket | Public Insurance | Private Insurance |
| Under 6 | 17 (13.9%) | 115 (94.3%) |
| 6 to 18 Years | 259 (41.6%) | 453 (72.7%) |
| 19 to 25 Years | 114 (22.4%) | 420 (82.4%) |
| 25 to 34 Years | 57 (16.5%) | 261 (75.6%) |
| 35 to 44 Years | 191 (27.9%) | 443 (64.7%) |
| 45 to 54 Years | 42 (13.6%) | 209 (67.6%) |
| 55 to 64 Years | 119 (29.7%) | 276 (68.8%) |
| 65 to 74 Years | 474 (100.0%) | 402 (84.8%) |
| 75 Years and over | 184 (100.0%) | 124 (67.4%) |
| Total | 1,457 (39.9%) | 2,703 (74.0%) |
Disability Status by Sex by Age in Plainwell
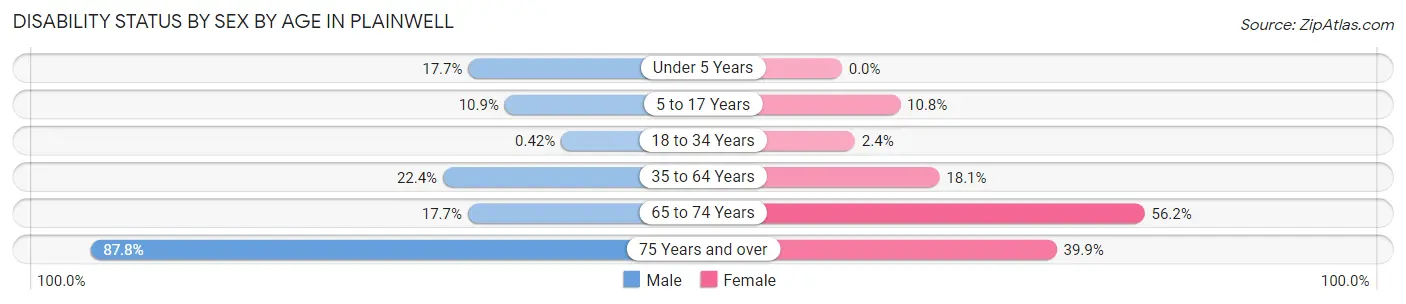
| Age Bracket | Male | Female |
| Under 5 Years | 9 (17.6%) | 0 (0.0%) |
| 5 to 17 Years | 32 (10.9%) | 33 (10.8%) |
| 18 to 34 Years | 2 (0.4%) | 10 (2.4%) |
| 35 to 64 Years | 160 (22.4%) | 123 (18.1%) |
| 65 to 74 Years | 44 (17.7%) | 127 (56.2%) |
| 75 Years and over | 36 (87.8%) | 57 (39.9%) |
Disability Class by Sex by Age in Plainwell
Disability Class: Hearing Difficulty
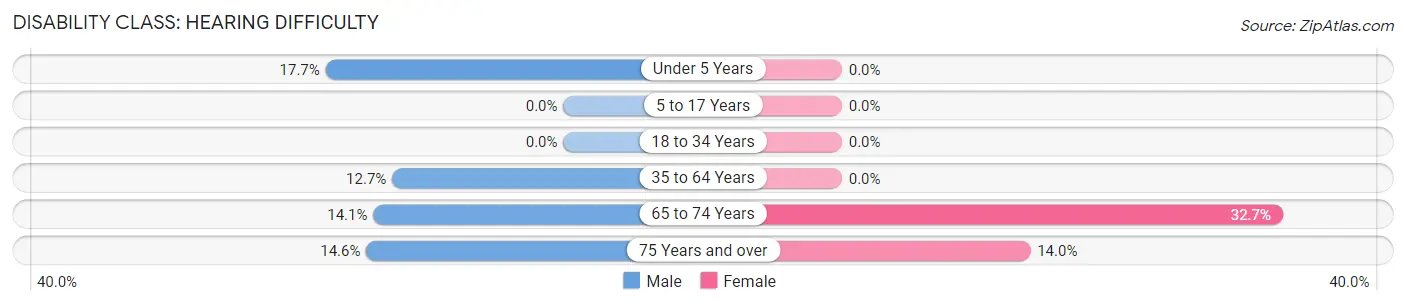
| Age Bracket | Male | Female |
| Under 5 Years | 9 (17.6%) | 0 (0.0%) |
| 5 to 17 Years | 0 (0.0%) | 0 (0.0%) |
| 18 to 34 Years | 0 (0.0%) | 0 (0.0%) |
| 35 to 64 Years | 91 (12.7%) | 0 (0.0%) |
| 65 to 74 Years | 35 (14.1%) | 74 (32.7%) |
| 75 Years and over | 6 (14.6%) | 20 (14.0%) |
Disability Class: Vision Difficulty
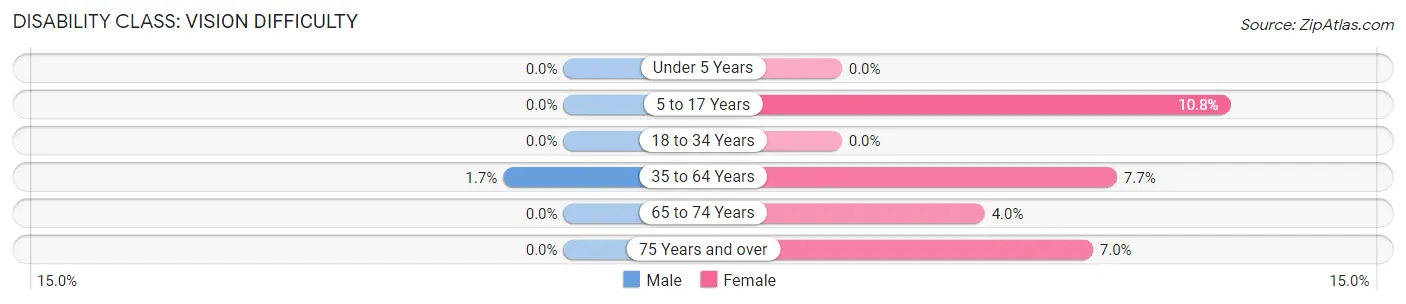
| Age Bracket | Male | Female |
| Under 5 Years | 0 (0.0%) | 0 (0.0%) |
| 5 to 17 Years | 0 (0.0%) | 33 (10.8%) |
| 18 to 34 Years | 0 (0.0%) | 0 (0.0%) |
| 35 to 64 Years | 12 (1.7%) | 52 (7.7%) |
| 65 to 74 Years | 0 (0.0%) | 9 (4.0%) |
| 75 Years and over | 0 (0.0%) | 10 (7.0%) |
Disability Class: Cognitive Difficulty
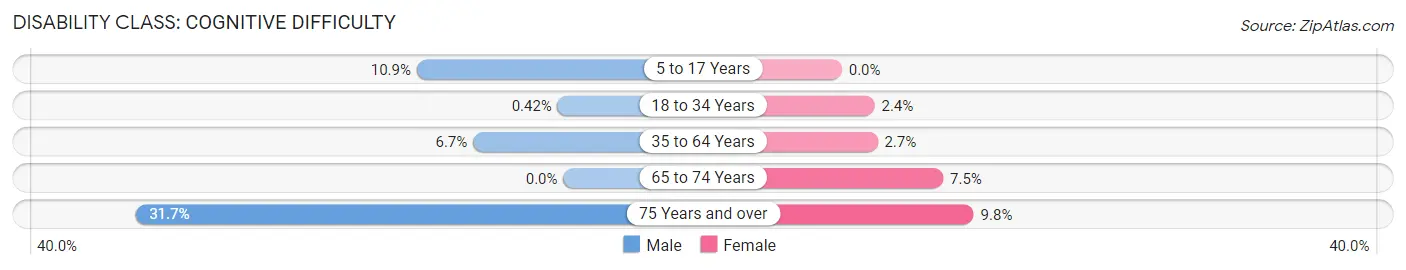
| Age Bracket | Male | Female |
| 5 to 17 Years | 32 (10.9%) | 0 (0.0%) |
| 18 to 34 Years | 2 (0.4%) | 10 (2.4%) |
| 35 to 64 Years | 48 (6.7%) | 18 (2.6%) |
| 65 to 74 Years | 0 (0.0%) | 17 (7.5%) |
| 75 Years and over | 13 (31.7%) | 14 (9.8%) |
Disability Class: Ambulatory Difficulty
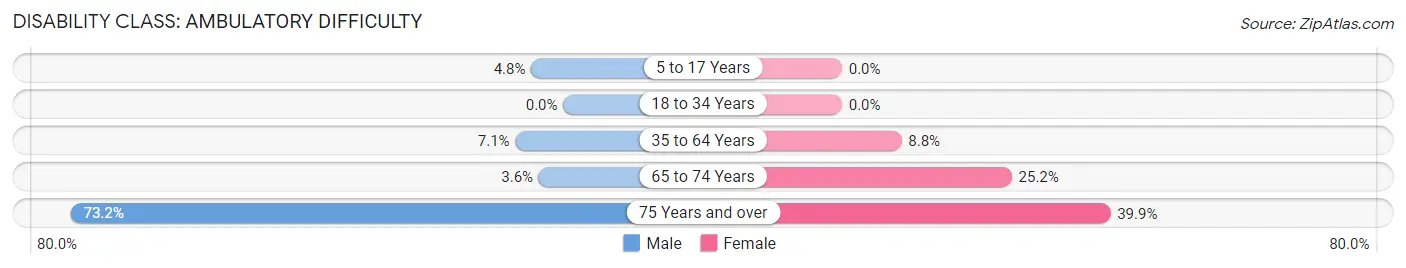
| Age Bracket | Male | Female |
| 5 to 17 Years | 14 (4.8%) | 0 (0.0%) |
| 18 to 34 Years | 0 (0.0%) | 0 (0.0%) |
| 35 to 64 Years | 51 (7.1%) | 60 (8.8%) |
| 65 to 74 Years | 9 (3.6%) | 57 (25.2%) |
| 75 Years and over | 30 (73.2%) | 57 (39.9%) |
Disability Class: Self-Care Difficulty
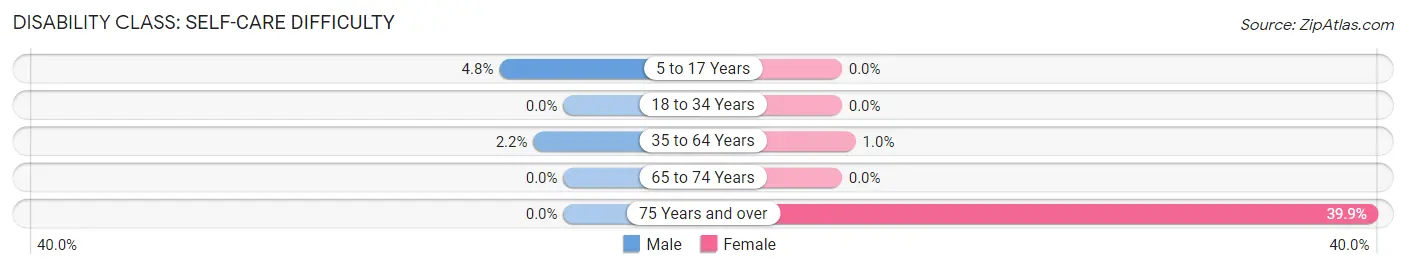
| Age Bracket | Male | Female |
| 5 to 17 Years | 14 (4.8%) | 0 (0.0%) |
| 18 to 34 Years | 0 (0.0%) | 0 (0.0%) |
| 35 to 64 Years | 16 (2.2%) | 7 (1.0%) |
| 65 to 74 Years | 0 (0.0%) | 0 (0.0%) |
| 75 Years and over | 0 (0.0%) | 57 (39.9%) |
Technology Access in Plainwell
Computing Device Access in Plainwell
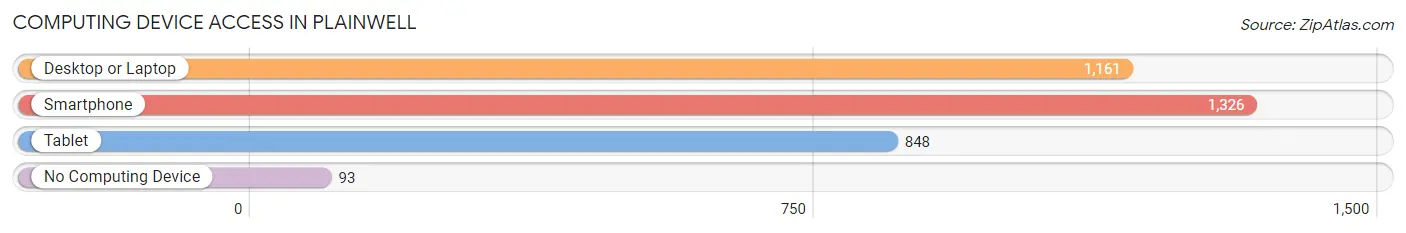
| Device Type | # Households | % Households |
| Desktop or Laptop | 1,161 | 77.5% |
| Smartphone | 1,326 | 88.5% |
| Tablet | 848 | 56.6% |
| No Computing Device | 93 | 6.2% |
| Total | 1,498 | 100.0% |
Internet Access in Plainwell
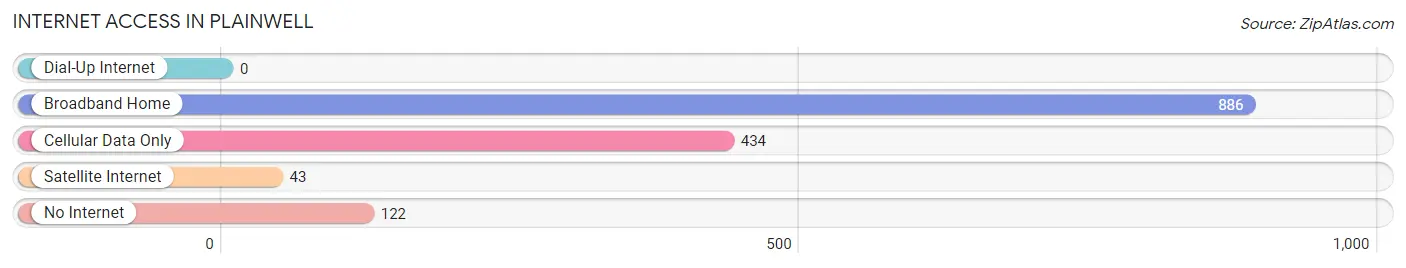
| Internet Type | # Households | % Households |
| Dial-Up Internet | 0 | 0.0% |
| Broadband Home | 886 | 59.2% |
| Cellular Data Only | 434 | 29.0% |
| Satellite Internet | 43 | 2.9% |
| No Internet | 122 | 8.1% |
| Total | 1,498 | 100.0% |
Plainwell Summary
Plainwell is a city located in Allegan County, Michigan, United States. The population was 3,804 at the 2010 census. It is part of the Kalamazoo-Portage Metropolitan Statistical Area.
History
The area that is now Plainwell was first settled in 1833 by a group of settlers from New York. The settlement was originally known as "Plainfield" and was located on the banks of the Kalamazoo River. In 1837, the name was changed to "Plainwell" after the nearby Plainwell Mill. The mill was built in 1836 by William and John B. Miller and was the first grist mill in the area.
In 1844, the first post office was established in Plainwell. The village was incorporated in 1867 and the first mayor was elected in 1868.
Geography
Plainwell is located at 42°27′N 85°37′W (42.45, -85.62). According to the United States Census Bureau, the city has a total area of 2.2 square miles (5.7 km2), all land.
Economy
The economy of Plainwell is largely based on agriculture and manufacturing. The city is home to several large manufacturing companies, including Plainwell Paper Company, which produces paper products, and Plainwell Foundry, which produces metal products.
The city is also home to several small businesses, including restaurants, retail stores, and service providers.
Demographics
As of the census of 2010, there were 3,804 people, 1,541 households, and 1,039 families residing in the city. The population density was 1,717.3 people per square mile (662.2/km2). There were 1,664 housing units at an average density of 745.5 per square mile (288.2/km2). The racial makeup of the city was 95.2% White, 0.7% African American, 0.4% Native American, 0.7% Asian, 0.1% Pacific Islander, 1.2% from other races, and 1.7% from two or more races. Hispanic or Latino of any race were 3.2% of the population.
There were 1,541 households, out of which 32.2% had children under the age of 18 living with them, 51.2% were married couples living together, 11.7% had a female householder with no husband present, and 32.7% were non-families. 27.2% of all households were made up of individuals, and 11.2% had someone living alone who was 65 years of age or older. The average household size was 2.48 and the average family size was 3.00.
In the city, the population was spread out, with 25.7% under the age of 18, 8.2% from 18 to 24, 28.2% from 25 to 44, 23.2% from 45 to 64, and 14.7% who were 65 years of age or older. The median age was 37 years. For every 100 females, there were 93.2 males. For every 100 females age 18 and over, there were 89.3 males.
The median income for a household in the city was $41,944, and the median income for a family was $50,938. Males had a median income of $37,917 versus $25,917 for females. The per capita income for the city was $20,945. About 5.2% of families and 7.2% of the population were below the poverty line, including 8.3% of those under age 18 and 6.2% of those age 65 or over.
Common Questions
What is Per Capita Income in Plainwell?
Per Capita income in Plainwell is $26,753.
What is the Median Family Income in Plainwell?
Median Family Income in Plainwell is $61,750.
What is the Median Household income in Plainwell?
Median Household Income in Plainwell is $61,086.
What is Income or Wage Gap in Plainwell?
Income or Wage Gap in Plainwell is 36.3%.
Women in Plainwell earn 63.7 cents for every dollar earned by a man.
What is Inequality or Gini Index in Plainwell?
Inequality or Gini Index in Plainwell is 0.36.
What is the Total Population of Plainwell?
Total Population of Plainwell is 3,763.
What is the Total Male Population of Plainwell?
Total Male Population of Plainwell is 1,868.
What is the Total Female Population of Plainwell?
Total Female Population of Plainwell is 1,895.
What is the Ratio of Males per 100 Females in Plainwell?
There are 98.58 Males per 100 Females in Plainwell.
What is the Ratio of Females per 100 Males in Plainwell?
There are 101.45 Females per 100 Males in Plainwell.
What is the Median Population Age in Plainwell?
Median Population Age in Plainwell is 39.5 Years.
What is the Average Family Size in Plainwell
Average Family Size in Plainwell is 2.8 People.
What is the Average Household Size in Plainwell
Average Household Size in Plainwell is 2.4 People.
How Large is the Labor Force in Plainwell?
There are 1,783 People in the Labor Forcein in Plainwell.
What is the Percentage of People in the Labor Force in Plainwell?
57.2% of People are in the Labor Force in Plainwell.
What is the Unemployment Rate in Plainwell?
Unemployment Rate in Plainwell is 5.8%.