Pinconning, MI Map & Demographics
Pinconning Map
Pinconning Overview
$29,613
PER CAPITA INCOME
$82,642
AVG FAMILY INCOME
$68,438
AVG HOUSEHOLD INCOME
42.3%
WAGE / INCOME GAP [ % ]
57.7¢/ $1
WAGE / INCOME GAP [ $ ]
0.39
INEQUALITY / GINI INDEX
1,354
TOTAL POPULATION
718
MALE POPULATION
636
FEMALE POPULATION
112.89
MALES / 100 FEMALES
88.58
FEMALES / 100 MALES
47.0
MEDIAN AGE
2.7
AVG FAMILY SIZE
2.3
AVG HOUSEHOLD SIZE
479
LABOR FORCE [ PEOPLE ]
41.8%
PERCENT IN LABOR FORCE
4.4%
UNEMPLOYMENT RATE
Pinconning Zip Codes
Pinconning Area Codes
Income in Pinconning
Income Overview in Pinconning
Per Capita Income in Pinconning is $29,613, while median incomes of families and households are $82,642 and $68,438 respectively.
| Characteristic | Number | Measure |
| Per Capita Income | 1,354 | $29,613 |
| Median Family Income | 390 | $82,642 |
| Mean Family Income | 390 | $83,734 |
| Median Household Income | 586 | $68,438 |
| Mean Household Income | 586 | $67,370 |
| Income Deficit | 390 | $0 |
| Wage / Income Gap (%) | 1,354 | 42.25% |
| Wage / Income Gap ($) | 1,354 | 57.75¢ per $1 |
| Gini / Inequality Index | 1,354 | 0.39 |
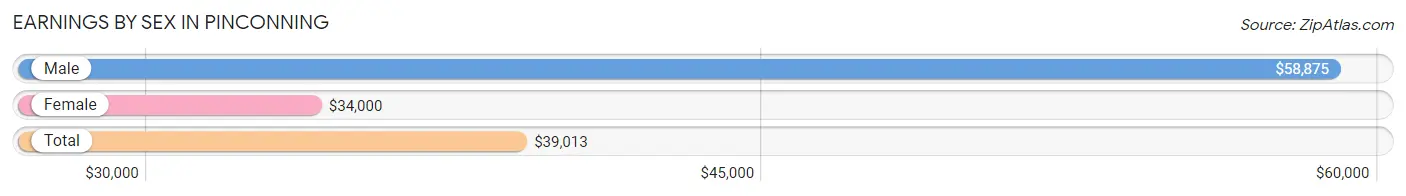
Earnings by Sex in Pinconning
Average Earnings in Pinconning are $39,013, $58,875 for men and $34,000 for women, a difference of 42.2%.
| Sex | Number | Average Earnings |
| Male | 301 (53.3%) | $58,875 |
| Female | 264 (46.7%) | $34,000 |
| Total | 565 (100.0%) | $39,013 |
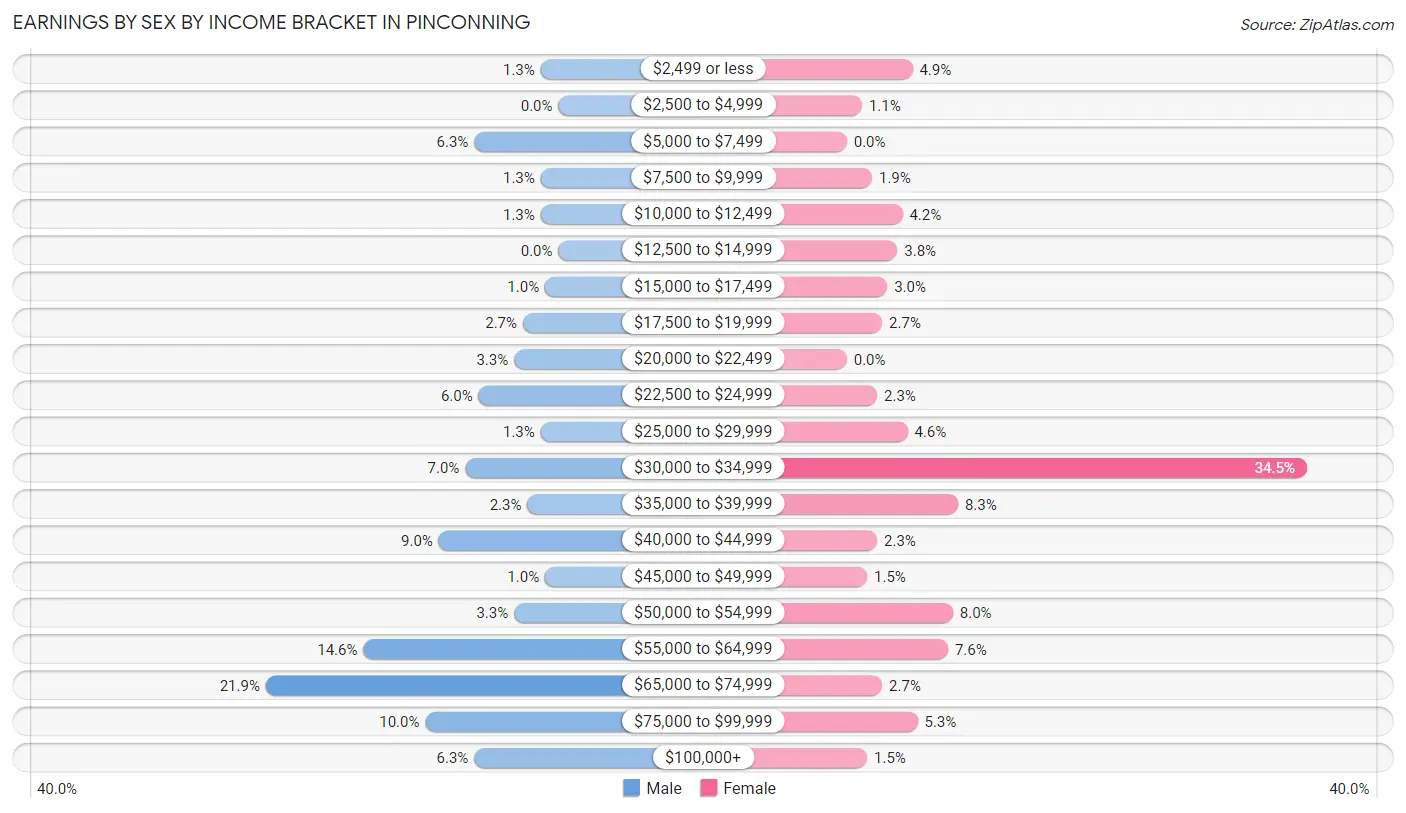
Earnings by Sex by Income Bracket in Pinconning
The most common earnings brackets in Pinconning are $65,000 to $74,999 for men (66 | 21.9%) and $30,000 to $34,999 for women (91 | 34.5%).
| Income | Male | Female |
| $2,499 or less | 4 (1.3%) | 13 (4.9%) |
| $2,500 to $4,999 | 0 (0.0%) | 3 (1.1%) |
| $5,000 to $7,499 | 19 (6.3%) | 0 (0.0%) |
| $7,500 to $9,999 | 4 (1.3%) | 5 (1.9%) |
| $10,000 to $12,499 | 4 (1.3%) | 11 (4.2%) |
| $12,500 to $14,999 | 0 (0.0%) | 10 (3.8%) |
| $15,000 to $17,499 | 3 (1.0%) | 8 (3.0%) |
| $17,500 to $19,999 | 8 (2.7%) | 7 (2.6%) |
| $20,000 to $22,499 | 10 (3.3%) | 0 (0.0%) |
| $22,500 to $24,999 | 18 (6.0%) | 6 (2.3%) |
| $25,000 to $29,999 | 4 (1.3%) | 12 (4.5%) |
| $30,000 to $34,999 | 21 (7.0%) | 91 (34.5%) |
| $35,000 to $39,999 | 7 (2.3%) | 22 (8.3%) |
| $40,000 to $44,999 | 27 (9.0%) | 6 (2.3%) |
| $45,000 to $49,999 | 3 (1.0%) | 4 (1.5%) |
| $50,000 to $54,999 | 10 (3.3%) | 21 (8.0%) |
| $55,000 to $64,999 | 44 (14.6%) | 20 (7.6%) |
| $65,000 to $74,999 | 66 (21.9%) | 7 (2.6%) |
| $75,000 to $99,999 | 30 (10.0%) | 14 (5.3%) |
| $100,000+ | 19 (6.3%) | 4 (1.5%) |
| Total | 301 (100.0%) | 264 (100.0%) |
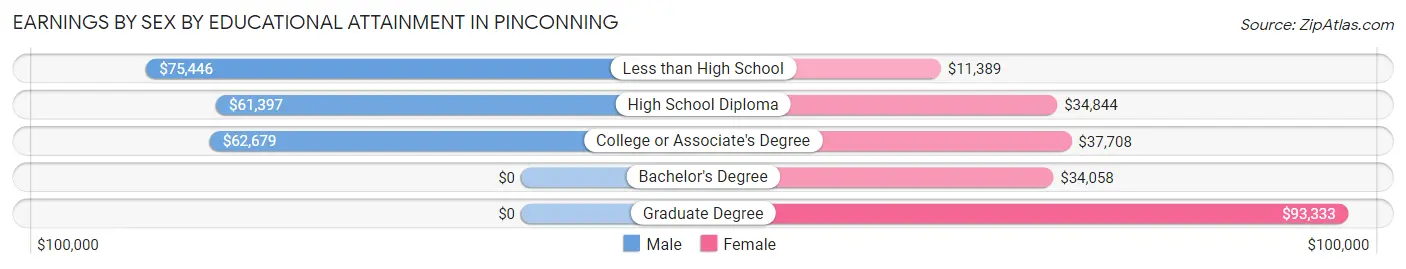
Earnings by Sex by Educational Attainment in Pinconning
Average earnings in Pinconning are $61,354 for men and $34,074 for women, a difference of 44.5%. Men with an educational attainment of less than high school enjoy the highest average annual earnings of $75,446, while those with high school diploma education earn the least with $61,397. Women with an educational attainment of graduate degree earn the most with the average annual earnings of $93,333, while those with less than high school education have the smallest earnings of $11,389.
| Educational Attainment | Male Income | Female Income |
| Less than High School | $75,446 | $11,389 |
| High School Diploma | $61,397 | $34,844 |
| College or Associate's Degree | $62,679 | $37,708 |
| Bachelor's Degree | - | - |
| Graduate Degree | - | - |
| Total | $61,354 | $34,074 |
Family Income in Pinconning
Family Income Brackets in Pinconning
According to the Pinconning family income data, there are 122 families falling into the $75,000 to $99,999 income range, which is the most common income bracket and makes up 31.3% of all families.
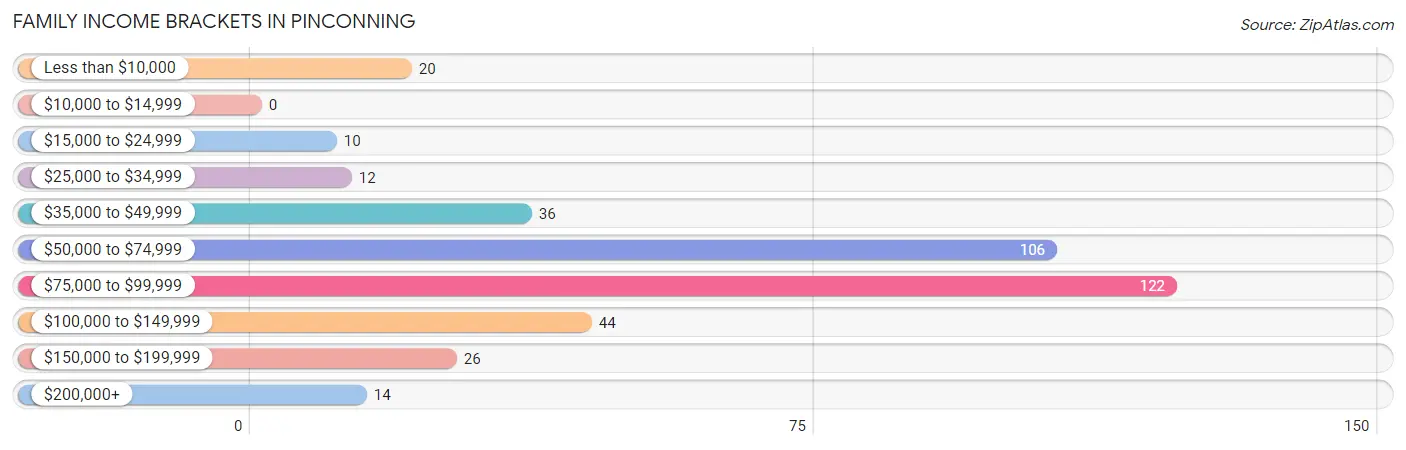
| Income Bracket | # Families | % Families |
| Less than $10,000 | 20 | 5.1% |
| $10,000 to $14,999 | 0 | 0.0% |
| $15,000 to $24,999 | 10 | 2.6% |
| $25,000 to $34,999 | 12 | 3.1% |
| $35,000 to $49,999 | 36 | 9.2% |
| $50,000 to $74,999 | 106 | 27.2% |
| $75,000 to $99,999 | 122 | 31.3% |
| $100,000 to $149,999 | 44 | 11.3% |
| $150,000 to $199,999 | 26 | 6.7% |
| $200,000+ | 14 | 3.6% |
Family Income by Famaliy Size in Pinconning
4-person families (50 | 12.8%) account for the highest median family income in Pinconning with $84,091 per family, while 2-person families (246 | 63.1%) have the highest median income of $41,510 per family member.
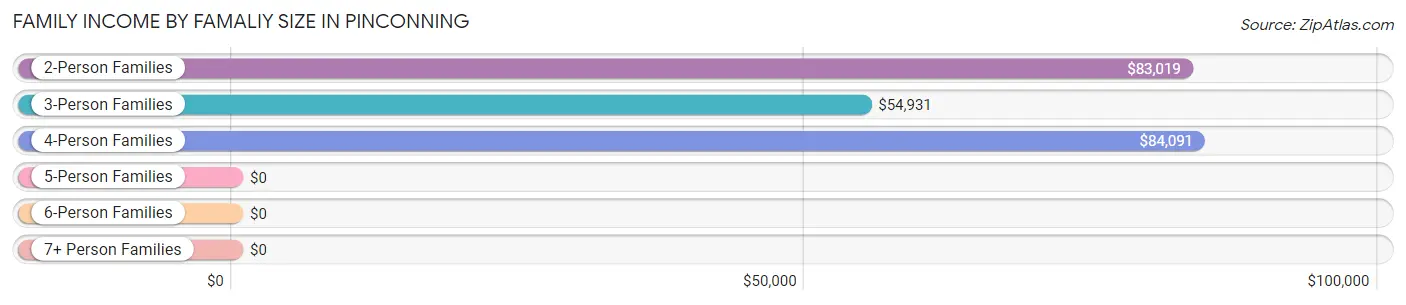
| Income Bracket | # Families | Median Income |
| 2-Person Families | 246 (63.1%) | $83,019 |
| 3-Person Families | 87 (22.3%) | $54,931 |
| 4-Person Families | 50 (12.8%) | $84,091 |
| 5-Person Families | 7 (1.8%) | $0 |
| 6-Person Families | 0 (0.0%) | $0 |
| 7+ Person Families | 0 (0.0%) | $0 |
| Total | 390 (100.0%) | $82,642 |
Family Income by Number of Earners in Pinconning
The median family income in Pinconning is $82,642, with families comprising 2 earners (51) having the highest median family income of $107,813, while families with no earners (60) have the lowest median family income of $34,500, accounting for 13.1% and 15.4% of families, respectively.
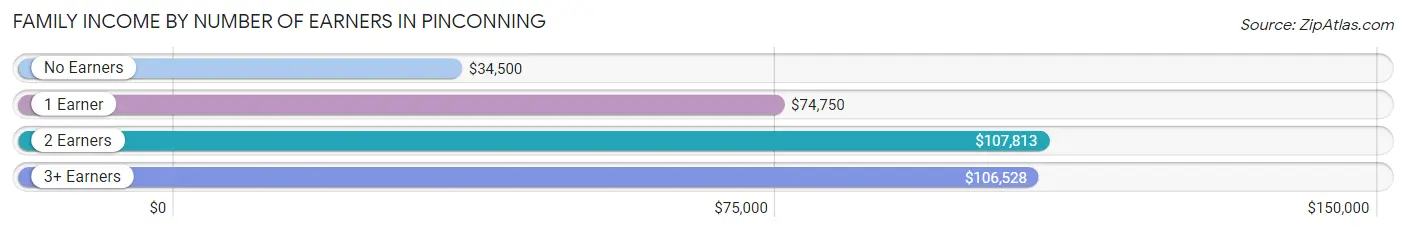
| Number of Earners | # Families | Median Income |
| No Earners | 60 (15.4%) | $34,500 |
| 1 Earner | 248 (63.6%) | $74,750 |
| 2 Earners | 51 (13.1%) | $107,813 |
| 3+ Earners | 31 (8.0%) | $106,528 |
| Total | 390 (100.0%) | $82,642 |
Household Income in Pinconning
Household Income Brackets in Pinconning
With 157 households falling in the category, the $75,000 to $99,999 income range is the most frequent in Pinconning, accounting for 26.8% of all households. In contrast, only 14 households (2.4%) fall into the $200,000+ income bracket, making it the least populous group.
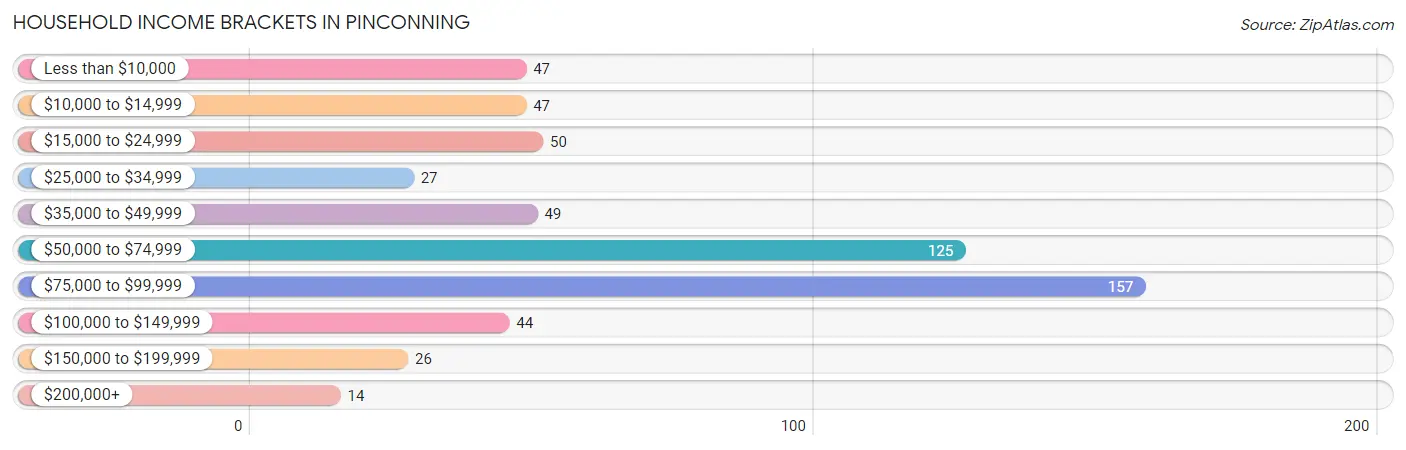
| Income Bracket | # Households | % Households |
| Less than $10,000 | 47 | 8.0% |
| $10,000 to $14,999 | 47 | 8.0% |
| $15,000 to $24,999 | 50 | 8.5% |
| $25,000 to $34,999 | 27 | 4.6% |
| $35,000 to $49,999 | 49 | 8.4% |
| $50,000 to $74,999 | 125 | 21.3% |
| $75,000 to $99,999 | 157 | 26.8% |
| $100,000 to $149,999 | 44 | 7.5% |
| $150,000 to $199,999 | 26 | 4.4% |
| $200,000+ | 14 | 2.4% |
Household Income by Householder Age in Pinconning
The median household income in Pinconning is $68,438, with the highest median household income of $74,038 found in the 45 to 64 years age bracket for the primary householder. A total of 154 households (26.3%) fall into this category. Meanwhile, the 15 to 24 years age bracket for the primary householder has the lowest median household income of $0, with 9 households (1.5%) in this group.
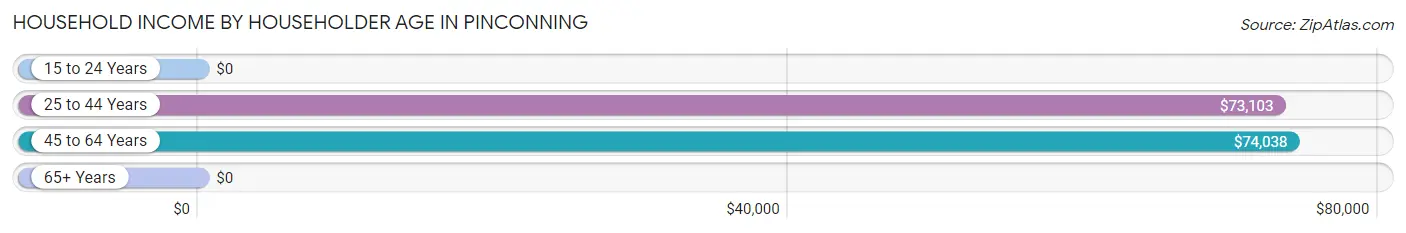
| Income Bracket | # Households | Median Income |
| 15 to 24 Years | 9 (1.5%) | $0 |
| 25 to 44 Years | 182 (31.1%) | $73,103 |
| 45 to 64 Years | 154 (26.3%) | $74,038 |
| 65+ Years | 241 (41.1%) | $0 |
| Total | 586 (100.0%) | $68,438 |
Poverty in Pinconning
Income Below Poverty by Sex and Age in Pinconning
With 9.9% poverty level for males and 20.7% for females among the residents of Pinconning, 12 to 14 year old males and 18 to 24 year old females are the most vulnerable to poverty, with 7 males (29.2%) and 11 females (57.9%) in their respective age groups living below the poverty level.
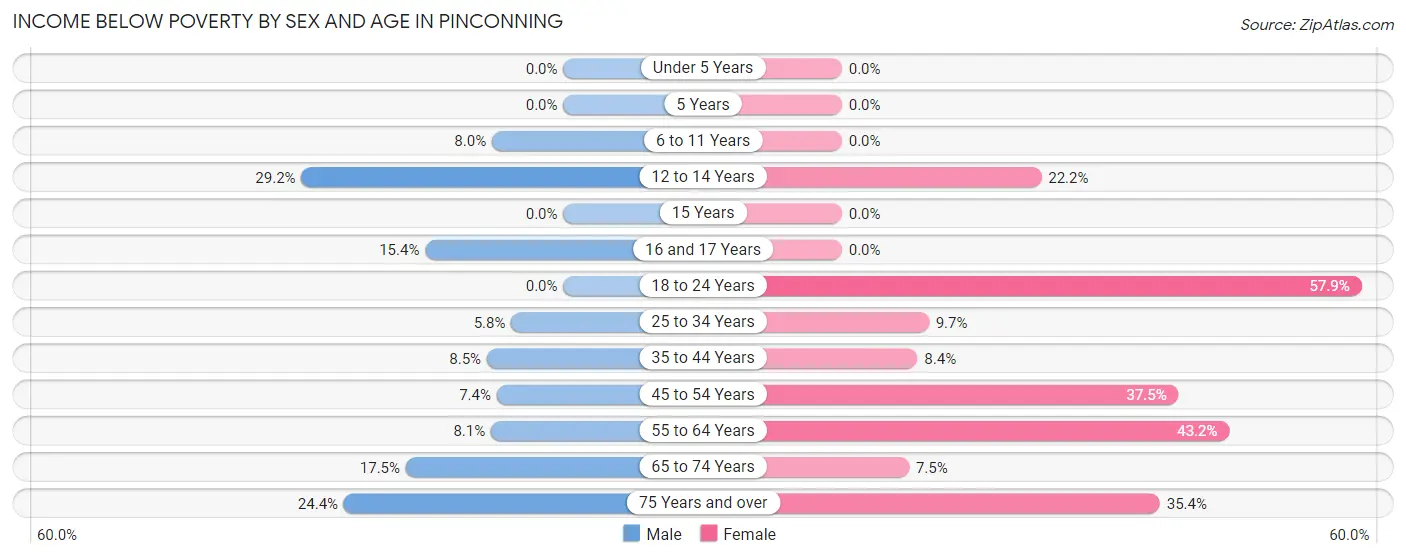
| Age Bracket | Male | Female |
| Under 5 Years | 0 (0.0%) | 0 (0.0%) |
| 5 Years | 0 (0.0%) | 0 (0.0%) |
| 6 to 11 Years | 7 (8.0%) | 0 (0.0%) |
| 12 to 14 Years | 7 (29.2%) | 4 (22.2%) |
| 15 Years | 0 (0.0%) | 0 (0.0%) |
| 16 and 17 Years | 6 (15.4%) | 0 (0.0%) |
| 18 to 24 Years | 0 (0.0%) | 11 (57.9%) |
| 25 to 34 Years | 4 (5.8%) | 3 (9.7%) |
| 35 to 44 Years | 8 (8.5%) | 8 (8.4%) |
| 45 to 54 Years | 4 (7.4%) | 15 (37.5%) |
| 55 to 64 Years | 14 (8.1%) | 63 (43.1%) |
| 65 to 74 Years | 10 (17.5%) | 11 (7.5%) |
| 75 Years and over | 11 (24.4%) | 17 (35.4%) |
| Total | 71 (9.9%) | 132 (20.7%) |
Income Above Poverty by Sex and Age in Pinconning
According to the poverty statistics in Pinconning, males aged under 5 years and females aged under 5 years are the age groups that are most secure financially, with 100.0% of males and 100.0% of females in these age groups living above the poverty line.
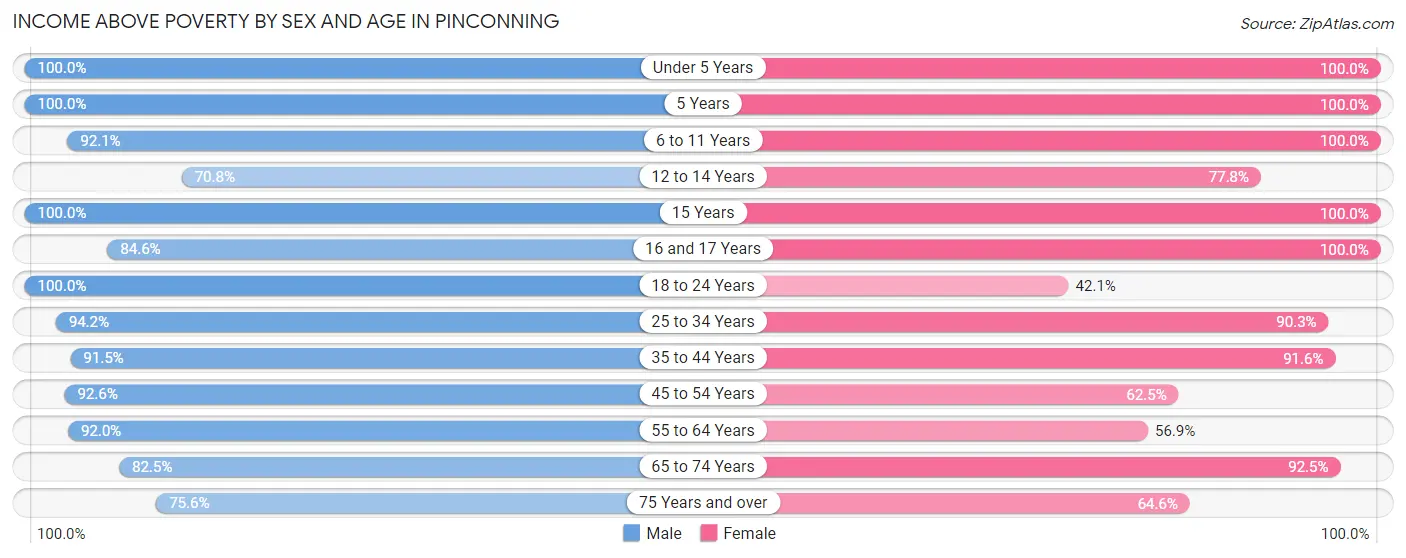
| Age Bracket | Male | Female |
| Under 5 Years | 2 (100.0%) | 21 (100.0%) |
| 5 Years | 3 (100.0%) | 3 (100.0%) |
| 6 to 11 Years | 81 (92.0%) | 10 (100.0%) |
| 12 to 14 Years | 17 (70.8%) | 14 (77.8%) |
| 15 Years | 33 (100.0%) | 7 (100.0%) |
| 16 and 17 Years | 33 (84.6%) | 51 (100.0%) |
| 18 to 24 Years | 36 (100.0%) | 8 (42.1%) |
| 25 to 34 Years | 65 (94.2%) | 28 (90.3%) |
| 35 to 44 Years | 86 (91.5%) | 87 (91.6%) |
| 45 to 54 Years | 50 (92.6%) | 25 (62.5%) |
| 55 to 64 Years | 160 (91.9%) | 83 (56.9%) |
| 65 to 74 Years | 47 (82.5%) | 136 (92.5%) |
| 75 Years and over | 34 (75.6%) | 31 (64.6%) |
| Total | 647 (90.1%) | 504 (79.2%) |
Income Below Poverty Among Married-Couple Families in Pinconning
The poverty statistics for married-couple families in Pinconning show that 1.2% or 3 of the total 248 families live below the poverty line. Families with no children have the highest poverty rate of 1.5%, comprising of 3 families. On the other hand, families with 1 or 2 children have the lowest poverty rate of 0.0%, which includes 0 families.
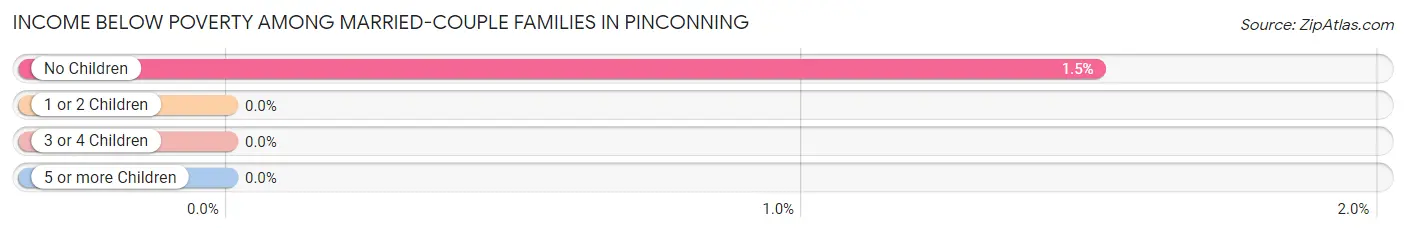
| Children | Above Poverty | Below Poverty |
| No Children | 196 (98.5%) | 3 (1.5%) |
| 1 or 2 Children | 49 (100.0%) | 0 (0.0%) |
| 3 or 4 Children | 0 (0.0%) | 0 (0.0%) |
| 5 or more Children | 0 (0.0%) | 0 (0.0%) |
| Total | 245 (98.8%) | 3 (1.2%) |
Income Below Poverty Among Single-Parent Households in Pinconning
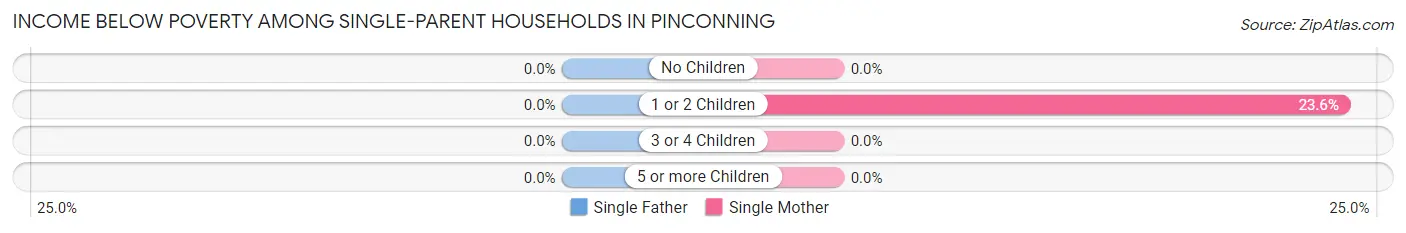
| Children | Single Father | Single Mother |
| No Children | 0 (0.0%) | 0 (0.0%) |
| 1 or 2 Children | 0 (0.0%) | 17 (23.6%) |
| 3 or 4 Children | 0 (0.0%) | 0 (0.0%) |
| 5 or more Children | 0 (0.0%) | 0 (0.0%) |
| Total | 0 (0.0%) | 17 (21.2%) |
Income Below Poverty Among Married-Couple vs Single-Parent Households in Pinconning
The poverty data for Pinconning shows that 3 of the married-couple family households (1.2%) and 17 of the single-parent households (12.0%) are living below the poverty level. Within the married-couple family households, those with no children have the highest poverty rate, with 3 households (1.5%) falling below the poverty line. Among the single-parent households, those with 1 or 2 children have the highest poverty rate, with 17 household (14.9%) living below poverty.
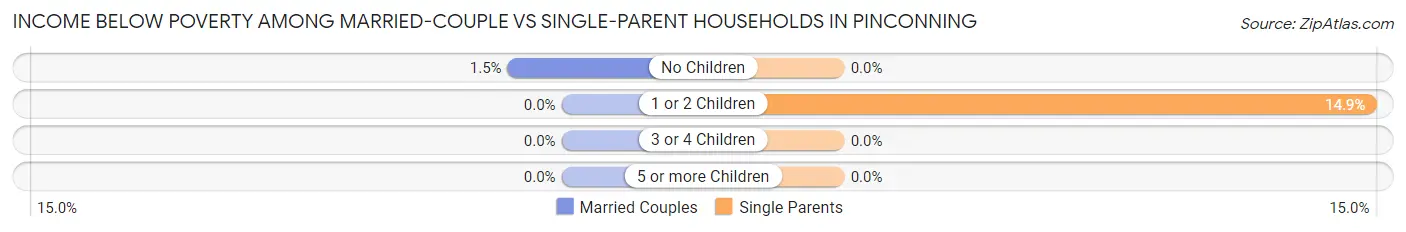
| Children | Married-Couple Families | Single-Parent Households |
| No Children | 3 (1.5%) | 0 (0.0%) |
| 1 or 2 Children | 0 (0.0%) | 17 (14.9%) |
| 3 or 4 Children | 0 (0.0%) | 0 (0.0%) |
| 5 or more Children | 0 (0.0%) | 0 (0.0%) |
| Total | 3 (1.2%) | 17 (12.0%) |
Race in Pinconning
The most populous races in Pinconning are White / Caucasian (1,258 | 92.9%), Two or more Races (79 | 5.8%), and Hispanic or Latino (32 | 2.4%).
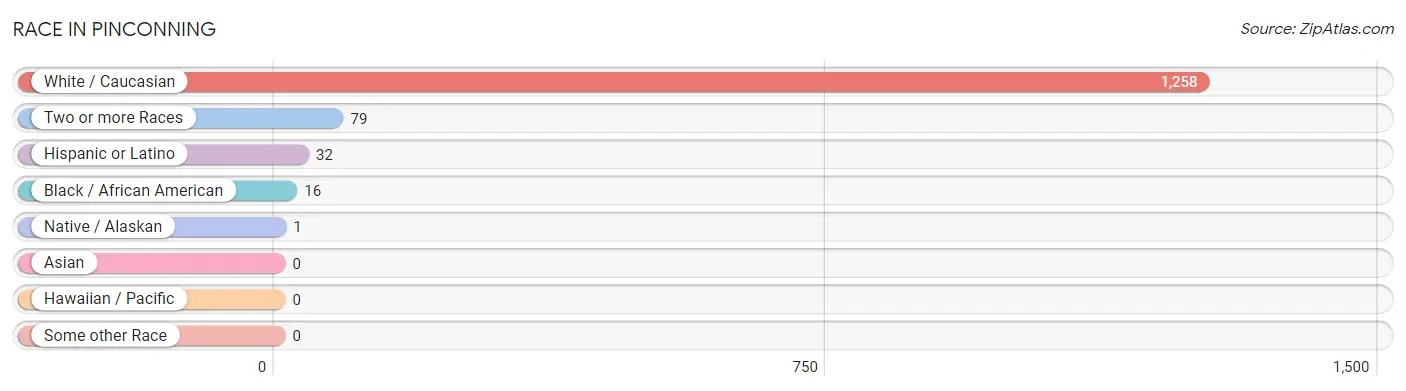
| Race | # Population | % Population |
| Asian | 0 | 0.0% |
| Black / African American | 16 | 1.2% |
| Hawaiian / Pacific | 0 | 0.0% |
| Hispanic or Latino | 32 | 2.4% |
| Native / Alaskan | 1 | 0.1% |
| White / Caucasian | 1,258 | 92.9% |
| Two or more Races | 79 | 5.8% |
| Some other Race | 0 | 0.0% |
| Total | 1,354 | 100.0% |
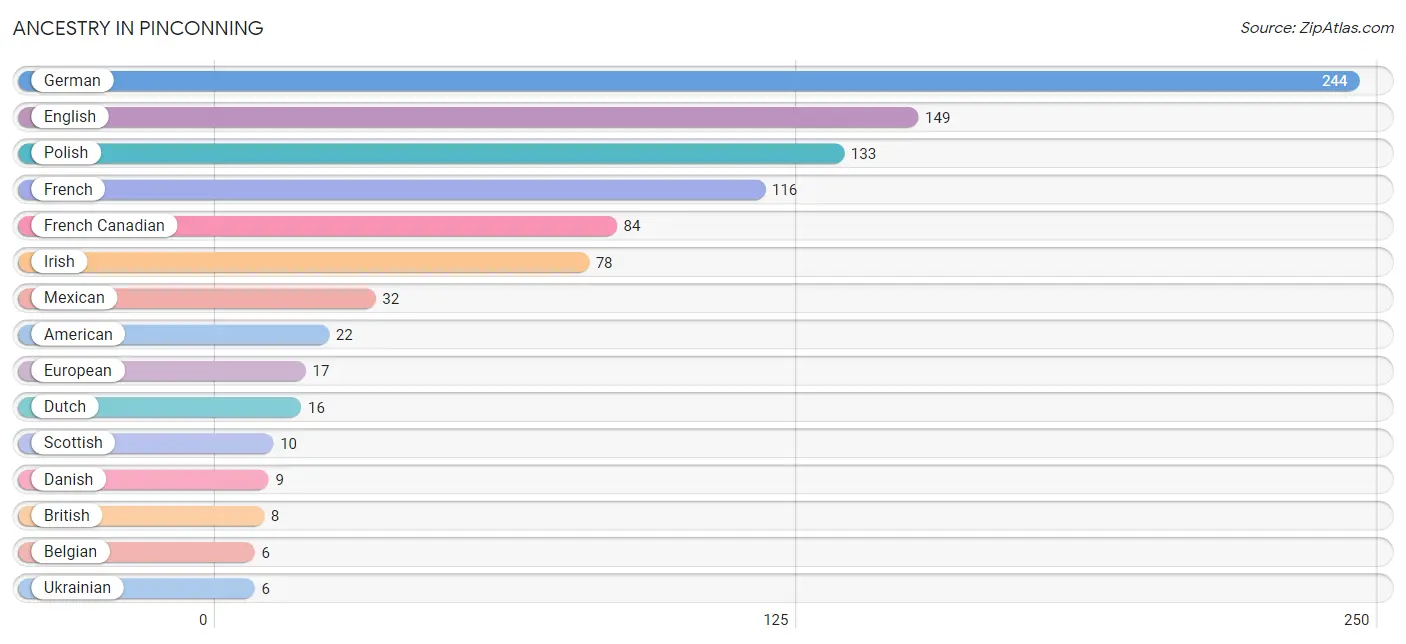
Ancestry in Pinconning
The most populous ancestries reported in Pinconning are German (244 | 18.0%), English (149 | 11.0%), Polish (133 | 9.8%), French (116 | 8.6%), and French Canadian (84 | 6.2%), together accounting for 53.6% of all Pinconning residents.
| Ancestry | # Population | % Population |
| American | 22 | 1.6% |
| Arab | 3 | 0.2% |
| Belgian | 6 | 0.4% |
| British | 8 | 0.6% |
| Cherokee | 5 | 0.4% |
| Chippewa | 1 | 0.1% |
| Danish | 9 | 0.7% |
| Dutch | 16 | 1.2% |
| English | 149 | 11.0% |
| European | 17 | 1.3% |
| French | 116 | 8.6% |
| French Canadian | 84 | 6.2% |
| German | 244 | 18.0% |
| Irish | 78 | 5.8% |
| Italian | 3 | 0.2% |
| Lebanese | 3 | 0.2% |
| Mexican | 32 | 2.4% |
| Norwegian | 3 | 0.2% |
| Polish | 133 | 9.8% |
| Scotch-Irish | 4 | 0.3% |
| Scottish | 10 | 0.7% |
| Swedish | 4 | 0.3% |
| Ukrainian | 6 | 0.4% | View All 23 Rows |
Immigrants in Pinconning

| Immigration Origin | # Population | % Population | View All 0 Rows |
Sex and Age in Pinconning
Sex and Age in Pinconning
The most populous age groups in Pinconning are 60 to 64 Years (152 | 21.2%) for men and 65 to 69 Years (118 | 18.5%) for women.
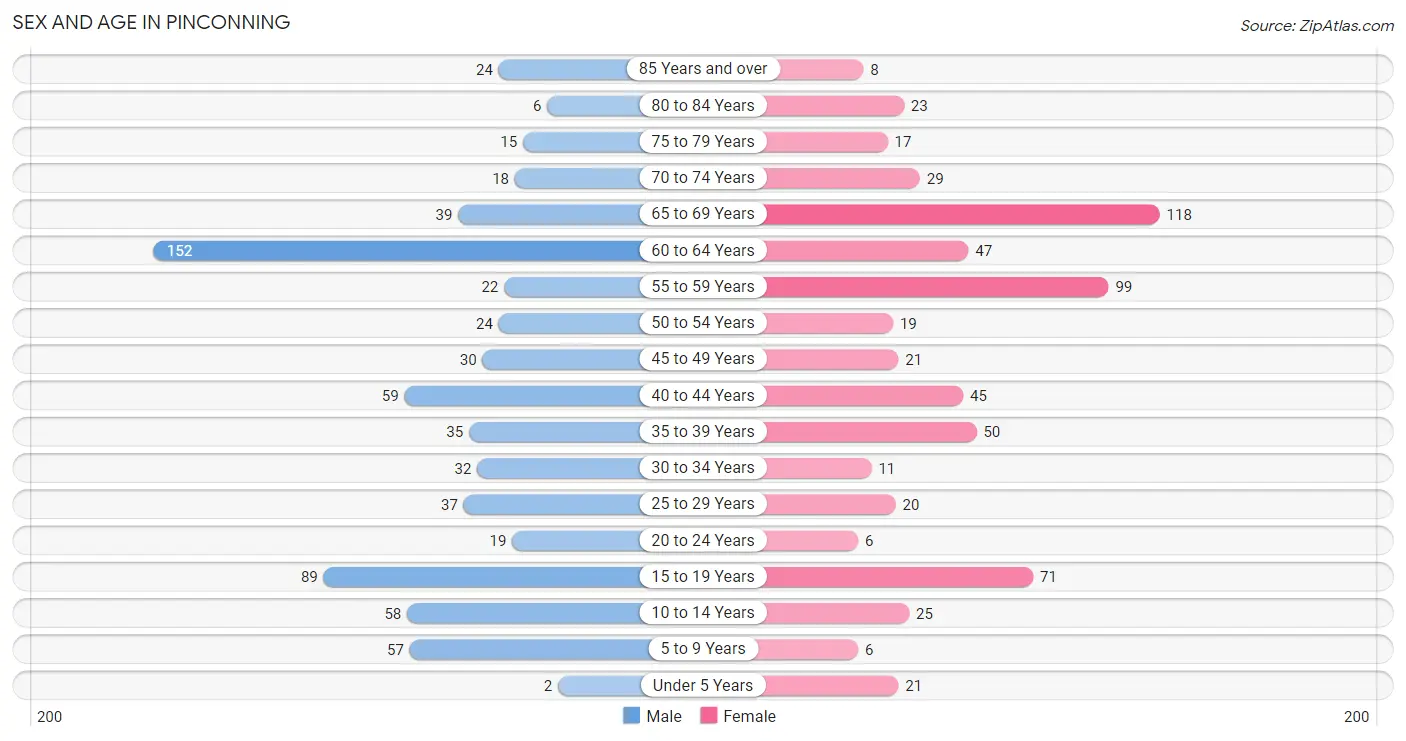
| Age Bracket | Male | Female |
| Under 5 Years | 2 (0.3%) | 21 (3.3%) |
| 5 to 9 Years | 57 (7.9%) | 6 (0.9%) |
| 10 to 14 Years | 58 (8.1%) | 25 (3.9%) |
| 15 to 19 Years | 89 (12.4%) | 71 (11.2%) |
| 20 to 24 Years | 19 (2.6%) | 6 (0.9%) |
| 25 to 29 Years | 37 (5.1%) | 20 (3.1%) |
| 30 to 34 Years | 32 (4.5%) | 11 (1.7%) |
| 35 to 39 Years | 35 (4.9%) | 50 (7.9%) |
| 40 to 44 Years | 59 (8.2%) | 45 (7.1%) |
| 45 to 49 Years | 30 (4.2%) | 21 (3.3%) |
| 50 to 54 Years | 24 (3.3%) | 19 (3.0%) |
| 55 to 59 Years | 22 (3.1%) | 99 (15.6%) |
| 60 to 64 Years | 152 (21.2%) | 47 (7.4%) |
| 65 to 69 Years | 39 (5.4%) | 118 (18.5%) |
| 70 to 74 Years | 18 (2.5%) | 29 (4.6%) |
| 75 to 79 Years | 15 (2.1%) | 17 (2.7%) |
| 80 to 84 Years | 6 (0.8%) | 23 (3.6%) |
| 85 Years and over | 24 (3.3%) | 8 (1.3%) |
| Total | 718 (100.0%) | 636 (100.0%) |
Families and Households in Pinconning
Median Family Size in Pinconning
The median family size in Pinconning is 2.71 persons per family, with single female/mother families (80 | 20.5%) accounting for the largest median family size of 3.3 persons per family. On the other hand, married-couple families (248 | 63.6%) represent the smallest median family size with 2.50 persons per family.
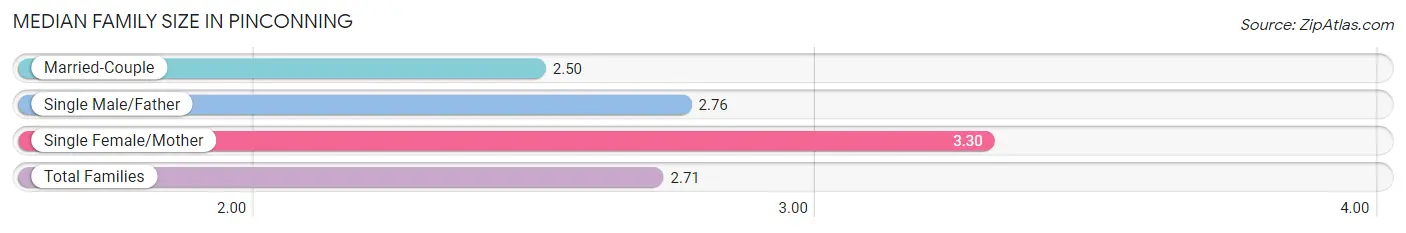
| Family Type | # Families | Family Size |
| Married-Couple | 248 (63.6%) | 2.50 |
| Single Male/Father | 62 (15.9%) | 2.76 |
| Single Female/Mother | 80 (20.5%) | 3.30 |
| Total Families | 390 (100.0%) | 2.71 |
Median Household Size in Pinconning
The median household size in Pinconning is 2.30 persons per household, with single male/father households (62 | 10.6%) accounting for the largest median household size of 3.73 persons per household. non-family households (196 | 33.5%) represent the smallest median household size with 1.07 persons per household.
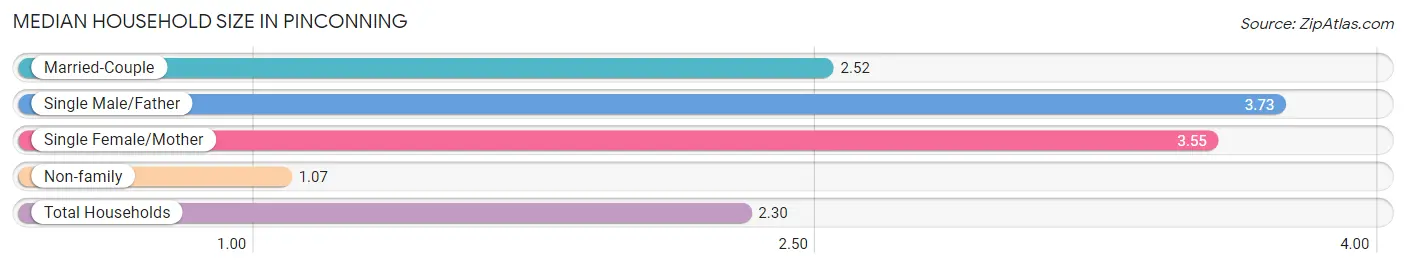
| Household Type | # Households | Household Size |
| Married-Couple | 248 (42.3%) | 2.52 |
| Single Male/Father | 62 (10.6%) | 3.73 |
| Single Female/Mother | 80 (13.7%) | 3.55 |
| Non-family | 196 (33.5%) | 1.07 |
| Total Households | 586 (100.0%) | 2.30 |
Household Size by Marriage Status in Pinconning
Out of a total of 586 households in Pinconning, 390 (66.5%) are family households, while 196 (33.5%) are nonfamily households. The most numerous type of family households are 2-person households, comprising 207, and the most common type of nonfamily households are 1-person households, comprising 185.
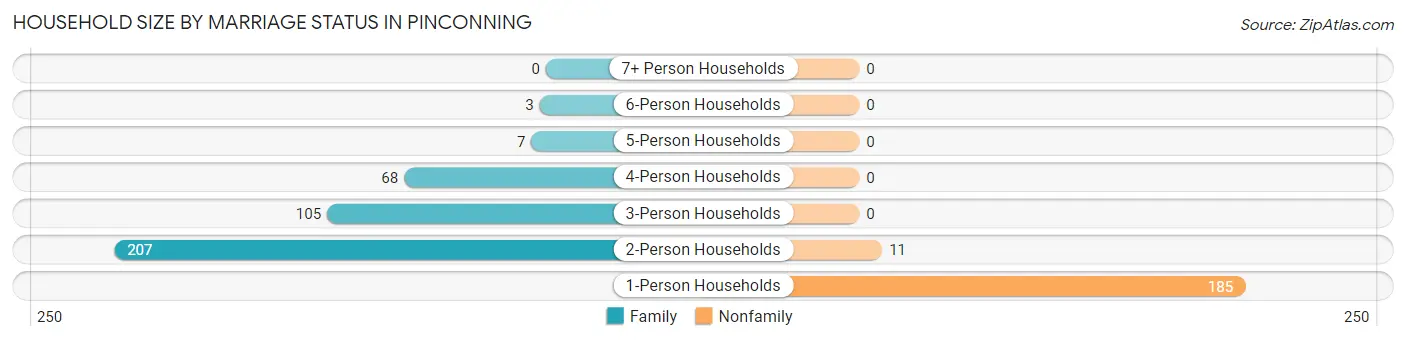
| Household Size | Family Households | Nonfamily Households |
| 1-Person Households | - | 185 (31.6%) |
| 2-Person Households | 207 (35.3%) | 11 (1.9%) |
| 3-Person Households | 105 (17.9%) | 0 (0.0%) |
| 4-Person Households | 68 (11.6%) | 0 (0.0%) |
| 5-Person Households | 7 (1.2%) | 0 (0.0%) |
| 6-Person Households | 3 (0.5%) | 0 (0.0%) |
| 7+ Person Households | 0 (0.0%) | 0 (0.0%) |
| Total | 390 (66.5%) | 196 (33.5%) |
Female Fertility in Pinconning
Fertility by Age in Pinconning
Average fertility rate in Pinconning is 30.0 births per 1,000 women. Women in the age bracket of 20 to 34 years have the highest fertility rate with 81.0 births per 1,000 women. Women in the age bracket of 35 to 50 years acount for 57.1% of all women with births.
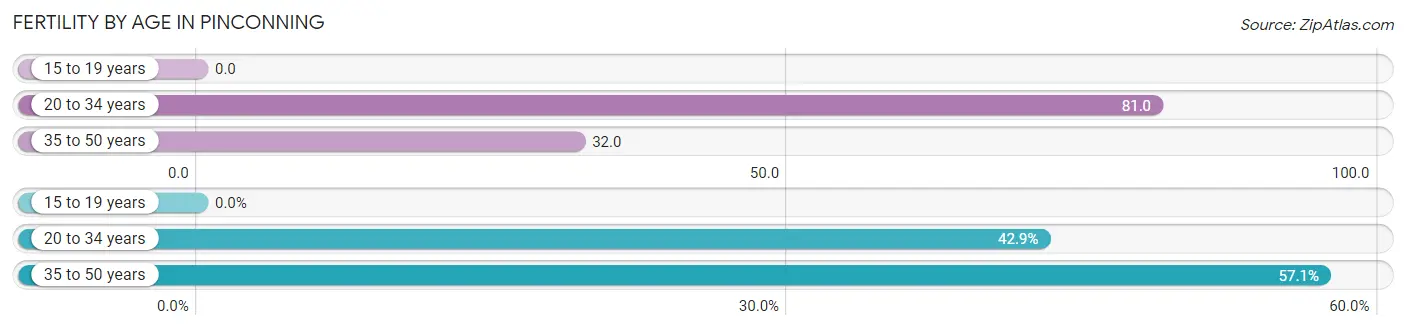
| Age Bracket | Women with Births | Births / 1,000 Women |
| 15 to 19 years | 0 (0.0%) | 0.0 |
| 20 to 34 years | 3 (42.9%) | 81.0 |
| 35 to 50 years | 4 (57.1%) | 32.0 |
| Total | 7 (100.0%) | 30.0 |
Fertility by Age by Marriage Status in Pinconning
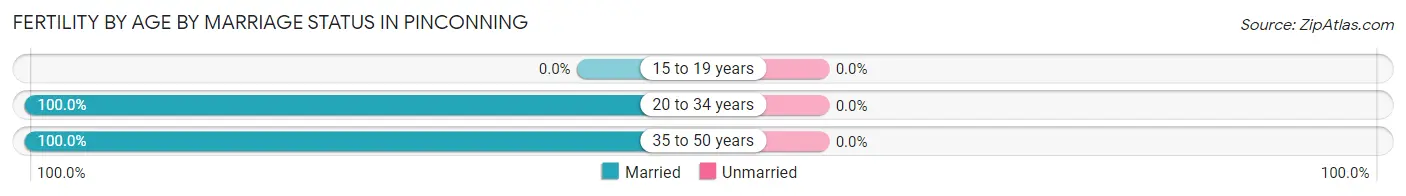
| Age Bracket | Married | Unmarried |
| 15 to 19 years | 0 (0.0%) | 0 (0.0%) |
| 20 to 34 years | 3 (100.0%) | 0 (0.0%) |
| 35 to 50 years | 4 (100.0%) | 0 (0.0%) |
| Total | 7 (100.0%) | 0 (0.0%) |
Fertility by Education in Pinconning
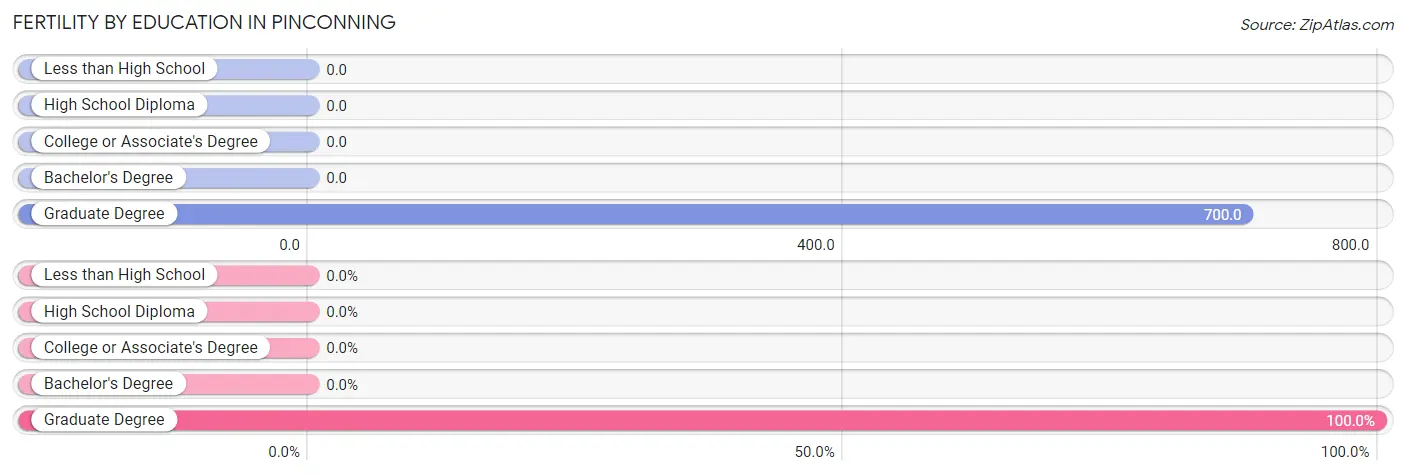
| Educational Attainment | Women with Births | Births / 1,000 Women |
| Less than High School | 0 (0.0%) | 0.0 |
| High School Diploma | 0 (0.0%) | 0.0 |
| College or Associate's Degree | 0 (0.0%) | 0.0 |
| Bachelor's Degree | 0 (0.0%) | 0.0 |
| Graduate Degree | 7 (100.0%) | 700.0 |
| Total | 7 (100.0%) | 30.0 |
Fertility by Education by Marriage Status in Pinconning
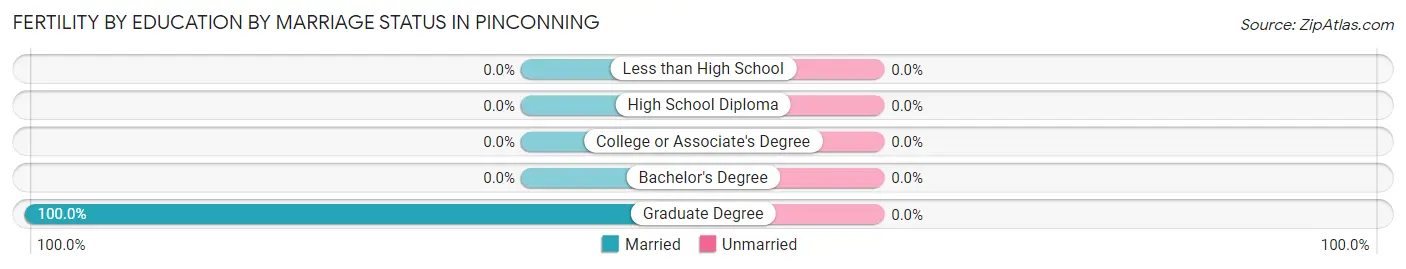
| Educational Attainment | Married | Unmarried |
| Less than High School | 0 (0.0%) | 0 (0.0%) |
| High School Diploma | 0 (0.0%) | 0 (0.0%) |
| College or Associate's Degree | 0 (0.0%) | 0 (0.0%) |
| Bachelor's Degree | 0 (0.0%) | 0 (0.0%) |
| Graduate Degree | 7 (100.0%) | 0 (0.0%) |
| Total | 7 (100.0%) | 0 (0.0%) |
Employment Characteristics in Pinconning
Employment by Class of Employer in Pinconning
Among the 447 employed individuals in Pinconning, private company employees (367 | 82.1%), not-for-profit organizations (35 | 7.8%), and self-employed (incorporated) (13 | 2.9%) make up the most common classes of employment.
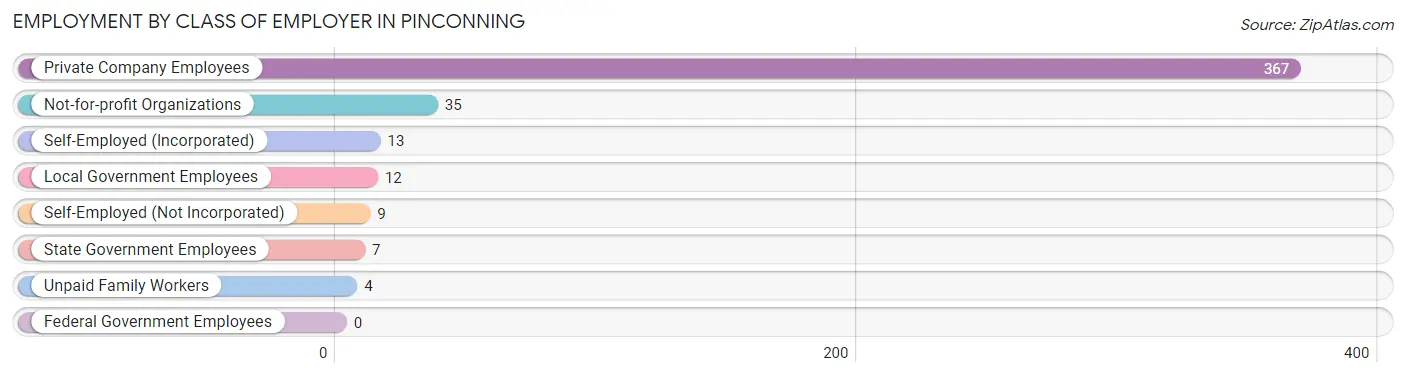
| Employer Class | # Employees | % Employees |
| Private Company Employees | 367 | 82.1% |
| Self-Employed (Incorporated) | 13 | 2.9% |
| Self-Employed (Not Incorporated) | 9 | 2.0% |
| Not-for-profit Organizations | 35 | 7.8% |
| Local Government Employees | 12 | 2.7% |
| State Government Employees | 7 | 1.6% |
| Federal Government Employees | 0 | 0.0% |
| Unpaid Family Workers | 4 | 0.9% |
| Total | 447 | 100.0% |
Employment Status by Age in Pinconning
According to the labor force statistics for Pinconning, out of the total population over 16 years of age (1,145), 41.8% or 479 individuals are in the labor force, with 4.4% or 21 of them unemployed. The age group with the highest labor force participation rate is 30 to 34 years, with 100.0% or 43 individuals in the labor force. Within the labor force, the 16 to 19 years age range has the highest percentage of unemployed individuals, with 26.7% or 4 of them being unemployed.
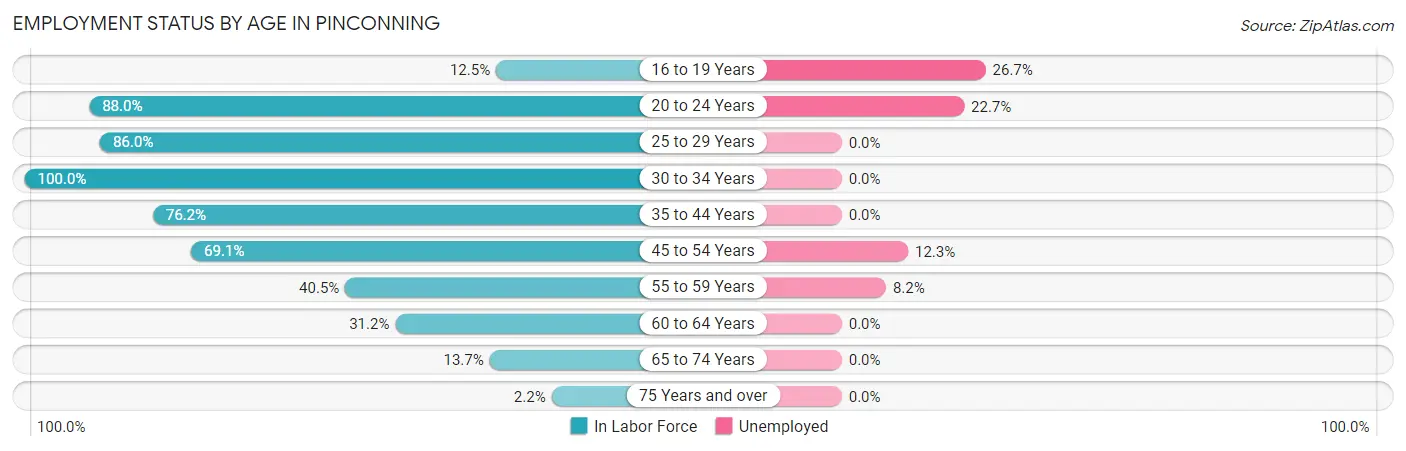
| Age Bracket | In Labor Force | Unemployed |
| 16 to 19 Years | 15 (12.5%) | 4 (26.7%) |
| 20 to 24 Years | 22 (88.0%) | 5 (22.7%) |
| 25 to 29 Years | 49 (86.0%) | 0 (0.0%) |
| 30 to 34 Years | 43 (100.0%) | 0 (0.0%) |
| 35 to 44 Years | 144 (76.2%) | 0 (0.0%) |
| 45 to 54 Years | 65 (69.1%) | 8 (12.3%) |
| 55 to 59 Years | 49 (40.5%) | 4 (8.2%) |
| 60 to 64 Years | 62 (31.2%) | 0 (0.0%) |
| 65 to 74 Years | 28 (13.7%) | 0 (0.0%) |
| 75 Years and over | 2 (2.2%) | 0 (0.0%) |
| Total | 479 (41.8%) | 21 (4.4%) |
Employment Status by Educational Attainment in Pinconning
According to labor force statistics for Pinconning, 58.6% of individuals (412) out of the total population between 25 and 64 years of age (703) are in the labor force, with 2.9% or 12 of them being unemployed. The group with the highest labor force participation rate are those with the educational attainment of college / associate degree, with 81.0% or 141 individuals in the labor force. Within the labor force, individuals with less than high school education have the highest percentage of unemployment, with 15.7% or 8 of them being unemployed.
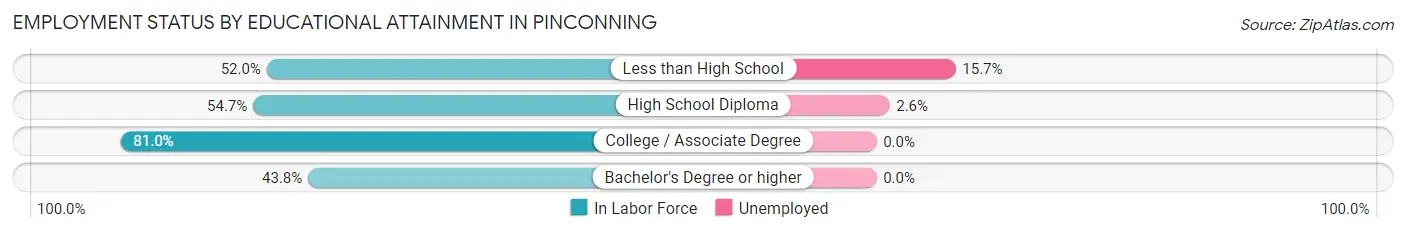
| Educational Attainment | In Labor Force | Unemployed |
| Less than High School | 51 (52.0%) | 15 (15.7%) |
| High School Diploma | 156 (54.7%) | 7 (2.6%) |
| College / Associate Degree | 141 (81.0%) | 0 (0.0%) |
| Bachelor's Degree or higher | 64 (43.8%) | 0 (0.0%) |
| Total | 412 (58.6%) | 20 (2.9%) |
Employment Occupations by Sex in Pinconning
Management, Business, Science and Arts Occupations
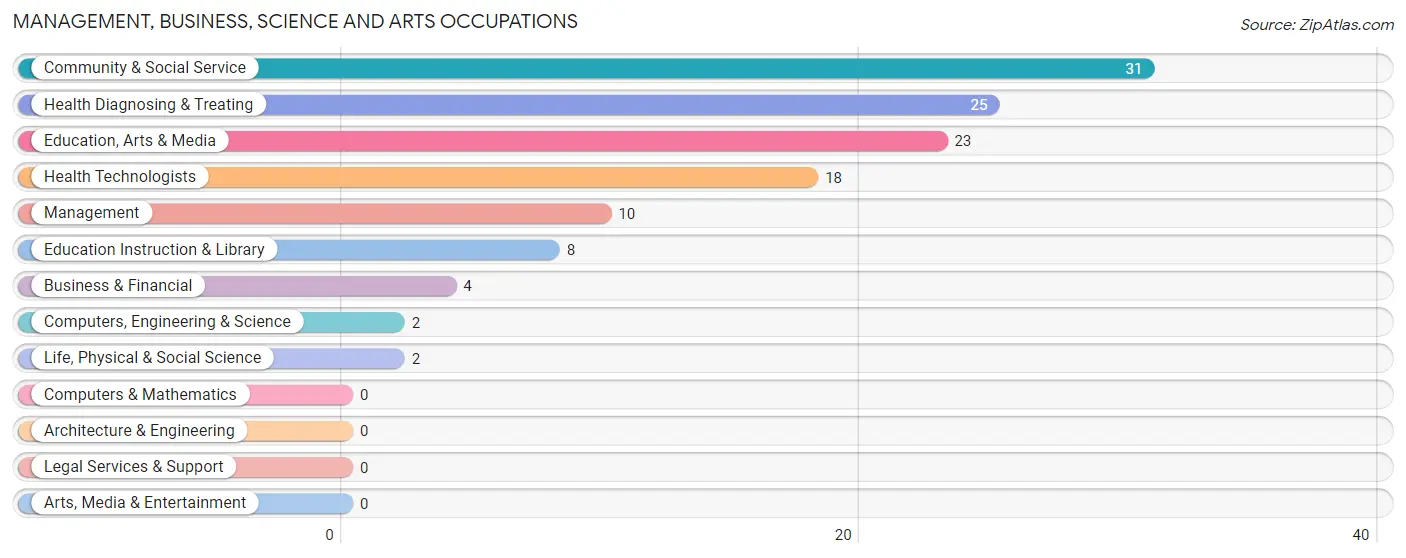
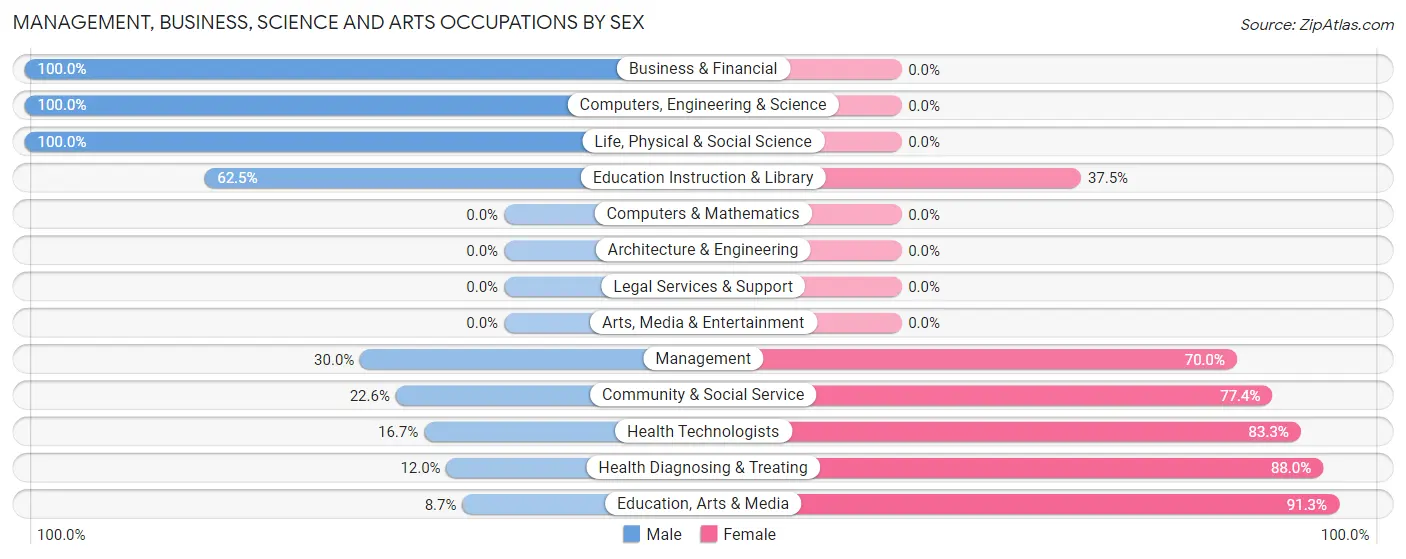
The most common Management, Business, Science and Arts occupations in Pinconning are Community & Social Service (31 | 6.8%), Health Diagnosing & Treating (25 | 5.5%), Education, Arts & Media (23 | 5.0%), Health Technologists (18 | 3.9%), and Management (10 | 2.2%).
Management, Business, Science and Arts Occupations by Sex
Within the Management, Business, Science and Arts occupations in Pinconning, the most male-oriented occupations are Business & Financial (100.0%), Computers, Engineering & Science (100.0%), and Life, Physical & Social Science (100.0%), while the most female-oriented occupations are Education, Arts & Media (91.3%), Health Diagnosing & Treating (88.0%), and Health Technologists (83.3%).
| Occupation | Male | Female |
| Management | 3 (30.0%) | 7 (70.0%) |
| Business & Financial | 4 (100.0%) | 0 (0.0%) |
| Computers, Engineering & Science | 2 (100.0%) | 0 (0.0%) |
| Computers & Mathematics | 0 (0.0%) | 0 (0.0%) |
| Architecture & Engineering | 0 (0.0%) | 0 (0.0%) |
| Life, Physical & Social Science | 2 (100.0%) | 0 (0.0%) |
| Community & Social Service | 7 (22.6%) | 24 (77.4%) |
| Education, Arts & Media | 2 (8.7%) | 21 (91.3%) |
| Legal Services & Support | 0 (0.0%) | 0 (0.0%) |
| Education Instruction & Library | 5 (62.5%) | 3 (37.5%) |
| Arts, Media & Entertainment | 0 (0.0%) | 0 (0.0%) |
| Health Diagnosing & Treating | 3 (12.0%) | 22 (88.0%) |
| Health Technologists | 3 (16.7%) | 15 (83.3%) |
| Total (Category) | 19 (26.4%) | 53 (73.6%) |
| Total (Overall) | 282 (61.6%) | 176 (38.4%) |
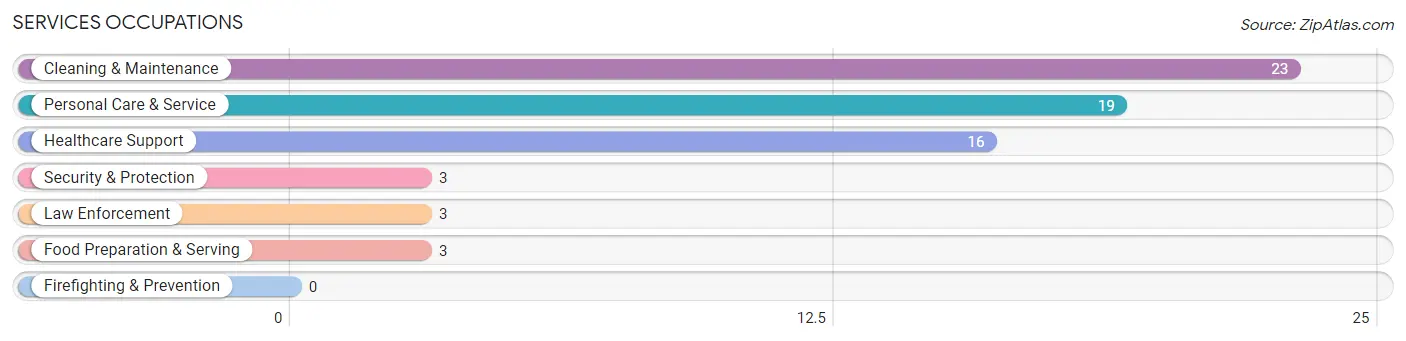
Services Occupations
The most common Services occupations in Pinconning are Cleaning & Maintenance (23 | 5.0%), Personal Care & Service (19 | 4.2%), Healthcare Support (16 | 3.5%), Security & Protection (3 | 0.7%), and Law Enforcement (3 | 0.7%).
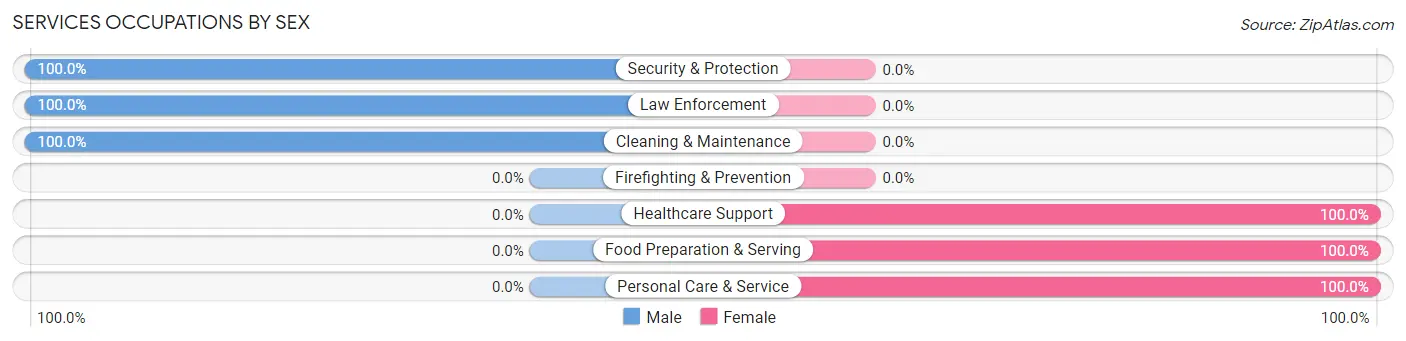
Services Occupations by Sex
Within the Services occupations in Pinconning, the most male-oriented occupations are Security & Protection (100.0%), Law Enforcement (100.0%), and Cleaning & Maintenance (100.0%), while the most female-oriented occupations are Healthcare Support (100.0%), Food Preparation & Serving (100.0%), and Personal Care & Service (100.0%).
| Occupation | Male | Female |
| Healthcare Support | 0 (0.0%) | 16 (100.0%) |
| Security & Protection | 3 (100.0%) | 0 (0.0%) |
| Firefighting & Prevention | 0 (0.0%) | 0 (0.0%) |
| Law Enforcement | 3 (100.0%) | 0 (0.0%) |
| Food Preparation & Serving | 0 (0.0%) | 3 (100.0%) |
| Cleaning & Maintenance | 23 (100.0%) | 0 (0.0%) |
| Personal Care & Service | 0 (0.0%) | 19 (100.0%) |
| Total (Category) | 26 (40.6%) | 38 (59.4%) |
| Total (Overall) | 282 (61.6%) | 176 (38.4%) |
Sales and Office Occupations
The most common Sales and Office occupations in Pinconning are Office & Administration (64 | 14.0%), and Sales & Related (37 | 8.1%).

Sales and Office Occupations by Sex

| Occupation | Male | Female |
| Sales & Related | 30 (81.1%) | 7 (18.9%) |
| Office & Administration | 7 (10.9%) | 57 (89.1%) |
| Total (Category) | 37 (36.6%) | 64 (63.4%) |
| Total (Overall) | 282 (61.6%) | 176 (38.4%) |
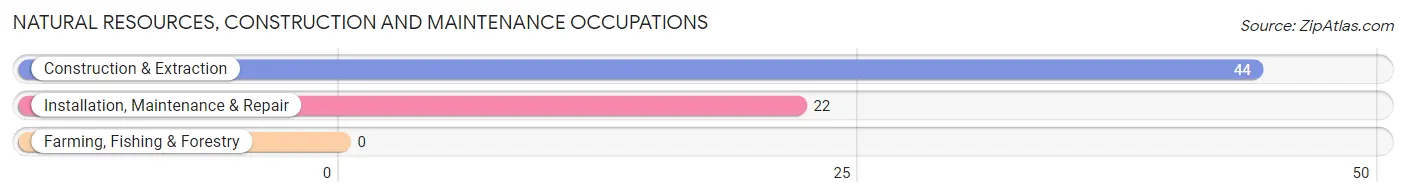
Natural Resources, Construction and Maintenance Occupations
The most common Natural Resources, Construction and Maintenance occupations in Pinconning are Construction & Extraction (44 | 9.6%), and Installation, Maintenance & Repair (22 | 4.8%).
Natural Resources, Construction and Maintenance Occupations by Sex

| Occupation | Male | Female |
| Farming, Fishing & Forestry | 0 (0.0%) | 0 (0.0%) |
| Construction & Extraction | 44 (100.0%) | 0 (0.0%) |
| Installation, Maintenance & Repair | 22 (100.0%) | 0 (0.0%) |
| Total (Category) | 66 (100.0%) | 0 (0.0%) |
| Total (Overall) | 282 (61.6%) | 176 (38.4%) |
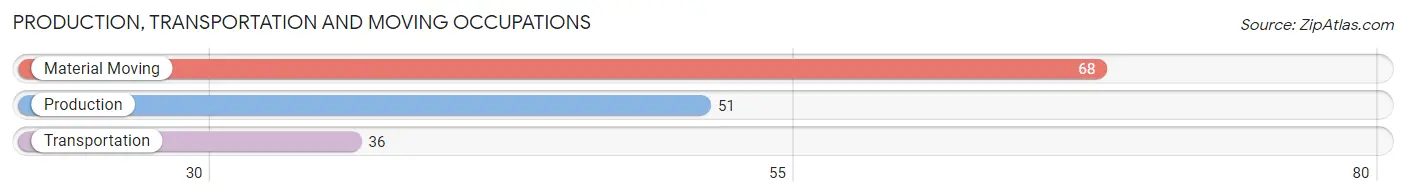
Production, Transportation and Moving Occupations
The most common Production, Transportation and Moving occupations in Pinconning are Material Moving (68 | 14.8%), Production (51 | 11.1%), and Transportation (36 | 7.9%).
Production, Transportation and Moving Occupations by Sex
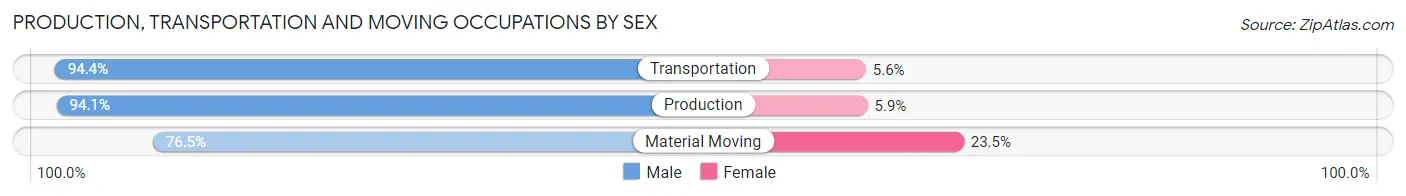
| Occupation | Male | Female |
| Production | 48 (94.1%) | 3 (5.9%) |
| Transportation | 34 (94.4%) | 2 (5.6%) |
| Material Moving | 52 (76.5%) | 16 (23.5%) |
| Total (Category) | 134 (86.5%) | 21 (13.6%) |
| Total (Overall) | 282 (61.6%) | 176 (38.4%) |
Employment Industries by Sex in Pinconning
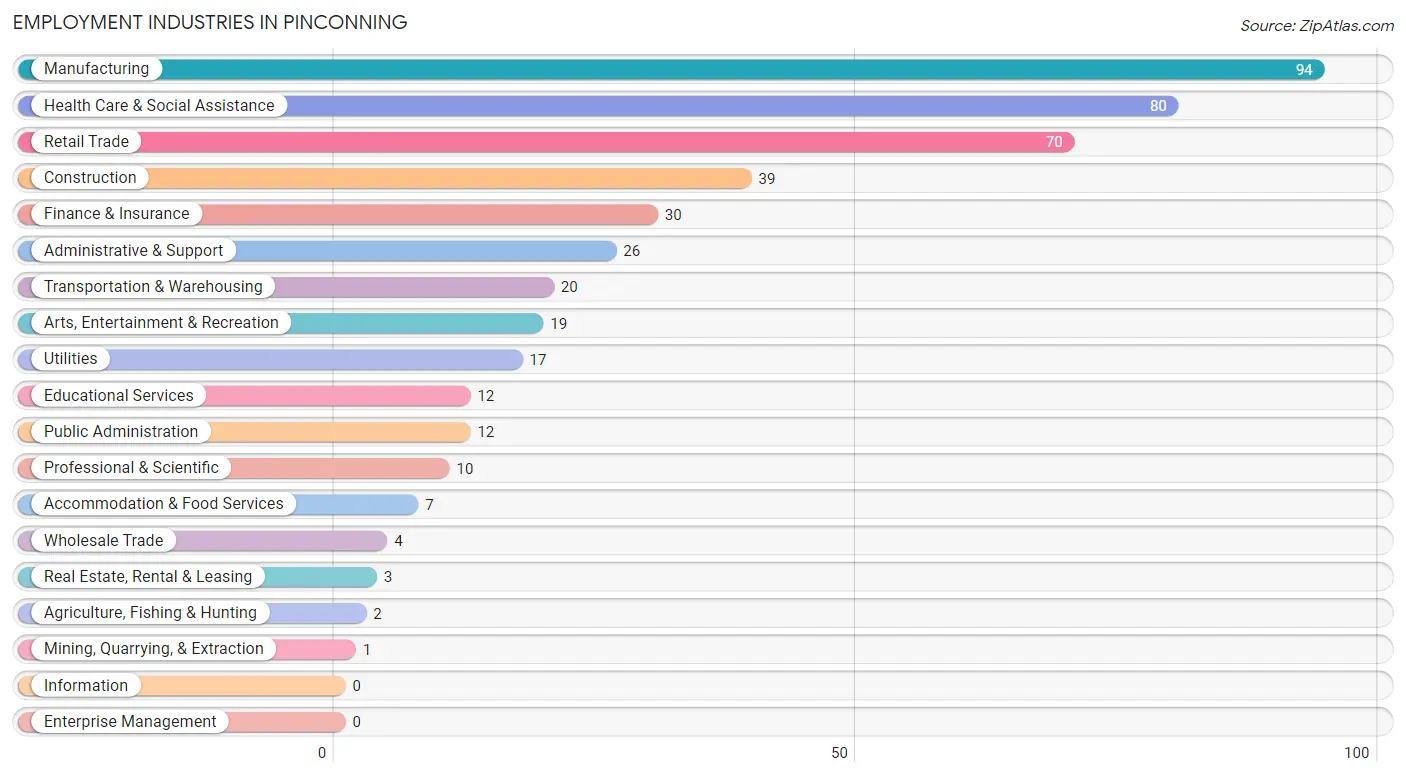
Employment Industries in Pinconning
The major employment industries in Pinconning include Manufacturing (94 | 20.5%), Health Care & Social Assistance (80 | 17.5%), Retail Trade (70 | 15.3%), Construction (39 | 8.5%), and Finance & Insurance (30 | 6.6%).
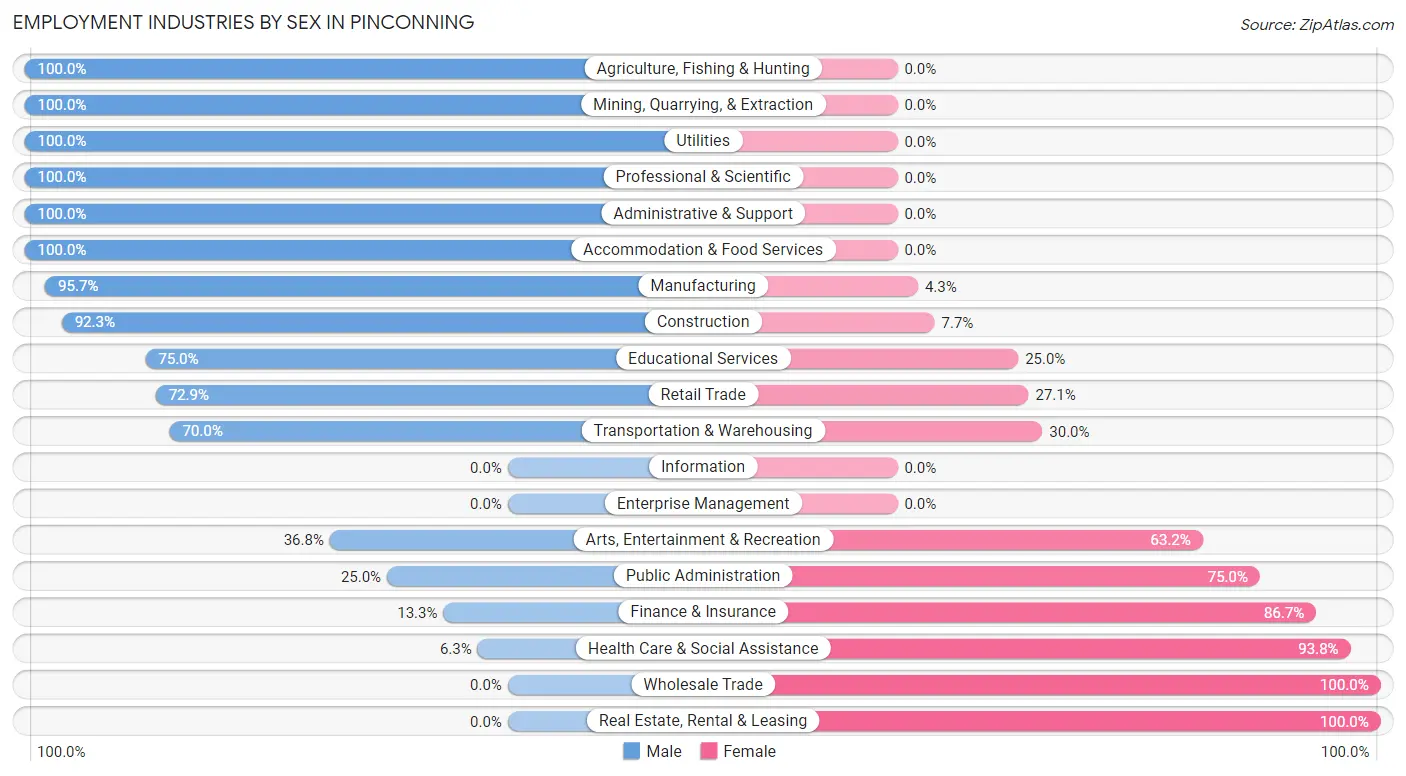
Employment Industries by Sex in Pinconning
The Pinconning industries that see more men than women are Agriculture, Fishing & Hunting (100.0%), Mining, Quarrying, & Extraction (100.0%), and Utilities (100.0%), whereas the industries that tend to have a higher number of women are Wholesale Trade (100.0%), Real Estate, Rental & Leasing (100.0%), and Health Care & Social Assistance (93.8%).
| Industry | Male | Female |
| Agriculture, Fishing & Hunting | 2 (100.0%) | 0 (0.0%) |
| Mining, Quarrying, & Extraction | 1 (100.0%) | 0 (0.0%) |
| Construction | 36 (92.3%) | 3 (7.7%) |
| Manufacturing | 90 (95.7%) | 4 (4.3%) |
| Wholesale Trade | 0 (0.0%) | 4 (100.0%) |
| Retail Trade | 51 (72.9%) | 19 (27.1%) |
| Transportation & Warehousing | 14 (70.0%) | 6 (30.0%) |
| Utilities | 17 (100.0%) | 0 (0.0%) |
| Information | 0 (0.0%) | 0 (0.0%) |
| Finance & Insurance | 4 (13.3%) | 26 (86.7%) |
| Real Estate, Rental & Leasing | 0 (0.0%) | 3 (100.0%) |
| Professional & Scientific | 10 (100.0%) | 0 (0.0%) |
| Enterprise Management | 0 (0.0%) | 0 (0.0%) |
| Administrative & Support | 26 (100.0%) | 0 (0.0%) |
| Educational Services | 9 (75.0%) | 3 (25.0%) |
| Health Care & Social Assistance | 5 (6.2%) | 75 (93.8%) |
| Arts, Entertainment & Recreation | 7 (36.8%) | 12 (63.2%) |
| Accommodation & Food Services | 7 (100.0%) | 0 (0.0%) |
| Public Administration | 3 (25.0%) | 9 (75.0%) |
| Total | 282 (61.6%) | 176 (38.4%) |
Education in Pinconning
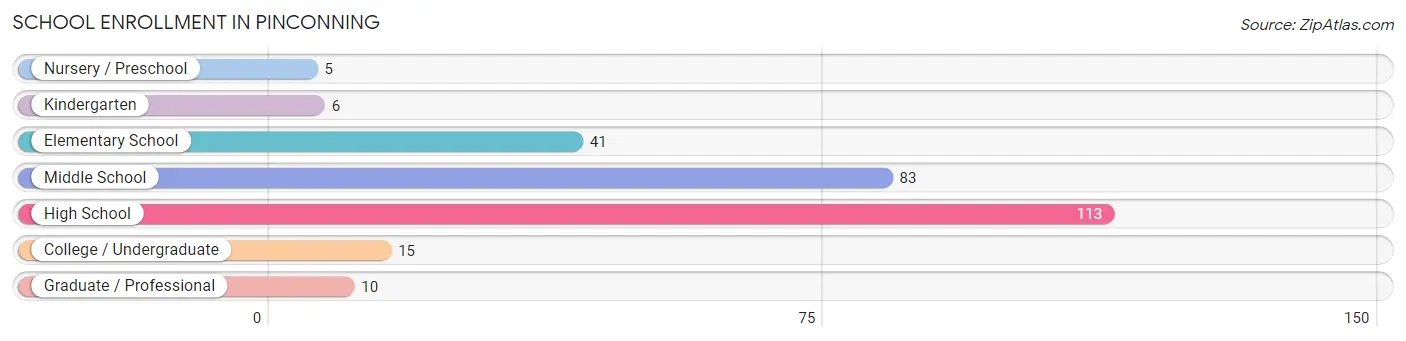
School Enrollment in Pinconning
The most common levels of schooling among the 273 students in Pinconning are high school (113 | 41.4%), middle school (83 | 30.4%), and elementary school (41 | 15.0%).
| School Level | # Students | % Students |
| Nursery / Preschool | 5 | 1.8% |
| Kindergarten | 6 | 2.2% |
| Elementary School | 41 | 15.0% |
| Middle School | 83 | 30.4% |
| High School | 113 | 41.4% |
| College / Undergraduate | 15 | 5.5% |
| Graduate / Professional | 10 | 3.7% |
| Total | 273 | 100.0% |
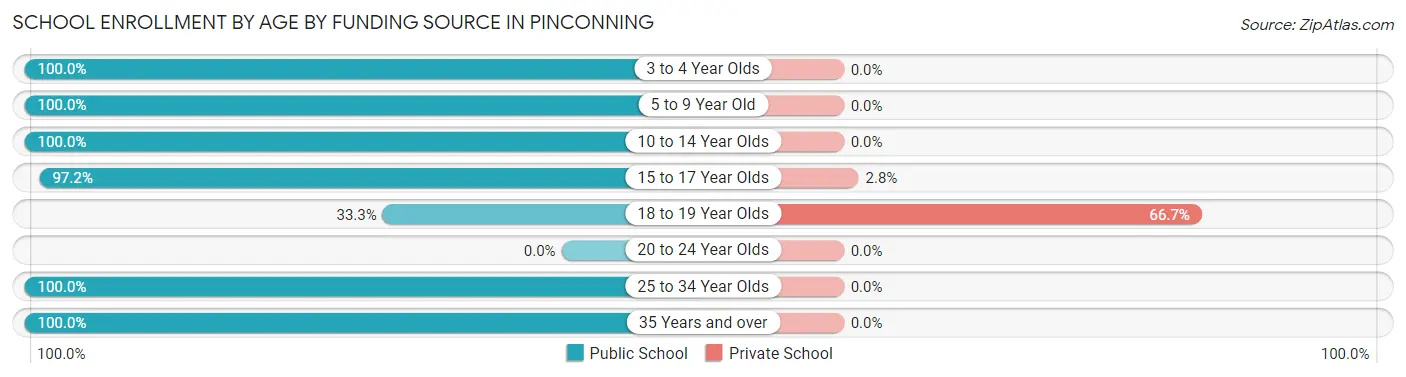
School Enrollment by Age by Funding Source in Pinconning
Out of a total of 273 students who are enrolled in schools in Pinconning, 15 (5.5%) attend a private institution, while the remaining 258 (94.5%) are enrolled in public schools. The age group of 18 to 19 year olds has the highest likelihood of being enrolled in private schools, with 12 (66.7% in the age bracket) enrolled. Conversely, the age group of 3 to 4 year olds has the lowest likelihood of being enrolled in a private school, with 5 (100.0% in the age bracket) attending a public institution.
| Age Bracket | Public School | Private School |
| 3 to 4 Year Olds | 5 (100.0%) | 0 (0.0%) |
| 5 to 9 Year Old | 36 (100.0%) | 0 (0.0%) |
| 10 to 14 Year Olds | 83 (100.0%) | 0 (0.0%) |
| 15 to 17 Year Olds | 105 (97.2%) | 3 (2.8%) |
| 18 to 19 Year Olds | 6 (33.3%) | 12 (66.7%) |
| 20 to 24 Year Olds | 0 (0.0%) | 0 (0.0%) |
| 25 to 34 Year Olds | 8 (100.0%) | 0 (0.0%) |
| 35 Years and over | 15 (100.0%) | 0 (0.0%) |
| Total | 258 (94.5%) | 15 (5.5%) |
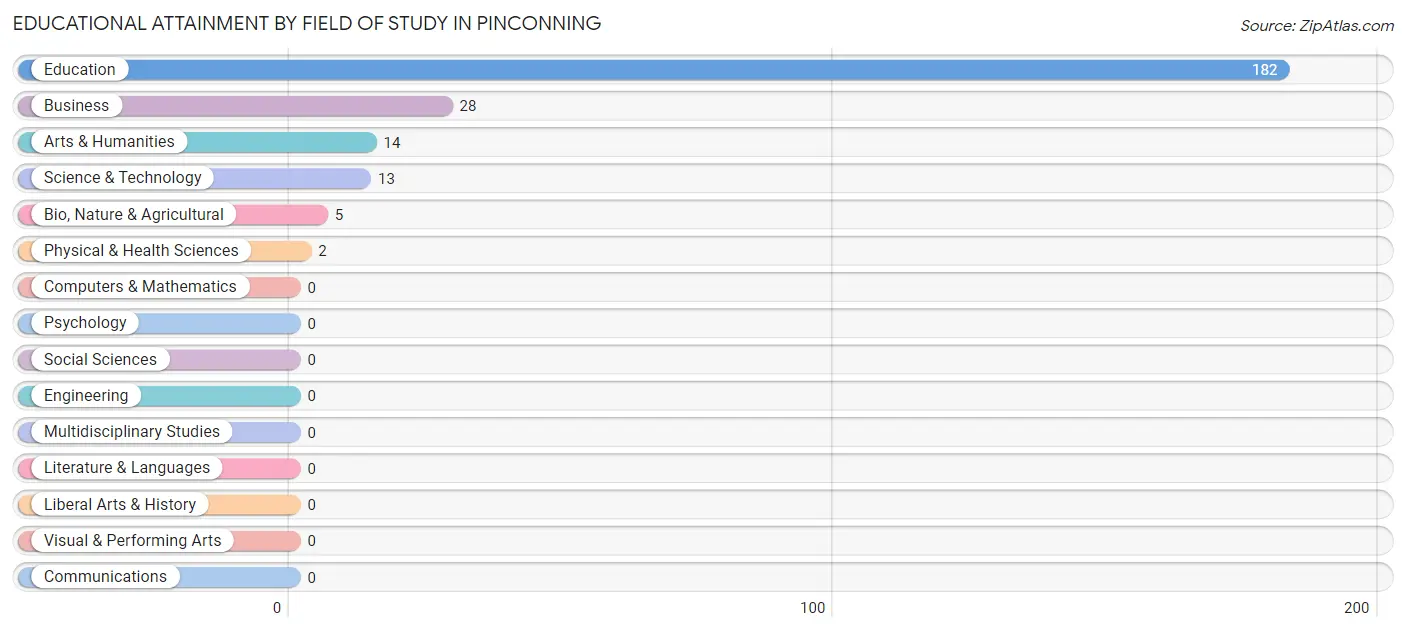
Educational Attainment by Field of Study in Pinconning
Education (182 | 74.6%), business (28 | 11.5%), arts & humanities (14 | 5.7%), science & technology (13 | 5.3%), and bio, nature & agricultural (5 | 2.1%) are the most common fields of study among 244 individuals in Pinconning who have obtained a bachelor's degree or higher.
| Field of Study | # Graduates | % Graduates |
| Computers & Mathematics | 0 | 0.0% |
| Bio, Nature & Agricultural | 5 | 2.1% |
| Physical & Health Sciences | 2 | 0.8% |
| Psychology | 0 | 0.0% |
| Social Sciences | 0 | 0.0% |
| Engineering | 0 | 0.0% |
| Multidisciplinary Studies | 0 | 0.0% |
| Science & Technology | 13 | 5.3% |
| Business | 28 | 11.5% |
| Education | 182 | 74.6% |
| Literature & Languages | 0 | 0.0% |
| Liberal Arts & History | 0 | 0.0% |
| Visual & Performing Arts | 0 | 0.0% |
| Communications | 0 | 0.0% |
| Arts & Humanities | 14 | 5.7% |
| Total | 244 | 100.0% |
Transportation & Commute in Pinconning
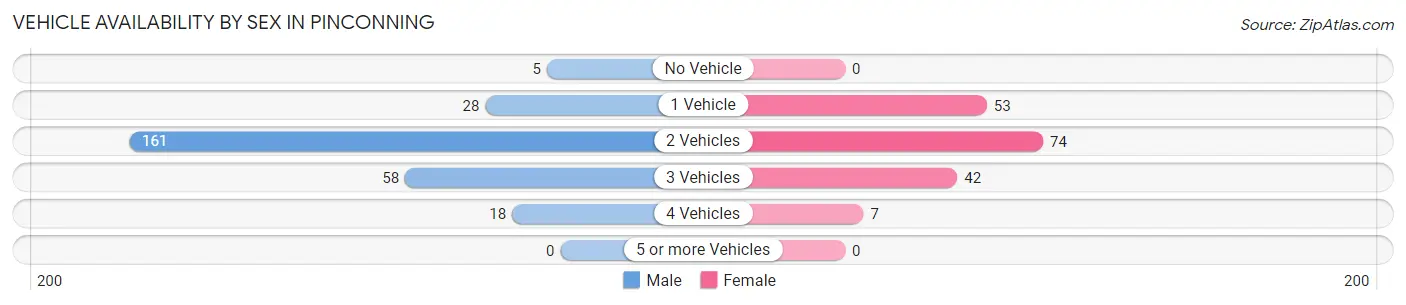
Vehicle Availability by Sex in Pinconning
The most prevalent vehicle ownership categories in Pinconning are males with 2 vehicles (161, accounting for 59.6%) and females with 2 vehicles (74, making up 91.5%).
| Vehicles Available | Male | Female |
| No Vehicle | 5 (1.8%) | 0 (0.0%) |
| 1 Vehicle | 28 (10.4%) | 53 (30.1%) |
| 2 Vehicles | 161 (59.6%) | 74 (42.0%) |
| 3 Vehicles | 58 (21.5%) | 42 (23.9%) |
| 4 Vehicles | 18 (6.7%) | 7 (4.0%) |
| 5 or more Vehicles | 0 (0.0%) | 0 (0.0%) |
| Total | 270 (100.0%) | 176 (100.0%) |
Commute Time in Pinconning
The most frequently occuring commute durations in Pinconning are 30 to 34 minutes (67 commuters, 17.4%), 40 to 44 minutes (55 commuters, 14.3%), and 15 to 19 minutes (44 commuters, 11.5%).
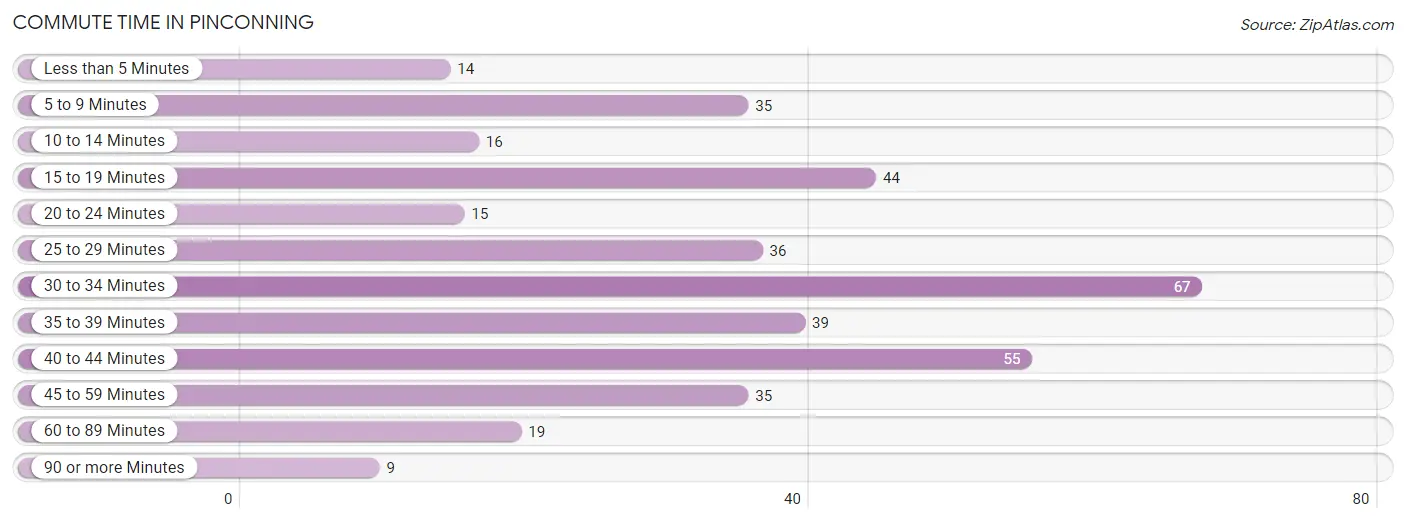
| Commute Time | # Commuters | % Commuters |
| Less than 5 Minutes | 14 | 3.6% |
| 5 to 9 Minutes | 35 | 9.1% |
| 10 to 14 Minutes | 16 | 4.2% |
| 15 to 19 Minutes | 44 | 11.5% |
| 20 to 24 Minutes | 15 | 3.9% |
| 25 to 29 Minutes | 36 | 9.4% |
| 30 to 34 Minutes | 67 | 17.4% |
| 35 to 39 Minutes | 39 | 10.2% |
| 40 to 44 Minutes | 55 | 14.3% |
| 45 to 59 Minutes | 35 | 9.1% |
| 60 to 89 Minutes | 19 | 5.0% |
| 90 or more Minutes | 9 | 2.3% |
Commute Time by Sex in Pinconning
The most common commute times in Pinconning are 15 to 19 minutes (36 commuters, 15.5%) for males and 30 to 34 minutes (38 commuters, 25.0%) for females.
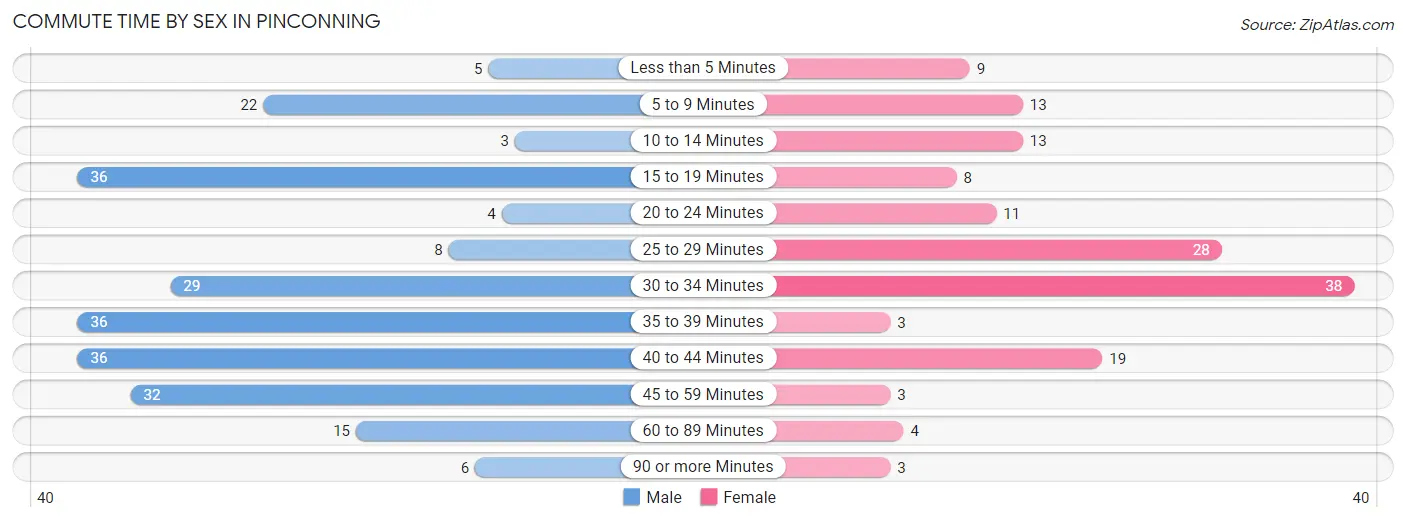
| Commute Time | Male | Female |
| Less than 5 Minutes | 5 (2.2%) | 9 (5.9%) |
| 5 to 9 Minutes | 22 (9.5%) | 13 (8.6%) |
| 10 to 14 Minutes | 3 (1.3%) | 13 (8.6%) |
| 15 to 19 Minutes | 36 (15.5%) | 8 (5.3%) |
| 20 to 24 Minutes | 4 (1.7%) | 11 (7.2%) |
| 25 to 29 Minutes | 8 (3.5%) | 28 (18.4%) |
| 30 to 34 Minutes | 29 (12.5%) | 38 (25.0%) |
| 35 to 39 Minutes | 36 (15.5%) | 3 (2.0%) |
| 40 to 44 Minutes | 36 (15.5%) | 19 (12.5%) |
| 45 to 59 Minutes | 32 (13.8%) | 3 (2.0%) |
| 60 to 89 Minutes | 15 (6.5%) | 4 (2.6%) |
| 90 or more Minutes | 6 (2.6%) | 3 (2.0%) |
Time of Departure to Work by Sex in Pinconning
The most frequent times of departure to work in Pinconning are 6:00 AM to 6:29 AM (69, 29.7%) for males and 7:00 AM to 7:29 AM (36, 23.7%) for females.
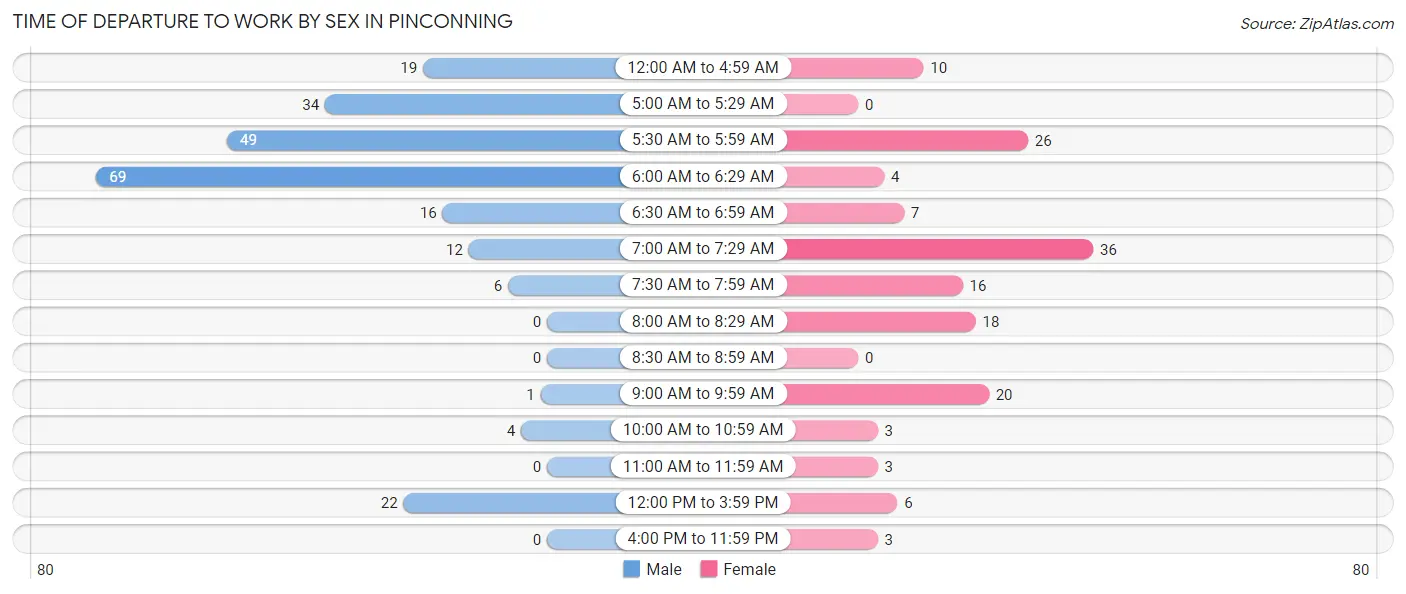
| Time of Departure | Male | Female |
| 12:00 AM to 4:59 AM | 19 (8.2%) | 10 (6.6%) |
| 5:00 AM to 5:29 AM | 34 (14.7%) | 0 (0.0%) |
| 5:30 AM to 5:59 AM | 49 (21.1%) | 26 (17.1%) |
| 6:00 AM to 6:29 AM | 69 (29.7%) | 4 (2.6%) |
| 6:30 AM to 6:59 AM | 16 (6.9%) | 7 (4.6%) |
| 7:00 AM to 7:29 AM | 12 (5.2%) | 36 (23.7%) |
| 7:30 AM to 7:59 AM | 6 (2.6%) | 16 (10.5%) |
| 8:00 AM to 8:29 AM | 0 (0.0%) | 18 (11.8%) |
| 8:30 AM to 8:59 AM | 0 (0.0%) | 0 (0.0%) |
| 9:00 AM to 9:59 AM | 1 (0.4%) | 20 (13.2%) |
| 10:00 AM to 10:59 AM | 4 (1.7%) | 3 (2.0%) |
| 11:00 AM to 11:59 AM | 0 (0.0%) | 3 (2.0%) |
| 12:00 PM to 3:59 PM | 22 (9.5%) | 6 (4.0%) |
| 4:00 PM to 11:59 PM | 0 (0.0%) | 3 (2.0%) |
| Total | 232 (100.0%) | 152 (100.0%) |
Housing Occupancy in Pinconning
Occupancy by Ownership in Pinconning
Of the total 586 dwellings in Pinconning, owner-occupied units account for 456 (77.8%), while renter-occupied units make up 130 (22.2%).
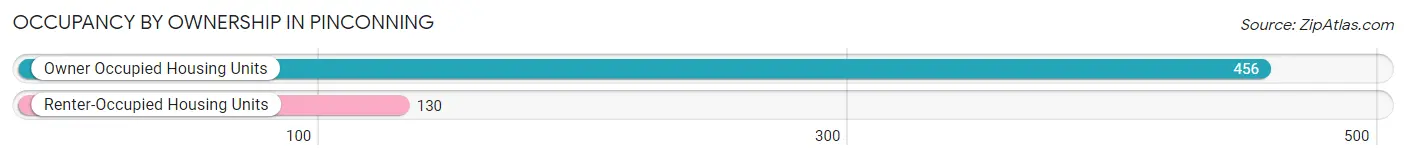
| Occupancy | # Housing Units | % Housing Units |
| Owner Occupied Housing Units | 456 | 77.8% |
| Renter-Occupied Housing Units | 130 | 22.2% |
| Total Occupied Housing Units | 586 | 100.0% |
Occupancy by Household Size in Pinconning
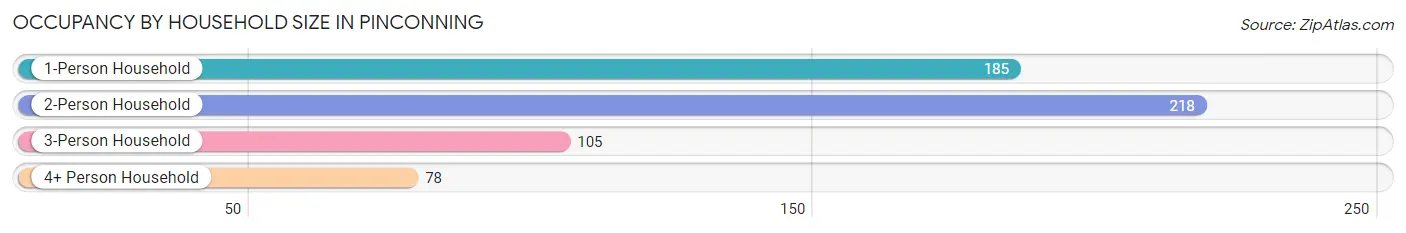
| Household Size | # Housing Units | % Housing Units |
| 1-Person Household | 185 | 31.6% |
| 2-Person Household | 218 | 37.2% |
| 3-Person Household | 105 | 17.9% |
| 4+ Person Household | 78 | 13.3% |
| Total Housing Units | 586 | 100.0% |
Occupancy by Ownership by Household Size in Pinconning
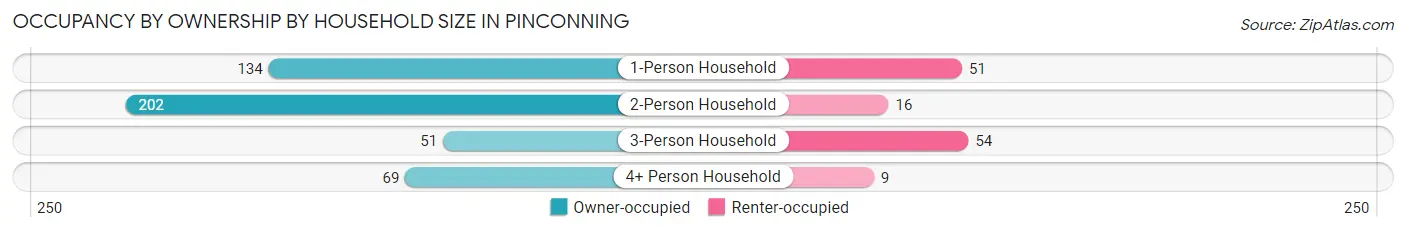
| Household Size | Owner-occupied | Renter-occupied |
| 1-Person Household | 134 (72.4%) | 51 (27.6%) |
| 2-Person Household | 202 (92.7%) | 16 (7.3%) |
| 3-Person Household | 51 (48.6%) | 54 (51.4%) |
| 4+ Person Household | 69 (88.5%) | 9 (11.5%) |
| Total Housing Units | 456 (77.8%) | 130 (22.2%) |
Occupancy by Educational Attainment in Pinconning
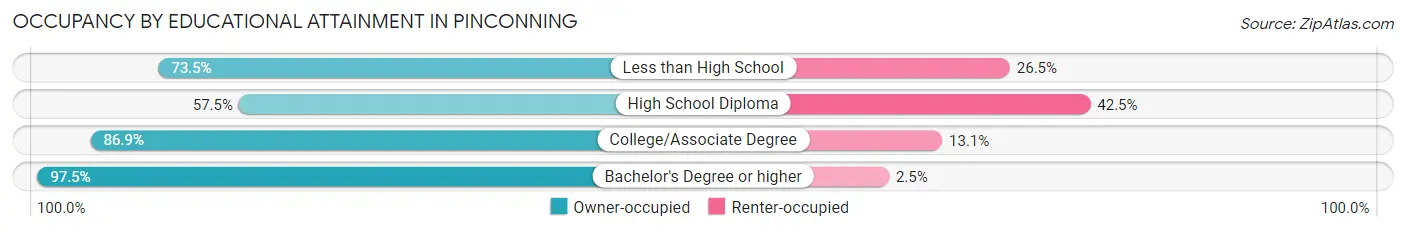
| Household Size | Owner-occupied | Renter-occupied |
| Less than High School | 61 (73.5%) | 22 (26.5%) |
| High School Diploma | 107 (57.5%) | 79 (42.5%) |
| College/Associate Degree | 173 (86.9%) | 26 (13.1%) |
| Bachelor's Degree or higher | 115 (97.5%) | 3 (2.5%) |
Occupancy by Age of Householder in Pinconning
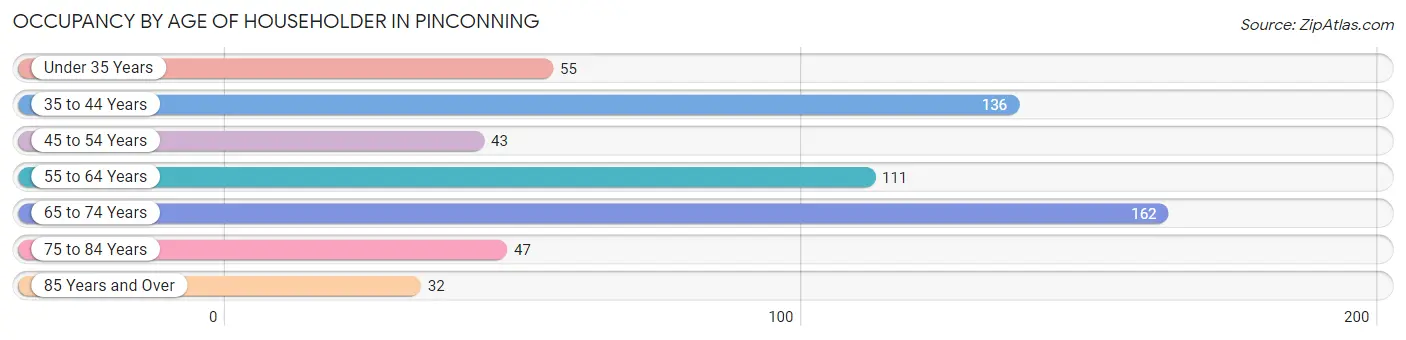
| Age Bracket | # Households | % Households |
| Under 35 Years | 55 | 9.4% |
| 35 to 44 Years | 136 | 23.2% |
| 45 to 54 Years | 43 | 7.3% |
| 55 to 64 Years | 111 | 18.9% |
| 65 to 74 Years | 162 | 27.7% |
| 75 to 84 Years | 47 | 8.0% |
| 85 Years and Over | 32 | 5.5% |
| Total | 586 | 100.0% |
Housing Finances in Pinconning
Median Income by Occupancy in Pinconning
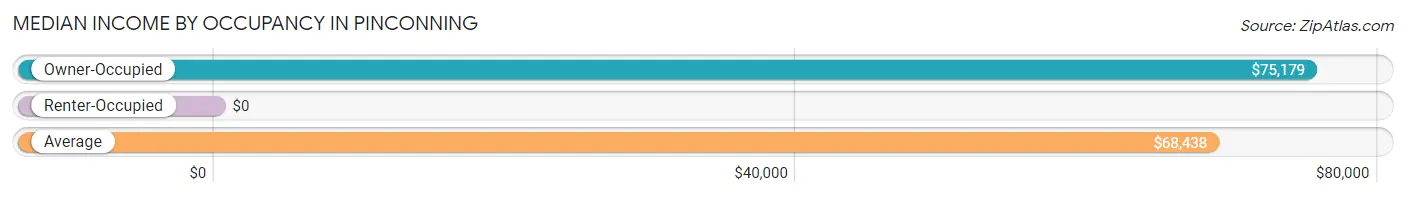
| Occupancy Type | # Households | Median Income |
| Owner-Occupied | 456 (77.8%) | $75,179 |
| Renter-Occupied | 130 (22.2%) | $0 |
| Average | 586 (100.0%) | $68,438 |
Occupancy by Householder Income Bracket in Pinconning
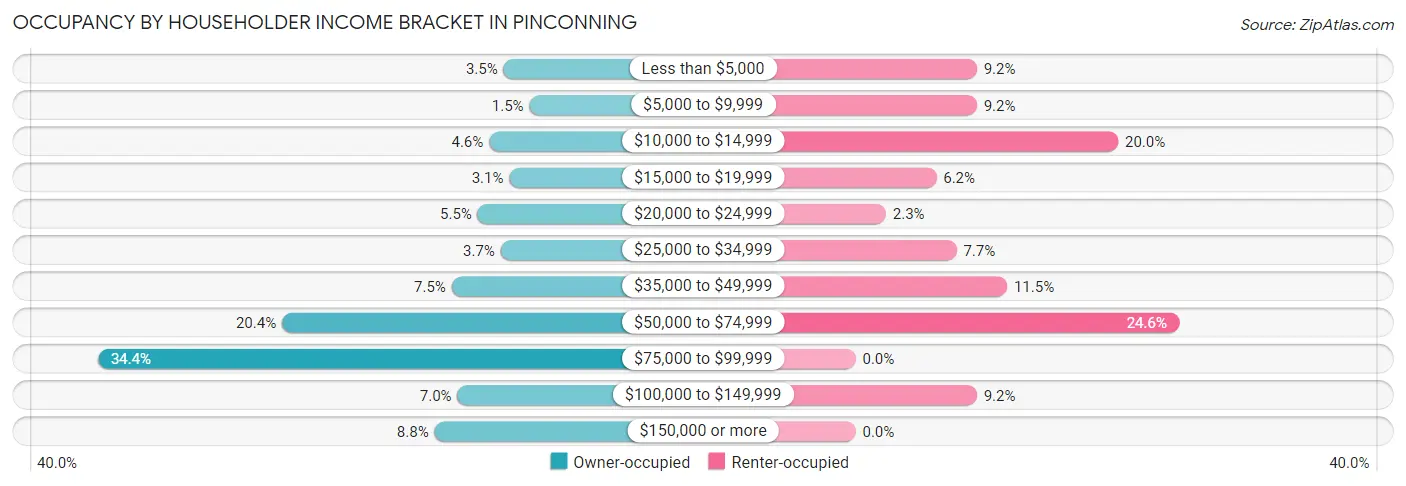
| Income Bracket | Owner-occupied | Renter-occupied |
| Less than $5,000 | 16 (3.5%) | 12 (9.2%) |
| $5,000 to $9,999 | 7 (1.5%) | 12 (9.2%) |
| $10,000 to $14,999 | 21 (4.6%) | 26 (20.0%) |
| $15,000 to $19,999 | 14 (3.1%) | 8 (6.1%) |
| $20,000 to $24,999 | 25 (5.5%) | 3 (2.3%) |
| $25,000 to $34,999 | 17 (3.7%) | 10 (7.7%) |
| $35,000 to $49,999 | 34 (7.5%) | 15 (11.5%) |
| $50,000 to $74,999 | 93 (20.4%) | 32 (24.6%) |
| $75,000 to $99,999 | 157 (34.4%) | 0 (0.0%) |
| $100,000 to $149,999 | 32 (7.0%) | 12 (9.2%) |
| $150,000 or more | 40 (8.8%) | 0 (0.0%) |
| Total | 456 (100.0%) | 130 (100.0%) |
Monthly Housing Cost Tiers in Pinconning
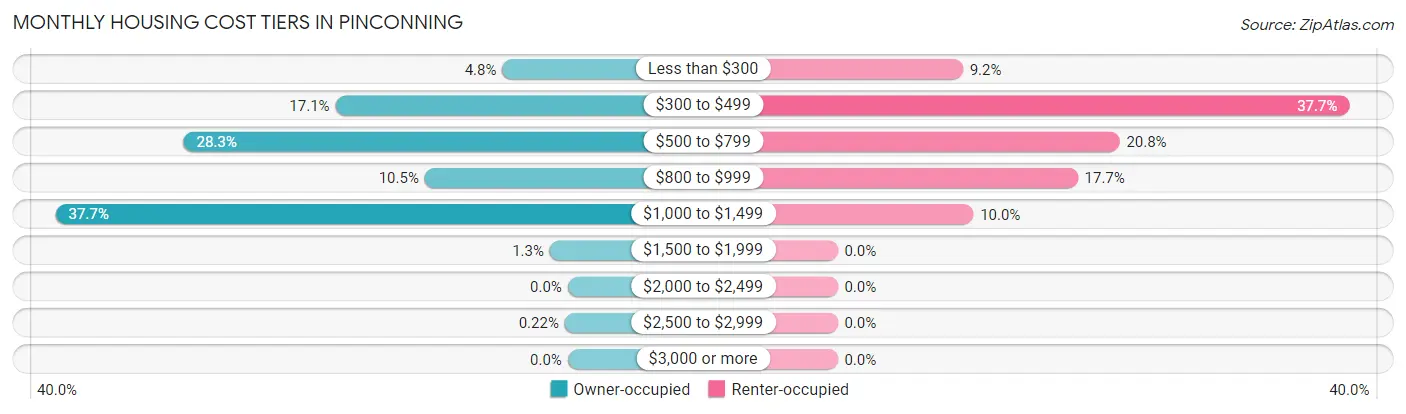
| Monthly Cost | Owner-occupied | Renter-occupied |
| Less than $300 | 22 (4.8%) | 12 (9.2%) |
| $300 to $499 | 78 (17.1%) | 49 (37.7%) |
| $500 to $799 | 129 (28.3%) | 27 (20.8%) |
| $800 to $999 | 48 (10.5%) | 23 (17.7%) |
| $1,000 to $1,499 | 172 (37.7%) | 13 (10.0%) |
| $1,500 to $1,999 | 6 (1.3%) | 0 (0.0%) |
| $2,000 to $2,499 | 0 (0.0%) | 0 (0.0%) |
| $2,500 to $2,999 | 1 (0.2%) | 0 (0.0%) |
| $3,000 or more | 0 (0.0%) | 0 (0.0%) |
| Total | 456 (100.0%) | 130 (100.0%) |
Physical Housing Characteristics in Pinconning
Housing Structures in Pinconning
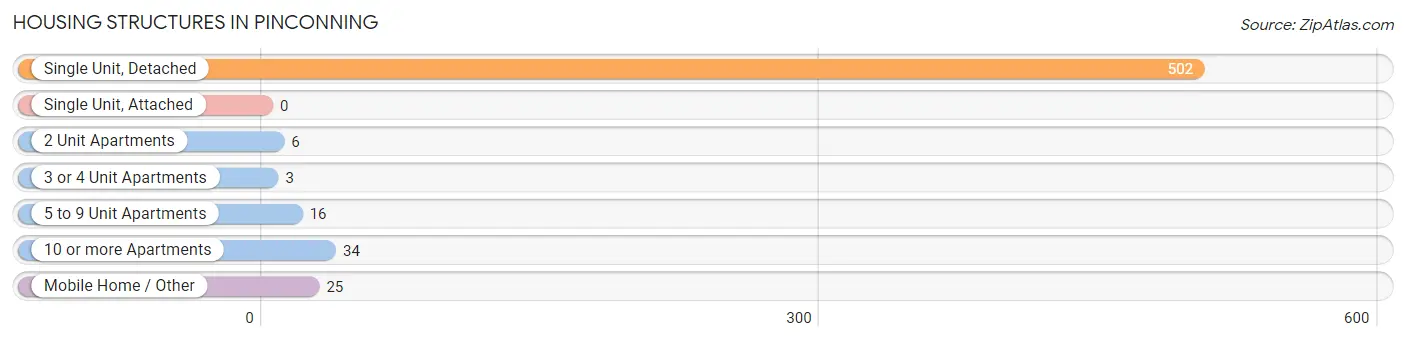
| Structure Type | # Housing Units | % Housing Units |
| Single Unit, Detached | 502 | 85.7% |
| Single Unit, Attached | 0 | 0.0% |
| 2 Unit Apartments | 6 | 1.0% |
| 3 or 4 Unit Apartments | 3 | 0.5% |
| 5 to 9 Unit Apartments | 16 | 2.7% |
| 10 or more Apartments | 34 | 5.8% |
| Mobile Home / Other | 25 | 4.3% |
| Total | 586 | 100.0% |
Housing Structures by Occupancy in Pinconning
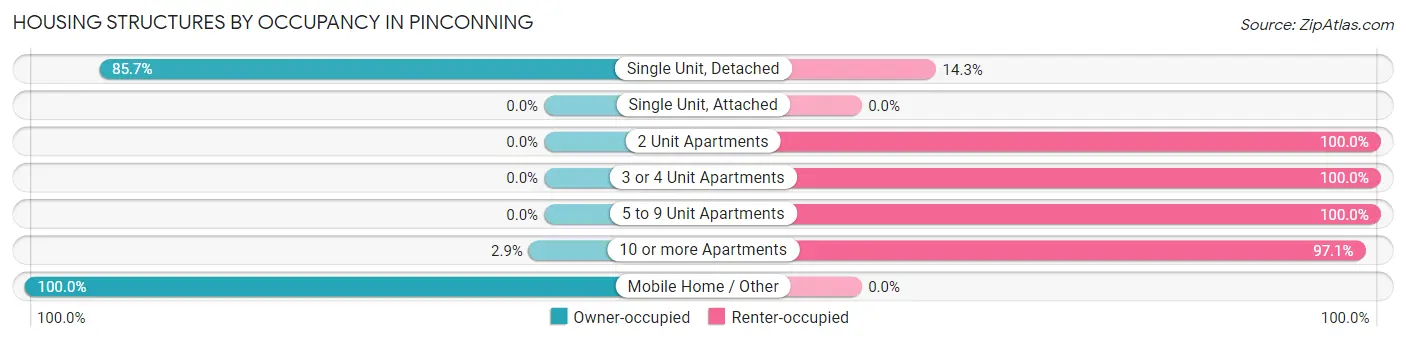
| Structure Type | Owner-occupied | Renter-occupied |
| Single Unit, Detached | 430 (85.7%) | 72 (14.3%) |
| Single Unit, Attached | 0 (0.0%) | 0 (0.0%) |
| 2 Unit Apartments | 0 (0.0%) | 6 (100.0%) |
| 3 or 4 Unit Apartments | 0 (0.0%) | 3 (100.0%) |
| 5 to 9 Unit Apartments | 0 (0.0%) | 16 (100.0%) |
| 10 or more Apartments | 1 (2.9%) | 33 (97.1%) |
| Mobile Home / Other | 25 (100.0%) | 0 (0.0%) |
| Total | 456 (77.8%) | 130 (22.2%) |
Housing Structures by Number of Rooms in Pinconning
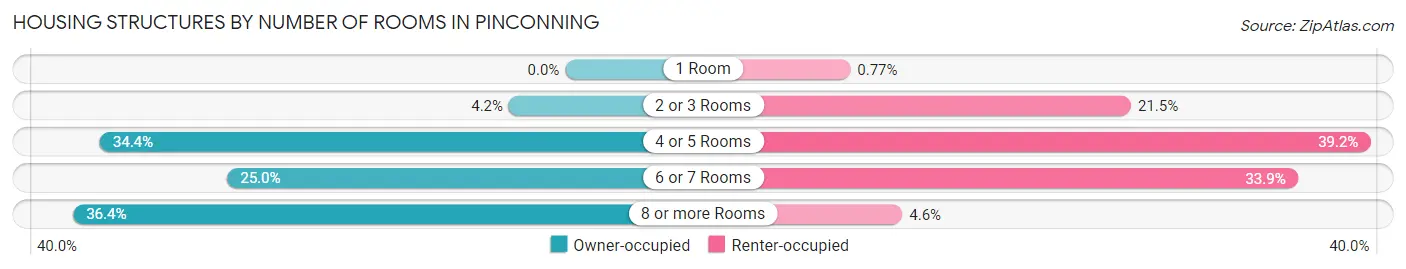
| Number of Rooms | Owner-occupied | Renter-occupied |
| 1 Room | 0 (0.0%) | 1 (0.8%) |
| 2 or 3 Rooms | 19 (4.2%) | 28 (21.5%) |
| 4 or 5 Rooms | 157 (34.4%) | 51 (39.2%) |
| 6 or 7 Rooms | 114 (25.0%) | 44 (33.9%) |
| 8 or more Rooms | 166 (36.4%) | 6 (4.6%) |
| Total | 456 (100.0%) | 130 (100.0%) |
Housing Structure by Heating Type in Pinconning
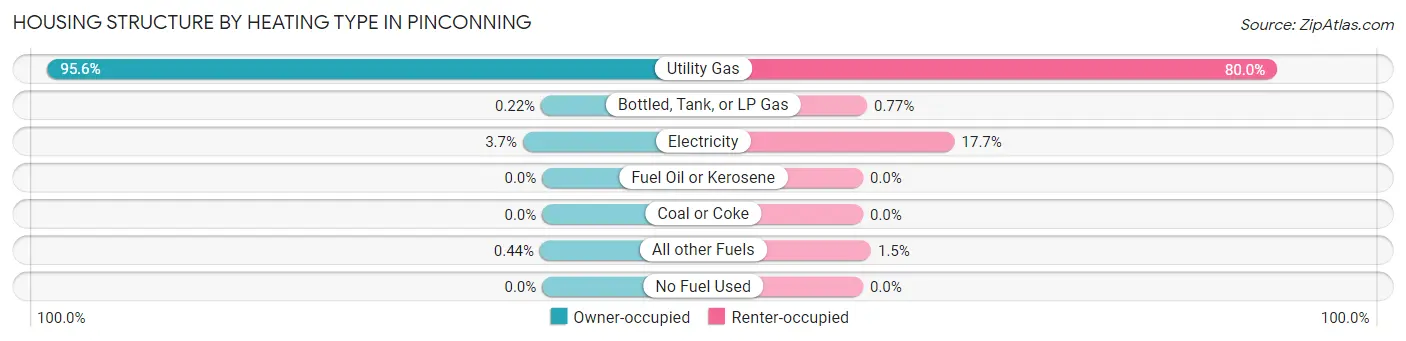
| Heating Type | Owner-occupied | Renter-occupied |
| Utility Gas | 436 (95.6%) | 104 (80.0%) |
| Bottled, Tank, or LP Gas | 1 (0.2%) | 1 (0.8%) |
| Electricity | 17 (3.7%) | 23 (17.7%) |
| Fuel Oil or Kerosene | 0 (0.0%) | 0 (0.0%) |
| Coal or Coke | 0 (0.0%) | 0 (0.0%) |
| All other Fuels | 2 (0.4%) | 2 (1.5%) |
| No Fuel Used | 0 (0.0%) | 0 (0.0%) |
| Total | 456 (100.0%) | 130 (100.0%) |
Household Vehicle Usage in Pinconning
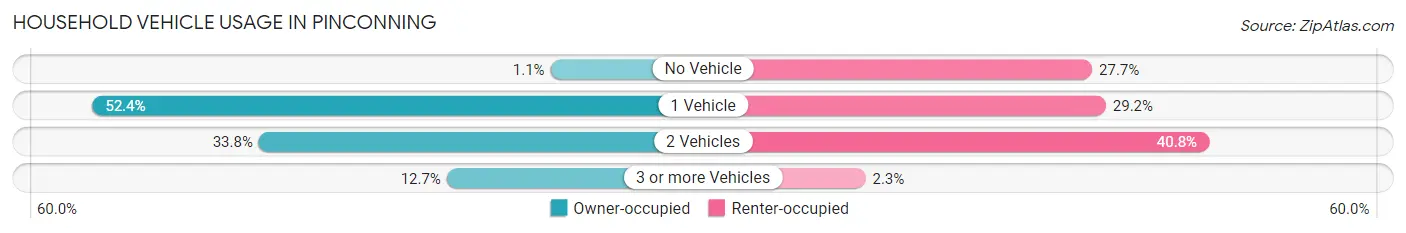
| Vehicles per Household | Owner-occupied | Renter-occupied |
| No Vehicle | 5 (1.1%) | 36 (27.7%) |
| 1 Vehicle | 239 (52.4%) | 38 (29.2%) |
| 2 Vehicles | 154 (33.8%) | 53 (40.8%) |
| 3 or more Vehicles | 58 (12.7%) | 3 (2.3%) |
| Total | 456 (100.0%) | 130 (100.0%) |
Real Estate & Mortgages in Pinconning
Real Estate and Mortgage Overview in Pinconning
| Characteristic | Without Mortgage | With Mortgage |
| Housing Units | 192 | 264 |
| Median Property Value | $65,200 | $73,300 |
| Median Household Income | $62,321 | $20 |
| Monthly Housing Costs | $500 | $0 |
| Real Estate Taxes | $1,532 | $3 |
Property Value by Mortgage Status in Pinconning
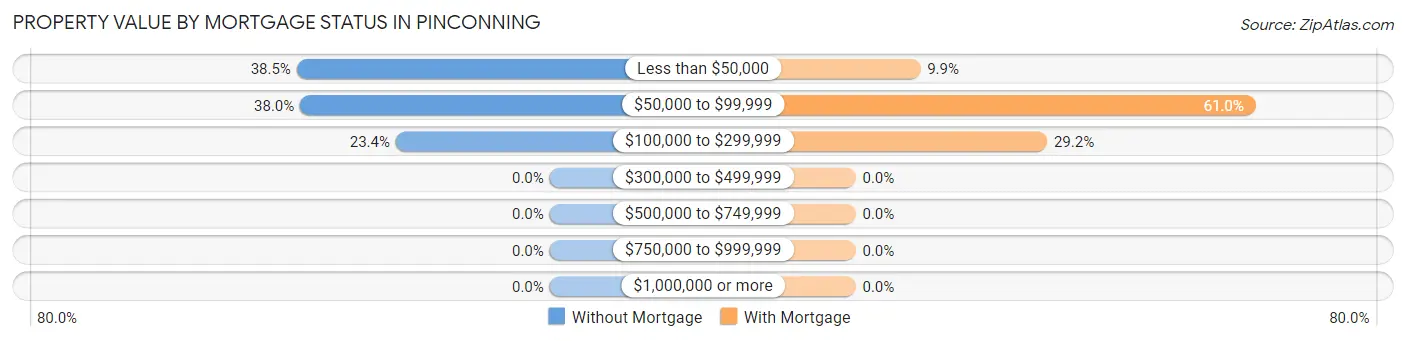
| Property Value | Without Mortgage | With Mortgage |
| Less than $50,000 | 74 (38.5%) | 26 (9.9%) |
| $50,000 to $99,999 | 73 (38.0%) | 161 (61.0%) |
| $100,000 to $299,999 | 45 (23.4%) | 77 (29.2%) |
| $300,000 to $499,999 | 0 (0.0%) | 0 (0.0%) |
| $500,000 to $749,999 | 0 (0.0%) | 0 (0.0%) |
| $750,000 to $999,999 | 0 (0.0%) | 0 (0.0%) |
| $1,000,000 or more | 0 (0.0%) | 0 (0.0%) |
| Total | 192 (100.0%) | 264 (100.0%) |
Household Income by Mortgage Status in Pinconning
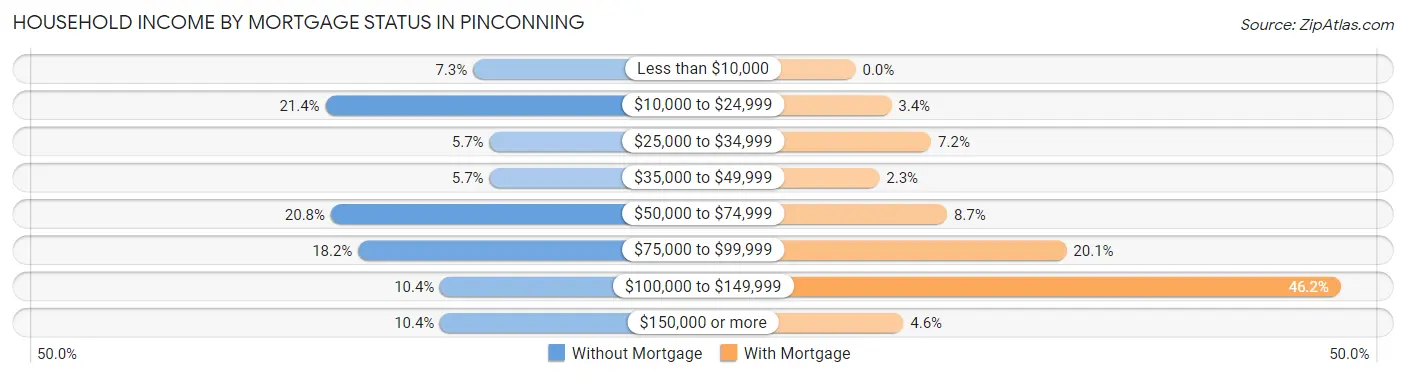
| Household Income | Without Mortgage | With Mortgage |
| Less than $10,000 | 14 (7.3%) | 0 (0.0%) |
| $10,000 to $24,999 | 41 (21.3%) | 9 (3.4%) |
| $25,000 to $34,999 | 11 (5.7%) | 19 (7.2%) |
| $35,000 to $49,999 | 11 (5.7%) | 6 (2.3%) |
| $50,000 to $74,999 | 40 (20.8%) | 23 (8.7%) |
| $75,000 to $99,999 | 35 (18.2%) | 53 (20.1%) |
| $100,000 to $149,999 | 20 (10.4%) | 122 (46.2%) |
| $150,000 or more | 20 (10.4%) | 12 (4.5%) |
| Total | 192 (100.0%) | 264 (100.0%) |
Property Value to Household Income Ratio in Pinconning
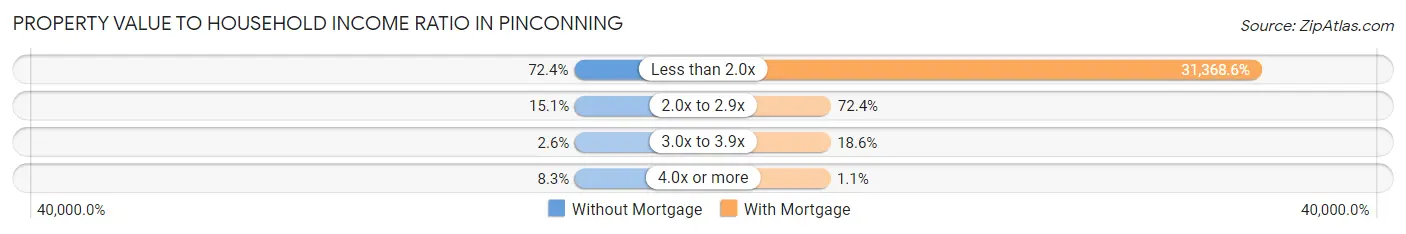
| Value-to-Income Ratio | Without Mortgage | With Mortgage |
| Less than 2.0x | 139 (72.4%) | 82,813 (31,368.6%) |
| 2.0x to 2.9x | 29 (15.1%) | 191 (72.4%) |
| 3.0x to 3.9x | 5 (2.6%) | 49 (18.6%) |
| 4.0x or more | 16 (8.3%) | 3 (1.1%) |
| Total | 192 (100.0%) | 264 (100.0%) |
Real Estate Taxes by Mortgage Status in Pinconning
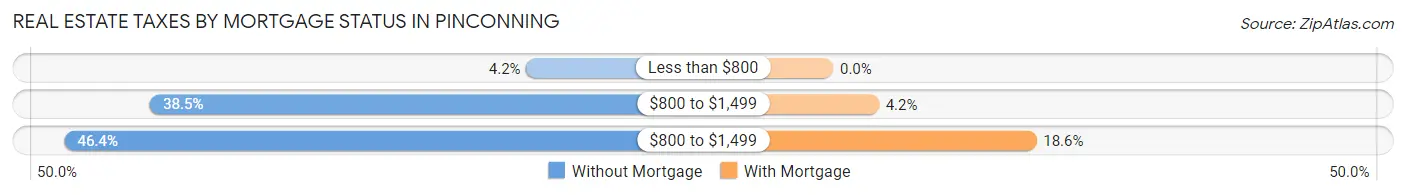
| Property Taxes | Without Mortgage | With Mortgage |
| Less than $800 | 8 (4.2%) | 0 (0.0%) |
| $800 to $1,499 | 74 (38.5%) | 11 (4.2%) |
| $800 to $1,499 | 89 (46.4%) | 49 (18.6%) |
| Total | 192 (100.0%) | 264 (100.0%) |
Health & Disability in Pinconning
Health Insurance Coverage by Age in Pinconning
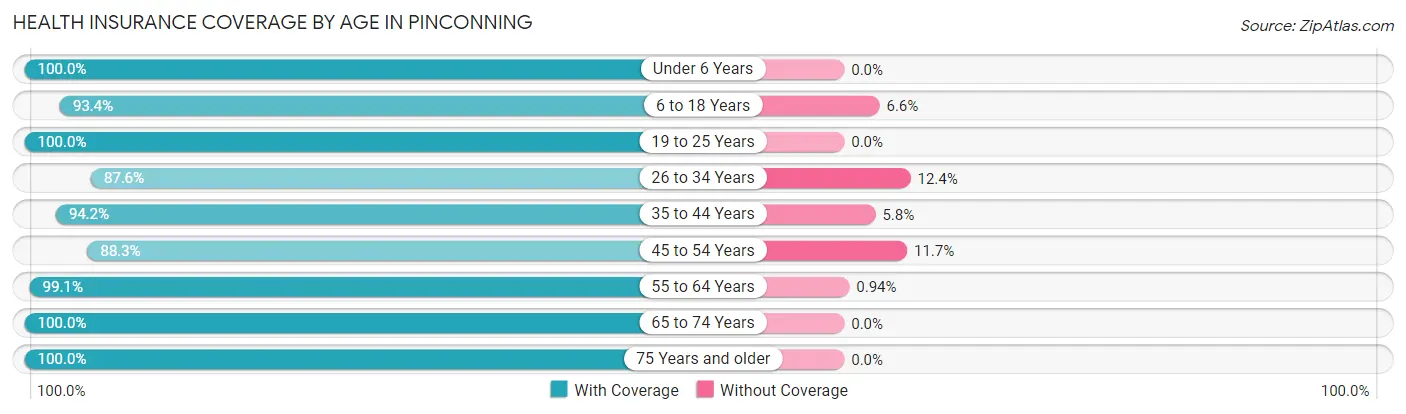
| Age Bracket | With Coverage | Without Coverage |
| Under 6 Years | 29 (100.0%) | 0 (0.0%) |
| 6 to 18 Years | 270 (93.4%) | 19 (6.6%) |
| 19 to 25 Years | 47 (100.0%) | 0 (0.0%) |
| 26 to 34 Years | 78 (87.6%) | 11 (12.4%) |
| 35 to 44 Years | 178 (94.2%) | 11 (5.8%) |
| 45 to 54 Years | 83 (88.3%) | 11 (11.7%) |
| 55 to 64 Years | 317 (99.1%) | 3 (0.9%) |
| 65 to 74 Years | 204 (100.0%) | 0 (0.0%) |
| 75 Years and older | 93 (100.0%) | 0 (0.0%) |
| Total | 1,299 (95.9%) | 55 (4.1%) |
Health Insurance Coverage by Citizenship Status in Pinconning
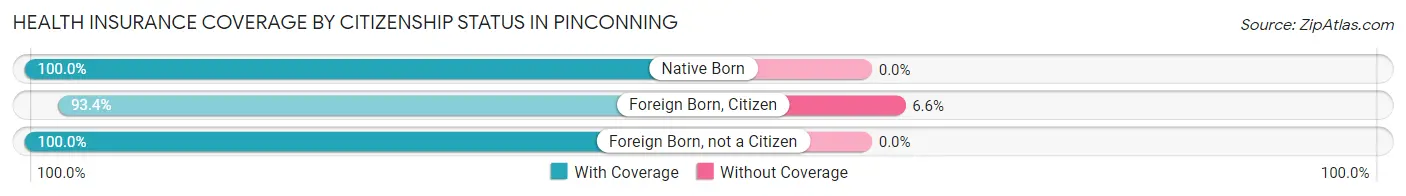
| Citizenship Status | With Coverage | Without Coverage |
| Native Born | 29 (100.0%) | 0 (0.0%) |
| Foreign Born, Citizen | 270 (93.4%) | 19 (6.6%) |
| Foreign Born, not a Citizen | 47 (100.0%) | 0 (0.0%) |
Health Insurance Coverage by Household Income in Pinconning
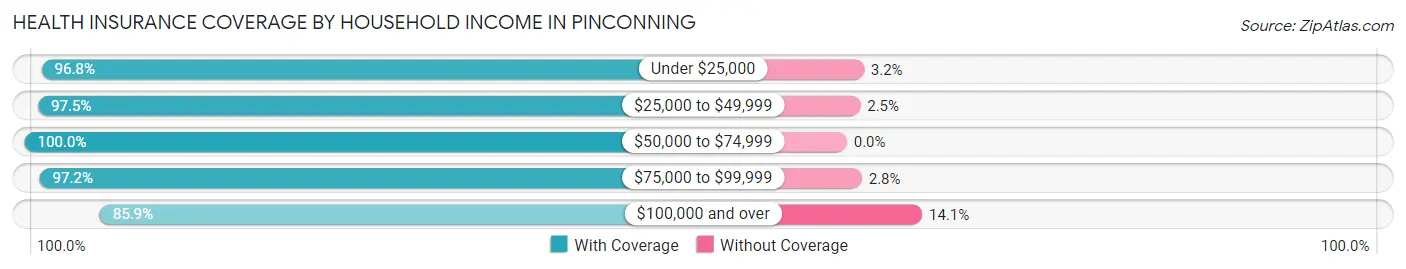
| Household Income | With Coverage | Without Coverage |
| Under $25,000 | 182 (96.8%) | 6 (3.2%) |
| $25,000 to $49,999 | 154 (97.5%) | 4 (2.5%) |
| $50,000 to $74,999 | 369 (100.0%) | 0 (0.0%) |
| $75,000 to $99,999 | 381 (97.2%) | 11 (2.8%) |
| $100,000 and over | 207 (85.9%) | 34 (14.1%) |
Public vs Private Health Insurance Coverage by Age in Pinconning
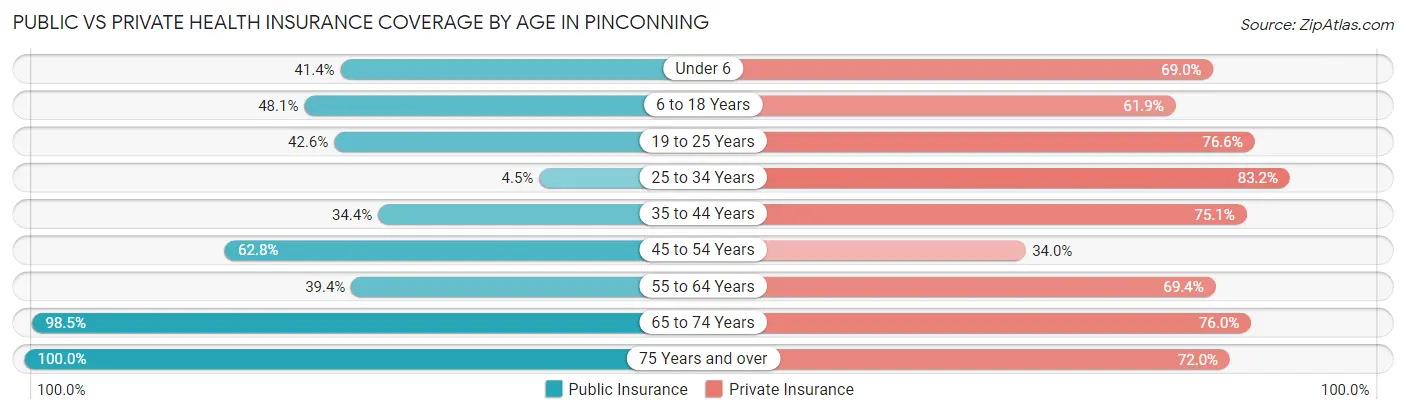
| Age Bracket | Public Insurance | Private Insurance |
| Under 6 | 12 (41.4%) | 20 (69.0%) |
| 6 to 18 Years | 139 (48.1%) | 179 (61.9%) |
| 19 to 25 Years | 20 (42.5%) | 36 (76.6%) |
| 25 to 34 Years | 4 (4.5%) | 74 (83.2%) |
| 35 to 44 Years | 65 (34.4%) | 142 (75.1%) |
| 45 to 54 Years | 59 (62.8%) | 32 (34.0%) |
| 55 to 64 Years | 126 (39.4%) | 222 (69.4%) |
| 65 to 74 Years | 201 (98.5%) | 155 (76.0%) |
| 75 Years and over | 93 (100.0%) | 67 (72.0%) |
| Total | 719 (53.1%) | 927 (68.5%) |
Disability Status by Sex by Age in Pinconning
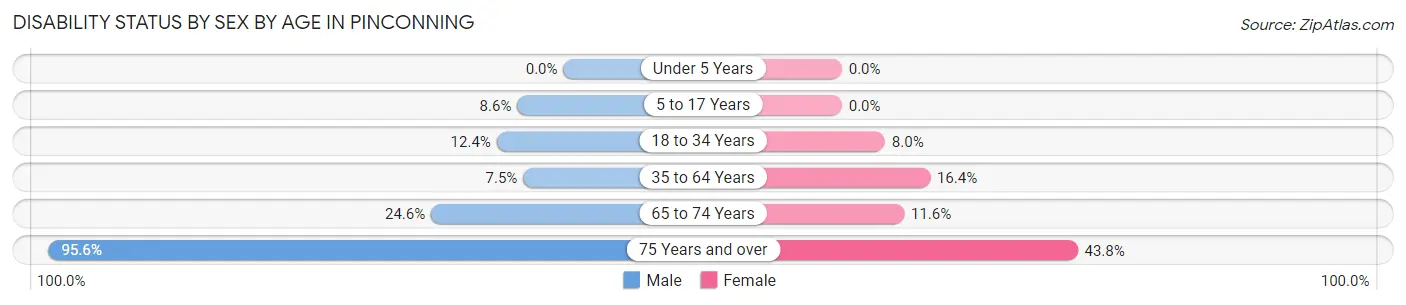
| Age Bracket | Male | Female |
| Under 5 Years | 0 (0.0%) | 0 (0.0%) |
| 5 to 17 Years | 16 (8.6%) | 0 (0.0%) |
| 18 to 34 Years | 13 (12.4%) | 4 (8.0%) |
| 35 to 64 Years | 24 (7.4%) | 46 (16.4%) |
| 65 to 74 Years | 14 (24.6%) | 17 (11.6%) |
| 75 Years and over | 43 (95.6%) | 21 (43.8%) |
Disability Class by Sex by Age in Pinconning
Disability Class: Hearing Difficulty
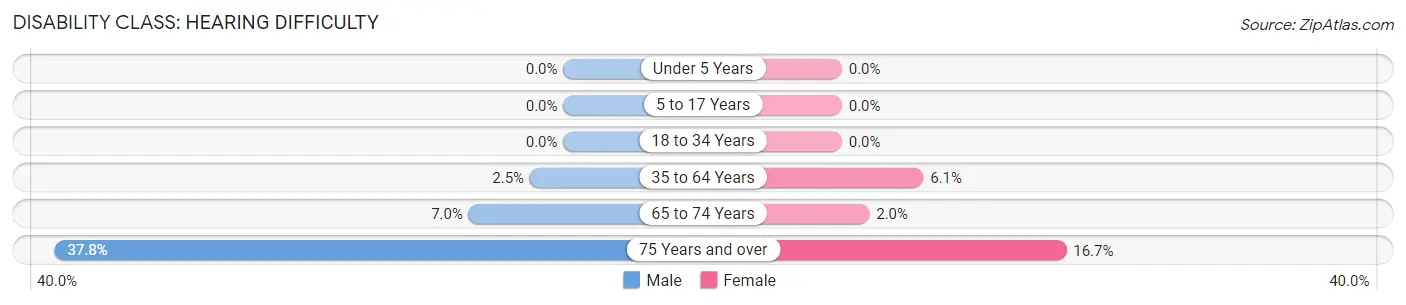
| Age Bracket | Male | Female |
| Under 5 Years | 0 (0.0%) | 0 (0.0%) |
| 5 to 17 Years | 0 (0.0%) | 0 (0.0%) |
| 18 to 34 Years | 0 (0.0%) | 0 (0.0%) |
| 35 to 64 Years | 8 (2.5%) | 17 (6.0%) |
| 65 to 74 Years | 4 (7.0%) | 3 (2.0%) |
| 75 Years and over | 17 (37.8%) | 8 (16.7%) |
Disability Class: Vision Difficulty
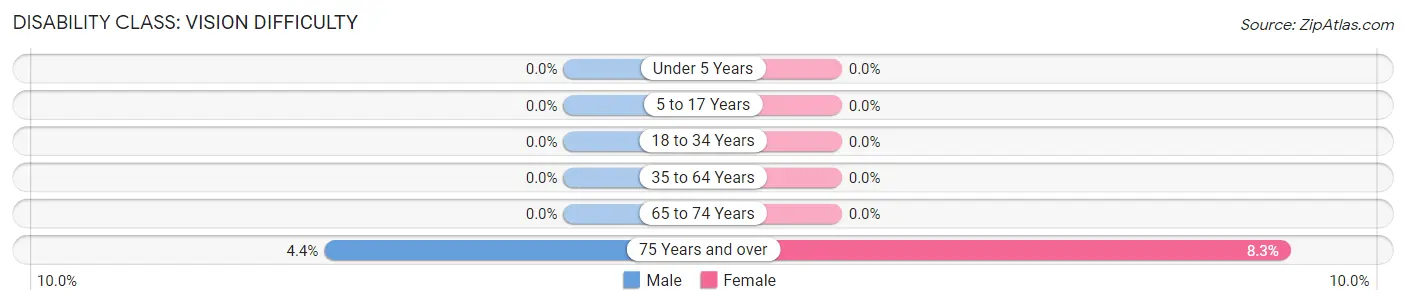
| Age Bracket | Male | Female |
| Under 5 Years | 0 (0.0%) | 0 (0.0%) |
| 5 to 17 Years | 0 (0.0%) | 0 (0.0%) |
| 18 to 34 Years | 0 (0.0%) | 0 (0.0%) |
| 35 to 64 Years | 0 (0.0%) | 0 (0.0%) |
| 65 to 74 Years | 0 (0.0%) | 0 (0.0%) |
| 75 Years and over | 2 (4.4%) | 4 (8.3%) |
Disability Class: Cognitive Difficulty
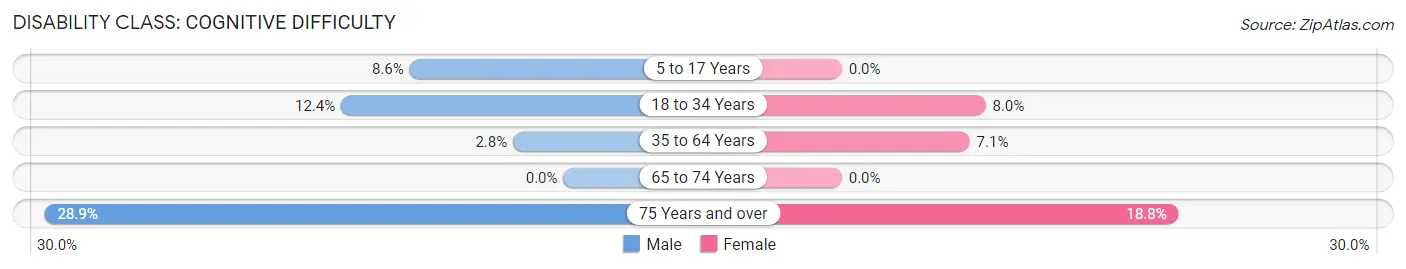
| Age Bracket | Male | Female |
| 5 to 17 Years | 16 (8.6%) | 0 (0.0%) |
| 18 to 34 Years | 13 (12.4%) | 4 (8.0%) |
| 35 to 64 Years | 9 (2.8%) | 20 (7.1%) |
| 65 to 74 Years | 0 (0.0%) | 0 (0.0%) |
| 75 Years and over | 13 (28.9%) | 9 (18.8%) |
Disability Class: Ambulatory Difficulty
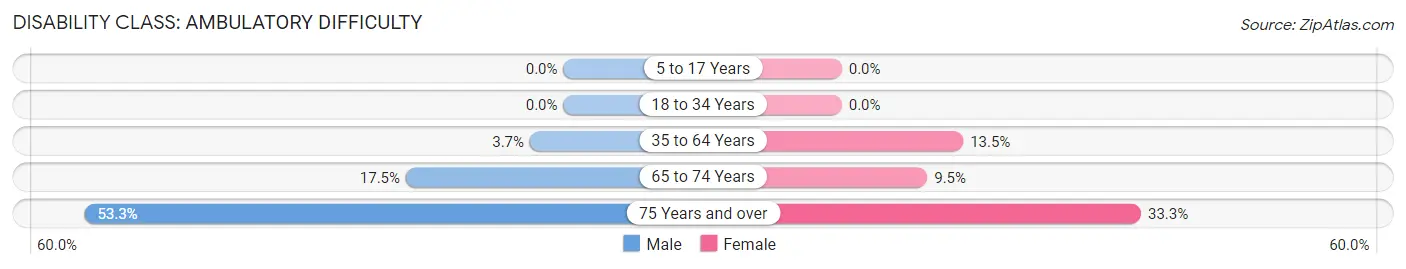
| Age Bracket | Male | Female |
| 5 to 17 Years | 0 (0.0%) | 0 (0.0%) |
| 18 to 34 Years | 0 (0.0%) | 0 (0.0%) |
| 35 to 64 Years | 12 (3.7%) | 38 (13.5%) |
| 65 to 74 Years | 10 (17.5%) | 14 (9.5%) |
| 75 Years and over | 24 (53.3%) | 16 (33.3%) |
Disability Class: Self-Care Difficulty
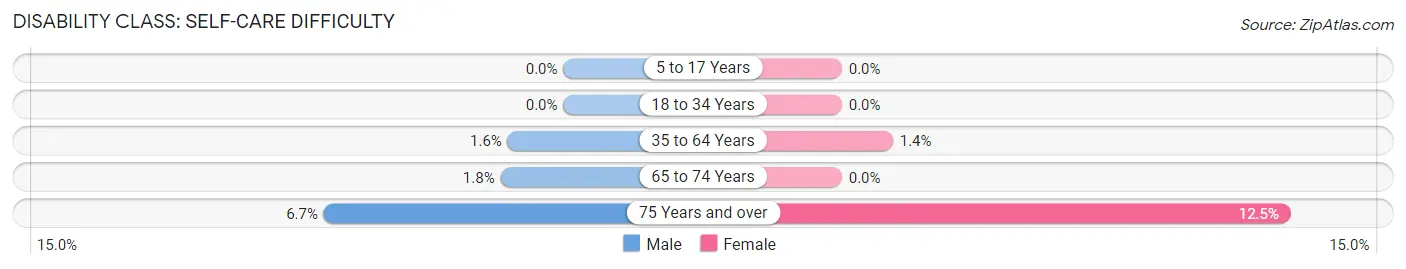
| Age Bracket | Male | Female |
| 5 to 17 Years | 0 (0.0%) | 0 (0.0%) |
| 18 to 34 Years | 0 (0.0%) | 0 (0.0%) |
| 35 to 64 Years | 5 (1.5%) | 4 (1.4%) |
| 65 to 74 Years | 1 (1.8%) | 0 (0.0%) |
| 75 Years and over | 3 (6.7%) | 6 (12.5%) |
Technology Access in Pinconning
Computing Device Access in Pinconning
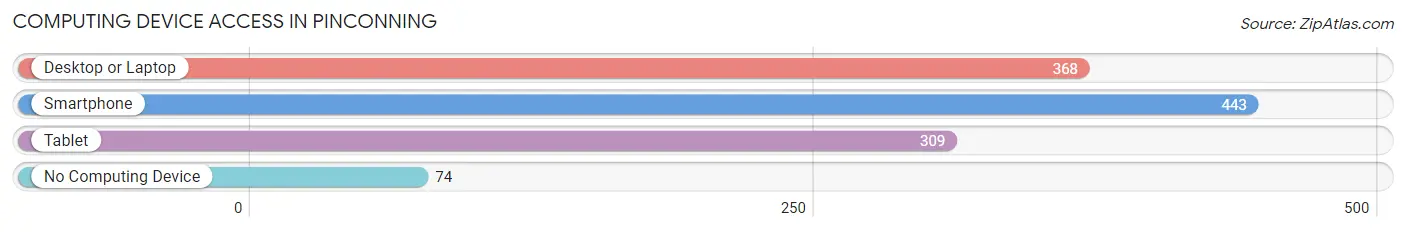
| Device Type | # Households | % Households |
| Desktop or Laptop | 368 | 62.8% |
| Smartphone | 443 | 75.6% |
| Tablet | 309 | 52.7% |
| No Computing Device | 74 | 12.6% |
| Total | 586 | 100.0% |
Internet Access in Pinconning
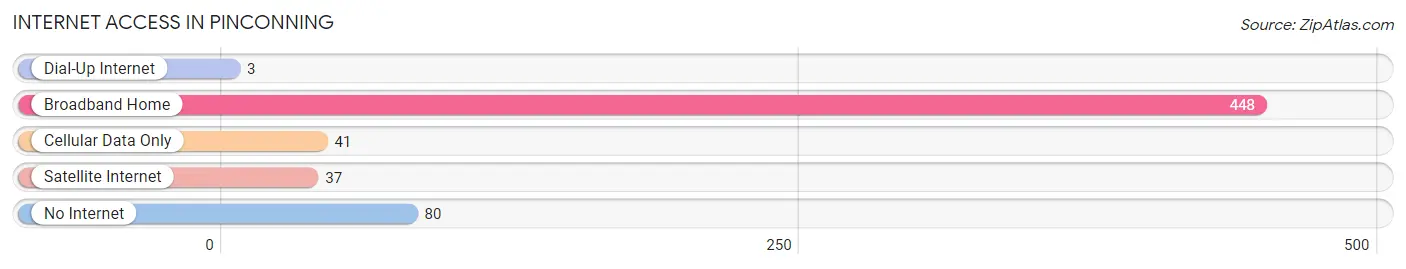
| Internet Type | # Households | % Households |
| Dial-Up Internet | 3 | 0.5% |
| Broadband Home | 448 | 76.4% |
| Cellular Data Only | 41 | 7.0% |
| Satellite Internet | 37 | 6.3% |
| No Internet | 80 | 13.7% |
| Total | 586 | 100.0% |
Pinconning Summary
Pinconning, Michigan is a small city located in Bay County, Michigan. It is situated on the Saginaw Bay of Lake Huron, approximately 10 miles north of Bay City. The city has a population of 1,817 as of the 2010 census, making it the second-largest city in Bay County.
History
Pinconning was first settled in 1854 by a group of lumbermen from Canada. The town was named after a local Native American chief, Chief Pinconning. The town was incorporated in 1887 and was the first city in Bay County to be incorporated.
The city was an important lumbering center in the late 19th and early 20th centuries. The Pinconning Lumber Company was the largest employer in the area, and the city was home to several other lumber mills. The lumber industry declined in the early 20th century, and the city shifted its focus to agriculture and tourism.
Geography
Pinconning is located at 43°59'N, 83°59'W. It is situated on the Saginaw Bay of Lake Huron, approximately 10 miles north of Bay City. The city has a total area of 2.2 square miles, all of which is land.
The city is located in a rural area, with the nearest major city being Bay City. The city is surrounded by farmland and woodlands. The Pinconning River runs through the city, and there are several small lakes in the area.
Economy
The economy of Pinconning is largely based on agriculture and tourism. The city is home to several farms, and the surrounding area is known for its production of apples, cherries, and other fruits and vegetables.
The city is also a popular tourist destination, with several attractions in the area. These include the Pinconning Historical Museum, the Pinconning Park, and the Pinconning Nature Center.
Demographics
As of the 2010 census, Pinconning had a population of 1,817. The racial makeup of the city was 97.2% White, 0.7% African American, 0.3% Native American, 0.2% Asian, 0.1% Pacific Islander, 0.3% from other races, and 1.3% from two or more races. Hispanic or Latino of any race were 1.3% of the population.
The median household income in Pinconning was $37,917, and the median family income was $45,938. The per capita income was $19,945. About 11.2% of families and 14.2% of the population were below the poverty line, including 19.2% of those under age 18 and 8.2% of those age 65 or over.
Pinconning is served by the Pinconning Area School District. The district has one elementary school, one middle school, and one high school. The city is also home to a branch of the Bay County Library System.
Common Questions
What is Per Capita Income in Pinconning?
Per Capita income in Pinconning is $29,613.
What is the Median Family Income in Pinconning?
Median Family Income in Pinconning is $82,642.
What is the Median Household income in Pinconning?
Median Household Income in Pinconning is $68,438.
What is Income or Wage Gap in Pinconning?
Income or Wage Gap in Pinconning is 42.3%.
Women in Pinconning earn 57.7 cents for every dollar earned by a man.
What is Inequality or Gini Index in Pinconning?
Inequality or Gini Index in Pinconning is 0.39.
What is the Total Population of Pinconning?
Total Population of Pinconning is 1,354.
What is the Total Male Population of Pinconning?
Total Male Population of Pinconning is 718.
What is the Total Female Population of Pinconning?
Total Female Population of Pinconning is 636.
What is the Ratio of Males per 100 Females in Pinconning?
There are 112.89 Males per 100 Females in Pinconning.
What is the Ratio of Females per 100 Males in Pinconning?
There are 88.58 Females per 100 Males in Pinconning.
What is the Median Population Age in Pinconning?
Median Population Age in Pinconning is 47.0 Years.
What is the Average Family Size in Pinconning
Average Family Size in Pinconning is 2.7 People.
What is the Average Household Size in Pinconning
Average Household Size in Pinconning is 2.3 People.
How Large is the Labor Force in Pinconning?
There are 479 People in the Labor Forcein in Pinconning.
What is the Percentage of People in the Labor Force in Pinconning?
41.8% of People are in the Labor Force in Pinconning.
What is the Unemployment Rate in Pinconning?
Unemployment Rate in Pinconning is 4.4%.