Onaway, MI Map & Demographics
Onaway Map
Onaway Overview
$20,994
PER CAPITA INCOME
$41,250
AVG FAMILY INCOME
$35,625
AVG HOUSEHOLD INCOME
48.2%
WAGE / INCOME GAP [ % ]
51.8¢/ $1
WAGE / INCOME GAP [ $ ]
0.42
INEQUALITY / GINI INDEX
813
TOTAL POPULATION
369
MALE POPULATION
444
FEMALE POPULATION
83.11
MALES / 100 FEMALES
120.33
FEMALES / 100 MALES
36.9
MEDIAN AGE
2.5
AVG FAMILY SIZE
2.0
AVG HOUSEHOLD SIZE
328
LABOR FORCE [ PEOPLE ]
47.4%
PERCENT IN LABOR FORCE
13.7%
UNEMPLOYMENT RATE
Onaway Zip Codes
Onaway Area Codes
Income in Onaway
Income Overview in Onaway
Per Capita Income in Onaway is $20,994, while median incomes of families and households are $41,250 and $35,625 respectively.
| Characteristic | Number | Measure |
| Per Capita Income | 813 | $20,994 |
| Median Family Income | 205 | $41,250 |
| Mean Family Income | 205 | $56,449 |
| Median Household Income | 405 | $35,625 |
| Mean Household Income | 405 | $45,165 |
| Income Deficit | 205 | $0 |
| Wage / Income Gap (%) | 813 | 48.19% |
| Wage / Income Gap ($) | 813 | 51.81¢ per $1 |
| Gini / Inequality Index | 813 | 0.42 |
Earnings by Sex in Onaway
Average Earnings in Onaway are $21,563, $37,500 for men and $19,429 for women, a difference of 48.2%.
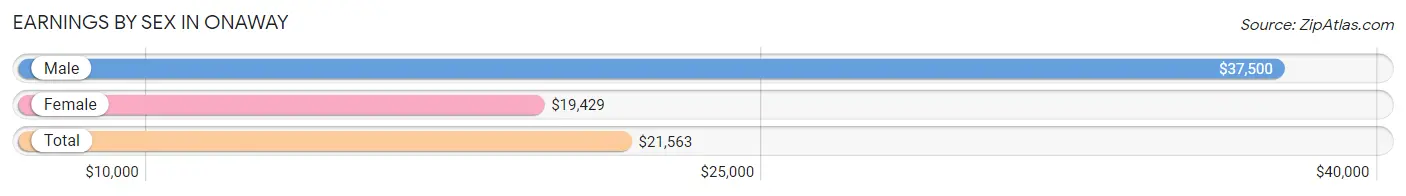
| Sex | Number | Average Earnings |
| Male | 156 (47.0%) | $37,500 |
| Female | 176 (53.0%) | $19,429 |
| Total | 332 (100.0%) | $21,563 |
Earnings by Sex by Income Bracket in Onaway
The most common earnings brackets in Onaway are $17,500 to $19,999 for men (23 | 14.7%) and $17,500 to $19,999 for women (35 | 19.9%).
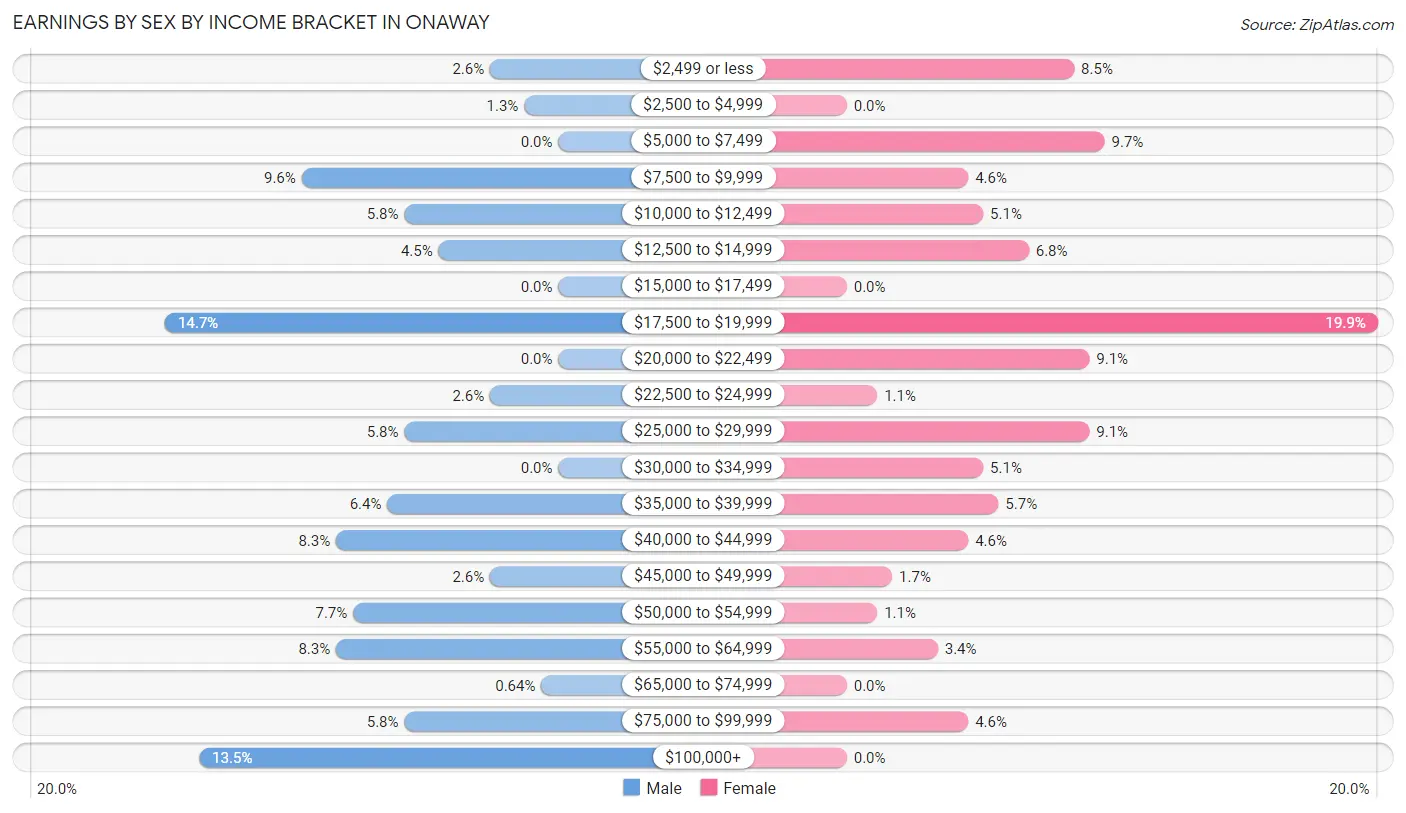
| Income | Male | Female |
| $2,499 or less | 4 (2.6%) | 15 (8.5%) |
| $2,500 to $4,999 | 2 (1.3%) | 0 (0.0%) |
| $5,000 to $7,499 | 0 (0.0%) | 17 (9.7%) |
| $7,500 to $9,999 | 15 (9.6%) | 8 (4.5%) |
| $10,000 to $12,499 | 9 (5.8%) | 9 (5.1%) |
| $12,500 to $14,999 | 7 (4.5%) | 12 (6.8%) |
| $15,000 to $17,499 | 0 (0.0%) | 0 (0.0%) |
| $17,500 to $19,999 | 23 (14.7%) | 35 (19.9%) |
| $20,000 to $22,499 | 0 (0.0%) | 16 (9.1%) |
| $22,500 to $24,999 | 4 (2.6%) | 2 (1.1%) |
| $25,000 to $29,999 | 9 (5.8%) | 16 (9.1%) |
| $30,000 to $34,999 | 0 (0.0%) | 9 (5.1%) |
| $35,000 to $39,999 | 10 (6.4%) | 10 (5.7%) |
| $40,000 to $44,999 | 13 (8.3%) | 8 (4.5%) |
| $45,000 to $49,999 | 4 (2.6%) | 3 (1.7%) |
| $50,000 to $54,999 | 12 (7.7%) | 2 (1.1%) |
| $55,000 to $64,999 | 13 (8.3%) | 6 (3.4%) |
| $65,000 to $74,999 | 1 (0.6%) | 0 (0.0%) |
| $75,000 to $99,999 | 9 (5.8%) | 8 (4.5%) |
| $100,000+ | 21 (13.5%) | 0 (0.0%) |
| Total | 156 (100.0%) | 176 (100.0%) |
Earnings by Sex by Educational Attainment in Onaway
Average earnings in Onaway are $41,406 for men and $26,250 for women, a difference of 36.6%. Men with an educational attainment of high school diploma enjoy the highest average annual earnings of $43,750, while those with high school diploma education earn the least with $43,750. Women with an educational attainment of college or associate's degree earn the most with the average annual earnings of $27,000, while those with high school diploma education have the smallest earnings of $21,964.
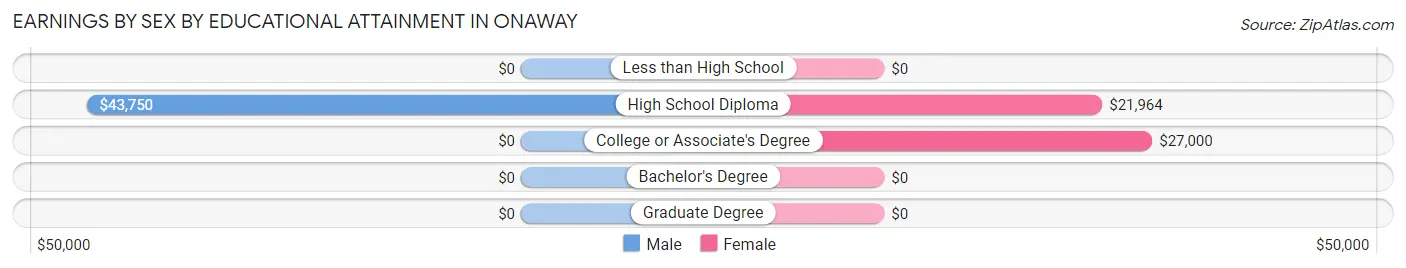
| Educational Attainment | Male Income | Female Income |
| Less than High School | - | - |
| High School Diploma | $43,750 | $21,964 |
| College or Associate's Degree | - | - |
| Bachelor's Degree | - | - |
| Graduate Degree | - | - |
| Total | $41,406 | $26,250 |
Family Income in Onaway
Family Income Brackets in Onaway
According to the Onaway family income data, there are 36 families falling into the $50,000 to $74,999 income range, which is the most common income bracket and makes up 17.6% of all families. Conversely, the $150,000 to $199,999 income bracket is the least frequent group with only 6 families (2.9%) belonging to this category.
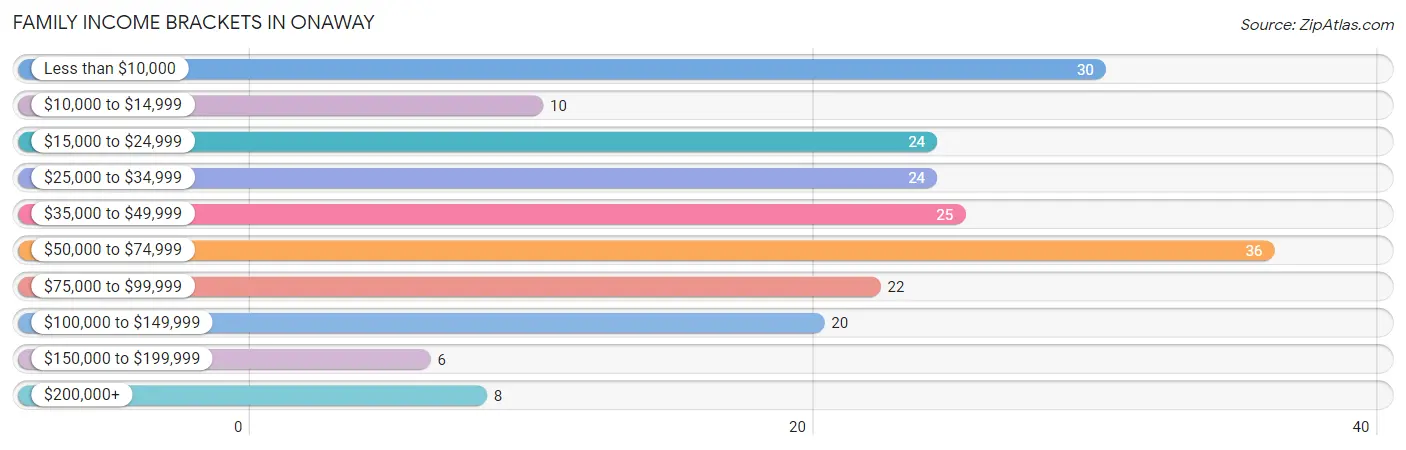
| Income Bracket | # Families | % Families |
| Less than $10,000 | 30 | 14.6% |
| $10,000 to $14,999 | 10 | 4.9% |
| $15,000 to $24,999 | 24 | 11.7% |
| $25,000 to $34,999 | 24 | 11.7% |
| $35,000 to $49,999 | 25 | 12.2% |
| $50,000 to $74,999 | 36 | 17.6% |
| $75,000 to $99,999 | 22 | 10.7% |
| $100,000 to $149,999 | 20 | 9.8% |
| $150,000 to $199,999 | 6 | 2.9% |
| $200,000+ | 8 | 3.9% |
Family Income by Famaliy Size in Onaway
5-person families (21 | 10.2%) account for the highest median family income in Onaway with $151,458 per family, while 5-person families (21 | 10.2%) have the highest median income of $30,292 per family member.
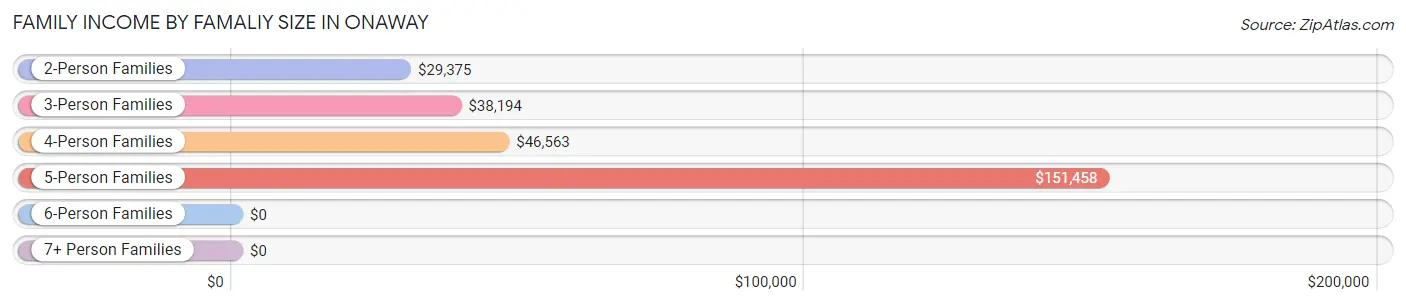
| Income Bracket | # Families | Median Income |
| 2-Person Families | 112 (54.6%) | $29,375 |
| 3-Person Families | 51 (24.9%) | $38,194 |
| 4-Person Families | 15 (7.3%) | $46,563 |
| 5-Person Families | 21 (10.2%) | $151,458 |
| 6-Person Families | 2 (1.0%) | $0 |
| 7+ Person Families | 4 (1.9%) | $0 |
| Total | 205 (100.0%) | $41,250 |
Family Income by Number of Earners in Onaway
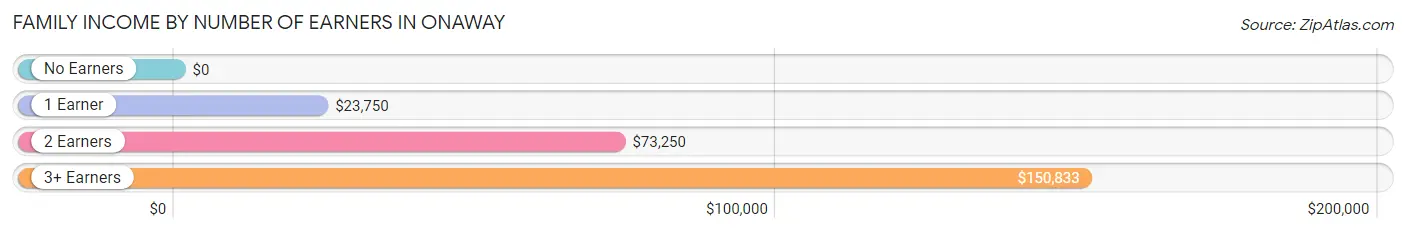
| Number of Earners | # Families | Median Income |
| No Earners | 66 (32.2%) | $0 |
| 1 Earner | 74 (36.1%) | $23,750 |
| 2 Earners | 41 (20.0%) | $73,250 |
| 3+ Earners | 24 (11.7%) | $150,833 |
| Total | 205 (100.0%) | $41,250 |
Household Income in Onaway
Household Income Brackets in Onaway
With 107 households falling in the category, the $15,000 to $24,999 income range is the most frequent in Onaway, accounting for 26.4% of all households. In contrast, only 6 households (1.5%) fall into the $150,000 to $199,999 income bracket, making it the least populous group.
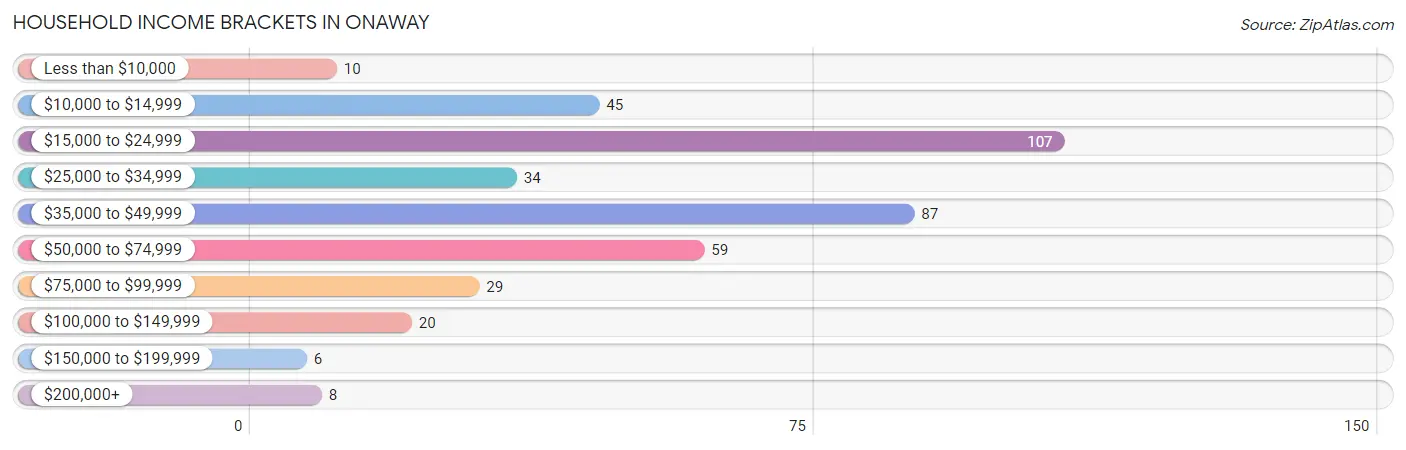
| Income Bracket | # Households | % Households |
| Less than $10,000 | 10 | 2.5% |
| $10,000 to $14,999 | 45 | 11.1% |
| $15,000 to $24,999 | 107 | 26.4% |
| $25,000 to $34,999 | 34 | 8.4% |
| $35,000 to $49,999 | 87 | 21.5% |
| $50,000 to $74,999 | 59 | 14.6% |
| $75,000 to $99,999 | 29 | 7.2% |
| $100,000 to $149,999 | 20 | 4.9% |
| $150,000 to $199,999 | 6 | 1.5% |
| $200,000+ | 8 | 2.0% |
Household Income by Householder Age in Onaway
The median household income in Onaway is $35,625, with the highest median household income of $41,250 found in the 45 to 64 years age bracket for the primary householder. A total of 136 households (33.6%) fall into this category. Meanwhile, the 65+ years age bracket for the primary householder has the lowest median household income of $24,526, with 141 households (34.8%) in this group.
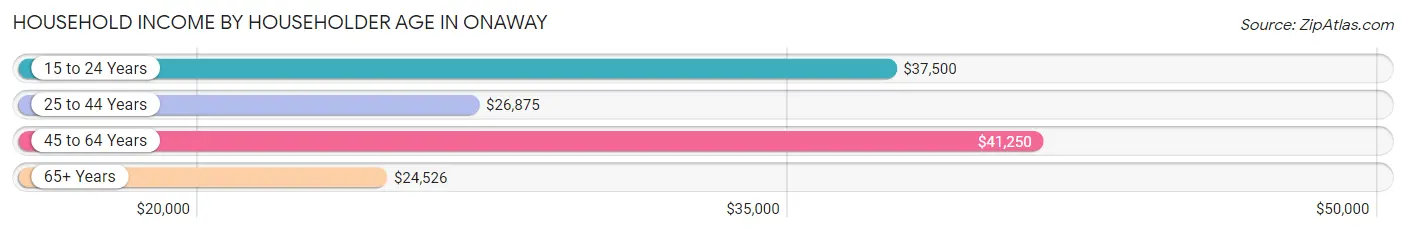
| Income Bracket | # Households | Median Income |
| 15 to 24 Years | 56 (13.8%) | $37,500 |
| 25 to 44 Years | 72 (17.8%) | $26,875 |
| 45 to 64 Years | 136 (33.6%) | $41,250 |
| 65+ Years | 141 (34.8%) | $24,526 |
| Total | 405 (100.0%) | $35,625 |
Poverty in Onaway
Income Below Poverty by Sex and Age in Onaway
With 24.0% poverty level for males and 29.9% for females among the residents of Onaway, 25 to 34 year old males and under 5 year old females are the most vulnerable to poverty, with 32 males (46.4%) and 21 females (87.5%) in their respective age groups living below the poverty level.
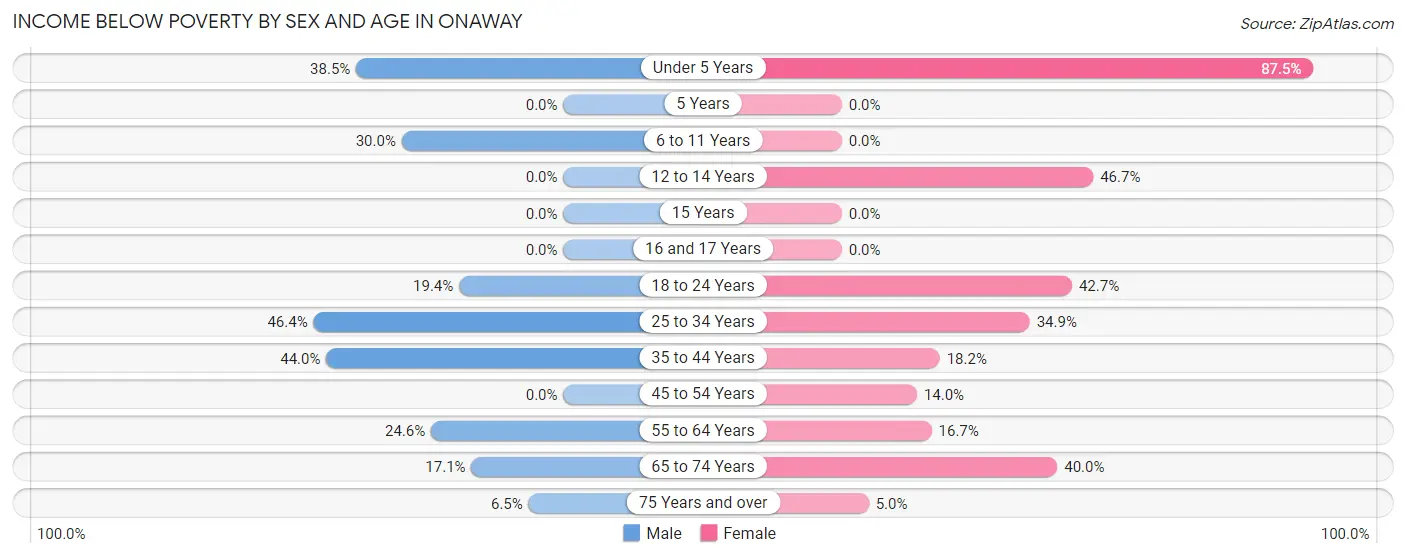
| Age Bracket | Male | Female |
| Under 5 Years | 10 (38.5%) | 21 (87.5%) |
| 5 Years | 0 (0.0%) | 0 (0.0%) |
| 6 to 11 Years | 3 (30.0%) | 0 (0.0%) |
| 12 to 14 Years | 0 (0.0%) | 7 (46.7%) |
| 15 Years | 0 (0.0%) | 0 (0.0%) |
| 16 and 17 Years | 0 (0.0%) | 0 (0.0%) |
| 18 to 24 Years | 6 (19.4%) | 47 (42.7%) |
| 25 to 34 Years | 32 (46.4%) | 15 (34.9%) |
| 35 to 44 Years | 11 (44.0%) | 4 (18.2%) |
| 45 to 54 Years | 0 (0.0%) | 6 (14.0%) |
| 55 to 64 Years | 14 (24.6%) | 9 (16.7%) |
| 65 to 74 Years | 7 (17.1%) | 18 (40.0%) |
| 75 Years and over | 2 (6.5%) | 3 (5.0%) |
| Total | 85 (24.0%) | 130 (29.9%) |
Income Above Poverty by Sex and Age in Onaway
According to the poverty statistics in Onaway, males aged 12 to 14 years and females aged 5 years are the age groups that are most secure financially, with 100.0% of males and 100.0% of females in these age groups living above the poverty line.
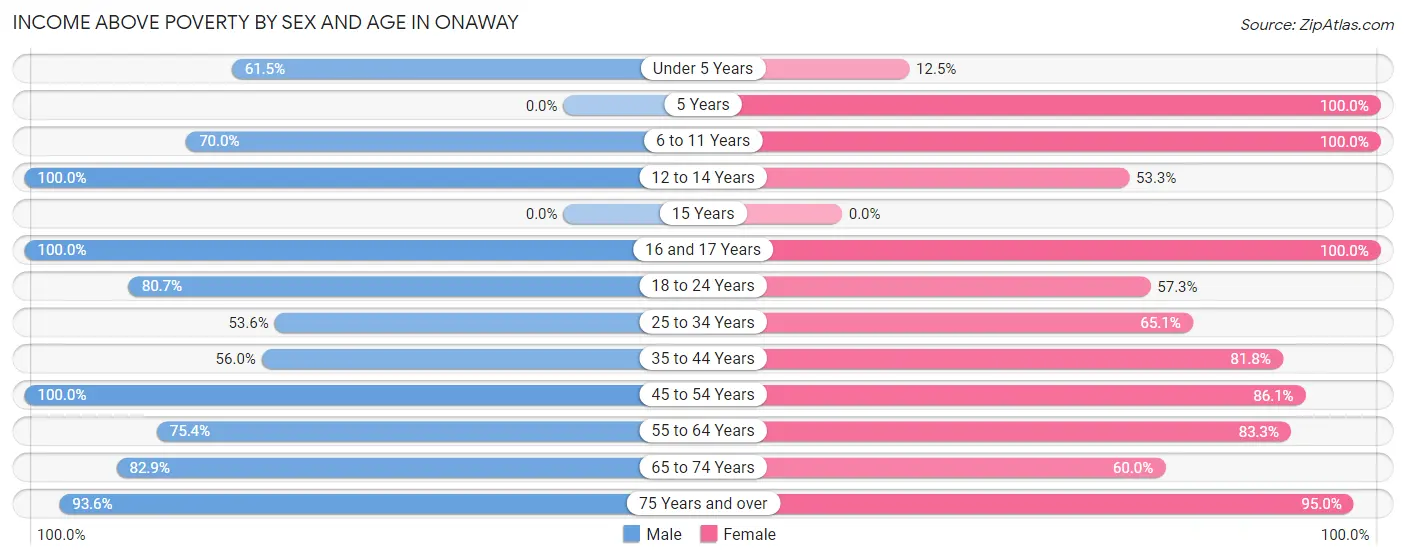
| Age Bracket | Male | Female |
| Under 5 Years | 16 (61.5%) | 3 (12.5%) |
| 5 Years | 0 (0.0%) | 2 (100.0%) |
| 6 to 11 Years | 7 (70.0%) | 7 (100.0%) |
| 12 to 14 Years | 14 (100.0%) | 8 (53.3%) |
| 15 Years | 0 (0.0%) | 0 (0.0%) |
| 16 and 17 Years | 1 (100.0%) | 10 (100.0%) |
| 18 to 24 Years | 25 (80.6%) | 63 (57.3%) |
| 25 to 34 Years | 37 (53.6%) | 28 (65.1%) |
| 35 to 44 Years | 14 (56.0%) | 18 (81.8%) |
| 45 to 54 Years | 49 (100.0%) | 37 (86.1%) |
| 55 to 64 Years | 43 (75.4%) | 45 (83.3%) |
| 65 to 74 Years | 34 (82.9%) | 27 (60.0%) |
| 75 Years and over | 29 (93.5%) | 57 (95.0%) |
| Total | 269 (76.0%) | 305 (70.1%) |
Income Below Poverty Among Married-Couple Families in Onaway
The poverty statistics for married-couple families in Onaway show that 4.6% or 6 of the total 131 families live below the poverty line. Families with no children have the highest poverty rate of 6.9%, comprising of 6 families. On the other hand, families with 1 or 2 children have the lowest poverty rate of 0.0%, which includes 0 families.
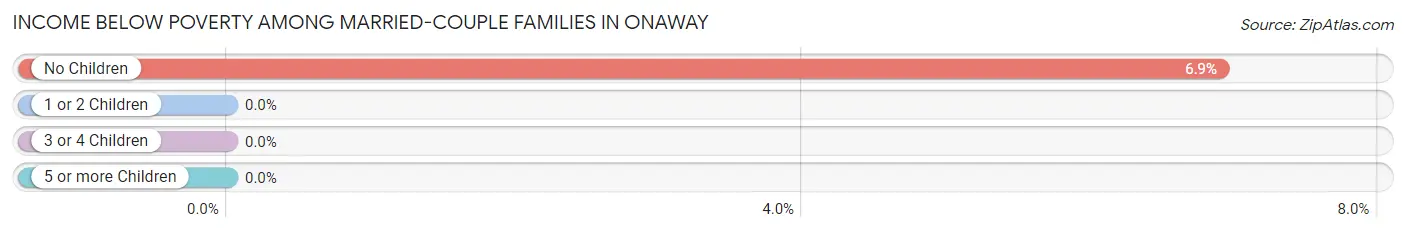
| Children | Above Poverty | Below Poverty |
| No Children | 81 (93.1%) | 6 (6.9%) |
| 1 or 2 Children | 37 (100.0%) | 0 (0.0%) |
| 3 or 4 Children | 7 (100.0%) | 0 (0.0%) |
| 5 or more Children | 0 (0.0%) | 0 (0.0%) |
| Total | 125 (95.4%) | 6 (4.6%) |
Income Below Poverty Among Single-Parent Households in Onaway
According to the poverty data in Onaway, 64.1% or 25 single-father households and 77.1% or 27 single-mother households are living below the poverty line. Among single-father households, those with 1 or 2 children have the highest poverty rate, with 25 households (86.2%) experiencing poverty. Likewise, among single-mother households, those with 1 or 2 children have the highest poverty rate, with 27 households (77.1%) falling below the poverty line.
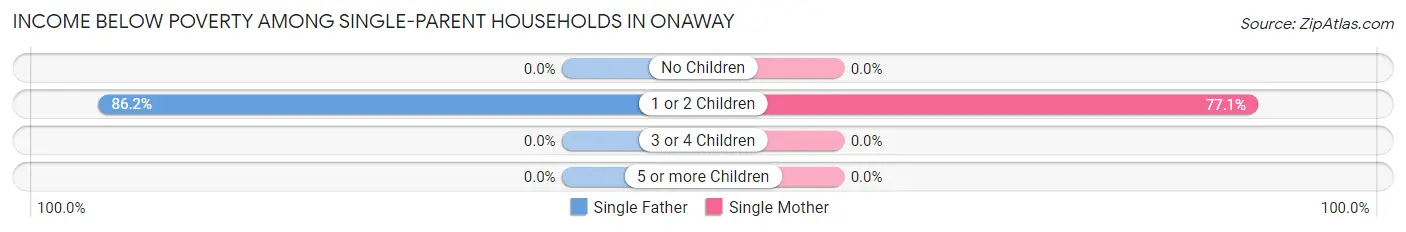
| Children | Single Father | Single Mother |
| No Children | 0 (0.0%) | 0 (0.0%) |
| 1 or 2 Children | 25 (86.2%) | 27 (77.1%) |
| 3 or 4 Children | 0 (0.0%) | 0 (0.0%) |
| 5 or more Children | 0 (0.0%) | 0 (0.0%) |
| Total | 25 (64.1%) | 27 (77.1%) |
Income Below Poverty Among Married-Couple vs Single-Parent Households in Onaway
The poverty data for Onaway shows that 6 of the married-couple family households (4.6%) and 52 of the single-parent households (70.3%) are living below the poverty level. Within the married-couple family households, those with no children have the highest poverty rate, with 6 households (6.9%) falling below the poverty line. Among the single-parent households, those with 1 or 2 children have the highest poverty rate, with 52 household (81.2%) living below poverty.
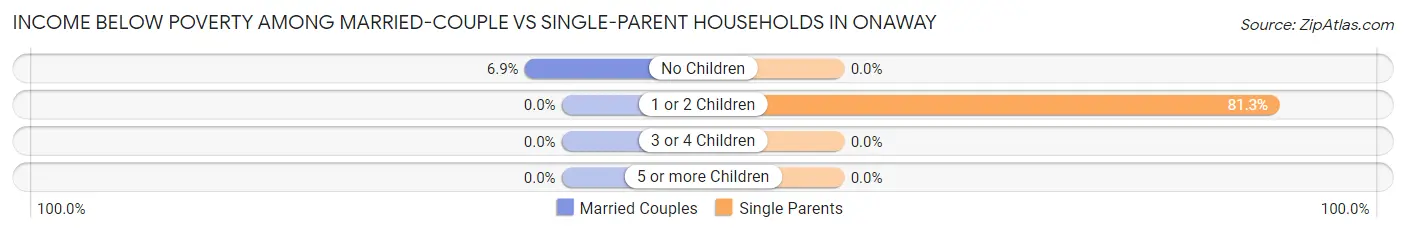
| Children | Married-Couple Families | Single-Parent Households |
| No Children | 6 (6.9%) | 0 (0.0%) |
| 1 or 2 Children | 0 (0.0%) | 52 (81.2%) |
| 3 or 4 Children | 0 (0.0%) | 0 (0.0%) |
| 5 or more Children | 0 (0.0%) | 0 (0.0%) |
| Total | 6 (4.6%) | 52 (70.3%) |
Race in Onaway
The most populous races in Onaway are White / Caucasian (718 | 88.3%), Two or more Races (67 | 8.2%), and Hispanic or Latino (38 | 4.7%).
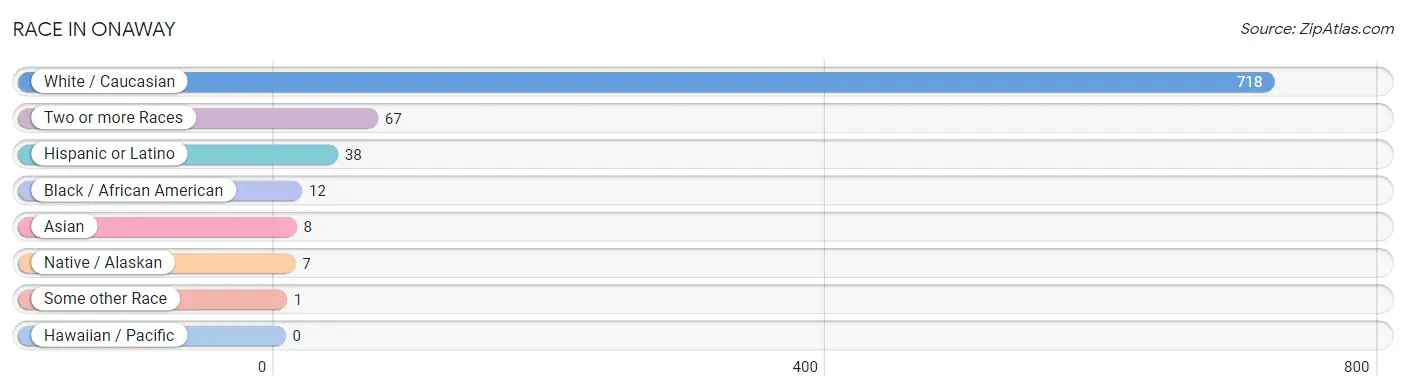
| Race | # Population | % Population |
| Asian | 8 | 1.0% |
| Black / African American | 12 | 1.5% |
| Hawaiian / Pacific | 0 | 0.0% |
| Hispanic or Latino | 38 | 4.7% |
| Native / Alaskan | 7 | 0.9% |
| White / Caucasian | 718 | 88.3% |
| Two or more Races | 67 | 8.2% |
| Some other Race | 1 | 0.1% |
| Total | 813 | 100.0% |
Ancestry in Onaway
The most populous ancestries reported in Onaway are German (183 | 22.5%), Irish (126 | 15.5%), American (116 | 14.3%), English (106 | 13.0%), and French (58 | 7.1%), together accounting for 72.4% of all Onaway residents.
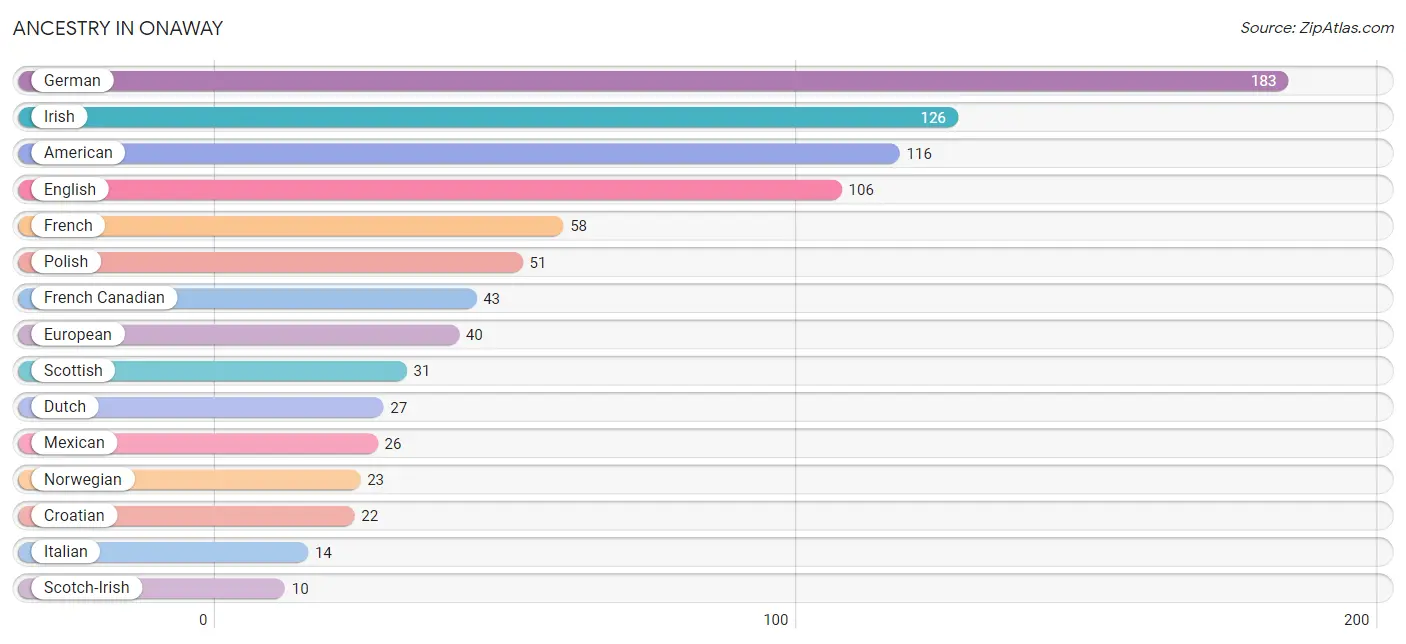
| Ancestry | # Population | % Population |
| American | 116 | 14.3% |
| Blackfeet | 1 | 0.1% |
| Canadian | 5 | 0.6% |
| Cherokee | 7 | 0.9% |
| Chippewa | 6 | 0.7% |
| Croatian | 22 | 2.7% |
| Cuban | 5 | 0.6% |
| Danish | 3 | 0.4% |
| Dutch | 27 | 3.3% |
| Eastern European | 4 | 0.5% |
| English | 106 | 13.0% |
| European | 40 | 4.9% |
| French | 58 | 7.1% |
| French Canadian | 43 | 5.3% |
| German | 183 | 22.5% |
| Hungarian | 7 | 0.9% |
| Irish | 126 | 15.5% |
| Italian | 14 | 1.7% |
| Korean | 8 | 1.0% |
| Mexican | 26 | 3.2% |
| Norwegian | 23 | 2.8% |
| Ottawa | 5 | 0.6% |
| Pakistani | 3 | 0.4% |
| Polish | 51 | 6.3% |
| Scandinavian | 2 | 0.3% |
| Scotch-Irish | 10 | 1.2% |
| Scottish | 31 | 3.8% | View All 27 Rows |
Immigrants in Onaway
The most numerous immigrant groups reported in Onaway came from Asia (5 | 0.6%), Europe (5 | 0.6%), Philippines (5 | 0.6%), South Eastern Asia (5 | 0.6%), and Denmark (3 | 0.4%), together accounting for 2.8% of all Onaway residents.
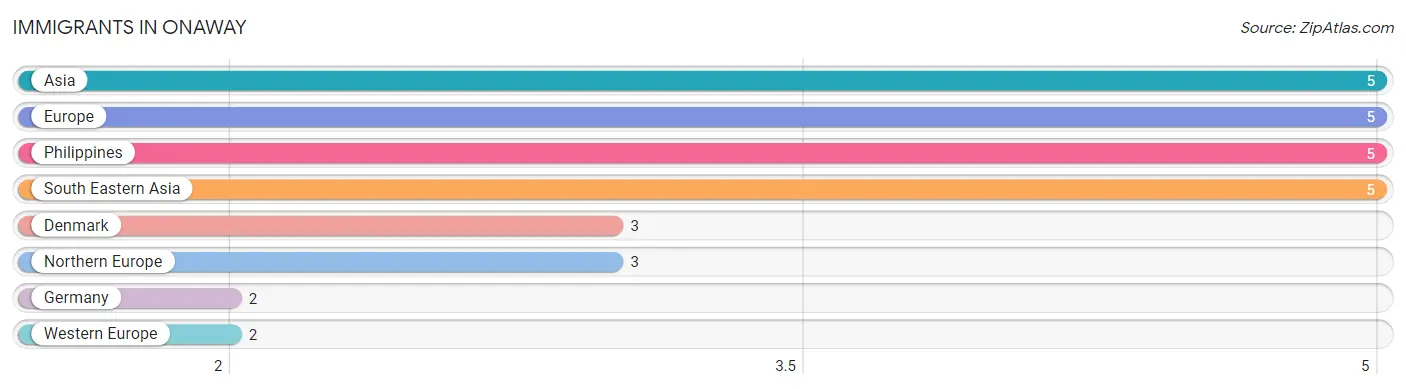
| Immigration Origin | # Population | % Population |
| Asia | 5 | 0.6% |
| Denmark | 3 | 0.4% |
| Europe | 5 | 0.6% |
| Germany | 2 | 0.3% |
| Northern Europe | 3 | 0.4% |
| Philippines | 5 | 0.6% |
| South Eastern Asia | 5 | 0.6% |
| Western Europe | 2 | 0.3% | View All 8 Rows |
Sex and Age in Onaway
Sex and Age in Onaway
The most populous age groups in Onaway are 25 to 29 Years (50 | 13.6%) for men and 20 to 24 Years (102 | 23.0%) for women.
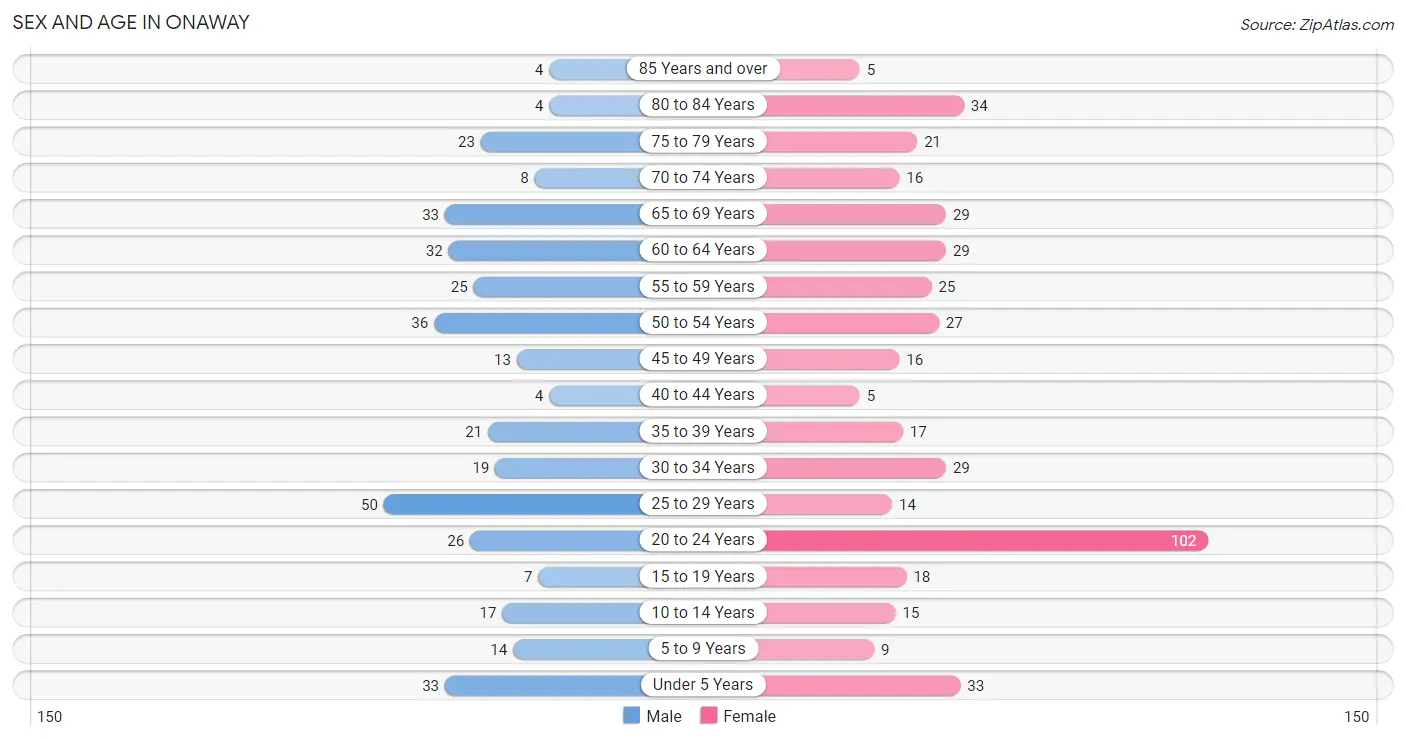
| Age Bracket | Male | Female |
| Under 5 Years | 33 (8.9%) | 33 (7.4%) |
| 5 to 9 Years | 14 (3.8%) | 9 (2.0%) |
| 10 to 14 Years | 17 (4.6%) | 15 (3.4%) |
| 15 to 19 Years | 7 (1.9%) | 18 (4.1%) |
| 20 to 24 Years | 26 (7.0%) | 102 (23.0%) |
| 25 to 29 Years | 50 (13.6%) | 14 (3.2%) |
| 30 to 34 Years | 19 (5.1%) | 29 (6.5%) |
| 35 to 39 Years | 21 (5.7%) | 17 (3.8%) |
| 40 to 44 Years | 4 (1.1%) | 5 (1.1%) |
| 45 to 49 Years | 13 (3.5%) | 16 (3.6%) |
| 50 to 54 Years | 36 (9.8%) | 27 (6.1%) |
| 55 to 59 Years | 25 (6.8%) | 25 (5.6%) |
| 60 to 64 Years | 32 (8.7%) | 29 (6.5%) |
| 65 to 69 Years | 33 (8.9%) | 29 (6.5%) |
| 70 to 74 Years | 8 (2.2%) | 16 (3.6%) |
| 75 to 79 Years | 23 (6.2%) | 21 (4.7%) |
| 80 to 84 Years | 4 (1.1%) | 34 (7.7%) |
| 85 Years and over | 4 (1.1%) | 5 (1.1%) |
| Total | 369 (100.0%) | 444 (100.0%) |
Families and Households in Onaway
Median Family Size in Onaway
The median family size in Onaway is 2.46 persons per family, with married-couple families (131 | 63.9%) accounting for the largest median family size of 2.76 persons per family. On the other hand, single female/mother families (35 | 17.1%) represent the smallest median family size with 1.66 persons per family.
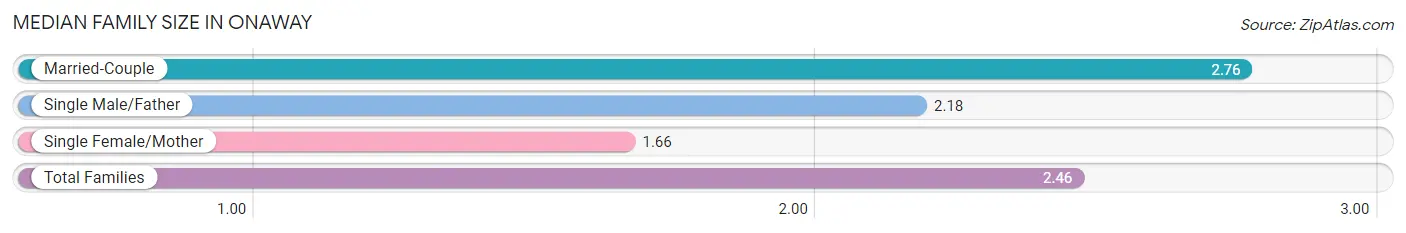
| Family Type | # Families | Family Size |
| Married-Couple | 131 (63.9%) | 2.76 |
| Single Male/Father | 39 (19.0%) | 2.18 |
| Single Female/Mother | 35 (17.1%) | 1.66 |
| Total Families | 205 (100.0%) | 2.46 |
Median Household Size in Onaway
The median household size in Onaway is 1.99 persons per household, with single male/father households (39 | 9.6%) accounting for the largest median household size of 3.31 persons per household. non-family households (200 | 49.4%) represent the smallest median household size with 1.12 persons per household.
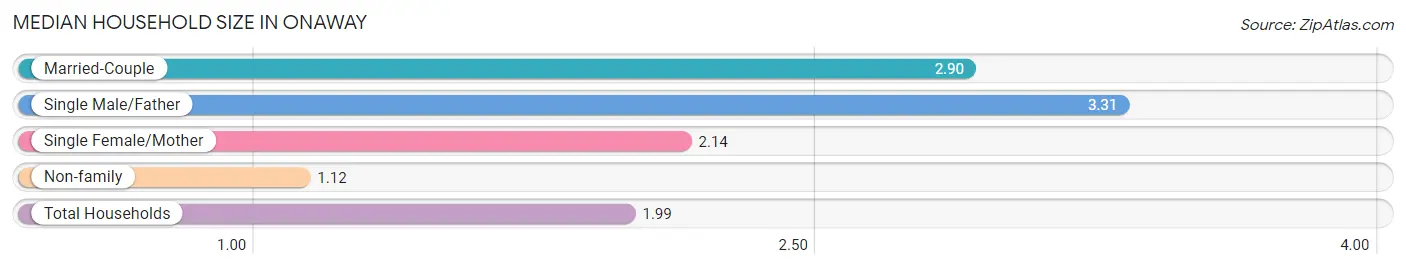
| Household Type | # Households | Household Size |
| Married-Couple | 131 (32.4%) | 2.90 |
| Single Male/Father | 39 (9.6%) | 3.31 |
| Single Female/Mother | 35 (8.6%) | 2.14 |
| Non-family | 200 (49.4%) | 1.12 |
| Total Households | 405 (100.0%) | 1.99 |
Household Size by Marriage Status in Onaway
Out of a total of 405 households in Onaway, 205 (50.6%) are family households, while 200 (49.4%) are nonfamily households. The most numerous type of family households are 2-person households, comprising 72, and the most common type of nonfamily households are 1-person households, comprising 167.
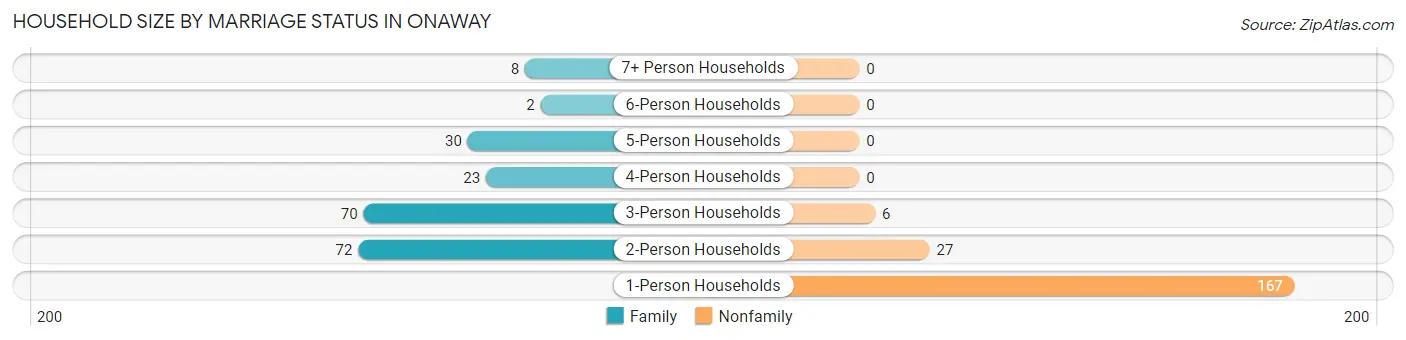
| Household Size | Family Households | Nonfamily Households |
| 1-Person Households | - | 167 (41.2%) |
| 2-Person Households | 72 (17.8%) | 27 (6.7%) |
| 3-Person Households | 70 (17.3%) | 6 (1.5%) |
| 4-Person Households | 23 (5.7%) | 0 (0.0%) |
| 5-Person Households | 30 (7.4%) | 0 (0.0%) |
| 6-Person Households | 2 (0.5%) | 0 (0.0%) |
| 7+ Person Households | 8 (2.0%) | 0 (0.0%) |
| Total | 205 (50.6%) | 200 (49.4%) |
Female Fertility in Onaway
Fertility by Age in Onaway
| Age Bracket | Women with Births | Births / 1,000 Women |
| 15 to 19 years | 0 (0.0%) | 0.0 |
| 20 to 34 years | 0 (0.0%) | 0.0 |
| 35 to 50 years | 0 (0.0%) | 0.0 |
| Total | 0 (0.0%) | 0.0 |
Fertility by Age by Marriage Status in Onaway
| Age Bracket | Married | Unmarried |
| 15 to 19 years | 0 (0.0%) | 0 (0.0%) |
| 20 to 34 years | 0 (0.0%) | 0 (0.0%) |
| 35 to 50 years | 0 (0.0%) | 0 (0.0%) |
| Total | 0 (0.0%) | 0 (0.0%) |
Fertility by Education in Onaway
| Educational Attainment | Women with Births | Births / 1,000 Women |
| Less than High School | 0 (0.0%) | 0.0 |
| High School Diploma | 0 (0.0%) | 0.0 |
| College or Associate's Degree | 0 (0.0%) | 0.0 |
| Bachelor's Degree | 0 (0.0%) | 0.0 |
| Graduate Degree | 0 (0.0%) | 0.0 |
| Total | 0 (0.0%) | 0.0 |
Fertility by Education by Marriage Status in Onaway
| Educational Attainment | Married | Unmarried |
| Less than High School | 0 (0.0%) | 0 (0.0%) |
| High School Diploma | 0 (0.0%) | 0 (0.0%) |
| College or Associate's Degree | 0 (0.0%) | 0 (0.0%) |
| Bachelor's Degree | 0 (0.0%) | 0 (0.0%) |
| Graduate Degree | 0 (0.0%) | 0 (0.0%) |
| Total | 0 (0.0%) | 0 (0.0%) |
Employment Characteristics in Onaway
Employment by Class of Employer in Onaway
Among the 272 employed individuals in Onaway, private company employees (180 | 66.2%), local government employees (36 | 13.2%), and not-for-profit organizations (24 | 8.8%) make up the most common classes of employment.
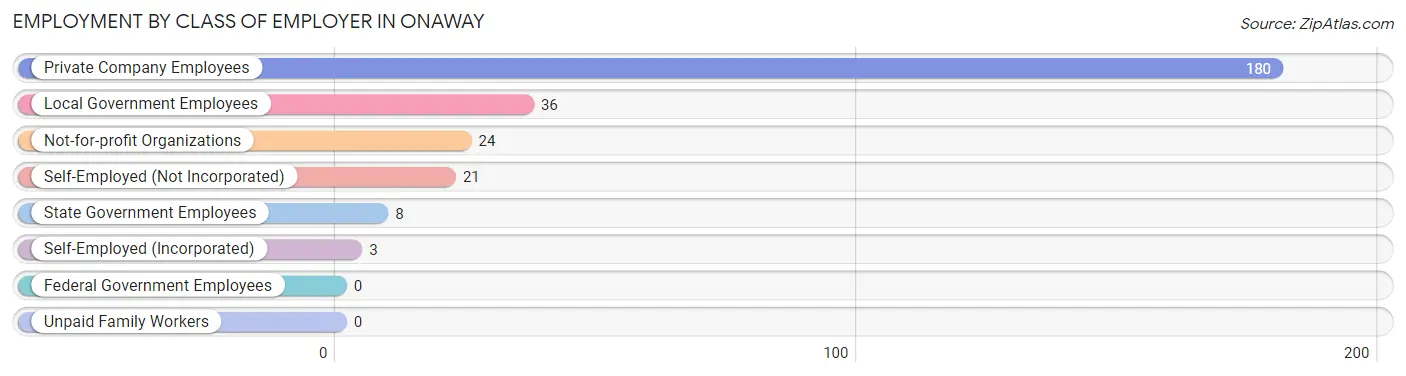
| Employer Class | # Employees | % Employees |
| Private Company Employees | 180 | 66.2% |
| Self-Employed (Incorporated) | 3 | 1.1% |
| Self-Employed (Not Incorporated) | 21 | 7.7% |
| Not-for-profit Organizations | 24 | 8.8% |
| Local Government Employees | 36 | 13.2% |
| State Government Employees | 8 | 2.9% |
| Federal Government Employees | 0 | 0.0% |
| Unpaid Family Workers | 0 | 0.0% |
| Total | 272 | 100.0% |
Employment Status by Age in Onaway
According to the labor force statistics for Onaway, out of the total population over 16 years of age (692), 47.4% or 328 individuals are in the labor force, with 13.7% or 45 of them unemployed. The age group with the highest labor force participation rate is 45 to 54 years, with 89.1% or 82 individuals in the labor force. Within the labor force, the 25 to 29 years age range has the highest percentage of unemployed individuals, with 53.2% or 25 of them being unemployed.
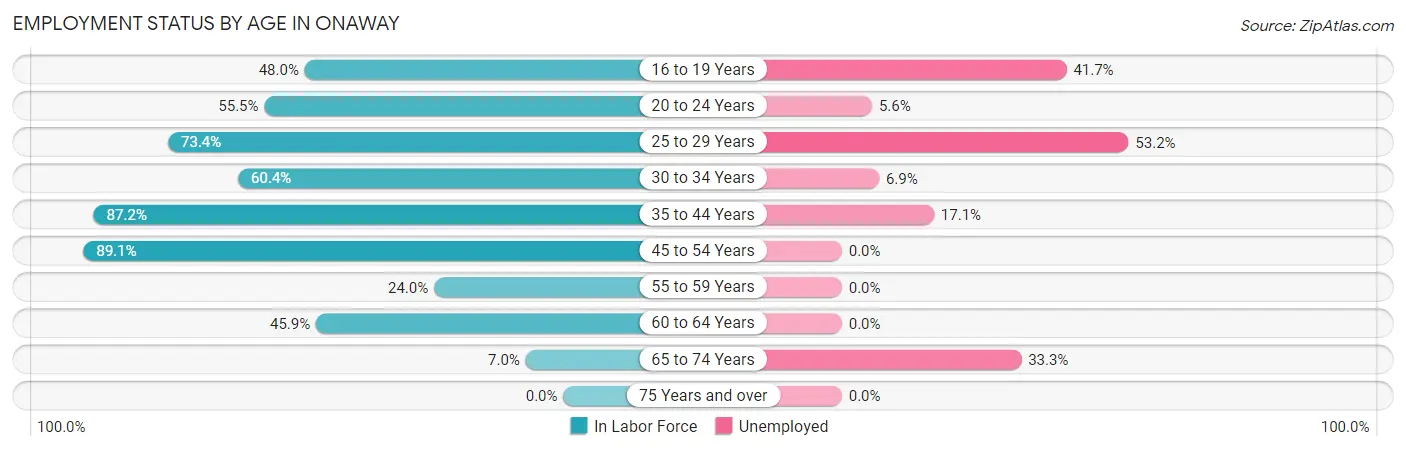
| Age Bracket | In Labor Force | Unemployed |
| 16 to 19 Years | 12 (48.0%) | 5 (41.7%) |
| 20 to 24 Years | 71 (55.5%) | 4 (5.6%) |
| 25 to 29 Years | 47 (73.4%) | 25 (53.2%) |
| 30 to 34 Years | 29 (60.4%) | 2 (6.9%) |
| 35 to 44 Years | 41 (87.2%) | 7 (17.1%) |
| 45 to 54 Years | 82 (89.1%) | 0 (0.0%) |
| 55 to 59 Years | 12 (24.0%) | 0 (0.0%) |
| 60 to 64 Years | 28 (45.9%) | 0 (0.0%) |
| 65 to 74 Years | 6 (7.0%) | 2 (33.3%) |
| 75 Years and over | 0 (0.0%) | 0 (0.0%) |
| Total | 328 (47.4%) | 45 (13.7%) |
Employment Status by Educational Attainment in Onaway
According to labor force statistics for Onaway, 66.0% of individuals (239) out of the total population between 25 and 64 years of age (362) are in the labor force, with 14.2% or 34 of them being unemployed. The group with the highest labor force participation rate are those with the educational attainment of bachelor's degree or higher, with 94.4% or 34 individuals in the labor force. Within the labor force, individuals with less than high school education have the highest percentage of unemployment, with 26.7% or 4 of them being unemployed.
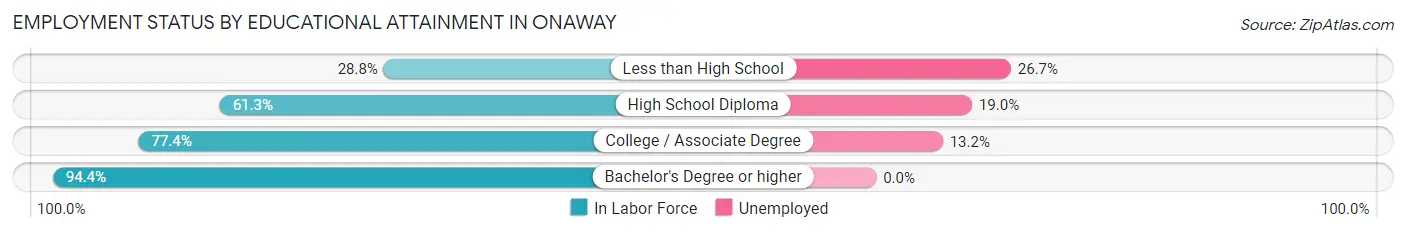
| Educational Attainment | In Labor Force | Unemployed |
| Less than High School | 15 (28.8%) | 14 (26.7%) |
| High School Diploma | 84 (61.3%) | 26 (19.0%) |
| College / Associate Degree | 106 (77.4%) | 18 (13.2%) |
| Bachelor's Degree or higher | 34 (94.4%) | 0 (0.0%) |
| Total | 239 (66.0%) | 51 (14.2%) |
Employment Occupations by Sex in Onaway
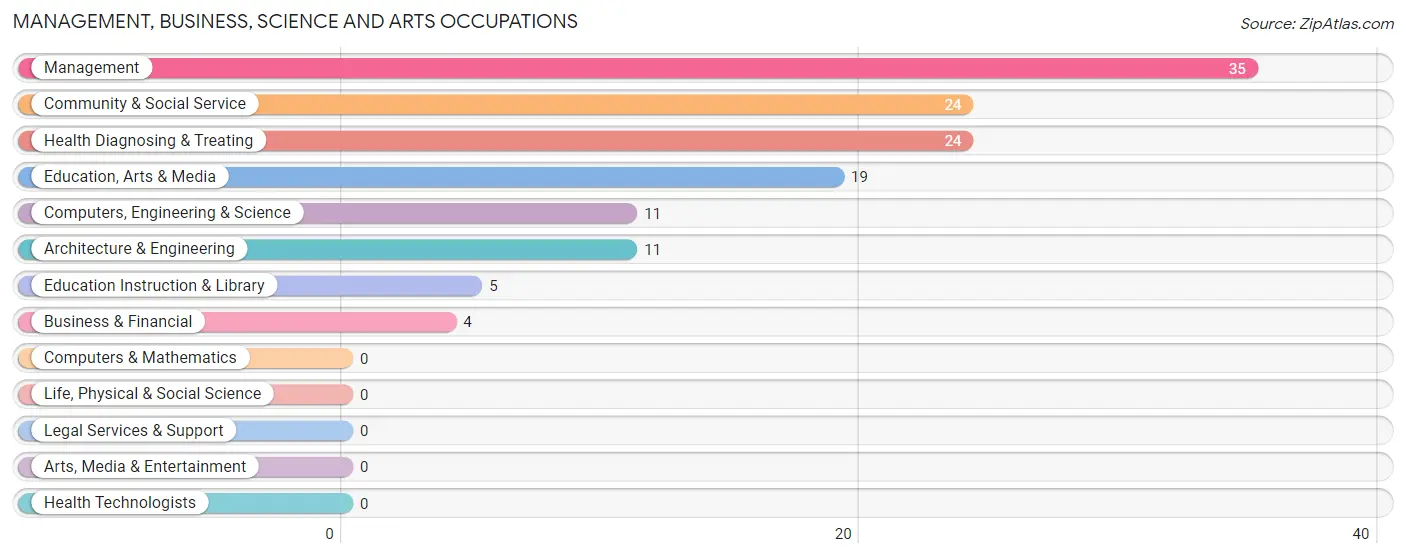
Management, Business, Science and Arts Occupations
The most common Management, Business, Science and Arts occupations in Onaway are Management (35 | 12.4%), Community & Social Service (24 | 8.5%), Health Diagnosing & Treating (24 | 8.5%), Education, Arts & Media (19 | 6.7%), and Computers, Engineering & Science (11 | 3.9%).
Management, Business, Science and Arts Occupations by Sex
Within the Management, Business, Science and Arts occupations in Onaway, the most male-oriented occupations are Business & Financial (100.0%), Computers, Engineering & Science (81.8%), and Architecture & Engineering (81.8%), while the most female-oriented occupations are Education Instruction & Library (100.0%), Health Diagnosing & Treating (91.7%), and Community & Social Service (62.5%).
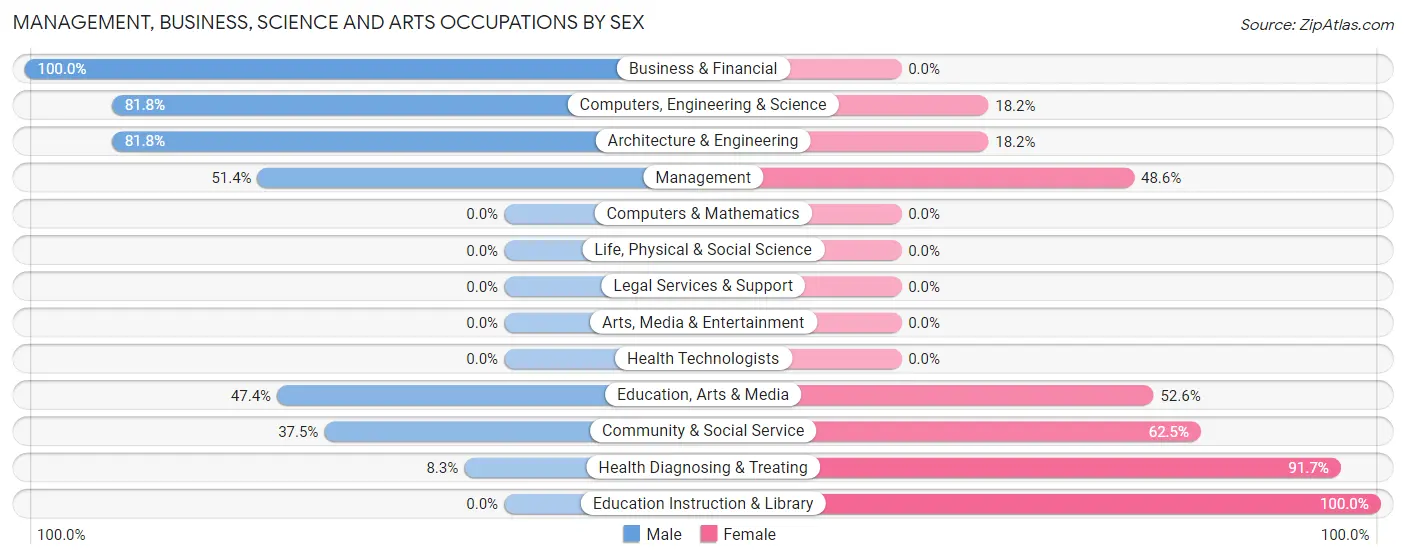
| Occupation | Male | Female |
| Management | 18 (51.4%) | 17 (48.6%) |
| Business & Financial | 4 (100.0%) | 0 (0.0%) |
| Computers, Engineering & Science | 9 (81.8%) | 2 (18.2%) |
| Computers & Mathematics | 0 (0.0%) | 0 (0.0%) |
| Architecture & Engineering | 9 (81.8%) | 2 (18.2%) |
| Life, Physical & Social Science | 0 (0.0%) | 0 (0.0%) |
| Community & Social Service | 9 (37.5%) | 15 (62.5%) |
| Education, Arts & Media | 9 (47.4%) | 10 (52.6%) |
| Legal Services & Support | 0 (0.0%) | 0 (0.0%) |
| Education Instruction & Library | 0 (0.0%) | 5 (100.0%) |
| Arts, Media & Entertainment | 0 (0.0%) | 0 (0.0%) |
| Health Diagnosing & Treating | 2 (8.3%) | 22 (91.7%) |
| Health Technologists | 0 (0.0%) | 0 (0.0%) |
| Total (Category) | 42 (42.9%) | 56 (57.1%) |
| Total (Overall) | 123 (43.5%) | 160 (56.5%) |
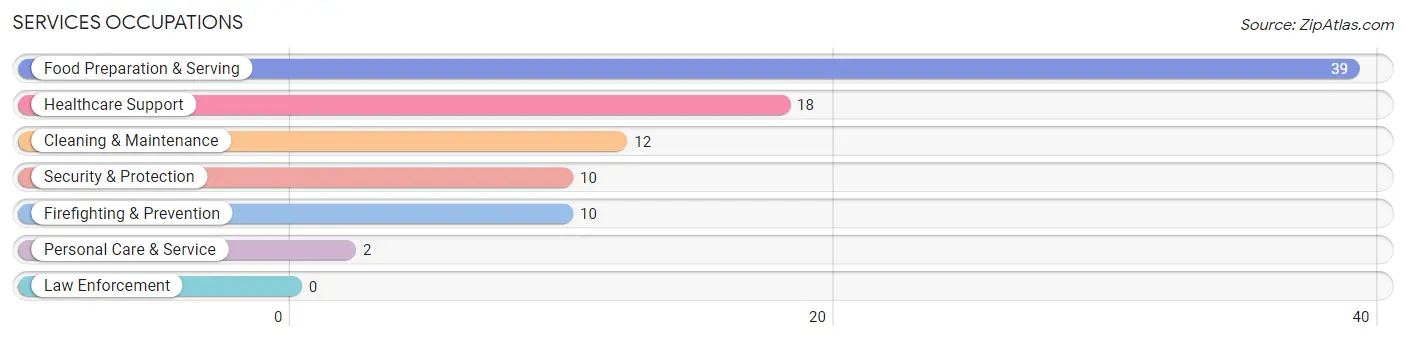
Services Occupations
The most common Services occupations in Onaway are Food Preparation & Serving (39 | 13.8%), Healthcare Support (18 | 6.4%), Cleaning & Maintenance (12 | 4.2%), Security & Protection (10 | 3.5%), and Firefighting & Prevention (10 | 3.5%).
Services Occupations by Sex
Within the Services occupations in Onaway, the most male-oriented occupations are Cleaning & Maintenance (75.0%), Security & Protection (70.0%), and Firefighting & Prevention (70.0%), while the most female-oriented occupations are Healthcare Support (100.0%), Food Preparation & Serving (100.0%), and Personal Care & Service (100.0%).
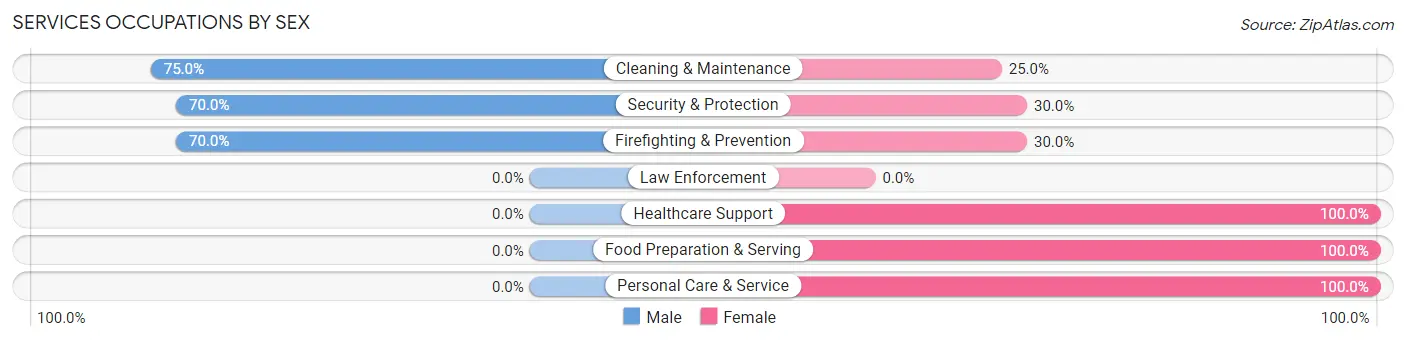
| Occupation | Male | Female |
| Healthcare Support | 0 (0.0%) | 18 (100.0%) |
| Security & Protection | 7 (70.0%) | 3 (30.0%) |
| Firefighting & Prevention | 7 (70.0%) | 3 (30.0%) |
| Law Enforcement | 0 (0.0%) | 0 (0.0%) |
| Food Preparation & Serving | 0 (0.0%) | 39 (100.0%) |
| Cleaning & Maintenance | 9 (75.0%) | 3 (25.0%) |
| Personal Care & Service | 0 (0.0%) | 2 (100.0%) |
| Total (Category) | 16 (19.8%) | 65 (80.2%) |
| Total (Overall) | 123 (43.5%) | 160 (56.5%) |
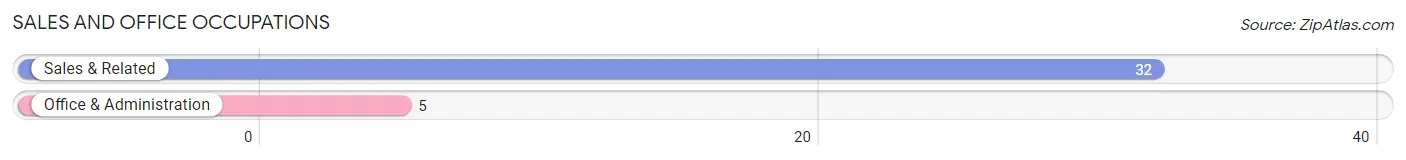
Sales and Office Occupations
The most common Sales and Office occupations in Onaway are Sales & Related (32 | 11.3%), and Office & Administration (5 | 1.8%).
Sales and Office Occupations by Sex
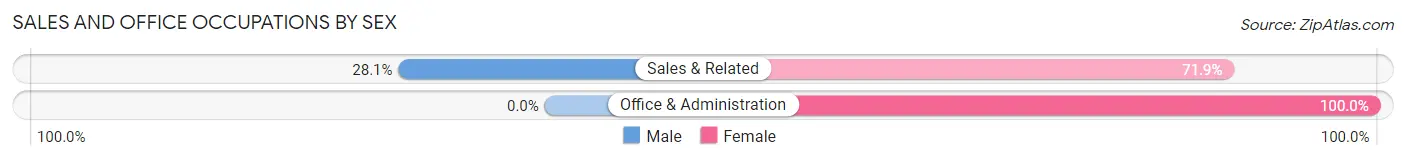
| Occupation | Male | Female |
| Sales & Related | 9 (28.1%) | 23 (71.9%) |
| Office & Administration | 0 (0.0%) | 5 (100.0%) |
| Total (Category) | 9 (24.3%) | 28 (75.7%) |
| Total (Overall) | 123 (43.5%) | 160 (56.5%) |
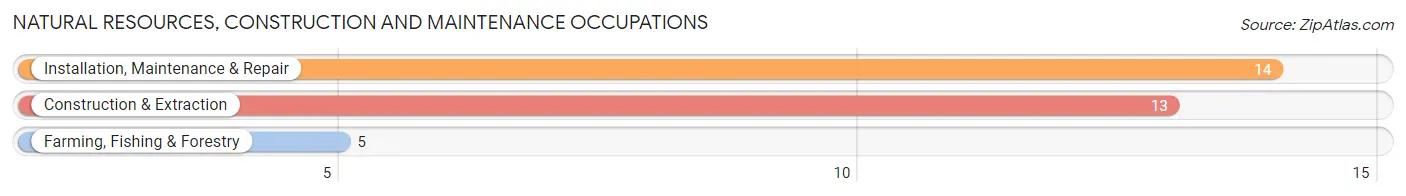
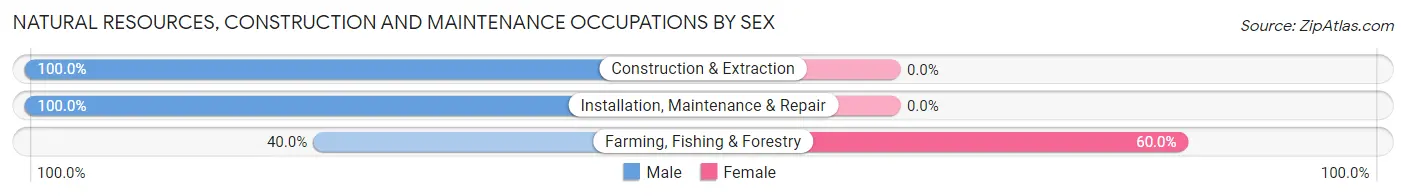
Natural Resources, Construction and Maintenance Occupations
The most common Natural Resources, Construction and Maintenance occupations in Onaway are Installation, Maintenance & Repair (14 | 5.0%), Construction & Extraction (13 | 4.6%), and Farming, Fishing & Forestry (5 | 1.8%).
Natural Resources, Construction and Maintenance Occupations by Sex
| Occupation | Male | Female |
| Farming, Fishing & Forestry | 2 (40.0%) | 3 (60.0%) |
| Construction & Extraction | 13 (100.0%) | 0 (0.0%) |
| Installation, Maintenance & Repair | 14 (100.0%) | 0 (0.0%) |
| Total (Category) | 29 (90.6%) | 3 (9.4%) |
| Total (Overall) | 123 (43.5%) | 160 (56.5%) |
Production, Transportation and Moving Occupations
The most common Production, Transportation and Moving occupations in Onaway are Production (23 | 8.1%), Transportation (9 | 3.2%), and Material Moving (3 | 1.1%).
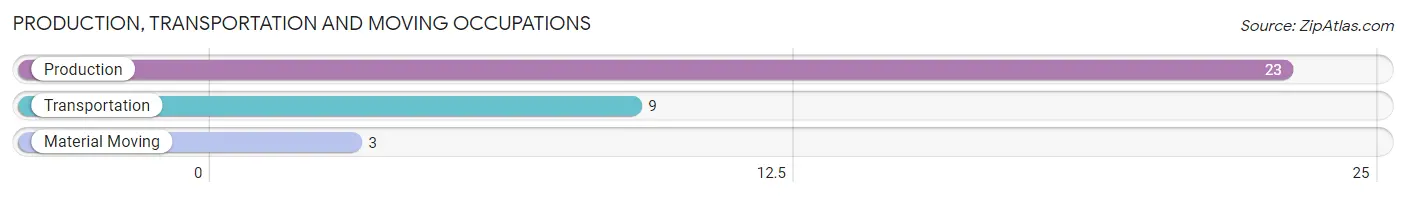
Production, Transportation and Moving Occupations by Sex
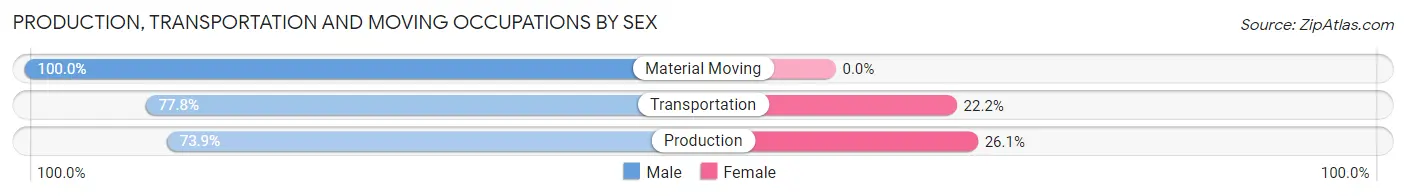
| Occupation | Male | Female |
| Production | 17 (73.9%) | 6 (26.1%) |
| Transportation | 7 (77.8%) | 2 (22.2%) |
| Material Moving | 3 (100.0%) | 0 (0.0%) |
| Total (Category) | 27 (77.1%) | 8 (22.9%) |
| Total (Overall) | 123 (43.5%) | 160 (56.5%) |
Employment Industries by Sex in Onaway
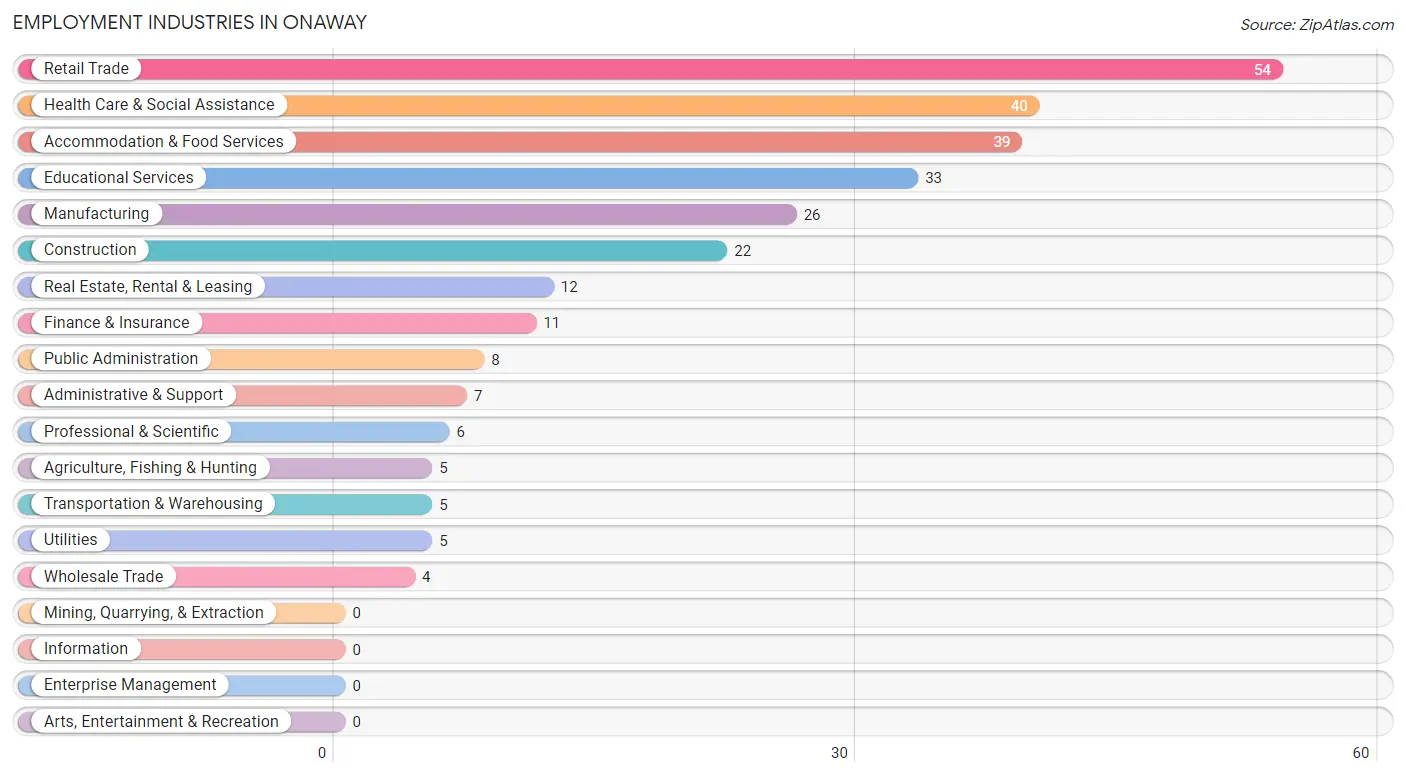
Employment Industries in Onaway
The major employment industries in Onaway include Retail Trade (54 | 19.1%), Health Care & Social Assistance (40 | 14.1%), Accommodation & Food Services (39 | 13.8%), Educational Services (33 | 11.7%), and Manufacturing (26 | 9.2%).
Employment Industries by Sex in Onaway
The Onaway industries that see more men than women are Construction (100.0%), Wholesale Trade (100.0%), and Transportation & Warehousing (100.0%), whereas the industries that tend to have a higher number of women are Accommodation & Food Services (100.0%), Public Administration (100.0%), and Educational Services (93.9%).
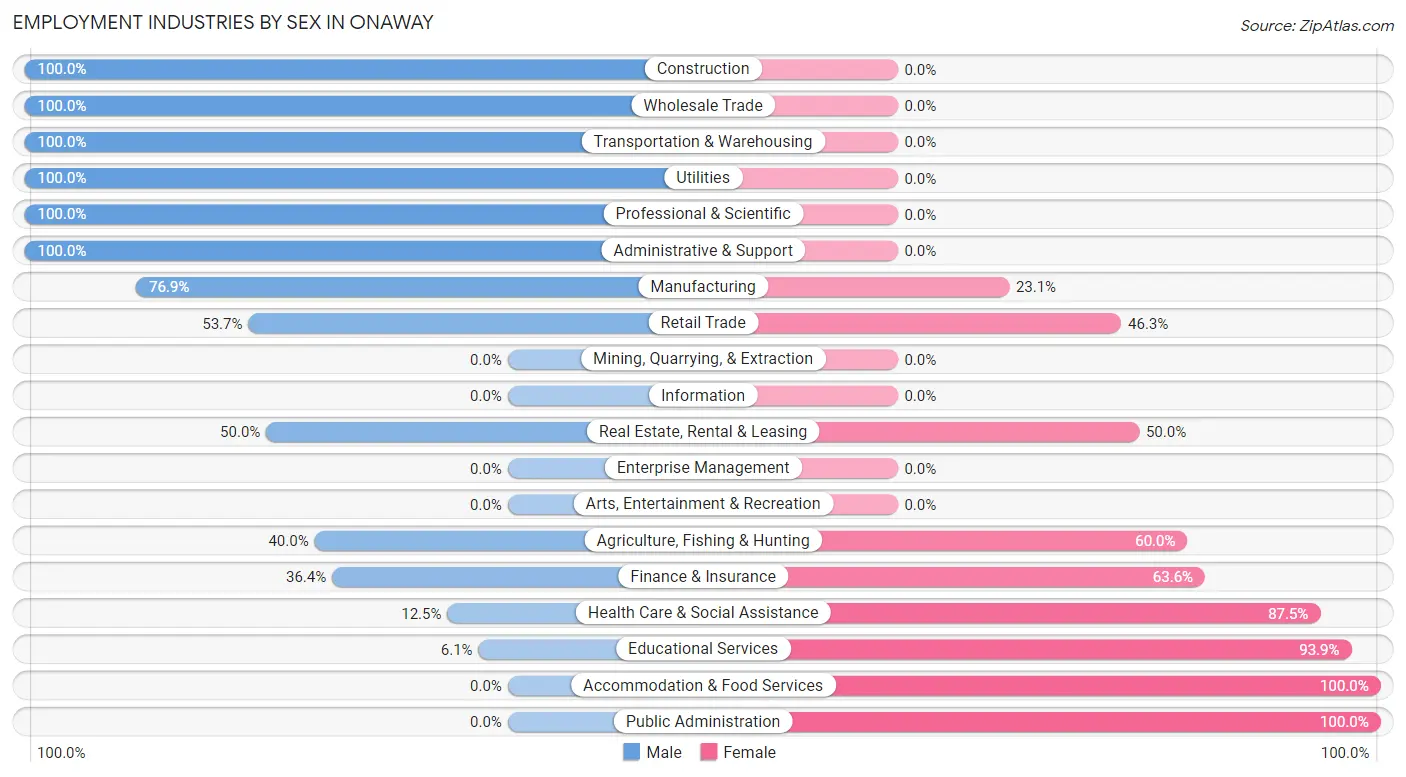
| Industry | Male | Female |
| Agriculture, Fishing & Hunting | 2 (40.0%) | 3 (60.0%) |
| Mining, Quarrying, & Extraction | 0 (0.0%) | 0 (0.0%) |
| Construction | 22 (100.0%) | 0 (0.0%) |
| Manufacturing | 20 (76.9%) | 6 (23.1%) |
| Wholesale Trade | 4 (100.0%) | 0 (0.0%) |
| Retail Trade | 29 (53.7%) | 25 (46.3%) |
| Transportation & Warehousing | 5 (100.0%) | 0 (0.0%) |
| Utilities | 5 (100.0%) | 0 (0.0%) |
| Information | 0 (0.0%) | 0 (0.0%) |
| Finance & Insurance | 4 (36.4%) | 7 (63.6%) |
| Real Estate, Rental & Leasing | 6 (50.0%) | 6 (50.0%) |
| Professional & Scientific | 6 (100.0%) | 0 (0.0%) |
| Enterprise Management | 0 (0.0%) | 0 (0.0%) |
| Administrative & Support | 7 (100.0%) | 0 (0.0%) |
| Educational Services | 2 (6.1%) | 31 (93.9%) |
| Health Care & Social Assistance | 5 (12.5%) | 35 (87.5%) |
| Arts, Entertainment & Recreation | 0 (0.0%) | 0 (0.0%) |
| Accommodation & Food Services | 0 (0.0%) | 39 (100.0%) |
| Public Administration | 0 (0.0%) | 8 (100.0%) |
| Total | 123 (43.5%) | 160 (56.5%) |
Education in Onaway
School Enrollment in Onaway
The most common levels of schooling among the 129 students in Onaway are college / undergraduate (45 | 34.9%), middle school (29 | 22.5%), and high school (21 | 16.3%).
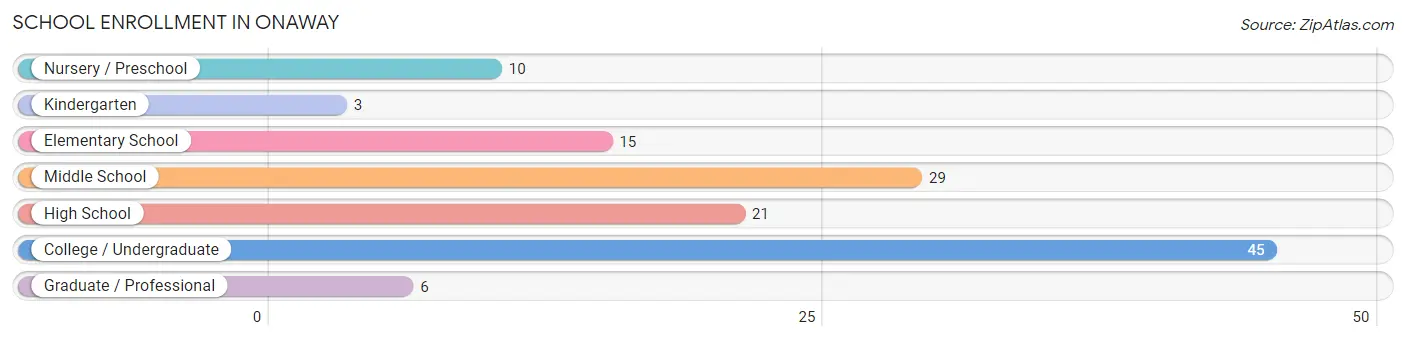
| School Level | # Students | % Students |
| Nursery / Preschool | 10 | 7.7% |
| Kindergarten | 3 | 2.3% |
| Elementary School | 15 | 11.6% |
| Middle School | 29 | 22.5% |
| High School | 21 | 16.3% |
| College / Undergraduate | 45 | 34.9% |
| Graduate / Professional | 6 | 4.6% |
| Total | 129 | 100.0% |
School Enrollment by Age by Funding Source in Onaway
Out of a total of 129 students who are enrolled in schools in Onaway, 37 (28.7%) attend a private institution, while the remaining 92 (71.3%) are enrolled in public schools. The age group of 20 to 24 year olds has the highest likelihood of being enrolled in private schools, with 25 (75.8% in the age bracket) enrolled. Conversely, the age group of 5 to 9 year old has the lowest likelihood of being enrolled in a private school, with 23 (100.0% in the age bracket) attending a public institution.
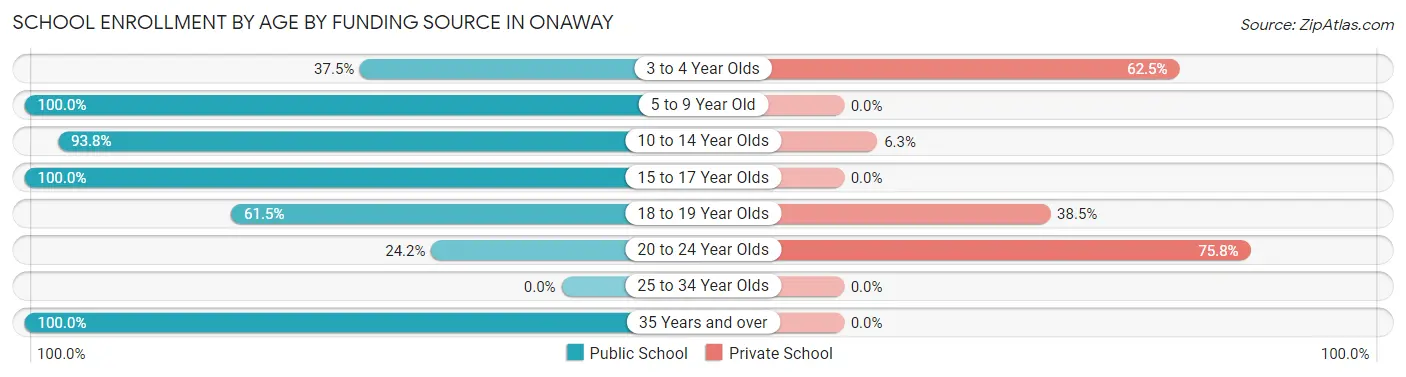
| Age Bracket | Public School | Private School |
| 3 to 4 Year Olds | 3 (37.5%) | 5 (62.5%) |
| 5 to 9 Year Old | 23 (100.0%) | 0 (0.0%) |
| 10 to 14 Year Olds | 30 (93.8%) | 2 (6.2%) |
| 15 to 17 Year Olds | 12 (100.0%) | 0 (0.0%) |
| 18 to 19 Year Olds | 8 (61.5%) | 5 (38.5%) |
| 20 to 24 Year Olds | 8 (24.2%) | 25 (75.8%) |
| 25 to 34 Year Olds | 0 (0.0%) | 0 (0.0%) |
| 35 Years and over | 8 (100.0%) | 0 (0.0%) |
| Total | 92 (71.3%) | 37 (28.7%) |
Educational Attainment by Field of Study in Onaway
Business (10 | 22.7%), arts & humanities (10 | 22.7%), liberal arts & history (8 | 18.2%), bio, nature & agricultural (4 | 9.1%), and education (4 | 9.1%) are the most common fields of study among 44 individuals in Onaway who have obtained a bachelor's degree or higher.
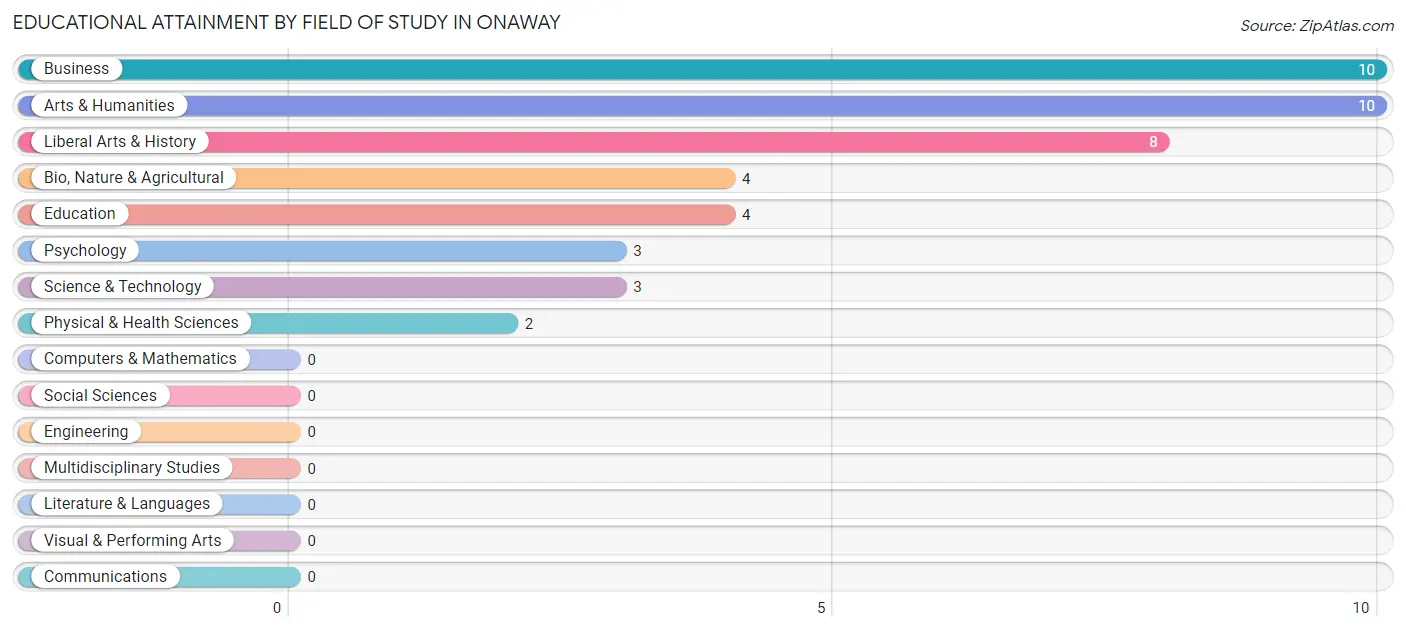
| Field of Study | # Graduates | % Graduates |
| Computers & Mathematics | 0 | 0.0% |
| Bio, Nature & Agricultural | 4 | 9.1% |
| Physical & Health Sciences | 2 | 4.5% |
| Psychology | 3 | 6.8% |
| Social Sciences | 0 | 0.0% |
| Engineering | 0 | 0.0% |
| Multidisciplinary Studies | 0 | 0.0% |
| Science & Technology | 3 | 6.8% |
| Business | 10 | 22.7% |
| Education | 4 | 9.1% |
| Literature & Languages | 0 | 0.0% |
| Liberal Arts & History | 8 | 18.2% |
| Visual & Performing Arts | 0 | 0.0% |
| Communications | 0 | 0.0% |
| Arts & Humanities | 10 | 22.7% |
| Total | 44 | 100.0% |
Transportation & Commute in Onaway
Vehicle Availability by Sex in Onaway
The most prevalent vehicle ownership categories in Onaway are males with 2 vehicles (89, accounting for 73.0%) and females with 2 vehicles (81, making up 59.3%).
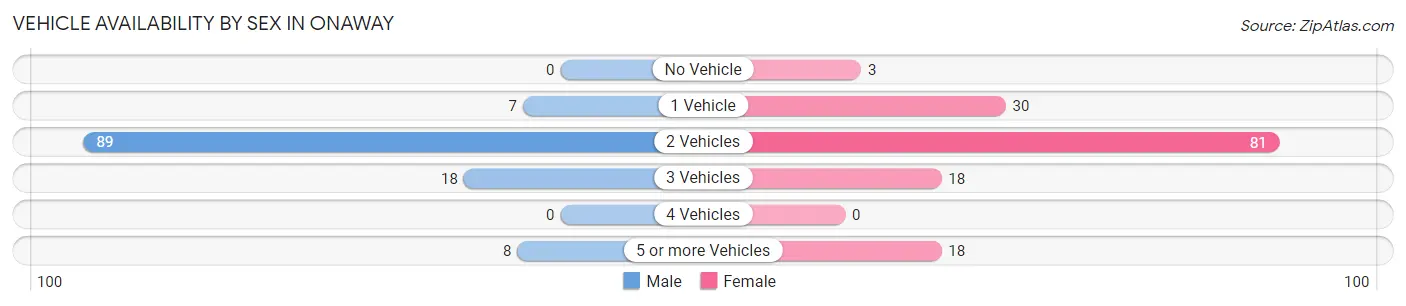
| Vehicles Available | Male | Female |
| No Vehicle | 0 (0.0%) | 3 (2.0%) |
| 1 Vehicle | 7 (5.7%) | 30 (20.0%) |
| 2 Vehicles | 89 (73.0%) | 81 (54.0%) |
| 3 Vehicles | 18 (14.7%) | 18 (12.0%) |
| 4 Vehicles | 0 (0.0%) | 0 (0.0%) |
| 5 or more Vehicles | 8 (6.6%) | 18 (12.0%) |
| Total | 122 (100.0%) | 150 (100.0%) |
Commute Time in Onaway
The most frequently occuring commute durations in Onaway are 5 to 9 minutes (61 commuters, 23.1%), less than 5 minutes (51 commuters, 19.3%), and 45 to 59 minutes (33 commuters, 12.5%).
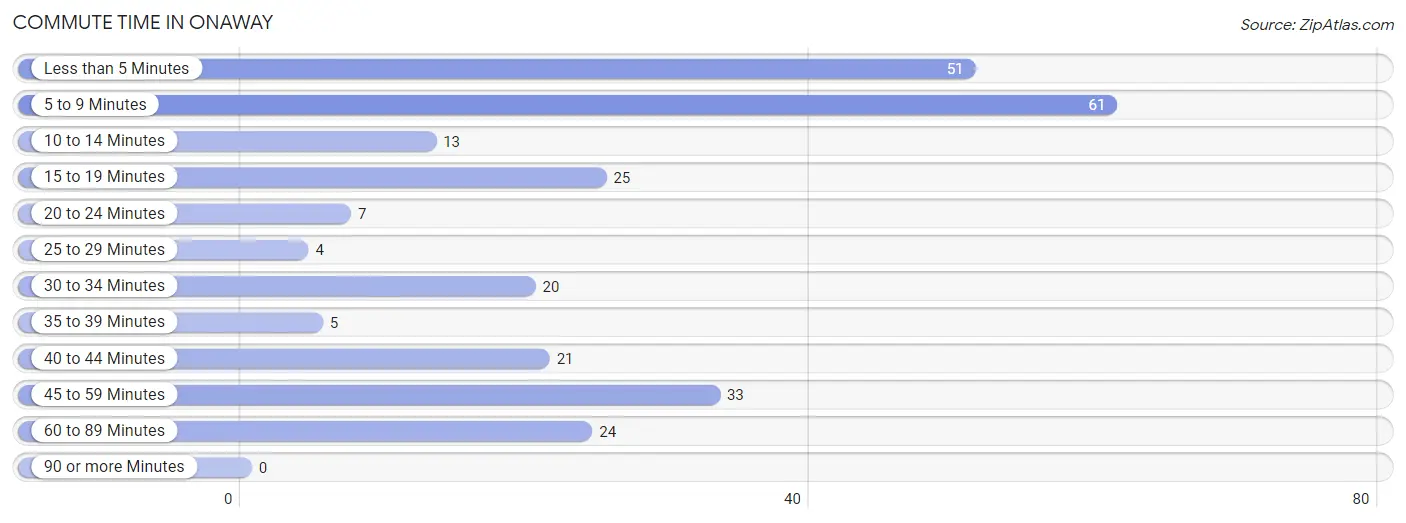
| Commute Time | # Commuters | % Commuters |
| Less than 5 Minutes | 51 | 19.3% |
| 5 to 9 Minutes | 61 | 23.1% |
| 10 to 14 Minutes | 13 | 4.9% |
| 15 to 19 Minutes | 25 | 9.5% |
| 20 to 24 Minutes | 7 | 2.6% |
| 25 to 29 Minutes | 4 | 1.5% |
| 30 to 34 Minutes | 20 | 7.6% |
| 35 to 39 Minutes | 5 | 1.9% |
| 40 to 44 Minutes | 21 | 8.0% |
| 45 to 59 Minutes | 33 | 12.5% |
| 60 to 89 Minutes | 24 | 9.1% |
| 90 or more Minutes | 0 | 0.0% |
Commute Time by Sex in Onaway
The most common commute times in Onaway are 45 to 59 minutes (25 commuters, 21.9%) for males and 5 to 9 minutes (46 commuters, 30.7%) for females.
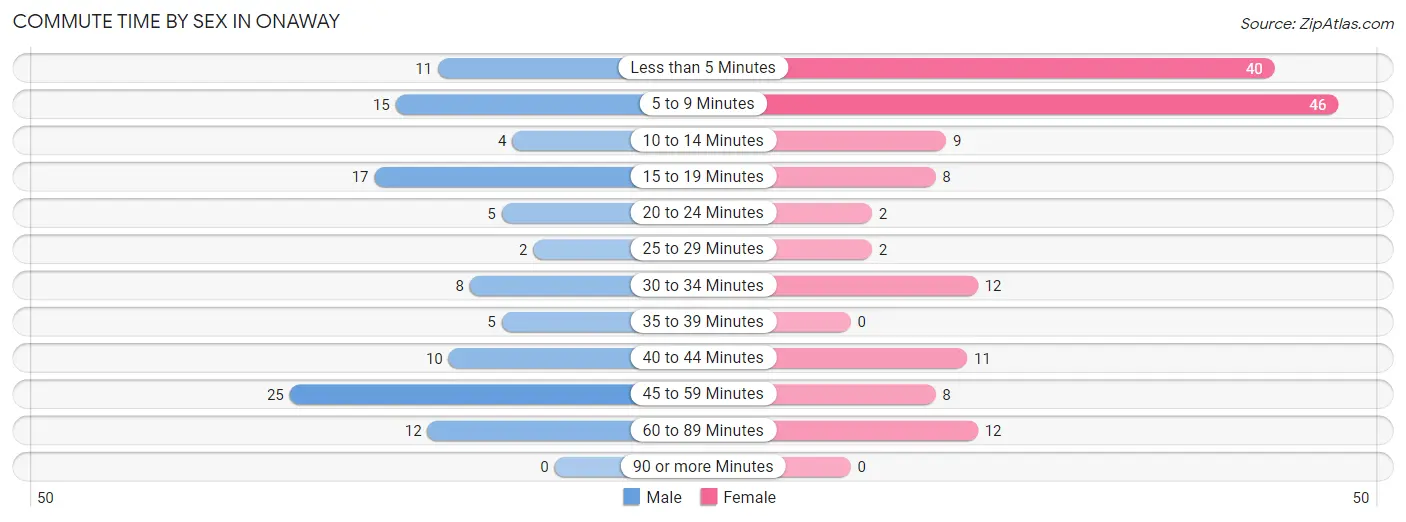
| Commute Time | Male | Female |
| Less than 5 Minutes | 11 (9.7%) | 40 (26.7%) |
| 5 to 9 Minutes | 15 (13.2%) | 46 (30.7%) |
| 10 to 14 Minutes | 4 (3.5%) | 9 (6.0%) |
| 15 to 19 Minutes | 17 (14.9%) | 8 (5.3%) |
| 20 to 24 Minutes | 5 (4.4%) | 2 (1.3%) |
| 25 to 29 Minutes | 2 (1.8%) | 2 (1.3%) |
| 30 to 34 Minutes | 8 (7.0%) | 12 (8.0%) |
| 35 to 39 Minutes | 5 (4.4%) | 0 (0.0%) |
| 40 to 44 Minutes | 10 (8.8%) | 11 (7.3%) |
| 45 to 59 Minutes | 25 (21.9%) | 8 (5.3%) |
| 60 to 89 Minutes | 12 (10.5%) | 12 (8.0%) |
| 90 or more Minutes | 0 (0.0%) | 0 (0.0%) |
Time of Departure to Work by Sex in Onaway
The most frequent times of departure to work in Onaway are 12:00 AM to 4:59 AM (20, 17.5%) for males and 11:00 AM to 11:59 AM (30, 20.0%) for females.
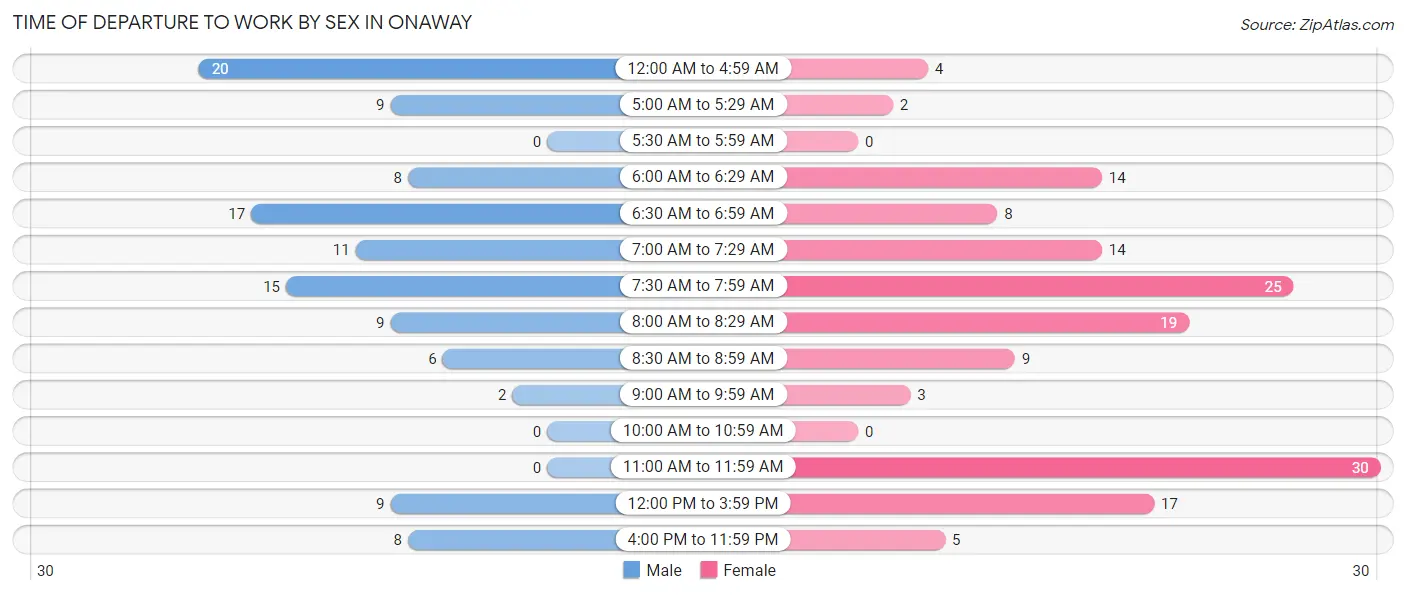
| Time of Departure | Male | Female |
| 12:00 AM to 4:59 AM | 20 (17.5%) | 4 (2.7%) |
| 5:00 AM to 5:29 AM | 9 (7.9%) | 2 (1.3%) |
| 5:30 AM to 5:59 AM | 0 (0.0%) | 0 (0.0%) |
| 6:00 AM to 6:29 AM | 8 (7.0%) | 14 (9.3%) |
| 6:30 AM to 6:59 AM | 17 (14.9%) | 8 (5.3%) |
| 7:00 AM to 7:29 AM | 11 (9.7%) | 14 (9.3%) |
| 7:30 AM to 7:59 AM | 15 (13.2%) | 25 (16.7%) |
| 8:00 AM to 8:29 AM | 9 (7.9%) | 19 (12.7%) |
| 8:30 AM to 8:59 AM | 6 (5.3%) | 9 (6.0%) |
| 9:00 AM to 9:59 AM | 2 (1.8%) | 3 (2.0%) |
| 10:00 AM to 10:59 AM | 0 (0.0%) | 0 (0.0%) |
| 11:00 AM to 11:59 AM | 0 (0.0%) | 30 (20.0%) |
| 12:00 PM to 3:59 PM | 9 (7.9%) | 17 (11.3%) |
| 4:00 PM to 11:59 PM | 8 (7.0%) | 5 (3.3%) |
| Total | 114 (100.0%) | 150 (100.0%) |
Housing Occupancy in Onaway
Occupancy by Ownership in Onaway
Of the total 405 dwellings in Onaway, owner-occupied units account for 263 (64.9%), while renter-occupied units make up 142 (35.1%).
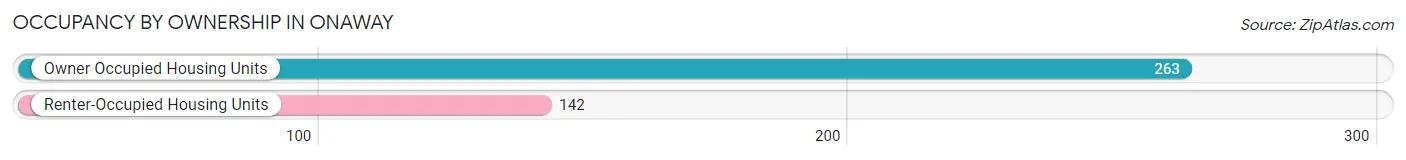
| Occupancy | # Housing Units | % Housing Units |
| Owner Occupied Housing Units | 263 | 64.9% |
| Renter-Occupied Housing Units | 142 | 35.1% |
| Total Occupied Housing Units | 405 | 100.0% |
Occupancy by Household Size in Onaway
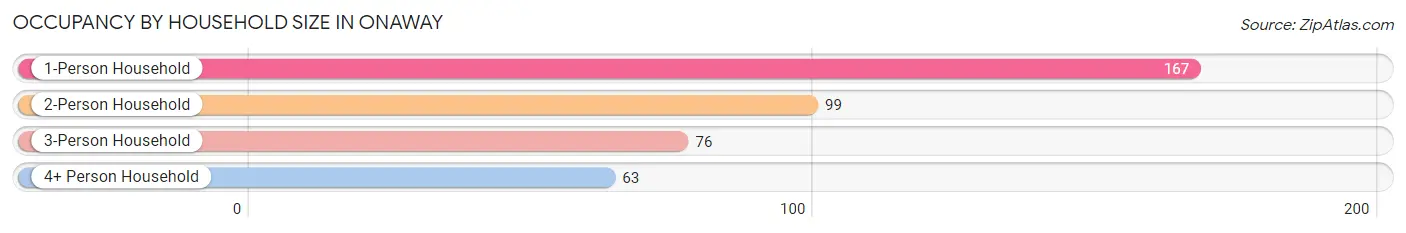
| Household Size | # Housing Units | % Housing Units |
| 1-Person Household | 167 | 41.2% |
| 2-Person Household | 99 | 24.4% |
| 3-Person Household | 76 | 18.8% |
| 4+ Person Household | 63 | 15.6% |
| Total Housing Units | 405 | 100.0% |
Occupancy by Ownership by Household Size in Onaway
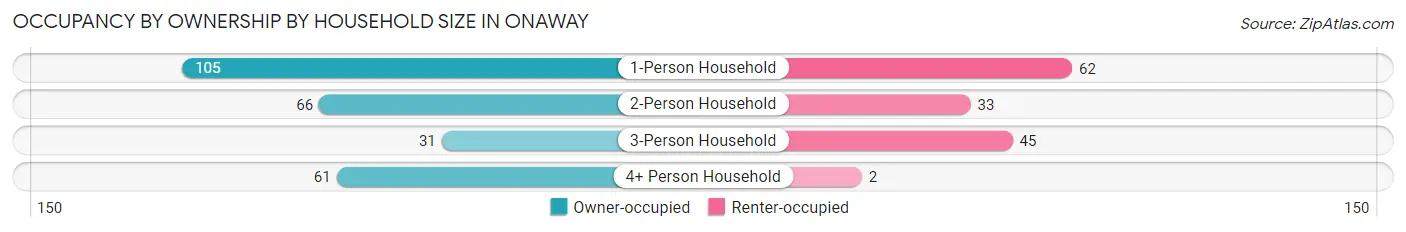
| Household Size | Owner-occupied | Renter-occupied |
| 1-Person Household | 105 (62.9%) | 62 (37.1%) |
| 2-Person Household | 66 (66.7%) | 33 (33.3%) |
| 3-Person Household | 31 (40.8%) | 45 (59.2%) |
| 4+ Person Household | 61 (96.8%) | 2 (3.2%) |
| Total Housing Units | 263 (64.9%) | 142 (35.1%) |
Occupancy by Educational Attainment in Onaway
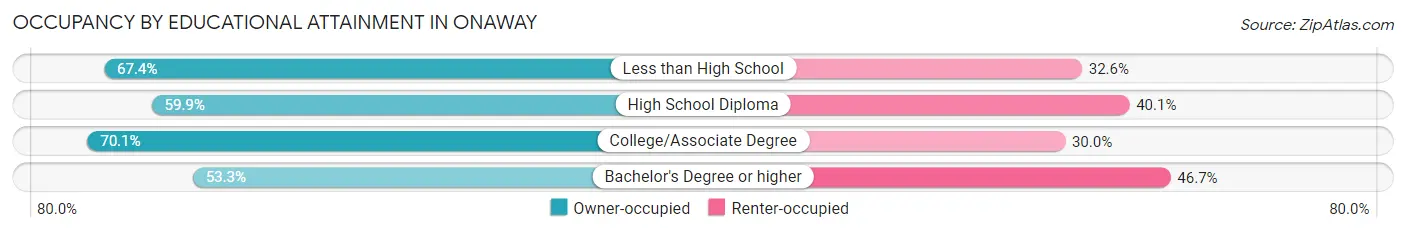
| Household Size | Owner-occupied | Renter-occupied |
| Less than High School | 31 (67.4%) | 15 (32.6%) |
| High School Diploma | 85 (59.9%) | 57 (40.1%) |
| College/Associate Degree | 131 (70.1%) | 56 (29.9%) |
| Bachelor's Degree or higher | 16 (53.3%) | 14 (46.7%) |
Occupancy by Age of Householder in Onaway
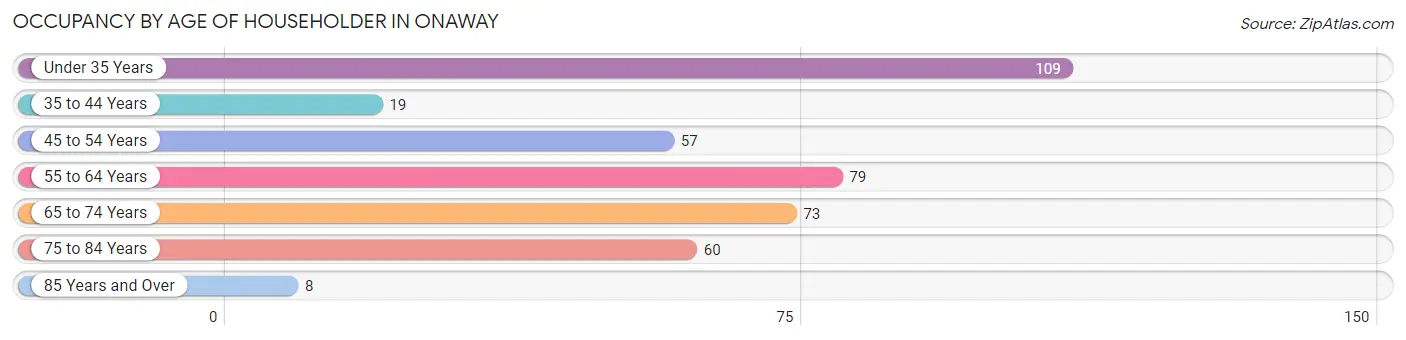
| Age Bracket | # Households | % Households |
| Under 35 Years | 109 | 26.9% |
| 35 to 44 Years | 19 | 4.7% |
| 45 to 54 Years | 57 | 14.1% |
| 55 to 64 Years | 79 | 19.5% |
| 65 to 74 Years | 73 | 18.0% |
| 75 to 84 Years | 60 | 14.8% |
| 85 Years and Over | 8 | 2.0% |
| Total | 405 | 100.0% |
Housing Finances in Onaway
Median Income by Occupancy in Onaway
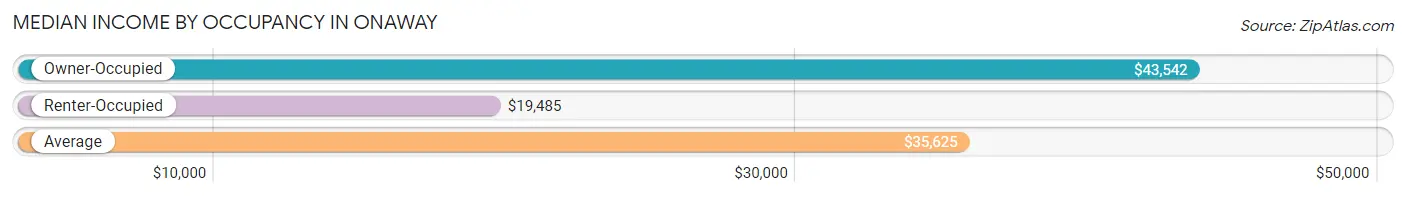
| Occupancy Type | # Households | Median Income |
| Owner-Occupied | 263 (64.9%) | $43,542 |
| Renter-Occupied | 142 (35.1%) | $19,485 |
| Average | 405 (100.0%) | $35,625 |
Occupancy by Householder Income Bracket in Onaway
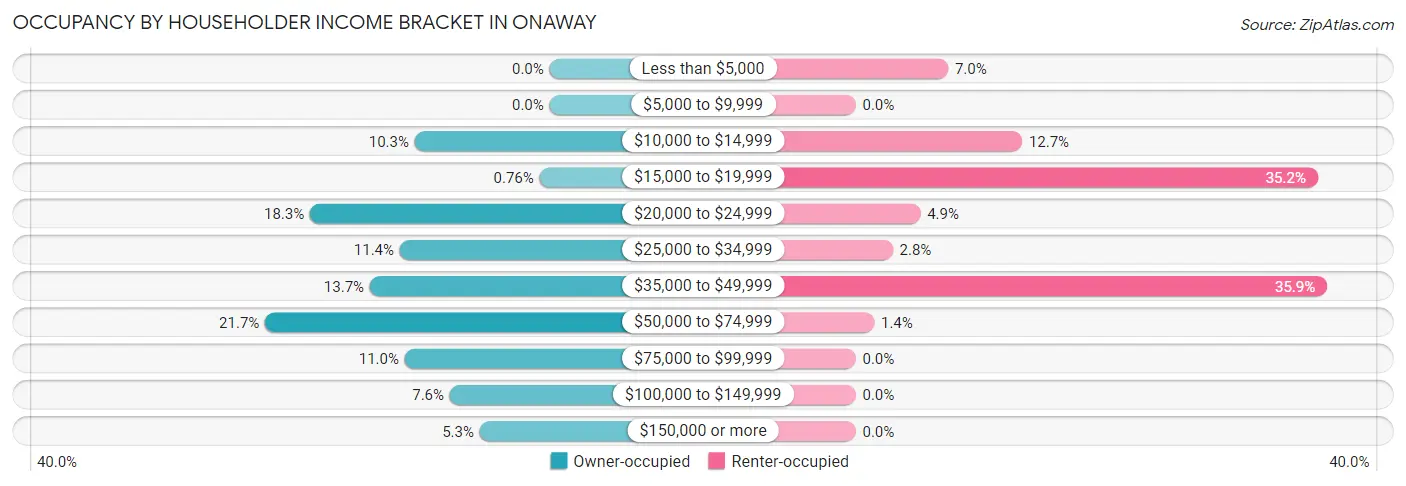
| Income Bracket | Owner-occupied | Renter-occupied |
| Less than $5,000 | 0 (0.0%) | 10 (7.0%) |
| $5,000 to $9,999 | 0 (0.0%) | 0 (0.0%) |
| $10,000 to $14,999 | 27 (10.3%) | 18 (12.7%) |
| $15,000 to $19,999 | 2 (0.8%) | 50 (35.2%) |
| $20,000 to $24,999 | 48 (18.2%) | 7 (4.9%) |
| $25,000 to $34,999 | 30 (11.4%) | 4 (2.8%) |
| $35,000 to $49,999 | 36 (13.7%) | 51 (35.9%) |
| $50,000 to $74,999 | 57 (21.7%) | 2 (1.4%) |
| $75,000 to $99,999 | 29 (11.0%) | 0 (0.0%) |
| $100,000 to $149,999 | 20 (7.6%) | 0 (0.0%) |
| $150,000 or more | 14 (5.3%) | 0 (0.0%) |
| Total | 263 (100.0%) | 142 (100.0%) |
Monthly Housing Cost Tiers in Onaway
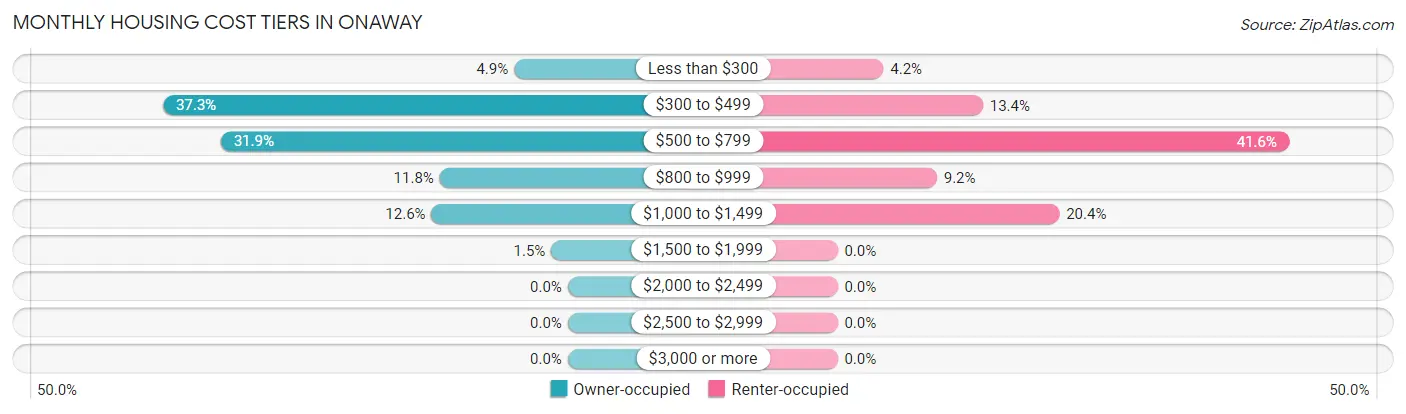
| Monthly Cost | Owner-occupied | Renter-occupied |
| Less than $300 | 13 (4.9%) | 6 (4.2%) |
| $300 to $499 | 98 (37.3%) | 19 (13.4%) |
| $500 to $799 | 84 (31.9%) | 59 (41.5%) |
| $800 to $999 | 31 (11.8%) | 13 (9.1%) |
| $1,000 to $1,499 | 33 (12.6%) | 29 (20.4%) |
| $1,500 to $1,999 | 4 (1.5%) | 0 (0.0%) |
| $2,000 to $2,499 | 0 (0.0%) | 0 (0.0%) |
| $2,500 to $2,999 | 0 (0.0%) | 0 (0.0%) |
| $3,000 or more | 0 (0.0%) | 0 (0.0%) |
| Total | 263 (100.0%) | 142 (100.0%) |
Physical Housing Characteristics in Onaway
Housing Structures in Onaway
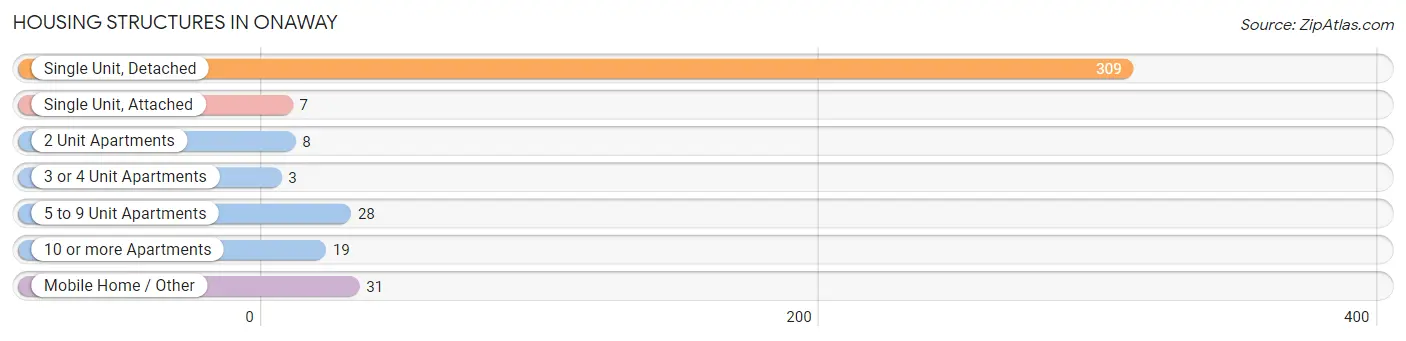
| Structure Type | # Housing Units | % Housing Units |
| Single Unit, Detached | 309 | 76.3% |
| Single Unit, Attached | 7 | 1.7% |
| 2 Unit Apartments | 8 | 2.0% |
| 3 or 4 Unit Apartments | 3 | 0.7% |
| 5 to 9 Unit Apartments | 28 | 6.9% |
| 10 or more Apartments | 19 | 4.7% |
| Mobile Home / Other | 31 | 7.6% |
| Total | 405 | 100.0% |
Housing Structures by Occupancy in Onaway
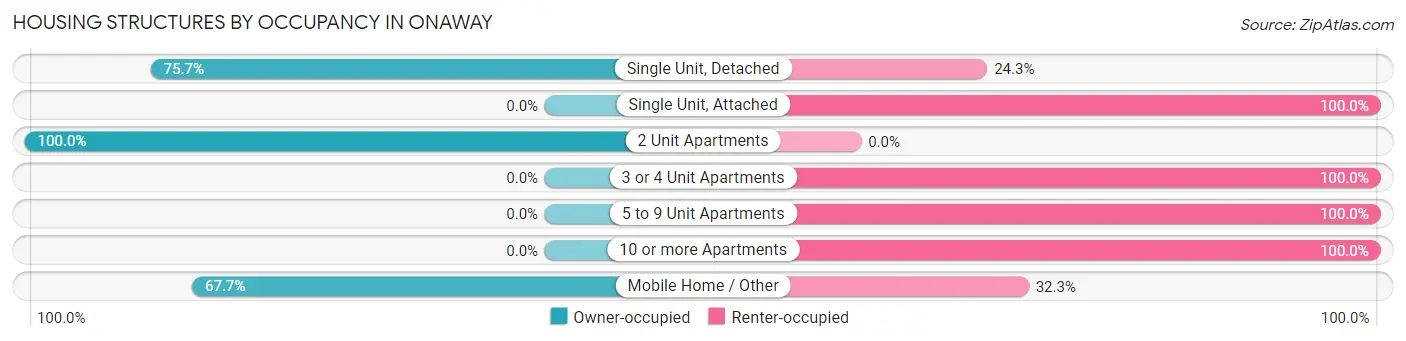
| Structure Type | Owner-occupied | Renter-occupied |
| Single Unit, Detached | 234 (75.7%) | 75 (24.3%) |
| Single Unit, Attached | 0 (0.0%) | 7 (100.0%) |
| 2 Unit Apartments | 8 (100.0%) | 0 (0.0%) |
| 3 or 4 Unit Apartments | 0 (0.0%) | 3 (100.0%) |
| 5 to 9 Unit Apartments | 0 (0.0%) | 28 (100.0%) |
| 10 or more Apartments | 0 (0.0%) | 19 (100.0%) |
| Mobile Home / Other | 21 (67.7%) | 10 (32.3%) |
| Total | 263 (64.9%) | 142 (35.1%) |
Housing Structures by Number of Rooms in Onaway
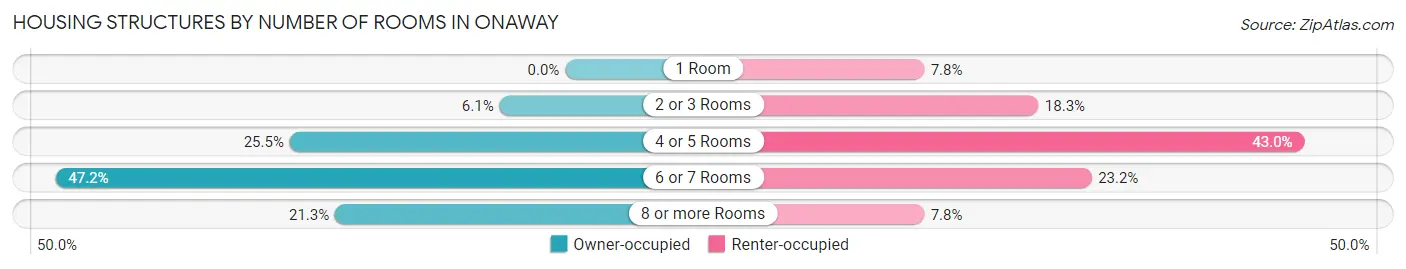
| Number of Rooms | Owner-occupied | Renter-occupied |
| 1 Room | 0 (0.0%) | 11 (7.7%) |
| 2 or 3 Rooms | 16 (6.1%) | 26 (18.3%) |
| 4 or 5 Rooms | 67 (25.5%) | 61 (43.0%) |
| 6 or 7 Rooms | 124 (47.1%) | 33 (23.2%) |
| 8 or more Rooms | 56 (21.3%) | 11 (7.7%) |
| Total | 263 (100.0%) | 142 (100.0%) |
Housing Structure by Heating Type in Onaway
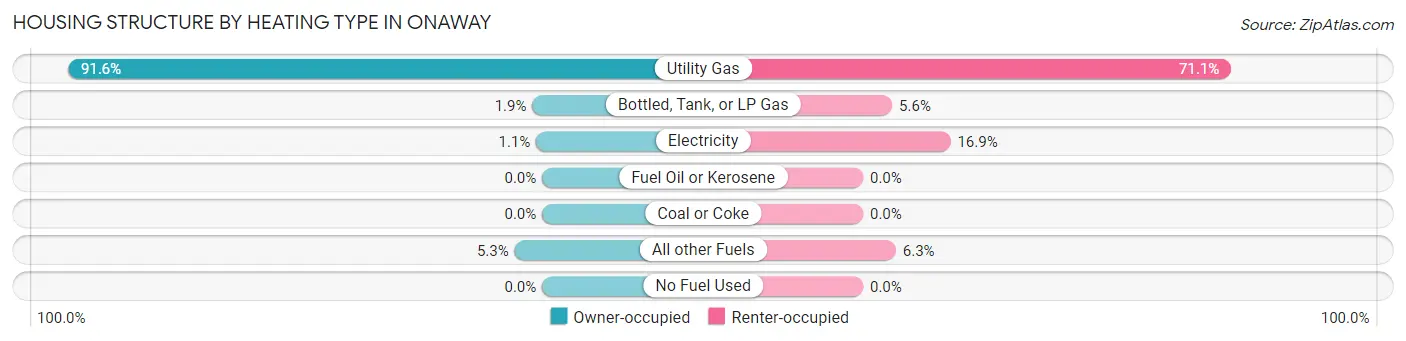
| Heating Type | Owner-occupied | Renter-occupied |
| Utility Gas | 241 (91.6%) | 101 (71.1%) |
| Bottled, Tank, or LP Gas | 5 (1.9%) | 8 (5.6%) |
| Electricity | 3 (1.1%) | 24 (16.9%) |
| Fuel Oil or Kerosene | 0 (0.0%) | 0 (0.0%) |
| Coal or Coke | 0 (0.0%) | 0 (0.0%) |
| All other Fuels | 14 (5.3%) | 9 (6.3%) |
| No Fuel Used | 0 (0.0%) | 0 (0.0%) |
| Total | 263 (100.0%) | 142 (100.0%) |
Household Vehicle Usage in Onaway
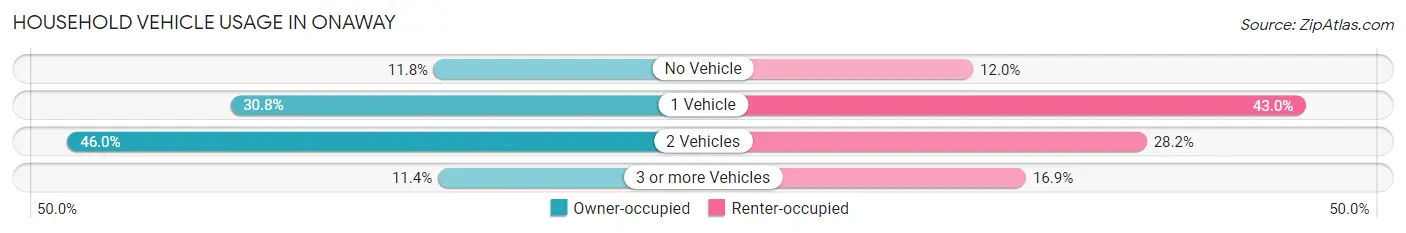
| Vehicles per Household | Owner-occupied | Renter-occupied |
| No Vehicle | 31 (11.8%) | 17 (12.0%) |
| 1 Vehicle | 81 (30.8%) | 61 (43.0%) |
| 2 Vehicles | 121 (46.0%) | 40 (28.2%) |
| 3 or more Vehicles | 30 (11.4%) | 24 (16.9%) |
| Total | 263 (100.0%) | 142 (100.0%) |
Real Estate & Mortgages in Onaway
Real Estate and Mortgage Overview in Onaway
| Characteristic | Without Mortgage | With Mortgage |
| Housing Units | 138 | 125 |
| Median Property Value | $65,000 | $51,000 |
| Median Household Income | $52,727 | $8 |
| Monthly Housing Costs | $350 | $0 |
| Real Estate Taxes | $814 | $6 |
Property Value by Mortgage Status in Onaway
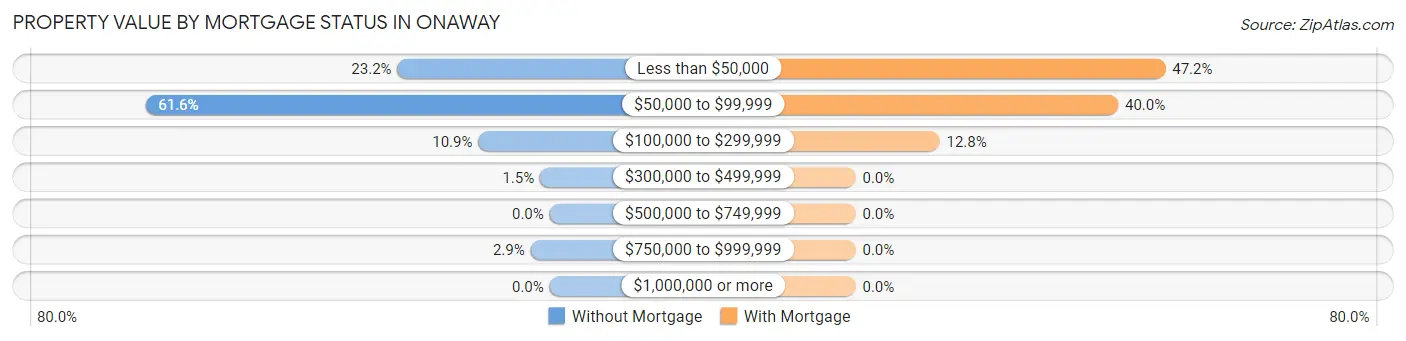
| Property Value | Without Mortgage | With Mortgage |
| Less than $50,000 | 32 (23.2%) | 59 (47.2%) |
| $50,000 to $99,999 | 85 (61.6%) | 50 (40.0%) |
| $100,000 to $299,999 | 15 (10.9%) | 16 (12.8%) |
| $300,000 to $499,999 | 2 (1.5%) | 0 (0.0%) |
| $500,000 to $749,999 | 0 (0.0%) | 0 (0.0%) |
| $750,000 to $999,999 | 4 (2.9%) | 0 (0.0%) |
| $1,000,000 or more | 0 (0.0%) | 0 (0.0%) |
| Total | 138 (100.0%) | 125 (100.0%) |
Household Income by Mortgage Status in Onaway
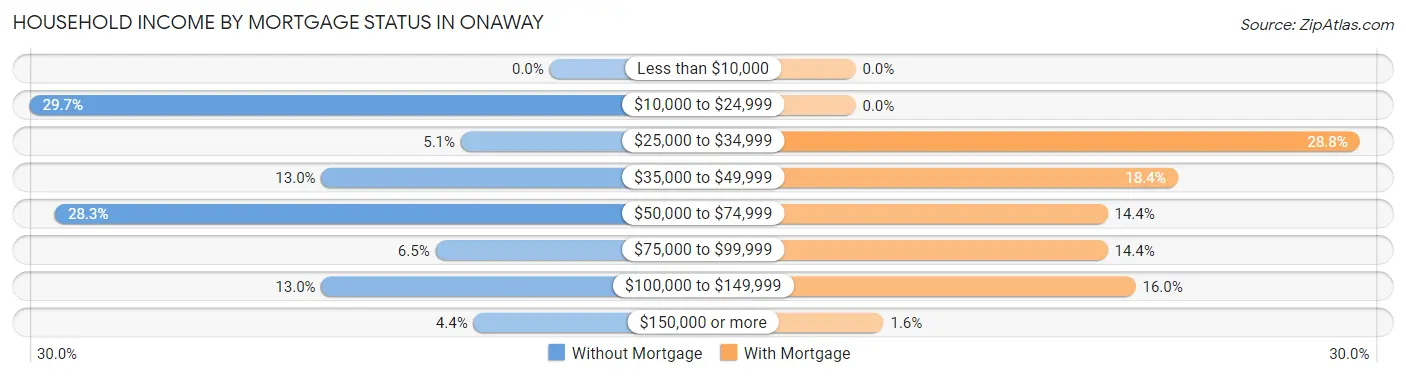
| Household Income | Without Mortgage | With Mortgage |
| Less than $10,000 | 0 (0.0%) | 0 (0.0%) |
| $10,000 to $24,999 | 41 (29.7%) | 0 (0.0%) |
| $25,000 to $34,999 | 7 (5.1%) | 36 (28.8%) |
| $35,000 to $49,999 | 18 (13.0%) | 23 (18.4%) |
| $50,000 to $74,999 | 39 (28.3%) | 18 (14.4%) |
| $75,000 to $99,999 | 9 (6.5%) | 18 (14.4%) |
| $100,000 to $149,999 | 18 (13.0%) | 20 (16.0%) |
| $150,000 or more | 6 (4.3%) | 2 (1.6%) |
| Total | 138 (100.0%) | 125 (100.0%) |
Property Value to Household Income Ratio in Onaway
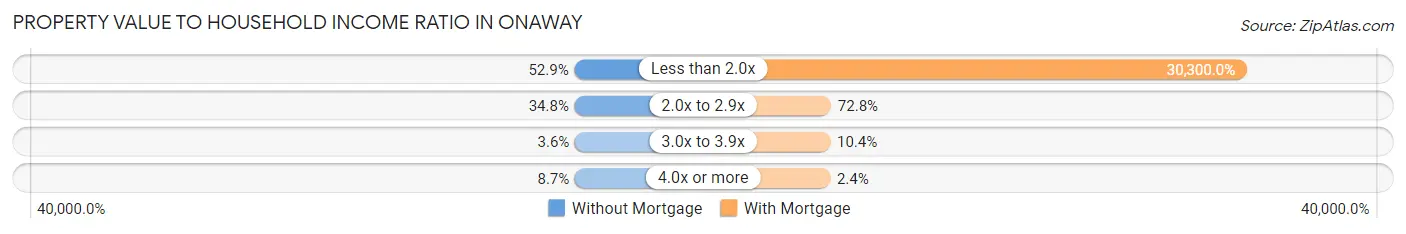
| Value-to-Income Ratio | Without Mortgage | With Mortgage |
| Less than 2.0x | 73 (52.9%) | 37,875 (30,300.0%) |
| 2.0x to 2.9x | 48 (34.8%) | 91 (72.8%) |
| 3.0x to 3.9x | 5 (3.6%) | 13 (10.4%) |
| 4.0x or more | 12 (8.7%) | 3 (2.4%) |
| Total | 138 (100.0%) | 125 (100.0%) |
Real Estate Taxes by Mortgage Status in Onaway
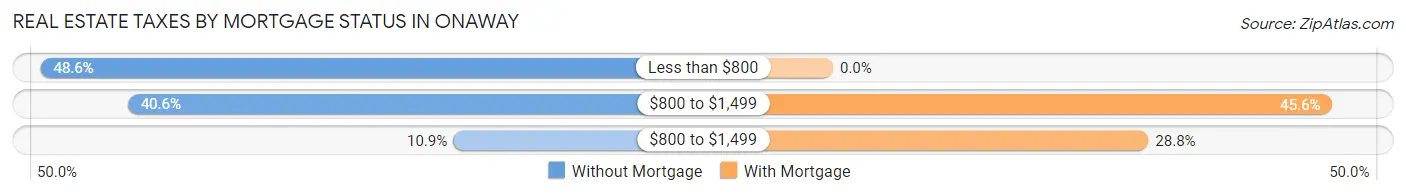
| Property Taxes | Without Mortgage | With Mortgage |
| Less than $800 | 67 (48.5%) | 0 (0.0%) |
| $800 to $1,499 | 56 (40.6%) | 57 (45.6%) |
| $800 to $1,499 | 15 (10.9%) | 36 (28.8%) |
| Total | 138 (100.0%) | 125 (100.0%) |
Health & Disability in Onaway
Health Insurance Coverage by Age in Onaway
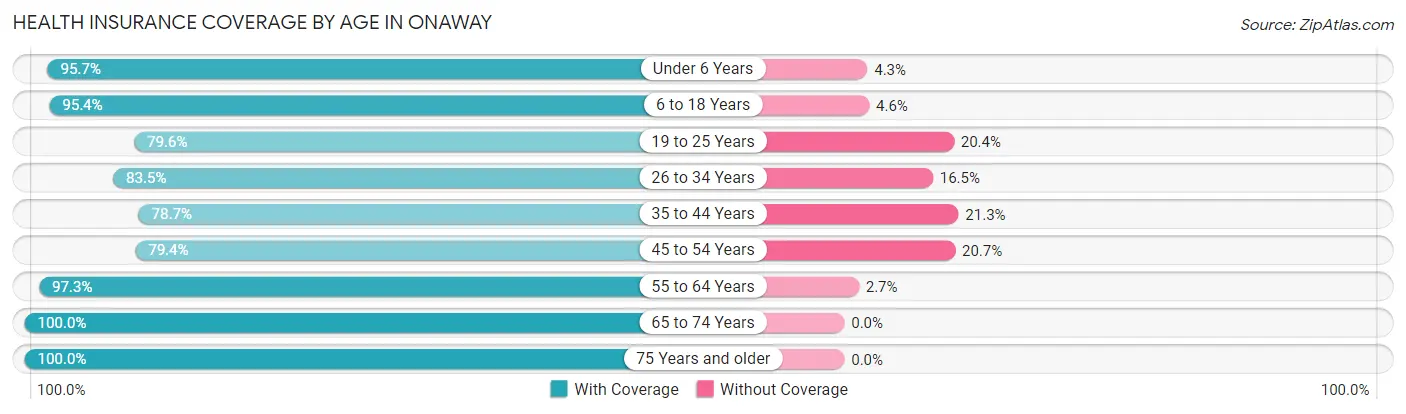
| Age Bracket | With Coverage | Without Coverage |
| Under 6 Years | 67 (95.7%) | 3 (4.3%) |
| 6 to 18 Years | 62 (95.4%) | 3 (4.6%) |
| 19 to 25 Years | 113 (79.6%) | 29 (20.4%) |
| 26 to 34 Years | 86 (83.5%) | 17 (16.5%) |
| 35 to 44 Years | 37 (78.7%) | 10 (21.3%) |
| 45 to 54 Years | 73 (79.3%) | 19 (20.6%) |
| 55 to 64 Years | 108 (97.3%) | 3 (2.7%) |
| 65 to 74 Years | 86 (100.0%) | 0 (0.0%) |
| 75 Years and older | 91 (100.0%) | 0 (0.0%) |
| Total | 723 (89.6%) | 84 (10.4%) |
Health Insurance Coverage by Citizenship Status in Onaway
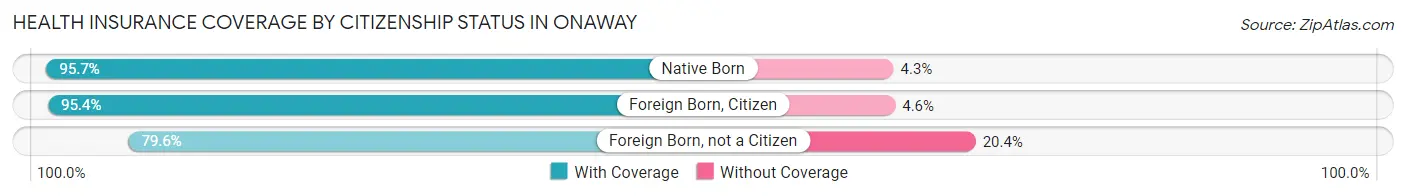
| Citizenship Status | With Coverage | Without Coverage |
| Native Born | 67 (95.7%) | 3 (4.3%) |
| Foreign Born, Citizen | 62 (95.4%) | 3 (4.6%) |
| Foreign Born, not a Citizen | 113 (79.6%) | 29 (20.4%) |
Health Insurance Coverage by Household Income in Onaway
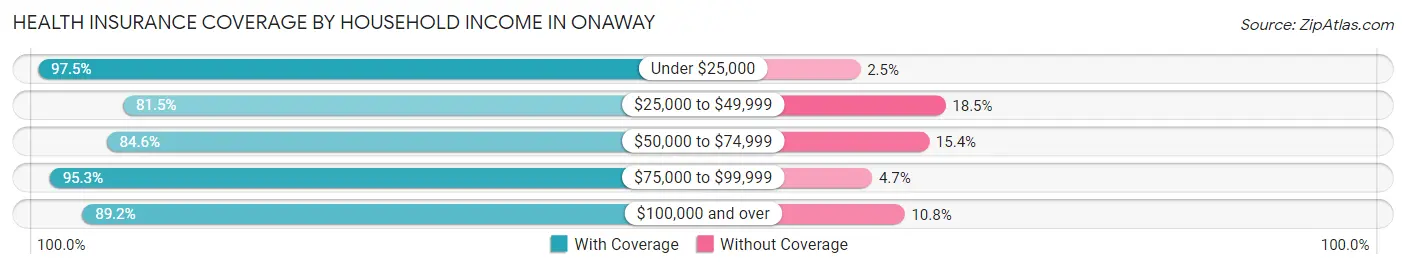
| Household Income | With Coverage | Without Coverage |
| Under $25,000 | 232 (97.5%) | 6 (2.5%) |
| $25,000 to $49,999 | 181 (81.5%) | 41 (18.5%) |
| $50,000 to $74,999 | 110 (84.6%) | 20 (15.4%) |
| $75,000 to $99,999 | 101 (95.3%) | 5 (4.7%) |
| $100,000 and over | 99 (89.2%) | 12 (10.8%) |
Public vs Private Health Insurance Coverage by Age in Onaway
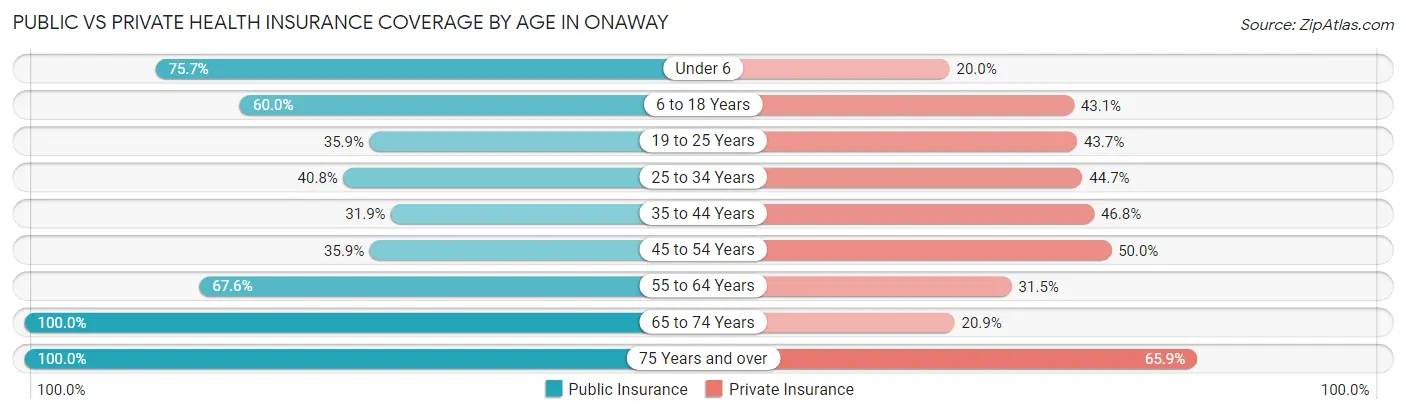
| Age Bracket | Public Insurance | Private Insurance |
| Under 6 | 53 (75.7%) | 14 (20.0%) |
| 6 to 18 Years | 39 (60.0%) | 28 (43.1%) |
| 19 to 25 Years | 51 (35.9%) | 62 (43.7%) |
| 25 to 34 Years | 42 (40.8%) | 46 (44.7%) |
| 35 to 44 Years | 15 (31.9%) | 22 (46.8%) |
| 45 to 54 Years | 33 (35.9%) | 46 (50.0%) |
| 55 to 64 Years | 75 (67.6%) | 35 (31.5%) |
| 65 to 74 Years | 86 (100.0%) | 18 (20.9%) |
| 75 Years and over | 91 (100.0%) | 60 (65.9%) |
| Total | 485 (60.1%) | 331 (41.0%) |
Disability Status by Sex by Age in Onaway
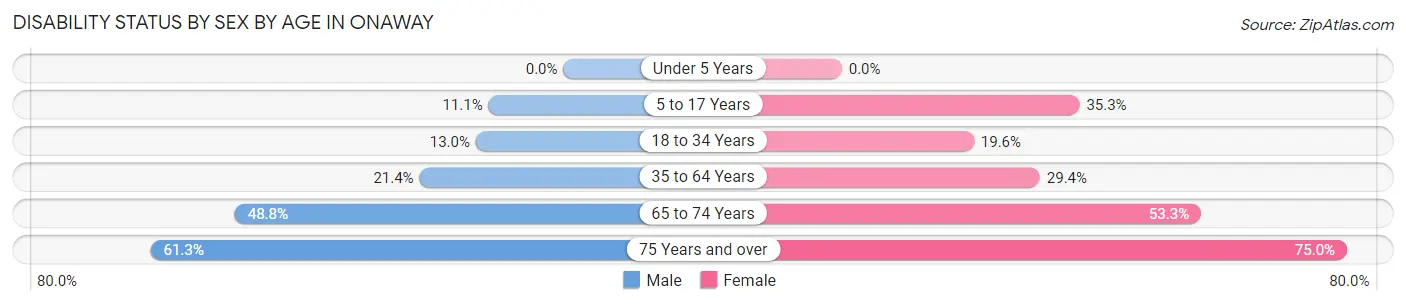
| Age Bracket | Male | Female |
| Under 5 Years | 0 (0.0%) | 0 (0.0%) |
| 5 to 17 Years | 3 (11.1%) | 12 (35.3%) |
| 18 to 34 Years | 13 (13.0%) | 30 (19.6%) |
| 35 to 64 Years | 28 (21.4%) | 35 (29.4%) |
| 65 to 74 Years | 20 (48.8%) | 24 (53.3%) |
| 75 Years and over | 19 (61.3%) | 45 (75.0%) |
Disability Class by Sex by Age in Onaway
Disability Class: Hearing Difficulty
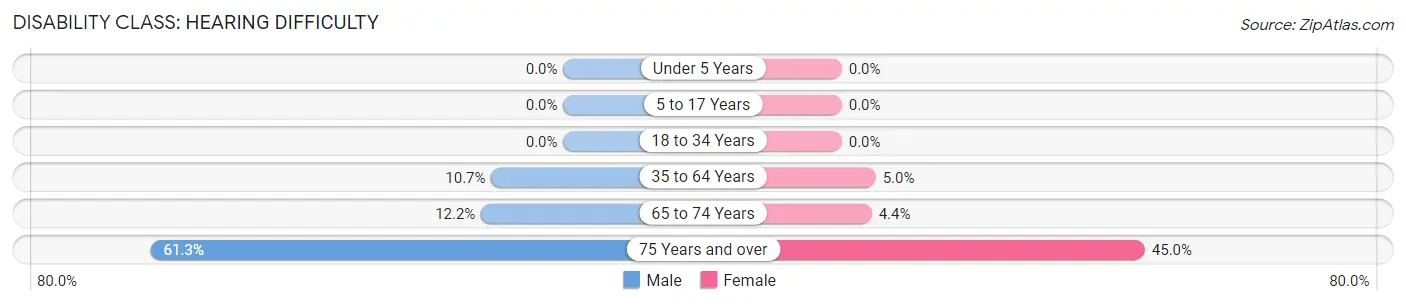
| Age Bracket | Male | Female |
| Under 5 Years | 0 (0.0%) | 0 (0.0%) |
| 5 to 17 Years | 0 (0.0%) | 0 (0.0%) |
| 18 to 34 Years | 0 (0.0%) | 0 (0.0%) |
| 35 to 64 Years | 14 (10.7%) | 6 (5.0%) |
| 65 to 74 Years | 5 (12.2%) | 2 (4.4%) |
| 75 Years and over | 19 (61.3%) | 27 (45.0%) |
Disability Class: Vision Difficulty
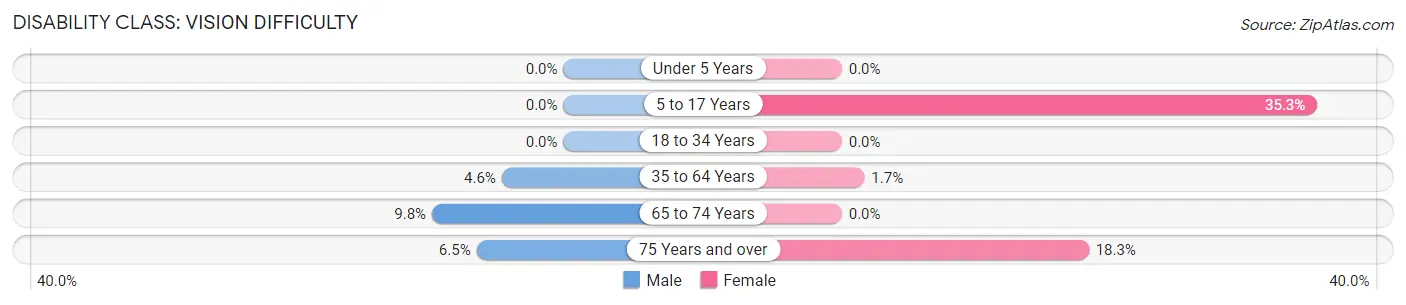
| Age Bracket | Male | Female |
| Under 5 Years | 0 (0.0%) | 0 (0.0%) |
| 5 to 17 Years | 0 (0.0%) | 12 (35.3%) |
| 18 to 34 Years | 0 (0.0%) | 0 (0.0%) |
| 35 to 64 Years | 6 (4.6%) | 2 (1.7%) |
| 65 to 74 Years | 4 (9.8%) | 0 (0.0%) |
| 75 Years and over | 2 (6.5%) | 11 (18.3%) |
Disability Class: Cognitive Difficulty
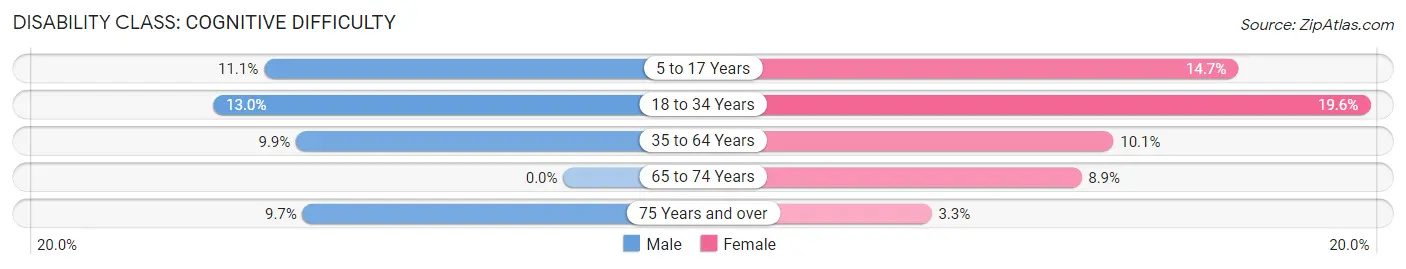
| Age Bracket | Male | Female |
| 5 to 17 Years | 3 (11.1%) | 5 (14.7%) |
| 18 to 34 Years | 13 (13.0%) | 30 (19.6%) |
| 35 to 64 Years | 13 (9.9%) | 12 (10.1%) |
| 65 to 74 Years | 0 (0.0%) | 4 (8.9%) |
| 75 Years and over | 3 (9.7%) | 2 (3.3%) |
Disability Class: Ambulatory Difficulty
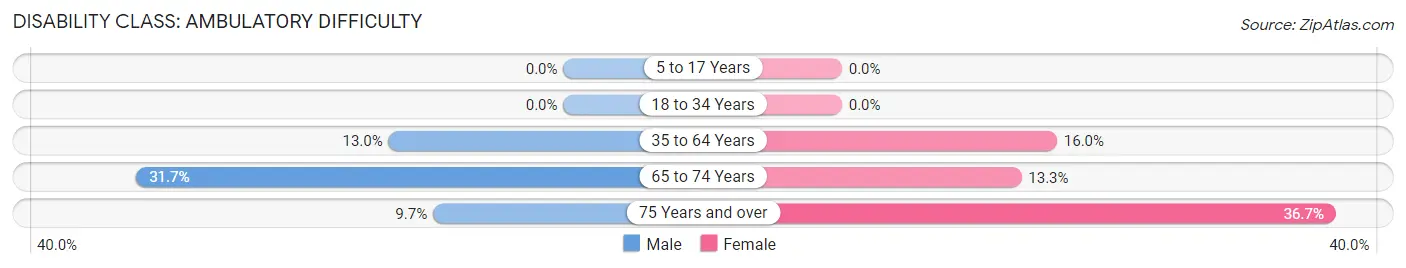
| Age Bracket | Male | Female |
| 5 to 17 Years | 0 (0.0%) | 0 (0.0%) |
| 18 to 34 Years | 0 (0.0%) | 0 (0.0%) |
| 35 to 64 Years | 17 (13.0%) | 19 (16.0%) |
| 65 to 74 Years | 13 (31.7%) | 6 (13.3%) |
| 75 Years and over | 3 (9.7%) | 22 (36.7%) |
Disability Class: Self-Care Difficulty
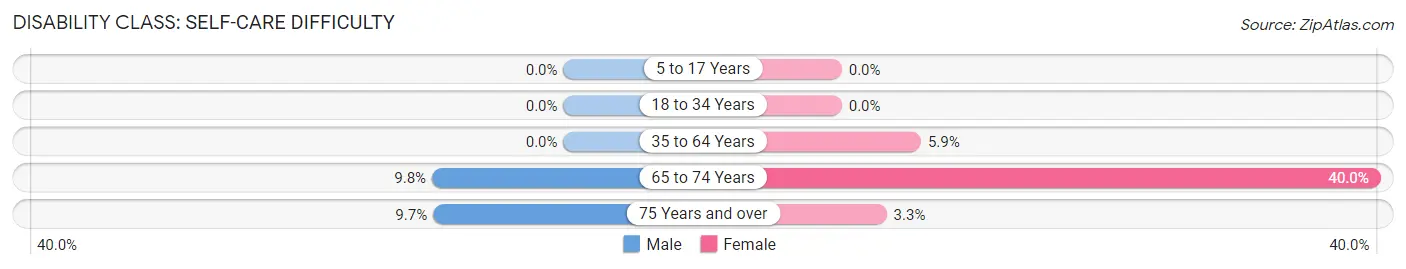
| Age Bracket | Male | Female |
| 5 to 17 Years | 0 (0.0%) | 0 (0.0%) |
| 18 to 34 Years | 0 (0.0%) | 0 (0.0%) |
| 35 to 64 Years | 0 (0.0%) | 7 (5.9%) |
| 65 to 74 Years | 4 (9.8%) | 18 (40.0%) |
| 75 Years and over | 3 (9.7%) | 2 (3.3%) |
Technology Access in Onaway
Computing Device Access in Onaway
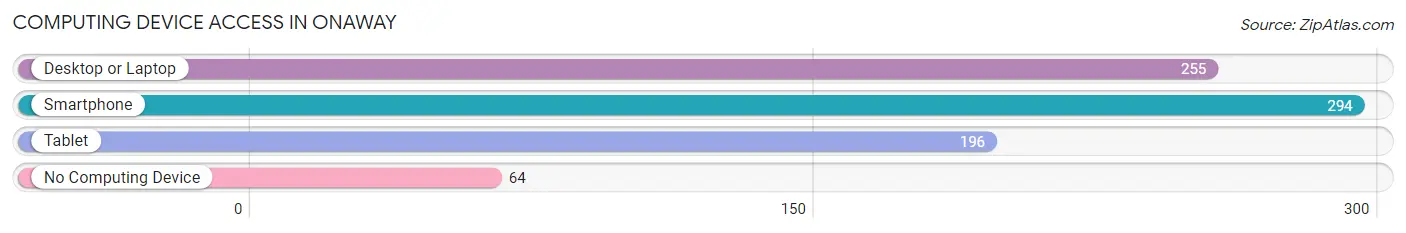
| Device Type | # Households | % Households |
| Desktop or Laptop | 255 | 63.0% |
| Smartphone | 294 | 72.6% |
| Tablet | 196 | 48.4% |
| No Computing Device | 64 | 15.8% |
| Total | 405 | 100.0% |
Internet Access in Onaway
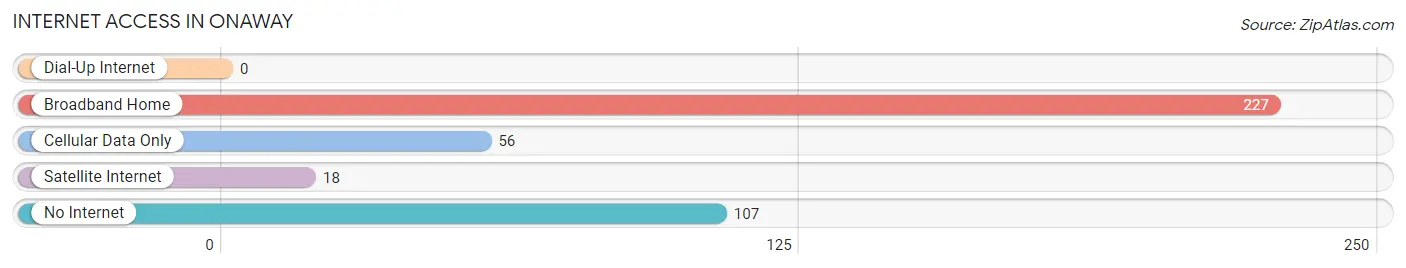
| Internet Type | # Households | % Households |
| Dial-Up Internet | 0 | 0.0% |
| Broadband Home | 227 | 56.0% |
| Cellular Data Only | 56 | 13.8% |
| Satellite Internet | 18 | 4.4% |
| No Internet | 107 | 26.4% |
| Total | 405 | 100.0% |
Onaway Summary
Onaway is a small city located in Presque Isle County, Michigan. It is situated on the shores of Black Lake, which is part of the larger Lake Huron. The city has a population of 1,717 people, according to the 2010 census. The city is known for its outdoor recreation opportunities, including fishing, hunting, and camping.
History
The area that is now Onaway was first settled in the late 1800s by lumberjacks and farmers. The city was officially incorporated in 1891 and was named after the Ojibwe word for “on the way”. The city was a major lumbering center in the late 19th and early 20th centuries, and the lumber industry was the main source of employment for the city’s residents.
In the early 20th century, the city began to diversify its economy. The city’s first bank was established in 1906, and the first newspaper was published in 1908. The city also became a popular tourist destination, with many visitors coming to enjoy the area’s natural beauty and outdoor recreation opportunities.
Geography
Onaway is located in the northern part of Michigan’s Lower Peninsula, on the shores of Black Lake. The city is situated in a rural area, surrounded by forests and farmland. The city is located about 30 miles from the city of Alpena, and about 60 miles from the city of Mackinaw City.
The city has a total area of 2.2 square miles, all of which is land. The city is located at an elevation of 645 feet above sea level. The climate in Onaway is classified as humid continental, with cold winters and warm summers.
Economy
The economy of Onaway is largely based on tourism and outdoor recreation. The city is home to several resorts and campgrounds, which attract visitors from all over the state and beyond. The city is also home to several marinas, which offer boat rentals and other services.
In addition to tourism, the city’s economy is also supported by manufacturing and agriculture. The city is home to several factories, which produce a variety of products, including furniture, automotive parts, and food products. The city is also home to several farms, which produce a variety of crops, including corn, soybeans, and wheat.
Demographics
According to the 2010 census, the population of Onaway was 1,717 people. The population is spread out, with 48.3% male and 51.7% female. The median age of the population is 44.7 years.
The racial makeup of the city is 97.2% White, 0.5% African American, 0.3% Native American, 0.2% Asian, 0.1% Pacific Islander, 0.3% from other races, and 1.4% from two or more races. The median household income in Onaway is $37,917, and the median family income is $45,938. The per capita income in Onaway is $19,945.
Conclusion
Onaway is a small city located in Presque Isle County, Michigan. It is situated on the shores of Black Lake, and is known for its outdoor recreation opportunities. The city has a population of 1,717 people, and the economy is largely based on tourism and outdoor recreation. The city is also home to several factories and farms, which produce a variety of products. The racial makeup of the city is 97.2% White, and the median household income is $37,917. Onaway is a great place to visit for outdoor recreation, and to experience the beauty of northern Michigan.
Common Questions
What is Per Capita Income in Onaway?
Per Capita income in Onaway is $20,994.
What is the Median Family Income in Onaway?
Median Family Income in Onaway is $41,250.
What is the Median Household income in Onaway?
Median Household Income in Onaway is $35,625.
What is Income or Wage Gap in Onaway?
Income or Wage Gap in Onaway is 48.2%.
Women in Onaway earn 51.8 cents for every dollar earned by a man.
What is Inequality or Gini Index in Onaway?
Inequality or Gini Index in Onaway is 0.42.
What is the Total Population of Onaway?
Total Population of Onaway is 813.
What is the Total Male Population of Onaway?
Total Male Population of Onaway is 369.
What is the Total Female Population of Onaway?
Total Female Population of Onaway is 444.
What is the Ratio of Males per 100 Females in Onaway?
There are 83.11 Males per 100 Females in Onaway.
What is the Ratio of Females per 100 Males in Onaway?
There are 120.33 Females per 100 Males in Onaway.
What is the Median Population Age in Onaway?
Median Population Age in Onaway is 36.9 Years.
What is the Average Family Size in Onaway
Average Family Size in Onaway is 2.5 People.
What is the Average Household Size in Onaway
Average Household Size in Onaway is 2.0 People.
How Large is the Labor Force in Onaway?
There are 328 People in the Labor Forcein in Onaway.
What is the Percentage of People in the Labor Force in Onaway?
47.4% of People are in the Labor Force in Onaway.
What is the Unemployment Rate in Onaway?
Unemployment Rate in Onaway is 13.7%.