Norway, MI Map & Demographics
Norway Map
Norway Overview
$28,432
PER CAPITA INCOME
$75,363
AVG FAMILY INCOME
$49,261
AVG HOUSEHOLD INCOME
40.9%
WAGE / INCOME GAP [ % ]
59.1¢/ $1
WAGE / INCOME GAP [ $ ]
0.35
INEQUALITY / GINI INDEX
2,832
TOTAL POPULATION
1,486
MALE POPULATION
1,346
FEMALE POPULATION
110.40
MALES / 100 FEMALES
90.58
FEMALES / 100 MALES
45.3
MEDIAN AGE
3.0
AVG FAMILY SIZE
2.2
AVG HOUSEHOLD SIZE
1,408
LABOR FORCE [ PEOPLE ]
57.3%
PERCENT IN LABOR FORCE
2.3%
UNEMPLOYMENT RATE
Norway Zip Codes
Norway Area Codes
Income in Norway
Income Overview in Norway
Per Capita Income in Norway is $28,432, while median incomes of families and households are $75,363 and $49,261 respectively.
| Characteristic | Number | Measure |
| Per Capita Income | 2,832 | $28,432 |
| Median Family Income | 695 | $75,363 |
| Mean Family Income | 695 | $74,872 |
| Median Household Income | 1,266 | $49,261 |
| Mean Household Income | 1,266 | $59,666 |
| Income Deficit | 695 | $0 |
| Wage / Income Gap (%) | 2,832 | 40.86% |
| Wage / Income Gap ($) | 2,832 | 59.14¢ per $1 |
| Gini / Inequality Index | 2,832 | 0.35 |
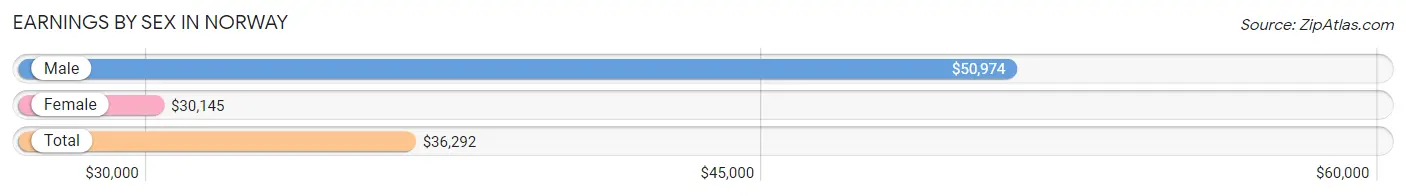
Earnings by Sex in Norway
Average Earnings in Norway are $36,292, $50,974 for men and $30,145 for women, a difference of 40.9%.
| Sex | Number | Average Earnings |
| Male | 735 (50.1%) | $50,974 |
| Female | 731 (49.9%) | $30,145 |
| Total | 1,466 (100.0%) | $36,292 |
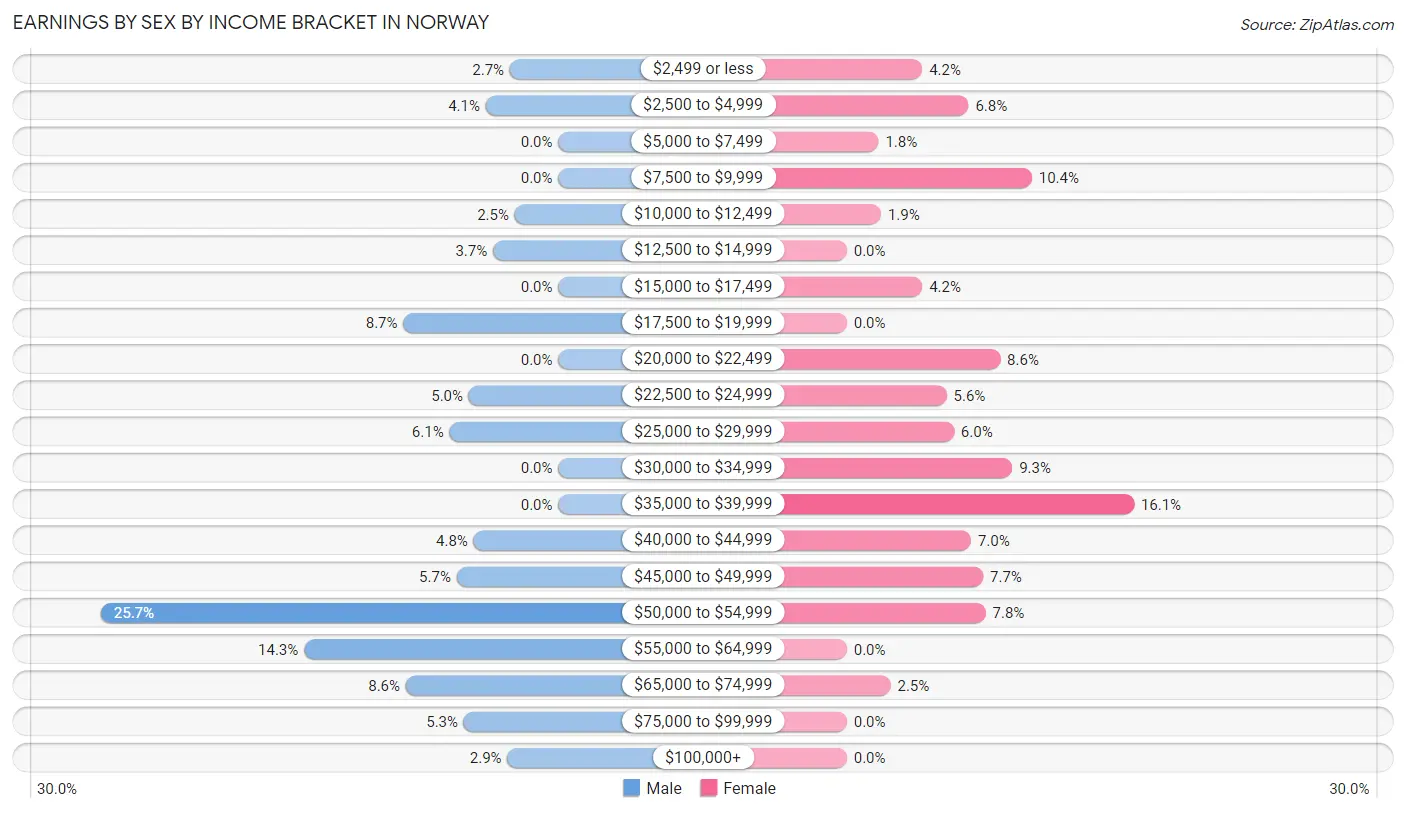
Earnings by Sex by Income Bracket in Norway
The most common earnings brackets in Norway are $50,000 to $54,999 for men (189 | 25.7%) and $35,000 to $39,999 for women (118 | 16.1%).
| Income | Male | Female |
| $2,499 or less | 20 (2.7%) | 31 (4.2%) |
| $2,500 to $4,999 | 30 (4.1%) | 50 (6.8%) |
| $5,000 to $7,499 | 0 (0.0%) | 13 (1.8%) |
| $7,500 to $9,999 | 0 (0.0%) | 76 (10.4%) |
| $10,000 to $12,499 | 18 (2.5%) | 14 (1.9%) |
| $12,500 to $14,999 | 27 (3.7%) | 0 (0.0%) |
| $15,000 to $17,499 | 0 (0.0%) | 31 (4.2%) |
| $17,500 to $19,999 | 64 (8.7%) | 0 (0.0%) |
| $20,000 to $22,499 | 0 (0.0%) | 63 (8.6%) |
| $22,500 to $24,999 | 37 (5.0%) | 41 (5.6%) |
| $25,000 to $29,999 | 45 (6.1%) | 44 (6.0%) |
| $30,000 to $34,999 | 0 (0.0%) | 68 (9.3%) |
| $35,000 to $39,999 | 0 (0.0%) | 118 (16.1%) |
| $40,000 to $44,999 | 35 (4.8%) | 51 (7.0%) |
| $45,000 to $49,999 | 42 (5.7%) | 56 (7.7%) |
| $50,000 to $54,999 | 189 (25.7%) | 57 (7.8%) |
| $55,000 to $64,999 | 105 (14.3%) | 0 (0.0%) |
| $65,000 to $74,999 | 63 (8.6%) | 18 (2.5%) |
| $75,000 to $99,999 | 39 (5.3%) | 0 (0.0%) |
| $100,000+ | 21 (2.9%) | 0 (0.0%) |
| Total | 735 (100.0%) | 731 (100.0%) |
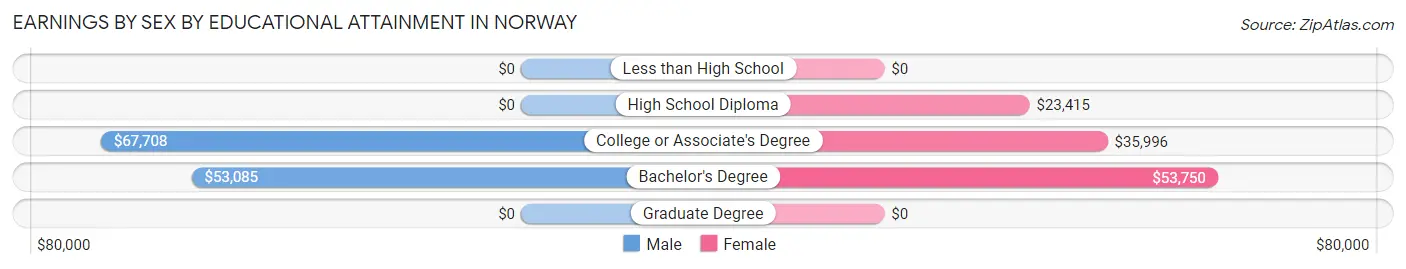
Earnings by Sex by Educational Attainment in Norway
Average earnings in Norway are $52,944 for men and $31,250 for women, a difference of 41.0%. Men with an educational attainment of college or associate's degree enjoy the highest average annual earnings of $67,708, while those with bachelor's degree education earn the least with $53,085. Women with an educational attainment of bachelor's degree earn the most with the average annual earnings of $53,750, while those with high school diploma education have the smallest earnings of $23,415.
| Educational Attainment | Male Income | Female Income |
| Less than High School | - | - |
| High School Diploma | - | - |
| College or Associate's Degree | $67,708 | $35,996 |
| Bachelor's Degree | $53,085 | $53,750 |
| Graduate Degree | - | - |
| Total | $52,944 | $31,250 |
Family Income in Norway
Family Income Brackets in Norway
According to the Norway family income data, there are 260 families falling into the $100,000 to $149,999 income range, which is the most common income bracket and makes up 37.4% of all families.
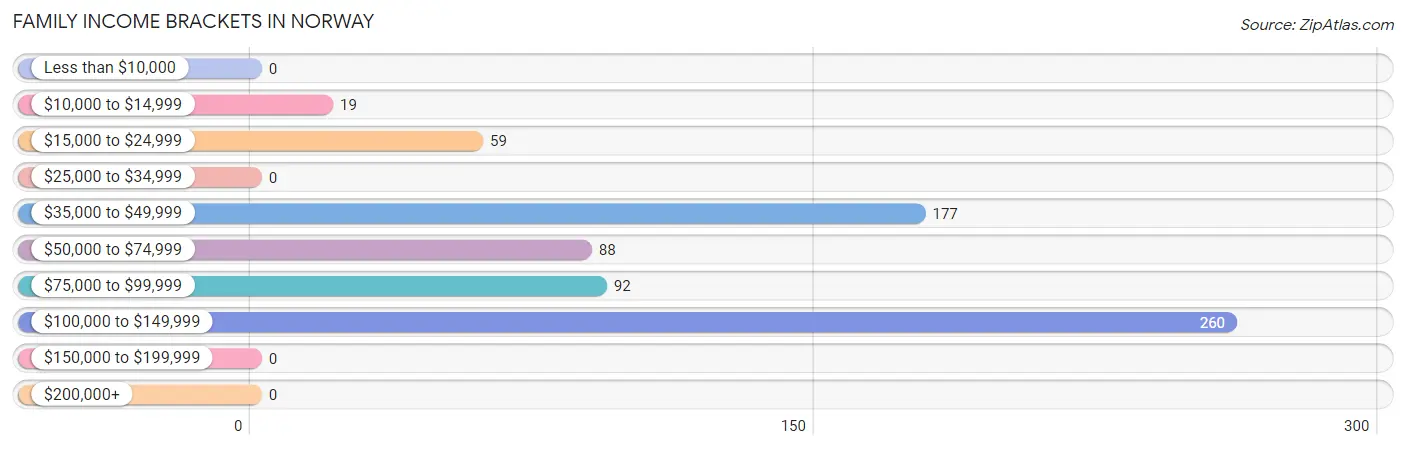
| Income Bracket | # Families | % Families |
| Less than $10,000 | 0 | 0.0% |
| $10,000 to $14,999 | 19 | 2.7% |
| $15,000 to $24,999 | 59 | 8.5% |
| $25,000 to $34,999 | 0 | 0.0% |
| $35,000 to $49,999 | 177 | 25.5% |
| $50,000 to $74,999 | 88 | 12.7% |
| $75,000 to $99,999 | 92 | 13.2% |
| $100,000 to $149,999 | 260 | 37.4% |
| $150,000 to $199,999 | 0 | 0.0% |
| $200,000+ | 0 | 0.0% |
Family Income by Famaliy Size in Norway
3-person families (123 | 17.7%) account for the highest median family income in Norway with $102,560 per family, while 3-person families (123 | 17.7%) have the highest median income of $34,187 per family member.
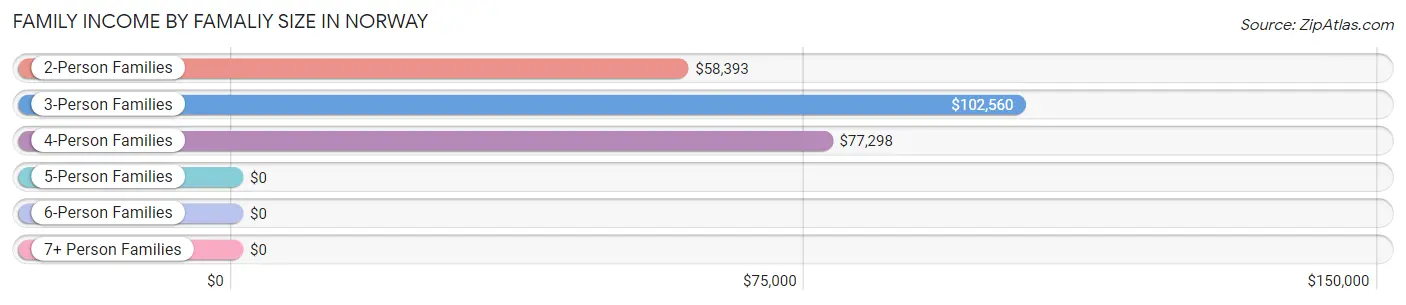
| Income Bracket | # Families | Median Income |
| 2-Person Families | 391 (56.3%) | $58,393 |
| 3-Person Families | 123 (17.7%) | $102,560 |
| 4-Person Families | 137 (19.7%) | $77,298 |
| 5-Person Families | 20 (2.9%) | $0 |
| 6-Person Families | 24 (3.5%) | $0 |
| 7+ Person Families | 0 (0.0%) | $0 |
| Total | 695 (100.0%) | $75,363 |
Family Income by Number of Earners in Norway
The median family income in Norway is $75,363, with families comprising 3+ earners (131) having the highest median family income of $103,139, while families with no earners (125) have the lowest median family income of $39,236, accounting for 18.9% and 18.0% of families, respectively.
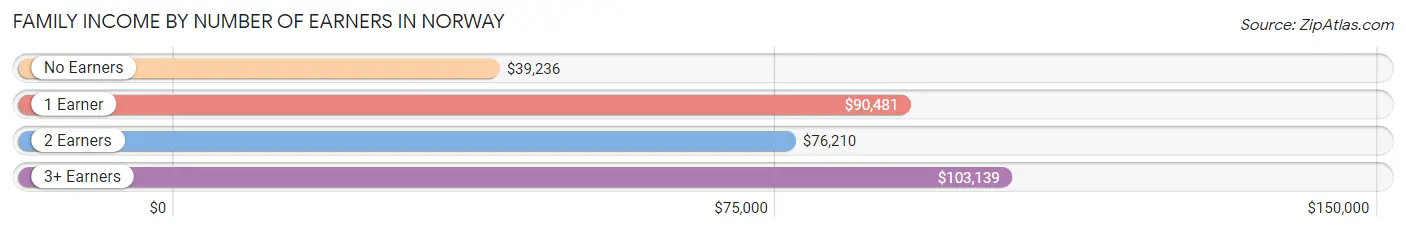
| Number of Earners | # Families | Median Income |
| No Earners | 125 (18.0%) | $39,236 |
| 1 Earner | 247 (35.5%) | $90,481 |
| 2 Earners | 192 (27.6%) | $76,210 |
| 3+ Earners | 131 (18.9%) | $103,139 |
| Total | 695 (100.0%) | $75,363 |
Household Income in Norway
Household Income Brackets in Norway
With 292 households falling in the category, the $100,000 to $149,999 income range is the most frequent in Norway, accounting for 23.1% of all households.
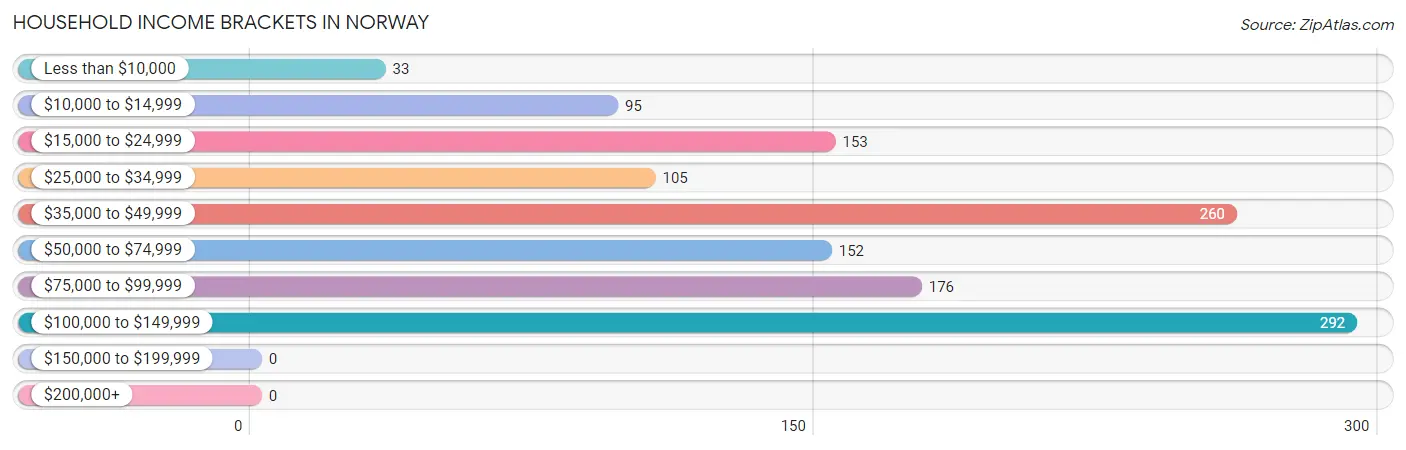
| Income Bracket | # Households | % Households |
| Less than $10,000 | 33 | 2.6% |
| $10,000 to $14,999 | 95 | 7.5% |
| $15,000 to $24,999 | 153 | 12.1% |
| $25,000 to $34,999 | 105 | 8.3% |
| $35,000 to $49,999 | 260 | 20.5% |
| $50,000 to $74,999 | 152 | 12.0% |
| $75,000 to $99,999 | 176 | 13.9% |
| $100,000 to $149,999 | 292 | 23.1% |
| $150,000 to $199,999 | 0 | 0.0% |
| $200,000+ | 0 | 0.0% |
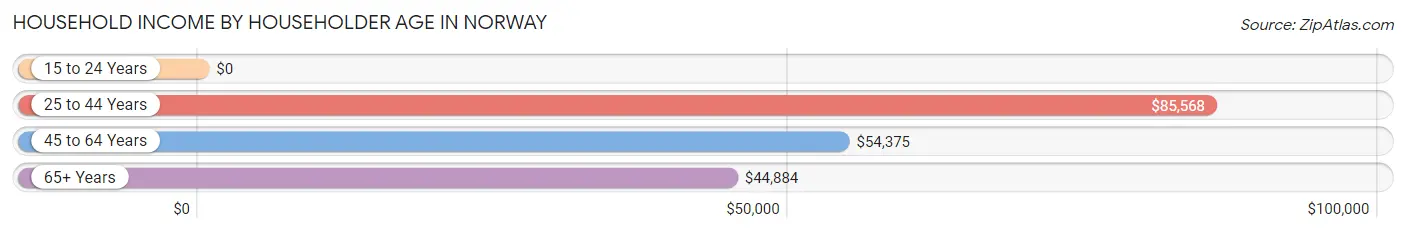
Household Income by Householder Age in Norway
The median household income in Norway is $49,261, with the highest median household income of $85,568 found in the 25 to 44 years age bracket for the primary householder. A total of 284 households (22.4%) fall into this category. Meanwhile, the 15 to 24 years age bracket for the primary householder has the lowest median household income of $0, with 32 households (2.5%) in this group.
| Income Bracket | # Households | Median Income |
| 15 to 24 Years | 32 (2.5%) | $0 |
| 25 to 44 Years | 284 (22.4%) | $85,568 |
| 45 to 64 Years | 490 (38.7%) | $54,375 |
| 65+ Years | 460 (36.3%) | $44,884 |
| Total | 1,266 (100.0%) | $49,261 |
Poverty in Norway
Income Below Poverty by Sex and Age in Norway
With 17.6% poverty level for males and 11.3% for females among the residents of Norway, 15 year old males and 75 year old and over females are the most vulnerable to poverty, with 21 males (100.0%) and 57 females (38.0%) in their respective age groups living below the poverty level.
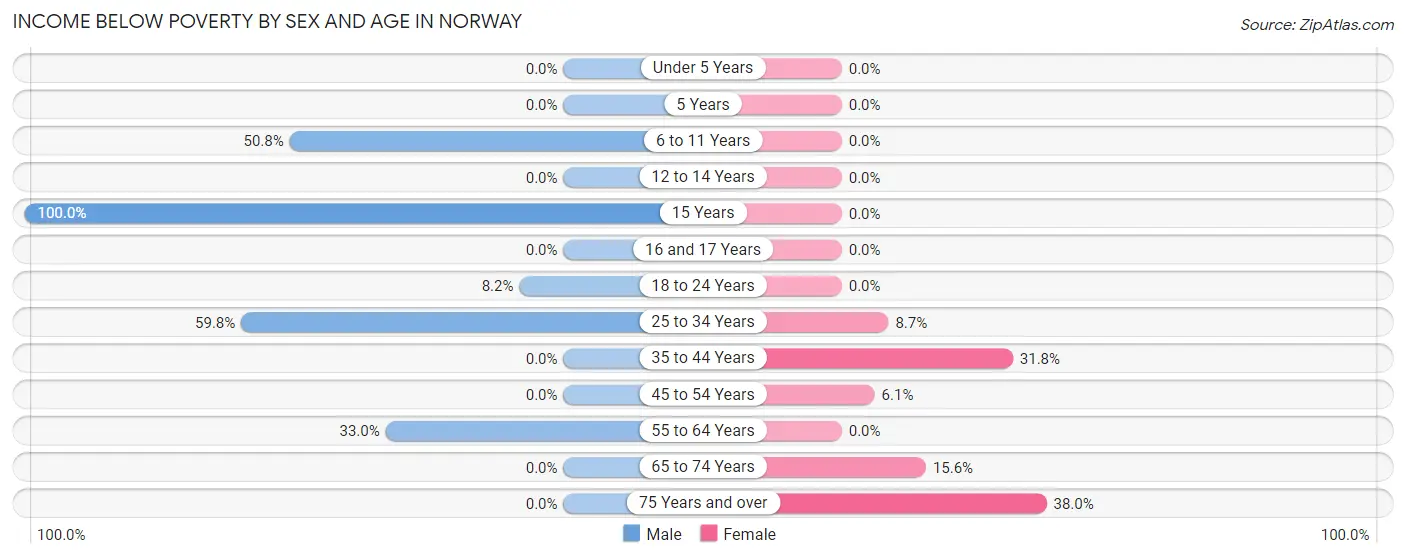
| Age Bracket | Male | Female |
| Under 5 Years | 0 (0.0%) | 0 (0.0%) |
| 5 Years | 0 (0.0%) | 0 (0.0%) |
| 6 to 11 Years | 92 (50.8%) | 0 (0.0%) |
| 12 to 14 Years | 0 (0.0%) | 0 (0.0%) |
| 15 Years | 21 (100.0%) | 0 (0.0%) |
| 16 and 17 Years | 0 (0.0%) | 0 (0.0%) |
| 18 to 24 Years | 18 (8.2%) | 0 (0.0%) |
| 25 to 34 Years | 64 (59.8%) | 17 (8.7%) |
| 35 to 44 Years | 0 (0.0%) | 40 (31.8%) |
| 45 to 54 Years | 0 (0.0%) | 13 (6.1%) |
| 55 to 64 Years | 66 (33.0%) | 0 (0.0%) |
| 65 to 74 Years | 0 (0.0%) | 25 (15.6%) |
| 75 Years and over | 0 (0.0%) | 57 (38.0%) |
| Total | 261 (17.6%) | 152 (11.3%) |
Income Above Poverty by Sex and Age in Norway
According to the poverty statistics in Norway, males aged under 5 years and females aged under 5 years are the age groups that are most secure financially, with 100.0% of males and 100.0% of females in these age groups living above the poverty line.
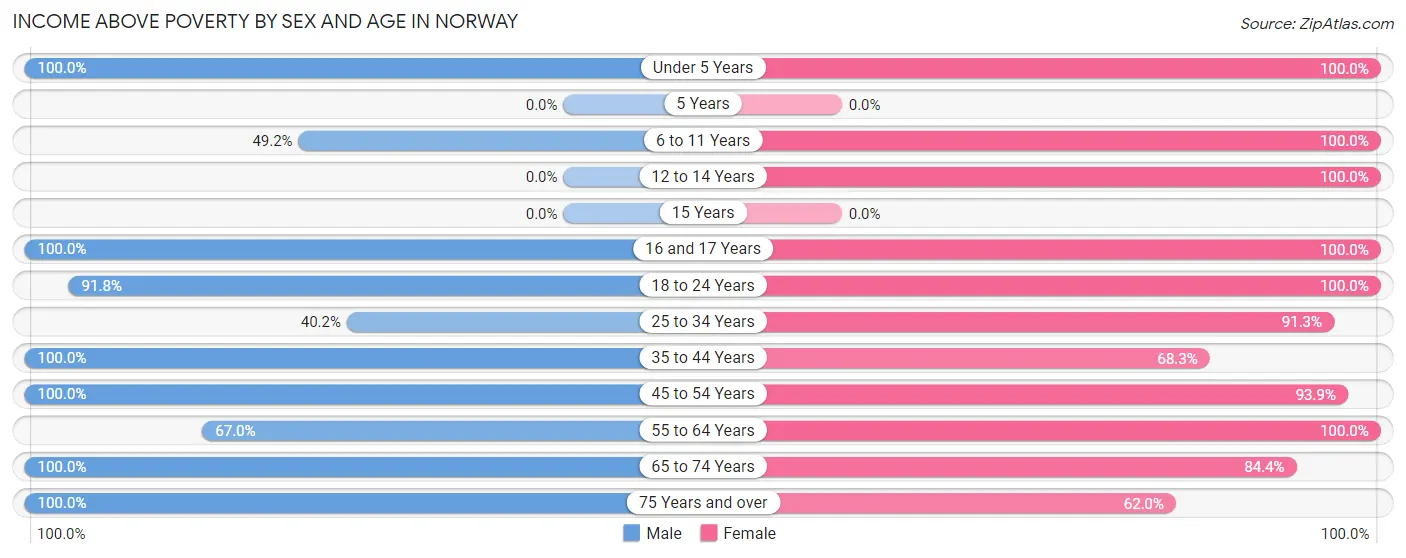
| Age Bracket | Male | Female |
| Under 5 Years | 19 (100.0%) | 88 (100.0%) |
| 5 Years | 0 (0.0%) | 0 (0.0%) |
| 6 to 11 Years | 89 (49.2%) | 23 (100.0%) |
| 12 to 14 Years | 0 (0.0%) | 42 (100.0%) |
| 15 Years | 0 (0.0%) | 0 (0.0%) |
| 16 and 17 Years | 71 (100.0%) | 30 (100.0%) |
| 18 to 24 Years | 202 (91.8%) | 108 (100.0%) |
| 25 to 34 Years | 43 (40.2%) | 179 (91.3%) |
| 35 to 44 Years | 163 (100.0%) | 86 (68.2%) |
| 45 to 54 Years | 190 (100.0%) | 200 (93.9%) |
| 55 to 64 Years | 134 (67.0%) | 210 (100.0%) |
| 65 to 74 Years | 166 (100.0%) | 135 (84.4%) |
| 75 Years and over | 148 (100.0%) | 93 (62.0%) |
| Total | 1,225 (82.4%) | 1,194 (88.7%) |
Income Below Poverty Among Married-Couple Families in Norway
The poverty statistics for married-couple families in Norway show that 11.4% or 59 of the total 517 families live below the poverty line. Families with 1 or 2 children have the highest poverty rate of 24.8%, comprising of 40 families. On the other hand, families with 3 or 4 children have the lowest poverty rate of 0.0%, which includes 0 families.
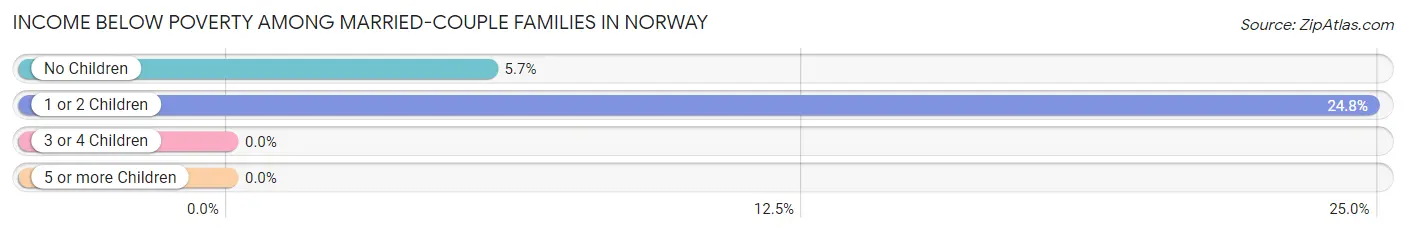
| Children | Above Poverty | Below Poverty |
| No Children | 317 (94.4%) | 19 (5.7%) |
| 1 or 2 Children | 121 (75.2%) | 40 (24.8%) |
| 3 or 4 Children | 20 (100.0%) | 0 (0.0%) |
| 5 or more Children | 0 (0.0%) | 0 (0.0%) |
| Total | 458 (88.6%) | 59 (11.4%) |
Income Below Poverty Among Single-Parent Households in Norway
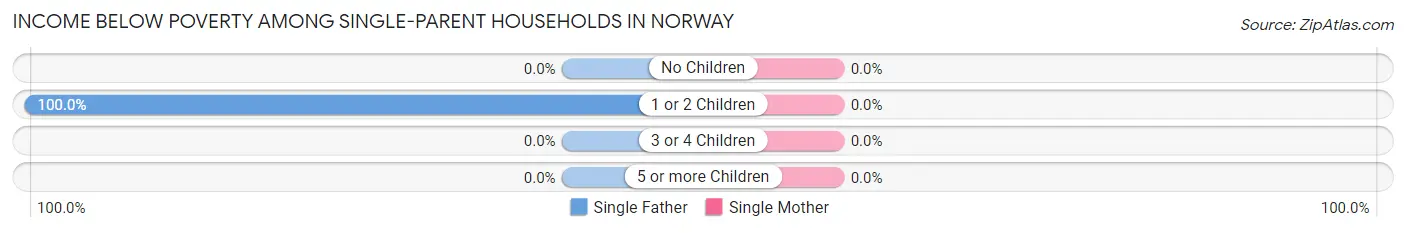
| Children | Single Father | Single Mother |
| No Children | 0 (0.0%) | 0 (0.0%) |
| 1 or 2 Children | 19 (100.0%) | 0 (0.0%) |
| 3 or 4 Children | 0 (0.0%) | 0 (0.0%) |
| 5 or more Children | 0 (0.0%) | 0 (0.0%) |
| Total | 19 (30.6%) | 0 (0.0%) |
Income Below Poverty Among Married-Couple vs Single-Parent Households in Norway
The poverty data for Norway shows that 59 of the married-couple family households (11.4%) and 19 of the single-parent households (10.7%) are living below the poverty level. Within the married-couple family households, those with 1 or 2 children have the highest poverty rate, with 40 households (24.8%) falling below the poverty line. Among the single-parent households, those with 1 or 2 children have the highest poverty rate, with 19 household (26.4%) living below poverty.
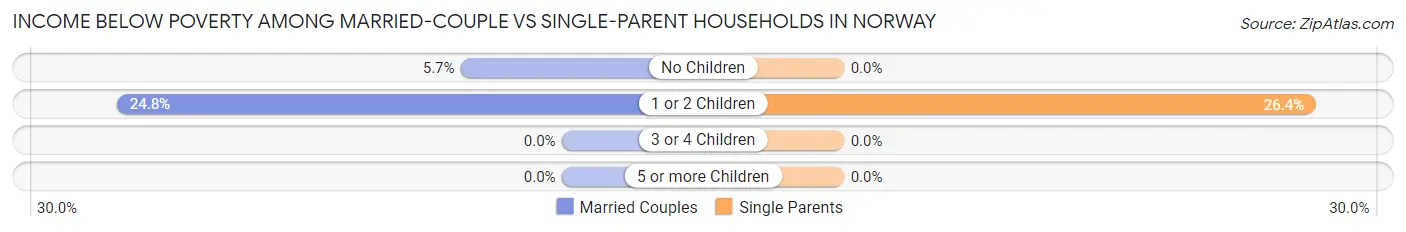
| Children | Married-Couple Families | Single-Parent Households |
| No Children | 19 (5.7%) | 0 (0.0%) |
| 1 or 2 Children | 40 (24.8%) | 19 (26.4%) |
| 3 or 4 Children | 0 (0.0%) | 0 (0.0%) |
| 5 or more Children | 0 (0.0%) | 0 (0.0%) |
| Total | 59 (11.4%) | 19 (10.7%) |
Race in Norway
The most populous races in Norway are White / Caucasian (2,685 | 94.8%), Two or more Races (97 | 3.4%), and Black / African American (31 | 1.1%).
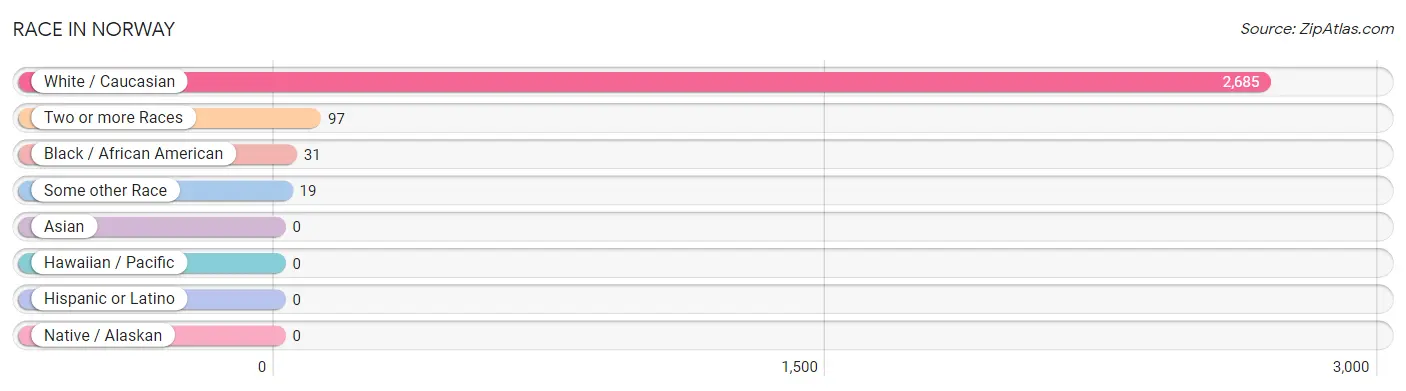
| Race | # Population | % Population |
| Asian | 0 | 0.0% |
| Black / African American | 31 | 1.1% |
| Hawaiian / Pacific | 0 | 0.0% |
| Hispanic or Latino | 0 | 0.0% |
| Native / Alaskan | 0 | 0.0% |
| White / Caucasian | 2,685 | 94.8% |
| Two or more Races | 97 | 3.4% |
| Some other Race | 19 | 0.7% |
| Total | 2,832 | 100.0% |
Ancestry in Norway
The most populous ancestries reported in Norway are German (516 | 18.2%), Irish (483 | 17.1%), American (282 | 10.0%), Italian (243 | 8.6%), and Swedish (213 | 7.5%), together accounting for 61.3% of all Norway residents.
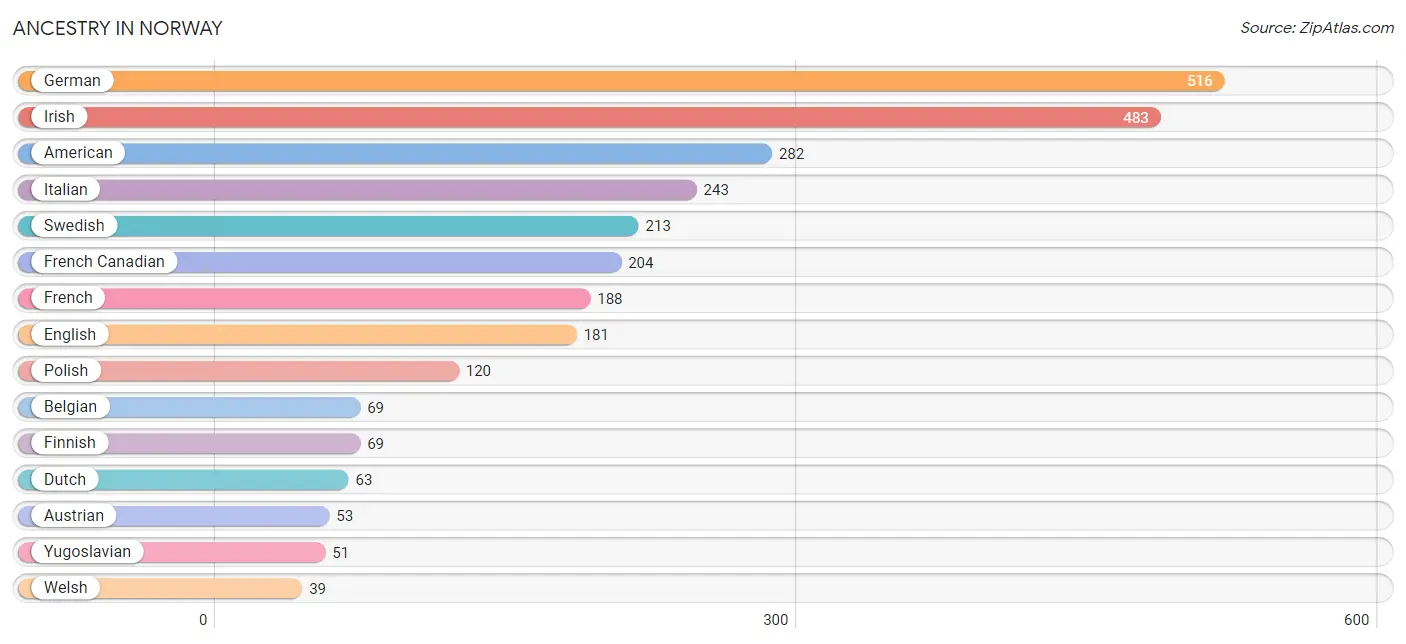
| Ancestry | # Population | % Population |
| American | 282 | 10.0% |
| Austrian | 53 | 1.9% |
| Belgian | 69 | 2.4% |
| Czech | 22 | 0.8% |
| Czechoslovakian | 15 | 0.5% |
| Dutch | 63 | 2.2% |
| English | 181 | 6.4% |
| European | 24 | 0.9% |
| Finnish | 69 | 2.4% |
| French | 188 | 6.6% |
| French American Indian | 18 | 0.6% |
| French Canadian | 204 | 7.2% |
| German | 516 | 18.2% |
| Irish | 483 | 17.1% |
| Italian | 243 | 8.6% |
| Norwegian | 15 | 0.5% |
| Polish | 120 | 4.2% |
| Swedish | 213 | 7.5% |
| Welsh | 39 | 1.4% |
| Yugoslavian | 51 | 1.8% | View All 20 Rows |
Immigrants in Norway

| Immigration Origin | # Population | % Population | View All 0 Rows |
Sex and Age in Norway
Sex and Age in Norway
The most populous age groups in Norway are 15 to 19 Years (267 | 18.0%) for men and 25 to 29 Years (141 | 10.5%) for women.
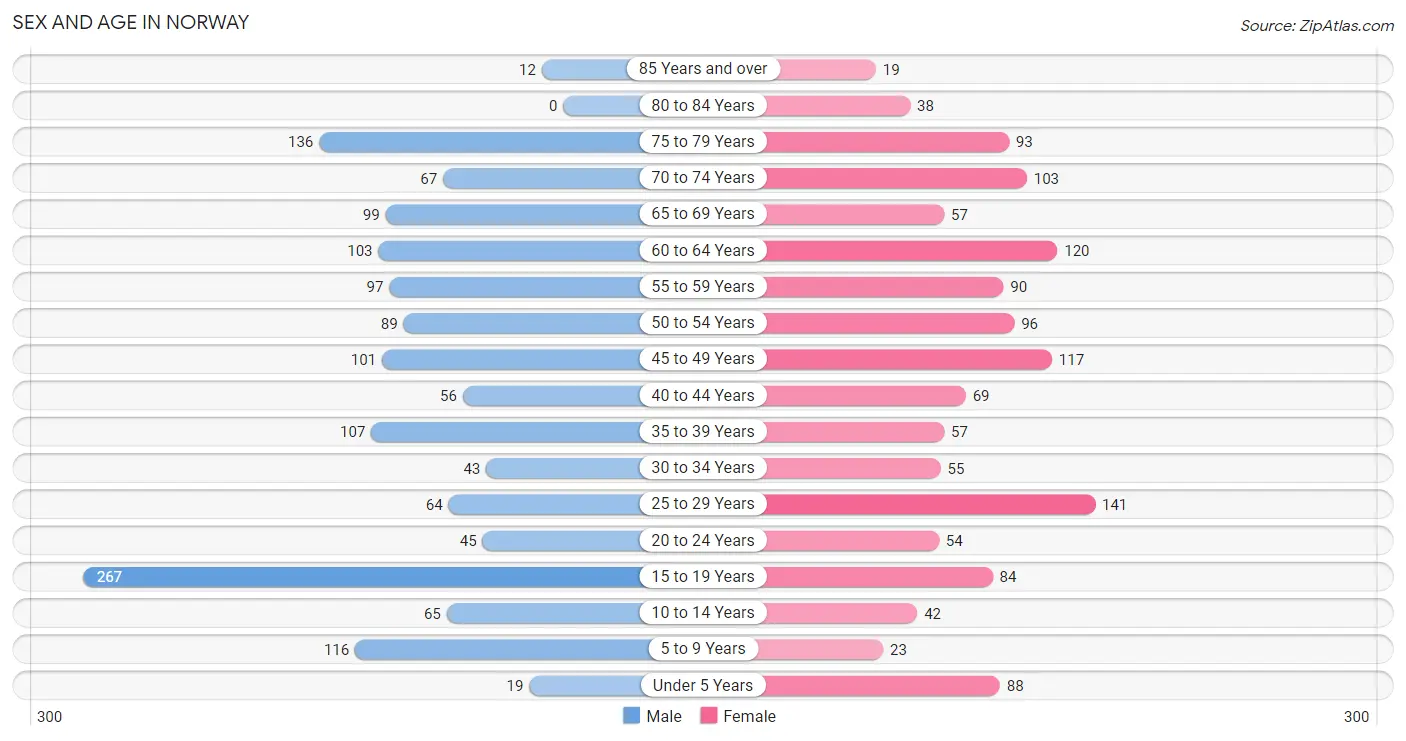
| Age Bracket | Male | Female |
| Under 5 Years | 19 (1.3%) | 88 (6.5%) |
| 5 to 9 Years | 116 (7.8%) | 23 (1.7%) |
| 10 to 14 Years | 65 (4.4%) | 42 (3.1%) |
| 15 to 19 Years | 267 (18.0%) | 84 (6.2%) |
| 20 to 24 Years | 45 (3.0%) | 54 (4.0%) |
| 25 to 29 Years | 64 (4.3%) | 141 (10.5%) |
| 30 to 34 Years | 43 (2.9%) | 55 (4.1%) |
| 35 to 39 Years | 107 (7.2%) | 57 (4.2%) |
| 40 to 44 Years | 56 (3.8%) | 69 (5.1%) |
| 45 to 49 Years | 101 (6.8%) | 117 (8.7%) |
| 50 to 54 Years | 89 (6.0%) | 96 (7.1%) |
| 55 to 59 Years | 97 (6.5%) | 90 (6.7%) |
| 60 to 64 Years | 103 (6.9%) | 120 (8.9%) |
| 65 to 69 Years | 99 (6.7%) | 57 (4.2%) |
| 70 to 74 Years | 67 (4.5%) | 103 (7.6%) |
| 75 to 79 Years | 136 (9.1%) | 93 (6.9%) |
| 80 to 84 Years | 0 (0.0%) | 38 (2.8%) |
| 85 Years and over | 12 (0.8%) | 19 (1.4%) |
| Total | 1,486 (100.0%) | 1,346 (100.0%) |
Families and Households in Norway
Median Family Size in Norway
The median family size in Norway is 3.01 persons per family, with married-couple families (517 | 74.4%) accounting for the largest median family size of 3.18 persons per family. On the other hand, single male/father families (62 | 8.9%) represent the smallest median family size with 1.76 persons per family.
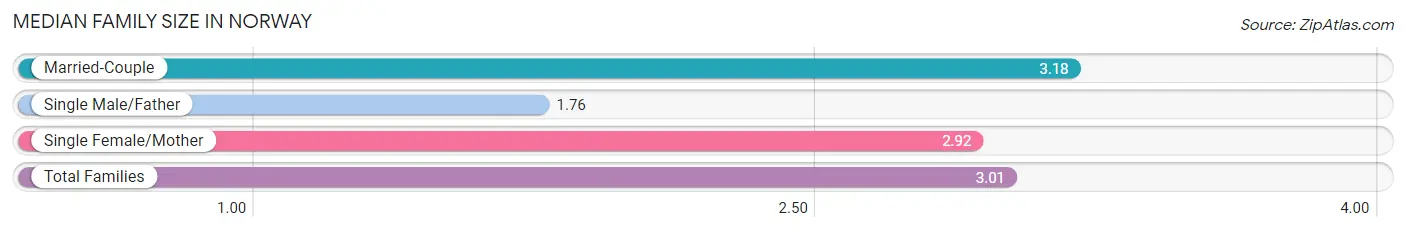
| Family Type | # Families | Family Size |
| Married-Couple | 517 (74.4%) | 3.18 |
| Single Male/Father | 62 (8.9%) | 1.76 |
| Single Female/Mother | 116 (16.7%) | 2.92 |
| Total Families | 695 (100.0%) | 3.01 |
Median Household Size in Norway
The median household size in Norway is 2.21 persons per household, with married-couple households (517 | 40.8%) accounting for the largest median household size of 3.18 persons per household. non-family households (571 | 45.1%) represent the smallest median household size with 1.24 persons per household.
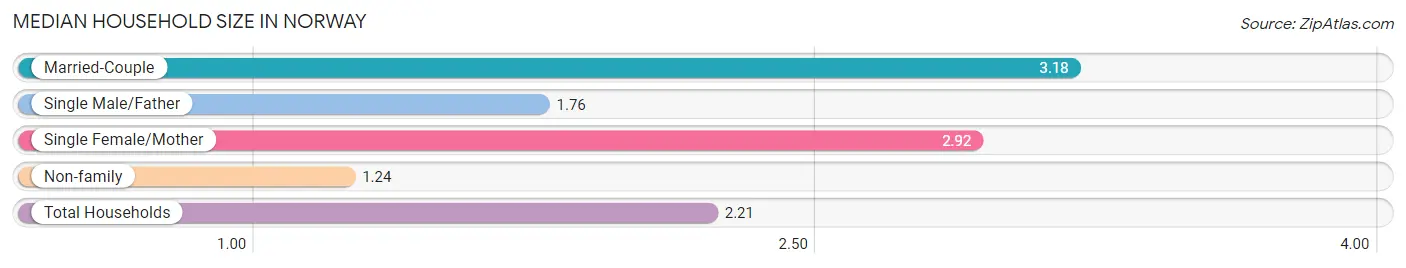
| Household Type | # Households | Household Size |
| Married-Couple | 517 (40.8%) | 3.18 |
| Single Male/Father | 62 (4.9%) | 1.76 |
| Single Female/Mother | 116 (9.2%) | 2.92 |
| Non-family | 571 (45.1%) | 1.24 |
| Total Households | 1,266 (100.0%) | 2.21 |
Household Size by Marriage Status in Norway
Out of a total of 1,266 households in Norway, 695 (54.9%) are family households, while 571 (45.1%) are nonfamily households. The most numerous type of family households are 2-person households, comprising 391, and the most common type of nonfamily households are 1-person households, comprising 469.
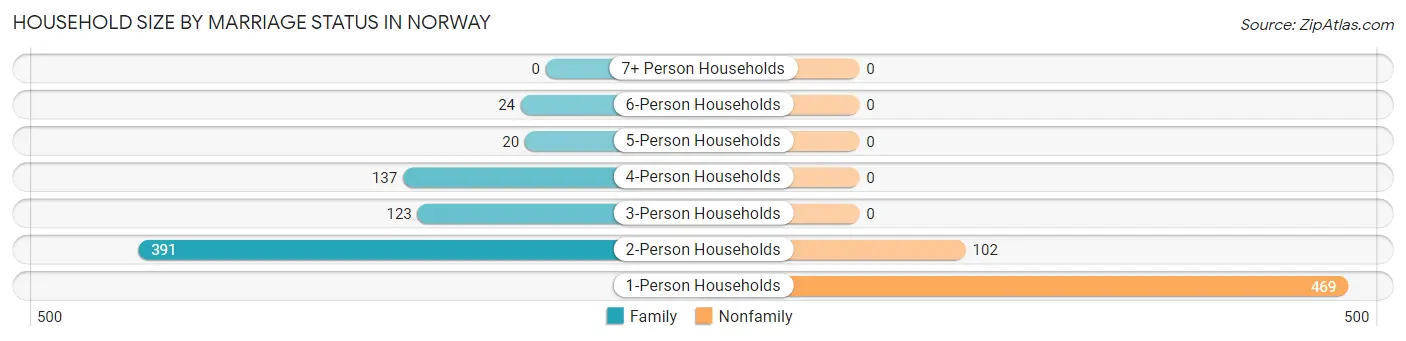
| Household Size | Family Households | Nonfamily Households |
| 1-Person Households | - | 469 (37.0%) |
| 2-Person Households | 391 (30.9%) | 102 (8.1%) |
| 3-Person Households | 123 (9.7%) | 0 (0.0%) |
| 4-Person Households | 137 (10.8%) | 0 (0.0%) |
| 5-Person Households | 20 (1.6%) | 0 (0.0%) |
| 6-Person Households | 24 (1.9%) | 0 (0.0%) |
| 7+ Person Households | 0 (0.0%) | 0 (0.0%) |
| Total | 695 (54.9%) | 571 (45.1%) |
Female Fertility in Norway
Fertility by Age in Norway
Average fertility rate in Norway is 83.0 births per 1,000 women. Women in the age bracket of 20 to 34 years have the highest fertility rate with 128.0 births per 1,000 women. Women in the age bracket of 20 to 34 years acount for 66.7% of all women with births.
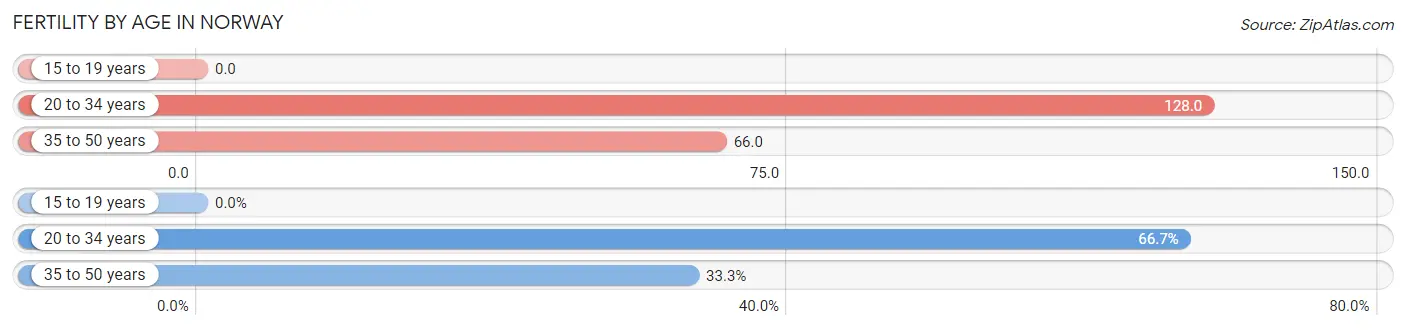
| Age Bracket | Women with Births | Births / 1,000 Women |
| 15 to 19 years | 0 (0.0%) | 0.0 |
| 20 to 34 years | 32 (66.7%) | 128.0 |
| 35 to 50 years | 16 (33.3%) | 66.0 |
| Total | 48 (100.0%) | 83.0 |
Fertility by Age by Marriage Status in Norway
33.3% of women with births (48) in Norway are married. The highest percentage of unmarried women with births falls into 20 to 34 years age bracket with 100.0% of them unmarried at the time of birth, while the lowest percentage of unmarried women with births belong to 35 to 50 years age bracket with 0.0% of them unmarried.
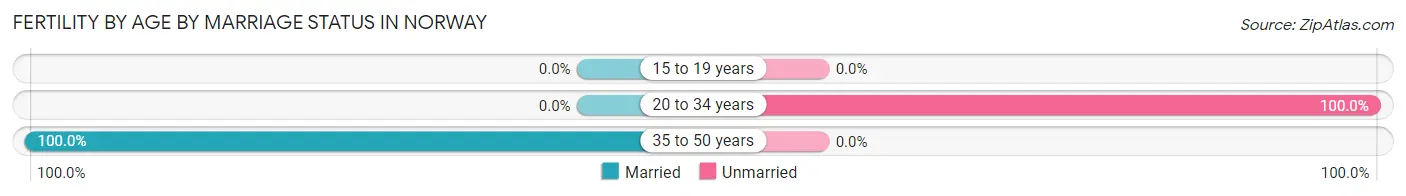
| Age Bracket | Married | Unmarried |
| 15 to 19 years | 0 (0.0%) | 0 (0.0%) |
| 20 to 34 years | 0 (0.0%) | 32 (100.0%) |
| 35 to 50 years | 16 (100.0%) | 0 (0.0%) |
| Total | 16 (33.3%) | 32 (66.7%) |
Fertility by Education in Norway
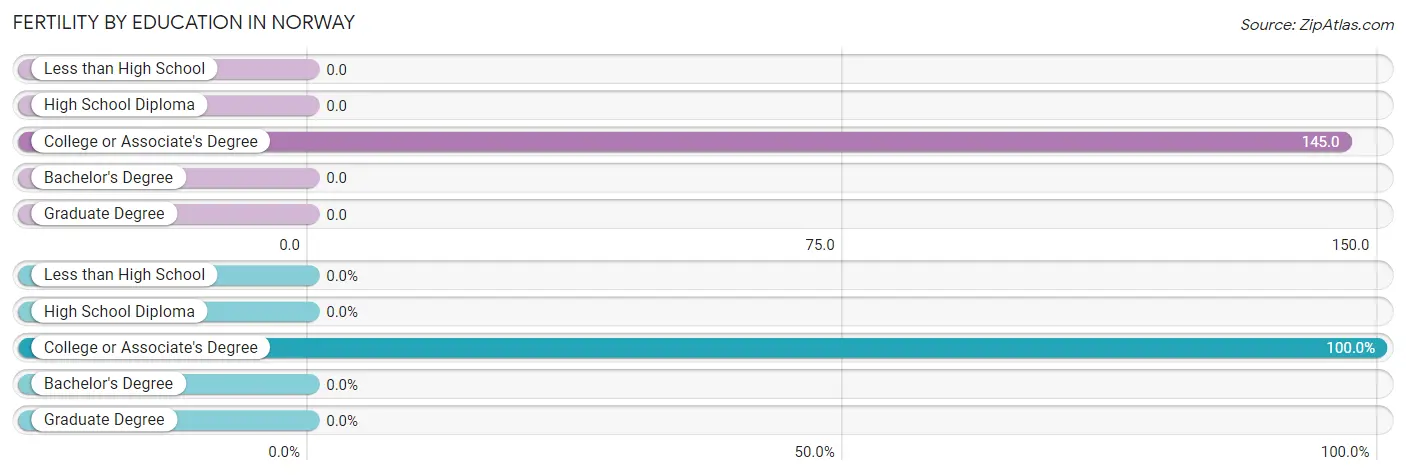
| Educational Attainment | Women with Births | Births / 1,000 Women |
| Less than High School | 0 (0.0%) | 0.0 |
| High School Diploma | 0 (0.0%) | 0.0 |
| College or Associate's Degree | 48 (100.0%) | 145.0 |
| Bachelor's Degree | 0 (0.0%) | 0.0 |
| Graduate Degree | 0 (0.0%) | 0.0 |
| Total | 48 (100.0%) | 83.0 |
Fertility by Education by Marriage Status in Norway
66.7% of women with births in Norway are unmarried. Women with the educational attainment of college or associate's degree are most likely to be married with 33.3% of them married at childbirth, while women with the educational attainment of college or associate's degree are least likely to be married with 66.7% of them unmarried at childbirth.
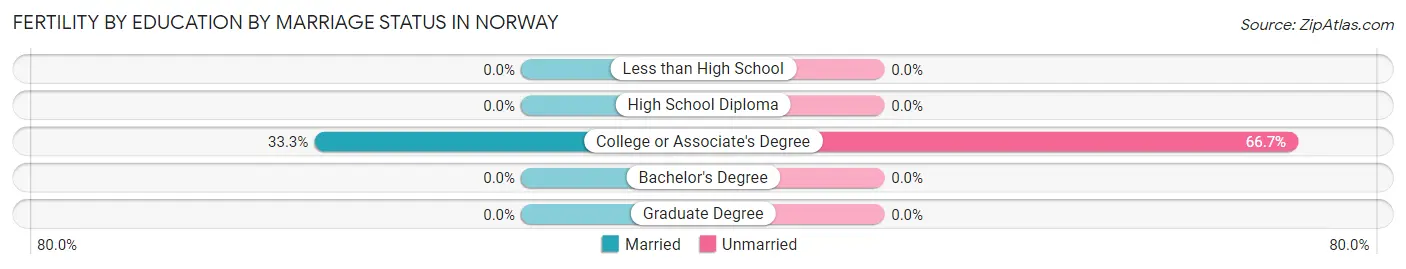
| Educational Attainment | Married | Unmarried |
| Less than High School | 0 (0.0%) | 0 (0.0%) |
| High School Diploma | 0 (0.0%) | 0 (0.0%) |
| College or Associate's Degree | 16 (33.3%) | 32 (66.7%) |
| Bachelor's Degree | 0 (0.0%) | 0 (0.0%) |
| Graduate Degree | 0 (0.0%) | 0 (0.0%) |
| Total | 16 (33.3%) | 32 (66.7%) |
Employment Characteristics in Norway
Employment by Class of Employer in Norway
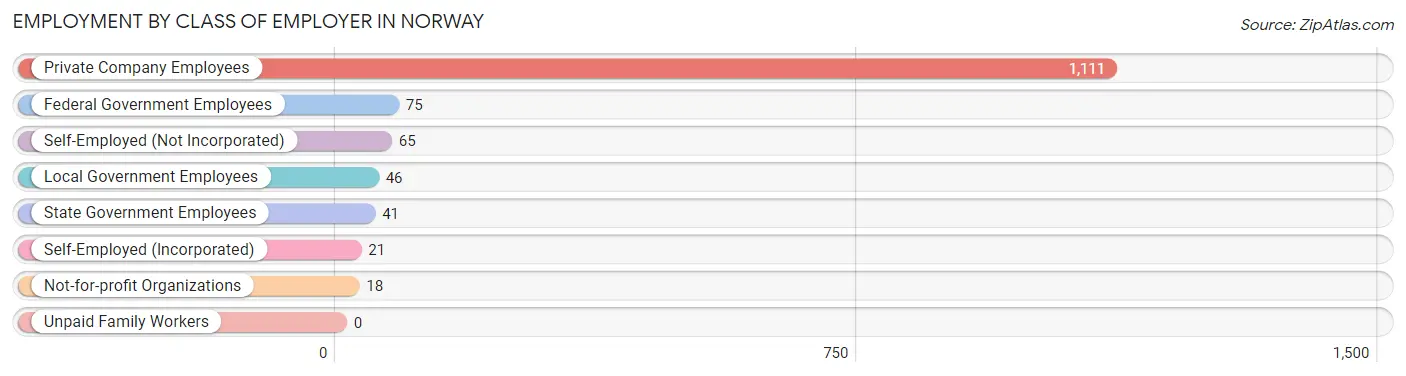
Among the 1,377 employed individuals in Norway, private company employees (1,111 | 80.7%), federal government employees (75 | 5.4%), and self-employed (not incorporated) (65 | 4.7%) make up the most common classes of employment.
| Employer Class | # Employees | % Employees |
| Private Company Employees | 1,111 | 80.7% |
| Self-Employed (Incorporated) | 21 | 1.5% |
| Self-Employed (Not Incorporated) | 65 | 4.7% |
| Not-for-profit Organizations | 18 | 1.3% |
| Local Government Employees | 46 | 3.3% |
| State Government Employees | 41 | 3.0% |
| Federal Government Employees | 75 | 5.4% |
| Unpaid Family Workers | 0 | 0.0% |
| Total | 1,377 | 100.0% |
Employment Status by Age in Norway
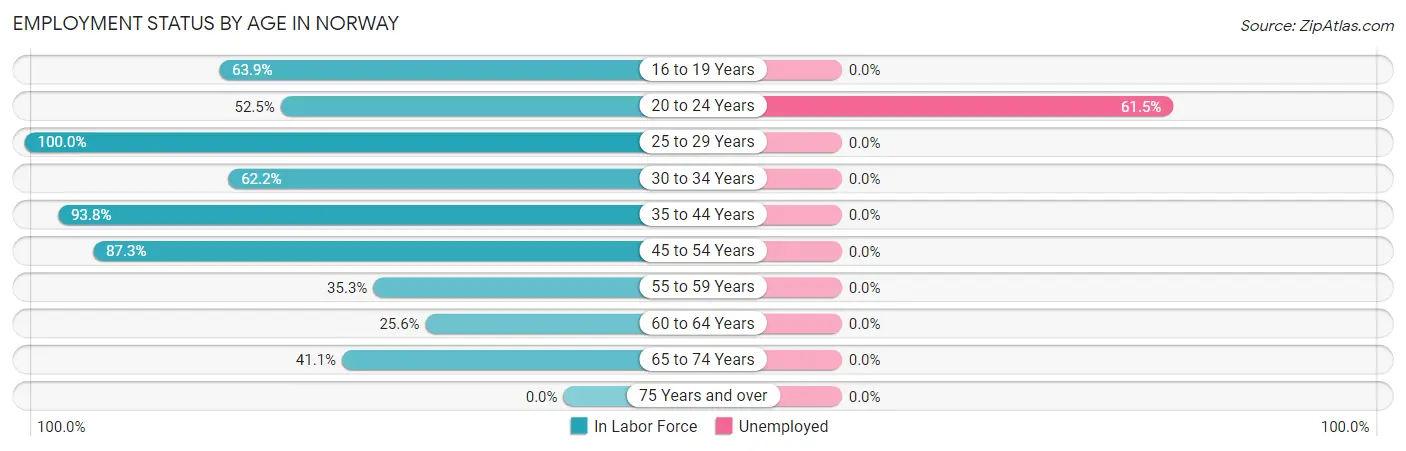
According to the labor force statistics for Norway, out of the total population over 16 years of age (2,458), 57.3% or 1,408 individuals are in the labor force, with 2.3% or 32 of them unemployed. The age group with the highest labor force participation rate is 25 to 29 years, with 100.0% or 205 individuals in the labor force. Within the labor force, the 20 to 24 years age range has the highest percentage of unemployed individuals, with 61.5% or 32 of them being unemployed.
| Age Bracket | In Labor Force | Unemployed |
| 16 to 19 Years | 211 (63.9%) | 0 (0.0%) |
| 20 to 24 Years | 52 (52.5%) | 32 (61.5%) |
| 25 to 29 Years | 205 (100.0%) | 0 (0.0%) |
| 30 to 34 Years | 61 (62.2%) | 0 (0.0%) |
| 35 to 44 Years | 271 (93.8%) | 0 (0.0%) |
| 45 to 54 Years | 352 (87.3%) | 0 (0.0%) |
| 55 to 59 Years | 66 (35.3%) | 0 (0.0%) |
| 60 to 64 Years | 57 (25.6%) | 0 (0.0%) |
| 65 to 74 Years | 134 (41.1%) | 0 (0.0%) |
| 75 Years and over | 0 (0.0%) | 0 (0.0%) |
| Total | 1,408 (57.3%) | 32 (2.3%) |
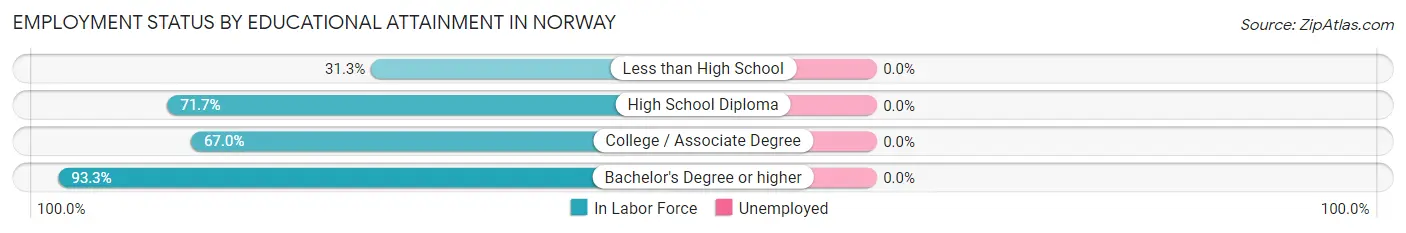
Employment Status by Educational Attainment in Norway
| Educational Attainment | In Labor Force | Unemployed |
| Less than High School | 21 (31.3%) | 0 (0.0%) |
| High School Diploma | 306 (71.7%) | 0 (0.0%) |
| College / Associate Degree | 420 (67.0%) | 0 (0.0%) |
| Bachelor's Degree or higher | 265 (93.3%) | 0 (0.0%) |
| Total | 1,012 (72.0%) | 0 (0.0%) |
Employment Occupations by Sex in Norway
Management, Business, Science and Arts Occupations
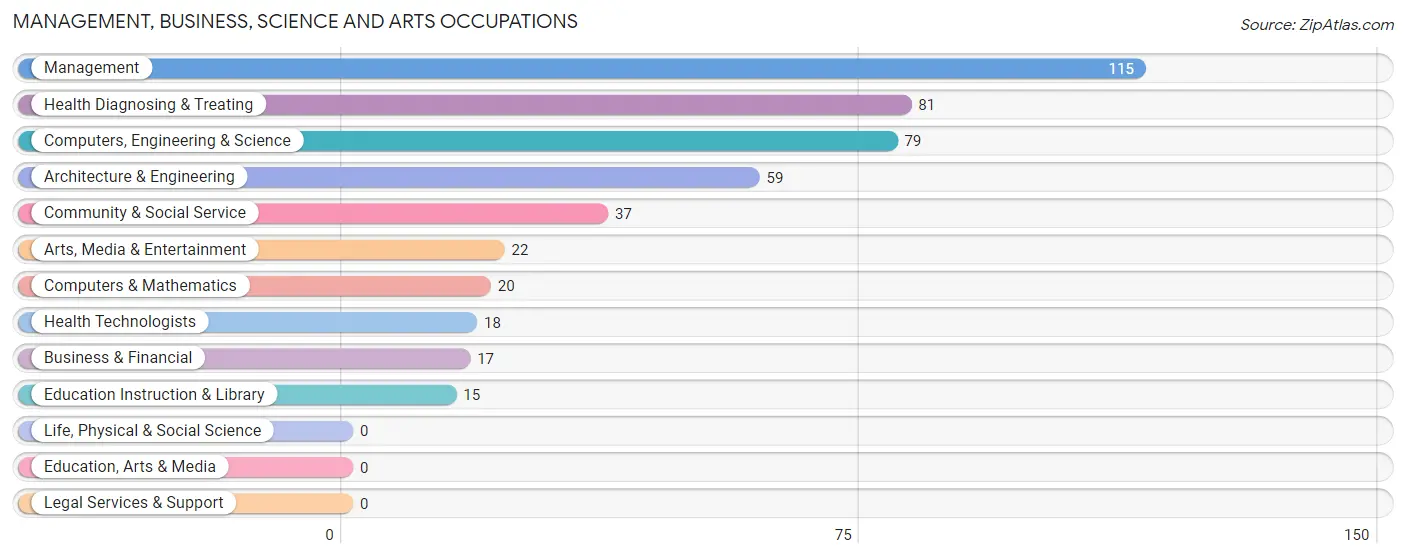
The most common Management, Business, Science and Arts occupations in Norway are Management (115 | 8.4%), Health Diagnosing & Treating (81 | 5.9%), Computers, Engineering & Science (79 | 5.7%), Architecture & Engineering (59 | 4.3%), and Community & Social Service (37 | 2.7%).
Management, Business, Science and Arts Occupations by Sex
Within the Management, Business, Science and Arts occupations in Norway, the most male-oriented occupations are Computers, Engineering & Science (100.0%), Computers & Mathematics (100.0%), and Architecture & Engineering (100.0%), while the most female-oriented occupations are Business & Financial (100.0%), Community & Social Service (100.0%), and Education Instruction & Library (100.0%).
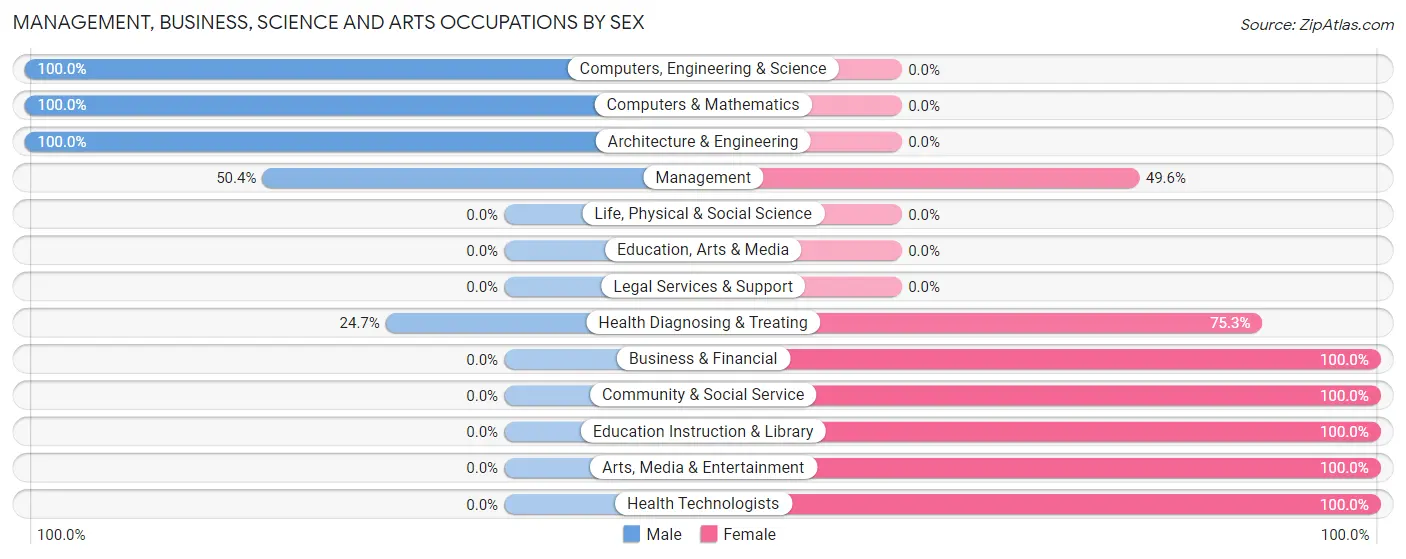
| Occupation | Male | Female |
| Management | 58 (50.4%) | 57 (49.6%) |
| Business & Financial | 0 (0.0%) | 17 (100.0%) |
| Computers, Engineering & Science | 79 (100.0%) | 0 (0.0%) |
| Computers & Mathematics | 20 (100.0%) | 0 (0.0%) |
| Architecture & Engineering | 59 (100.0%) | 0 (0.0%) |
| Life, Physical & Social Science | 0 (0.0%) | 0 (0.0%) |
| Community & Social Service | 0 (0.0%) | 37 (100.0%) |
| Education, Arts & Media | 0 (0.0%) | 0 (0.0%) |
| Legal Services & Support | 0 (0.0%) | 0 (0.0%) |
| Education Instruction & Library | 0 (0.0%) | 15 (100.0%) |
| Arts, Media & Entertainment | 0 (0.0%) | 22 (100.0%) |
| Health Diagnosing & Treating | 20 (24.7%) | 61 (75.3%) |
| Health Technologists | 0 (0.0%) | 18 (100.0%) |
| Total (Category) | 157 (47.7%) | 172 (52.3%) |
| Total (Overall) | 717 (52.1%) | 660 (47.9%) |
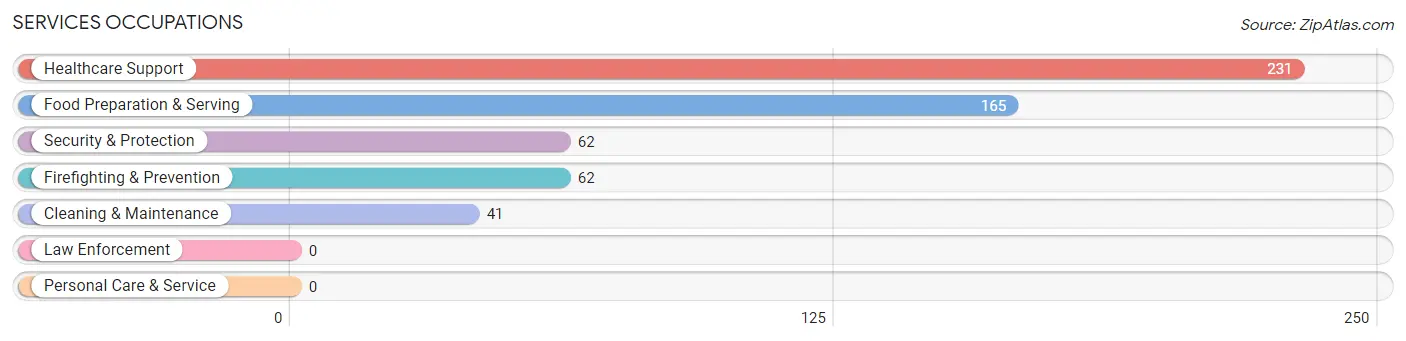
Services Occupations
The most common Services occupations in Norway are Healthcare Support (231 | 16.8%), Food Preparation & Serving (165 | 12.0%), Security & Protection (62 | 4.5%), Firefighting & Prevention (62 | 4.5%), and Cleaning & Maintenance (41 | 3.0%).
Services Occupations by Sex
Within the Services occupations in Norway, the most male-oriented occupations are Security & Protection (100.0%), Firefighting & Prevention (100.0%), and Cleaning & Maintenance (100.0%), while the most female-oriented occupations are Healthcare Support (100.0%), and Food Preparation & Serving (49.1%).
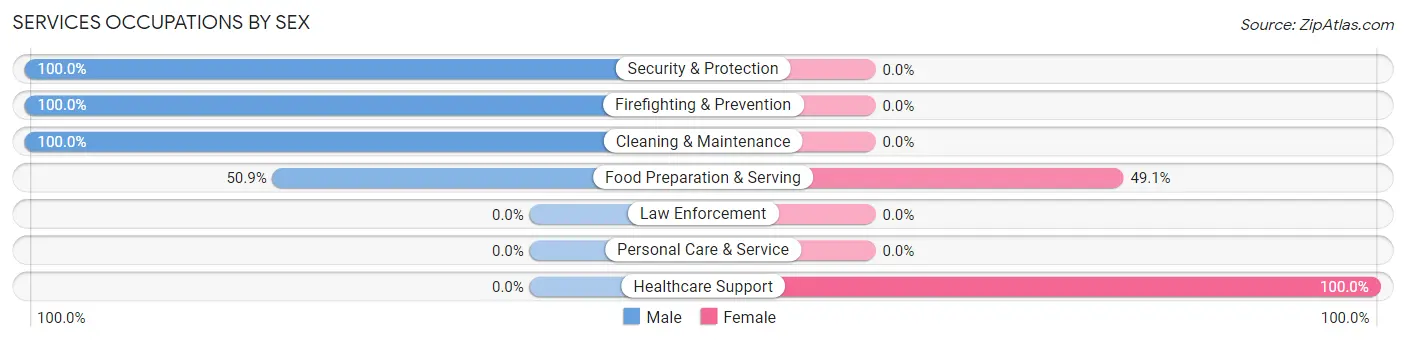
| Occupation | Male | Female |
| Healthcare Support | 0 (0.0%) | 231 (100.0%) |
| Security & Protection | 62 (100.0%) | 0 (0.0%) |
| Firefighting & Prevention | 62 (100.0%) | 0 (0.0%) |
| Law Enforcement | 0 (0.0%) | 0 (0.0%) |
| Food Preparation & Serving | 84 (50.9%) | 81 (49.1%) |
| Cleaning & Maintenance | 41 (100.0%) | 0 (0.0%) |
| Personal Care & Service | 0 (0.0%) | 0 (0.0%) |
| Total (Category) | 187 (37.5%) | 312 (62.5%) |
| Total (Overall) | 717 (52.1%) | 660 (47.9%) |
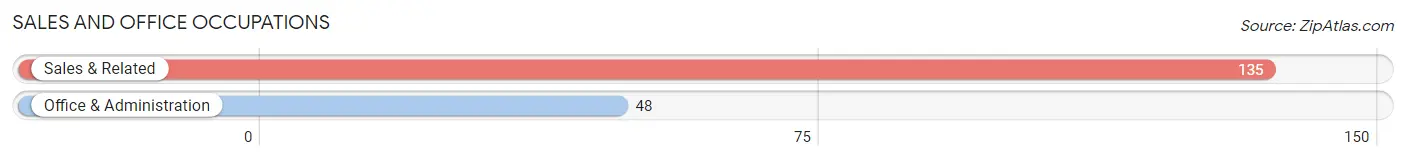
Sales and Office Occupations
The most common Sales and Office occupations in Norway are Sales & Related (135 | 9.8%), and Office & Administration (48 | 3.5%).
Sales and Office Occupations by Sex
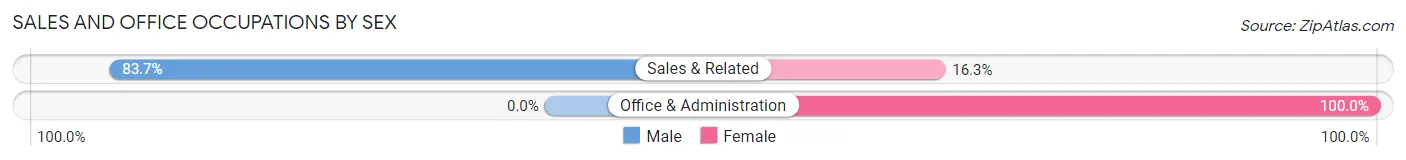
| Occupation | Male | Female |
| Sales & Related | 113 (83.7%) | 22 (16.3%) |
| Office & Administration | 0 (0.0%) | 48 (100.0%) |
| Total (Category) | 113 (61.8%) | 70 (38.3%) |
| Total (Overall) | 717 (52.1%) | 660 (47.9%) |
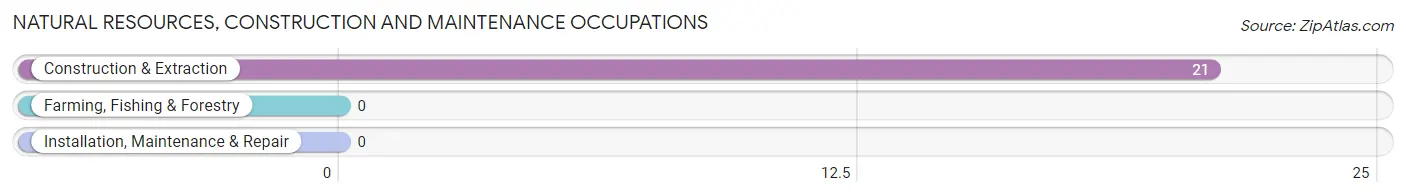
Natural Resources, Construction and Maintenance Occupations
The most common Natural Resources, Construction and Maintenance occupations in Norway are , and Construction & Extraction (21 | 1.5%).
Natural Resources, Construction and Maintenance Occupations by Sex
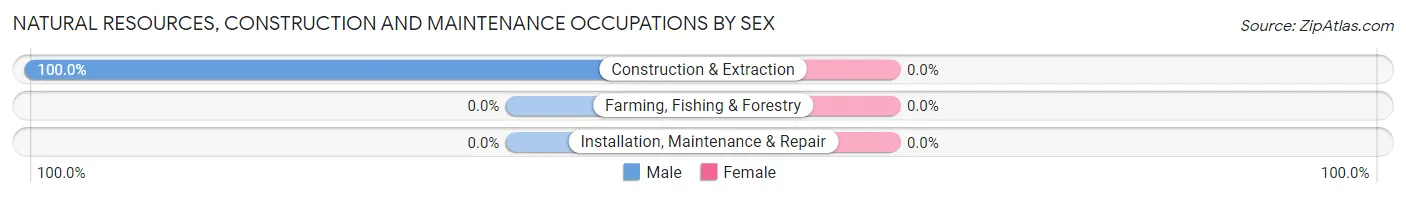
| Occupation | Male | Female |
| Farming, Fishing & Forestry | 0 (0.0%) | 0 (0.0%) |
| Construction & Extraction | 21 (100.0%) | 0 (0.0%) |
| Installation, Maintenance & Repair | 0 (0.0%) | 0 (0.0%) |
| Total (Category) | 21 (100.0%) | 0 (0.0%) |
| Total (Overall) | 717 (52.1%) | 660 (47.9%) |
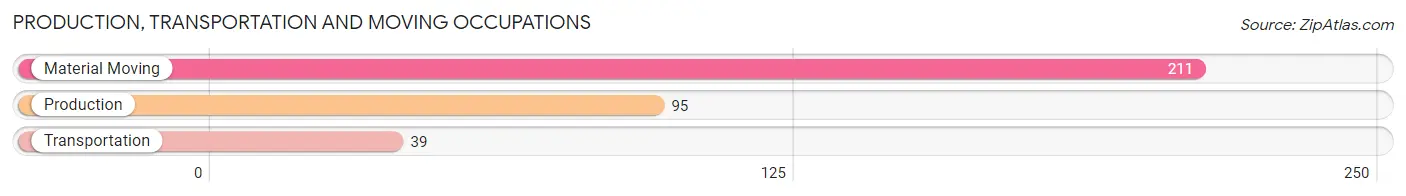
Production, Transportation and Moving Occupations
The most common Production, Transportation and Moving occupations in Norway are Material Moving (211 | 15.3%), Production (95 | 6.9%), and Transportation (39 | 2.8%).
Production, Transportation and Moving Occupations by Sex
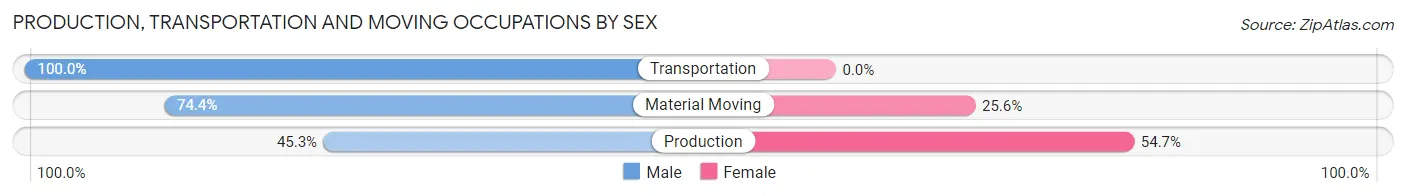
| Occupation | Male | Female |
| Production | 43 (45.3%) | 52 (54.7%) |
| Transportation | 39 (100.0%) | 0 (0.0%) |
| Material Moving | 157 (74.4%) | 54 (25.6%) |
| Total (Category) | 239 (69.3%) | 106 (30.7%) |
| Total (Overall) | 717 (52.1%) | 660 (47.9%) |
Employment Industries by Sex in Norway
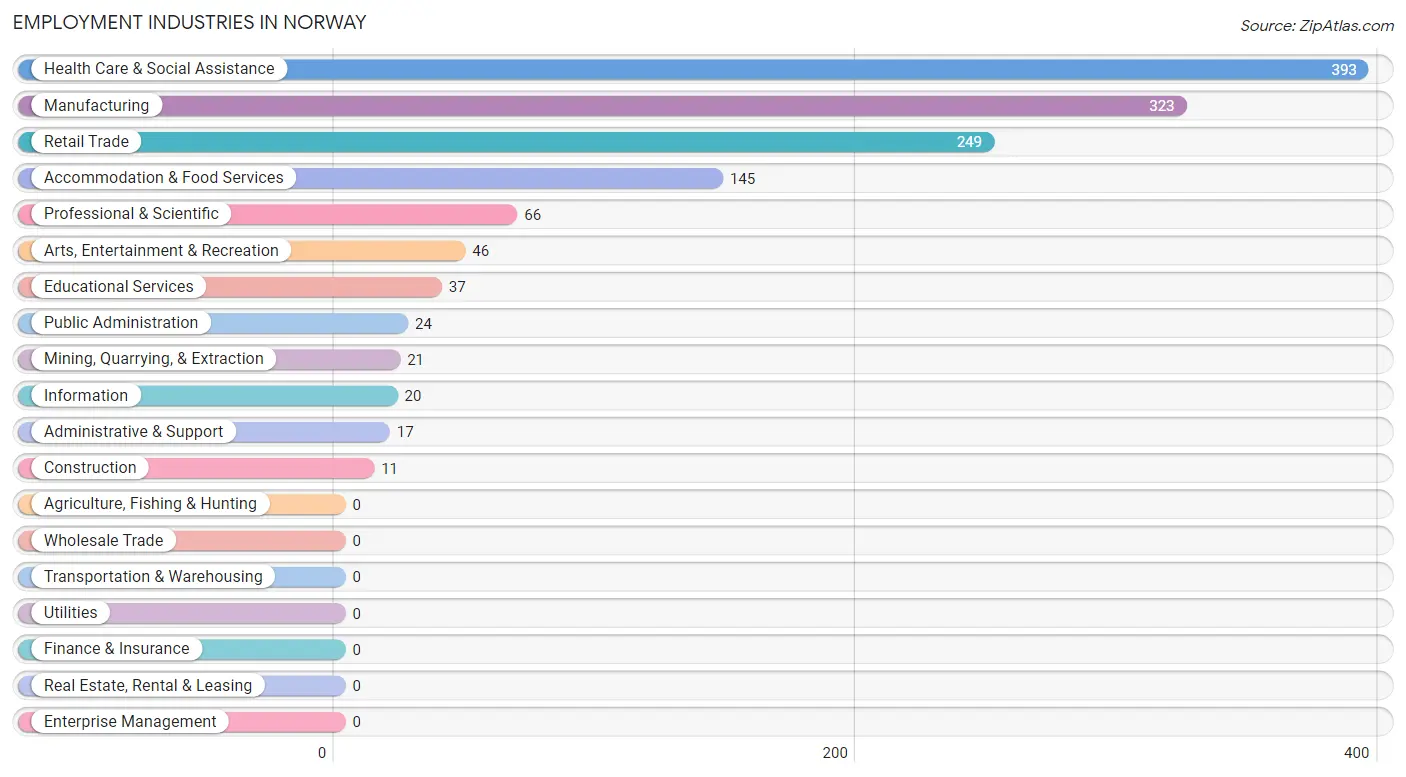
Employment Industries in Norway
The major employment industries in Norway include Health Care & Social Assistance (393 | 28.5%), Manufacturing (323 | 23.5%), Retail Trade (249 | 18.1%), Accommodation & Food Services (145 | 10.5%), and Professional & Scientific (66 | 4.8%).
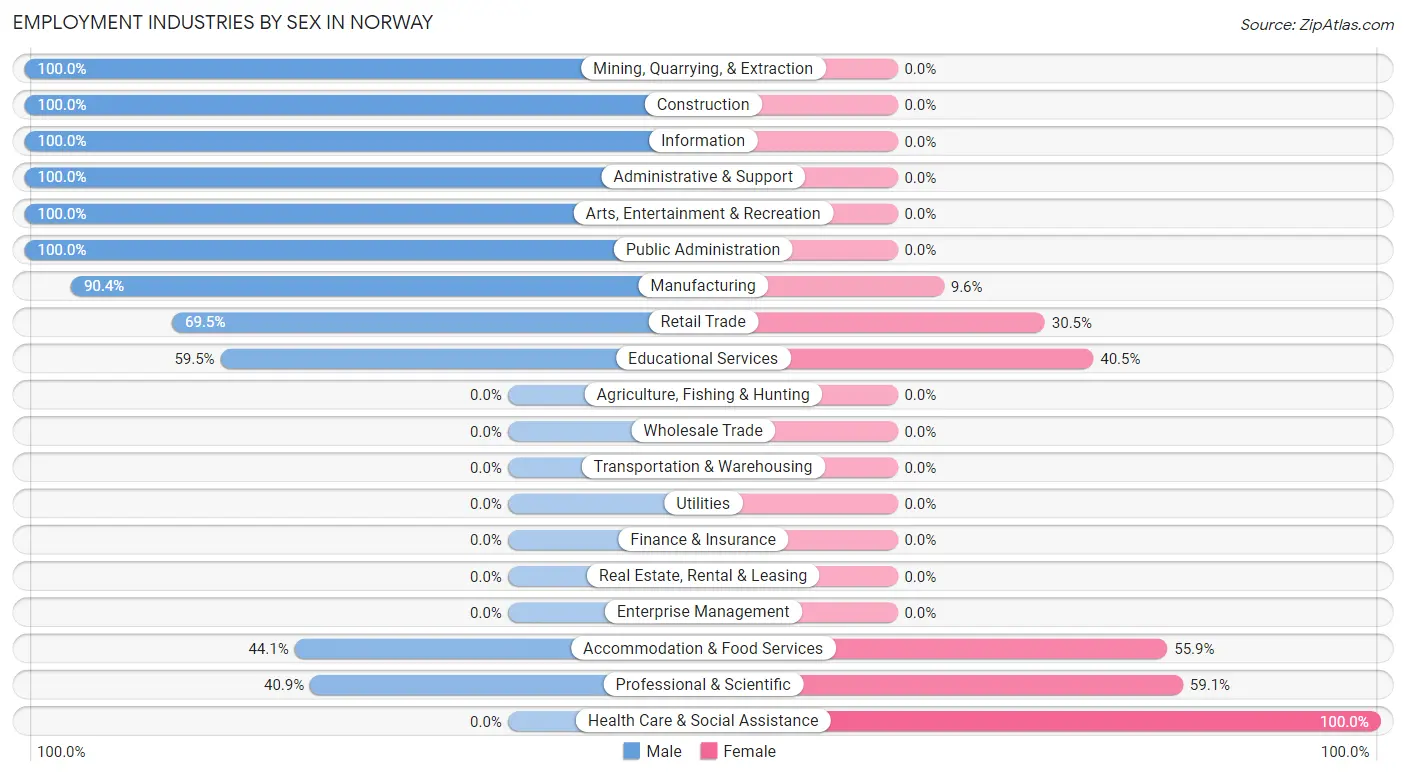
Employment Industries by Sex in Norway
The Norway industries that see more men than women are Mining, Quarrying, & Extraction (100.0%), Construction (100.0%), and Information (100.0%), whereas the industries that tend to have a higher number of women are Health Care & Social Assistance (100.0%), Professional & Scientific (59.1%), and Accommodation & Food Services (55.9%).
| Industry | Male | Female |
| Agriculture, Fishing & Hunting | 0 (0.0%) | 0 (0.0%) |
| Mining, Quarrying, & Extraction | 21 (100.0%) | 0 (0.0%) |
| Construction | 11 (100.0%) | 0 (0.0%) |
| Manufacturing | 292 (90.4%) | 31 (9.6%) |
| Wholesale Trade | 0 (0.0%) | 0 (0.0%) |
| Retail Trade | 173 (69.5%) | 76 (30.5%) |
| Transportation & Warehousing | 0 (0.0%) | 0 (0.0%) |
| Utilities | 0 (0.0%) | 0 (0.0%) |
| Information | 20 (100.0%) | 0 (0.0%) |
| Finance & Insurance | 0 (0.0%) | 0 (0.0%) |
| Real Estate, Rental & Leasing | 0 (0.0%) | 0 (0.0%) |
| Professional & Scientific | 27 (40.9%) | 39 (59.1%) |
| Enterprise Management | 0 (0.0%) | 0 (0.0%) |
| Administrative & Support | 17 (100.0%) | 0 (0.0%) |
| Educational Services | 22 (59.5%) | 15 (40.5%) |
| Health Care & Social Assistance | 0 (0.0%) | 393 (100.0%) |
| Arts, Entertainment & Recreation | 46 (100.0%) | 0 (0.0%) |
| Accommodation & Food Services | 64 (44.1%) | 81 (55.9%) |
| Public Administration | 24 (100.0%) | 0 (0.0%) |
| Total | 717 (52.1%) | 660 (47.9%) |
Education in Norway
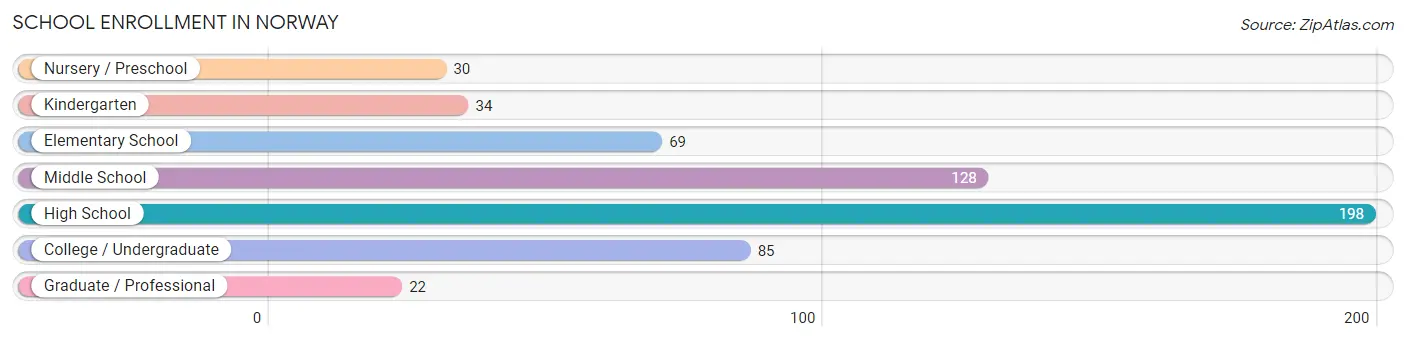
School Enrollment in Norway
The most common levels of schooling among the 566 students in Norway are high school (198 | 35.0%), middle school (128 | 22.6%), and college / undergraduate (85 | 15.0%).
| School Level | # Students | % Students |
| Nursery / Preschool | 30 | 5.3% |
| Kindergarten | 34 | 6.0% |
| Elementary School | 69 | 12.2% |
| Middle School | 128 | 22.6% |
| High School | 198 | 35.0% |
| College / Undergraduate | 85 | 15.0% |
| Graduate / Professional | 22 | 3.9% |
| Total | 566 | 100.0% |
School Enrollment by Age by Funding Source in Norway
Out of a total of 566 students who are enrolled in schools in Norway, 70 (12.4%) attend a private institution, while the remaining 496 (87.6%) are enrolled in public schools. The age group of 15 to 17 year olds has the highest likelihood of being enrolled in private schools, with 28 (23.0% in the age bracket) enrolled. Conversely, the age group of 3 to 4 year olds has the lowest likelihood of being enrolled in a private school, with 30 (100.0% in the age bracket) attending a public institution.
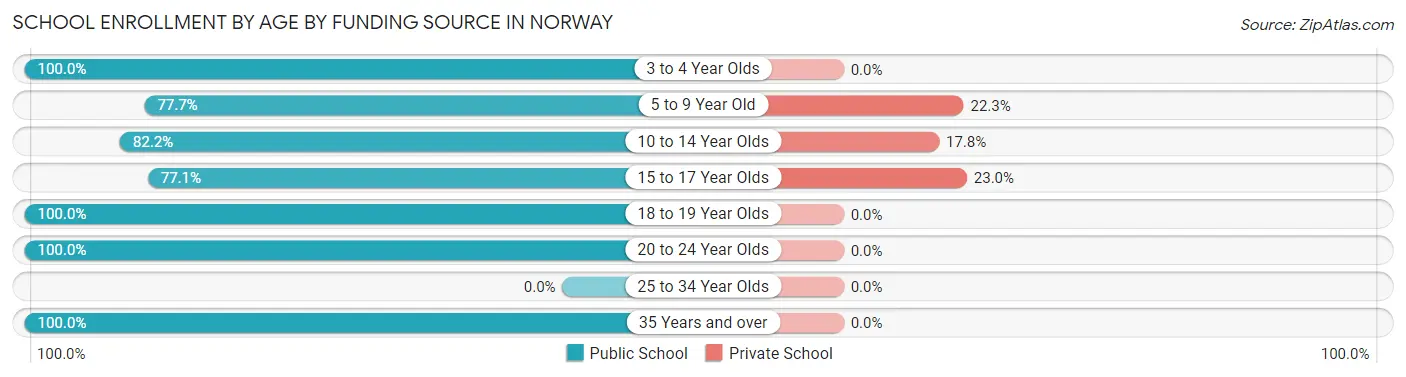
| Age Bracket | Public School | Private School |
| 3 to 4 Year Olds | 30 (100.0%) | 0 (0.0%) |
| 5 to 9 Year Old | 80 (77.7%) | 23 (22.3%) |
| 10 to 14 Year Olds | 88 (82.2%) | 19 (17.8%) |
| 15 to 17 Year Olds | 94 (77.0%) | 28 (23.0%) |
| 18 to 19 Year Olds | 84 (100.0%) | 0 (0.0%) |
| 20 to 24 Year Olds | 67 (100.0%) | 0 (0.0%) |
| 25 to 34 Year Olds | 0 (0.0%) | 0 (0.0%) |
| 35 Years and over | 53 (100.0%) | 0 (0.0%) |
| Total | 496 (87.6%) | 70 (12.4%) |
Educational Attainment by Field of Study in Norway
Science & technology (84 | 23.5%), arts & humanities (62 | 17.4%), business (52 | 14.6%), education (52 | 14.6%), and psychology (44 | 12.3%) are the most common fields of study among 357 individuals in Norway who have obtained a bachelor's degree or higher.
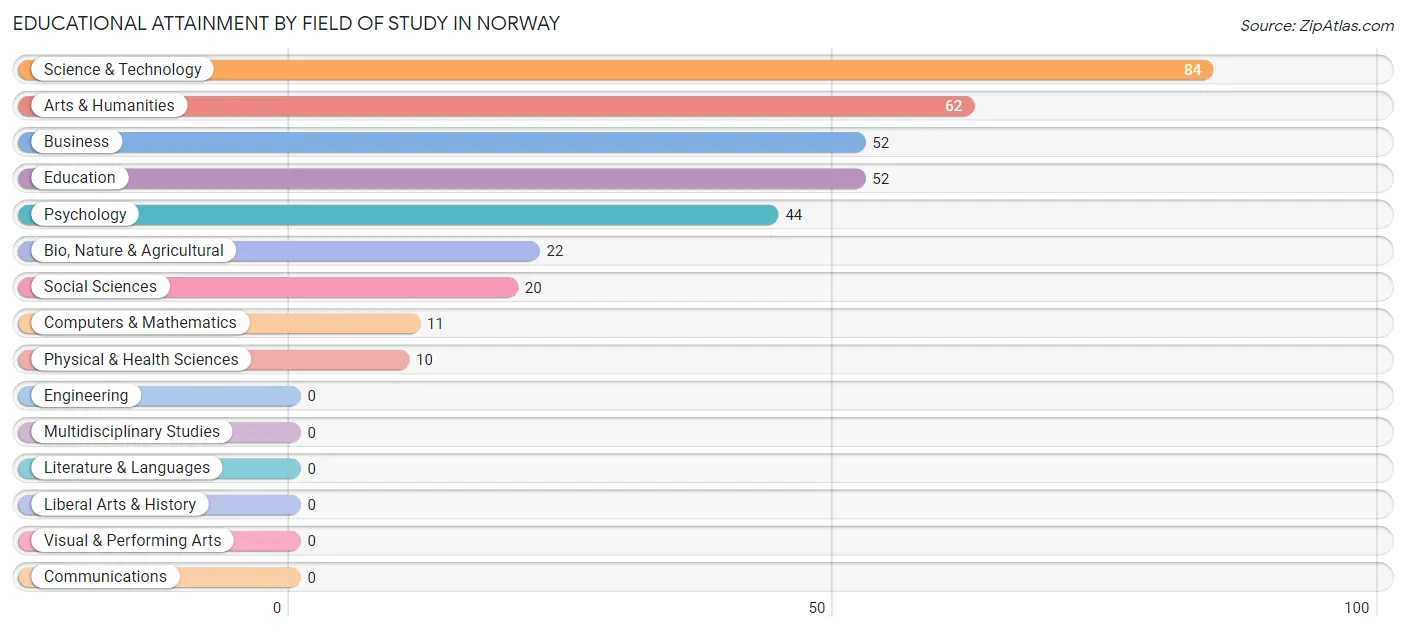
| Field of Study | # Graduates | % Graduates |
| Computers & Mathematics | 11 | 3.1% |
| Bio, Nature & Agricultural | 22 | 6.2% |
| Physical & Health Sciences | 10 | 2.8% |
| Psychology | 44 | 12.3% |
| Social Sciences | 20 | 5.6% |
| Engineering | 0 | 0.0% |
| Multidisciplinary Studies | 0 | 0.0% |
| Science & Technology | 84 | 23.5% |
| Business | 52 | 14.6% |
| Education | 52 | 14.6% |
| Literature & Languages | 0 | 0.0% |
| Liberal Arts & History | 0 | 0.0% |
| Visual & Performing Arts | 0 | 0.0% |
| Communications | 0 | 0.0% |
| Arts & Humanities | 62 | 17.4% |
| Total | 357 | 100.0% |
Transportation & Commute in Norway
Vehicle Availability by Sex in Norway
The most prevalent vehicle ownership categories in Norway are males with 2 vehicles (354, accounting for 49.4%) and females with 2 vehicles (364, making up 53.6%).
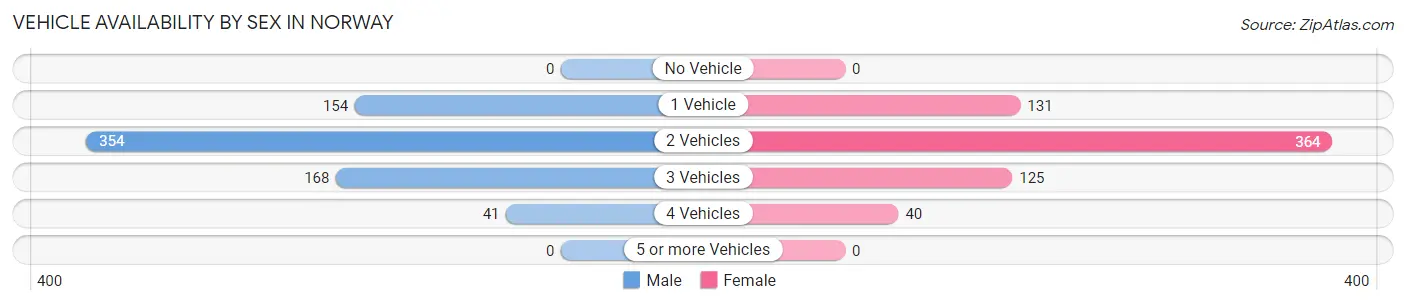
| Vehicles Available | Male | Female |
| No Vehicle | 0 (0.0%) | 0 (0.0%) |
| 1 Vehicle | 154 (21.5%) | 131 (19.9%) |
| 2 Vehicles | 354 (49.4%) | 364 (55.1%) |
| 3 Vehicles | 168 (23.4%) | 125 (18.9%) |
| 4 Vehicles | 41 (5.7%) | 40 (6.1%) |
| 5 or more Vehicles | 0 (0.0%) | 0 (0.0%) |
| Total | 717 (100.0%) | 660 (100.0%) |
Commute Time in Norway
The most frequently occuring commute durations in Norway are 10 to 14 minutes (408 commuters, 31.0%), 5 to 9 minutes (226 commuters, 17.2%), and less than 5 minutes (198 commuters, 15.1%).
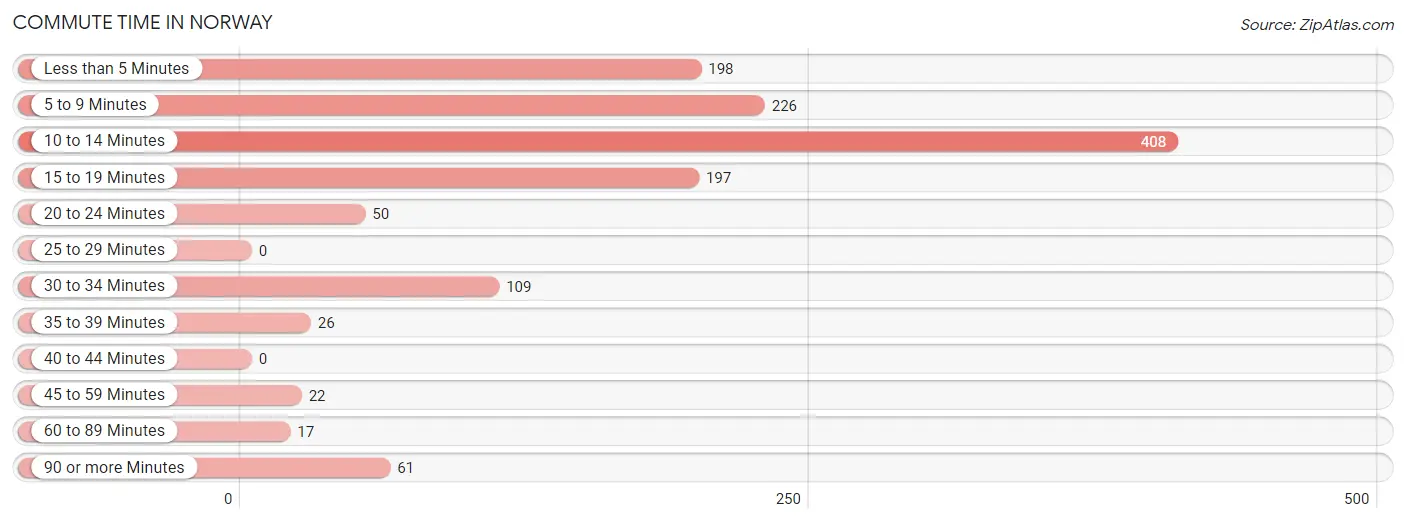
| Commute Time | # Commuters | % Commuters |
| Less than 5 Minutes | 198 | 15.1% |
| 5 to 9 Minutes | 226 | 17.2% |
| 10 to 14 Minutes | 408 | 31.0% |
| 15 to 19 Minutes | 197 | 15.0% |
| 20 to 24 Minutes | 50 | 3.8% |
| 25 to 29 Minutes | 0 | 0.0% |
| 30 to 34 Minutes | 109 | 8.3% |
| 35 to 39 Minutes | 26 | 2.0% |
| 40 to 44 Minutes | 0 | 0.0% |
| 45 to 59 Minutes | 22 | 1.7% |
| 60 to 89 Minutes | 17 | 1.3% |
| 90 or more Minutes | 61 | 4.6% |
Commute Time by Sex in Norway
The most common commute times in Norway are 5 to 9 minutes (189 commuters, 26.4%) for males and 10 to 14 minutes (285 commuters, 47.7%) for females.
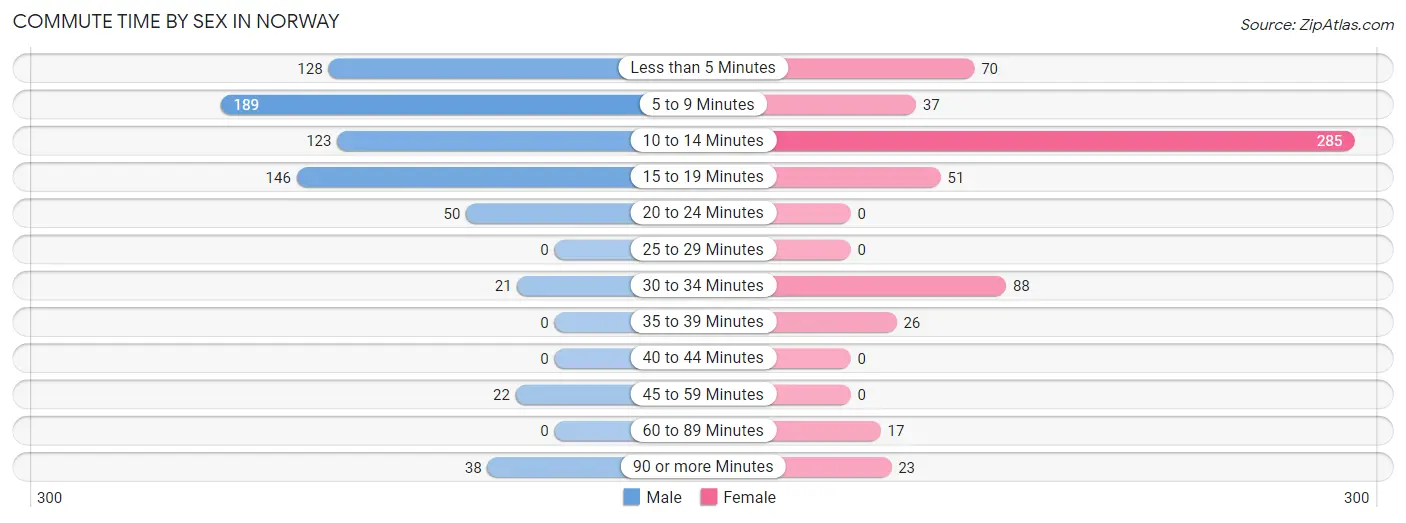
| Commute Time | Male | Female |
| Less than 5 Minutes | 128 (17.8%) | 70 (11.7%) |
| 5 to 9 Minutes | 189 (26.4%) | 37 (6.2%) |
| 10 to 14 Minutes | 123 (17.2%) | 285 (47.7%) |
| 15 to 19 Minutes | 146 (20.4%) | 51 (8.5%) |
| 20 to 24 Minutes | 50 (7.0%) | 0 (0.0%) |
| 25 to 29 Minutes | 0 (0.0%) | 0 (0.0%) |
| 30 to 34 Minutes | 21 (2.9%) | 88 (14.7%) |
| 35 to 39 Minutes | 0 (0.0%) | 26 (4.4%) |
| 40 to 44 Minutes | 0 (0.0%) | 0 (0.0%) |
| 45 to 59 Minutes | 22 (3.1%) | 0 (0.0%) |
| 60 to 89 Minutes | 0 (0.0%) | 17 (2.9%) |
| 90 or more Minutes | 38 (5.3%) | 23 (3.8%) |
Time of Departure to Work by Sex in Norway
The most frequent times of departure to work in Norway are 7:30 AM to 7:59 AM (174, 24.3%) for males and 12:00 AM to 4:59 AM (166, 27.8%) for females.
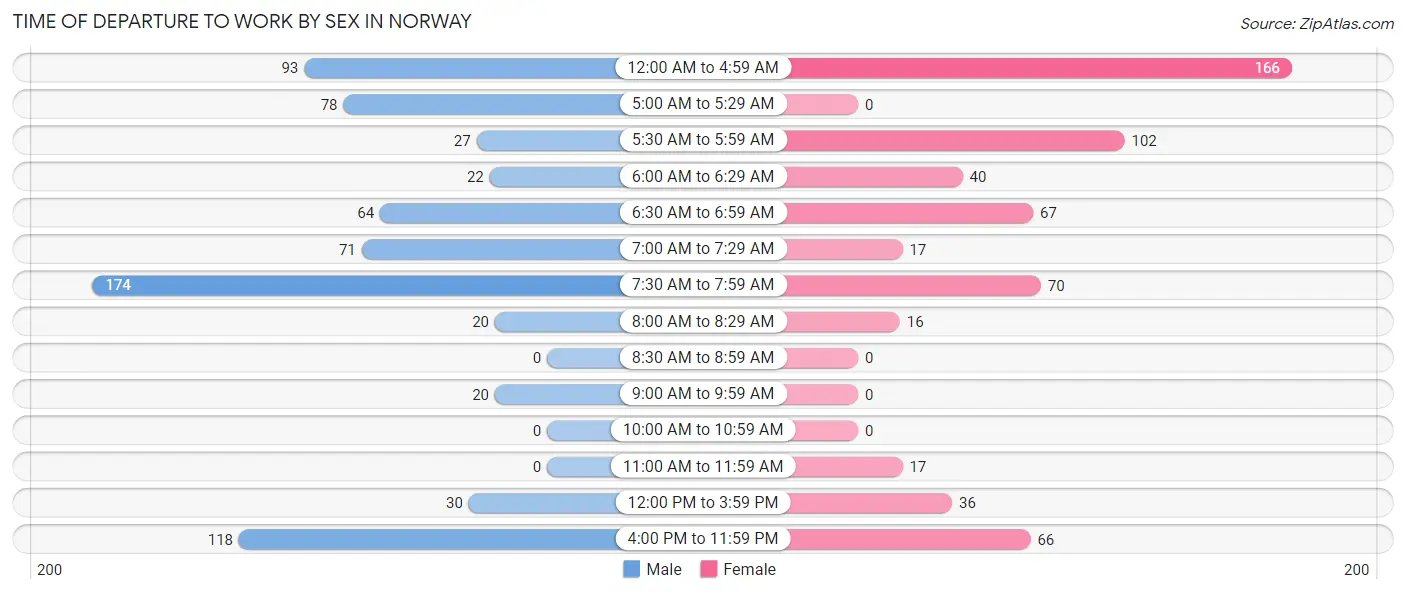
| Time of Departure | Male | Female |
| 12:00 AM to 4:59 AM | 93 (13.0%) | 166 (27.8%) |
| 5:00 AM to 5:29 AM | 78 (10.9%) | 0 (0.0%) |
| 5:30 AM to 5:59 AM | 27 (3.8%) | 102 (17.1%) |
| 6:00 AM to 6:29 AM | 22 (3.1%) | 40 (6.7%) |
| 6:30 AM to 6:59 AM | 64 (8.9%) | 67 (11.2%) |
| 7:00 AM to 7:29 AM | 71 (9.9%) | 17 (2.9%) |
| 7:30 AM to 7:59 AM | 174 (24.3%) | 70 (11.7%) |
| 8:00 AM to 8:29 AM | 20 (2.8%) | 16 (2.7%) |
| 8:30 AM to 8:59 AM | 0 (0.0%) | 0 (0.0%) |
| 9:00 AM to 9:59 AM | 20 (2.8%) | 0 (0.0%) |
| 10:00 AM to 10:59 AM | 0 (0.0%) | 0 (0.0%) |
| 11:00 AM to 11:59 AM | 0 (0.0%) | 17 (2.9%) |
| 12:00 PM to 3:59 PM | 30 (4.2%) | 36 (6.0%) |
| 4:00 PM to 11:59 PM | 118 (16.5%) | 66 (11.1%) |
| Total | 717 (100.0%) | 597 (100.0%) |
Housing Occupancy in Norway
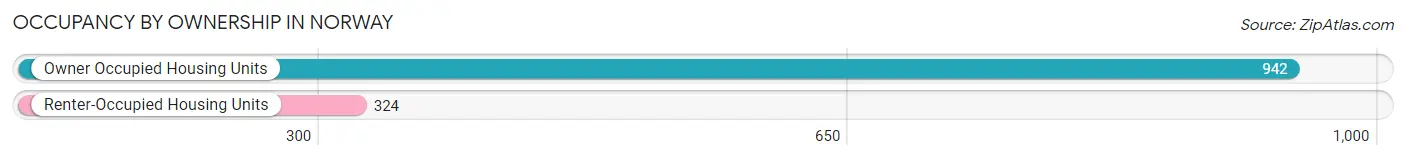
Occupancy by Ownership in Norway
Of the total 1,266 dwellings in Norway, owner-occupied units account for 942 (74.4%), while renter-occupied units make up 324 (25.6%).
| Occupancy | # Housing Units | % Housing Units |
| Owner Occupied Housing Units | 942 | 74.4% |
| Renter-Occupied Housing Units | 324 | 25.6% |
| Total Occupied Housing Units | 1,266 | 100.0% |
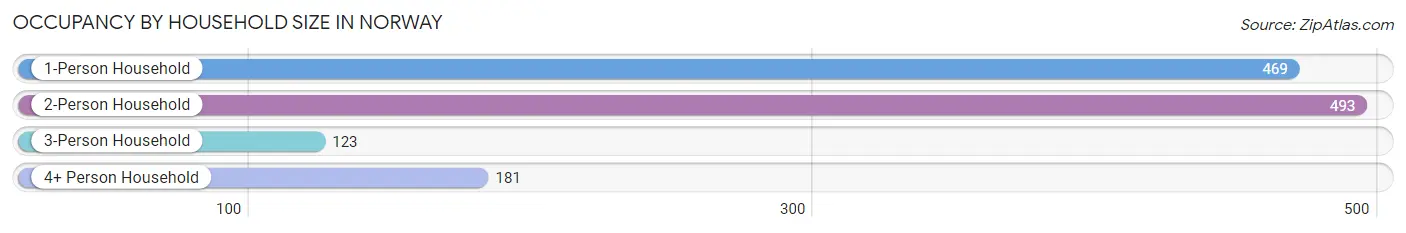
Occupancy by Household Size in Norway
| Household Size | # Housing Units | % Housing Units |
| 1-Person Household | 469 | 37.0% |
| 2-Person Household | 493 | 38.9% |
| 3-Person Household | 123 | 9.7% |
| 4+ Person Household | 181 | 14.3% |
| Total Housing Units | 1,266 | 100.0% |
Occupancy by Ownership by Household Size in Norway
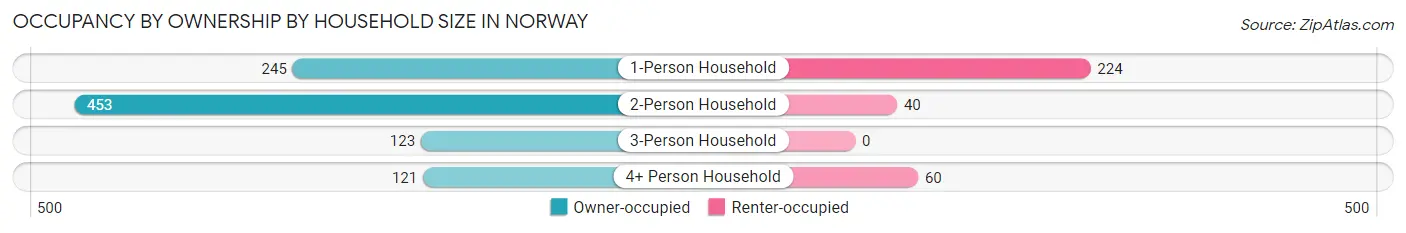
| Household Size | Owner-occupied | Renter-occupied |
| 1-Person Household | 245 (52.2%) | 224 (47.8%) |
| 2-Person Household | 453 (91.9%) | 40 (8.1%) |
| 3-Person Household | 123 (100.0%) | 0 (0.0%) |
| 4+ Person Household | 121 (66.8%) | 60 (33.2%) |
| Total Housing Units | 942 (74.4%) | 324 (25.6%) |
Occupancy by Educational Attainment in Norway
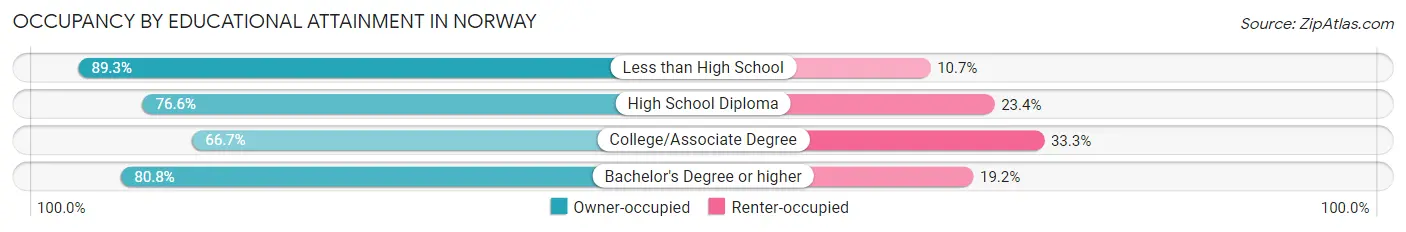
| Household Size | Owner-occupied | Renter-occupied |
| Less than High School | 125 (89.3%) | 15 (10.7%) |
| High School Diploma | 265 (76.6%) | 81 (23.4%) |
| College/Associate Degree | 371 (66.7%) | 185 (33.3%) |
| Bachelor's Degree or higher | 181 (80.8%) | 43 (19.2%) |
Occupancy by Age of Householder in Norway
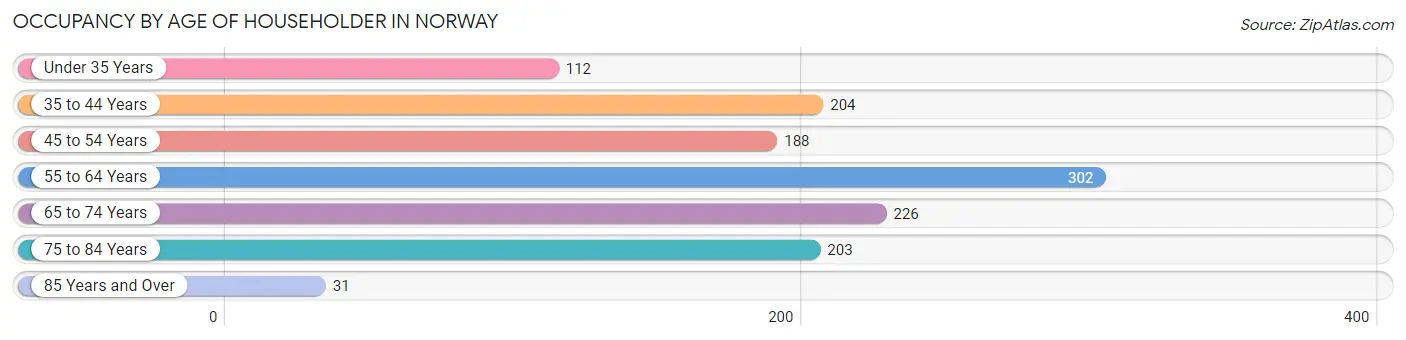
| Age Bracket | # Households | % Households |
| Under 35 Years | 112 | 8.8% |
| 35 to 44 Years | 204 | 16.1% |
| 45 to 54 Years | 188 | 14.8% |
| 55 to 64 Years | 302 | 23.8% |
| 65 to 74 Years | 226 | 17.8% |
| 75 to 84 Years | 203 | 16.0% |
| 85 Years and Over | 31 | 2.5% |
| Total | 1,266 | 100.0% |
Housing Finances in Norway
Median Income by Occupancy in Norway
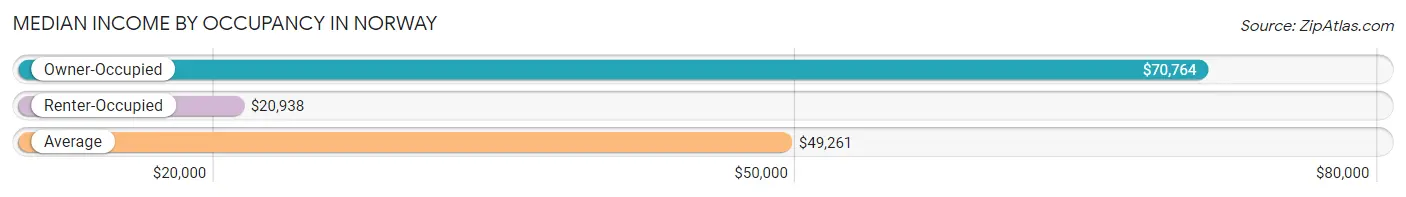
| Occupancy Type | # Households | Median Income |
| Owner-Occupied | 942 (74.4%) | $70,764 |
| Renter-Occupied | 324 (25.6%) | $20,938 |
| Average | 1,266 (100.0%) | $49,261 |
Occupancy by Householder Income Bracket in Norway
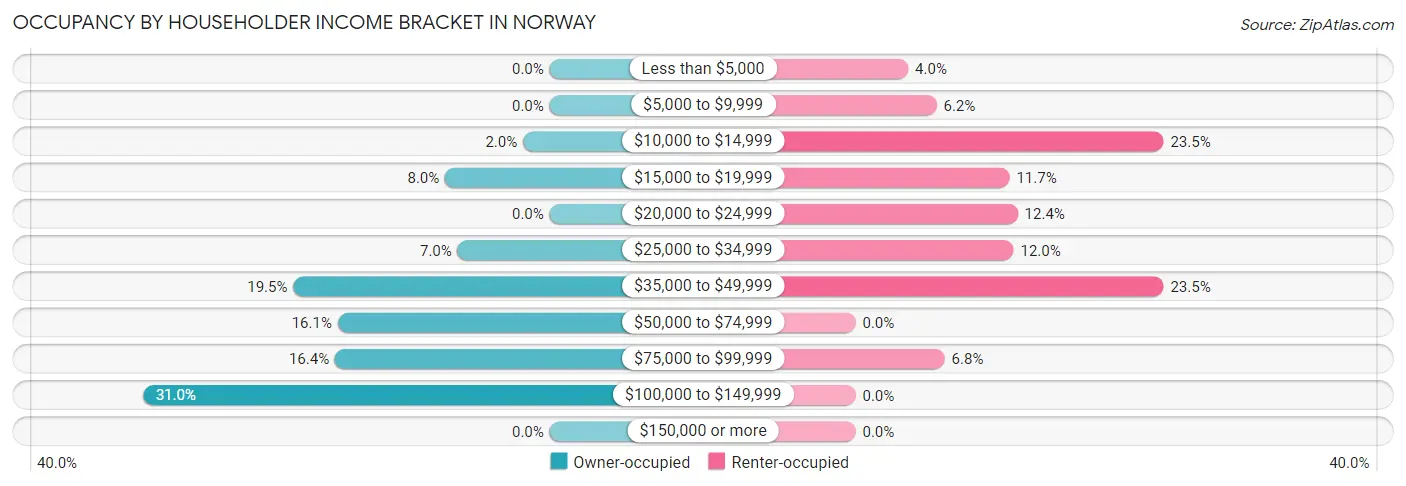
| Income Bracket | Owner-occupied | Renter-occupied |
| Less than $5,000 | 0 (0.0%) | 13 (4.0%) |
| $5,000 to $9,999 | 0 (0.0%) | 20 (6.2%) |
| $10,000 to $14,999 | 19 (2.0%) | 76 (23.5%) |
| $15,000 to $19,999 | 75 (8.0%) | 38 (11.7%) |
| $20,000 to $24,999 | 0 (0.0%) | 40 (12.3%) |
| $25,000 to $34,999 | 66 (7.0%) | 39 (12.0%) |
| $35,000 to $49,999 | 184 (19.5%) | 76 (23.5%) |
| $50,000 to $74,999 | 152 (16.1%) | 0 (0.0%) |
| $75,000 to $99,999 | 154 (16.4%) | 22 (6.8%) |
| $100,000 to $149,999 | 292 (31.0%) | 0 (0.0%) |
| $150,000 or more | 0 (0.0%) | 0 (0.0%) |
| Total | 942 (100.0%) | 324 (100.0%) |
Monthly Housing Cost Tiers in Norway
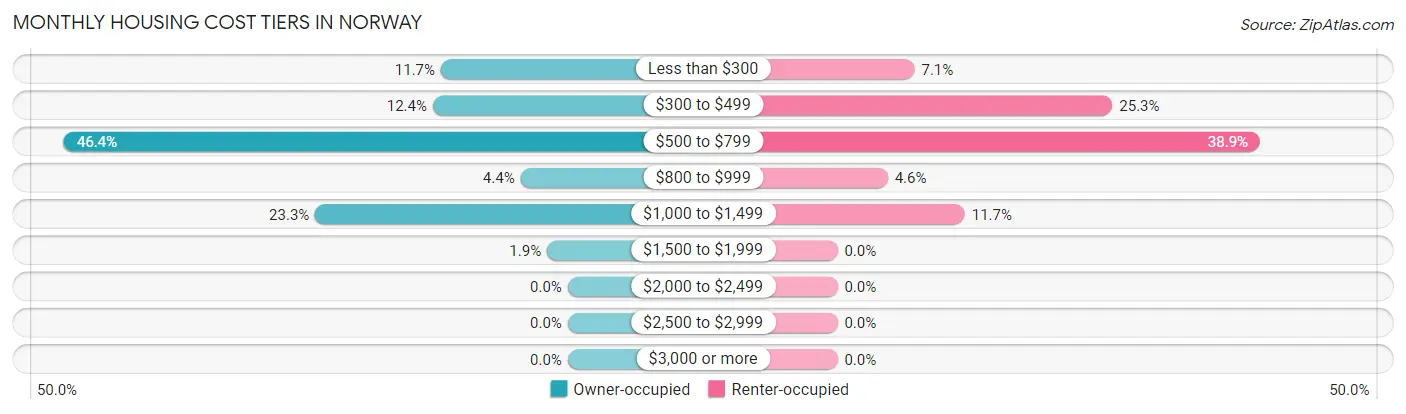
| Monthly Cost | Owner-occupied | Renter-occupied |
| Less than $300 | 110 (11.7%) | 23 (7.1%) |
| $300 to $499 | 117 (12.4%) | 82 (25.3%) |
| $500 to $799 | 437 (46.4%) | 126 (38.9%) |
| $800 to $999 | 41 (4.3%) | 15 (4.6%) |
| $1,000 to $1,499 | 219 (23.3%) | 38 (11.7%) |
| $1,500 to $1,999 | 18 (1.9%) | 0 (0.0%) |
| $2,000 to $2,499 | 0 (0.0%) | 0 (0.0%) |
| $2,500 to $2,999 | 0 (0.0%) | 0 (0.0%) |
| $3,000 or more | 0 (0.0%) | 0 (0.0%) |
| Total | 942 (100.0%) | 324 (100.0%) |
Physical Housing Characteristics in Norway
Housing Structures in Norway
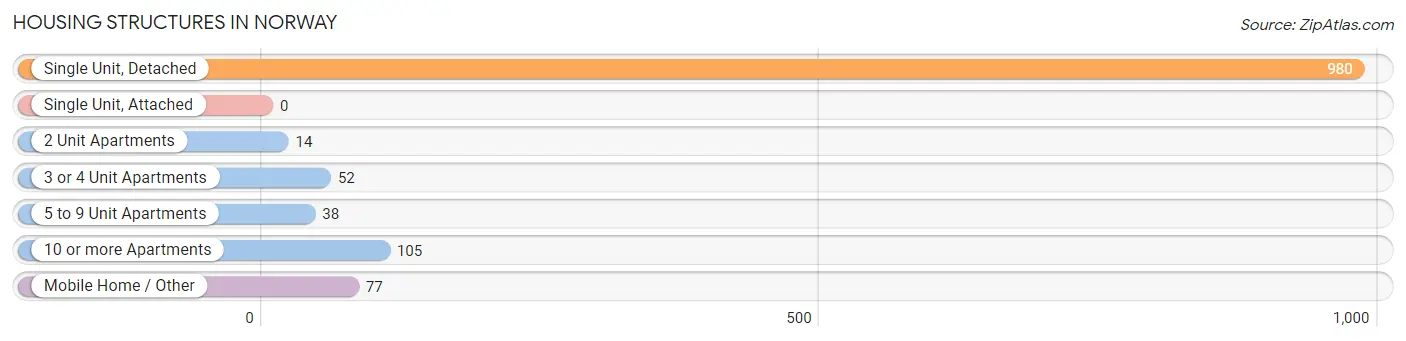
| Structure Type | # Housing Units | % Housing Units |
| Single Unit, Detached | 980 | 77.4% |
| Single Unit, Attached | 0 | 0.0% |
| 2 Unit Apartments | 14 | 1.1% |
| 3 or 4 Unit Apartments | 52 | 4.1% |
| 5 to 9 Unit Apartments | 38 | 3.0% |
| 10 or more Apartments | 105 | 8.3% |
| Mobile Home / Other | 77 | 6.1% |
| Total | 1,266 | 100.0% |
Housing Structures by Occupancy in Norway
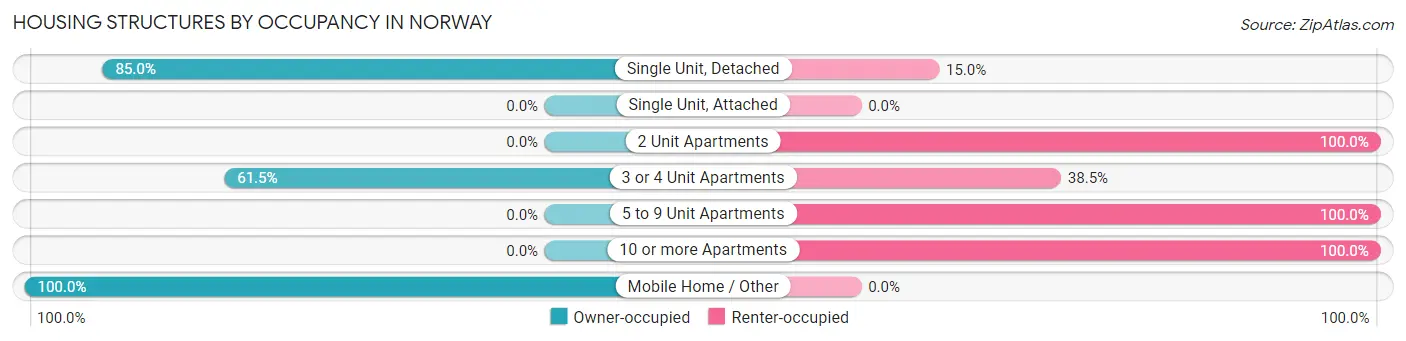
| Structure Type | Owner-occupied | Renter-occupied |
| Single Unit, Detached | 833 (85.0%) | 147 (15.0%) |
| Single Unit, Attached | 0 (0.0%) | 0 (0.0%) |
| 2 Unit Apartments | 0 (0.0%) | 14 (100.0%) |
| 3 or 4 Unit Apartments | 32 (61.5%) | 20 (38.5%) |
| 5 to 9 Unit Apartments | 0 (0.0%) | 38 (100.0%) |
| 10 or more Apartments | 0 (0.0%) | 105 (100.0%) |
| Mobile Home / Other | 77 (100.0%) | 0 (0.0%) |
| Total | 942 (74.4%) | 324 (25.6%) |
Housing Structures by Number of Rooms in Norway
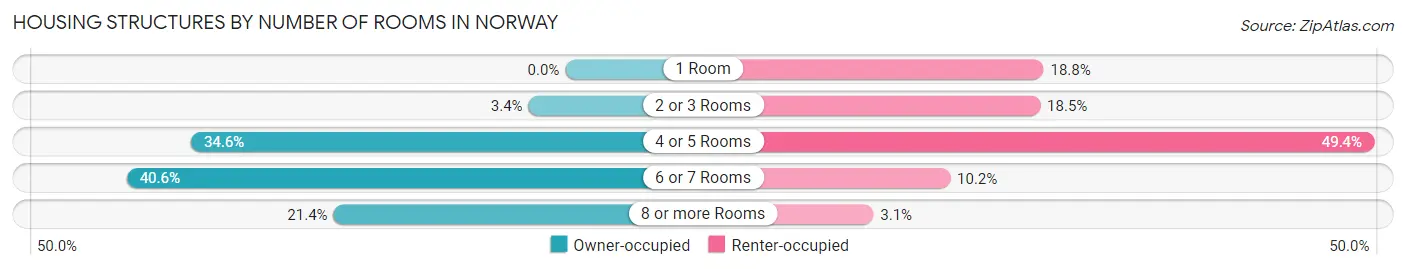
| Number of Rooms | Owner-occupied | Renter-occupied |
| 1 Room | 0 (0.0%) | 61 (18.8%) |
| 2 or 3 Rooms | 32 (3.4%) | 60 (18.5%) |
| 4 or 5 Rooms | 326 (34.6%) | 160 (49.4%) |
| 6 or 7 Rooms | 382 (40.6%) | 33 (10.2%) |
| 8 or more Rooms | 202 (21.4%) | 10 (3.1%) |
| Total | 942 (100.0%) | 324 (100.0%) |
Housing Structure by Heating Type in Norway
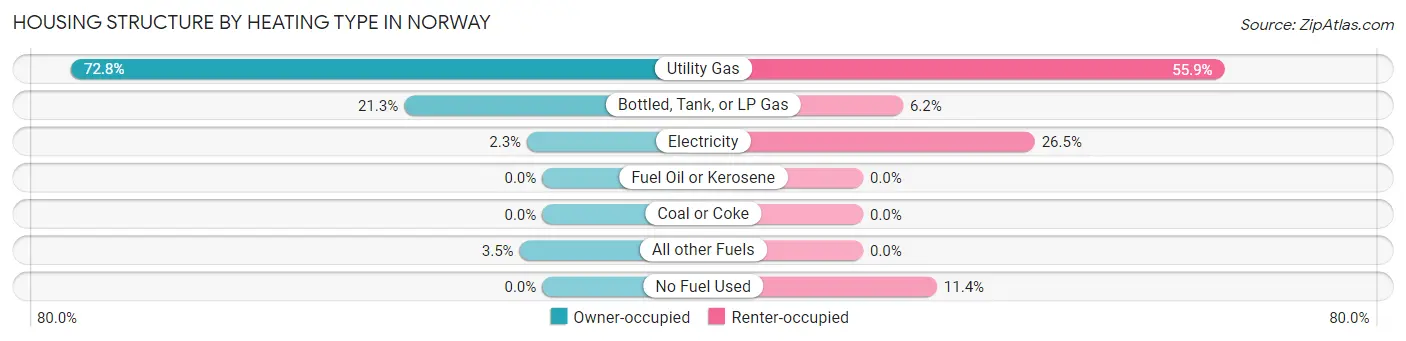
| Heating Type | Owner-occupied | Renter-occupied |
| Utility Gas | 686 (72.8%) | 181 (55.9%) |
| Bottled, Tank, or LP Gas | 201 (21.3%) | 20 (6.2%) |
| Electricity | 22 (2.3%) | 86 (26.5%) |
| Fuel Oil or Kerosene | 0 (0.0%) | 0 (0.0%) |
| Coal or Coke | 0 (0.0%) | 0 (0.0%) |
| All other Fuels | 33 (3.5%) | 0 (0.0%) |
| No Fuel Used | 0 (0.0%) | 37 (11.4%) |
| Total | 942 (100.0%) | 324 (100.0%) |
Household Vehicle Usage in Norway
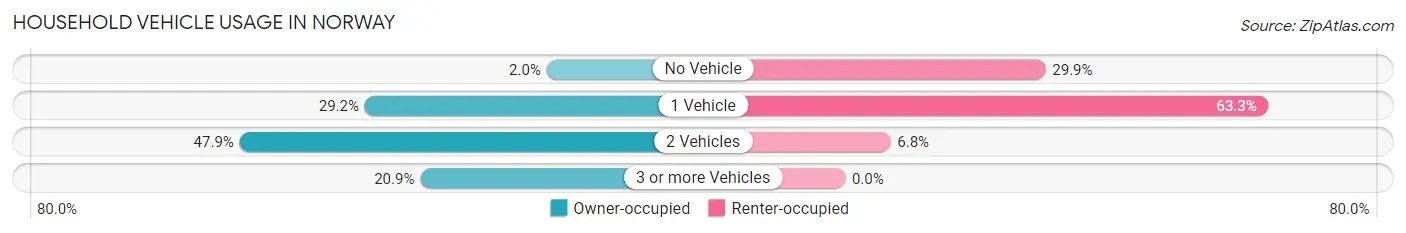
| Vehicles per Household | Owner-occupied | Renter-occupied |
| No Vehicle | 19 (2.0%) | 97 (29.9%) |
| 1 Vehicle | 275 (29.2%) | 205 (63.3%) |
| 2 Vehicles | 451 (47.9%) | 22 (6.8%) |
| 3 or more Vehicles | 197 (20.9%) | 0 (0.0%) |
| Total | 942 (100.0%) | 324 (100.0%) |
Real Estate & Mortgages in Norway
Real Estate and Mortgage Overview in Norway
| Characteristic | Without Mortgage | With Mortgage |
| Housing Units | 459 | 483 |
| Median Property Value | $83,700 | $84,000 |
| Median Household Income | $49,688 | $0 |
| Monthly Housing Costs | $502 | $0 |
| Real Estate Taxes | $1,575 | $0 |
Property Value by Mortgage Status in Norway
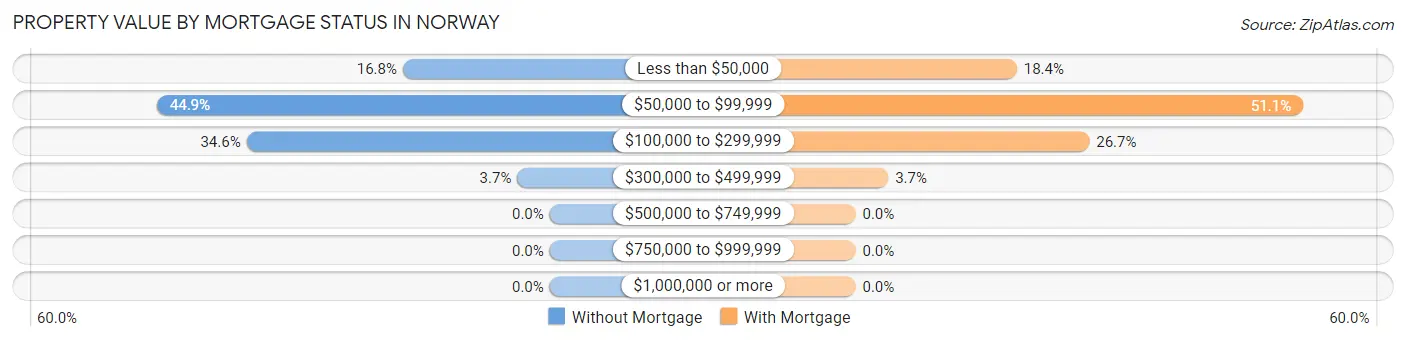
| Property Value | Without Mortgage | With Mortgage |
| Less than $50,000 | 77 (16.8%) | 89 (18.4%) |
| $50,000 to $99,999 | 206 (44.9%) | 247 (51.1%) |
| $100,000 to $299,999 | 159 (34.6%) | 129 (26.7%) |
| $300,000 to $499,999 | 17 (3.7%) | 18 (3.7%) |
| $500,000 to $749,999 | 0 (0.0%) | 0 (0.0%) |
| $750,000 to $999,999 | 0 (0.0%) | 0 (0.0%) |
| $1,000,000 or more | 0 (0.0%) | 0 (0.0%) |
| Total | 459 (100.0%) | 483 (100.0%) |
Household Income by Mortgage Status in Norway
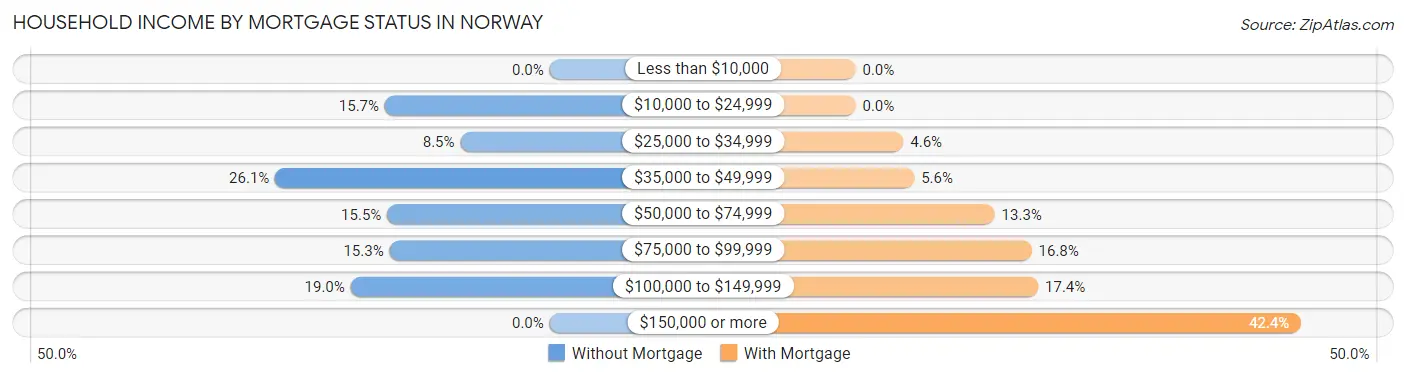
| Household Income | Without Mortgage | With Mortgage |
| Less than $10,000 | 0 (0.0%) | 0 (0.0%) |
| $10,000 to $24,999 | 72 (15.7%) | 0 (0.0%) |
| $25,000 to $34,999 | 39 (8.5%) | 22 (4.5%) |
| $35,000 to $49,999 | 120 (26.1%) | 27 (5.6%) |
| $50,000 to $74,999 | 71 (15.5%) | 64 (13.3%) |
| $75,000 to $99,999 | 70 (15.2%) | 81 (16.8%) |
| $100,000 to $149,999 | 87 (19.0%) | 84 (17.4%) |
| $150,000 or more | 0 (0.0%) | 205 (42.4%) |
| Total | 459 (100.0%) | 483 (100.0%) |
Property Value to Household Income Ratio in Norway
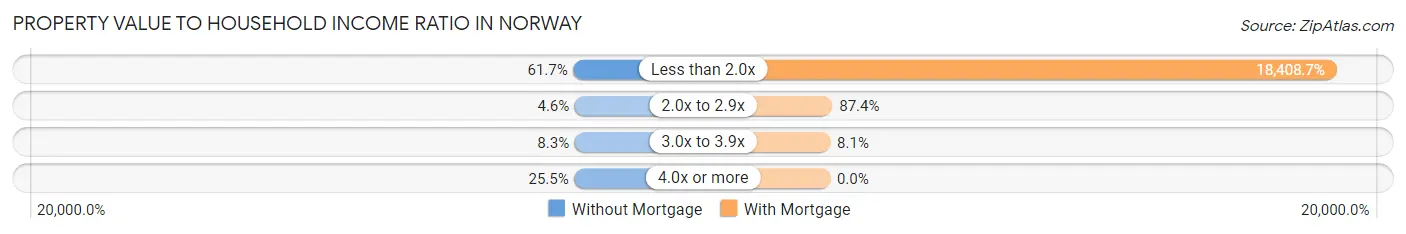
| Value-to-Income Ratio | Without Mortgage | With Mortgage |
| Less than 2.0x | 283 (61.7%) | 88,914 (18,408.7%) |
| 2.0x to 2.9x | 21 (4.6%) | 422 (87.4%) |
| 3.0x to 3.9x | 38 (8.3%) | 39 (8.1%) |
| 4.0x or more | 117 (25.5%) | 0 (0.0%) |
| Total | 459 (100.0%) | 483 (100.0%) |
Real Estate Taxes by Mortgage Status in Norway
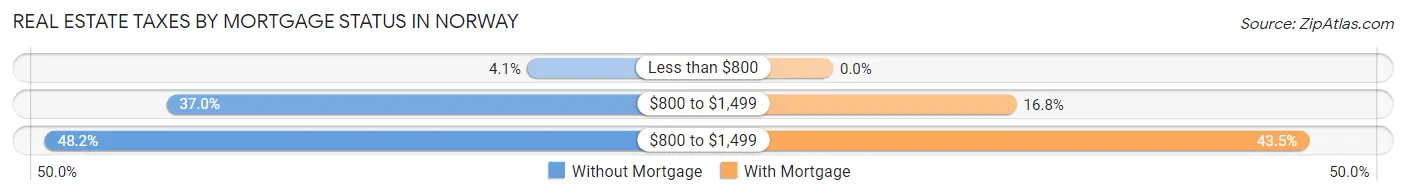
| Property Taxes | Without Mortgage | With Mortgage |
| Less than $800 | 19 (4.1%) | 0 (0.0%) |
| $800 to $1,499 | 170 (37.0%) | 81 (16.8%) |
| $800 to $1,499 | 221 (48.1%) | 210 (43.5%) |
| Total | 459 (100.0%) | 483 (100.0%) |
Health & Disability in Norway
Health Insurance Coverage by Age in Norway
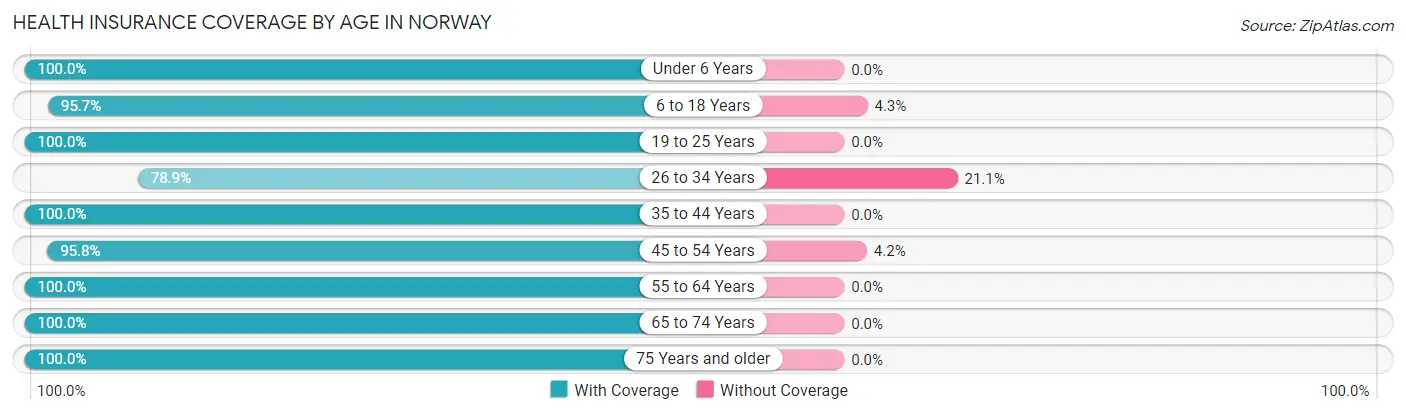
| Age Bracket | With Coverage | Without Coverage |
| Under 6 Years | 107 (100.0%) | 0 (0.0%) |
| 6 to 18 Years | 398 (95.7%) | 18 (4.3%) |
| 19 to 25 Years | 280 (100.0%) | 0 (0.0%) |
| 26 to 34 Years | 239 (78.9%) | 64 (21.1%) |
| 35 to 44 Years | 289 (100.0%) | 0 (0.0%) |
| 45 to 54 Years | 386 (95.8%) | 17 (4.2%) |
| 55 to 64 Years | 410 (100.0%) | 0 (0.0%) |
| 65 to 74 Years | 326 (100.0%) | 0 (0.0%) |
| 75 Years and older | 298 (100.0%) | 0 (0.0%) |
| Total | 2,733 (96.5%) | 99 (3.5%) |
Health Insurance Coverage by Citizenship Status in Norway
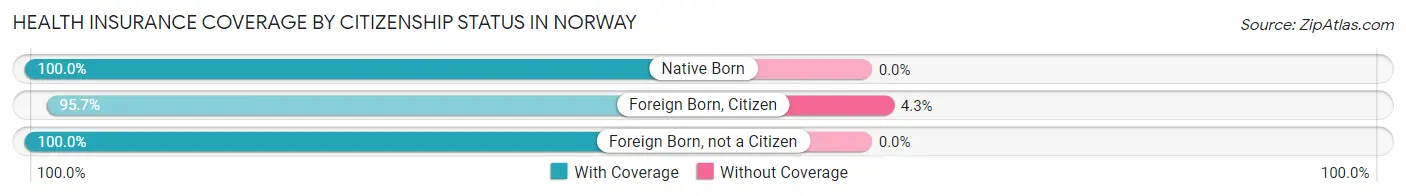
| Citizenship Status | With Coverage | Without Coverage |
| Native Born | 107 (100.0%) | 0 (0.0%) |
| Foreign Born, Citizen | 398 (95.7%) | 18 (4.3%) |
| Foreign Born, not a Citizen | 280 (100.0%) | 0 (0.0%) |
Health Insurance Coverage by Household Income in Norway
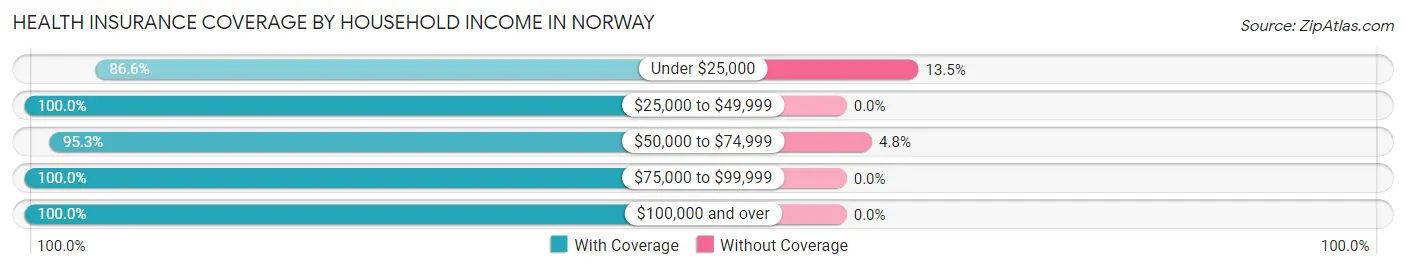
| Household Income | With Coverage | Without Coverage |
| Under $25,000 | 412 (86.6%) | 64 (13.5%) |
| $25,000 to $49,999 | 626 (100.0%) | 0 (0.0%) |
| $50,000 to $74,999 | 341 (95.3%) | 17 (4.8%) |
| $75,000 to $99,999 | 540 (100.0%) | 0 (0.0%) |
| $100,000 and over | 801 (100.0%) | 0 (0.0%) |
Public vs Private Health Insurance Coverage by Age in Norway
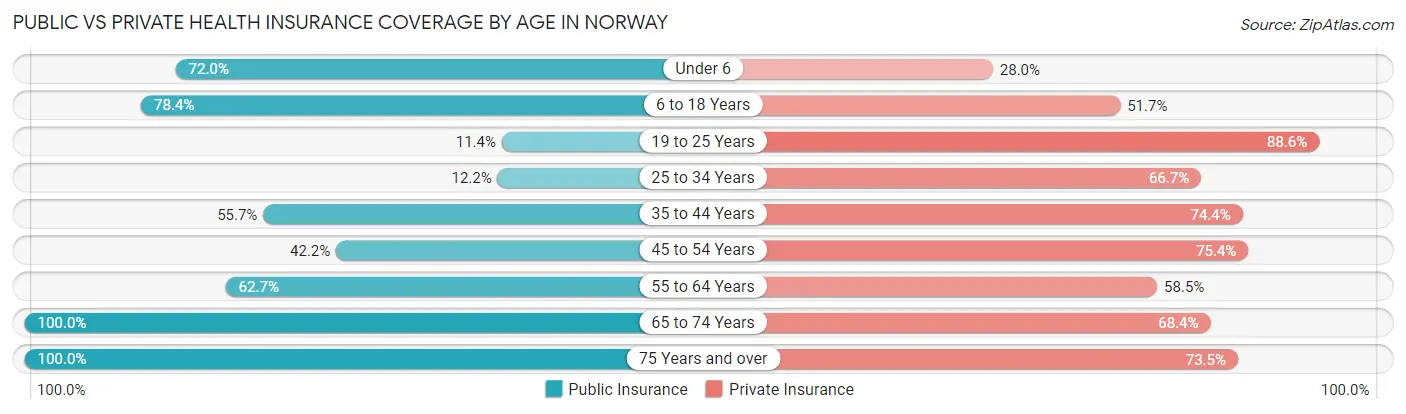
| Age Bracket | Public Insurance | Private Insurance |
| Under 6 | 77 (72.0%) | 30 (28.0%) |
| 6 to 18 Years | 326 (78.4%) | 215 (51.7%) |
| 19 to 25 Years | 32 (11.4%) | 248 (88.6%) |
| 25 to 34 Years | 37 (12.2%) | 202 (66.7%) |
| 35 to 44 Years | 161 (55.7%) | 215 (74.4%) |
| 45 to 54 Years | 170 (42.2%) | 304 (75.4%) |
| 55 to 64 Years | 257 (62.7%) | 240 (58.5%) |
| 65 to 74 Years | 326 (100.0%) | 223 (68.4%) |
| 75 Years and over | 298 (100.0%) | 219 (73.5%) |
| Total | 1,684 (59.5%) | 1,896 (66.9%) |
Disability Status by Sex by Age in Norway
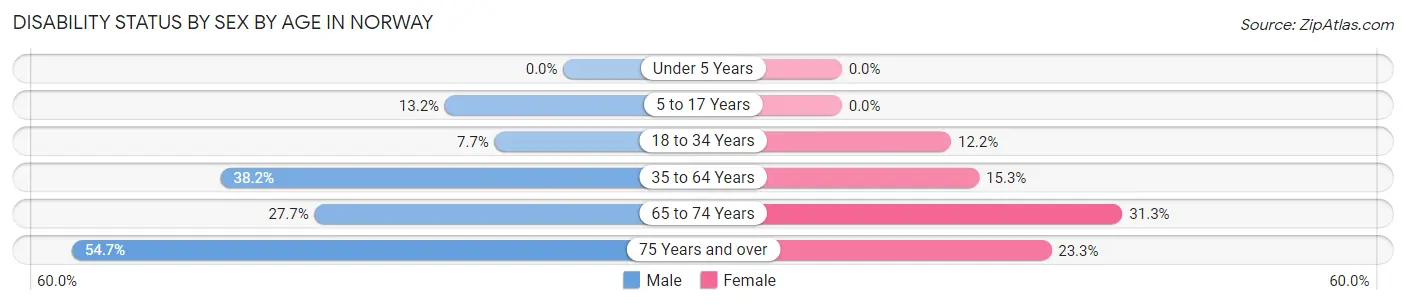
| Age Bracket | Male | Female |
| Under 5 Years | 0 (0.0%) | 0 (0.0%) |
| 5 to 17 Years | 36 (13.2%) | 0 (0.0%) |
| 18 to 34 Years | 25 (7.6%) | 37 (12.2%) |
| 35 to 64 Years | 211 (38.2%) | 84 (15.3%) |
| 65 to 74 Years | 46 (27.7%) | 50 (31.2%) |
| 75 Years and over | 81 (54.7%) | 35 (23.3%) |
Disability Class by Sex by Age in Norway
Disability Class: Hearing Difficulty
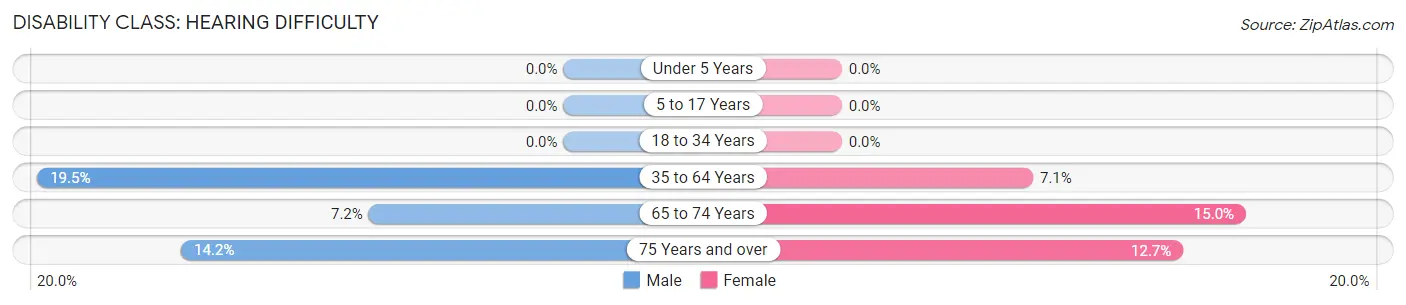
| Age Bracket | Male | Female |
| Under 5 Years | 0 (0.0%) | 0 (0.0%) |
| 5 to 17 Years | 0 (0.0%) | 0 (0.0%) |
| 18 to 34 Years | 0 (0.0%) | 0 (0.0%) |
| 35 to 64 Years | 108 (19.5%) | 39 (7.1%) |
| 65 to 74 Years | 12 (7.2%) | 24 (15.0%) |
| 75 Years and over | 21 (14.2%) | 19 (12.7%) |
Disability Class: Vision Difficulty
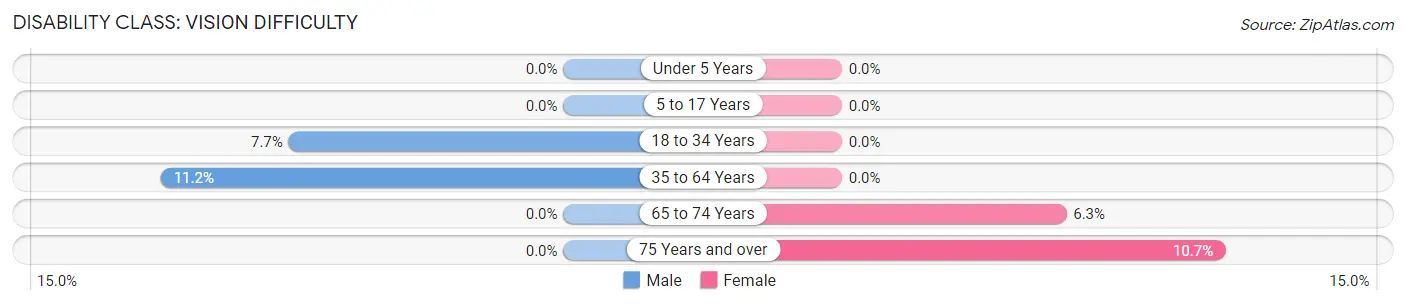
| Age Bracket | Male | Female |
| Under 5 Years | 0 (0.0%) | 0 (0.0%) |
| 5 to 17 Years | 0 (0.0%) | 0 (0.0%) |
| 18 to 34 Years | 25 (7.6%) | 0 (0.0%) |
| 35 to 64 Years | 62 (11.2%) | 0 (0.0%) |
| 65 to 74 Years | 0 (0.0%) | 10 (6.2%) |
| 75 Years and over | 0 (0.0%) | 16 (10.7%) |
Disability Class: Cognitive Difficulty
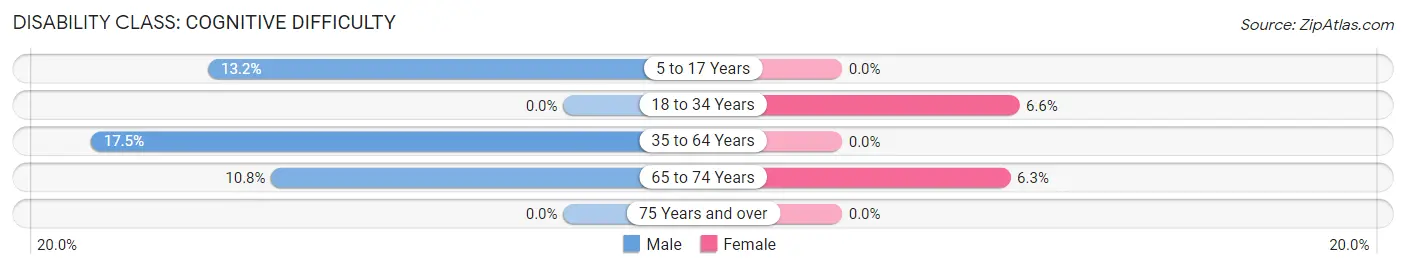
| Age Bracket | Male | Female |
| 5 to 17 Years | 36 (13.2%) | 0 (0.0%) |
| 18 to 34 Years | 0 (0.0%) | 20 (6.6%) |
| 35 to 64 Years | 97 (17.5%) | 0 (0.0%) |
| 65 to 74 Years | 18 (10.8%) | 10 (6.2%) |
| 75 Years and over | 0 (0.0%) | 0 (0.0%) |
Disability Class: Ambulatory Difficulty
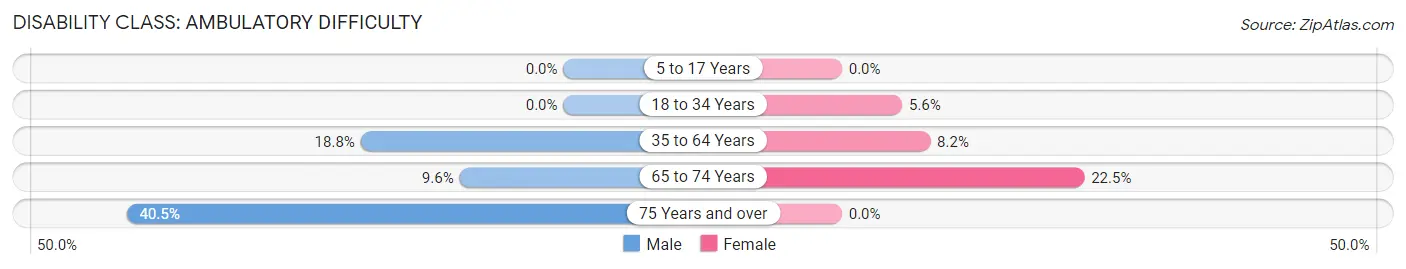
| Age Bracket | Male | Female |
| 5 to 17 Years | 0 (0.0%) | 0 (0.0%) |
| 18 to 34 Years | 0 (0.0%) | 17 (5.6%) |
| 35 to 64 Years | 104 (18.8%) | 45 (8.2%) |
| 65 to 74 Years | 16 (9.6%) | 36 (22.5%) |
| 75 Years and over | 60 (40.5%) | 0 (0.0%) |
Disability Class: Self-Care Difficulty
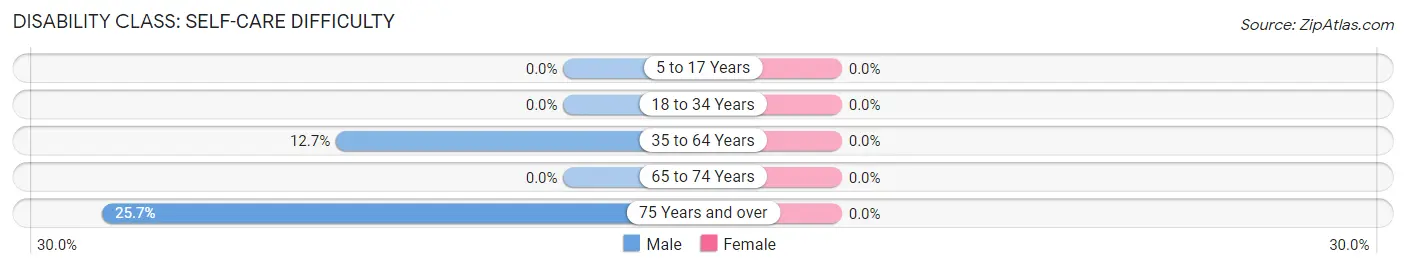
| Age Bracket | Male | Female |
| 5 to 17 Years | 0 (0.0%) | 0 (0.0%) |
| 18 to 34 Years | 0 (0.0%) | 0 (0.0%) |
| 35 to 64 Years | 70 (12.7%) | 0 (0.0%) |
| 65 to 74 Years | 0 (0.0%) | 0 (0.0%) |
| 75 Years and over | 38 (25.7%) | 0 (0.0%) |
Technology Access in Norway
Computing Device Access in Norway
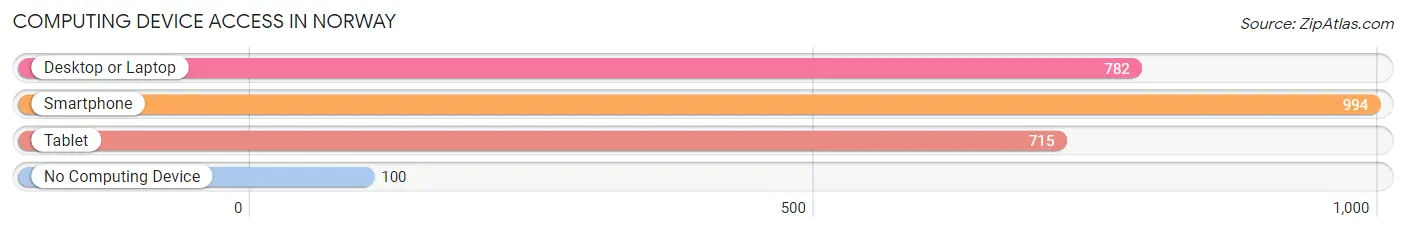
| Device Type | # Households | % Households |
| Desktop or Laptop | 782 | 61.8% |
| Smartphone | 994 | 78.5% |
| Tablet | 715 | 56.5% |
| No Computing Device | 100 | 7.9% |
| Total | 1,266 | 100.0% |
Internet Access in Norway
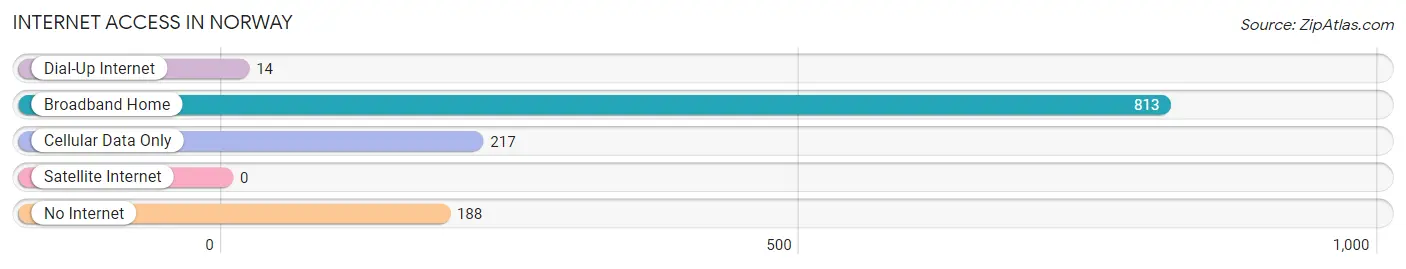
| Internet Type | # Households | % Households |
| Dial-Up Internet | 14 | 1.1% |
| Broadband Home | 813 | 64.2% |
| Cellular Data Only | 217 | 17.1% |
| Satellite Internet | 0 | 0.0% |
| No Internet | 188 | 14.8% |
| Total | 1,266 | 100.0% |
Norway Summary
Norway, Michigan is a small town located in Dickinson County in the Upper Peninsula of Michigan. It is situated on the Menominee River, which is a tributary of Lake Michigan. The town was founded in 1871 and was named after the country of Norway. The population of Norway was 1,945 as of the 2010 census.
Geography
Norway is located in the Upper Peninsula of Michigan, in Dickinson County. It is situated on the Menominee River, which is a tributary of Lake Michigan. The town is located at the intersection of US Highway 2 and M-69. Norway is surrounded by the towns of Iron Mountain, Kingsford, and Iron River. The town is located in the Central Time Zone.
The terrain of Norway is mostly flat, with some rolling hills. The town is located in a heavily forested area, with a variety of trees including maple, birch, and pine. The climate of Norway is humid continental, with cold winters and warm summers.
Economy
Norway’s economy is largely based on the timber industry. The town is home to several lumber mills, which produce lumber for the construction industry. The town is also home to several small businesses, including restaurants, retail stores, and service providers.
The town is also home to several tourist attractions, including the Norway Historical Museum, the Norway Ski Hill, and the Norway Country Club. The town is also home to several festivals, including the Norway Summer Festival and the Norway Winter Festival.
Demographics
As of the 2010 census, the population of Norway was 1,945. The racial makeup of the town was 97.2% White, 0.3% African American, 0.3% Native American, 0.3% Asian, 0.2% from other races, and 1.7% from two or more races. Hispanic or Latino of any race were 1.2% of the population.
The median income for a household in Norway was $37,917, and the median income for a family was $45,000. The per capita income for the town was $19,945. About 11.2% of families and 14.2% of the population were below the poverty line, including 18.2% of those under age 18 and 8.3% of those age 65 or over.
Conclusion
Norway, Michigan is a small town located in Dickinson County in the Upper Peninsula of Michigan. It is situated on the Menominee River, which is a tributary of Lake Michigan. The town was founded in 1871 and was named after the country of Norway. The population of Norway was 1,945 as of the 2010 census. The economy of Norway is largely based on the timber industry, and the town is also home to several tourist attractions and festivals. The racial makeup of the town was 97.2% White, 0.3% African American, 0.3% Native American, 0.3% Asian, 0.2% from other races, and 1.7% from two or more races. The median income for a household in Norway was $37,917, and the median income for a family was $45,000.
Common Questions
What is Per Capita Income in Norway?
Per Capita income in Norway is $28,432.
What is the Median Family Income in Norway?
Median Family Income in Norway is $75,363.
What is the Median Household income in Norway?
Median Household Income in Norway is $49,261.
What is Income or Wage Gap in Norway?
Income or Wage Gap in Norway is 40.9%.
Women in Norway earn 59.1 cents for every dollar earned by a man.
What is Inequality or Gini Index in Norway?
Inequality or Gini Index in Norway is 0.35.
What is the Total Population of Norway?
Total Population of Norway is 2,832.
What is the Total Male Population of Norway?
Total Male Population of Norway is 1,486.
What is the Total Female Population of Norway?
Total Female Population of Norway is 1,346.
What is the Ratio of Males per 100 Females in Norway?
There are 110.40 Males per 100 Females in Norway.
What is the Ratio of Females per 100 Males in Norway?
There are 90.58 Females per 100 Males in Norway.
What is the Median Population Age in Norway?
Median Population Age in Norway is 45.3 Years.
What is the Average Family Size in Norway
Average Family Size in Norway is 3.0 People.
What is the Average Household Size in Norway
Average Household Size in Norway is 2.2 People.
How Large is the Labor Force in Norway?
There are 1,408 People in the Labor Forcein in Norway.
What is the Percentage of People in the Labor Force in Norway?
57.3% of People are in the Labor Force in Norway.
What is the Unemployment Rate in Norway?
Unemployment Rate in Norway is 2.3%.