Newberry, MI Map & Demographics
Newberry Map
Newberry Overview
$24,135
PER CAPITA INCOME
$63,036
AVG FAMILY INCOME
$45,213
AVG HOUSEHOLD INCOME
30.3%
WAGE / INCOME GAP [ % ]
69.7¢/ $1
WAGE / INCOME GAP [ $ ]
0.46
INEQUALITY / GINI INDEX
1,138
TOTAL POPULATION
476
MALE POPULATION
662
FEMALE POPULATION
71.90
MALES / 100 FEMALES
139.08
FEMALES / 100 MALES
38.6
MEDIAN AGE
3.0
AVG FAMILY SIZE
2.2
AVG HOUSEHOLD SIZE
373
LABOR FORCE [ PEOPLE ]
45.6%
PERCENT IN LABOR FORCE
4.6%
UNEMPLOYMENT RATE
Newberry Zip Codes
Newberry Area Codes
Income in Newberry
Income Overview in Newberry
Per Capita Income in Newberry is $24,135, while median incomes of families and households are $63,036 and $45,213 respectively.
| Characteristic | Number | Measure |
| Per Capita Income | 1,138 | $24,135 |
| Median Family Income | 270 | $63,036 |
| Mean Family Income | 270 | $80,296 |
| Median Household Income | 487 | $45,213 |
| Mean Household Income | 487 | $60,119 |
| Income Deficit | 270 | $0 |
| Wage / Income Gap (%) | 1,138 | 30.26% |
| Wage / Income Gap ($) | 1,138 | 69.74¢ per $1 |
| Gini / Inequality Index | 1,138 | 0.46 |
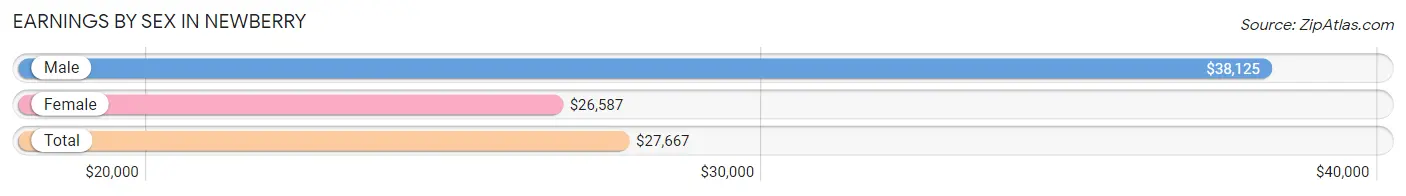
Earnings by Sex in Newberry
Average Earnings in Newberry are $27,667, $38,125 for men and $26,587 for women, a difference of 30.3%.
| Sex | Number | Average Earnings |
| Male | 87 (23.0%) | $38,125 |
| Female | 291 (77.0%) | $26,587 |
| Total | 378 (100.0%) | $27,667 |
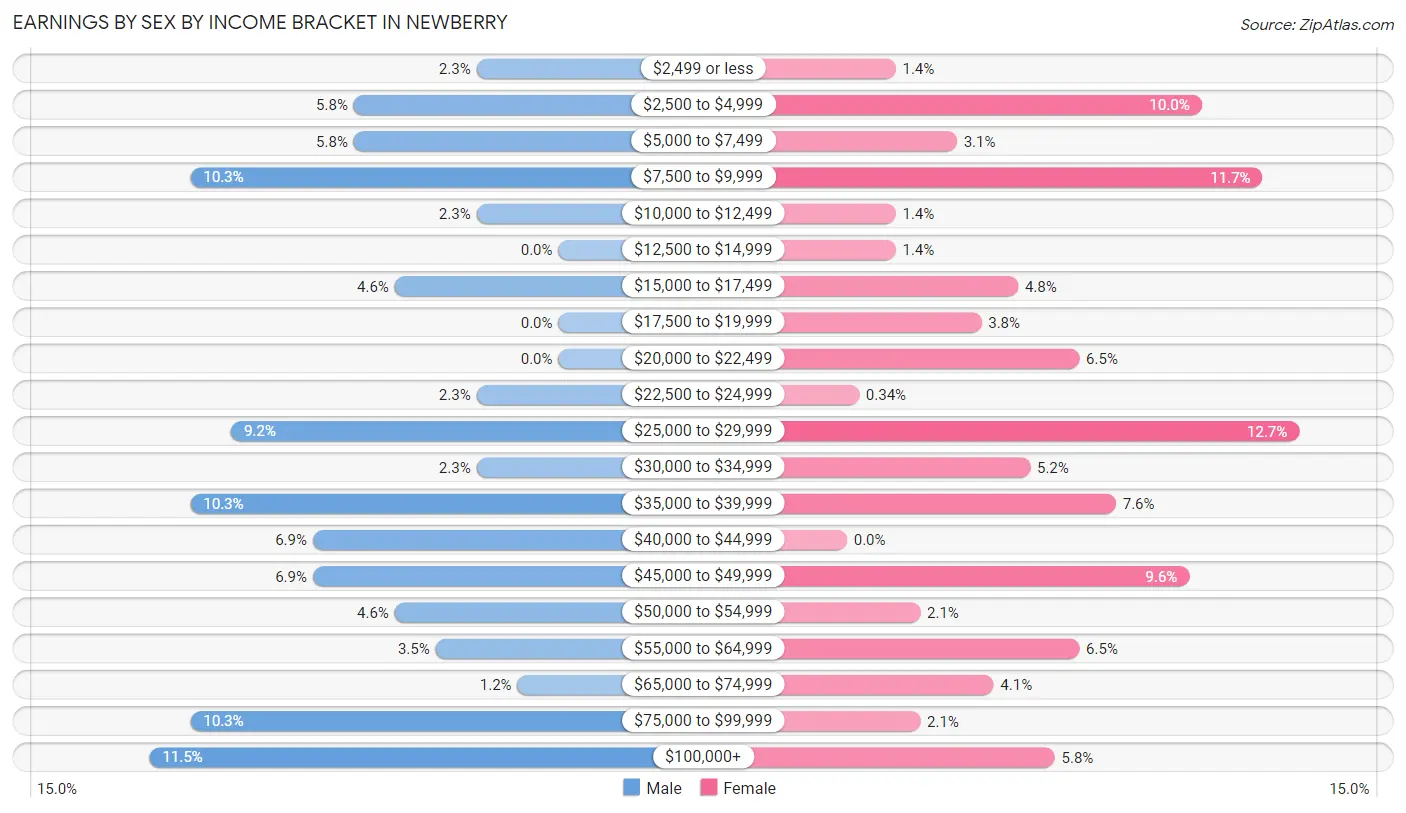
Earnings by Sex by Income Bracket in Newberry
The most common earnings brackets in Newberry are $100,000+ for men (10 | 11.5%) and $25,000 to $29,999 for women (37 | 12.7%).
| Income | Male | Female |
| $2,499 or less | 2 (2.3%) | 4 (1.4%) |
| $2,500 to $4,999 | 5 (5.8%) | 29 (10.0%) |
| $5,000 to $7,499 | 5 (5.8%) | 9 (3.1%) |
| $7,500 to $9,999 | 9 (10.3%) | 34 (11.7%) |
| $10,000 to $12,499 | 2 (2.3%) | 4 (1.4%) |
| $12,500 to $14,999 | 0 (0.0%) | 4 (1.4%) |
| $15,000 to $17,499 | 4 (4.6%) | 14 (4.8%) |
| $17,500 to $19,999 | 0 (0.0%) | 11 (3.8%) |
| $20,000 to $22,499 | 0 (0.0%) | 19 (6.5%) |
| $22,500 to $24,999 | 2 (2.3%) | 1 (0.3%) |
| $25,000 to $29,999 | 8 (9.2%) | 37 (12.7%) |
| $30,000 to $34,999 | 2 (2.3%) | 15 (5.1%) |
| $35,000 to $39,999 | 9 (10.3%) | 22 (7.6%) |
| $40,000 to $44,999 | 6 (6.9%) | 0 (0.0%) |
| $45,000 to $49,999 | 6 (6.9%) | 28 (9.6%) |
| $50,000 to $54,999 | 4 (4.6%) | 6 (2.1%) |
| $55,000 to $64,999 | 3 (3.5%) | 19 (6.5%) |
| $65,000 to $74,999 | 1 (1.1%) | 12 (4.1%) |
| $75,000 to $99,999 | 9 (10.3%) | 6 (2.1%) |
| $100,000+ | 10 (11.5%) | 17 (5.8%) |
| Total | 87 (100.0%) | 291 (100.0%) |
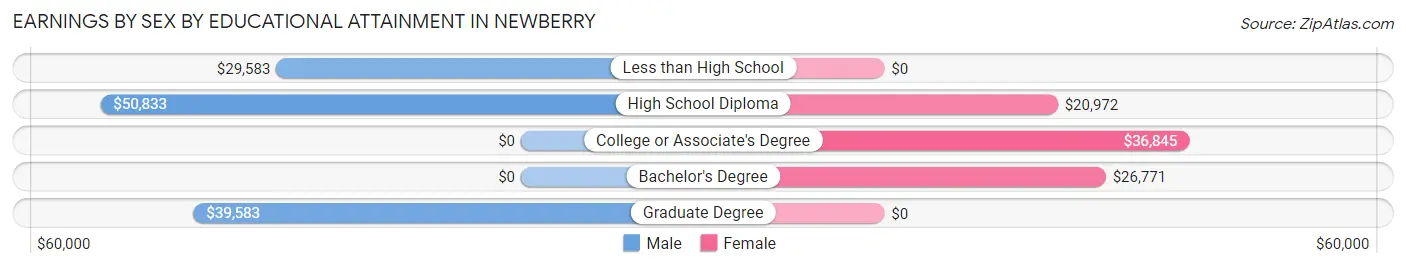
Earnings by Sex by Educational Attainment in Newberry
Average earnings in Newberry are $39,375 for men and $35,284 for women, a difference of 10.4%. Men with an educational attainment of high school diploma enjoy the highest average annual earnings of $50,833, while those with less than high school education earn the least with $29,583. Women with an educational attainment of college or associate's degree earn the most with the average annual earnings of $36,845, while those with high school diploma education have the smallest earnings of $20,972.
| Educational Attainment | Male Income | Female Income |
| Less than High School | $29,583 | $0 |
| High School Diploma | $50,833 | $20,972 |
| College or Associate's Degree | - | - |
| Bachelor's Degree | - | - |
| Graduate Degree | $39,583 | $0 |
| Total | $39,375 | $35,284 |
Family Income in Newberry
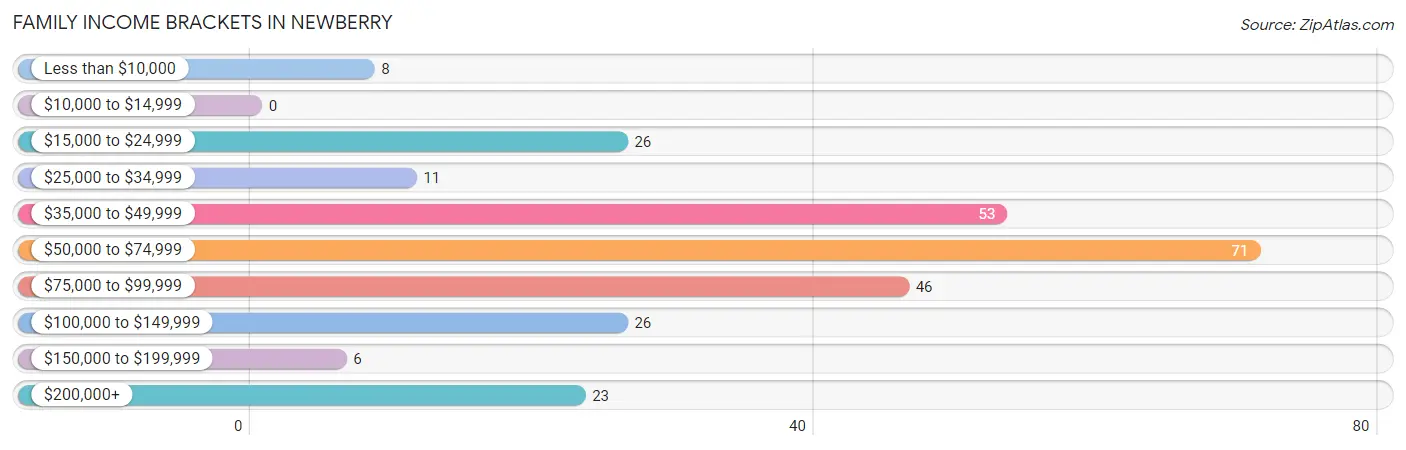
Family Income Brackets in Newberry
According to the Newberry family income data, there are 71 families falling into the $50,000 to $74,999 income range, which is the most common income bracket and makes up 26.3% of all families.
| Income Bracket | # Families | % Families |
| Less than $10,000 | 8 | 3.0% |
| $10,000 to $14,999 | 0 | 0.0% |
| $15,000 to $24,999 | 26 | 9.6% |
| $25,000 to $34,999 | 11 | 4.1% |
| $35,000 to $49,999 | 53 | 19.6% |
| $50,000 to $74,999 | 71 | 26.3% |
| $75,000 to $99,999 | 46 | 17.0% |
| $100,000 to $149,999 | 26 | 9.6% |
| $150,000 to $199,999 | 6 | 2.2% |
| $200,000+ | 23 | 8.5% |
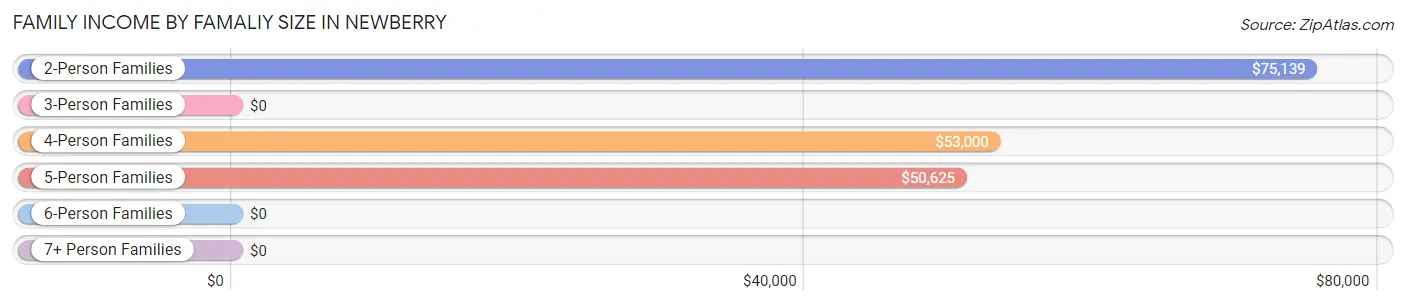
Family Income by Famaliy Size in Newberry
2-person families (149 | 55.2%) account for the highest median family income in Newberry with $75,139 per family, while 2-person families (149 | 55.2%) have the highest median income of $37,570 per family member.
| Income Bracket | # Families | Median Income |
| 2-Person Families | 149 (55.2%) | $75,139 |
| 3-Person Families | 45 (16.7%) | $0 |
| 4-Person Families | 42 (15.6%) | $53,000 |
| 5-Person Families | 8 (3.0%) | $50,625 |
| 6-Person Families | 5 (1.8%) | $0 |
| 7+ Person Families | 21 (7.8%) | $0 |
| Total | 270 (100.0%) | $63,036 |
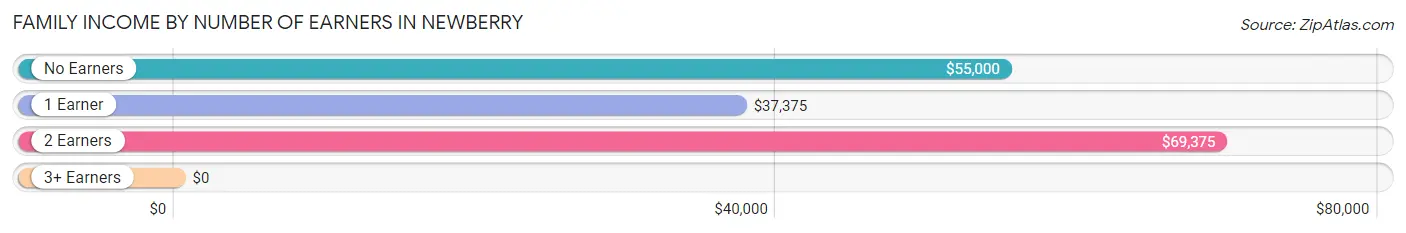
Family Income by Number of Earners in Newberry
| Number of Earners | # Families | Median Income |
| No Earners | 74 (27.4%) | $55,000 |
| 1 Earner | 75 (27.8%) | $37,375 |
| 2 Earners | 103 (38.2%) | $69,375 |
| 3+ Earners | 18 (6.7%) | $0 |
| Total | 270 (100.0%) | $63,036 |
Household Income in Newberry
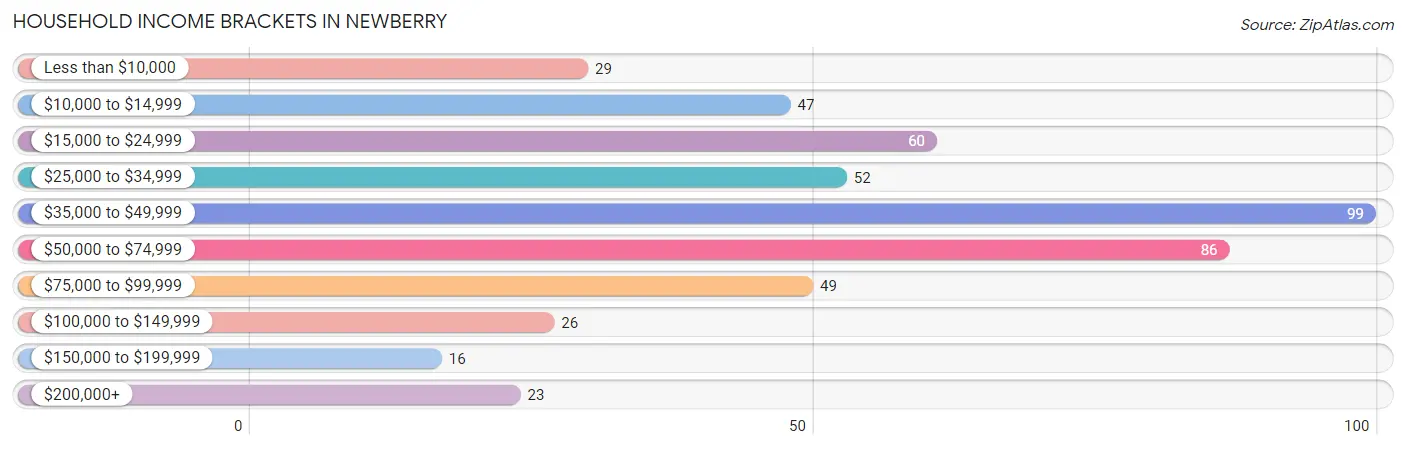
Household Income Brackets in Newberry
With 99 households falling in the category, the $35,000 to $49,999 income range is the most frequent in Newberry, accounting for 20.3% of all households. In contrast, only 16 households (3.3%) fall into the $150,000 to $199,999 income bracket, making it the least populous group.
| Income Bracket | # Households | % Households |
| Less than $10,000 | 29 | 6.0% |
| $10,000 to $14,999 | 47 | 9.7% |
| $15,000 to $24,999 | 60 | 12.3% |
| $25,000 to $34,999 | 52 | 10.7% |
| $35,000 to $49,999 | 99 | 20.3% |
| $50,000 to $74,999 | 86 | 17.7% |
| $75,000 to $99,999 | 49 | 10.1% |
| $100,000 to $149,999 | 26 | 5.3% |
| $150,000 to $199,999 | 16 | 3.3% |
| $200,000+ | 23 | 4.7% |
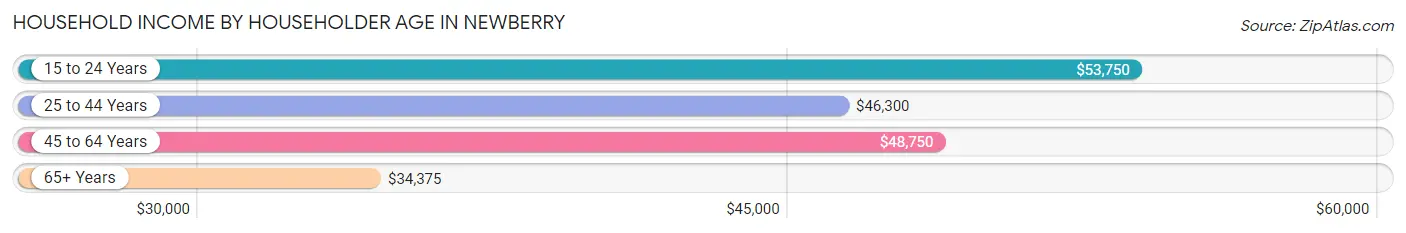
Household Income by Householder Age in Newberry
The median household income in Newberry is $45,213, with the highest median household income of $53,750 found in the 15 to 24 years age bracket for the primary householder. A total of 34 households (7.0%) fall into this category. Meanwhile, the 65+ years age bracket for the primary householder has the lowest median household income of $34,375, with 160 households (32.9%) in this group.
| Income Bracket | # Households | Median Income |
| 15 to 24 Years | 34 (7.0%) | $53,750 |
| 25 to 44 Years | 100 (20.5%) | $46,300 |
| 45 to 64 Years | 193 (39.6%) | $48,750 |
| 65+ Years | 160 (32.9%) | $34,375 |
| Total | 487 (100.0%) | $45,213 |
Poverty in Newberry
Income Below Poverty by Sex and Age in Newberry
With 32.4% poverty level for males and 24.0% for females among the residents of Newberry, 16 and 17 year old males and 15 year old females are the most vulnerable to poverty, with 5 males (100.0%) and 8 females (100.0%) in their respective age groups living below the poverty level.
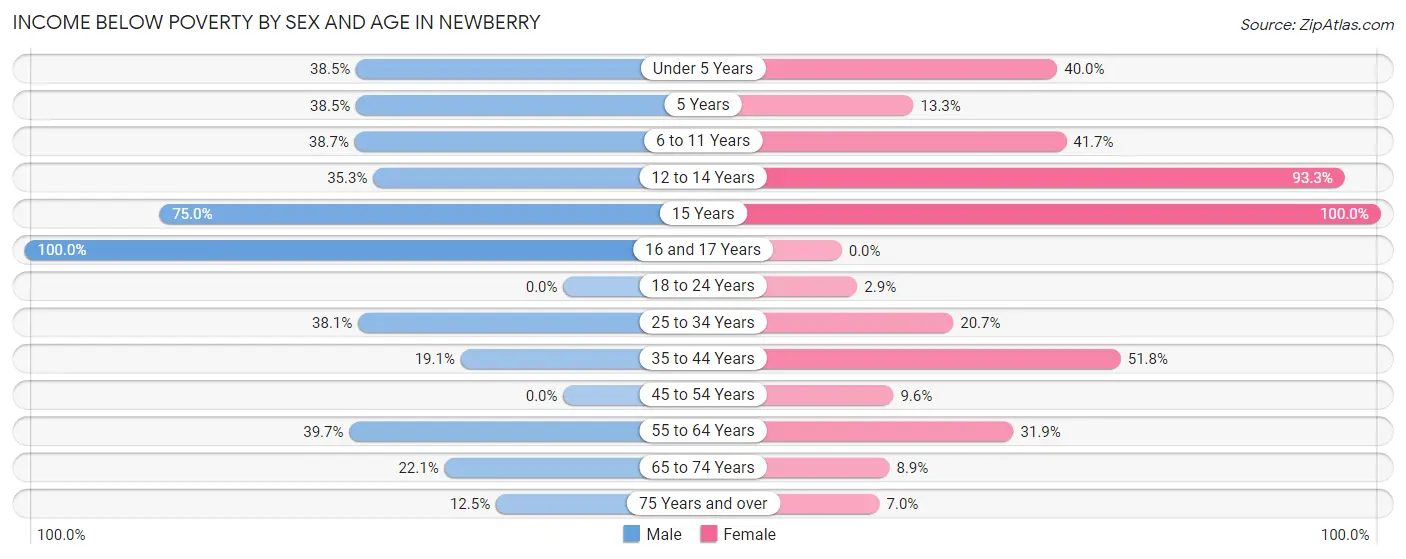
| Age Bracket | Male | Female |
| Under 5 Years | 20 (38.5%) | 6 (40.0%) |
| 5 Years | 5 (38.5%) | 2 (13.3%) |
| 6 to 11 Years | 36 (38.7%) | 20 (41.7%) |
| 12 to 14 Years | 12 (35.3%) | 28 (93.3%) |
| 15 Years | 9 (75.0%) | 8 (100.0%) |
| 16 and 17 Years | 5 (100.0%) | 0 (0.0%) |
| 18 to 24 Years | 0 (0.0%) | 2 (2.9%) |
| 25 to 34 Years | 8 (38.1%) | 18 (20.7%) |
| 35 to 44 Years | 4 (19.1%) | 29 (51.8%) |
| 45 to 54 Years | 0 (0.0%) | 7 (9.6%) |
| 55 to 64 Years | 29 (39.7%) | 22 (31.9%) |
| 65 to 74 Years | 15 (22.1%) | 7 (8.9%) |
| 75 Years and over | 6 (12.5%) | 4 (7.0%) |
| Total | 149 (32.4%) | 153 (24.0%) |
Income Above Poverty by Sex and Age in Newberry
According to the poverty statistics in Newberry, males aged 18 to 24 years and females aged 16 and 17 years are the age groups that are most secure financially, with 100.0% of males and 100.0% of females in these age groups living above the poverty line.
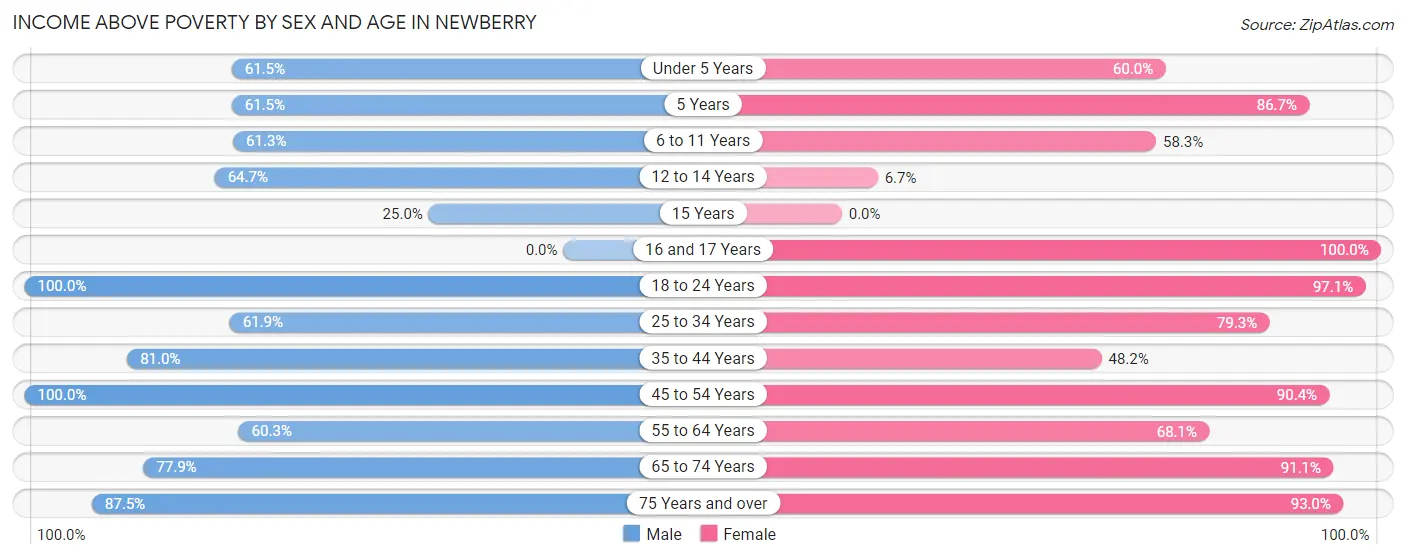
| Age Bracket | Male | Female |
| Under 5 Years | 32 (61.5%) | 9 (60.0%) |
| 5 Years | 8 (61.5%) | 13 (86.7%) |
| 6 to 11 Years | 57 (61.3%) | 28 (58.3%) |
| 12 to 14 Years | 22 (64.7%) | 2 (6.7%) |
| 15 Years | 3 (25.0%) | 0 (0.0%) |
| 16 and 17 Years | 0 (0.0%) | 31 (100.0%) |
| 18 to 24 Years | 9 (100.0%) | 67 (97.1%) |
| 25 to 34 Years | 13 (61.9%) | 69 (79.3%) |
| 35 to 44 Years | 17 (80.9%) | 27 (48.2%) |
| 45 to 54 Years | 11 (100.0%) | 66 (90.4%) |
| 55 to 64 Years | 44 (60.3%) | 47 (68.1%) |
| 65 to 74 Years | 53 (77.9%) | 72 (91.1%) |
| 75 Years and over | 42 (87.5%) | 53 (93.0%) |
| Total | 311 (67.6%) | 484 (76.0%) |
Income Below Poverty Among Married-Couple Families in Newberry
The poverty statistics for married-couple families in Newberry show that 6.8% or 12 of the total 177 families live below the poverty line. Families with 3 or 4 children have the highest poverty rate of 33.3%, comprising of 4 families. On the other hand, families with 5 or more children have the lowest poverty rate of 0.0%, which includes 0 families.
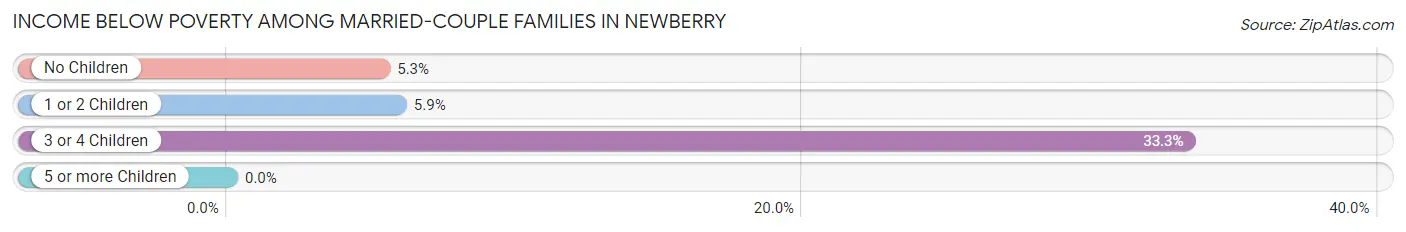
| Children | Above Poverty | Below Poverty |
| No Children | 125 (94.7%) | 7 (5.3%) |
| 1 or 2 Children | 16 (94.1%) | 1 (5.9%) |
| 3 or 4 Children | 8 (66.7%) | 4 (33.3%) |
| 5 or more Children | 16 (100.0%) | 0 (0.0%) |
| Total | 165 (93.2%) | 12 (6.8%) |
Income Below Poverty Among Single-Parent Households in Newberry
According to the poverty data in Newberry, 11.1% or 1 single-father households and 35.7% or 30 single-mother households are living below the poverty line. Among single-father households, those with 3 or 4 children have the highest poverty rate, with 1 households (100.0%) experiencing poverty. Likewise, among single-mother households, those with 3 or 4 children have the highest poverty rate, with 11 households (100.0%) falling below the poverty line.
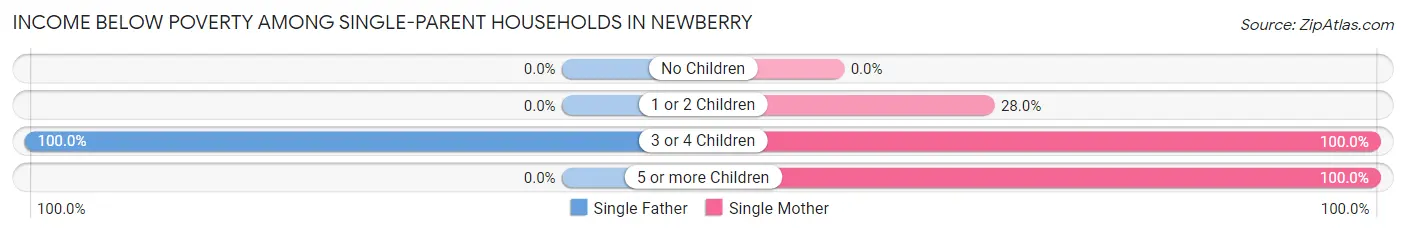
| Children | Single Father | Single Mother |
| No Children | 0 (0.0%) | 0 (0.0%) |
| 1 or 2 Children | 0 (0.0%) | 14 (28.0%) |
| 3 or 4 Children | 1 (100.0%) | 11 (100.0%) |
| 5 or more Children | 0 (0.0%) | 5 (100.0%) |
| Total | 1 (11.1%) | 30 (35.7%) |
Income Below Poverty Among Married-Couple vs Single-Parent Households in Newberry
The poverty data for Newberry shows that 12 of the married-couple family households (6.8%) and 31 of the single-parent households (33.3%) are living below the poverty level. Within the married-couple family households, those with 3 or 4 children have the highest poverty rate, with 4 households (33.3%) falling below the poverty line. Among the single-parent households, those with 3 or 4 children have the highest poverty rate, with 12 household (100.0%) living below poverty.
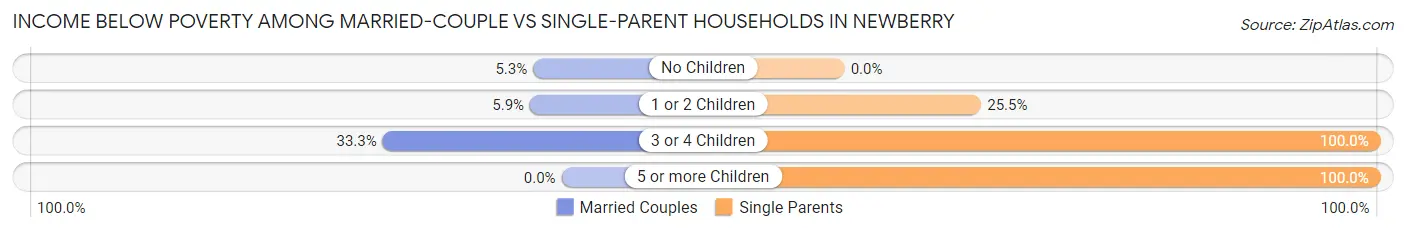
| Children | Married-Couple Families | Single-Parent Households |
| No Children | 7 (5.3%) | 0 (0.0%) |
| 1 or 2 Children | 1 (5.9%) | 14 (25.5%) |
| 3 or 4 Children | 4 (33.3%) | 12 (100.0%) |
| 5 or more Children | 0 (0.0%) | 5 (100.0%) |
| Total | 12 (6.8%) | 31 (33.3%) |
Race in Newberry
The most populous races in Newberry are White / Caucasian (1,052 | 92.4%), Two or more Races (43 | 3.8%), and Native / Alaskan (38 | 3.3%).
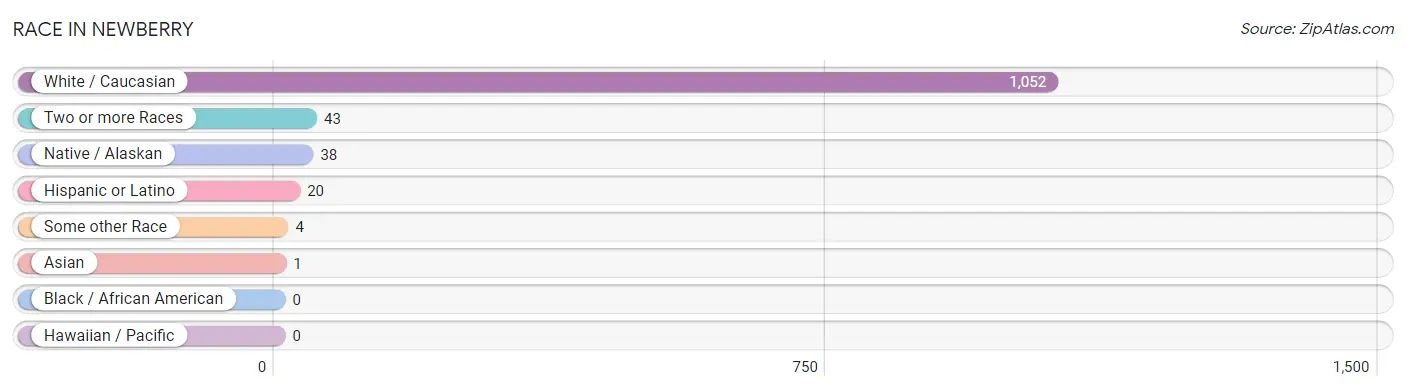
| Race | # Population | % Population |
| Asian | 1 | 0.1% |
| Black / African American | 0 | 0.0% |
| Hawaiian / Pacific | 0 | 0.0% |
| Hispanic or Latino | 20 | 1.8% |
| Native / Alaskan | 38 | 3.3% |
| White / Caucasian | 1,052 | 92.4% |
| Two or more Races | 43 | 3.8% |
| Some other Race | 4 | 0.4% |
| Total | 1,138 | 100.0% |
Ancestry in Newberry
The most populous ancestries reported in Newberry are German (287 | 25.2%), English (209 | 18.4%), Irish (204 | 17.9%), American (57 | 5.0%), and Chippewa (49 | 4.3%), together accounting for 70.8% of all Newberry residents.
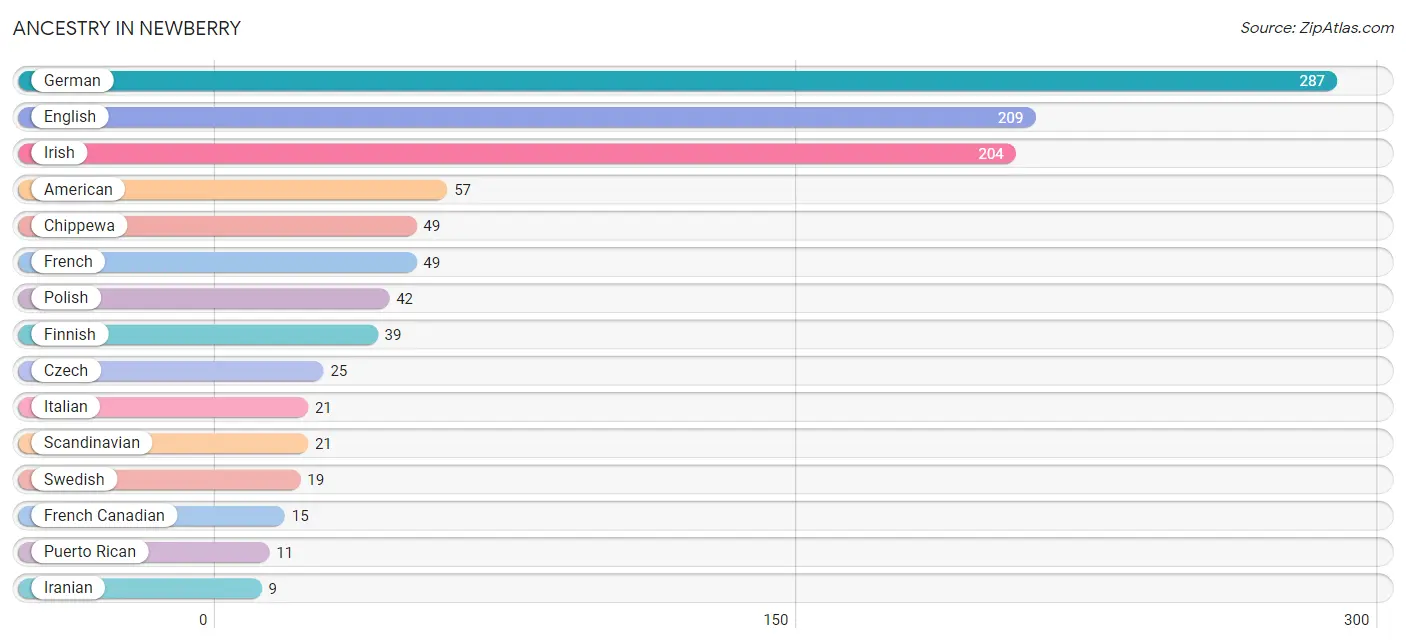
| Ancestry | # Population | % Population |
| Alsatian | 1 | 0.1% |
| American | 57 | 5.0% |
| Bhutanese | 1 | 0.1% |
| Canadian | 3 | 0.3% |
| Cherokee | 6 | 0.5% |
| Chippewa | 49 | 4.3% |
| Czech | 25 | 2.2% |
| Dutch | 3 | 0.3% |
| English | 209 | 18.4% |
| European | 3 | 0.3% |
| Finnish | 39 | 3.4% |
| French | 49 | 4.3% |
| French Canadian | 15 | 1.3% |
| German | 287 | 25.2% |
| Iranian | 9 | 0.8% |
| Irish | 204 | 17.9% |
| Italian | 21 | 1.8% |
| Korean | 2 | 0.2% |
| Mexican | 7 | 0.6% |
| Norwegian | 1 | 0.1% |
| Ottawa | 3 | 0.3% |
| Polish | 42 | 3.7% |
| Puerto Rican | 11 | 1.0% |
| Scandinavian | 21 | 1.8% |
| Scotch-Irish | 3 | 0.3% |
| Scottish | 7 | 0.6% |
| Slovak | 1 | 0.1% |
| Spanish | 2 | 0.2% |
| Swedish | 19 | 1.7% |
| Welsh | 5 | 0.4% | View All 30 Rows |
Immigrants in Newberry
The most numerous immigrant groups reported in Newberry came from Central America (4 | 0.4%), Latin America (4 | 0.4%), Mexico (4 | 0.4%), Canada (2 | 0.2%), and Asia (1 | 0.1%), together accounting for 1.3% of all Newberry residents.
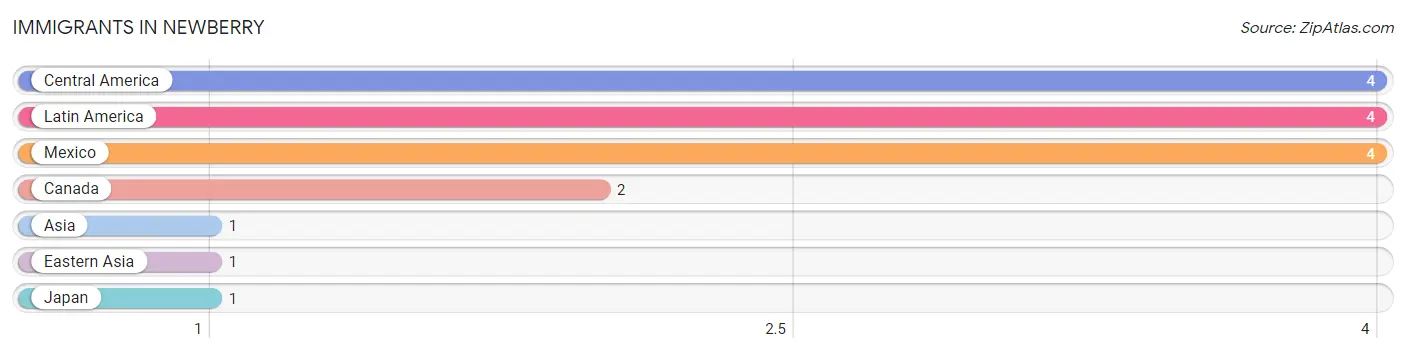
| Immigration Origin | # Population | % Population |
| Asia | 1 | 0.1% |
| Canada | 2 | 0.2% |
| Central America | 4 | 0.4% |
| Eastern Asia | 1 | 0.1% |
| Japan | 1 | 0.1% |
| Latin America | 4 | 0.4% |
| Mexico | 4 | 0.4% | View All 7 Rows |
Sex and Age in Newberry
Sex and Age in Newberry
The most populous age groups in Newberry are 10 to 14 Years (72 | 15.1%) for men and 20 to 24 Years (65 | 9.8%) for women.
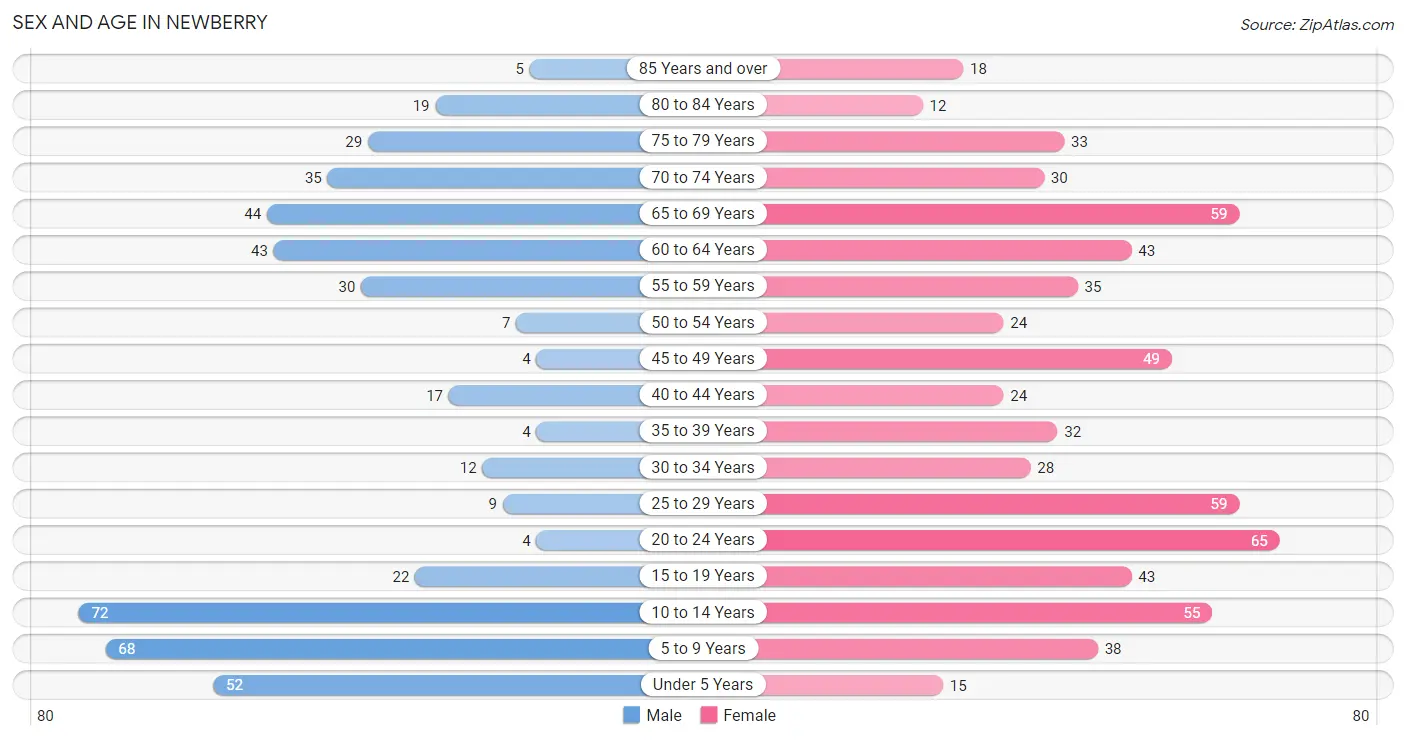
| Age Bracket | Male | Female |
| Under 5 Years | 52 (10.9%) | 15 (2.3%) |
| 5 to 9 Years | 68 (14.3%) | 38 (5.7%) |
| 10 to 14 Years | 72 (15.1%) | 55 (8.3%) |
| 15 to 19 Years | 22 (4.6%) | 43 (6.5%) |
| 20 to 24 Years | 4 (0.8%) | 65 (9.8%) |
| 25 to 29 Years | 9 (1.9%) | 59 (8.9%) |
| 30 to 34 Years | 12 (2.5%) | 28 (4.2%) |
| 35 to 39 Years | 4 (0.8%) | 32 (4.8%) |
| 40 to 44 Years | 17 (3.6%) | 24 (3.6%) |
| 45 to 49 Years | 4 (0.8%) | 49 (7.4%) |
| 50 to 54 Years | 7 (1.5%) | 24 (3.6%) |
| 55 to 59 Years | 30 (6.3%) | 35 (5.3%) |
| 60 to 64 Years | 43 (9.0%) | 43 (6.5%) |
| 65 to 69 Years | 44 (9.2%) | 59 (8.9%) |
| 70 to 74 Years | 35 (7.3%) | 30 (4.5%) |
| 75 to 79 Years | 29 (6.1%) | 33 (5.0%) |
| 80 to 84 Years | 19 (4.0%) | 12 (1.8%) |
| 85 Years and over | 5 (1.1%) | 18 (2.7%) |
| Total | 476 (100.0%) | 662 (100.0%) |
Families and Households in Newberry
Median Family Size in Newberry
The median family size in Newberry is 3.01 persons per family, with single male/father families (9 | 3.3%) accounting for the largest median family size of 4.89 persons per family. On the other hand, single female/mother families (84 | 31.1%) represent the smallest median family size with 2.79 persons per family.
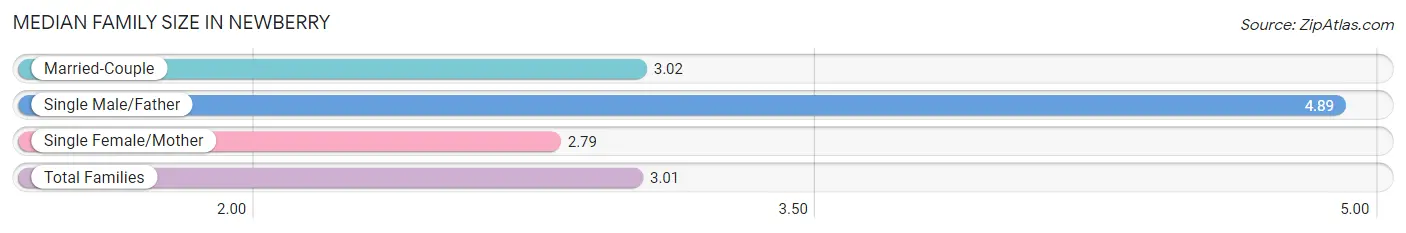
| Family Type | # Families | Family Size |
| Married-Couple | 177 (65.6%) | 3.02 |
| Single Male/Father | 9 (3.3%) | 4.89 |
| Single Female/Mother | 84 (31.1%) | 2.79 |
| Total Families | 270 (100.0%) | 3.01 |
Median Household Size in Newberry
The median household size in Newberry is 2.25 persons per household, with single male/father households (9 | 1.8%) accounting for the largest median household size of 9 persons per household. non-family households (217 | 44.6%) represent the smallest median household size with 1.08 persons per household.
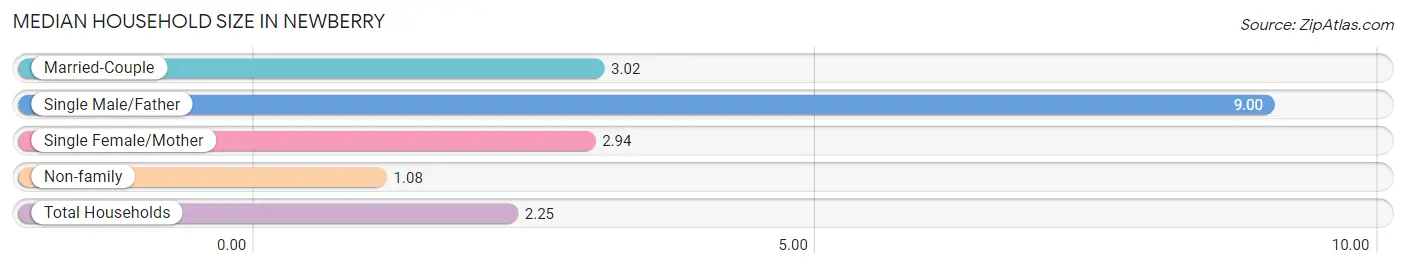
| Household Type | # Households | Household Size |
| Married-Couple | 177 (36.3%) | 3.02 |
| Single Male/Father | 9 (1.8%) | 9.00 |
| Single Female/Mother | 84 (17.2%) | 2.94 |
| Non-family | 217 (44.6%) | 1.08 |
| Total Households | 487 (100.0%) | 2.25 |
Household Size by Marriage Status in Newberry
Out of a total of 487 households in Newberry, 270 (55.4%) are family households, while 217 (44.6%) are nonfamily households. The most numerous type of family households are 2-person households, comprising 140, and the most common type of nonfamily households are 1-person households, comprising 186.
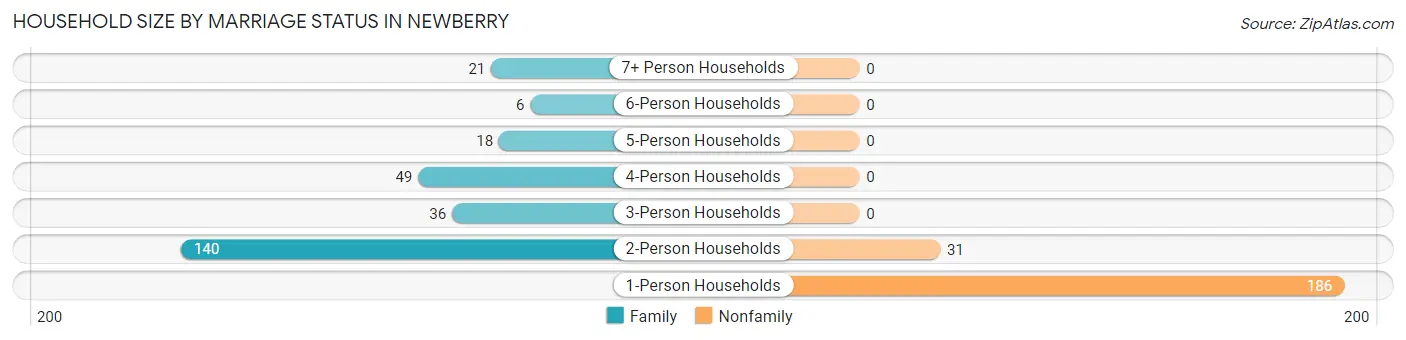
| Household Size | Family Households | Nonfamily Households |
| 1-Person Households | - | 186 (38.2%) |
| 2-Person Households | 140 (28.7%) | 31 (6.4%) |
| 3-Person Households | 36 (7.4%) | 0 (0.0%) |
| 4-Person Households | 49 (10.1%) | 0 (0.0%) |
| 5-Person Households | 18 (3.7%) | 0 (0.0%) |
| 6-Person Households | 6 (1.2%) | 0 (0.0%) |
| 7+ Person Households | 21 (4.3%) | 0 (0.0%) |
| Total | 270 (55.4%) | 217 (44.6%) |
Female Fertility in Newberry
Fertility by Age in Newberry
Average fertility rate in Newberry is 123.0 births per 1,000 women. Women in the age bracket of 20 to 34 years have the highest fertility rate with 224.0 births per 1,000 women. Women in the age bracket of 20 to 34 years acount for 91.9% of all women with births.
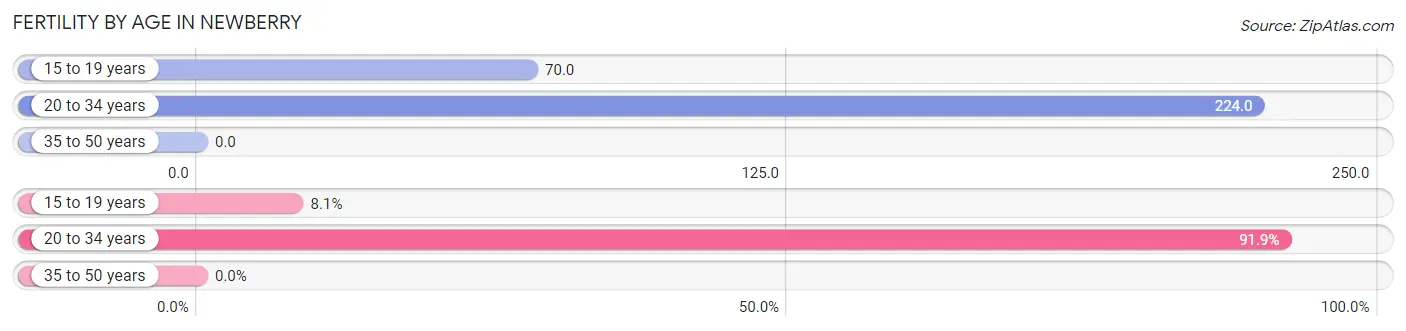
| Age Bracket | Women with Births | Births / 1,000 Women |
| 15 to 19 years | 3 (8.1%) | 70.0 |
| 20 to 34 years | 34 (91.9%) | 224.0 |
| 35 to 50 years | 0 (0.0%) | 0.0 |
| Total | 37 (100.0%) | 123.0 |
Fertility by Age by Marriage Status in Newberry
78.4% of women with births (37) in Newberry are married. The highest percentage of unmarried women with births falls into 20 to 34 years age bracket with 23.5% of them unmarried at the time of birth, while the lowest percentage of unmarried women with births belong to 15 to 19 years age bracket with 0.0% of them unmarried.
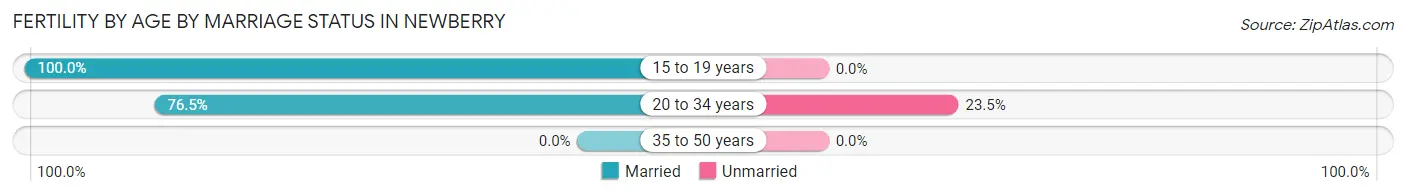
| Age Bracket | Married | Unmarried |
| 15 to 19 years | 3 (100.0%) | 0 (0.0%) |
| 20 to 34 years | 26 (76.5%) | 8 (23.5%) |
| 35 to 50 years | 0 (0.0%) | 0 (0.0%) |
| Total | 29 (78.4%) | 8 (21.6%) |
Fertility by Education in Newberry
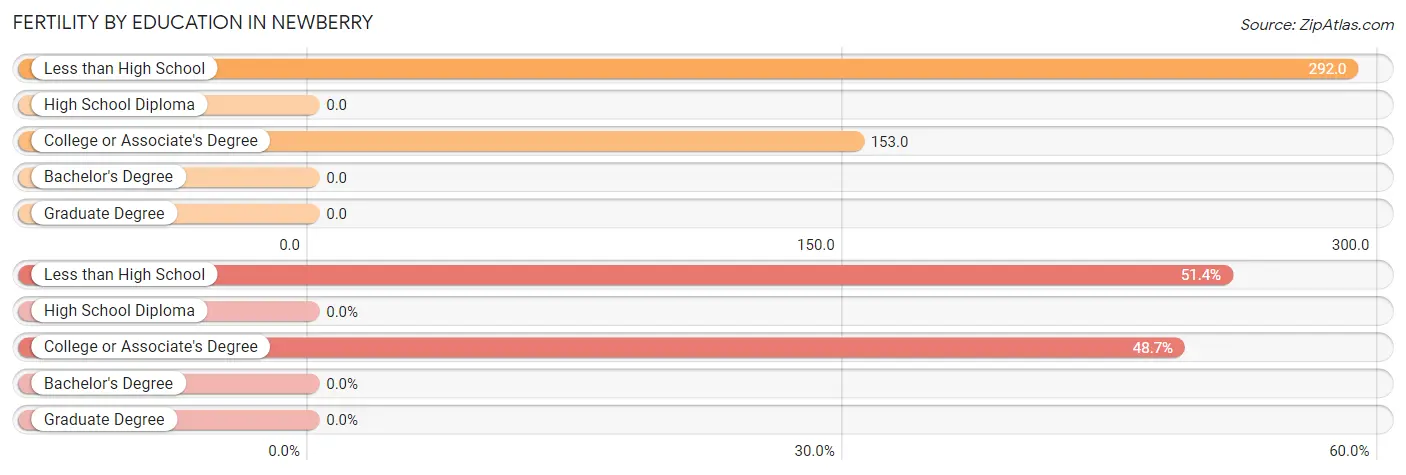
| Educational Attainment | Women with Births | Births / 1,000 Women |
| Less than High School | 19 (51.3%) | 292.0 |
| High School Diploma | 0 (0.0%) | 0.0 |
| College or Associate's Degree | 18 (48.6%) | 153.0 |
| Bachelor's Degree | 0 (0.0%) | 0.0 |
| Graduate Degree | 0 (0.0%) | 0.0 |
| Total | 37 (100.0%) | 123.0 |
Fertility by Education by Marriage Status in Newberry
21.6% of women with births in Newberry are unmarried. Women with the educational attainment of less than high school are most likely to be married with 100.0% of them married at childbirth, while women with the educational attainment of college or associate's degree are least likely to be married with 44.4% of them unmarried at childbirth.
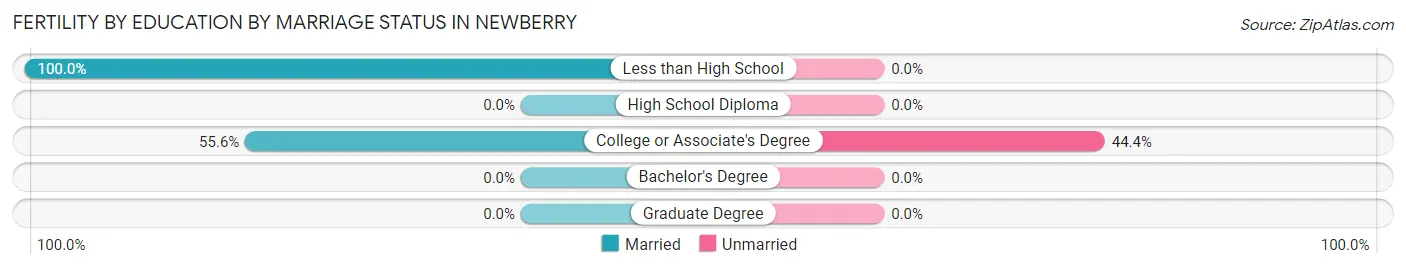
| Educational Attainment | Married | Unmarried |
| Less than High School | 19 (100.0%) | 0 (0.0%) |
| High School Diploma | 0 (0.0%) | 0 (0.0%) |
| College or Associate's Degree | 10 (55.6%) | 8 (44.4%) |
| Bachelor's Degree | 0 (0.0%) | 0 (0.0%) |
| Graduate Degree | 0 (0.0%) | 0 (0.0%) |
| Total | 29 (78.4%) | 8 (21.6%) |
Employment Characteristics in Newberry
Employment by Class of Employer in Newberry
Among the 324 employed individuals in Newberry, private company employees (208 | 64.2%), self-employed (not incorporated) (30 | 9.3%), and not-for-profit organizations (24 | 7.4%) make up the most common classes of employment.
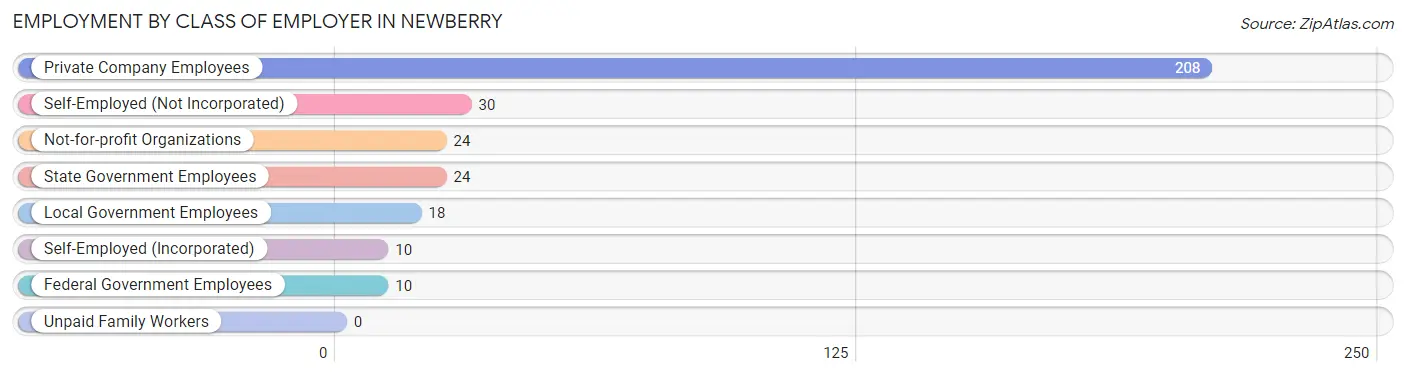
| Employer Class | # Employees | % Employees |
| Private Company Employees | 208 | 64.2% |
| Self-Employed (Incorporated) | 10 | 3.1% |
| Self-Employed (Not Incorporated) | 30 | 9.3% |
| Not-for-profit Organizations | 24 | 7.4% |
| Local Government Employees | 18 | 5.6% |
| State Government Employees | 24 | 7.4% |
| Federal Government Employees | 10 | 3.1% |
| Unpaid Family Workers | 0 | 0.0% |
| Total | 324 | 100.0% |
Employment Status by Age in Newberry
According to the labor force statistics for Newberry, out of the total population over 16 years of age (818), 45.6% or 373 individuals are in the labor force, with 4.6% or 17 of them unemployed. The age group with the highest labor force participation rate is 20 to 24 years, with 100.0% or 69 individuals in the labor force. Within the labor force, the 30 to 34 years age range has the highest percentage of unemployed individuals, with 14.7% or 5 of them being unemployed.
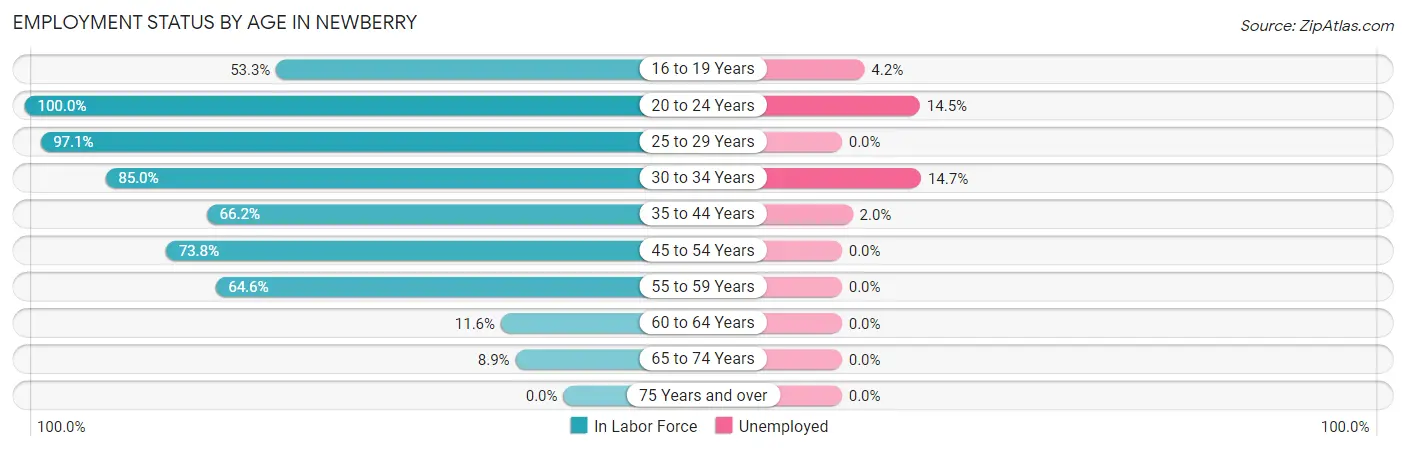
| Age Bracket | In Labor Force | Unemployed |
| 16 to 19 Years | 24 (53.3%) | 1 (4.2%) |
| 20 to 24 Years | 69 (100.0%) | 10 (14.5%) |
| 25 to 29 Years | 66 (97.1%) | 0 (0.0%) |
| 30 to 34 Years | 34 (85.0%) | 5 (14.7%) |
| 35 to 44 Years | 51 (66.2%) | 1 (2.0%) |
| 45 to 54 Years | 62 (73.8%) | 0 (0.0%) |
| 55 to 59 Years | 42 (64.6%) | 0 (0.0%) |
| 60 to 64 Years | 10 (11.6%) | 0 (0.0%) |
| 65 to 74 Years | 15 (8.9%) | 0 (0.0%) |
| 75 Years and over | 0 (0.0%) | 0 (0.0%) |
| Total | 373 (45.6%) | 17 (4.6%) |
Employment Status by Educational Attainment in Newberry
According to labor force statistics for Newberry, 63.1% of individuals (265) out of the total population between 25 and 64 years of age (420) are in the labor force, with 2.3% or 6 of them being unemployed. The group with the highest labor force participation rate are those with the educational attainment of bachelor's degree or higher, with 82.9% or 68 individuals in the labor force. Within the labor force, individuals with high school diploma education have the highest percentage of unemployment, with 6.9% or 5 of them being unemployed.
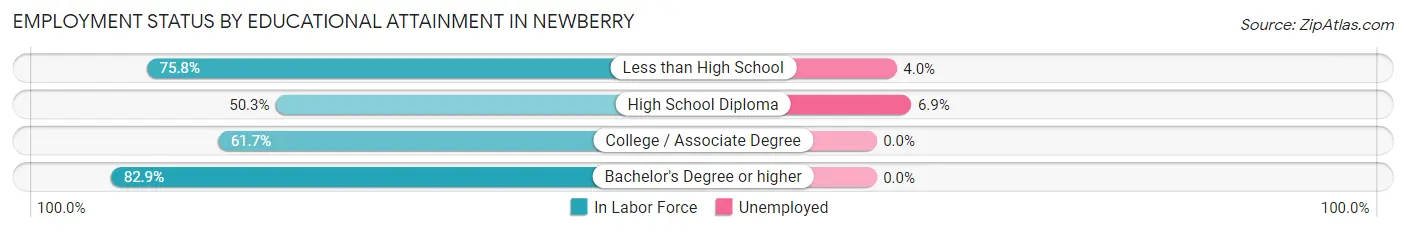
| Educational Attainment | In Labor Force | Unemployed |
| Less than High School | 25 (75.8%) | 1 (4.0%) |
| High School Diploma | 72 (50.3%) | 10 (6.9%) |
| College / Associate Degree | 100 (61.7%) | 0 (0.0%) |
| Bachelor's Degree or higher | 68 (82.9%) | 0 (0.0%) |
| Total | 265 (63.1%) | 10 (2.3%) |
Employment Occupations by Sex in Newberry
Management, Business, Science and Arts Occupations
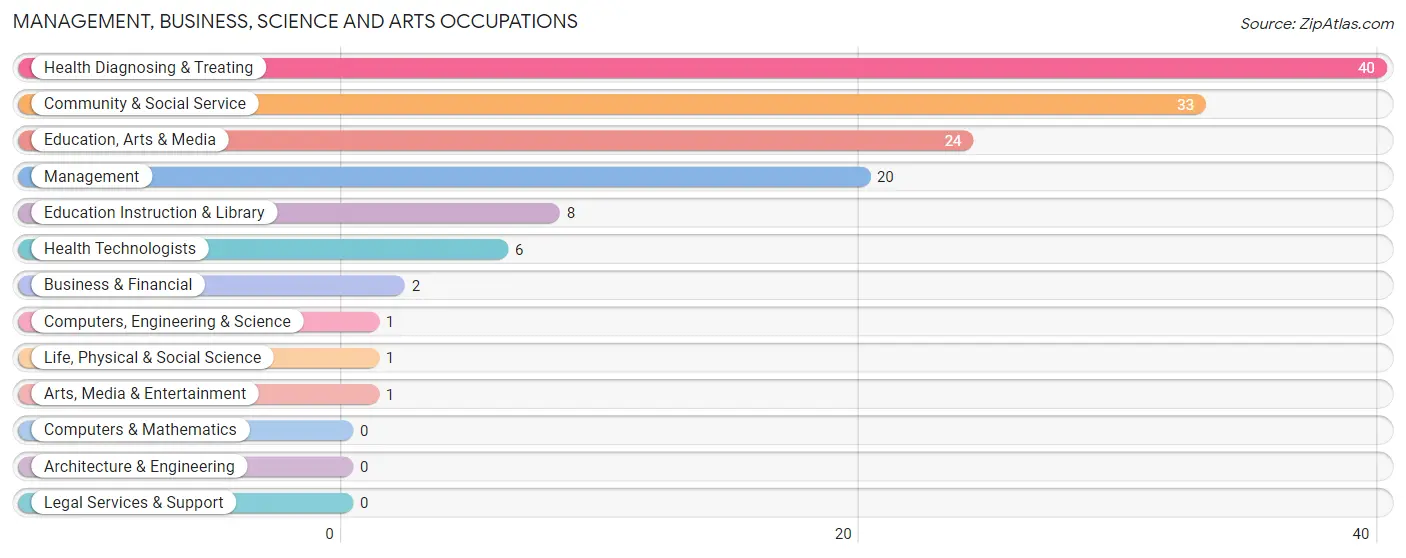
The most common Management, Business, Science and Arts occupations in Newberry are Health Diagnosing & Treating (40 | 11.2%), Community & Social Service (33 | 9.3%), Education, Arts & Media (24 | 6.7%), Management (20 | 5.6%), and Education Instruction & Library (8 | 2.2%).
Management, Business, Science and Arts Occupations by Sex
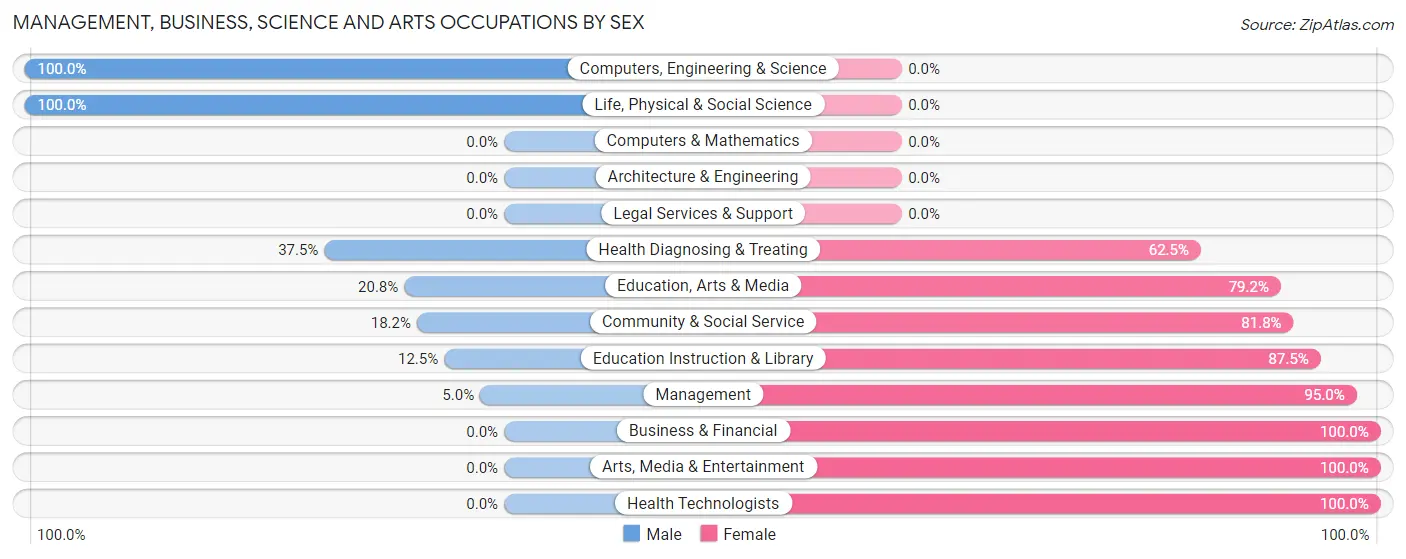
Within the Management, Business, Science and Arts occupations in Newberry, the most male-oriented occupations are Computers, Engineering & Science (100.0%), Life, Physical & Social Science (100.0%), and Health Diagnosing & Treating (37.5%), while the most female-oriented occupations are Business & Financial (100.0%), Arts, Media & Entertainment (100.0%), and Health Technologists (100.0%).
| Occupation | Male | Female |
| Management | 1 (5.0%) | 19 (95.0%) |
| Business & Financial | 0 (0.0%) | 2 (100.0%) |
| Computers, Engineering & Science | 1 (100.0%) | 0 (0.0%) |
| Computers & Mathematics | 0 (0.0%) | 0 (0.0%) |
| Architecture & Engineering | 0 (0.0%) | 0 (0.0%) |
| Life, Physical & Social Science | 1 (100.0%) | 0 (0.0%) |
| Community & Social Service | 6 (18.2%) | 27 (81.8%) |
| Education, Arts & Media | 5 (20.8%) | 19 (79.2%) |
| Legal Services & Support | 0 (0.0%) | 0 (0.0%) |
| Education Instruction & Library | 1 (12.5%) | 7 (87.5%) |
| Arts, Media & Entertainment | 0 (0.0%) | 1 (100.0%) |
| Health Diagnosing & Treating | 15 (37.5%) | 25 (62.5%) |
| Health Technologists | 0 (0.0%) | 6 (100.0%) |
| Total (Category) | 23 (24.0%) | 73 (76.0%) |
| Total (Overall) | 77 (21.6%) | 279 (78.4%) |
Services Occupations
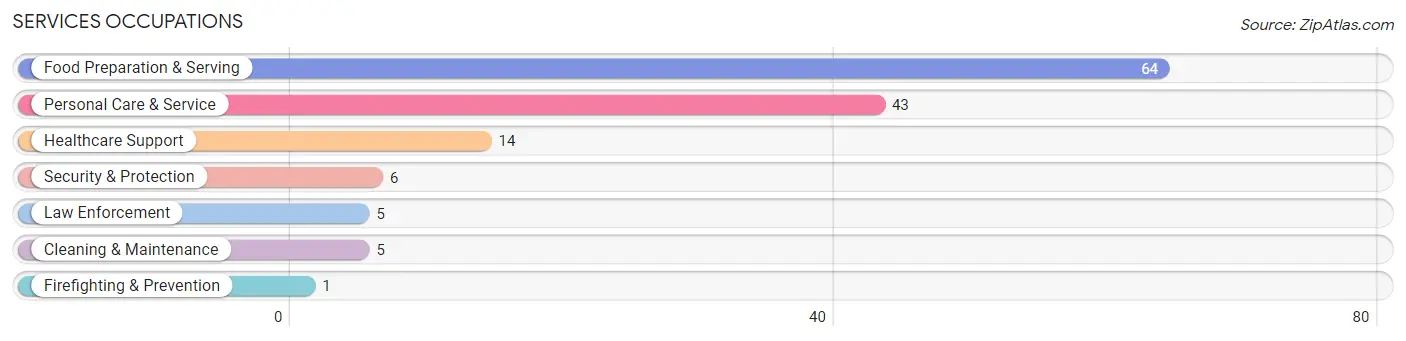
The most common Services occupations in Newberry are Food Preparation & Serving (64 | 18.0%), Personal Care & Service (43 | 12.1%), Healthcare Support (14 | 3.9%), Security & Protection (6 | 1.7%), and Law Enforcement (5 | 1.4%).
Services Occupations by Sex
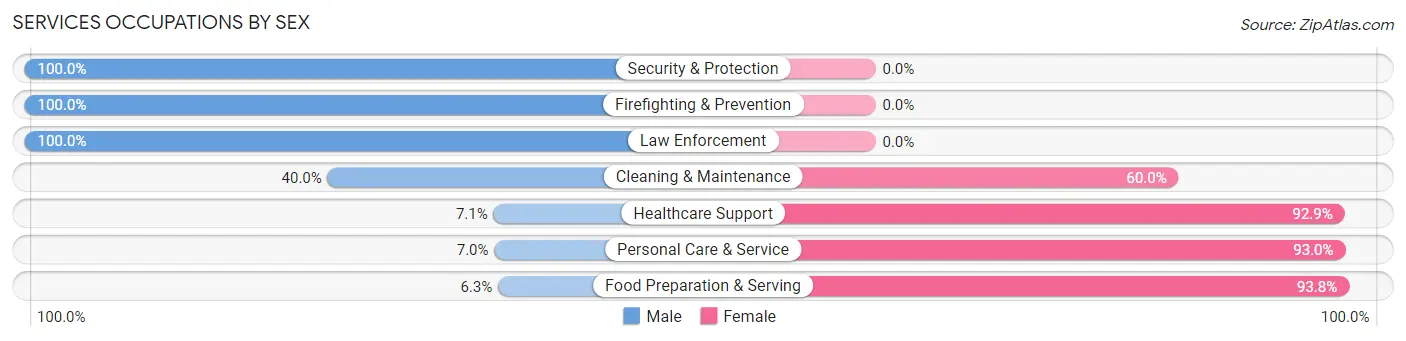
Within the Services occupations in Newberry, the most male-oriented occupations are Security & Protection (100.0%), Firefighting & Prevention (100.0%), and Law Enforcement (100.0%), while the most female-oriented occupations are Food Preparation & Serving (93.8%), Personal Care & Service (93.0%), and Healthcare Support (92.9%).
| Occupation | Male | Female |
| Healthcare Support | 1 (7.1%) | 13 (92.9%) |
| Security & Protection | 6 (100.0%) | 0 (0.0%) |
| Firefighting & Prevention | 1 (100.0%) | 0 (0.0%) |
| Law Enforcement | 5 (100.0%) | 0 (0.0%) |
| Food Preparation & Serving | 4 (6.2%) | 60 (93.8%) |
| Cleaning & Maintenance | 2 (40.0%) | 3 (60.0%) |
| Personal Care & Service | 3 (7.0%) | 40 (93.0%) |
| Total (Category) | 16 (12.1%) | 116 (87.9%) |
| Total (Overall) | 77 (21.6%) | 279 (78.4%) |
Sales and Office Occupations
The most common Sales and Office occupations in Newberry are Office & Administration (44 | 12.4%), and Sales & Related (41 | 11.5%).

Sales and Office Occupations by Sex
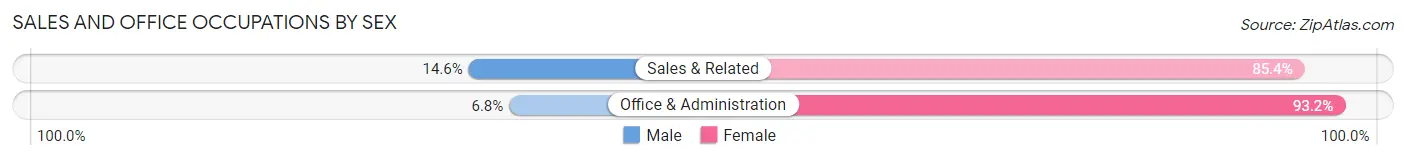
| Occupation | Male | Female |
| Sales & Related | 6 (14.6%) | 35 (85.4%) |
| Office & Administration | 3 (6.8%) | 41 (93.2%) |
| Total (Category) | 9 (10.6%) | 76 (89.4%) |
| Total (Overall) | 77 (21.6%) | 279 (78.4%) |
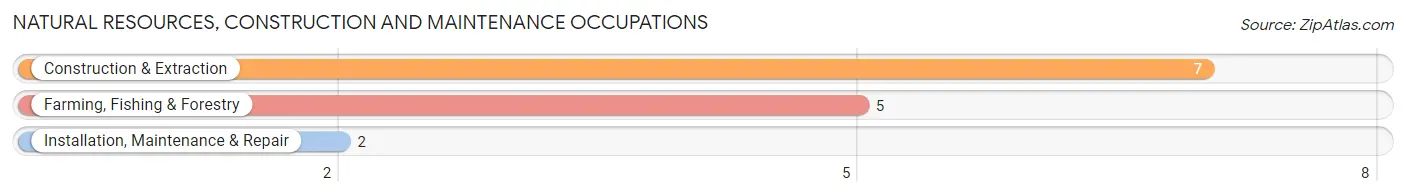
Natural Resources, Construction and Maintenance Occupations
The most common Natural Resources, Construction and Maintenance occupations in Newberry are Construction & Extraction (7 | 2.0%), Farming, Fishing & Forestry (5 | 1.4%), and Installation, Maintenance & Repair (2 | 0.6%).
Natural Resources, Construction and Maintenance Occupations by Sex
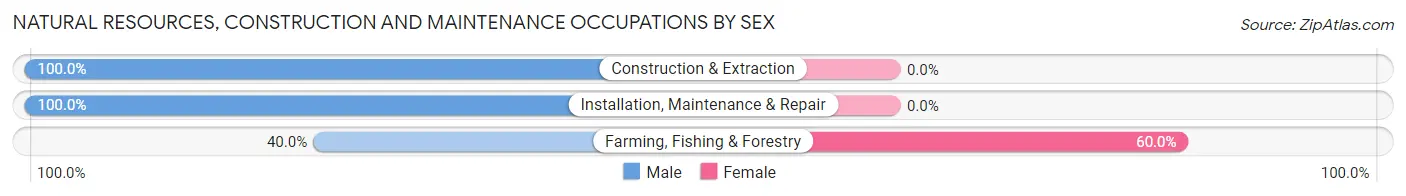
| Occupation | Male | Female |
| Farming, Fishing & Forestry | 2 (40.0%) | 3 (60.0%) |
| Construction & Extraction | 7 (100.0%) | 0 (0.0%) |
| Installation, Maintenance & Repair | 2 (100.0%) | 0 (0.0%) |
| Total (Category) | 11 (78.6%) | 3 (21.4%) |
| Total (Overall) | 77 (21.6%) | 279 (78.4%) |
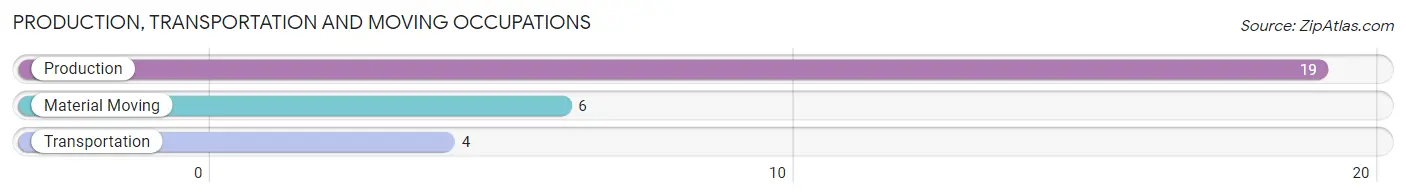
Production, Transportation and Moving Occupations
The most common Production, Transportation and Moving occupations in Newberry are Production (19 | 5.3%), Material Moving (6 | 1.7%), and Transportation (4 | 1.1%).
Production, Transportation and Moving Occupations by Sex
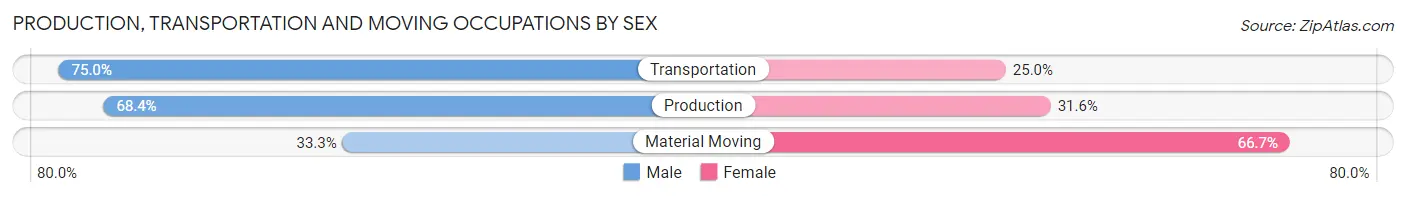
| Occupation | Male | Female |
| Production | 13 (68.4%) | 6 (31.6%) |
| Transportation | 3 (75.0%) | 1 (25.0%) |
| Material Moving | 2 (33.3%) | 4 (66.7%) |
| Total (Category) | 18 (62.1%) | 11 (37.9%) |
| Total (Overall) | 77 (21.6%) | 279 (78.4%) |
Employment Industries by Sex in Newberry
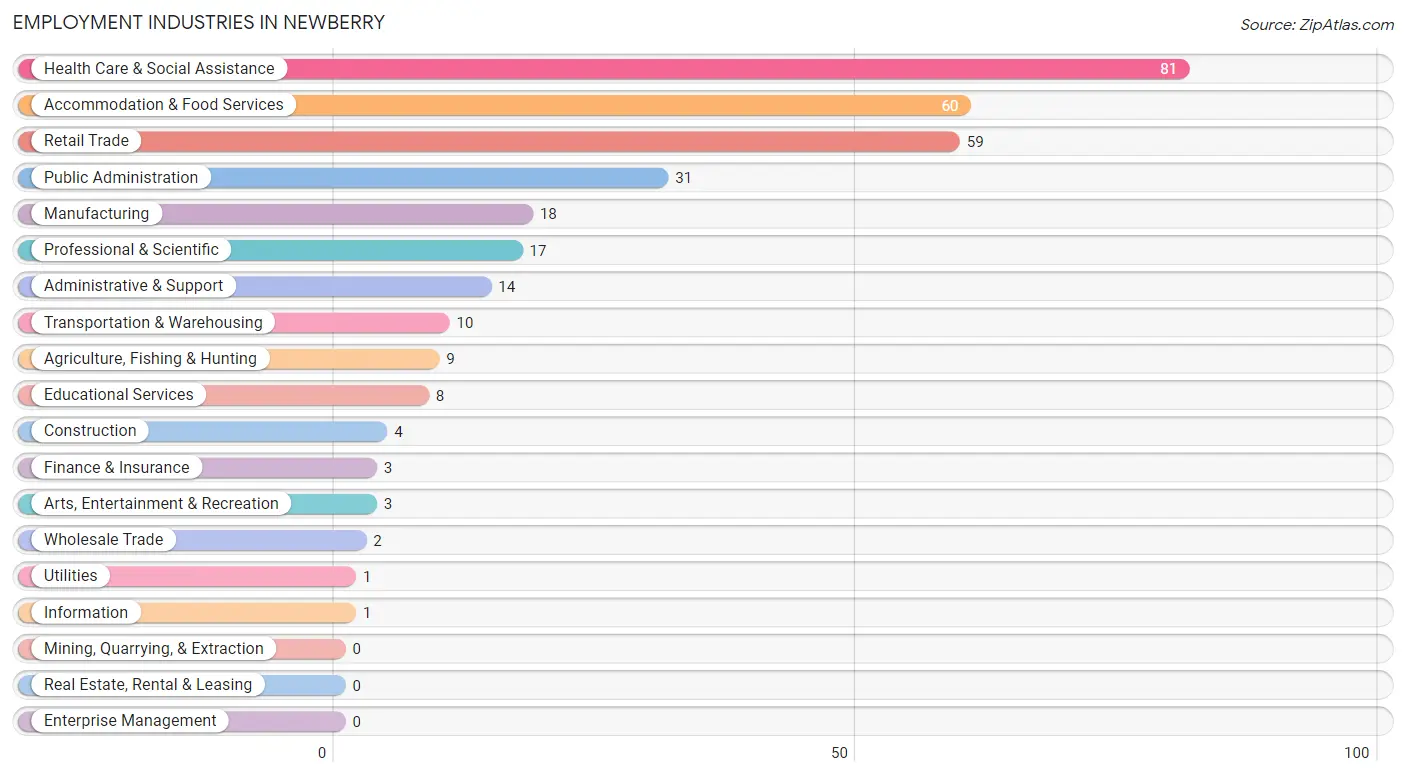
Employment Industries in Newberry
The major employment industries in Newberry include Health Care & Social Assistance (81 | 22.8%), Accommodation & Food Services (60 | 16.9%), Retail Trade (59 | 16.6%), Public Administration (31 | 8.7%), and Manufacturing (18 | 5.1%).
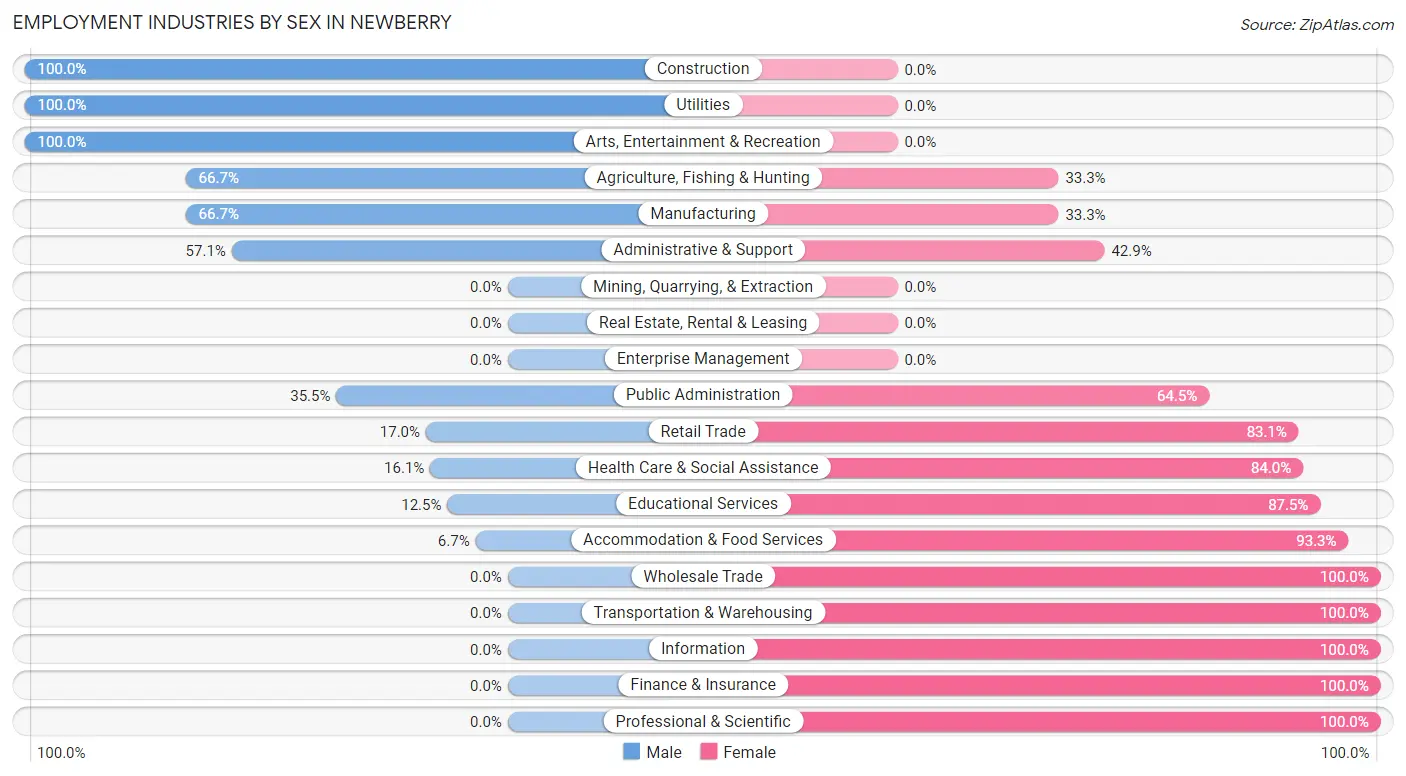
Employment Industries by Sex in Newberry
The Newberry industries that see more men than women are Construction (100.0%), Utilities (100.0%), and Arts, Entertainment & Recreation (100.0%), whereas the industries that tend to have a higher number of women are Wholesale Trade (100.0%), Transportation & Warehousing (100.0%), and Information (100.0%).
| Industry | Male | Female |
| Agriculture, Fishing & Hunting | 6 (66.7%) | 3 (33.3%) |
| Mining, Quarrying, & Extraction | 0 (0.0%) | 0 (0.0%) |
| Construction | 4 (100.0%) | 0 (0.0%) |
| Manufacturing | 12 (66.7%) | 6 (33.3%) |
| Wholesale Trade | 0 (0.0%) | 2 (100.0%) |
| Retail Trade | 10 (17.0%) | 49 (83.1%) |
| Transportation & Warehousing | 0 (0.0%) | 10 (100.0%) |
| Utilities | 1 (100.0%) | 0 (0.0%) |
| Information | 0 (0.0%) | 1 (100.0%) |
| Finance & Insurance | 0 (0.0%) | 3 (100.0%) |
| Real Estate, Rental & Leasing | 0 (0.0%) | 0 (0.0%) |
| Professional & Scientific | 0 (0.0%) | 17 (100.0%) |
| Enterprise Management | 0 (0.0%) | 0 (0.0%) |
| Administrative & Support | 8 (57.1%) | 6 (42.9%) |
| Educational Services | 1 (12.5%) | 7 (87.5%) |
| Health Care & Social Assistance | 13 (16.1%) | 68 (84.0%) |
| Arts, Entertainment & Recreation | 3 (100.0%) | 0 (0.0%) |
| Accommodation & Food Services | 4 (6.7%) | 56 (93.3%) |
| Public Administration | 11 (35.5%) | 20 (64.5%) |
| Total | 77 (21.6%) | 279 (78.4%) |
Education in Newberry
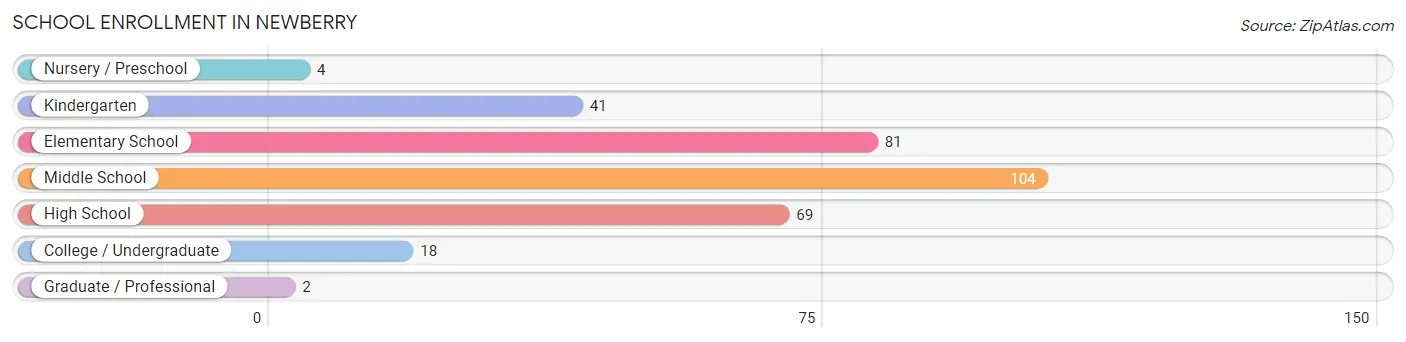
School Enrollment in Newberry
The most common levels of schooling among the 319 students in Newberry are middle school (104 | 32.6%), elementary school (81 | 25.4%), and high school (69 | 21.6%).
| School Level | # Students | % Students |
| Nursery / Preschool | 4 | 1.3% |
| Kindergarten | 41 | 12.9% |
| Elementary School | 81 | 25.4% |
| Middle School | 104 | 32.6% |
| High School | 69 | 21.6% |
| College / Undergraduate | 18 | 5.6% |
| Graduate / Professional | 2 | 0.6% |
| Total | 319 | 100.0% |
School Enrollment by Age by Funding Source in Newberry
Out of a total of 319 students who are enrolled in schools in Newberry, 35 (11.0%) attend a private institution, while the remaining 284 (89.0%) are enrolled in public schools. The age group of 20 to 24 year olds has the highest likelihood of being enrolled in private schools, with 10 (100.0% in the age bracket) enrolled. Conversely, the age group of 3 to 4 year olds has the lowest likelihood of being enrolled in a private school, with 4 (100.0% in the age bracket) attending a public institution.
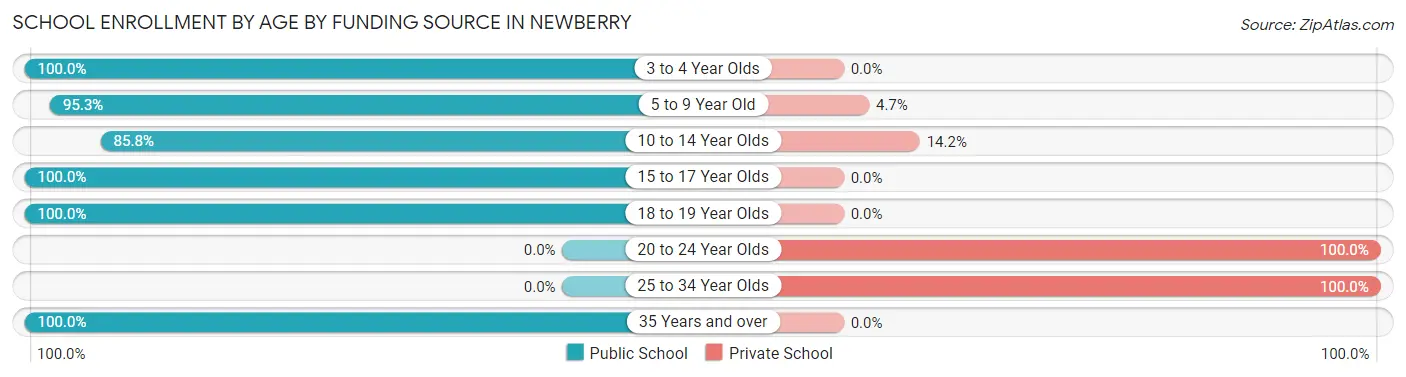
| Age Bracket | Public School | Private School |
| 3 to 4 Year Olds | 4 (100.0%) | 0 (0.0%) |
| 5 to 9 Year Old | 101 (95.3%) | 5 (4.7%) |
| 10 to 14 Year Olds | 109 (85.8%) | 18 (14.2%) |
| 15 to 17 Year Olds | 56 (100.0%) | 0 (0.0%) |
| 18 to 19 Year Olds | 9 (100.0%) | 0 (0.0%) |
| 20 to 24 Year Olds | 0 (0.0%) | 10 (100.0%) |
| 25 to 34 Year Olds | 0 (0.0%) | 2 (100.0%) |
| 35 Years and over | 5 (100.0%) | 0 (0.0%) |
| Total | 284 (89.0%) | 35 (11.0%) |
Educational Attainment by Field of Study in Newberry
Social sciences (41 | 28.3%), bio, nature & agricultural (21 | 14.5%), education (21 | 14.5%), business (20 | 13.8%), and arts & humanities (11 | 7.6%) are the most common fields of study among 145 individuals in Newberry who have obtained a bachelor's degree or higher.
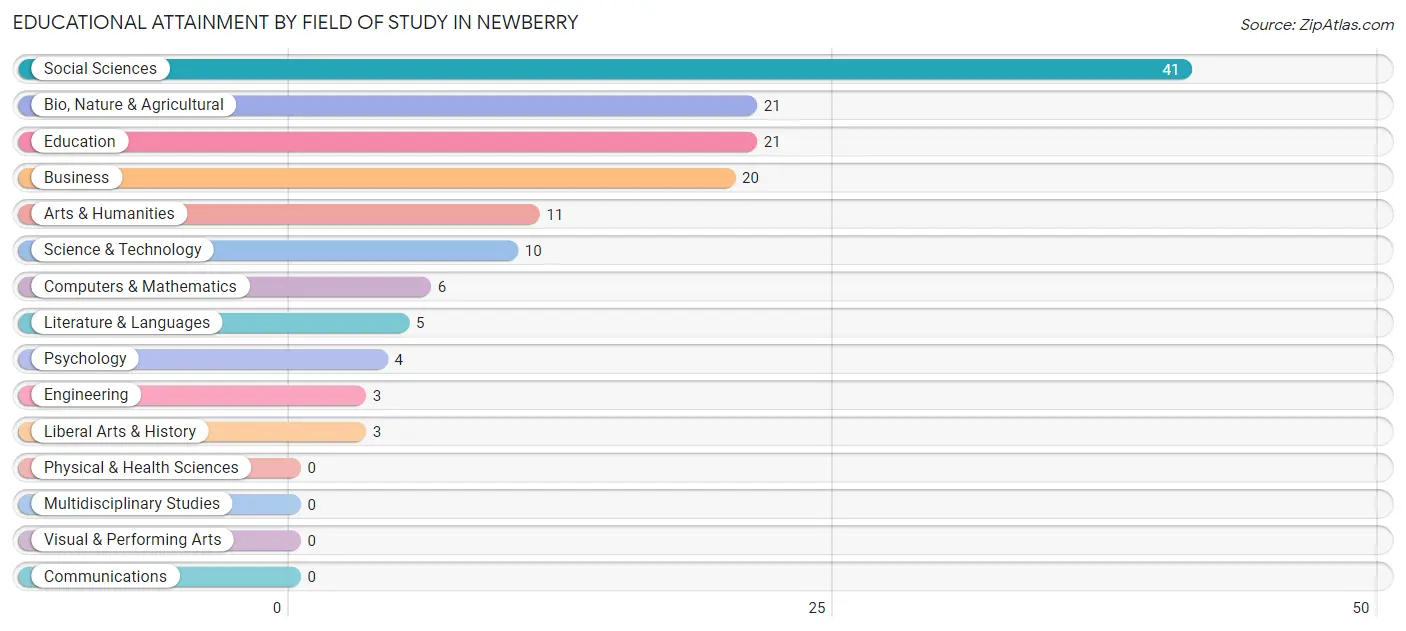
| Field of Study | # Graduates | % Graduates |
| Computers & Mathematics | 6 | 4.1% |
| Bio, Nature & Agricultural | 21 | 14.5% |
| Physical & Health Sciences | 0 | 0.0% |
| Psychology | 4 | 2.8% |
| Social Sciences | 41 | 28.3% |
| Engineering | 3 | 2.1% |
| Multidisciplinary Studies | 0 | 0.0% |
| Science & Technology | 10 | 6.9% |
| Business | 20 | 13.8% |
| Education | 21 | 14.5% |
| Literature & Languages | 5 | 3.5% |
| Liberal Arts & History | 3 | 2.1% |
| Visual & Performing Arts | 0 | 0.0% |
| Communications | 0 | 0.0% |
| Arts & Humanities | 11 | 7.6% |
| Total | 145 | 100.0% |
Transportation & Commute in Newberry
Vehicle Availability by Sex in Newberry
The most prevalent vehicle ownership categories in Newberry are males with 2 vehicles (40, accounting for 53.3%) and females with 2 vehicles (121, making up 16.1%).
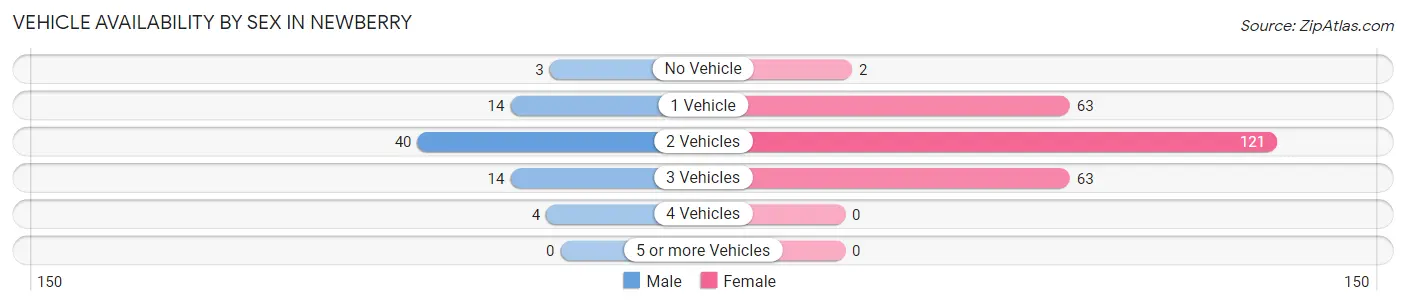
| Vehicles Available | Male | Female |
| No Vehicle | 3 (4.0%) | 2 (0.8%) |
| 1 Vehicle | 14 (18.7%) | 63 (25.3%) |
| 2 Vehicles | 40 (53.3%) | 121 (48.6%) |
| 3 Vehicles | 14 (18.7%) | 63 (25.3%) |
| 4 Vehicles | 4 (5.3%) | 0 (0.0%) |
| 5 or more Vehicles | 0 (0.0%) | 0 (0.0%) |
| Total | 75 (100.0%) | 249 (100.0%) |
Commute Time in Newberry
The most frequently occuring commute durations in Newberry are 5 to 9 minutes (96 commuters, 30.8%), less than 5 minutes (77 commuters, 24.7%), and 10 to 14 minutes (38 commuters, 12.2%).
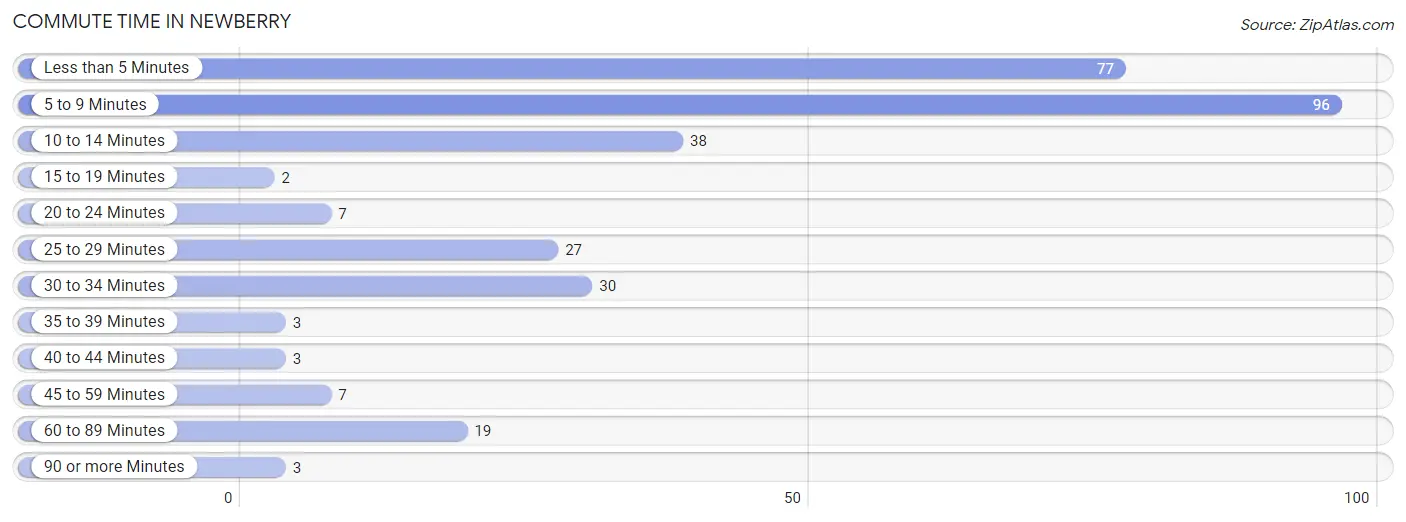
| Commute Time | # Commuters | % Commuters |
| Less than 5 Minutes | 77 | 24.7% |
| 5 to 9 Minutes | 96 | 30.8% |
| 10 to 14 Minutes | 38 | 12.2% |
| 15 to 19 Minutes | 2 | 0.6% |
| 20 to 24 Minutes | 7 | 2.2% |
| 25 to 29 Minutes | 27 | 8.6% |
| 30 to 34 Minutes | 30 | 9.6% |
| 35 to 39 Minutes | 3 | 1.0% |
| 40 to 44 Minutes | 3 | 1.0% |
| 45 to 59 Minutes | 7 | 2.2% |
| 60 to 89 Minutes | 19 | 6.1% |
| 90 or more Minutes | 3 | 1.0% |
Commute Time by Sex in Newberry
The most common commute times in Newberry are 5 to 9 minutes (32 commuters, 44.4%) for males and less than 5 minutes (70 commuters, 29.2%) for females.
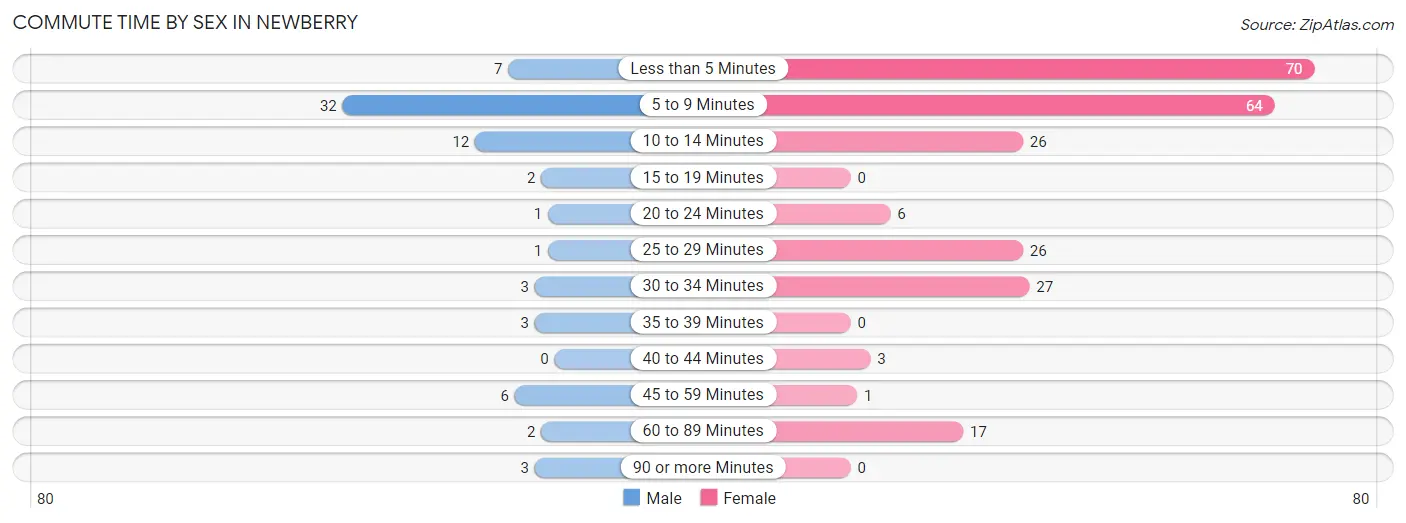
| Commute Time | Male | Female |
| Less than 5 Minutes | 7 (9.7%) | 70 (29.2%) |
| 5 to 9 Minutes | 32 (44.4%) | 64 (26.7%) |
| 10 to 14 Minutes | 12 (16.7%) | 26 (10.8%) |
| 15 to 19 Minutes | 2 (2.8%) | 0 (0.0%) |
| 20 to 24 Minutes | 1 (1.4%) | 6 (2.5%) |
| 25 to 29 Minutes | 1 (1.4%) | 26 (10.8%) |
| 30 to 34 Minutes | 3 (4.2%) | 27 (11.3%) |
| 35 to 39 Minutes | 3 (4.2%) | 0 (0.0%) |
| 40 to 44 Minutes | 0 (0.0%) | 3 (1.3%) |
| 45 to 59 Minutes | 6 (8.3%) | 1 (0.4%) |
| 60 to 89 Minutes | 2 (2.8%) | 17 (7.1%) |
| 90 or more Minutes | 3 (4.2%) | 0 (0.0%) |
Time of Departure to Work by Sex in Newberry
The most frequent times of departure to work in Newberry are 7:30 AM to 7:59 AM (24, 33.3%) for males and 7:00 AM to 7:29 AM (48, 20.0%) for females.
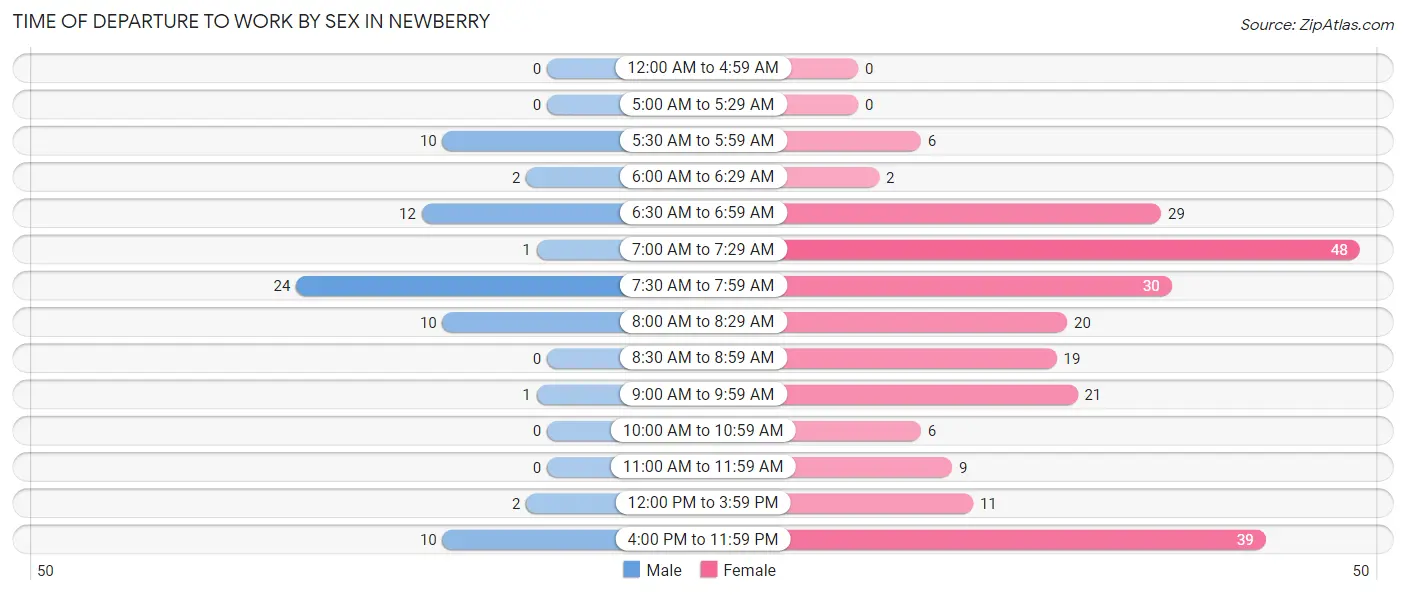
| Time of Departure | Male | Female |
| 12:00 AM to 4:59 AM | 0 (0.0%) | 0 (0.0%) |
| 5:00 AM to 5:29 AM | 0 (0.0%) | 0 (0.0%) |
| 5:30 AM to 5:59 AM | 10 (13.9%) | 6 (2.5%) |
| 6:00 AM to 6:29 AM | 2 (2.8%) | 2 (0.8%) |
| 6:30 AM to 6:59 AM | 12 (16.7%) | 29 (12.1%) |
| 7:00 AM to 7:29 AM | 1 (1.4%) | 48 (20.0%) |
| 7:30 AM to 7:59 AM | 24 (33.3%) | 30 (12.5%) |
| 8:00 AM to 8:29 AM | 10 (13.9%) | 20 (8.3%) |
| 8:30 AM to 8:59 AM | 0 (0.0%) | 19 (7.9%) |
| 9:00 AM to 9:59 AM | 1 (1.4%) | 21 (8.7%) |
| 10:00 AM to 10:59 AM | 0 (0.0%) | 6 (2.5%) |
| 11:00 AM to 11:59 AM | 0 (0.0%) | 9 (3.7%) |
| 12:00 PM to 3:59 PM | 2 (2.8%) | 11 (4.6%) |
| 4:00 PM to 11:59 PM | 10 (13.9%) | 39 (16.3%) |
| Total | 72 (100.0%) | 240 (100.0%) |
Housing Occupancy in Newberry
Occupancy by Ownership in Newberry
Of the total 487 dwellings in Newberry, owner-occupied units account for 309 (63.4%), while renter-occupied units make up 178 (36.5%).
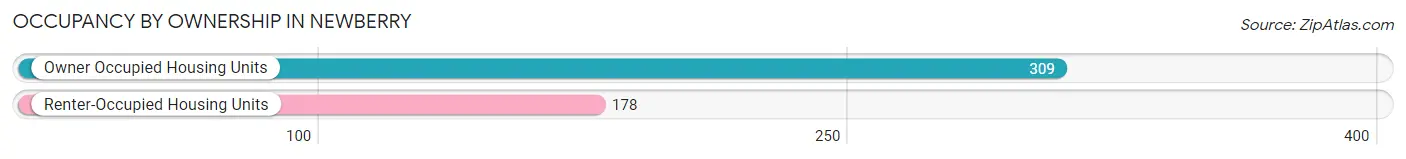
| Occupancy | # Housing Units | % Housing Units |
| Owner Occupied Housing Units | 309 | 63.4% |
| Renter-Occupied Housing Units | 178 | 36.5% |
| Total Occupied Housing Units | 487 | 100.0% |
Occupancy by Household Size in Newberry
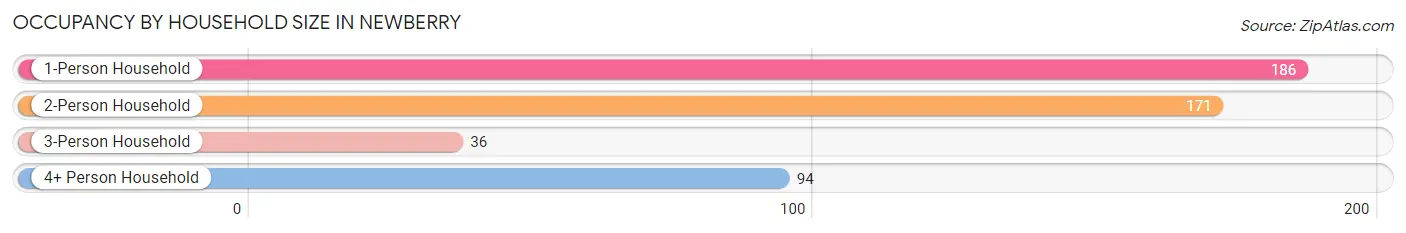
| Household Size | # Housing Units | % Housing Units |
| 1-Person Household | 186 | 38.2% |
| 2-Person Household | 171 | 35.1% |
| 3-Person Household | 36 | 7.4% |
| 4+ Person Household | 94 | 19.3% |
| Total Housing Units | 487 | 100.0% |
Occupancy by Ownership by Household Size in Newberry
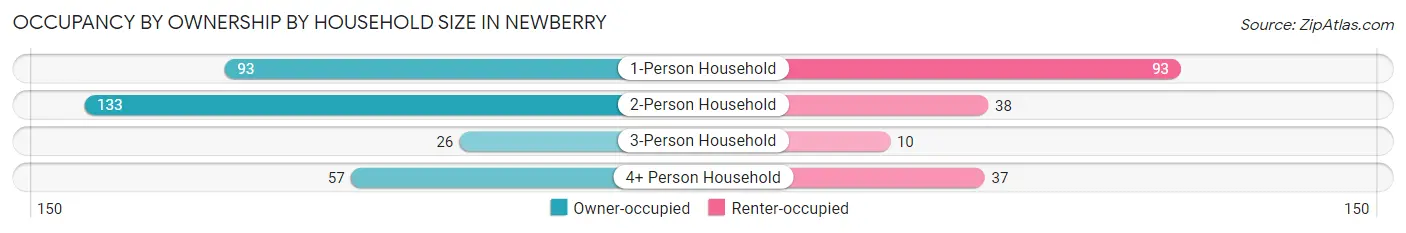
| Household Size | Owner-occupied | Renter-occupied |
| 1-Person Household | 93 (50.0%) | 93 (50.0%) |
| 2-Person Household | 133 (77.8%) | 38 (22.2%) |
| 3-Person Household | 26 (72.2%) | 10 (27.8%) |
| 4+ Person Household | 57 (60.6%) | 37 (39.4%) |
| Total Housing Units | 309 (63.4%) | 178 (36.5%) |
Occupancy by Educational Attainment in Newberry
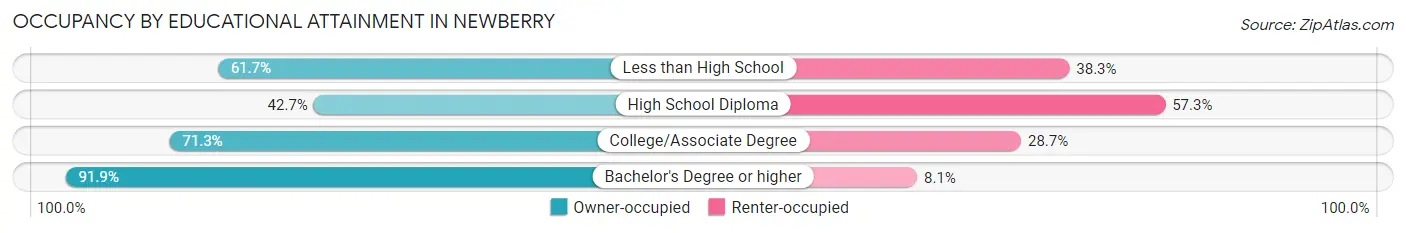
| Household Size | Owner-occupied | Renter-occupied |
| Less than High School | 29 (61.7%) | 18 (38.3%) |
| High School Diploma | 73 (42.7%) | 98 (57.3%) |
| College/Associate Degree | 139 (71.3%) | 56 (28.7%) |
| Bachelor's Degree or higher | 68 (91.9%) | 6 (8.1%) |
Occupancy by Age of Householder in Newberry
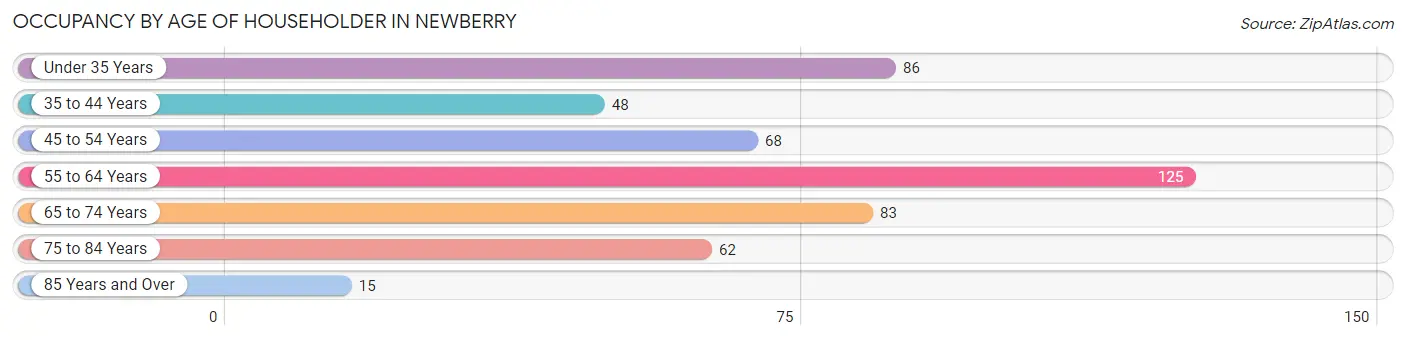
| Age Bracket | # Households | % Households |
| Under 35 Years | 86 | 17.7% |
| 35 to 44 Years | 48 | 9.9% |
| 45 to 54 Years | 68 | 14.0% |
| 55 to 64 Years | 125 | 25.7% |
| 65 to 74 Years | 83 | 17.0% |
| 75 to 84 Years | 62 | 12.7% |
| 85 Years and Over | 15 | 3.1% |
| Total | 487 | 100.0% |
Housing Finances in Newberry
Median Income by Occupancy in Newberry
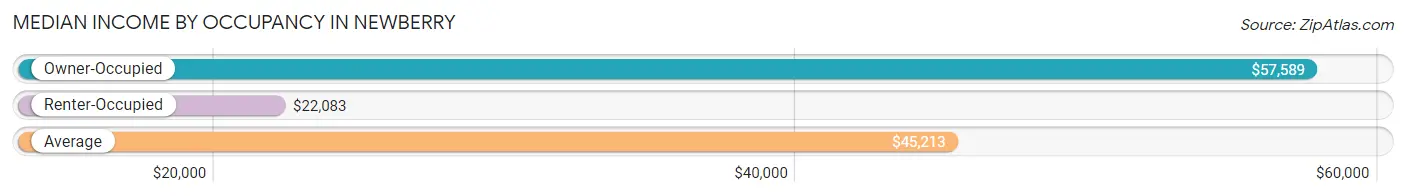
| Occupancy Type | # Households | Median Income |
| Owner-Occupied | 309 (63.4%) | $57,589 |
| Renter-Occupied | 178 (36.5%) | $22,083 |
| Average | 487 (100.0%) | $45,213 |
Occupancy by Householder Income Bracket in Newberry
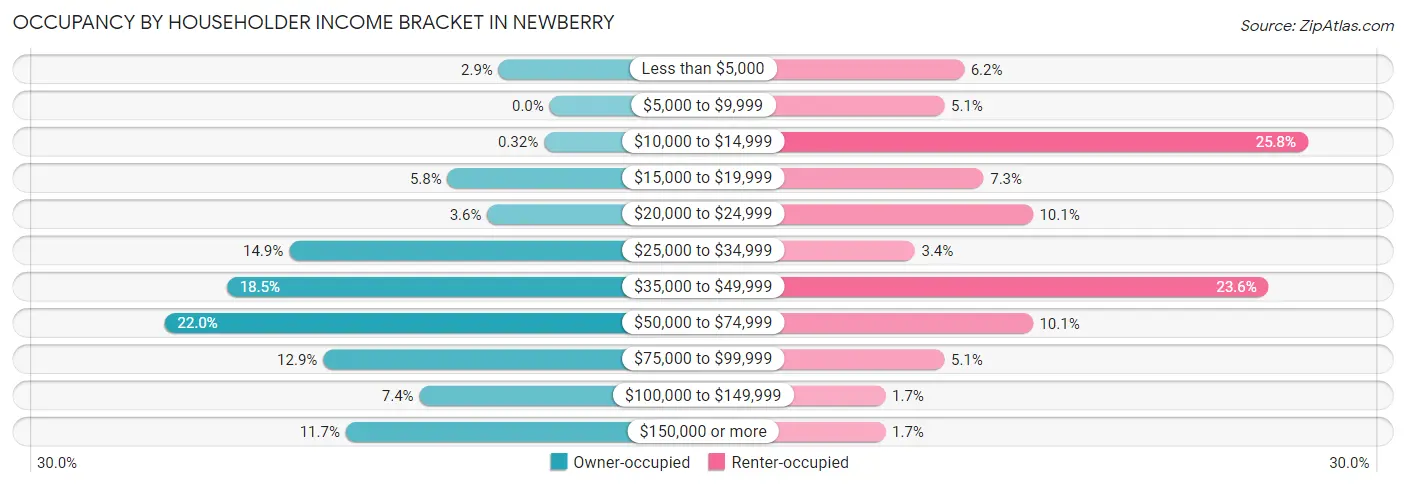
| Income Bracket | Owner-occupied | Renter-occupied |
| Less than $5,000 | 9 (2.9%) | 11 (6.2%) |
| $5,000 to $9,999 | 0 (0.0%) | 9 (5.1%) |
| $10,000 to $14,999 | 1 (0.3%) | 46 (25.8%) |
| $15,000 to $19,999 | 18 (5.8%) | 13 (7.3%) |
| $20,000 to $24,999 | 11 (3.6%) | 18 (10.1%) |
| $25,000 to $34,999 | 46 (14.9%) | 6 (3.4%) |
| $35,000 to $49,999 | 57 (18.4%) | 42 (23.6%) |
| $50,000 to $74,999 | 68 (22.0%) | 18 (10.1%) |
| $75,000 to $99,999 | 40 (12.9%) | 9 (5.1%) |
| $100,000 to $149,999 | 23 (7.4%) | 3 (1.7%) |
| $150,000 or more | 36 (11.7%) | 3 (1.7%) |
| Total | 309 (100.0%) | 178 (100.0%) |
Monthly Housing Cost Tiers in Newberry
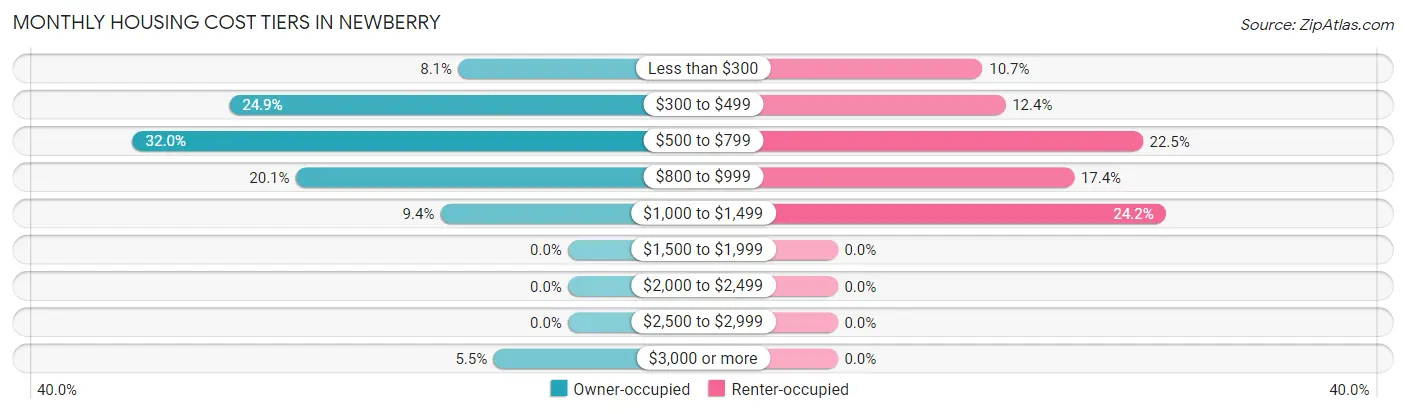
| Monthly Cost | Owner-occupied | Renter-occupied |
| Less than $300 | 25 (8.1%) | 19 (10.7%) |
| $300 to $499 | 77 (24.9%) | 22 (12.4%) |
| $500 to $799 | 99 (32.0%) | 40 (22.5%) |
| $800 to $999 | 62 (20.1%) | 31 (17.4%) |
| $1,000 to $1,499 | 29 (9.4%) | 43 (24.2%) |
| $1,500 to $1,999 | 0 (0.0%) | 0 (0.0%) |
| $2,000 to $2,499 | 0 (0.0%) | 0 (0.0%) |
| $2,500 to $2,999 | 0 (0.0%) | 0 (0.0%) |
| $3,000 or more | 17 (5.5%) | 0 (0.0%) |
| Total | 309 (100.0%) | 178 (100.0%) |
Physical Housing Characteristics in Newberry
Housing Structures in Newberry
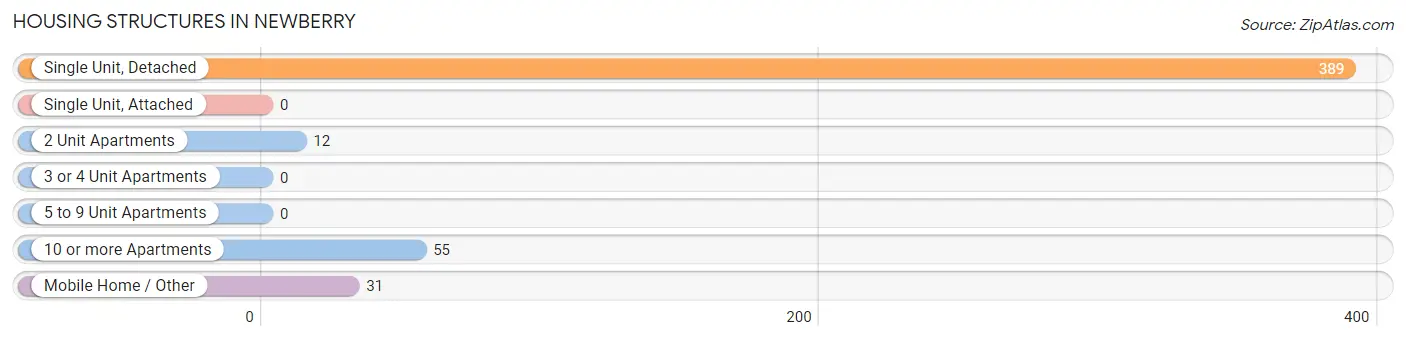
| Structure Type | # Housing Units | % Housing Units |
| Single Unit, Detached | 389 | 79.9% |
| Single Unit, Attached | 0 | 0.0% |
| 2 Unit Apartments | 12 | 2.5% |
| 3 or 4 Unit Apartments | 0 | 0.0% |
| 5 to 9 Unit Apartments | 0 | 0.0% |
| 10 or more Apartments | 55 | 11.3% |
| Mobile Home / Other | 31 | 6.4% |
| Total | 487 | 100.0% |
Housing Structures by Occupancy in Newberry
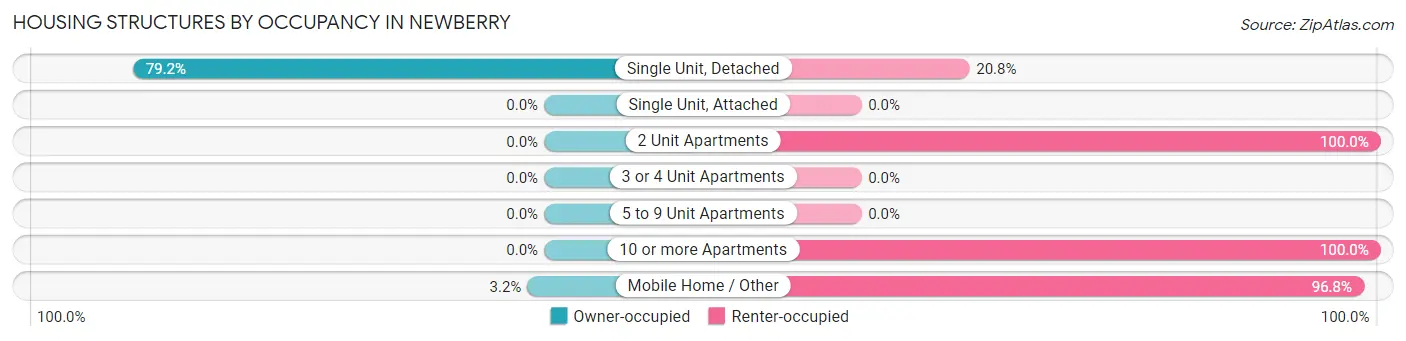
| Structure Type | Owner-occupied | Renter-occupied |
| Single Unit, Detached | 308 (79.2%) | 81 (20.8%) |
| Single Unit, Attached | 0 (0.0%) | 0 (0.0%) |
| 2 Unit Apartments | 0 (0.0%) | 12 (100.0%) |
| 3 or 4 Unit Apartments | 0 (0.0%) | 0 (0.0%) |
| 5 to 9 Unit Apartments | 0 (0.0%) | 0 (0.0%) |
| 10 or more Apartments | 0 (0.0%) | 55 (100.0%) |
| Mobile Home / Other | 1 (3.2%) | 30 (96.8%) |
| Total | 309 (63.4%) | 178 (36.5%) |
Housing Structures by Number of Rooms in Newberry
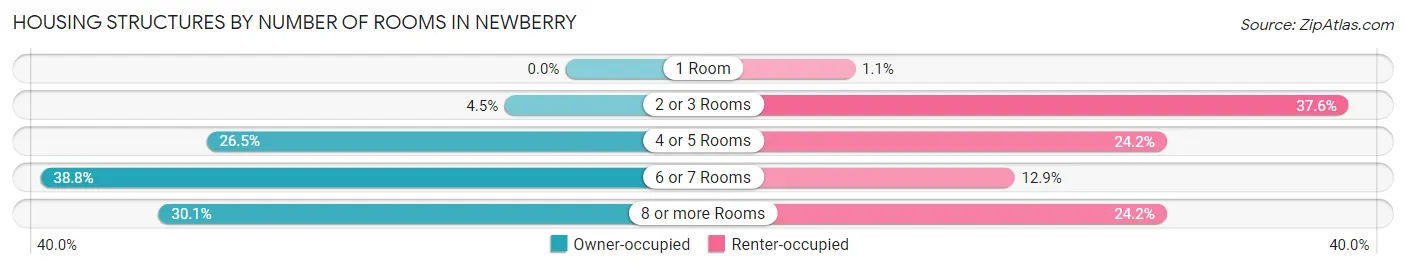
| Number of Rooms | Owner-occupied | Renter-occupied |
| 1 Room | 0 (0.0%) | 2 (1.1%) |
| 2 or 3 Rooms | 14 (4.5%) | 67 (37.6%) |
| 4 or 5 Rooms | 82 (26.5%) | 43 (24.2%) |
| 6 or 7 Rooms | 120 (38.8%) | 23 (12.9%) |
| 8 or more Rooms | 93 (30.1%) | 43 (24.2%) |
| Total | 309 (100.0%) | 178 (100.0%) |
Housing Structure by Heating Type in Newberry
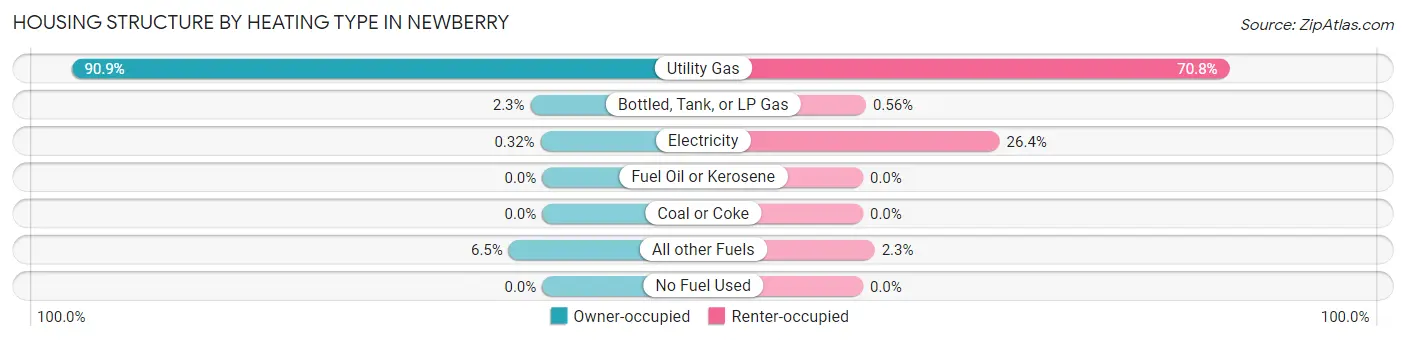
| Heating Type | Owner-occupied | Renter-occupied |
| Utility Gas | 281 (90.9%) | 126 (70.8%) |
| Bottled, Tank, or LP Gas | 7 (2.3%) | 1 (0.6%) |
| Electricity | 1 (0.3%) | 47 (26.4%) |
| Fuel Oil or Kerosene | 0 (0.0%) | 0 (0.0%) |
| Coal or Coke | 0 (0.0%) | 0 (0.0%) |
| All other Fuels | 20 (6.5%) | 4 (2.2%) |
| No Fuel Used | 0 (0.0%) | 0 (0.0%) |
| Total | 309 (100.0%) | 178 (100.0%) |
Household Vehicle Usage in Newberry
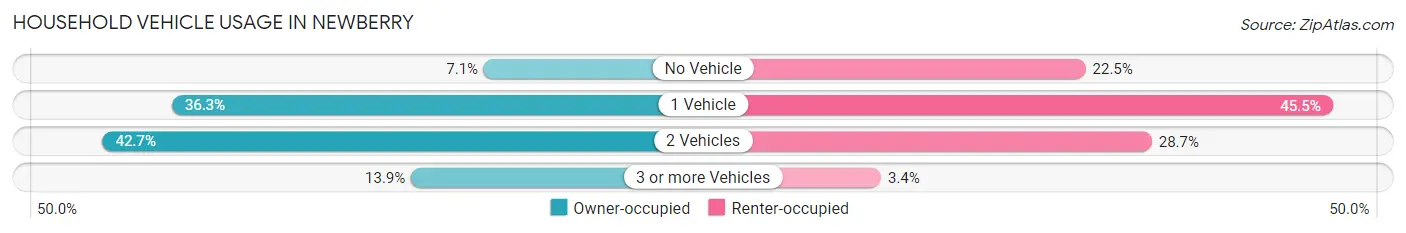
| Vehicles per Household | Owner-occupied | Renter-occupied |
| No Vehicle | 22 (7.1%) | 40 (22.5%) |
| 1 Vehicle | 112 (36.2%) | 81 (45.5%) |
| 2 Vehicles | 132 (42.7%) | 51 (28.6%) |
| 3 or more Vehicles | 43 (13.9%) | 6 (3.4%) |
| Total | 309 (100.0%) | 178 (100.0%) |
Real Estate & Mortgages in Newberry
Real Estate and Mortgage Overview in Newberry
| Characteristic | Without Mortgage | With Mortgage |
| Housing Units | 170 | 139 |
| Median Property Value | $55,200 | $57,900 |
| Median Household Income | $57,857 | $33 |
| Monthly Housing Costs | $462 | $17 |
| Real Estate Taxes | $993 | $4 |
Property Value by Mortgage Status in Newberry
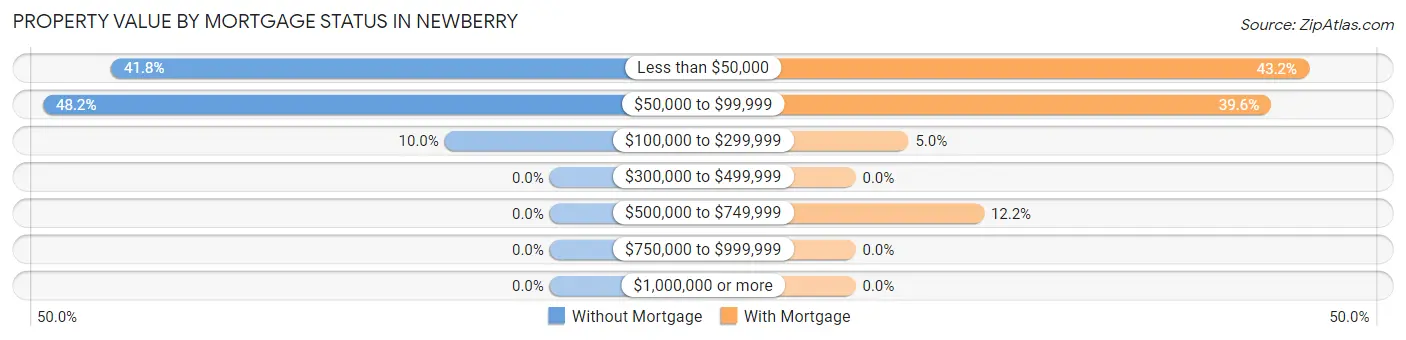
| Property Value | Without Mortgage | With Mortgage |
| Less than $50,000 | 71 (41.8%) | 60 (43.2%) |
| $50,000 to $99,999 | 82 (48.2%) | 55 (39.6%) |
| $100,000 to $299,999 | 17 (10.0%) | 7 (5.0%) |
| $300,000 to $499,999 | 0 (0.0%) | 0 (0.0%) |
| $500,000 to $749,999 | 0 (0.0%) | 17 (12.2%) |
| $750,000 to $999,999 | 0 (0.0%) | 0 (0.0%) |
| $1,000,000 or more | 0 (0.0%) | 0 (0.0%) |
| Total | 170 (100.0%) | 139 (100.0%) |
Household Income by Mortgage Status in Newberry
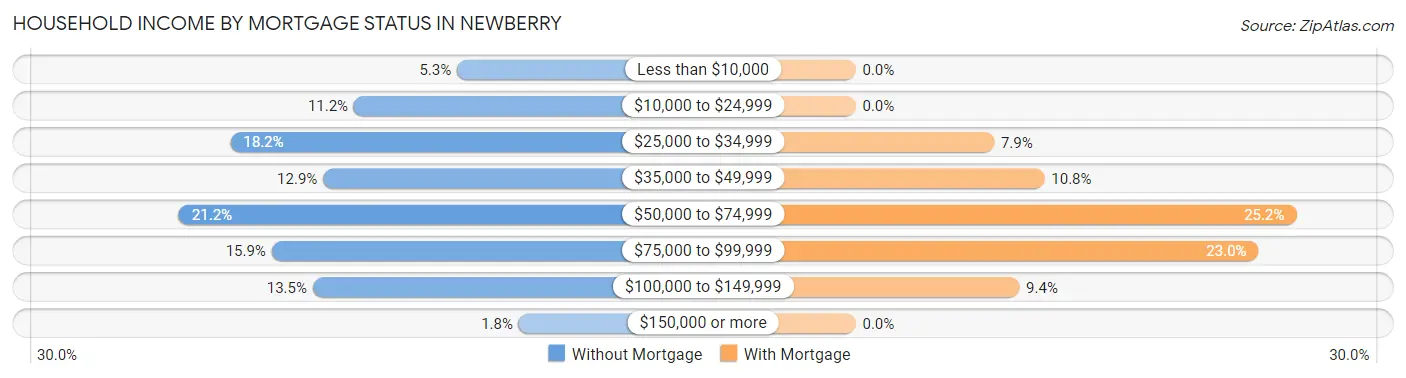
| Household Income | Without Mortgage | With Mortgage |
| Less than $10,000 | 9 (5.3%) | 0 (0.0%) |
| $10,000 to $24,999 | 19 (11.2%) | 0 (0.0%) |
| $25,000 to $34,999 | 31 (18.2%) | 11 (7.9%) |
| $35,000 to $49,999 | 22 (12.9%) | 15 (10.8%) |
| $50,000 to $74,999 | 36 (21.2%) | 35 (25.2%) |
| $75,000 to $99,999 | 27 (15.9%) | 32 (23.0%) |
| $100,000 to $149,999 | 23 (13.5%) | 13 (9.3%) |
| $150,000 or more | 3 (1.8%) | 0 (0.0%) |
| Total | 170 (100.0%) | 139 (100.0%) |
Property Value to Household Income Ratio in Newberry
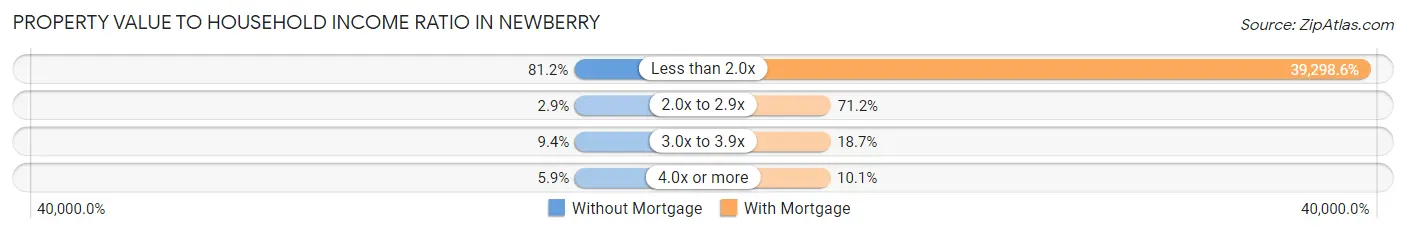
| Value-to-Income Ratio | Without Mortgage | With Mortgage |
| Less than 2.0x | 138 (81.2%) | 54,625 (39,298.6%) |
| 2.0x to 2.9x | 5 (2.9%) | 99 (71.2%) |
| 3.0x to 3.9x | 16 (9.4%) | 26 (18.7%) |
| 4.0x or more | 10 (5.9%) | 14 (10.1%) |
| Total | 170 (100.0%) | 139 (100.0%) |
Real Estate Taxes by Mortgage Status in Newberry
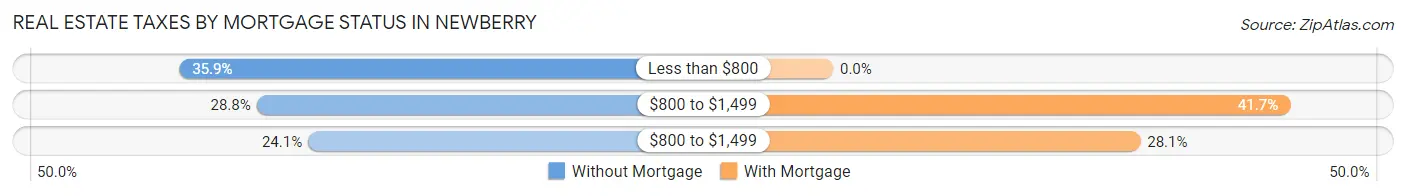
| Property Taxes | Without Mortgage | With Mortgage |
| Less than $800 | 61 (35.9%) | 0 (0.0%) |
| $800 to $1,499 | 49 (28.8%) | 58 (41.7%) |
| $800 to $1,499 | 41 (24.1%) | 39 (28.1%) |
| Total | 170 (100.0%) | 139 (100.0%) |
Health & Disability in Newberry
Health Insurance Coverage by Age in Newberry
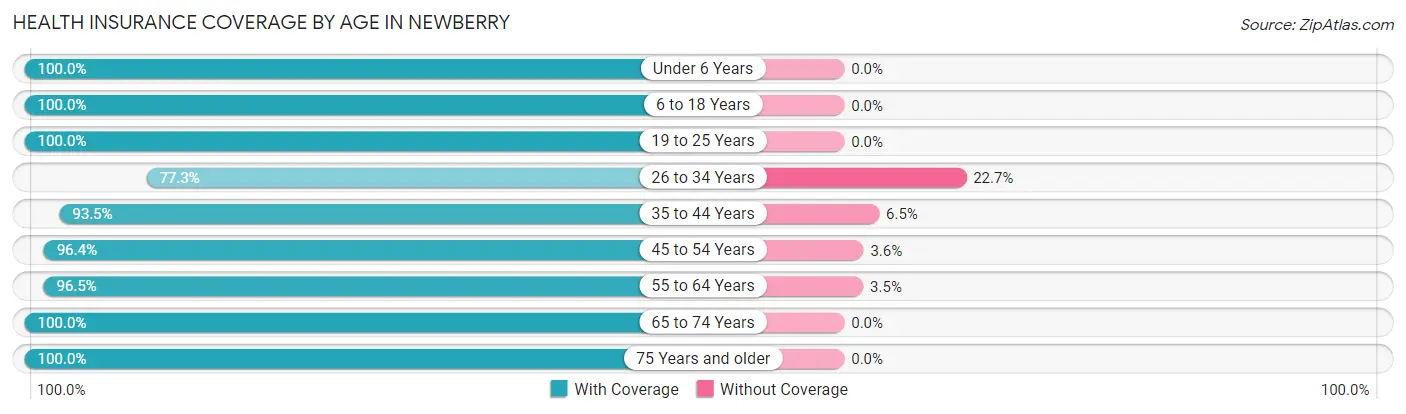
| Age Bracket | With Coverage | Without Coverage |
| Under 6 Years | 95 (100.0%) | 0 (0.0%) |
| 6 to 18 Years | 268 (100.0%) | 0 (0.0%) |
| 19 to 25 Years | 91 (100.0%) | 0 (0.0%) |
| 26 to 34 Years | 68 (77.3%) | 20 (22.7%) |
| 35 to 44 Years | 72 (93.5%) | 5 (6.5%) |
| 45 to 54 Years | 81 (96.4%) | 3 (3.6%) |
| 55 to 64 Years | 137 (96.5%) | 5 (3.5%) |
| 65 to 74 Years | 147 (100.0%) | 0 (0.0%) |
| 75 Years and older | 105 (100.0%) | 0 (0.0%) |
| Total | 1,064 (97.0%) | 33 (3.0%) |
Health Insurance Coverage by Citizenship Status in Newberry
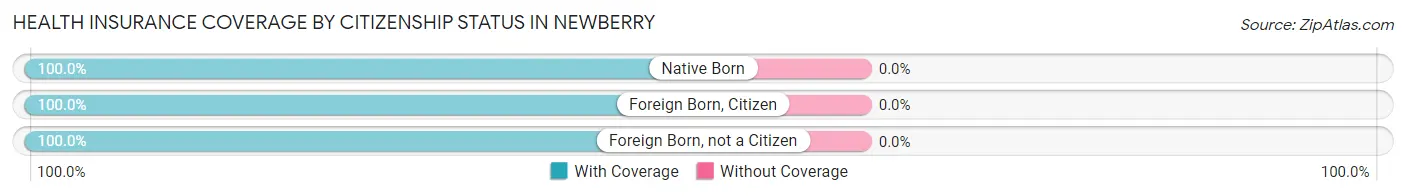
| Citizenship Status | With Coverage | Without Coverage |
| Native Born | 95 (100.0%) | 0 (0.0%) |
| Foreign Born, Citizen | 268 (100.0%) | 0 (0.0%) |
| Foreign Born, not a Citizen | 91 (100.0%) | 0 (0.0%) |
Health Insurance Coverage by Household Income in Newberry
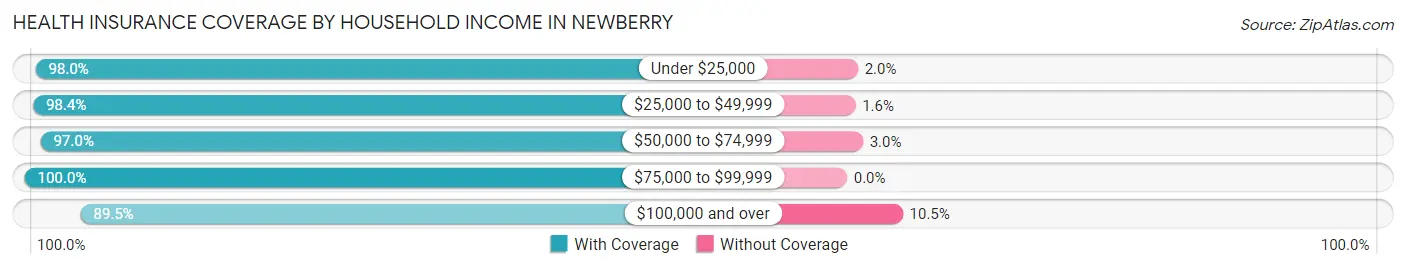
| Household Income | With Coverage | Without Coverage |
| Under $25,000 | 192 (98.0%) | 4 (2.0%) |
| $25,000 to $49,999 | 374 (98.4%) | 6 (1.6%) |
| $50,000 to $74,999 | 228 (97.0%) | 7 (3.0%) |
| $75,000 to $99,999 | 133 (100.0%) | 0 (0.0%) |
| $100,000 and over | 137 (89.5%) | 16 (10.5%) |
Public vs Private Health Insurance Coverage by Age in Newberry
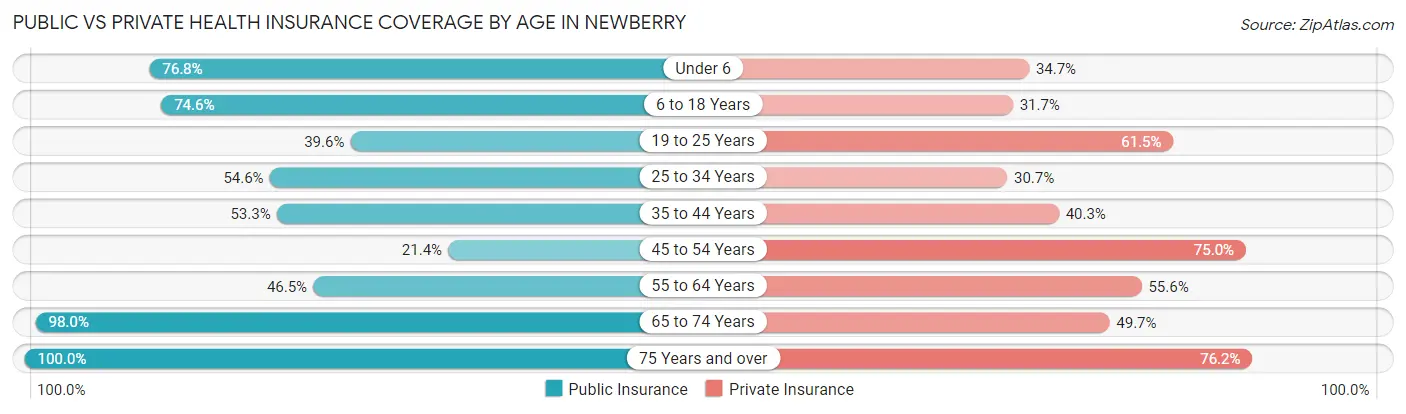
| Age Bracket | Public Insurance | Private Insurance |
| Under 6 | 73 (76.8%) | 33 (34.7%) |
| 6 to 18 Years | 200 (74.6%) | 85 (31.7%) |
| 19 to 25 Years | 36 (39.6%) | 56 (61.5%) |
| 25 to 34 Years | 48 (54.5%) | 27 (30.7%) |
| 35 to 44 Years | 41 (53.2%) | 31 (40.3%) |
| 45 to 54 Years | 18 (21.4%) | 63 (75.0%) |
| 55 to 64 Years | 66 (46.5%) | 79 (55.6%) |
| 65 to 74 Years | 144 (98.0%) | 73 (49.7%) |
| 75 Years and over | 105 (100.0%) | 80 (76.2%) |
| Total | 731 (66.6%) | 527 (48.0%) |
Disability Status by Sex by Age in Newberry
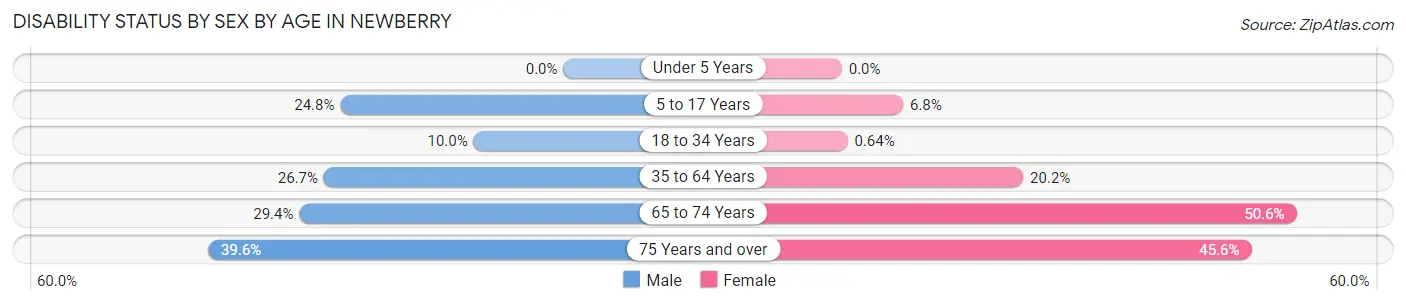
| Age Bracket | Male | Female |
| Under 5 Years | 0 (0.0%) | 0 (0.0%) |
| 5 to 17 Years | 39 (24.8%) | 9 (6.8%) |
| 18 to 34 Years | 3 (10.0%) | 1 (0.6%) |
| 35 to 64 Years | 28 (26.7%) | 40 (20.2%) |
| 65 to 74 Years | 20 (29.4%) | 40 (50.6%) |
| 75 Years and over | 19 (39.6%) | 26 (45.6%) |
Disability Class by Sex by Age in Newberry
Disability Class: Hearing Difficulty
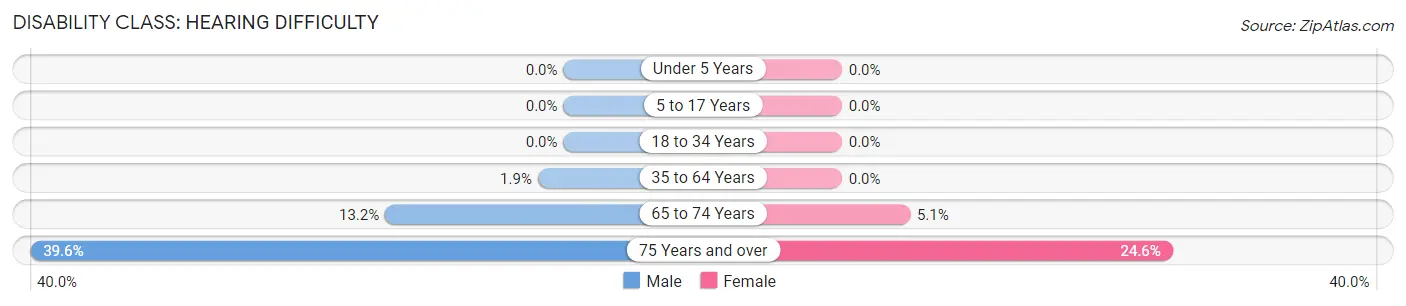
| Age Bracket | Male | Female |
| Under 5 Years | 0 (0.0%) | 0 (0.0%) |
| 5 to 17 Years | 0 (0.0%) | 0 (0.0%) |
| 18 to 34 Years | 0 (0.0%) | 0 (0.0%) |
| 35 to 64 Years | 2 (1.9%) | 0 (0.0%) |
| 65 to 74 Years | 9 (13.2%) | 4 (5.1%) |
| 75 Years and over | 19 (39.6%) | 14 (24.6%) |
Disability Class: Vision Difficulty
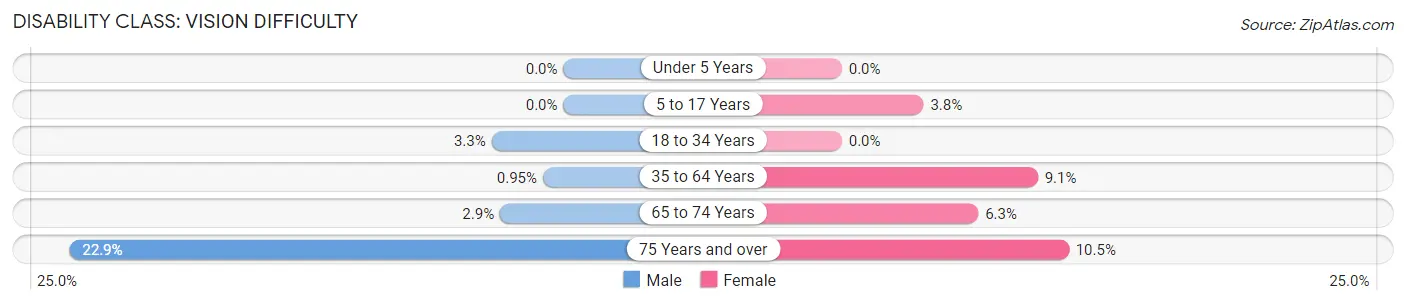
| Age Bracket | Male | Female |
| Under 5 Years | 0 (0.0%) | 0 (0.0%) |
| 5 to 17 Years | 0 (0.0%) | 5 (3.8%) |
| 18 to 34 Years | 1 (3.3%) | 0 (0.0%) |
| 35 to 64 Years | 1 (0.9%) | 18 (9.1%) |
| 65 to 74 Years | 2 (2.9%) | 5 (6.3%) |
| 75 Years and over | 11 (22.9%) | 6 (10.5%) |
Disability Class: Cognitive Difficulty
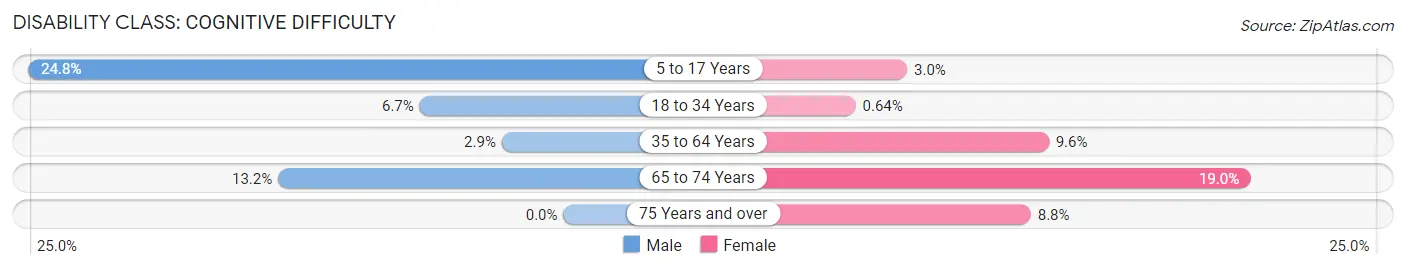
| Age Bracket | Male | Female |
| 5 to 17 Years | 39 (24.8%) | 4 (3.0%) |
| 18 to 34 Years | 2 (6.7%) | 1 (0.6%) |
| 35 to 64 Years | 3 (2.9%) | 19 (9.6%) |
| 65 to 74 Years | 9 (13.2%) | 15 (19.0%) |
| 75 Years and over | 0 (0.0%) | 5 (8.8%) |
Disability Class: Ambulatory Difficulty
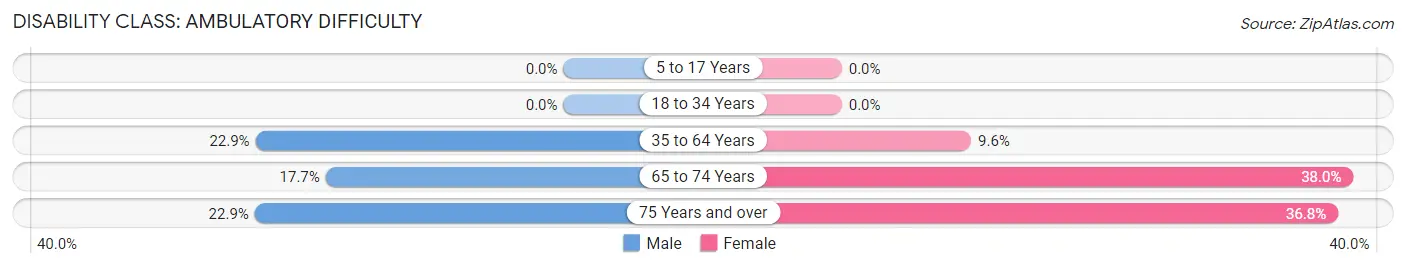
| Age Bracket | Male | Female |
| 5 to 17 Years | 0 (0.0%) | 0 (0.0%) |
| 18 to 34 Years | 0 (0.0%) | 0 (0.0%) |
| 35 to 64 Years | 24 (22.9%) | 19 (9.6%) |
| 65 to 74 Years | 12 (17.6%) | 30 (38.0%) |
| 75 Years and over | 11 (22.9%) | 21 (36.8%) |
Disability Class: Self-Care Difficulty
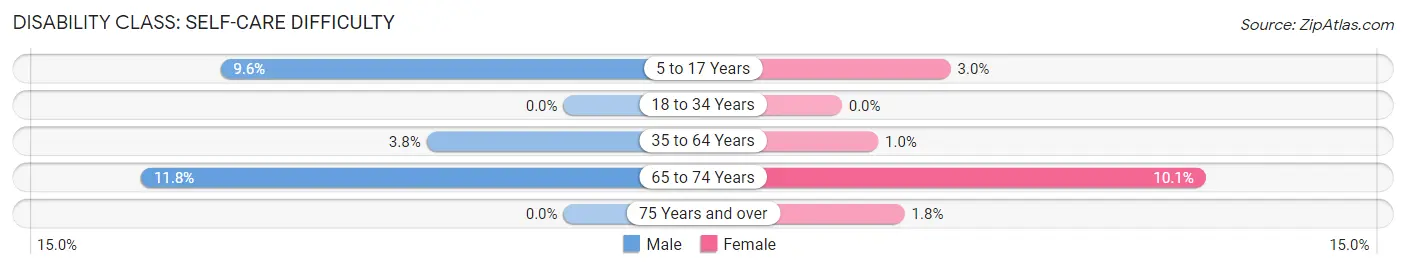
| Age Bracket | Male | Female |
| 5 to 17 Years | 15 (9.6%) | 4 (3.0%) |
| 18 to 34 Years | 0 (0.0%) | 0 (0.0%) |
| 35 to 64 Years | 4 (3.8%) | 2 (1.0%) |
| 65 to 74 Years | 8 (11.8%) | 8 (10.1%) |
| 75 Years and over | 0 (0.0%) | 1 (1.8%) |
Technology Access in Newberry
Computing Device Access in Newberry
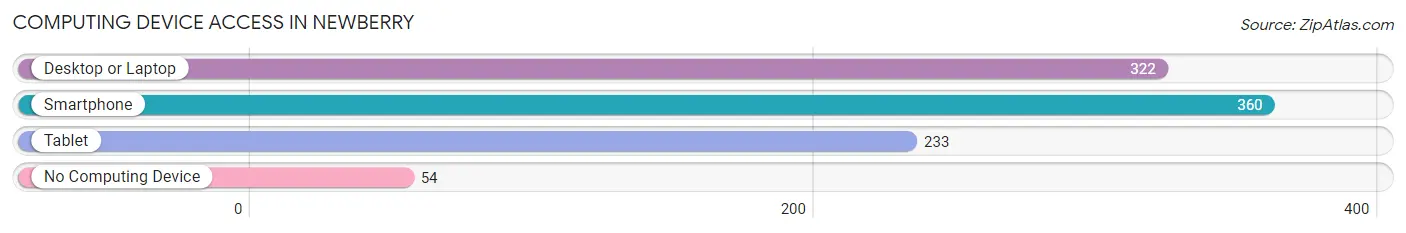
| Device Type | # Households | % Households |
| Desktop or Laptop | 322 | 66.1% |
| Smartphone | 360 | 73.9% |
| Tablet | 233 | 47.8% |
| No Computing Device | 54 | 11.1% |
| Total | 487 | 100.0% |
Internet Access in Newberry
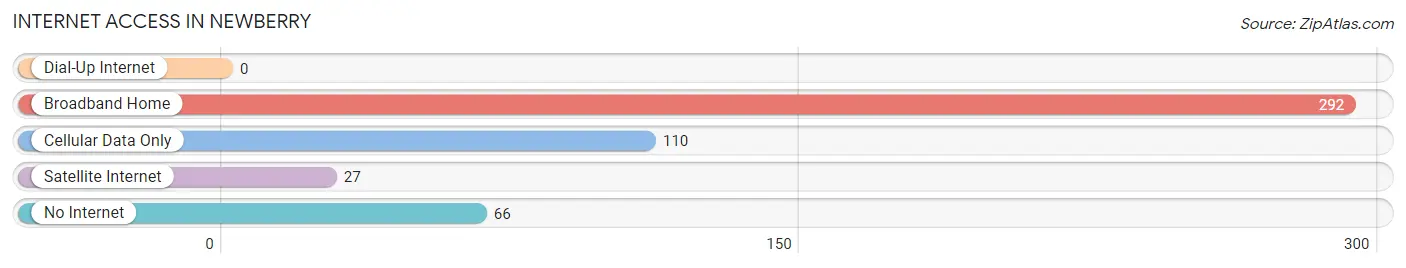
| Internet Type | # Households | % Households |
| Dial-Up Internet | 0 | 0.0% |
| Broadband Home | 292 | 60.0% |
| Cellular Data Only | 110 | 22.6% |
| Satellite Internet | 27 | 5.5% |
| No Internet | 66 | 13.6% |
| Total | 487 | 100.0% |
Newberry Summary
Newberry, Michigan is a small town located in the Upper Peninsula of Michigan. It is situated in Luce County, and is the county seat. The town is located on the banks of the Tahquamenon River, and is surrounded by forests and lakes. The population of Newberry in 2000 was 1,845.
History
The area that is now Newberry was first settled in 1877 by a group of lumberjacks. The town was originally called "Upper Tahquamenon," and was later changed to Newberry in 1883. The name was chosen in honor of a local lumberman, John Newberry. The town was incorporated in 1887.
In the late 19th century, Newberry was a bustling lumber town. The town was home to several sawmills, and the lumber industry was the main source of employment. The town also had a thriving commercial district, with several stores, hotels, and saloons.
In the early 20th century, the lumber industry began to decline, and the town's economy shifted to tourism. The town was a popular destination for hunters and fishermen, and the area was known for its excellent hunting and fishing. The town also became a popular destination for vacationers, and several resorts were built in the area.
Geography
Newberry is located in the Upper Peninsula of Michigan, in Luce County. The town is situated on the banks of the Tahquamenon River, and is surrounded by forests and lakes. The town is located about 30 miles east of the Mackinac Bridge, and is about a two-hour drive from the state capital of Lansing.
The town is located in a region known as the "Upper Peninsula," which is known for its rugged terrain and abundant natural resources. The area is home to several state parks, including Tahquamenon Falls State Park, which is located just outside of town.
Economy
The economy of Newberry is largely based on tourism. The town is a popular destination for hunters and fishermen, and the area is known for its excellent hunting and fishing. The town is also a popular destination for vacationers, and several resorts are located in the area.
The town is also home to several small businesses, including restaurants, retail stores, and service providers. The town is also home to several manufacturing companies, including a paper mill and a furniture factory.
Demographics
The population of Newberry in 2000 was 1,845. The town is predominantly white, with a small minority population. The median household income in 2000 was $30,938, and the median home value was $68,000. The town has a high rate of poverty, with 22.3% of the population living below the poverty line.
Common Questions
What is Per Capita Income in Newberry?
Per Capita income in Newberry is $24,135.
What is the Median Family Income in Newberry?
Median Family Income in Newberry is $63,036.
What is the Median Household income in Newberry?
Median Household Income in Newberry is $45,213.
What is Income or Wage Gap in Newberry?
Income or Wage Gap in Newberry is 30.3%.
Women in Newberry earn 69.7 cents for every dollar earned by a man.
What is Inequality or Gini Index in Newberry?
Inequality or Gini Index in Newberry is 0.46.
What is the Total Population of Newberry?
Total Population of Newberry is 1,138.
What is the Total Male Population of Newberry?
Total Male Population of Newberry is 476.
What is the Total Female Population of Newberry?
Total Female Population of Newberry is 662.
What is the Ratio of Males per 100 Females in Newberry?
There are 71.90 Males per 100 Females in Newberry.
What is the Ratio of Females per 100 Males in Newberry?
There are 139.08 Females per 100 Males in Newberry.
What is the Median Population Age in Newberry?
Median Population Age in Newberry is 38.6 Years.
What is the Average Family Size in Newberry
Average Family Size in Newberry is 3.0 People.
What is the Average Household Size in Newberry
Average Household Size in Newberry is 2.2 People.
How Large is the Labor Force in Newberry?
There are 373 People in the Labor Forcein in Newberry.
What is the Percentage of People in the Labor Force in Newberry?
45.6% of People are in the Labor Force in Newberry.
What is the Unemployment Rate in Newberry?
Unemployment Rate in Newberry is 4.6%.