Negaunee, MI Map & Demographics
Negaunee Map
Negaunee Overview
$30,977
PER CAPITA INCOME
$83,412
AVG FAMILY INCOME
$61,077
AVG HOUSEHOLD INCOME
31.3%
WAGE / INCOME GAP [ % ]
68.7¢/ $1
WAGE / INCOME GAP [ $ ]
0.39
INEQUALITY / GINI INDEX
4,650
TOTAL POPULATION
2,392
MALE POPULATION
2,258
FEMALE POPULATION
105.93
MALES / 100 FEMALES
94.40
FEMALES / 100 MALES
37.0
MEDIAN AGE
3.0
AVG FAMILY SIZE
2.2
AVG HOUSEHOLD SIZE
2,225
LABOR FORCE [ PEOPLE ]
62.5%
PERCENT IN LABOR FORCE
2.7%
UNEMPLOYMENT RATE
Negaunee Zip Codes
Negaunee Area Codes
Income in Negaunee
Income Overview in Negaunee
Per Capita Income in Negaunee is $30,977, while median incomes of families and households are $83,412 and $61,077 respectively.
| Characteristic | Number | Measure |
| Per Capita Income | 4,650 | $30,977 |
| Median Family Income | 1,187 | $83,412 |
| Mean Family Income | 1,187 | $91,781 |
| Median Household Income | 2,030 | $61,077 |
| Mean Household Income | 2,030 | $70,409 |
| Income Deficit | 1,187 | $0 |
| Wage / Income Gap (%) | 4,650 | 31.32% |
| Wage / Income Gap ($) | 4,650 | 68.68¢ per $1 |
| Gini / Inequality Index | 4,650 | 0.39 |
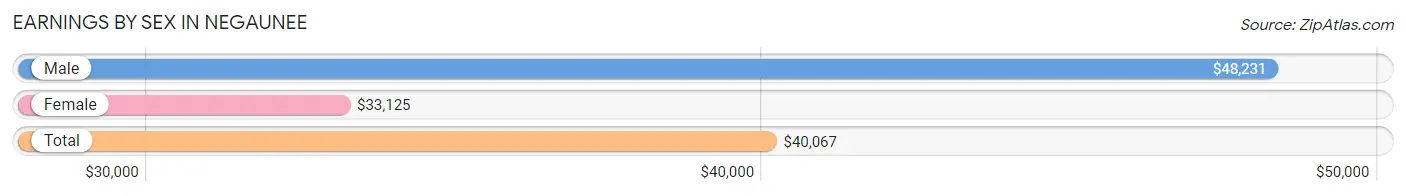
Earnings by Sex in Negaunee
Average Earnings in Negaunee are $40,067, $48,231 for men and $33,125 for women, a difference of 31.3%.
| Sex | Number | Average Earnings |
| Male | 1,346 (56.0%) | $48,231 |
| Female | 1,059 (44.0%) | $33,125 |
| Total | 2,405 (100.0%) | $40,067 |
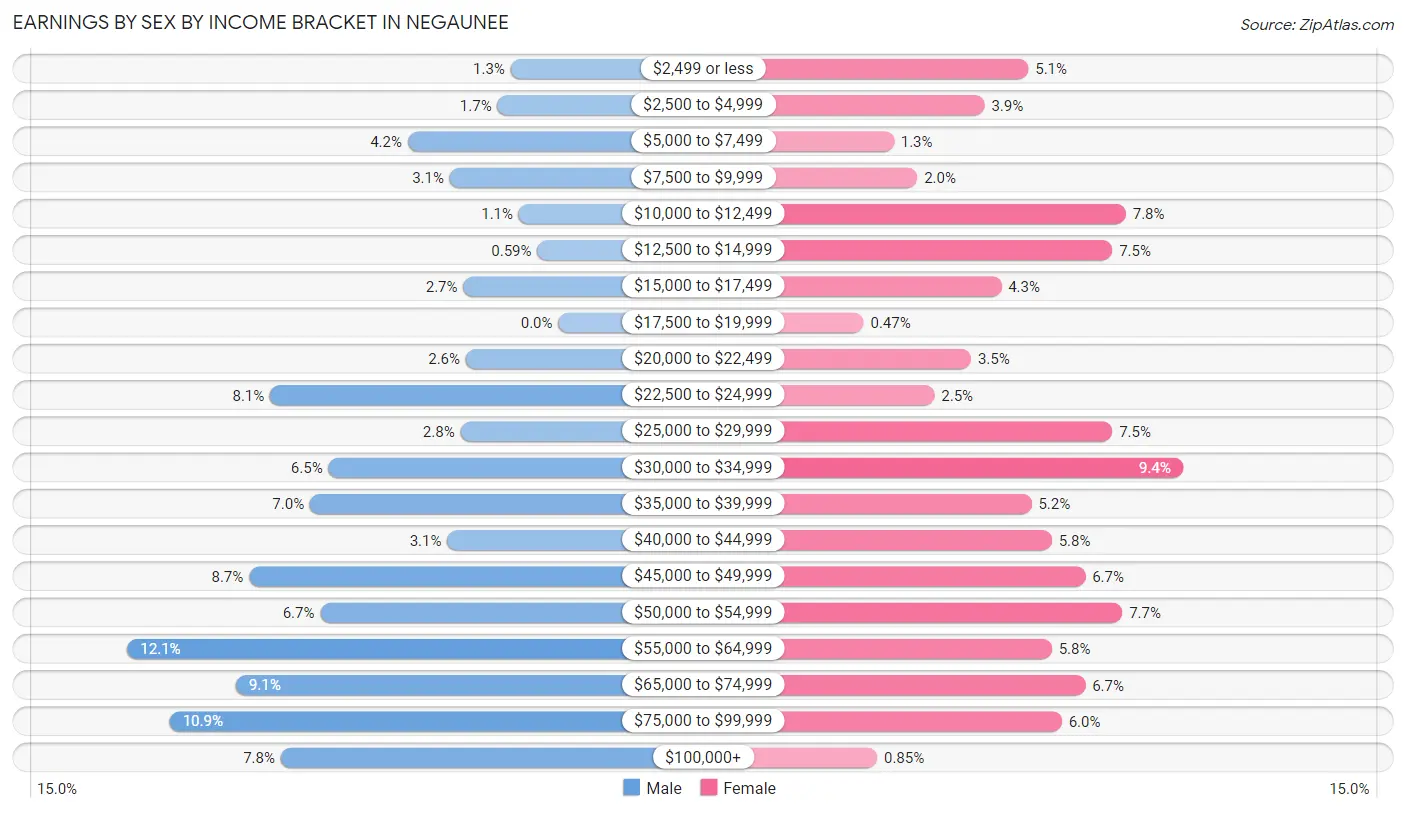
Earnings by Sex by Income Bracket in Negaunee
The most common earnings brackets in Negaunee are $55,000 to $64,999 for men (163 | 12.1%) and $30,000 to $34,999 for women (100 | 9.4%).
| Income | Male | Female |
| $2,499 or less | 18 (1.3%) | 54 (5.1%) |
| $2,500 to $4,999 | 23 (1.7%) | 41 (3.9%) |
| $5,000 to $7,499 | 57 (4.2%) | 14 (1.3%) |
| $7,500 to $9,999 | 41 (3.0%) | 21 (2.0%) |
| $10,000 to $12,499 | 15 (1.1%) | 83 (7.8%) |
| $12,500 to $14,999 | 8 (0.6%) | 79 (7.5%) |
| $15,000 to $17,499 | 36 (2.7%) | 46 (4.3%) |
| $17,500 to $19,999 | 0 (0.0%) | 5 (0.5%) |
| $20,000 to $22,499 | 35 (2.6%) | 37 (3.5%) |
| $22,500 to $24,999 | 109 (8.1%) | 26 (2.5%) |
| $25,000 to $29,999 | 37 (2.8%) | 79 (7.5%) |
| $30,000 to $34,999 | 87 (6.5%) | 100 (9.4%) |
| $35,000 to $39,999 | 94 (7.0%) | 55 (5.2%) |
| $40,000 to $44,999 | 42 (3.1%) | 61 (5.8%) |
| $45,000 to $49,999 | 117 (8.7%) | 71 (6.7%) |
| $50,000 to $54,999 | 90 (6.7%) | 82 (7.7%) |
| $55,000 to $64,999 | 163 (12.1%) | 61 (5.8%) |
| $65,000 to $74,999 | 122 (9.1%) | 71 (6.7%) |
| $75,000 to $99,999 | 147 (10.9%) | 64 (6.0%) |
| $100,000+ | 105 (7.8%) | 9 (0.9%) |
| Total | 1,346 (100.0%) | 1,059 (100.0%) |
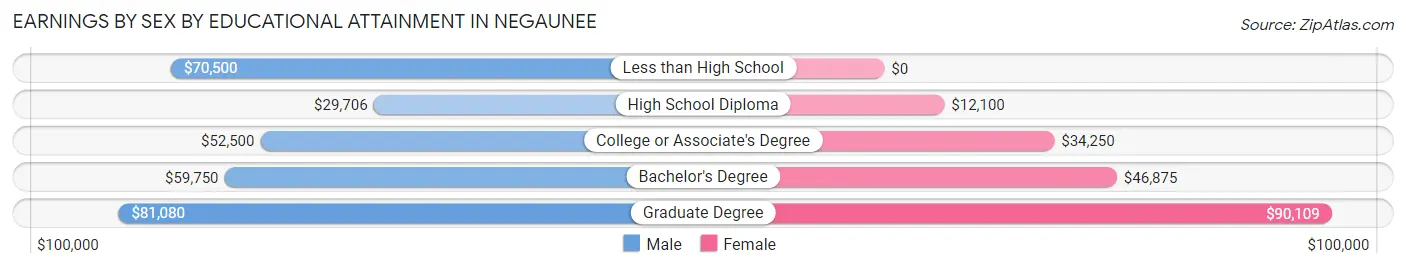
Earnings by Sex by Educational Attainment in Negaunee
Average earnings in Negaunee are $49,357 for men and $36,106 for women, a difference of 26.9%. Men with an educational attainment of graduate degree enjoy the highest average annual earnings of $81,080, while those with high school diploma education earn the least with $29,706. Women with an educational attainment of graduate degree earn the most with the average annual earnings of $90,109, while those with high school diploma education have the smallest earnings of $12,100.
| Educational Attainment | Male Income | Female Income |
| Less than High School | $70,500 | $0 |
| High School Diploma | $29,706 | $12,100 |
| College or Associate's Degree | $52,500 | $34,250 |
| Bachelor's Degree | $59,750 | $46,875 |
| Graduate Degree | $81,080 | $90,109 |
| Total | $49,357 | $36,106 |
Family Income in Negaunee
Family Income Brackets in Negaunee
According to the Negaunee family income data, there are 326 families falling into the $75,000 to $99,999 income range, which is the most common income bracket and makes up 27.5% of all families. Conversely, the $10,000 to $14,999 income bracket is the least frequent group with only 5 families (0.4%) belonging to this category.
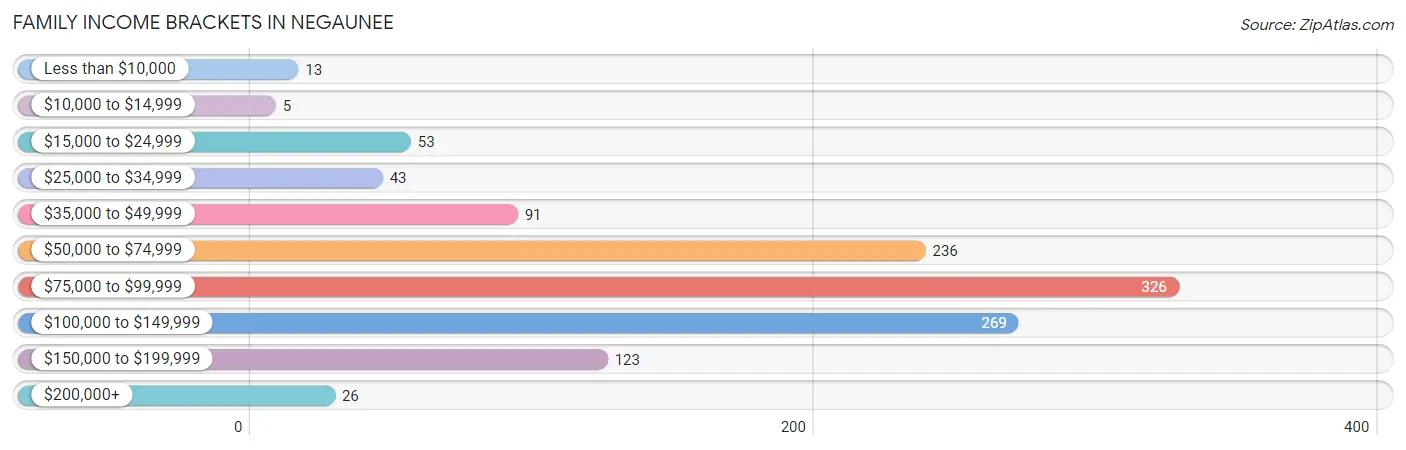
| Income Bracket | # Families | % Families |
| Less than $10,000 | 13 | 1.1% |
| $10,000 to $14,999 | 5 | 0.4% |
| $15,000 to $24,999 | 53 | 4.5% |
| $25,000 to $34,999 | 43 | 3.6% |
| $35,000 to $49,999 | 91 | 7.7% |
| $50,000 to $74,999 | 236 | 19.9% |
| $75,000 to $99,999 | 326 | 27.5% |
| $100,000 to $149,999 | 269 | 22.7% |
| $150,000 to $199,999 | 123 | 10.4% |
| $200,000+ | 26 | 2.2% |
Family Income by Famaliy Size in Negaunee
4-person families (217 | 18.3%) account for the highest median family income in Negaunee with $127,847 per family, while 2-person families (507 | 42.7%) have the highest median income of $41,188 per family member.
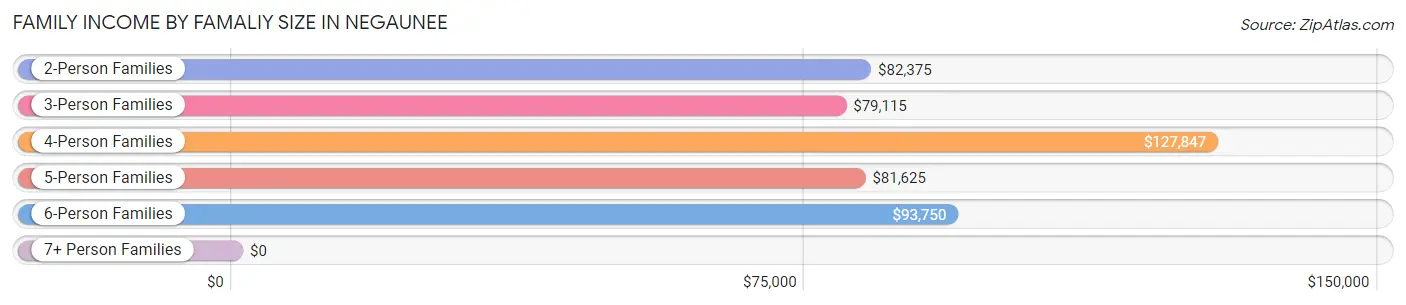
| Income Bracket | # Families | Median Income |
| 2-Person Families | 507 (42.7%) | $82,375 |
| 3-Person Families | 387 (32.6%) | $79,115 |
| 4-Person Families | 217 (18.3%) | $127,847 |
| 5-Person Families | 45 (3.8%) | $81,625 |
| 6-Person Families | 17 (1.4%) | $93,750 |
| 7+ Person Families | 14 (1.2%) | $0 |
| Total | 1,187 (100.0%) | $83,412 |
Family Income by Number of Earners in Negaunee
The median family income in Negaunee is $83,412, with families comprising 3+ earners (51) having the highest median family income of $170,450, while families with 1 earner (289) have the lowest median family income of $60,750, accounting for 4.3% and 24.3% of families, respectively.
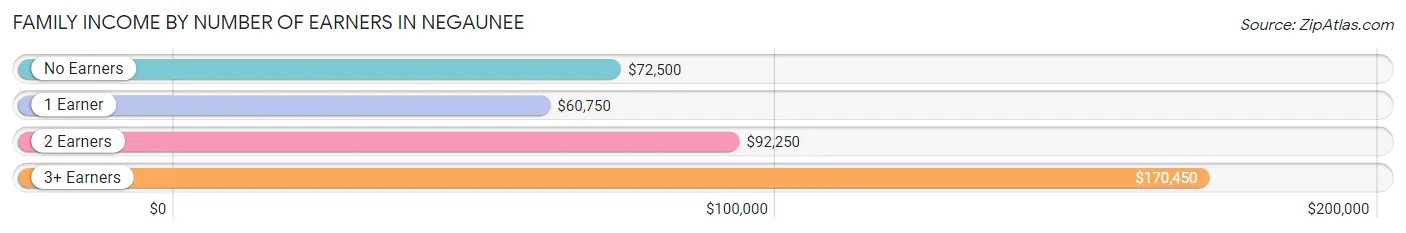
| Number of Earners | # Families | Median Income |
| No Earners | 158 (13.3%) | $72,500 |
| 1 Earner | 289 (24.3%) | $60,750 |
| 2 Earners | 689 (58.1%) | $92,250 |
| 3+ Earners | 51 (4.3%) | $170,450 |
| Total | 1,187 (100.0%) | $83,412 |
Household Income in Negaunee
Household Income Brackets in Negaunee
With 396 households falling in the category, the $75,000 to $99,999 income range is the most frequent in Negaunee, accounting for 19.5% of all households. In contrast, only 32 households (1.6%) fall into the $200,000+ income bracket, making it the least populous group.
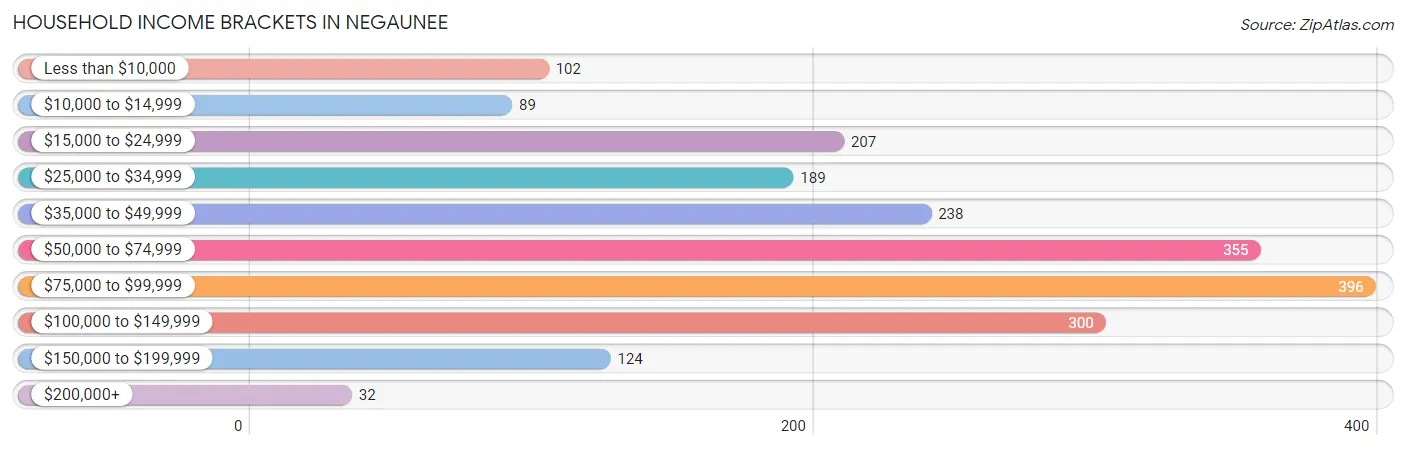
| Income Bracket | # Households | % Households |
| Less than $10,000 | 102 | 5.0% |
| $10,000 to $14,999 | 89 | 4.4% |
| $15,000 to $24,999 | 207 | 10.2% |
| $25,000 to $34,999 | 189 | 9.3% |
| $35,000 to $49,999 | 238 | 11.7% |
| $50,000 to $74,999 | 355 | 17.5% |
| $75,000 to $99,999 | 396 | 19.5% |
| $100,000 to $149,999 | 300 | 14.8% |
| $150,000 to $199,999 | 124 | 6.1% |
| $200,000+ | 32 | 1.6% |
Household Income by Householder Age in Negaunee
The median household income in Negaunee is $61,077, with the highest median household income of $80,862 found in the 25 to 44 years age bracket for the primary householder. A total of 740 households (36.4%) fall into this category. Meanwhile, the 15 to 24 years age bracket for the primary householder has the lowest median household income of $0, with 89 households (4.4%) in this group.
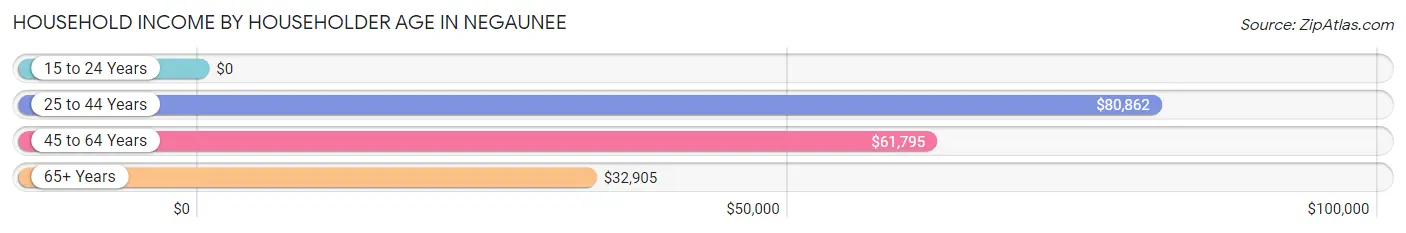
| Income Bracket | # Households | Median Income |
| 15 to 24 Years | 89 (4.4%) | $0 |
| 25 to 44 Years | 740 (36.4%) | $80,862 |
| 45 to 64 Years | 615 (30.3%) | $61,795 |
| 65+ Years | 586 (28.9%) | $32,905 |
| Total | 2,030 (100.0%) | $61,077 |
Poverty in Negaunee
Income Below Poverty by Sex and Age in Negaunee
With 12.3% poverty level for males and 12.8% for females among the residents of Negaunee, under 5 year old males and 75 year old and over females are the most vulnerable to poverty, with 39 males (35.8%) and 78 females (44.1%) in their respective age groups living below the poverty level.
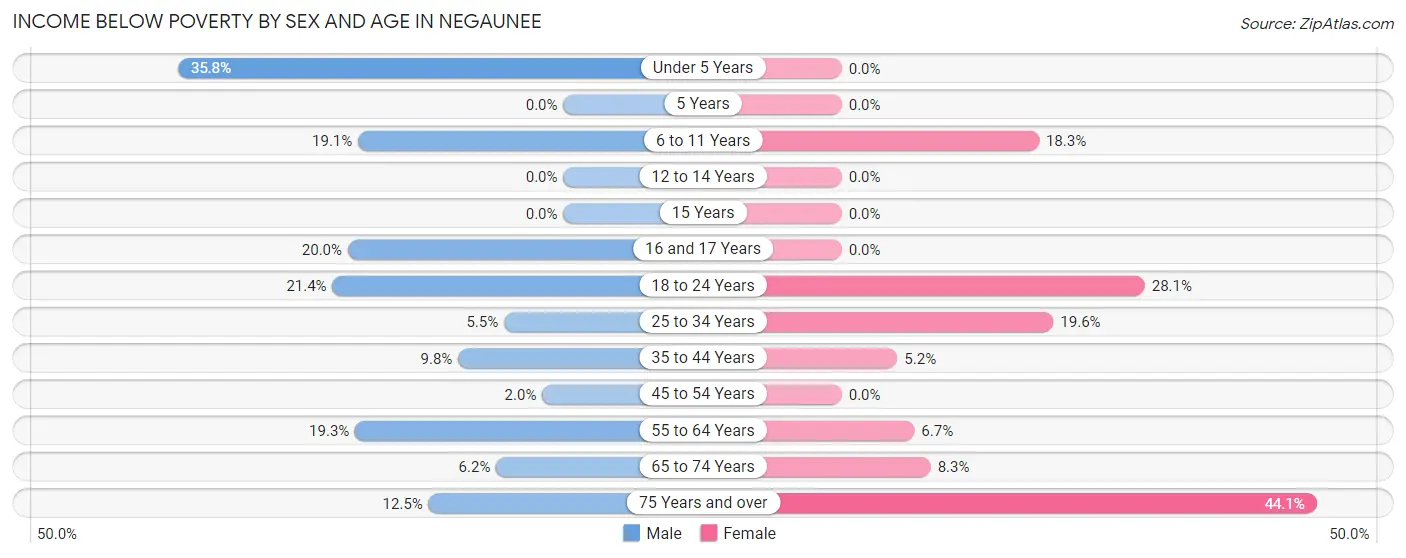
| Age Bracket | Male | Female |
| Under 5 Years | 39 (35.8%) | 0 (0.0%) |
| 5 Years | 0 (0.0%) | 0 (0.0%) |
| 6 to 11 Years | 64 (19.1%) | 41 (18.3%) |
| 12 to 14 Years | 0 (0.0%) | 0 (0.0%) |
| 15 Years | 0 (0.0%) | 0 (0.0%) |
| 16 and 17 Years | 7 (20.0%) | 0 (0.0%) |
| 18 to 24 Years | 39 (21.4%) | 45 (28.1%) |
| 25 to 34 Years | 16 (5.5%) | 55 (19.6%) |
| 35 to 44 Years | 41 (9.8%) | 19 (5.2%) |
| 45 to 54 Years | 5 (2.0%) | 0 (0.0%) |
| 55 to 64 Years | 51 (19.3%) | 19 (6.7%) |
| 65 to 74 Years | 16 (6.2%) | 17 (8.3%) |
| 75 Years and over | 16 (12.5%) | 78 (44.1%) |
| Total | 294 (12.3%) | 274 (12.8%) |
Income Above Poverty by Sex and Age in Negaunee
According to the poverty statistics in Negaunee, males aged 5 years and females aged under 5 years are the age groups that are most secure financially, with 100.0% of males and 100.0% of females in these age groups living above the poverty line.
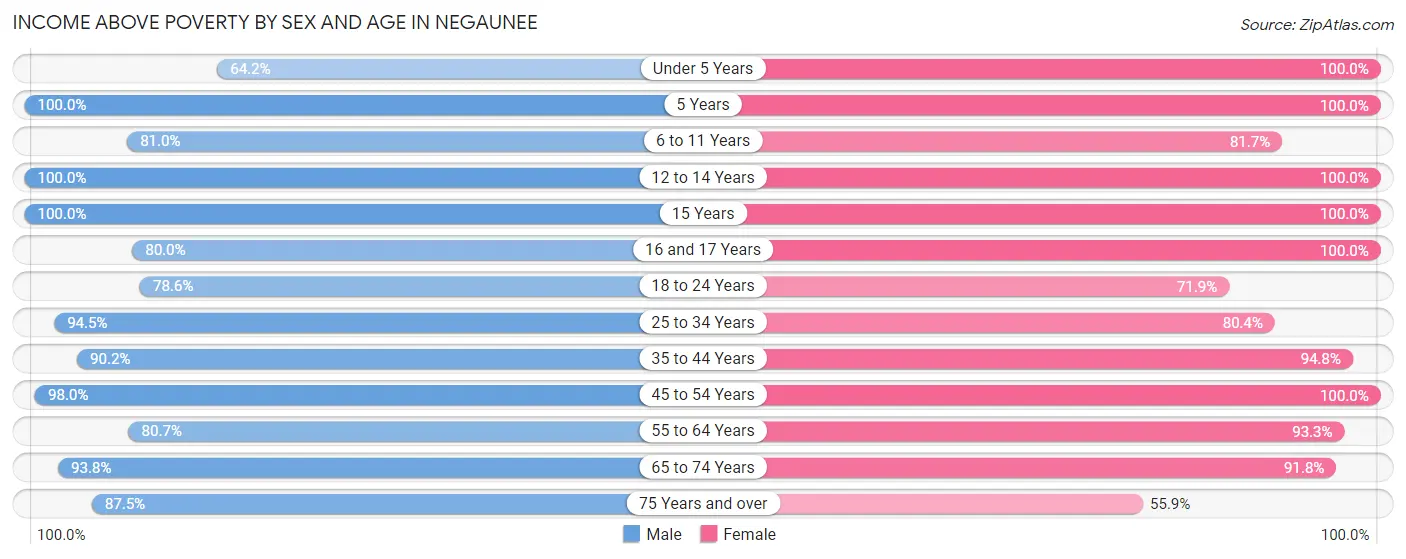
| Age Bracket | Male | Female |
| Under 5 Years | 70 (64.2%) | 155 (100.0%) |
| 5 Years | 18 (100.0%) | 28 (100.0%) |
| 6 to 11 Years | 272 (80.9%) | 183 (81.7%) |
| 12 to 14 Years | 60 (100.0%) | 82 (100.0%) |
| 15 Years | 37 (100.0%) | 22 (100.0%) |
| 16 and 17 Years | 28 (80.0%) | 25 (100.0%) |
| 18 to 24 Years | 143 (78.6%) | 115 (71.9%) |
| 25 to 34 Years | 275 (94.5%) | 225 (80.4%) |
| 35 to 44 Years | 379 (90.2%) | 349 (94.8%) |
| 45 to 54 Years | 250 (98.0%) | 131 (100.0%) |
| 55 to 64 Years | 213 (80.7%) | 263 (93.3%) |
| 65 to 74 Years | 241 (93.8%) | 189 (91.7%) |
| 75 Years and over | 112 (87.5%) | 99 (55.9%) |
| Total | 2,098 (87.7%) | 1,866 (87.2%) |
Income Below Poverty Among Married-Couple Families in Negaunee
The poverty statistics for married-couple families in Negaunee show that 1.6% or 16 of the total 974 families live below the poverty line. Families with 1 or 2 children have the highest poverty rate of 3.9%, comprising of 16 families. On the other hand, families with no children have the lowest poverty rate of 0.0%, which includes 0 families.
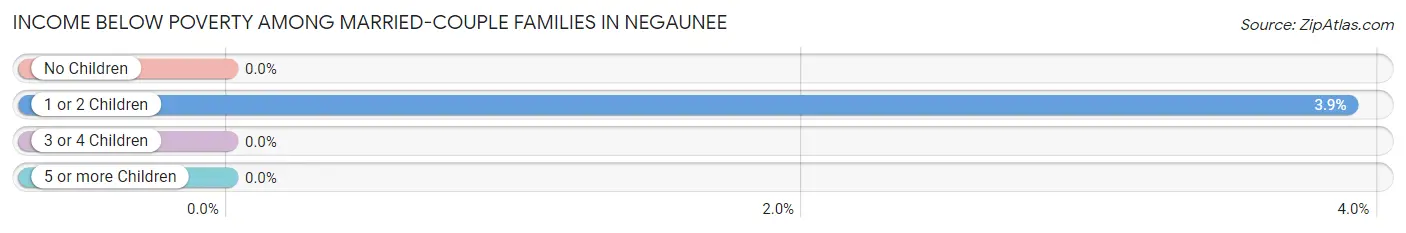
| Children | Above Poverty | Below Poverty |
| No Children | 493 (100.0%) | 0 (0.0%) |
| 1 or 2 Children | 394 (96.1%) | 16 (3.9%) |
| 3 or 4 Children | 57 (100.0%) | 0 (0.0%) |
| 5 or more Children | 14 (100.0%) | 0 (0.0%) |
| Total | 958 (98.4%) | 16 (1.6%) |
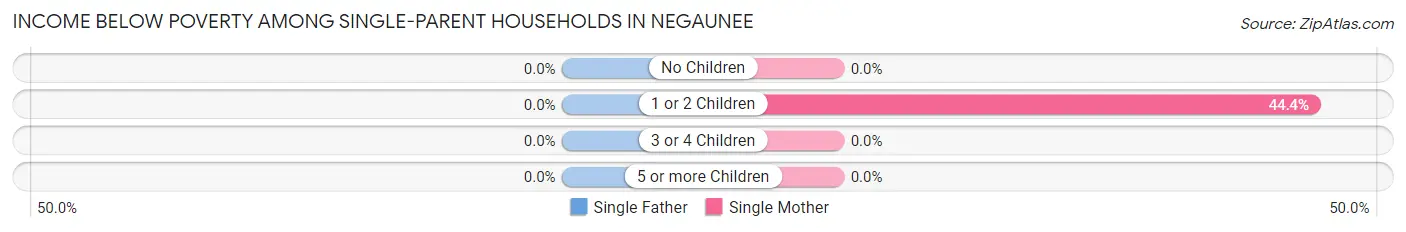
Income Below Poverty Among Single-Parent Households in Negaunee
| Children | Single Father | Single Mother |
| No Children | 0 (0.0%) | 0 (0.0%) |
| 1 or 2 Children | 0 (0.0%) | 48 (44.4%) |
| 3 or 4 Children | 0 (0.0%) | 0 (0.0%) |
| 5 or more Children | 0 (0.0%) | 0 (0.0%) |
| Total | 0 (0.0%) | 48 (35.8%) |
Income Below Poverty Among Married-Couple vs Single-Parent Households in Negaunee
The poverty data for Negaunee shows that 16 of the married-couple family households (1.6%) and 48 of the single-parent households (22.5%) are living below the poverty level. Within the married-couple family households, those with 1 or 2 children have the highest poverty rate, with 16 households (3.9%) falling below the poverty line. Among the single-parent households, those with 1 or 2 children have the highest poverty rate, with 48 household (32.0%) living below poverty.
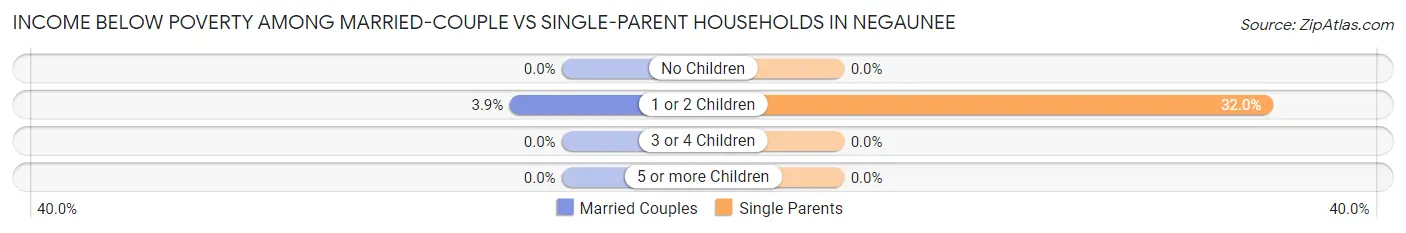
| Children | Married-Couple Families | Single-Parent Households |
| No Children | 0 (0.0%) | 0 (0.0%) |
| 1 or 2 Children | 16 (3.9%) | 48 (32.0%) |
| 3 or 4 Children | 0 (0.0%) | 0 (0.0%) |
| 5 or more Children | 0 (0.0%) | 0 (0.0%) |
| Total | 16 (1.6%) | 48 (22.5%) |
Race in Negaunee
The most populous races in Negaunee are White / Caucasian (4,302 | 92.5%), Two or more Races (209 | 4.5%), and Native / Alaskan (114 | 2.5%).
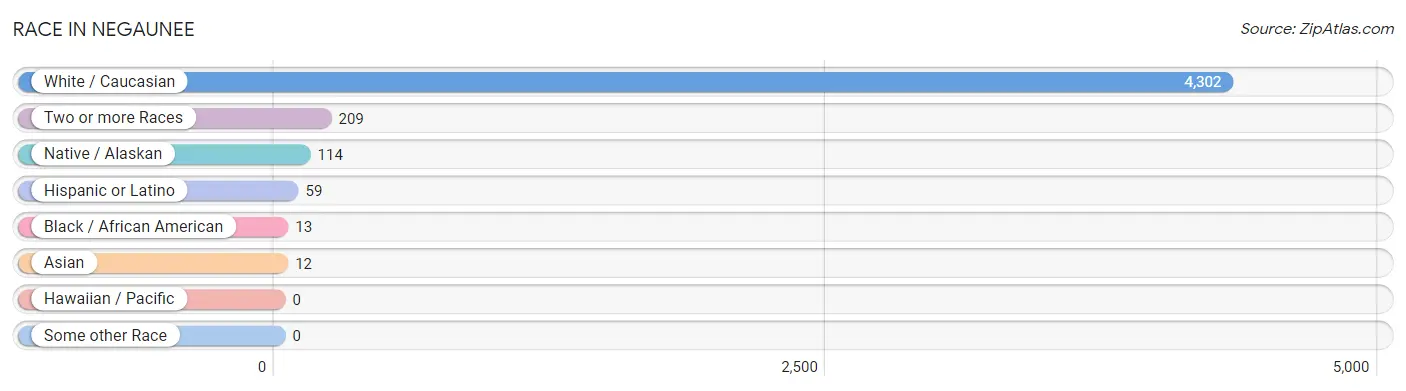
| Race | # Population | % Population |
| Asian | 12 | 0.3% |
| Black / African American | 13 | 0.3% |
| Hawaiian / Pacific | 0 | 0.0% |
| Hispanic or Latino | 59 | 1.3% |
| Native / Alaskan | 114 | 2.5% |
| White / Caucasian | 4,302 | 92.5% |
| Two or more Races | 209 | 4.5% |
| Some other Race | 0 | 0.0% |
| Total | 4,650 | 100.0% |
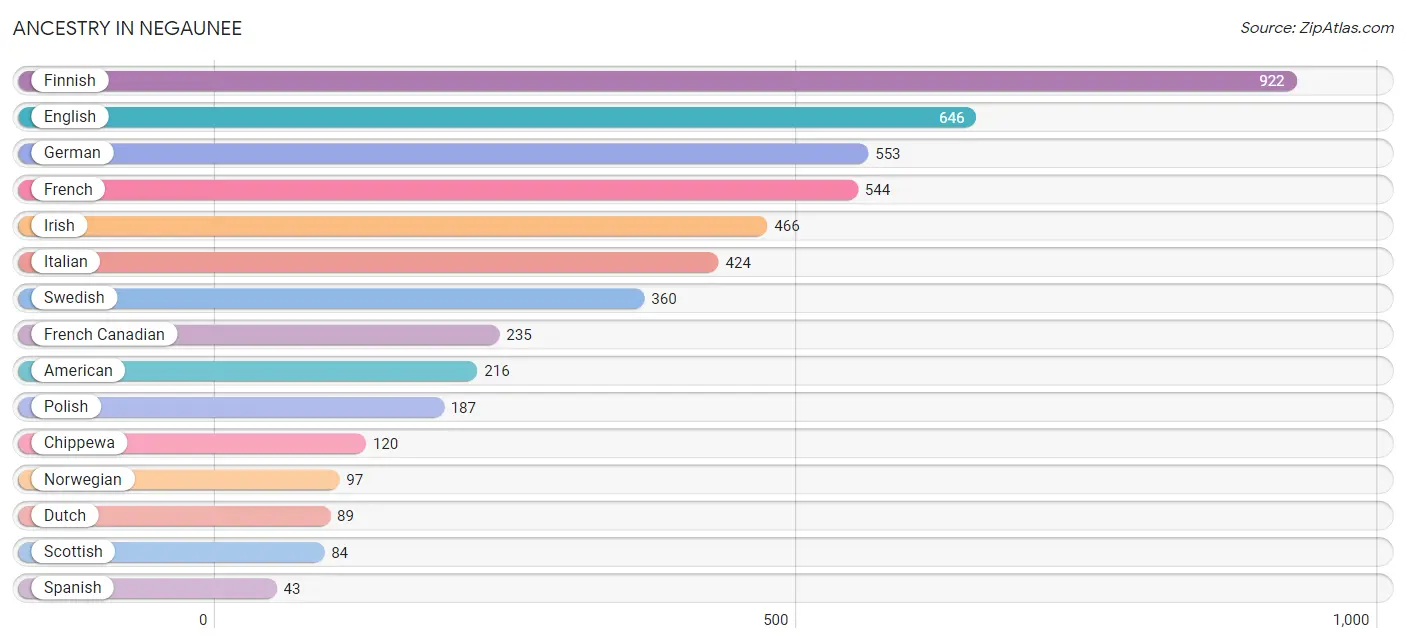
Ancestry in Negaunee
The most populous ancestries reported in Negaunee are Finnish (922 | 19.8%), English (646 | 13.9%), German (553 | 11.9%), French (544 | 11.7%), and Irish (466 | 10.0%), together accounting for 67.3% of all Negaunee residents.
| Ancestry | # Population | % Population |
| Albanian | 6 | 0.1% |
| American | 216 | 4.6% |
| Austrian | 36 | 0.8% |
| Belgian | 24 | 0.5% |
| Bhutanese | 12 | 0.3% |
| Central American | 5 | 0.1% |
| Cherokee | 12 | 0.3% |
| Chippewa | 120 | 2.6% |
| Croatian | 14 | 0.3% |
| Czech | 30 | 0.6% |
| Danish | 32 | 0.7% |
| Dutch | 89 | 1.9% |
| Eastern European | 30 | 0.6% |
| English | 646 | 13.9% |
| European | 36 | 0.8% |
| Finnish | 922 | 19.8% |
| French | 544 | 11.7% |
| French Canadian | 235 | 5.1% |
| German | 553 | 11.9% |
| Guatemalan | 5 | 0.1% |
| Hungarian | 5 | 0.1% |
| Irish | 466 | 10.0% |
| Italian | 424 | 9.1% |
| Norwegian | 97 | 2.1% |
| Polish | 187 | 4.0% |
| Potawatomi | 4 | 0.1% |
| Russian | 35 | 0.7% |
| Scandinavian | 12 | 0.3% |
| Scotch-Irish | 25 | 0.5% |
| Scottish | 84 | 1.8% |
| Slovak | 5 | 0.1% |
| Spanish | 43 | 0.9% |
| Spanish American | 11 | 0.2% |
| Swedish | 360 | 7.7% |
| Swiss | 6 | 0.1% |
| Ukrainian | 17 | 0.4% |
| Welsh | 8 | 0.2% |
| Yugoslavian | 8 | 0.2% | View All 38 Rows |
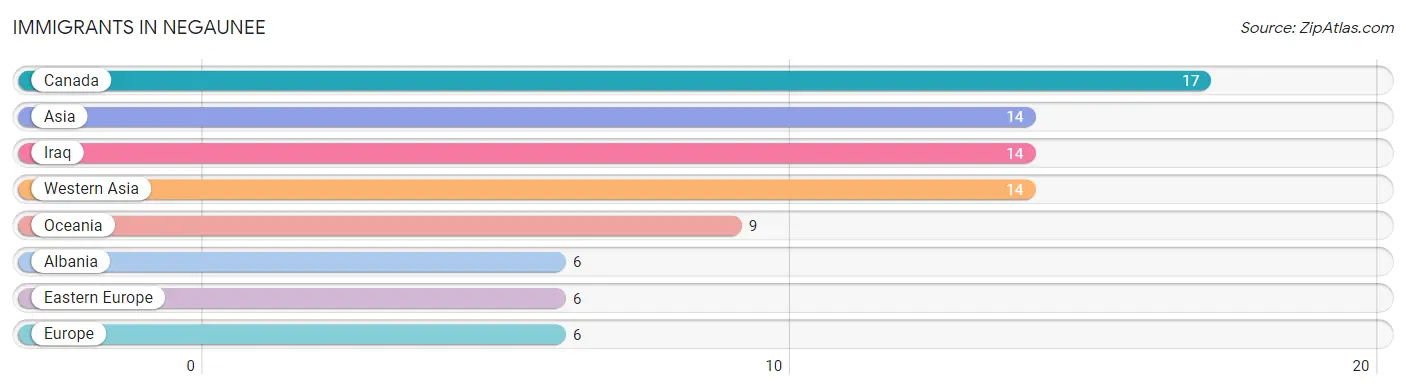
Immigrants in Negaunee
The most numerous immigrant groups reported in Negaunee came from Canada (17 | 0.4%), Asia (14 | 0.3%), Iraq (14 | 0.3%), Western Asia (14 | 0.3%), and Oceania (9 | 0.2%), together accounting for 1.5% of all Negaunee residents.
| Immigration Origin | # Population | % Population |
| Albania | 6 | 0.1% |
| Asia | 14 | 0.3% |
| Canada | 17 | 0.4% |
| Eastern Europe | 6 | 0.1% |
| Europe | 6 | 0.1% |
| Iraq | 14 | 0.3% |
| Oceania | 9 | 0.2% |
| Western Asia | 14 | 0.3% | View All 8 Rows |
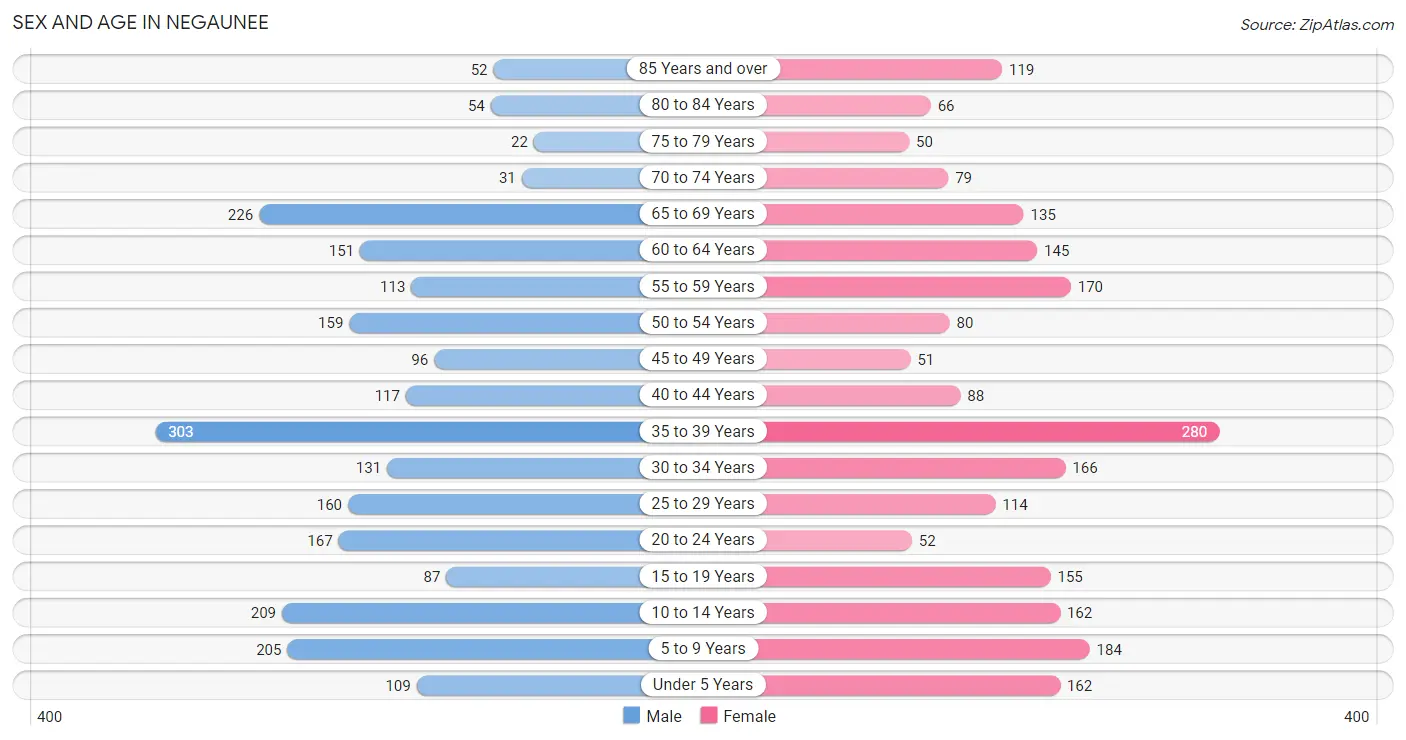
Sex and Age in Negaunee
Sex and Age in Negaunee
The most populous age groups in Negaunee are 35 to 39 Years (303 | 12.7%) for men and 35 to 39 Years (280 | 12.4%) for women.
| Age Bracket | Male | Female |
| Under 5 Years | 109 (4.6%) | 162 (7.2%) |
| 5 to 9 Years | 205 (8.6%) | 184 (8.2%) |
| 10 to 14 Years | 209 (8.7%) | 162 (7.2%) |
| 15 to 19 Years | 87 (3.6%) | 155 (6.9%) |
| 20 to 24 Years | 167 (7.0%) | 52 (2.3%) |
| 25 to 29 Years | 160 (6.7%) | 114 (5.1%) |
| 30 to 34 Years | 131 (5.5%) | 166 (7.3%) |
| 35 to 39 Years | 303 (12.7%) | 280 (12.4%) |
| 40 to 44 Years | 117 (4.9%) | 88 (3.9%) |
| 45 to 49 Years | 96 (4.0%) | 51 (2.3%) |
| 50 to 54 Years | 159 (6.7%) | 80 (3.5%) |
| 55 to 59 Years | 113 (4.7%) | 170 (7.5%) |
| 60 to 64 Years | 151 (6.3%) | 145 (6.4%) |
| 65 to 69 Years | 226 (9.5%) | 135 (6.0%) |
| 70 to 74 Years | 31 (1.3%) | 79 (3.5%) |
| 75 to 79 Years | 22 (0.9%) | 50 (2.2%) |
| 80 to 84 Years | 54 (2.3%) | 66 (2.9%) |
| 85 Years and over | 52 (2.2%) | 119 (5.3%) |
| Total | 2,392 (100.0%) | 2,258 (100.0%) |
Families and Households in Negaunee
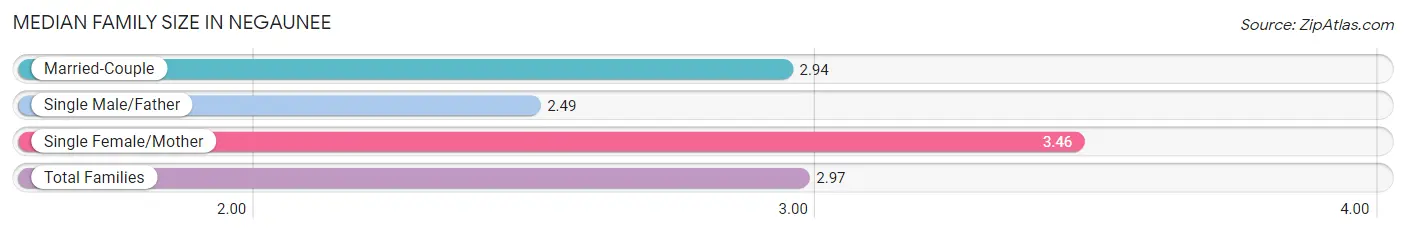
Median Family Size in Negaunee
The median family size in Negaunee is 2.97 persons per family, with single female/mother families (134 | 11.3%) accounting for the largest median family size of 3.46 persons per family. On the other hand, single male/father families (79 | 6.7%) represent the smallest median family size with 2.49 persons per family.
| Family Type | # Families | Family Size |
| Married-Couple | 974 (82.1%) | 2.94 |
| Single Male/Father | 79 (6.7%) | 2.49 |
| Single Female/Mother | 134 (11.3%) | 3.46 |
| Total Families | 1,187 (100.0%) | 2.97 |
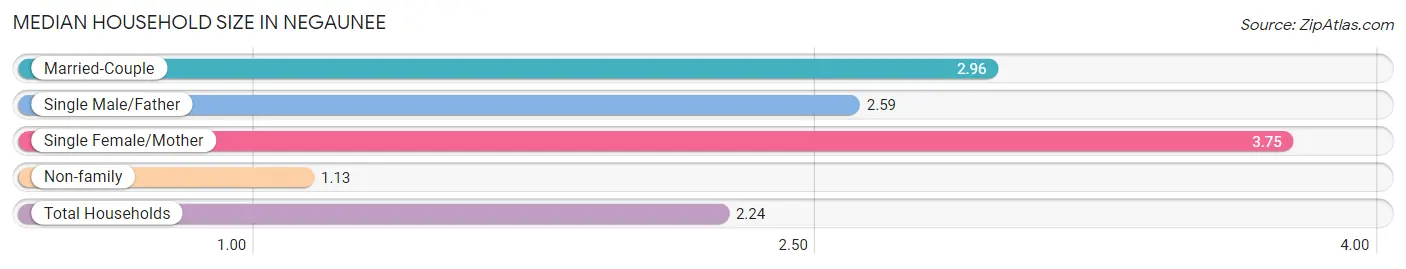
Median Household Size in Negaunee
The median household size in Negaunee is 2.24 persons per household, with single female/mother households (134 | 6.6%) accounting for the largest median household size of 3.75 persons per household. non-family households (843 | 41.5%) represent the smallest median household size with 1.13 persons per household.
| Household Type | # Households | Household Size |
| Married-Couple | 974 (48.0%) | 2.96 |
| Single Male/Father | 79 (3.9%) | 2.59 |
| Single Female/Mother | 134 (6.6%) | 3.75 |
| Non-family | 843 (41.5%) | 1.13 |
| Total Households | 2,030 (100.0%) | 2.24 |
Household Size by Marriage Status in Negaunee
Out of a total of 2,030 households in Negaunee, 1,187 (58.5%) are family households, while 843 (41.5%) are nonfamily households. The most numerous type of family households are 2-person households, comprising 502, and the most common type of nonfamily households are 1-person households, comprising 749.
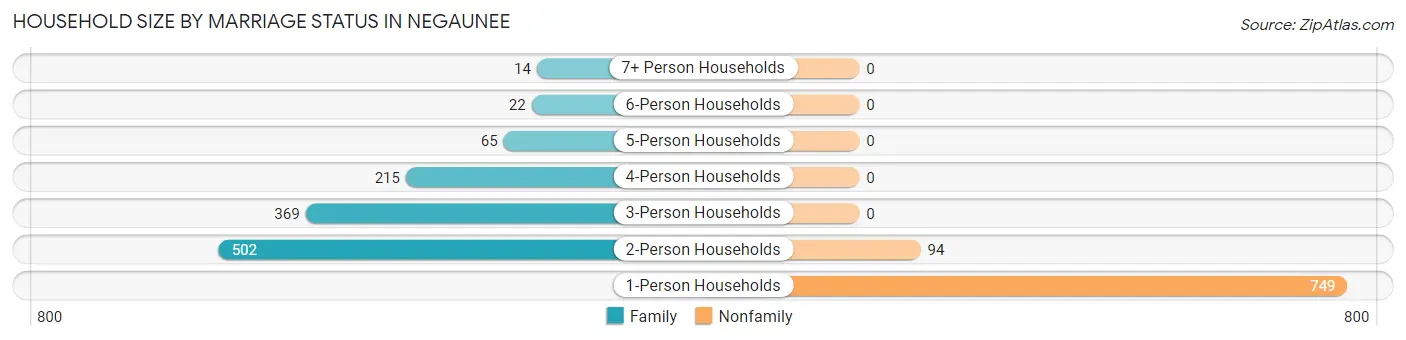
| Household Size | Family Households | Nonfamily Households |
| 1-Person Households | - | 749 (36.9%) |
| 2-Person Households | 502 (24.7%) | 94 (4.6%) |
| 3-Person Households | 369 (18.2%) | 0 (0.0%) |
| 4-Person Households | 215 (10.6%) | 0 (0.0%) |
| 5-Person Households | 65 (3.2%) | 0 (0.0%) |
| 6-Person Households | 22 (1.1%) | 0 (0.0%) |
| 7+ Person Households | 14 (0.7%) | 0 (0.0%) |
| Total | 1,187 (58.5%) | 843 (41.5%) |
Female Fertility in Negaunee
Fertility by Age in Negaunee
Average fertility rate in Negaunee is 36.0 births per 1,000 women. Women in the age bracket of 20 to 34 years have the highest fertility rate with 81.0 births per 1,000 women. Women in the age bracket of 20 to 34 years acount for 81.8% of all women with births.
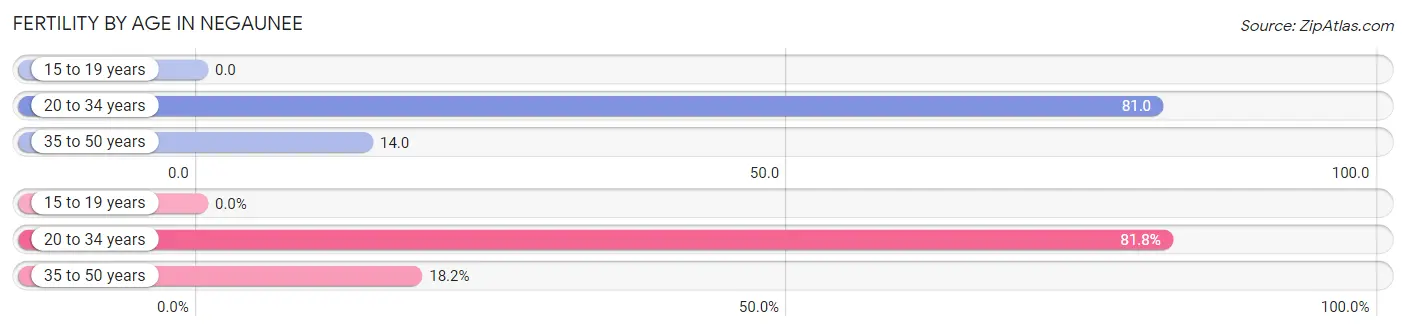
| Age Bracket | Women with Births | Births / 1,000 Women |
| 15 to 19 years | 0 (0.0%) | 0.0 |
| 20 to 34 years | 27 (81.8%) | 81.0 |
| 35 to 50 years | 6 (18.2%) | 14.0 |
| Total | 33 (100.0%) | 36.0 |
Fertility by Age by Marriage Status in Negaunee
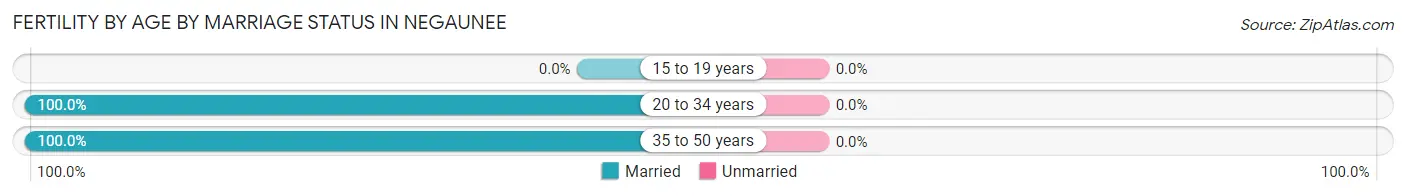
| Age Bracket | Married | Unmarried |
| 15 to 19 years | 0 (0.0%) | 0 (0.0%) |
| 20 to 34 years | 27 (100.0%) | 0 (0.0%) |
| 35 to 50 years | 6 (100.0%) | 0 (0.0%) |
| Total | 33 (100.0%) | 0 (0.0%) |
Fertility by Education in Negaunee
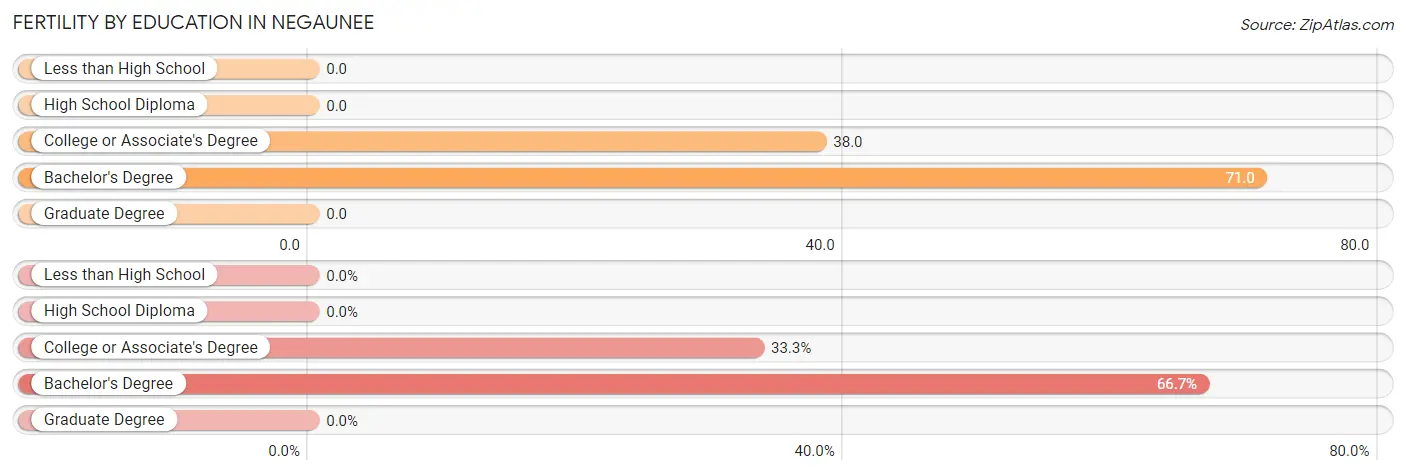
| Educational Attainment | Women with Births | Births / 1,000 Women |
| Less than High School | 0 (0.0%) | 0.0 |
| High School Diploma | 0 (0.0%) | 0.0 |
| College or Associate's Degree | 11 (33.3%) | 38.0 |
| Bachelor's Degree | 22 (66.7%) | 71.0 |
| Graduate Degree | 0 (0.0%) | 0.0 |
| Total | 33 (100.0%) | 36.0 |
Fertility by Education by Marriage Status in Negaunee
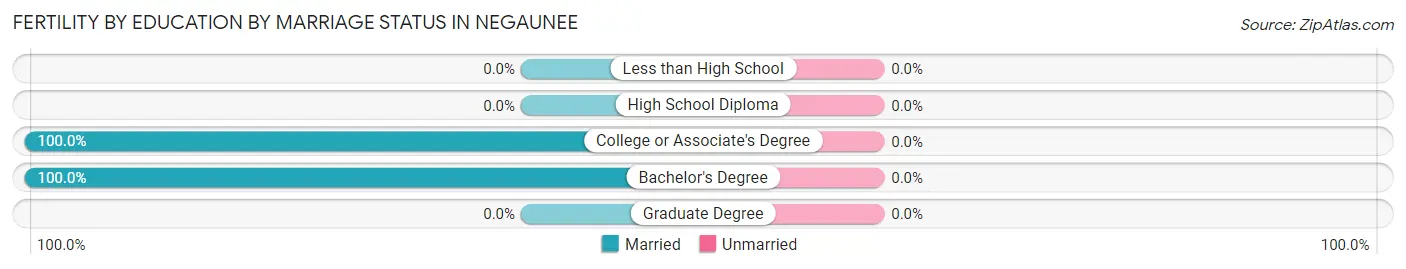
| Educational Attainment | Married | Unmarried |
| Less than High School | 0 (0.0%) | 0 (0.0%) |
| High School Diploma | 0 (0.0%) | 0 (0.0%) |
| College or Associate's Degree | 11 (100.0%) | 0 (0.0%) |
| Bachelor's Degree | 22 (100.0%) | 0 (0.0%) |
| Graduate Degree | 0 (0.0%) | 0 (0.0%) |
| Total | 33 (100.0%) | 0 (0.0%) |
Employment Characteristics in Negaunee
Employment by Class of Employer in Negaunee
Among the 2,144 employed individuals in Negaunee, private company employees (1,275 | 59.5%), local government employees (233 | 10.9%), and not-for-profit organizations (187 | 8.7%) make up the most common classes of employment.
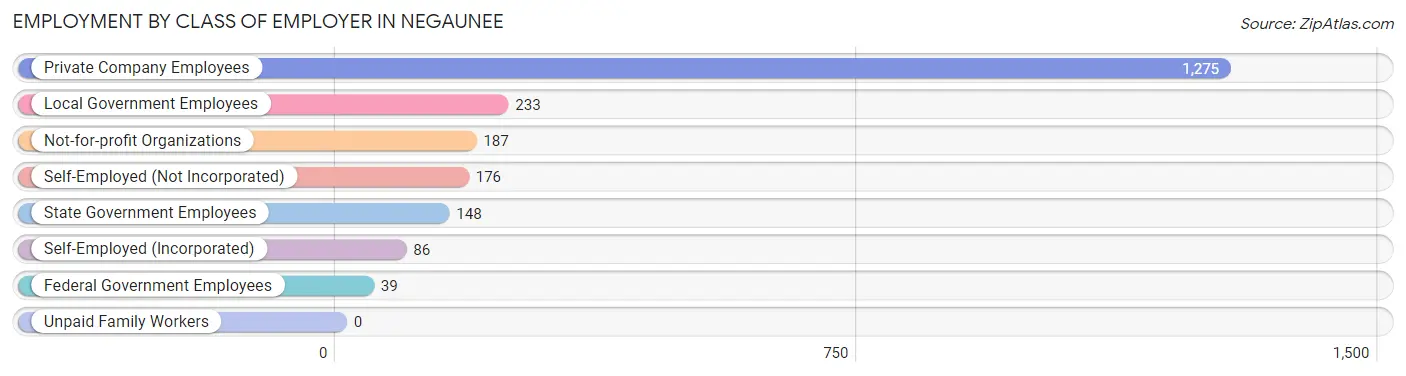
| Employer Class | # Employees | % Employees |
| Private Company Employees | 1,275 | 59.5% |
| Self-Employed (Incorporated) | 86 | 4.0% |
| Self-Employed (Not Incorporated) | 176 | 8.2% |
| Not-for-profit Organizations | 187 | 8.7% |
| Local Government Employees | 233 | 10.9% |
| State Government Employees | 148 | 6.9% |
| Federal Government Employees | 39 | 1.8% |
| Unpaid Family Workers | 0 | 0.0% |
| Total | 2,144 | 100.0% |
Employment Status by Age in Negaunee
According to the labor force statistics for Negaunee, out of the total population over 16 years of age (3,560), 62.5% or 2,225 individuals are in the labor force, with 2.7% or 60 of them unemployed. The age group with the highest labor force participation rate is 30 to 34 years, with 91.2% or 271 individuals in the labor force. Within the labor force, the 55 to 59 years age range has the highest percentage of unemployed individuals, with 8.9% or 16 of them being unemployed.
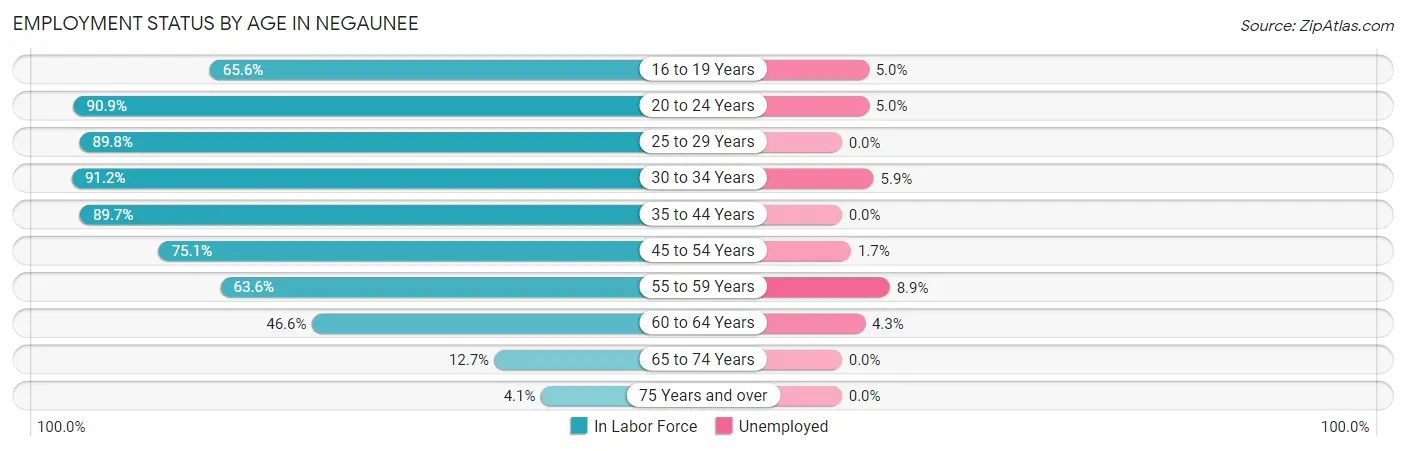
| Age Bracket | In Labor Force | Unemployed |
| 16 to 19 Years | 120 (65.6%) | 6 (5.0%) |
| 20 to 24 Years | 199 (90.9%) | 10 (5.0%) |
| 25 to 29 Years | 246 (89.8%) | 0 (0.0%) |
| 30 to 34 Years | 271 (91.2%) | 16 (5.9%) |
| 35 to 44 Years | 707 (89.7%) | 0 (0.0%) |
| 45 to 54 Years | 290 (75.1%) | 5 (1.7%) |
| 55 to 59 Years | 180 (63.6%) | 16 (8.9%) |
| 60 to 64 Years | 138 (46.6%) | 6 (4.3%) |
| 65 to 74 Years | 60 (12.7%) | 0 (0.0%) |
| 75 Years and over | 15 (4.1%) | 0 (0.0%) |
| Total | 2,225 (62.5%) | 60 (2.7%) |
Employment Status by Educational Attainment in Negaunee
According to labor force statistics for Negaunee, 78.8% of individuals (1,831) out of the total population between 25 and 64 years of age (2,324) are in the labor force, with 2.3% or 42 of them being unemployed. The group with the highest labor force participation rate are those with the educational attainment of less than high school, with 86.4% or 70 individuals in the labor force. Within the labor force, individuals with less than high school education have the highest percentage of unemployment, with 22.9% or 16 of them being unemployed.
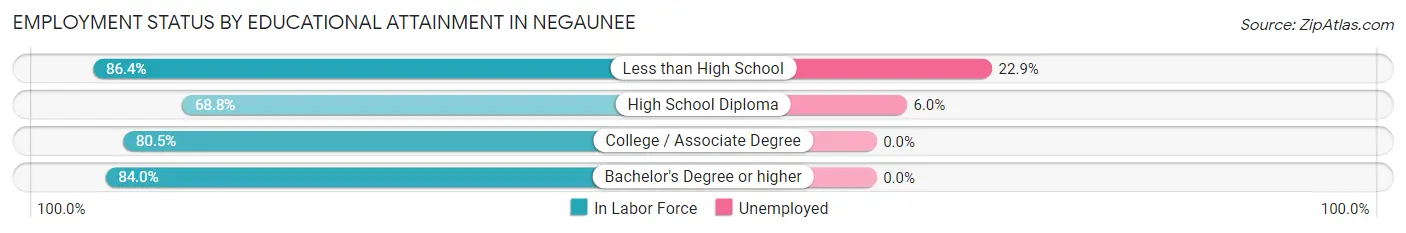
| Educational Attainment | In Labor Force | Unemployed |
| Less than High School | 70 (86.4%) | 19 (22.9%) |
| High School Diploma | 448 (68.8%) | 39 (6.0%) |
| College / Associate Degree | 524 (80.5%) | 0 (0.0%) |
| Bachelor's Degree or higher | 790 (84.0%) | 0 (0.0%) |
| Total | 1,831 (78.8%) | 53 (2.3%) |
Employment Occupations by Sex in Negaunee
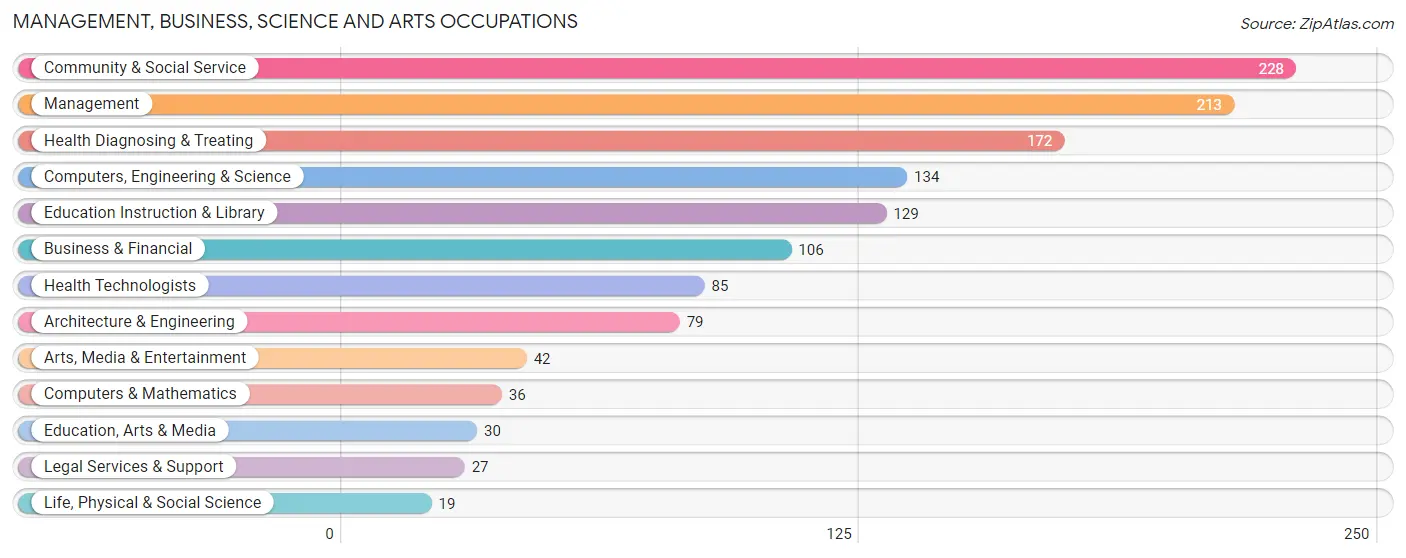
Management, Business, Science and Arts Occupations
The most common Management, Business, Science and Arts occupations in Negaunee are Community & Social Service (228 | 10.5%), Management (213 | 9.8%), Health Diagnosing & Treating (172 | 7.9%), Computers, Engineering & Science (134 | 6.2%), and Education Instruction & Library (129 | 5.9%).
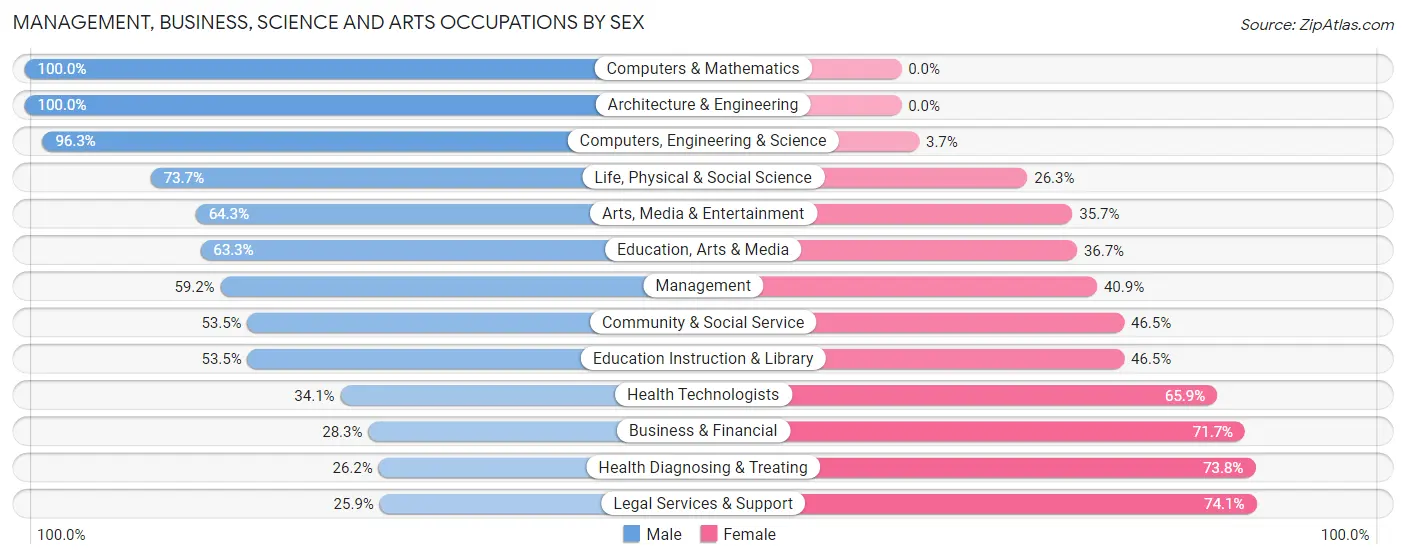
Management, Business, Science and Arts Occupations by Sex
Within the Management, Business, Science and Arts occupations in Negaunee, the most male-oriented occupations are Computers & Mathematics (100.0%), Architecture & Engineering (100.0%), and Computers, Engineering & Science (96.3%), while the most female-oriented occupations are Legal Services & Support (74.1%), Health Diagnosing & Treating (73.8%), and Business & Financial (71.7%).
| Occupation | Male | Female |
| Management | 126 (59.2%) | 87 (40.8%) |
| Business & Financial | 30 (28.3%) | 76 (71.7%) |
| Computers, Engineering & Science | 129 (96.3%) | 5 (3.7%) |
| Computers & Mathematics | 36 (100.0%) | 0 (0.0%) |
| Architecture & Engineering | 79 (100.0%) | 0 (0.0%) |
| Life, Physical & Social Science | 14 (73.7%) | 5 (26.3%) |
| Community & Social Service | 122 (53.5%) | 106 (46.5%) |
| Education, Arts & Media | 19 (63.3%) | 11 (36.7%) |
| Legal Services & Support | 7 (25.9%) | 20 (74.1%) |
| Education Instruction & Library | 69 (53.5%) | 60 (46.5%) |
| Arts, Media & Entertainment | 27 (64.3%) | 15 (35.7%) |
| Health Diagnosing & Treating | 45 (26.2%) | 127 (73.8%) |
| Health Technologists | 29 (34.1%) | 56 (65.9%) |
| Total (Category) | 452 (53.0%) | 401 (47.0%) |
| Total (Overall) | 1,194 (55.1%) | 973 (44.9%) |
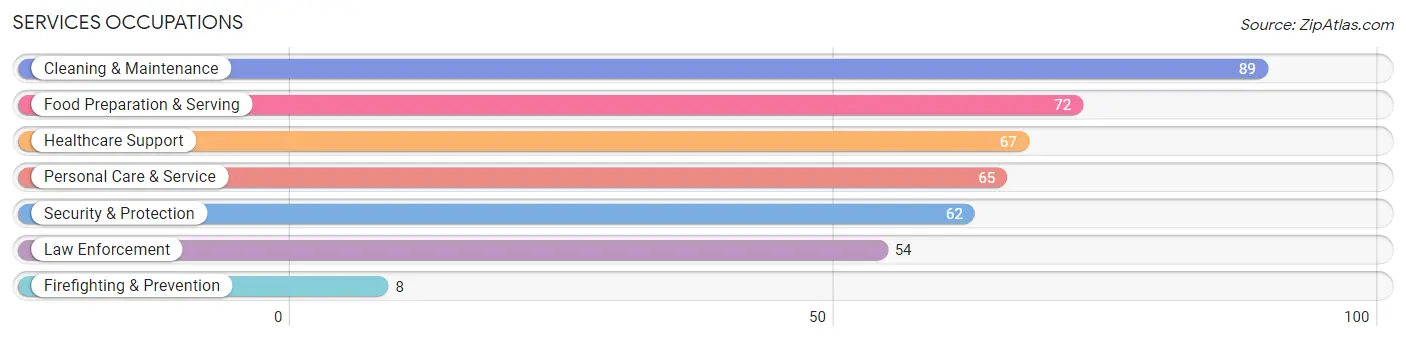
Services Occupations
The most common Services occupations in Negaunee are Cleaning & Maintenance (89 | 4.1%), Food Preparation & Serving (72 | 3.3%), Healthcare Support (67 | 3.1%), Personal Care & Service (65 | 3.0%), and Security & Protection (62 | 2.9%).
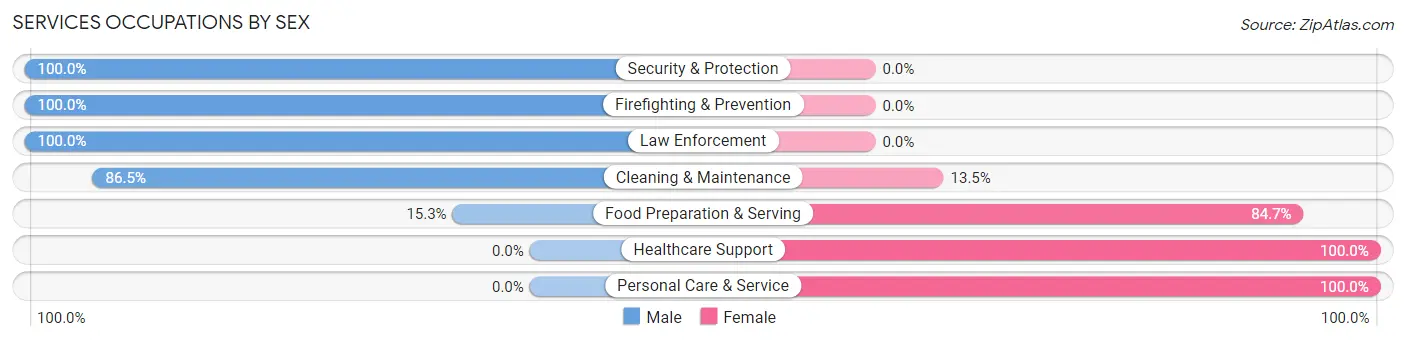
Services Occupations by Sex
Within the Services occupations in Negaunee, the most male-oriented occupations are Security & Protection (100.0%), Firefighting & Prevention (100.0%), and Law Enforcement (100.0%), while the most female-oriented occupations are Healthcare Support (100.0%), Personal Care & Service (100.0%), and Food Preparation & Serving (84.7%).
| Occupation | Male | Female |
| Healthcare Support | 0 (0.0%) | 67 (100.0%) |
| Security & Protection | 62 (100.0%) | 0 (0.0%) |
| Firefighting & Prevention | 8 (100.0%) | 0 (0.0%) |
| Law Enforcement | 54 (100.0%) | 0 (0.0%) |
| Food Preparation & Serving | 11 (15.3%) | 61 (84.7%) |
| Cleaning & Maintenance | 77 (86.5%) | 12 (13.5%) |
| Personal Care & Service | 0 (0.0%) | 65 (100.0%) |
| Total (Category) | 150 (42.2%) | 205 (57.8%) |
| Total (Overall) | 1,194 (55.1%) | 973 (44.9%) |
Sales and Office Occupations
The most common Sales and Office occupations in Negaunee are Sales & Related (217 | 10.0%), and Office & Administration (214 | 9.9%).
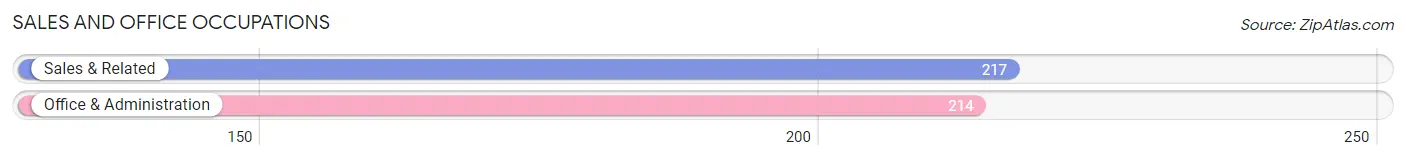
Sales and Office Occupations by Sex
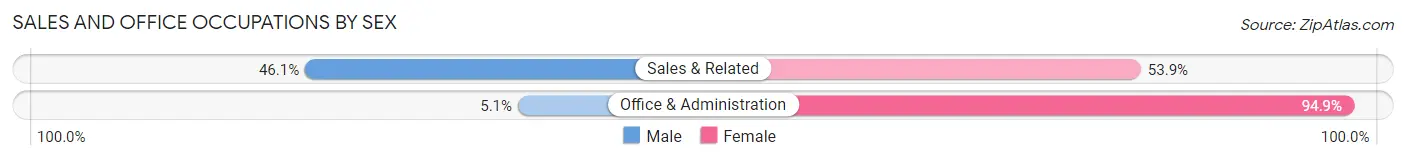
| Occupation | Male | Female |
| Sales & Related | 100 (46.1%) | 117 (53.9%) |
| Office & Administration | 11 (5.1%) | 203 (94.9%) |
| Total (Category) | 111 (25.8%) | 320 (74.3%) |
| Total (Overall) | 1,194 (55.1%) | 973 (44.9%) |
Natural Resources, Construction and Maintenance Occupations
The most common Natural Resources, Construction and Maintenance occupations in Negaunee are Construction & Extraction (145 | 6.7%), Installation, Maintenance & Repair (97 | 4.5%), and Farming, Fishing & Forestry (5 | 0.2%).
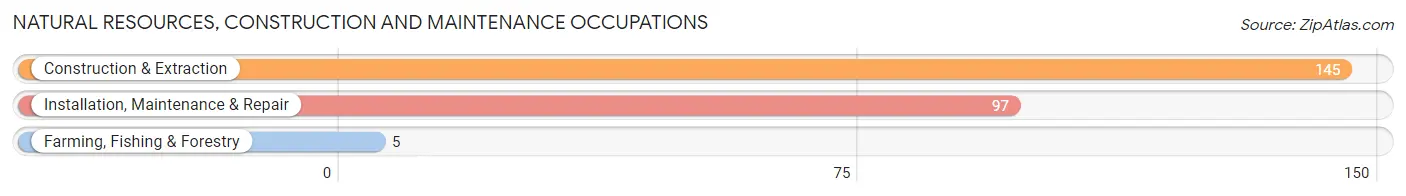
Natural Resources, Construction and Maintenance Occupations by Sex
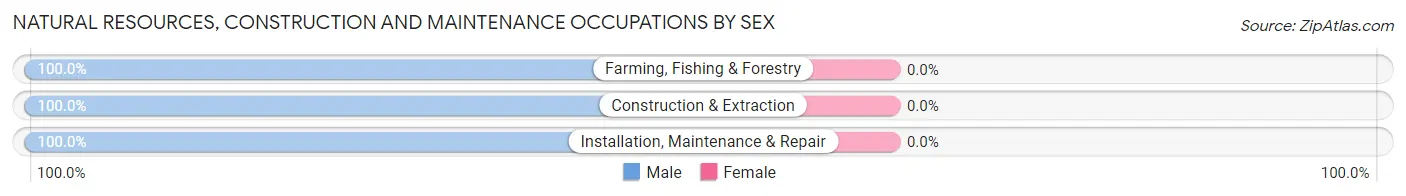
| Occupation | Male | Female |
| Farming, Fishing & Forestry | 5 (100.0%) | 0 (0.0%) |
| Construction & Extraction | 145 (100.0%) | 0 (0.0%) |
| Installation, Maintenance & Repair | 97 (100.0%) | 0 (0.0%) |
| Total (Category) | 247 (100.0%) | 0 (0.0%) |
| Total (Overall) | 1,194 (55.1%) | 973 (44.9%) |
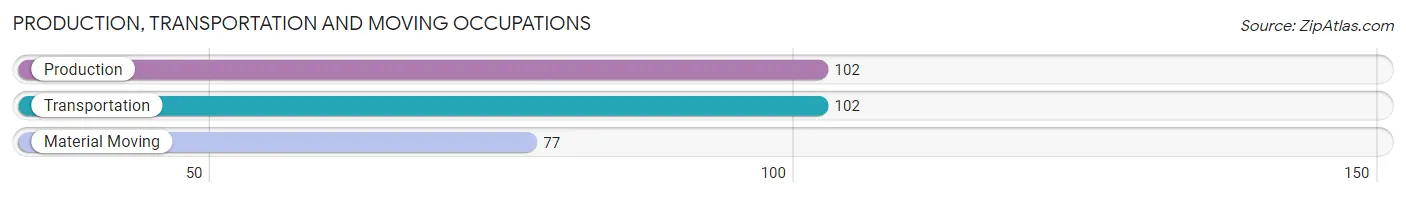
Production, Transportation and Moving Occupations
The most common Production, Transportation and Moving occupations in Negaunee are Production (102 | 4.7%), Transportation (102 | 4.7%), and Material Moving (77 | 3.5%).
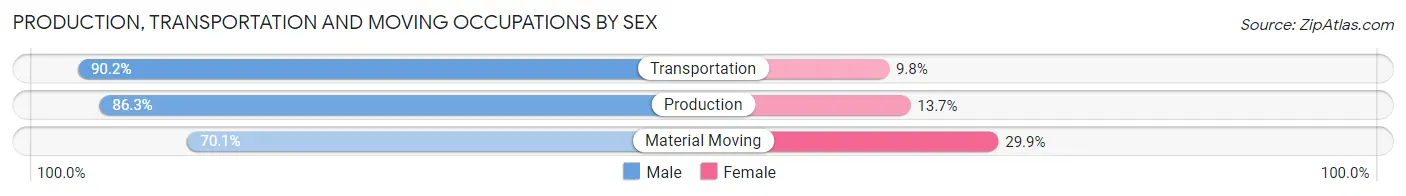
Production, Transportation and Moving Occupations by Sex
| Occupation | Male | Female |
| Production | 88 (86.3%) | 14 (13.7%) |
| Transportation | 92 (90.2%) | 10 (9.8%) |
| Material Moving | 54 (70.1%) | 23 (29.9%) |
| Total (Category) | 234 (83.3%) | 47 (16.7%) |
| Total (Overall) | 1,194 (55.1%) | 973 (44.9%) |
Employment Industries by Sex in Negaunee
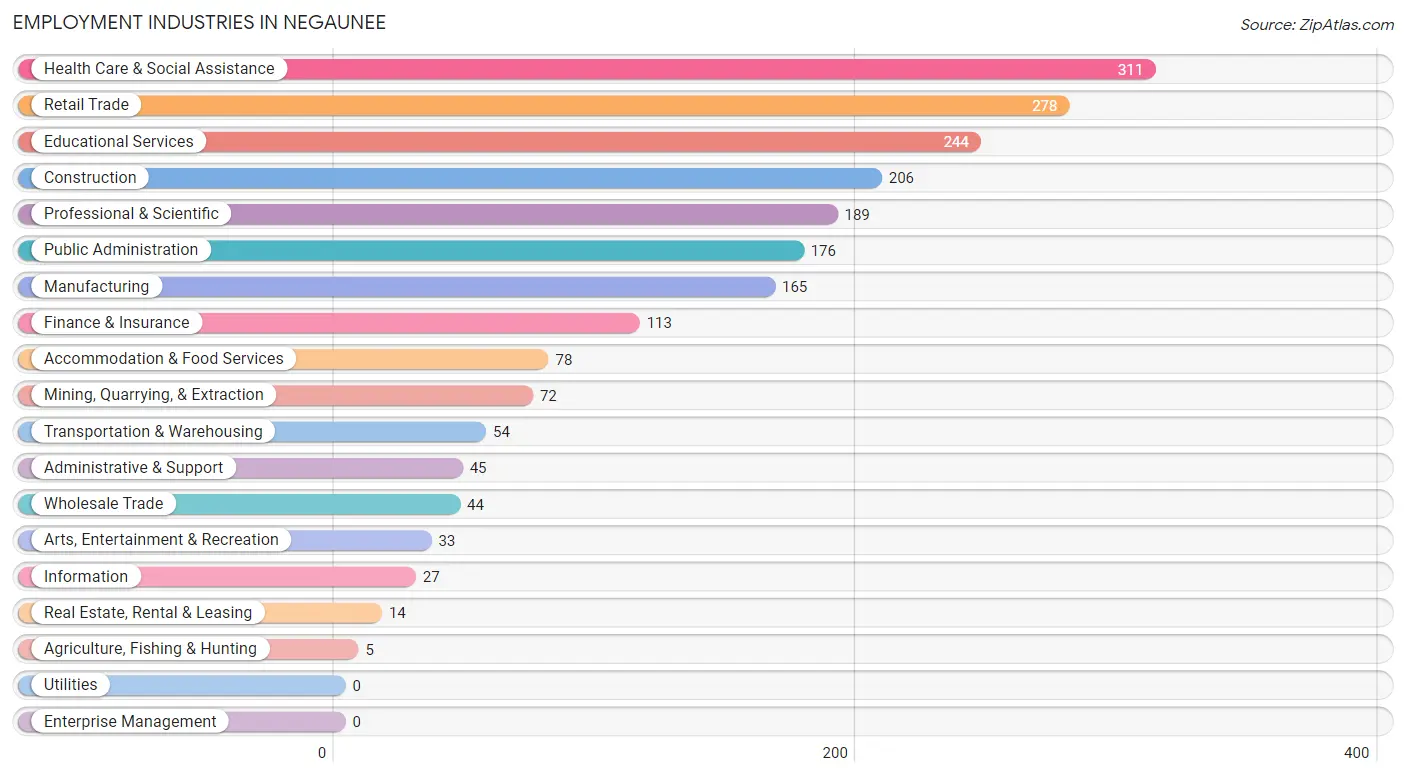
Employment Industries in Negaunee
The major employment industries in Negaunee include Health Care & Social Assistance (311 | 14.3%), Retail Trade (278 | 12.8%), Educational Services (244 | 11.3%), Construction (206 | 9.5%), and Professional & Scientific (189 | 8.7%).
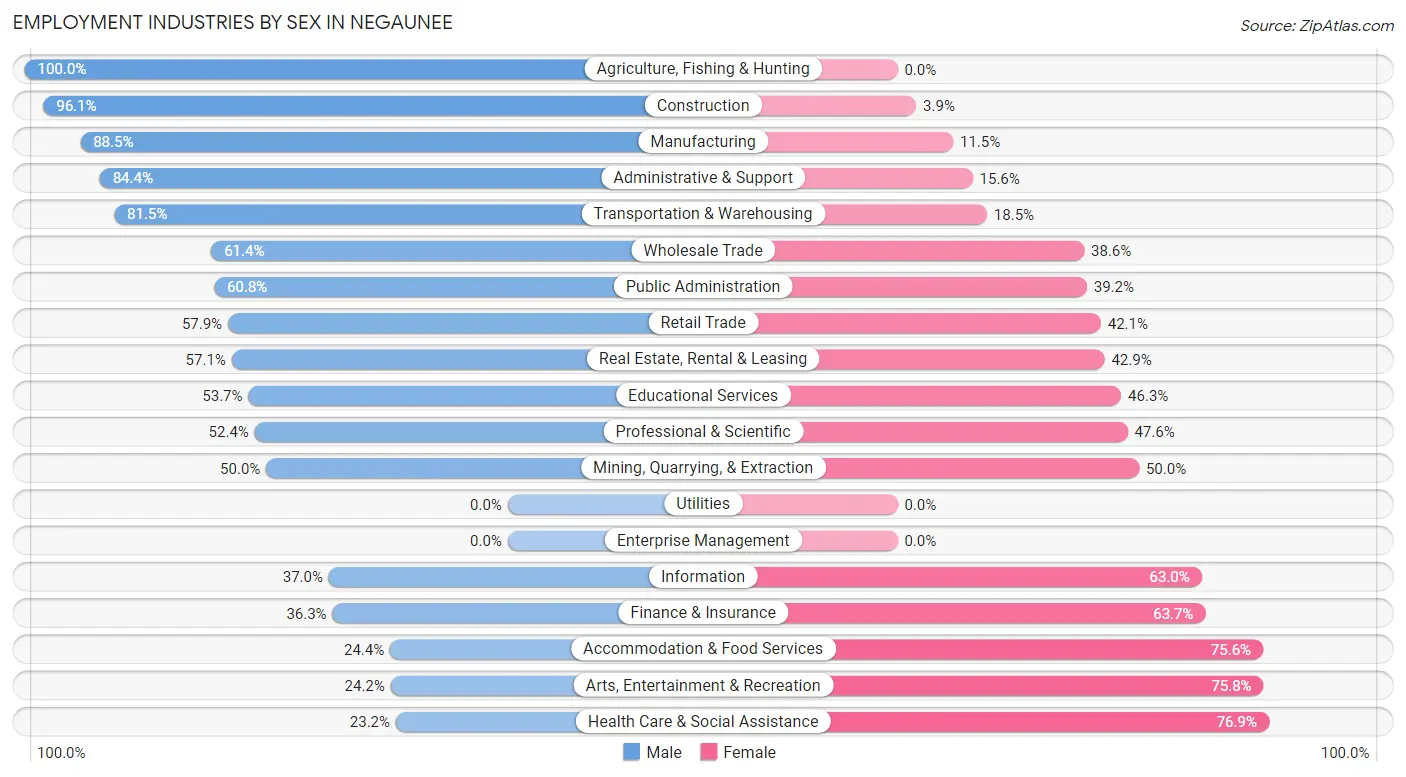
Employment Industries by Sex in Negaunee
The Negaunee industries that see more men than women are Agriculture, Fishing & Hunting (100.0%), Construction (96.1%), and Manufacturing (88.5%), whereas the industries that tend to have a higher number of women are Health Care & Social Assistance (76.8%), Arts, Entertainment & Recreation (75.8%), and Accommodation & Food Services (75.6%).
| Industry | Male | Female |
| Agriculture, Fishing & Hunting | 5 (100.0%) | 0 (0.0%) |
| Mining, Quarrying, & Extraction | 36 (50.0%) | 36 (50.0%) |
| Construction | 198 (96.1%) | 8 (3.9%) |
| Manufacturing | 146 (88.5%) | 19 (11.5%) |
| Wholesale Trade | 27 (61.4%) | 17 (38.6%) |
| Retail Trade | 161 (57.9%) | 117 (42.1%) |
| Transportation & Warehousing | 44 (81.5%) | 10 (18.5%) |
| Utilities | 0 (0.0%) | 0 (0.0%) |
| Information | 10 (37.0%) | 17 (63.0%) |
| Finance & Insurance | 41 (36.3%) | 72 (63.7%) |
| Real Estate, Rental & Leasing | 8 (57.1%) | 6 (42.9%) |
| Professional & Scientific | 99 (52.4%) | 90 (47.6%) |
| Enterprise Management | 0 (0.0%) | 0 (0.0%) |
| Administrative & Support | 38 (84.4%) | 7 (15.6%) |
| Educational Services | 131 (53.7%) | 113 (46.3%) |
| Health Care & Social Assistance | 72 (23.2%) | 239 (76.8%) |
| Arts, Entertainment & Recreation | 8 (24.2%) | 25 (75.8%) |
| Accommodation & Food Services | 19 (24.4%) | 59 (75.6%) |
| Public Administration | 107 (60.8%) | 69 (39.2%) |
| Total | 1,194 (55.1%) | 973 (44.9%) |
Education in Negaunee
School Enrollment in Negaunee
The most common levels of schooling among the 1,189 students in Negaunee are middle school (312 | 26.2%), elementary school (270 | 22.7%), and college / undergraduate (184 | 15.5%).
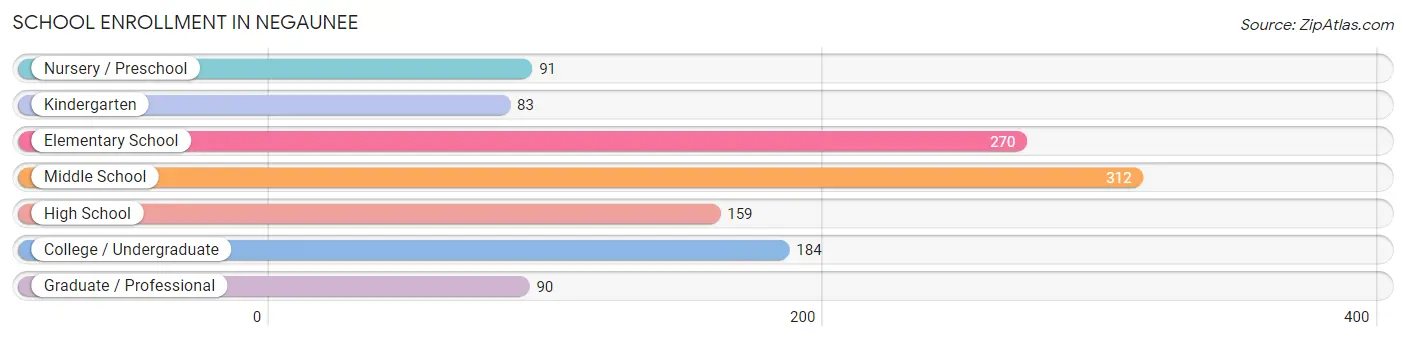
| School Level | # Students | % Students |
| Nursery / Preschool | 91 | 7.6% |
| Kindergarten | 83 | 7.0% |
| Elementary School | 270 | 22.7% |
| Middle School | 312 | 26.2% |
| High School | 159 | 13.4% |
| College / Undergraduate | 184 | 15.5% |
| Graduate / Professional | 90 | 7.6% |
| Total | 1,189 | 100.0% |
School Enrollment by Age by Funding Source in Negaunee
Out of a total of 1,189 students who are enrolled in schools in Negaunee, 172 (14.5%) attend a private institution, while the remaining 1,017 (85.5%) are enrolled in public schools. The age group of 35 years and over has the highest likelihood of being enrolled in private schools, with 43 (44.8% in the age bracket) enrolled. Conversely, the age group of 15 to 17 year olds has the lowest likelihood of being enrolled in a private school, with 119 (100.0% in the age bracket) attending a public institution.
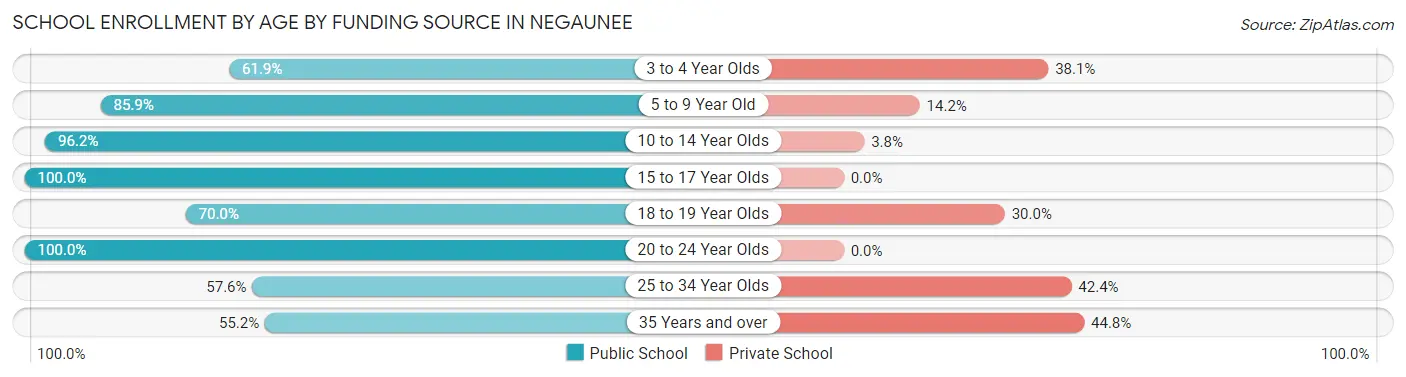
| Age Bracket | Public School | Private School |
| 3 to 4 Year Olds | 52 (61.9%) | 32 (38.1%) |
| 5 to 9 Year Old | 273 (85.9%) | 45 (14.1%) |
| 10 to 14 Year Olds | 352 (96.2%) | 14 (3.8%) |
| 15 to 17 Year Olds | 119 (100.0%) | 0 (0.0%) |
| 18 to 19 Year Olds | 56 (70.0%) | 24 (30.0%) |
| 20 to 24 Year Olds | 93 (100.0%) | 0 (0.0%) |
| 25 to 34 Year Olds | 19 (57.6%) | 14 (42.4%) |
| 35 Years and over | 53 (55.2%) | 43 (44.8%) |
| Total | 1,017 (85.5%) | 172 (14.5%) |
Educational Attainment by Field of Study in Negaunee
Business (326 | 26.6%), education (204 | 16.6%), science & technology (183 | 14.9%), computers & mathematics (97 | 7.9%), and communications (76 | 6.2%) are the most common fields of study among 1,228 individuals in Negaunee who have obtained a bachelor's degree or higher.
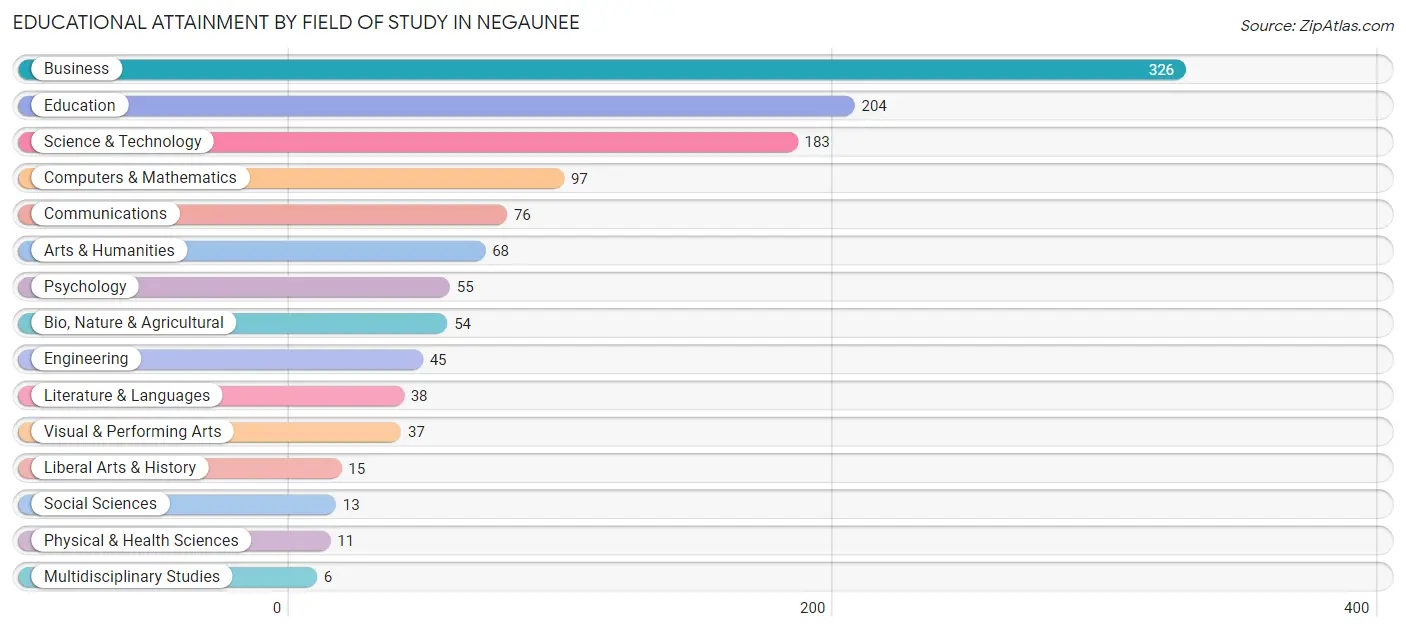
| Field of Study | # Graduates | % Graduates |
| Computers & Mathematics | 97 | 7.9% |
| Bio, Nature & Agricultural | 54 | 4.4% |
| Physical & Health Sciences | 11 | 0.9% |
| Psychology | 55 | 4.5% |
| Social Sciences | 13 | 1.1% |
| Engineering | 45 | 3.7% |
| Multidisciplinary Studies | 6 | 0.5% |
| Science & Technology | 183 | 14.9% |
| Business | 326 | 26.6% |
| Education | 204 | 16.6% |
| Literature & Languages | 38 | 3.1% |
| Liberal Arts & History | 15 | 1.2% |
| Visual & Performing Arts | 37 | 3.0% |
| Communications | 76 | 6.2% |
| Arts & Humanities | 68 | 5.5% |
| Total | 1,228 | 100.0% |
Transportation & Commute in Negaunee
Vehicle Availability by Sex in Negaunee
The most prevalent vehicle ownership categories in Negaunee are males with 2 vehicles (616, accounting for 52.1%) and females with 2 vehicles (523, making up 64.0%).
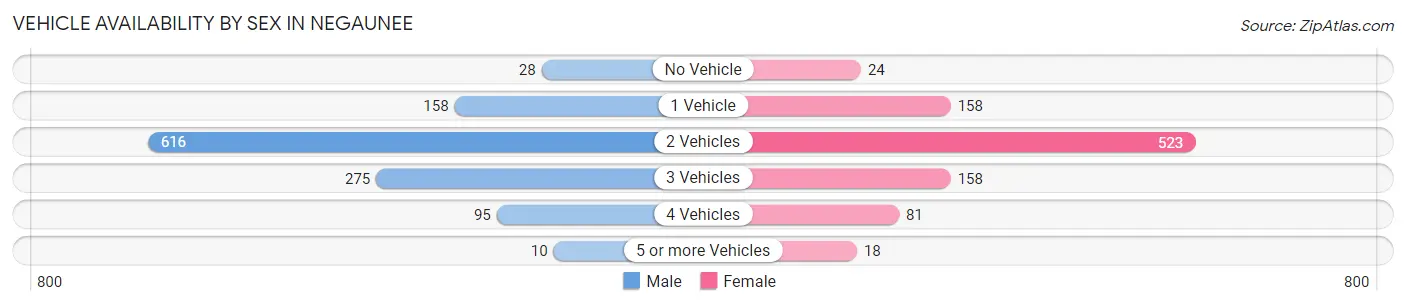
| Vehicles Available | Male | Female |
| No Vehicle | 28 (2.4%) | 24 (2.5%) |
| 1 Vehicle | 158 (13.4%) | 158 (16.4%) |
| 2 Vehicles | 616 (52.1%) | 523 (54.4%) |
| 3 Vehicles | 275 (23.3%) | 158 (16.4%) |
| 4 Vehicles | 95 (8.0%) | 81 (8.4%) |
| 5 or more Vehicles | 10 (0.9%) | 18 (1.9%) |
| Total | 1,182 (100.0%) | 962 (100.0%) |
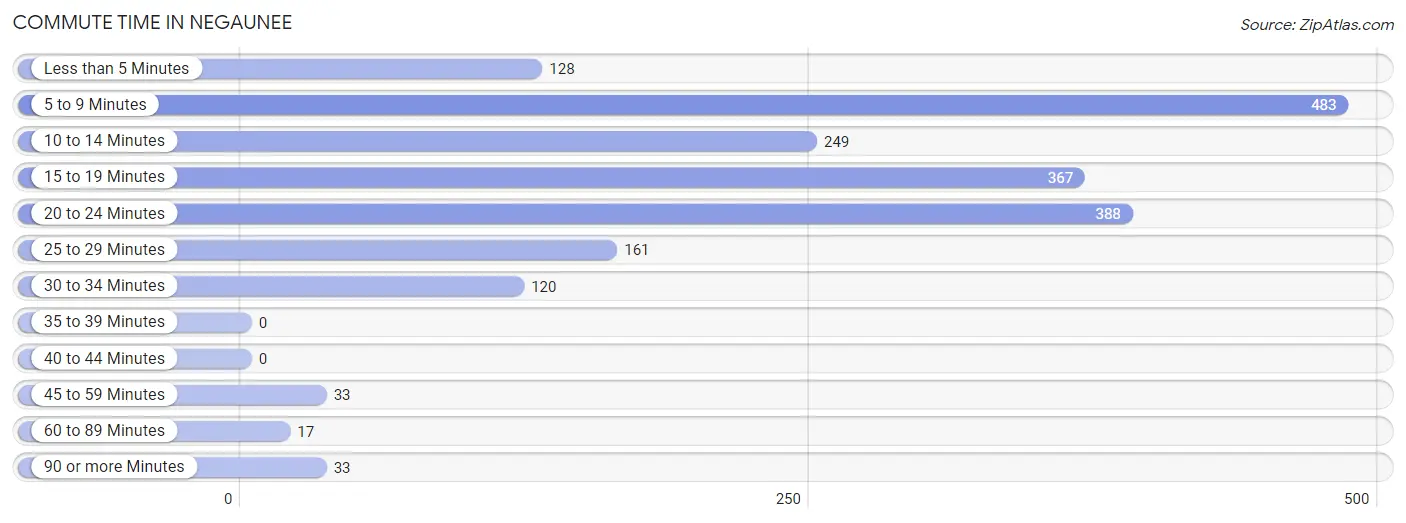
Commute Time in Negaunee
The most frequently occuring commute durations in Negaunee are 5 to 9 minutes (483 commuters, 24.4%), 20 to 24 minutes (388 commuters, 19.6%), and 15 to 19 minutes (367 commuters, 18.5%).
| Commute Time | # Commuters | % Commuters |
| Less than 5 Minutes | 128 | 6.5% |
| 5 to 9 Minutes | 483 | 24.4% |
| 10 to 14 Minutes | 249 | 12.6% |
| 15 to 19 Minutes | 367 | 18.5% |
| 20 to 24 Minutes | 388 | 19.6% |
| 25 to 29 Minutes | 161 | 8.1% |
| 30 to 34 Minutes | 120 | 6.1% |
| 35 to 39 Minutes | 0 | 0.0% |
| 40 to 44 Minutes | 0 | 0.0% |
| 45 to 59 Minutes | 33 | 1.7% |
| 60 to 89 Minutes | 17 | 0.9% |
| 90 or more Minutes | 33 | 1.7% |
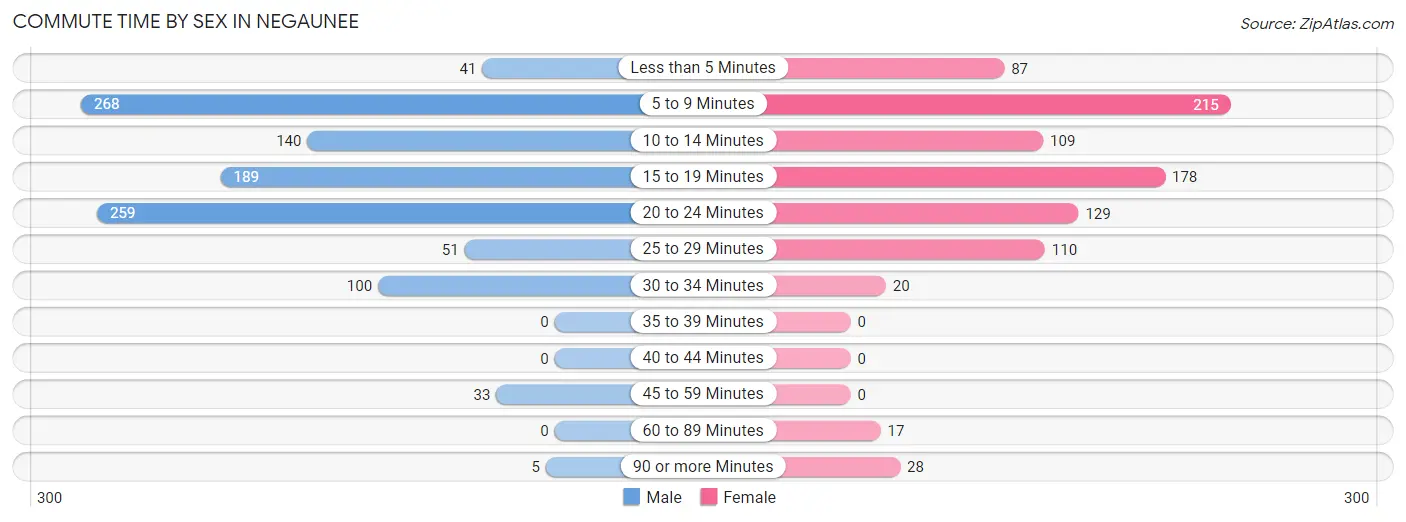
Commute Time by Sex in Negaunee
The most common commute times in Negaunee are 5 to 9 minutes (268 commuters, 24.7%) for males and 5 to 9 minutes (215 commuters, 24.1%) for females.
| Commute Time | Male | Female |
| Less than 5 Minutes | 41 (3.8%) | 87 (9.7%) |
| 5 to 9 Minutes | 268 (24.7%) | 215 (24.1%) |
| 10 to 14 Minutes | 140 (12.9%) | 109 (12.2%) |
| 15 to 19 Minutes | 189 (17.4%) | 178 (19.9%) |
| 20 to 24 Minutes | 259 (23.8%) | 129 (14.4%) |
| 25 to 29 Minutes | 51 (4.7%) | 110 (12.3%) |
| 30 to 34 Minutes | 100 (9.2%) | 20 (2.2%) |
| 35 to 39 Minutes | 0 (0.0%) | 0 (0.0%) |
| 40 to 44 Minutes | 0 (0.0%) | 0 (0.0%) |
| 45 to 59 Minutes | 33 (3.0%) | 0 (0.0%) |
| 60 to 89 Minutes | 0 (0.0%) | 17 (1.9%) |
| 90 or more Minutes | 5 (0.5%) | 28 (3.1%) |
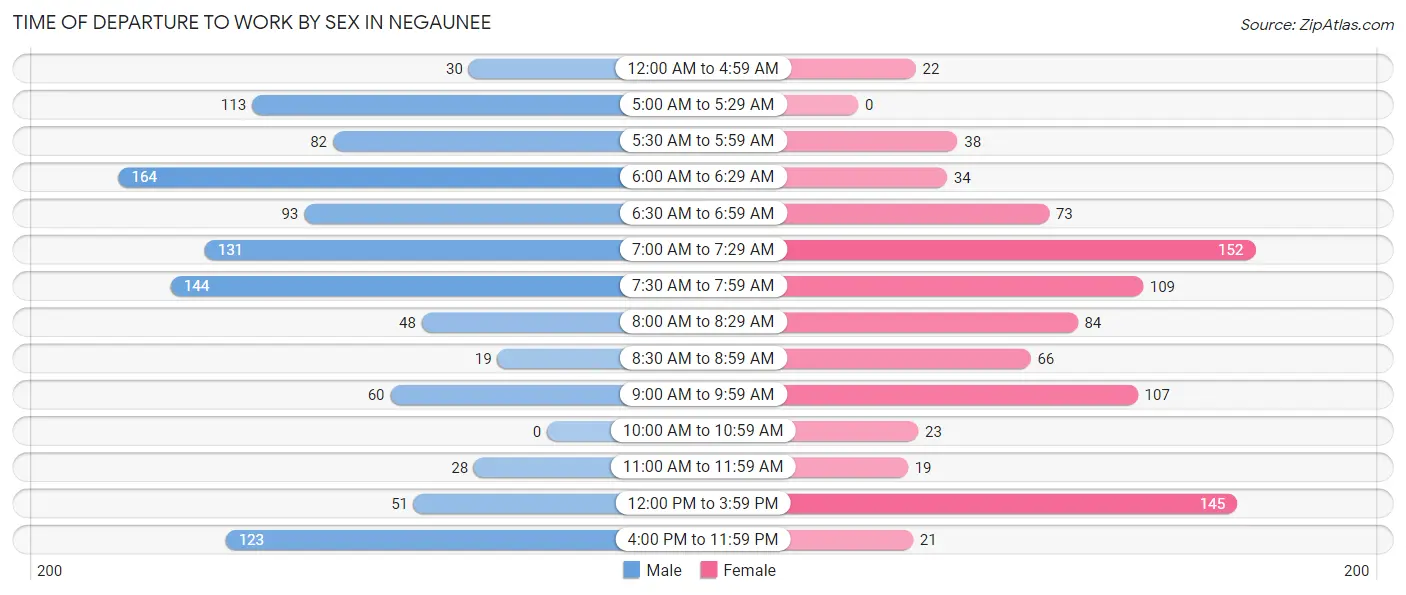
Time of Departure to Work by Sex in Negaunee
The most frequent times of departure to work in Negaunee are 6:00 AM to 6:29 AM (164, 15.1%) for males and 7:00 AM to 7:29 AM (152, 17.0%) for females.
| Time of Departure | Male | Female |
| 12:00 AM to 4:59 AM | 30 (2.8%) | 22 (2.5%) |
| 5:00 AM to 5:29 AM | 113 (10.4%) | 0 (0.0%) |
| 5:30 AM to 5:59 AM | 82 (7.5%) | 38 (4.3%) |
| 6:00 AM to 6:29 AM | 164 (15.1%) | 34 (3.8%) |
| 6:30 AM to 6:59 AM | 93 (8.6%) | 73 (8.2%) |
| 7:00 AM to 7:29 AM | 131 (12.1%) | 152 (17.0%) |
| 7:30 AM to 7:59 AM | 144 (13.3%) | 109 (12.2%) |
| 8:00 AM to 8:29 AM | 48 (4.4%) | 84 (9.4%) |
| 8:30 AM to 8:59 AM | 19 (1.8%) | 66 (7.4%) |
| 9:00 AM to 9:59 AM | 60 (5.5%) | 107 (12.0%) |
| 10:00 AM to 10:59 AM | 0 (0.0%) | 23 (2.6%) |
| 11:00 AM to 11:59 AM | 28 (2.6%) | 19 (2.1%) |
| 12:00 PM to 3:59 PM | 51 (4.7%) | 145 (16.2%) |
| 4:00 PM to 11:59 PM | 123 (11.3%) | 21 (2.4%) |
| Total | 1,086 (100.0%) | 893 (100.0%) |
Housing Occupancy in Negaunee
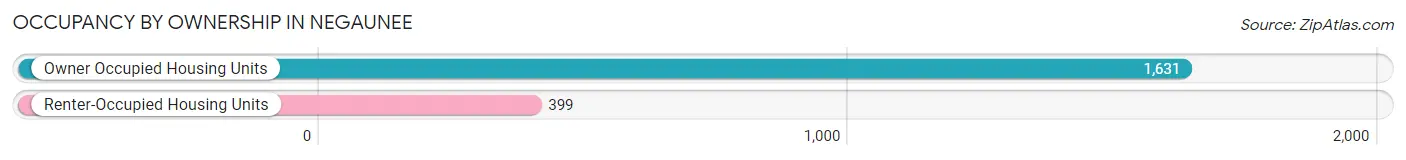
Occupancy by Ownership in Negaunee
Of the total 2,030 dwellings in Negaunee, owner-occupied units account for 1,631 (80.3%), while renter-occupied units make up 399 (19.7%).
| Occupancy | # Housing Units | % Housing Units |
| Owner Occupied Housing Units | 1,631 | 80.3% |
| Renter-Occupied Housing Units | 399 | 19.7% |
| Total Occupied Housing Units | 2,030 | 100.0% |
Occupancy by Household Size in Negaunee
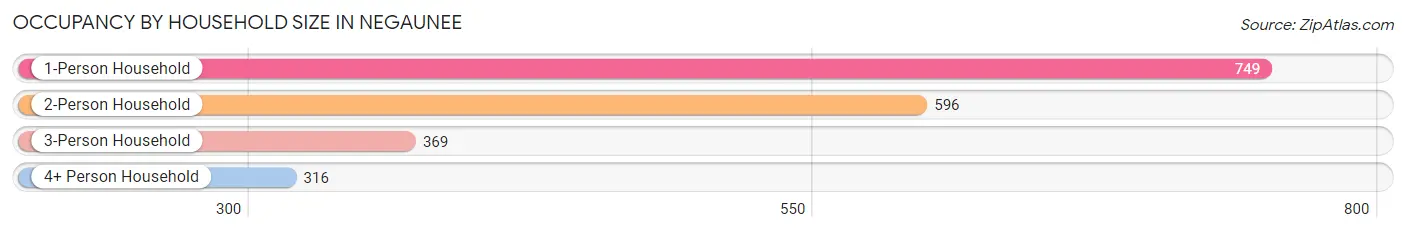
| Household Size | # Housing Units | % Housing Units |
| 1-Person Household | 749 | 36.9% |
| 2-Person Household | 596 | 29.4% |
| 3-Person Household | 369 | 18.2% |
| 4+ Person Household | 316 | 15.6% |
| Total Housing Units | 2,030 | 100.0% |
Occupancy by Ownership by Household Size in Negaunee
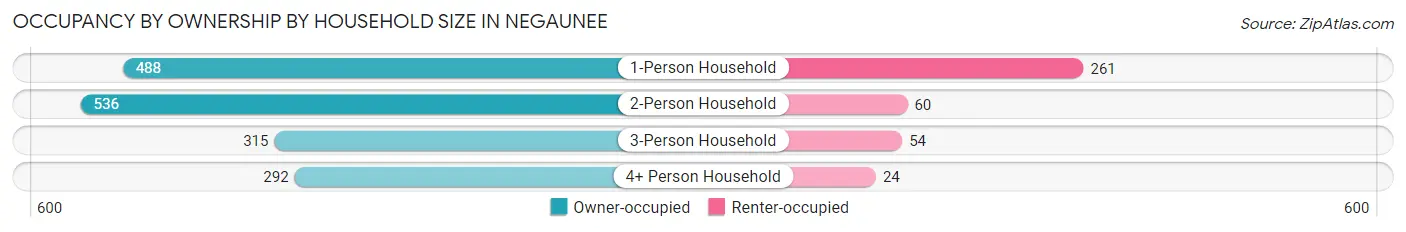
| Household Size | Owner-occupied | Renter-occupied |
| 1-Person Household | 488 (65.1%) | 261 (34.8%) |
| 2-Person Household | 536 (89.9%) | 60 (10.1%) |
| 3-Person Household | 315 (85.4%) | 54 (14.6%) |
| 4+ Person Household | 292 (92.4%) | 24 (7.6%) |
| Total Housing Units | 1,631 (80.3%) | 399 (19.7%) |
Occupancy by Educational Attainment in Negaunee
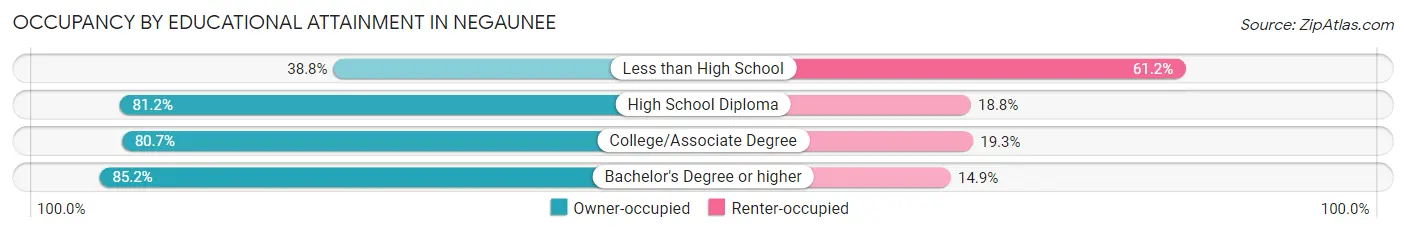
| Household Size | Owner-occupied | Renter-occupied |
| Less than High School | 38 (38.8%) | 60 (61.2%) |
| High School Diploma | 578 (81.2%) | 134 (18.8%) |
| College/Associate Degree | 436 (80.7%) | 104 (19.3%) |
| Bachelor's Degree or higher | 579 (85.2%) | 101 (14.8%) |
Occupancy by Age of Householder in Negaunee
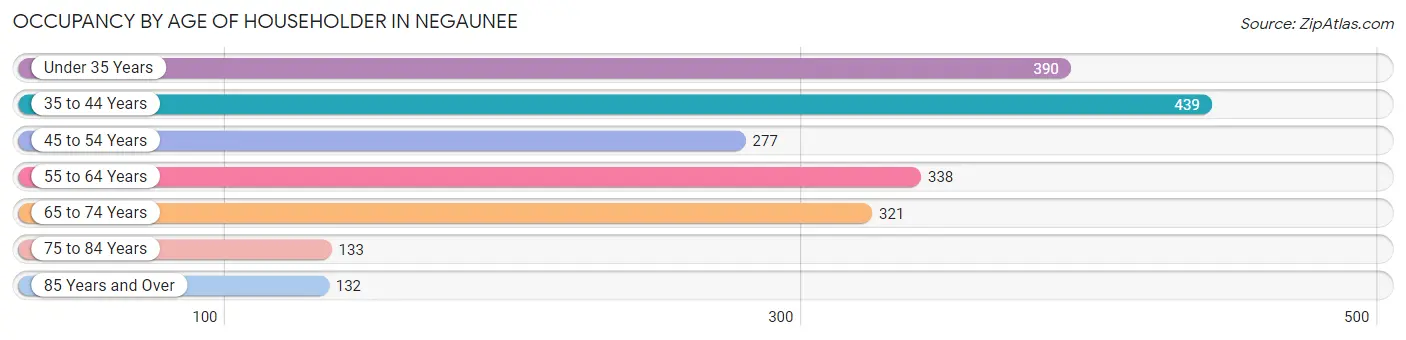
| Age Bracket | # Households | % Households |
| Under 35 Years | 390 | 19.2% |
| 35 to 44 Years | 439 | 21.6% |
| 45 to 54 Years | 277 | 13.7% |
| 55 to 64 Years | 338 | 16.7% |
| 65 to 74 Years | 321 | 15.8% |
| 75 to 84 Years | 133 | 6.6% |
| 85 Years and Over | 132 | 6.5% |
| Total | 2,030 | 100.0% |
Housing Finances in Negaunee
Median Income by Occupancy in Negaunee
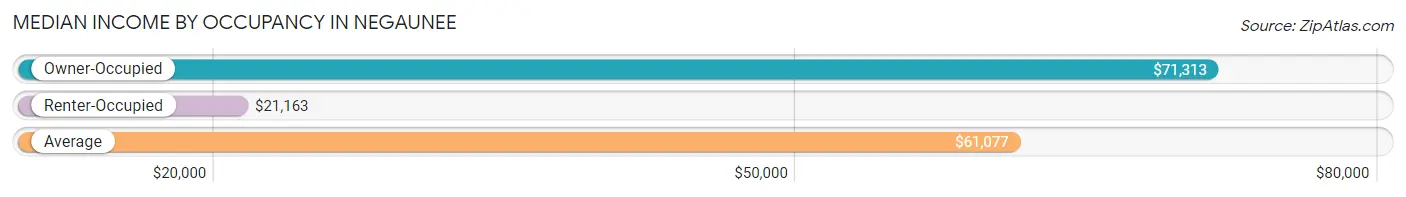
| Occupancy Type | # Households | Median Income |
| Owner-Occupied | 1,631 (80.3%) | $71,313 |
| Renter-Occupied | 399 (19.7%) | $21,163 |
| Average | 2,030 (100.0%) | $61,077 |
Occupancy by Householder Income Bracket in Negaunee
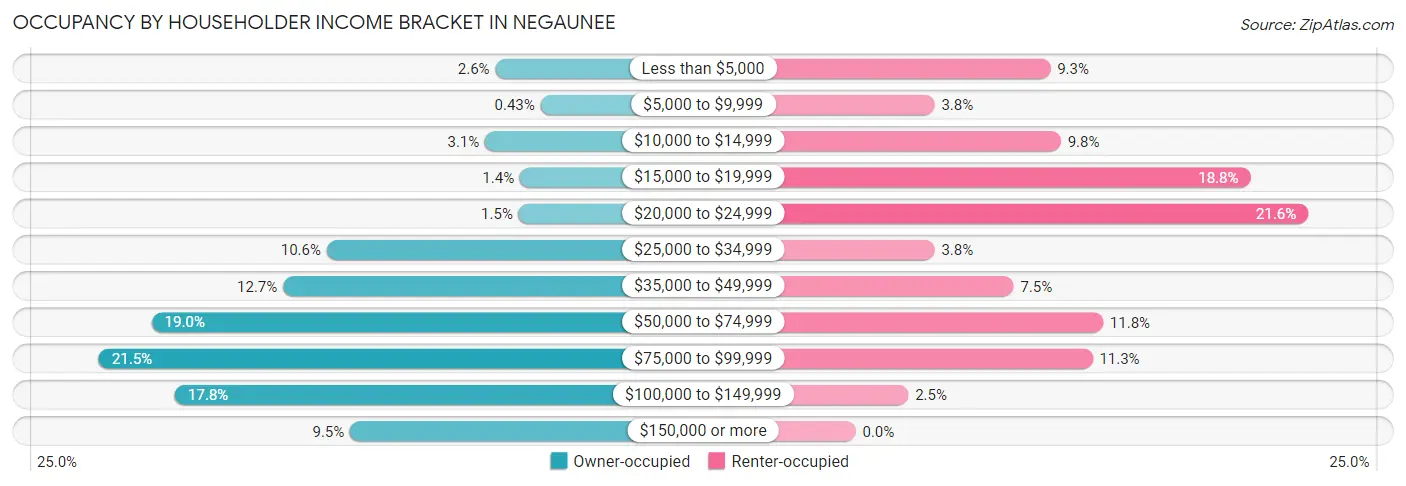
| Income Bracket | Owner-occupied | Renter-occupied |
| Less than $5,000 | 42 (2.6%) | 37 (9.3%) |
| $5,000 to $9,999 | 7 (0.4%) | 15 (3.8%) |
| $10,000 to $14,999 | 50 (3.1%) | 39 (9.8%) |
| $15,000 to $19,999 | 23 (1.4%) | 75 (18.8%) |
| $20,000 to $24,999 | 24 (1.5%) | 86 (21.5%) |
| $25,000 to $34,999 | 173 (10.6%) | 15 (3.8%) |
| $35,000 to $49,999 | 207 (12.7%) | 30 (7.5%) |
| $50,000 to $74,999 | 309 (19.0%) | 47 (11.8%) |
| $75,000 to $99,999 | 350 (21.5%) | 45 (11.3%) |
| $100,000 to $149,999 | 291 (17.8%) | 10 (2.5%) |
| $150,000 or more | 155 (9.5%) | 0 (0.0%) |
| Total | 1,631 (100.0%) | 399 (100.0%) |
Monthly Housing Cost Tiers in Negaunee
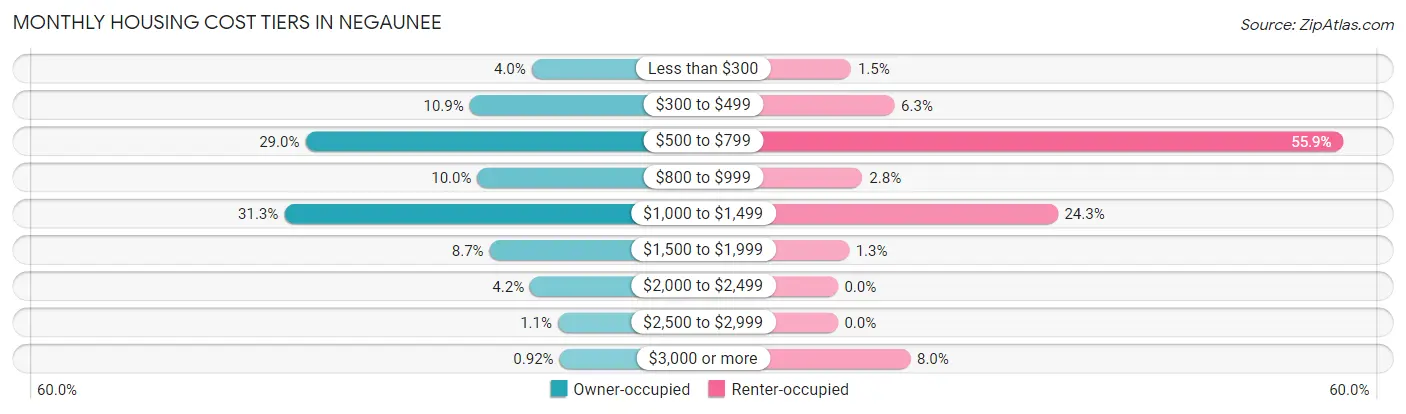
| Monthly Cost | Owner-occupied | Renter-occupied |
| Less than $300 | 65 (4.0%) | 6 (1.5%) |
| $300 to $499 | 177 (10.8%) | 25 (6.3%) |
| $500 to $799 | 473 (29.0%) | 223 (55.9%) |
| $800 to $999 | 163 (10.0%) | 11 (2.8%) |
| $1,000 to $1,499 | 511 (31.3%) | 97 (24.3%) |
| $1,500 to $1,999 | 141 (8.6%) | 5 (1.3%) |
| $2,000 to $2,499 | 68 (4.2%) | 0 (0.0%) |
| $2,500 to $2,999 | 18 (1.1%) | 0 (0.0%) |
| $3,000 or more | 15 (0.9%) | 32 (8.0%) |
| Total | 1,631 (100.0%) | 399 (100.0%) |
Physical Housing Characteristics in Negaunee
Housing Structures in Negaunee
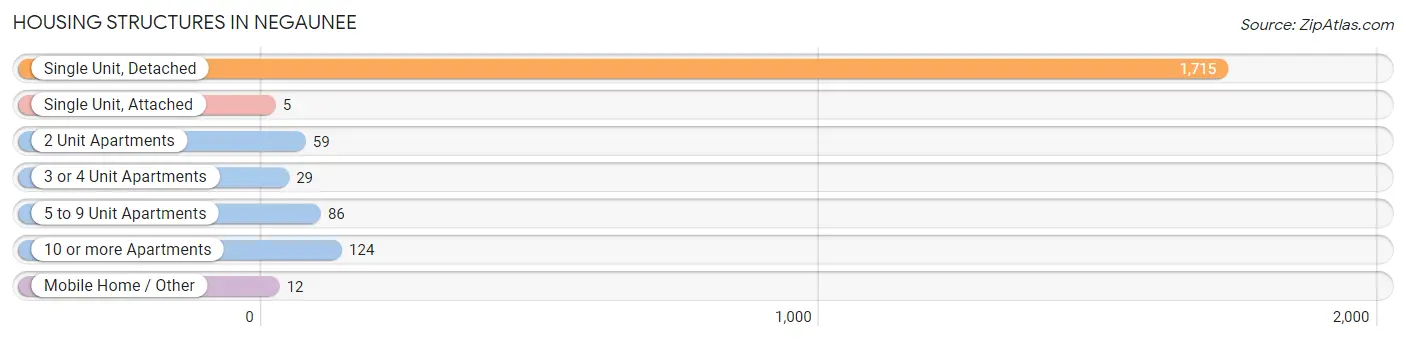
| Structure Type | # Housing Units | % Housing Units |
| Single Unit, Detached | 1,715 | 84.5% |
| Single Unit, Attached | 5 | 0.3% |
| 2 Unit Apartments | 59 | 2.9% |
| 3 or 4 Unit Apartments | 29 | 1.4% |
| 5 to 9 Unit Apartments | 86 | 4.2% |
| 10 or more Apartments | 124 | 6.1% |
| Mobile Home / Other | 12 | 0.6% |
| Total | 2,030 | 100.0% |
Housing Structures by Occupancy in Negaunee
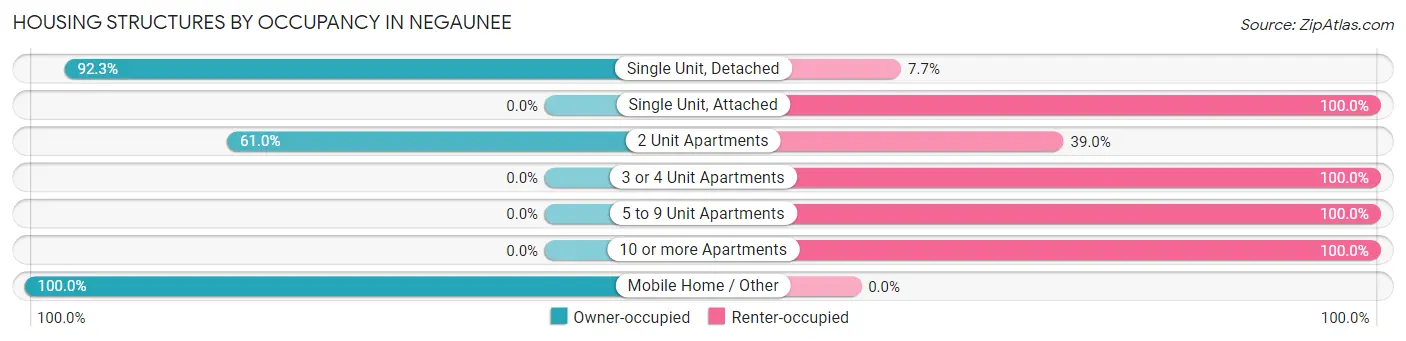
| Structure Type | Owner-occupied | Renter-occupied |
| Single Unit, Detached | 1,583 (92.3%) | 132 (7.7%) |
| Single Unit, Attached | 0 (0.0%) | 5 (100.0%) |
| 2 Unit Apartments | 36 (61.0%) | 23 (39.0%) |
| 3 or 4 Unit Apartments | 0 (0.0%) | 29 (100.0%) |
| 5 to 9 Unit Apartments | 0 (0.0%) | 86 (100.0%) |
| 10 or more Apartments | 0 (0.0%) | 124 (100.0%) |
| Mobile Home / Other | 12 (100.0%) | 0 (0.0%) |
| Total | 1,631 (80.3%) | 399 (19.7%) |
Housing Structures by Number of Rooms in Negaunee
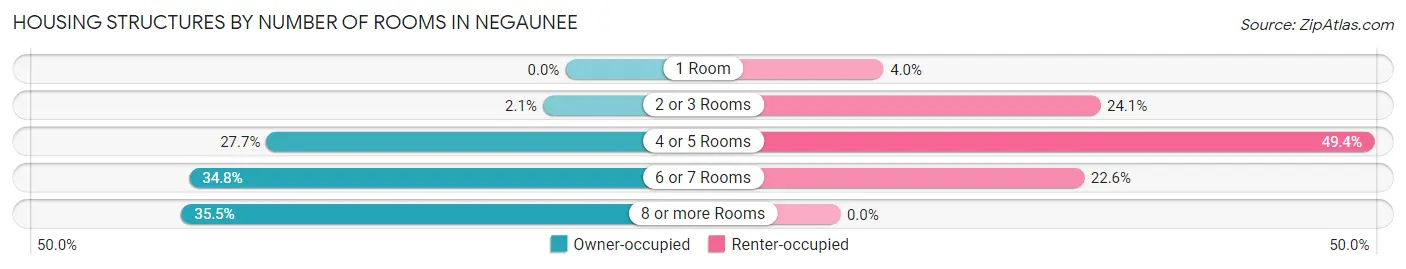
| Number of Rooms | Owner-occupied | Renter-occupied |
| 1 Room | 0 (0.0%) | 16 (4.0%) |
| 2 or 3 Rooms | 34 (2.1%) | 96 (24.1%) |
| 4 or 5 Rooms | 451 (27.7%) | 197 (49.4%) |
| 6 or 7 Rooms | 567 (34.8%) | 90 (22.6%) |
| 8 or more Rooms | 579 (35.5%) | 0 (0.0%) |
| Total | 1,631 (100.0%) | 399 (100.0%) |
Housing Structure by Heating Type in Negaunee
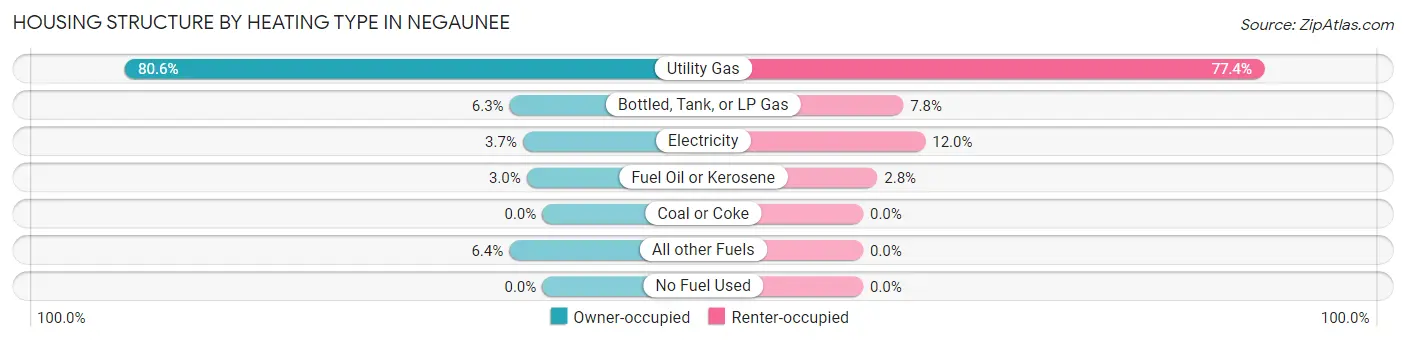
| Heating Type | Owner-occupied | Renter-occupied |
| Utility Gas | 1,314 (80.6%) | 309 (77.4%) |
| Bottled, Tank, or LP Gas | 103 (6.3%) | 31 (7.8%) |
| Electricity | 61 (3.7%) | 48 (12.0%) |
| Fuel Oil or Kerosene | 49 (3.0%) | 11 (2.8%) |
| Coal or Coke | 0 (0.0%) | 0 (0.0%) |
| All other Fuels | 104 (6.4%) | 0 (0.0%) |
| No Fuel Used | 0 (0.0%) | 0 (0.0%) |
| Total | 1,631 (100.0%) | 399 (100.0%) |
Household Vehicle Usage in Negaunee
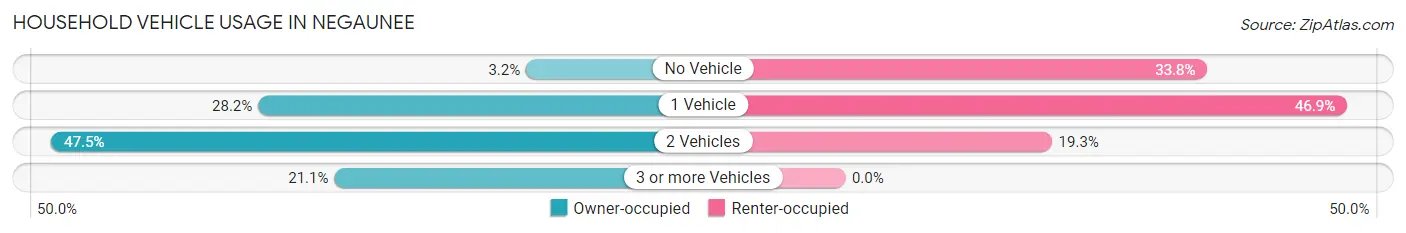
| Vehicles per Household | Owner-occupied | Renter-occupied |
| No Vehicle | 52 (3.2%) | 135 (33.8%) |
| 1 Vehicle | 460 (28.2%) | 187 (46.9%) |
| 2 Vehicles | 775 (47.5%) | 77 (19.3%) |
| 3 or more Vehicles | 344 (21.1%) | 0 (0.0%) |
| Total | 1,631 (100.0%) | 399 (100.0%) |
Real Estate & Mortgages in Negaunee
Real Estate and Mortgage Overview in Negaunee
| Characteristic | Without Mortgage | With Mortgage |
| Housing Units | 582 | 1,049 |
| Median Property Value | $138,300 | $144,700 |
| Median Household Income | $60,652 | $107 |
| Monthly Housing Costs | $545 | $15 |
| Real Estate Taxes | $1,960 | $26 |
Property Value by Mortgage Status in Negaunee
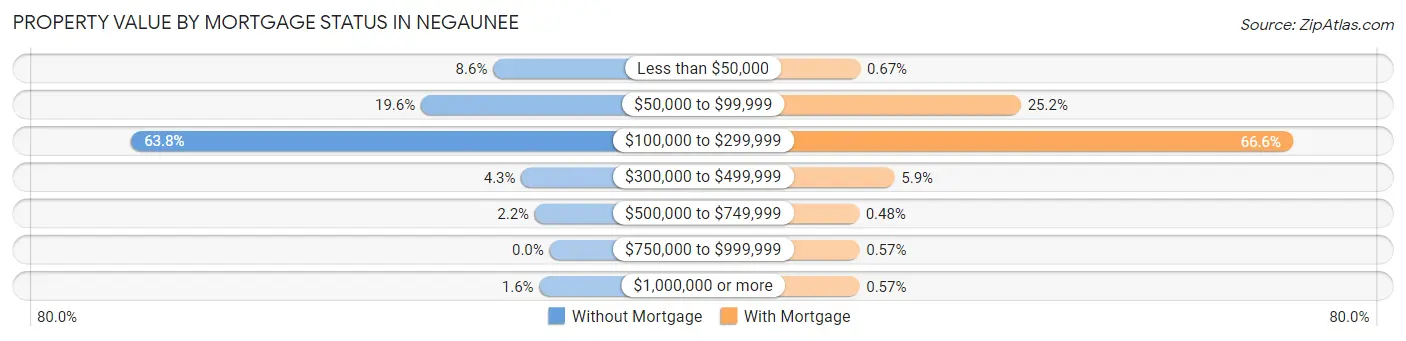
| Property Value | Without Mortgage | With Mortgage |
| Less than $50,000 | 50 (8.6%) | 7 (0.7%) |
| $50,000 to $99,999 | 114 (19.6%) | 264 (25.2%) |
| $100,000 to $299,999 | 371 (63.7%) | 699 (66.6%) |
| $300,000 to $499,999 | 25 (4.3%) | 62 (5.9%) |
| $500,000 to $749,999 | 13 (2.2%) | 5 (0.5%) |
| $750,000 to $999,999 | 0 (0.0%) | 6 (0.6%) |
| $1,000,000 or more | 9 (1.5%) | 6 (0.6%) |
| Total | 582 (100.0%) | 1,049 (100.0%) |
Household Income by Mortgage Status in Negaunee
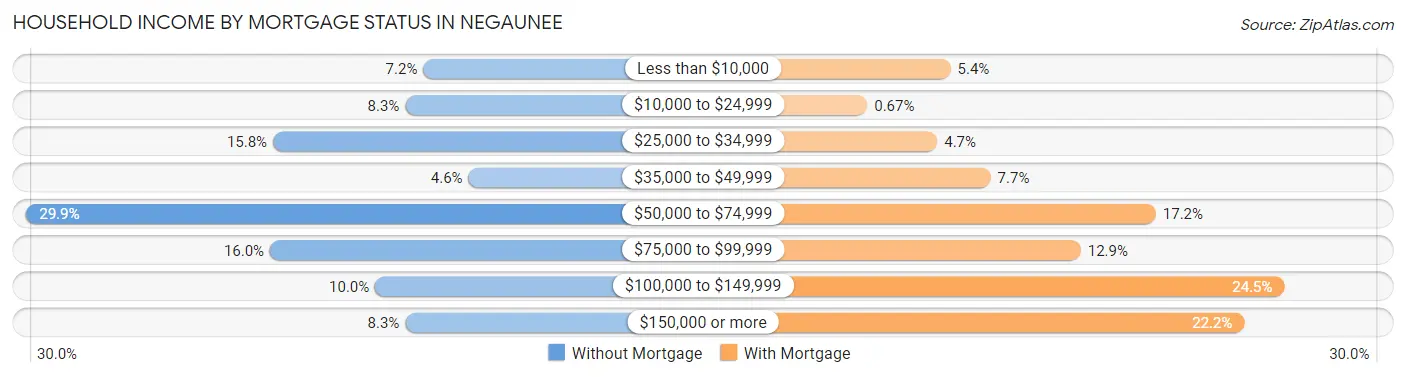
| Household Income | Without Mortgage | With Mortgage |
| Less than $10,000 | 42 (7.2%) | 57 (5.4%) |
| $10,000 to $24,999 | 48 (8.3%) | 7 (0.7%) |
| $25,000 to $34,999 | 92 (15.8%) | 49 (4.7%) |
| $35,000 to $49,999 | 27 (4.6%) | 81 (7.7%) |
| $50,000 to $74,999 | 174 (29.9%) | 180 (17.2%) |
| $75,000 to $99,999 | 93 (16.0%) | 135 (12.9%) |
| $100,000 to $149,999 | 58 (10.0%) | 257 (24.5%) |
| $150,000 or more | 48 (8.3%) | 233 (22.2%) |
| Total | 582 (100.0%) | 1,049 (100.0%) |
Property Value to Household Income Ratio in Negaunee
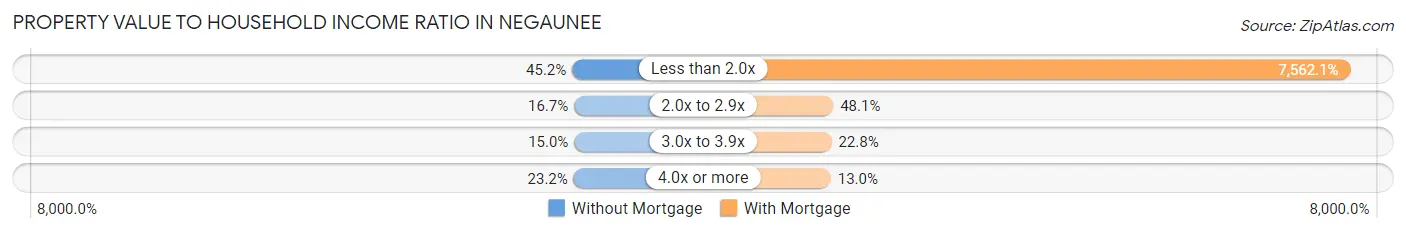
| Value-to-Income Ratio | Without Mortgage | With Mortgage |
| Less than 2.0x | 263 (45.2%) | 79,326 (7,562.1%) |
| 2.0x to 2.9x | 97 (16.7%) | 504 (48.0%) |
| 3.0x to 3.9x | 87 (14.9%) | 239 (22.8%) |
| 4.0x or more | 135 (23.2%) | 136 (13.0%) |
| Total | 582 (100.0%) | 1,049 (100.0%) |
Real Estate Taxes by Mortgage Status in Negaunee
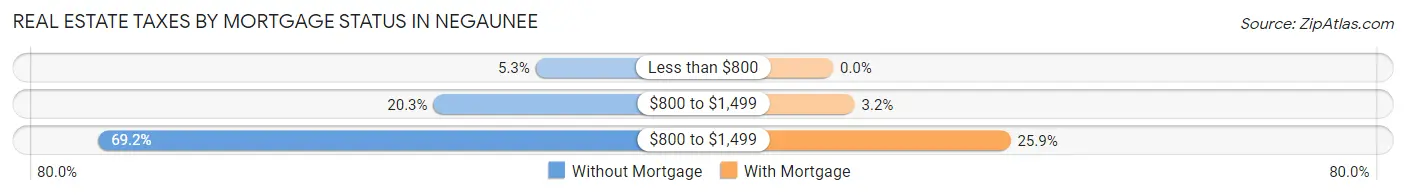
| Property Taxes | Without Mortgage | With Mortgage |
| Less than $800 | 31 (5.3%) | 0 (0.0%) |
| $800 to $1,499 | 118 (20.3%) | 33 (3.2%) |
| $800 to $1,499 | 403 (69.2%) | 272 (25.9%) |
| Total | 582 (100.0%) | 1,049 (100.0%) |
Health & Disability in Negaunee
Health Insurance Coverage by Age in Negaunee
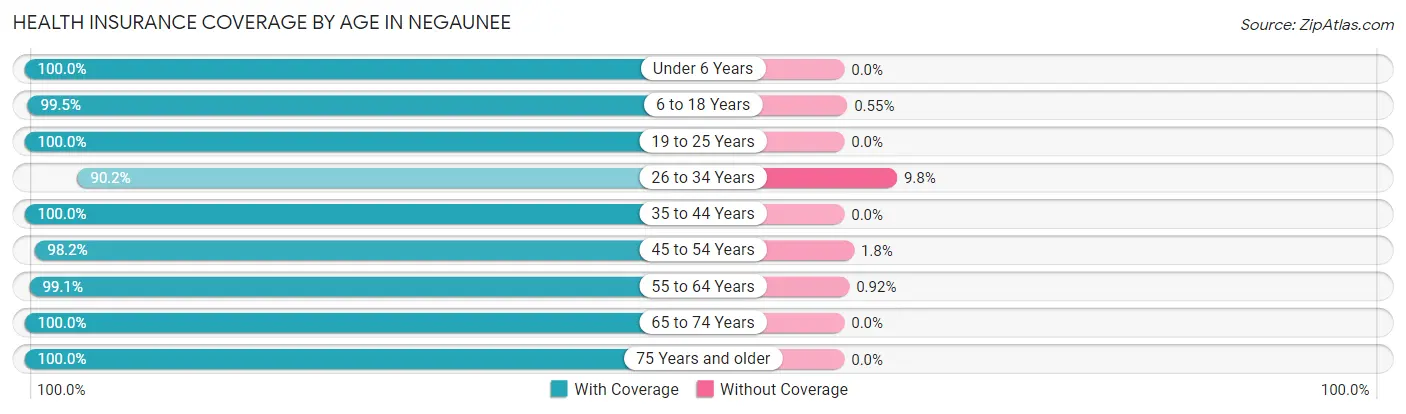
| Age Bracket | With Coverage | Without Coverage |
| Under 6 Years | 317 (100.0%) | 0 (0.0%) |
| 6 to 18 Years | 897 (99.5%) | 5 (0.5%) |
| 19 to 25 Years | 325 (100.0%) | 0 (0.0%) |
| 26 to 34 Years | 468 (90.2%) | 51 (9.8%) |
| 35 to 44 Years | 788 (100.0%) | 0 (0.0%) |
| 45 to 54 Years | 379 (98.2%) | 7 (1.8%) |
| 55 to 64 Years | 541 (99.1%) | 5 (0.9%) |
| 65 to 74 Years | 463 (100.0%) | 0 (0.0%) |
| 75 Years and older | 305 (100.0%) | 0 (0.0%) |
| Total | 4,483 (98.5%) | 68 (1.5%) |
Health Insurance Coverage by Citizenship Status in Negaunee
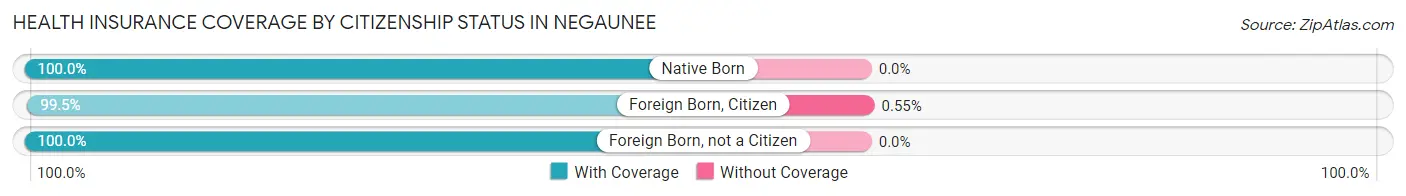
| Citizenship Status | With Coverage | Without Coverage |
| Native Born | 317 (100.0%) | 0 (0.0%) |
| Foreign Born, Citizen | 897 (99.5%) | 5 (0.5%) |
| Foreign Born, not a Citizen | 325 (100.0%) | 0 (0.0%) |
Health Insurance Coverage by Household Income in Negaunee
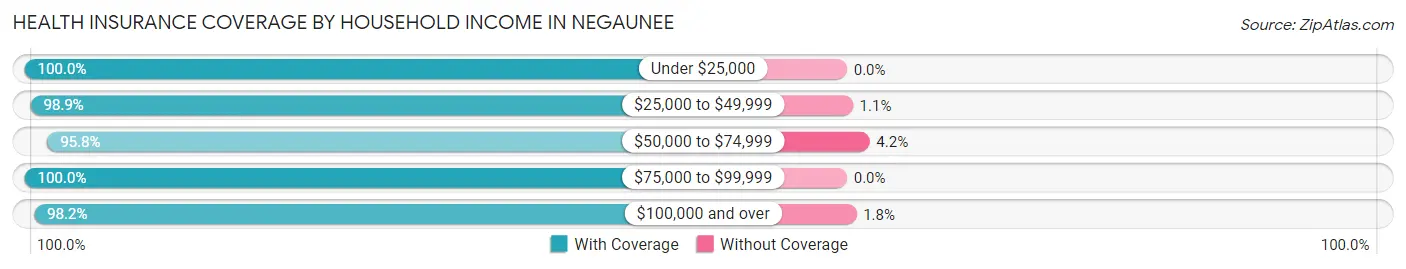
| Household Income | With Coverage | Without Coverage |
| Under $25,000 | 592 (100.0%) | 0 (0.0%) |
| $25,000 to $49,999 | 629 (98.9%) | 7 (1.1%) |
| $50,000 to $74,999 | 814 (95.8%) | 36 (4.2%) |
| $75,000 to $99,999 | 1,051 (100.0%) | 0 (0.0%) |
| $100,000 and over | 1,391 (98.2%) | 25 (1.8%) |
Public vs Private Health Insurance Coverage by Age in Negaunee
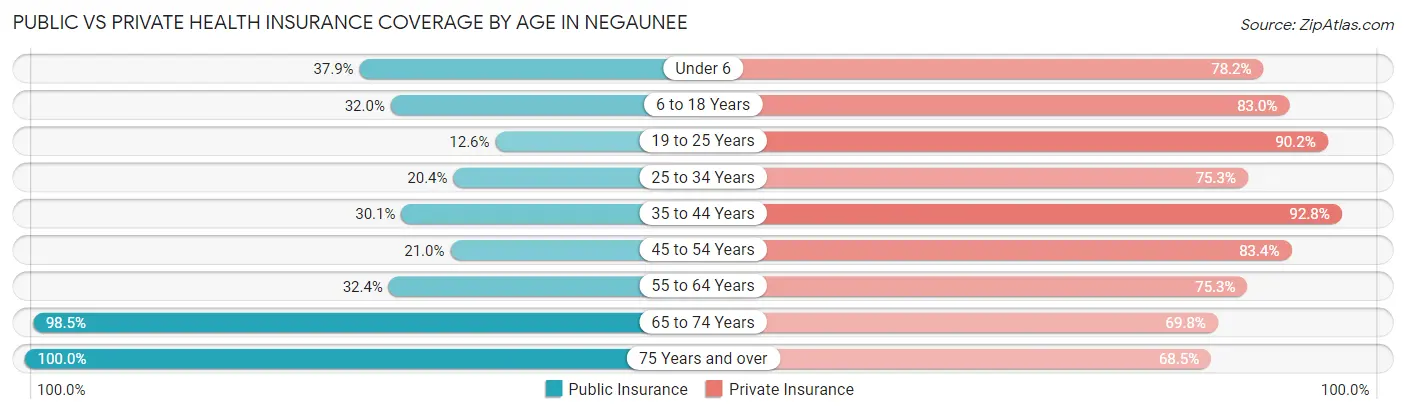
| Age Bracket | Public Insurance | Private Insurance |
| Under 6 | 120 (37.9%) | 248 (78.2%) |
| 6 to 18 Years | 289 (32.0%) | 749 (83.0%) |
| 19 to 25 Years | 41 (12.6%) | 293 (90.1%) |
| 25 to 34 Years | 106 (20.4%) | 391 (75.3%) |
| 35 to 44 Years | 237 (30.1%) | 731 (92.8%) |
| 45 to 54 Years | 81 (21.0%) | 322 (83.4%) |
| 55 to 64 Years | 177 (32.4%) | 411 (75.3%) |
| 65 to 74 Years | 456 (98.5%) | 323 (69.8%) |
| 75 Years and over | 305 (100.0%) | 209 (68.5%) |
| Total | 1,812 (39.8%) | 3,677 (80.8%) |
Disability Status by Sex by Age in Negaunee
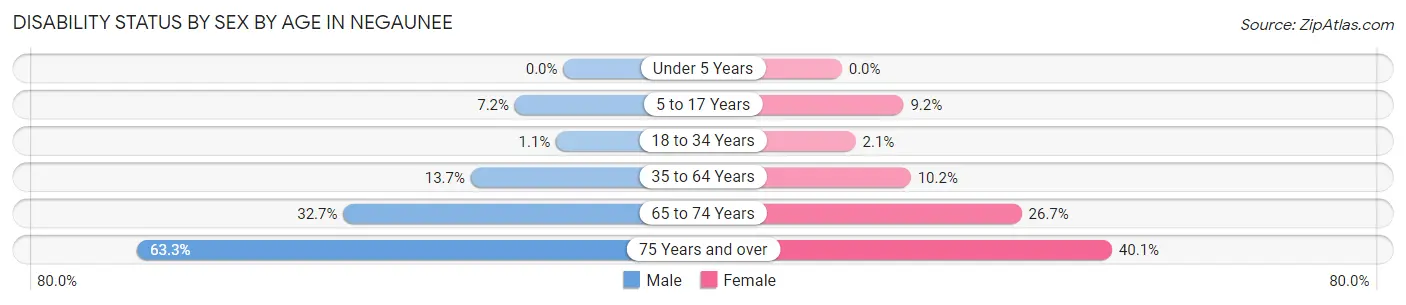
| Age Bracket | Male | Female |
| Under 5 Years | 0 (0.0%) | 0 (0.0%) |
| 5 to 17 Years | 35 (7.2%) | 36 (9.2%) |
| 18 to 34 Years | 5 (1.1%) | 9 (2.1%) |
| 35 to 64 Years | 129 (13.7%) | 80 (10.2%) |
| 65 to 74 Years | 84 (32.7%) | 55 (26.7%) |
| 75 Years and over | 81 (63.3%) | 71 (40.1%) |
Disability Class by Sex by Age in Negaunee
Disability Class: Hearing Difficulty
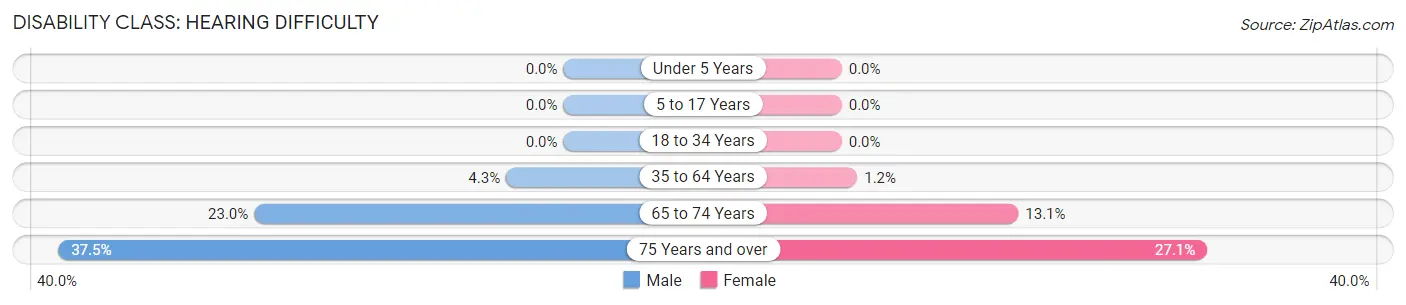
| Age Bracket | Male | Female |
| Under 5 Years | 0 (0.0%) | 0 (0.0%) |
| 5 to 17 Years | 0 (0.0%) | 0 (0.0%) |
| 18 to 34 Years | 0 (0.0%) | 0 (0.0%) |
| 35 to 64 Years | 40 (4.3%) | 9 (1.1%) |
| 65 to 74 Years | 59 (23.0%) | 27 (13.1%) |
| 75 Years and over | 48 (37.5%) | 48 (27.1%) |
Disability Class: Vision Difficulty
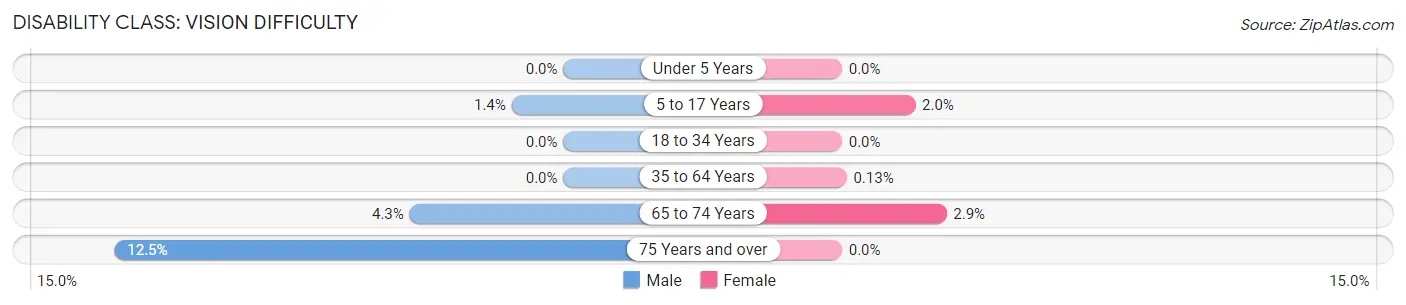
| Age Bracket | Male | Female |
| Under 5 Years | 0 (0.0%) | 0 (0.0%) |
| 5 to 17 Years | 7 (1.4%) | 8 (2.0%) |
| 18 to 34 Years | 0 (0.0%) | 0 (0.0%) |
| 35 to 64 Years | 0 (0.0%) | 1 (0.1%) |
| 65 to 74 Years | 11 (4.3%) | 6 (2.9%) |
| 75 Years and over | 16 (12.5%) | 0 (0.0%) |
Disability Class: Cognitive Difficulty
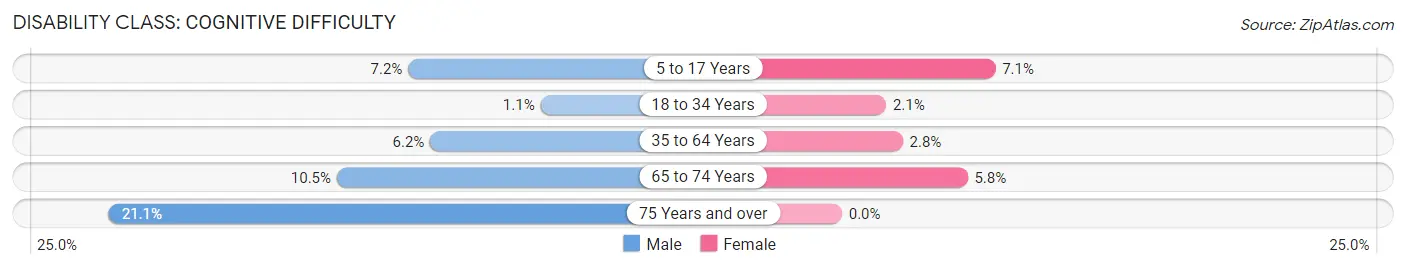
| Age Bracket | Male | Female |
| 5 to 17 Years | 35 (7.2%) | 28 (7.1%) |
| 18 to 34 Years | 5 (1.1%) | 9 (2.1%) |
| 35 to 64 Years | 58 (6.2%) | 22 (2.8%) |
| 65 to 74 Years | 27 (10.5%) | 12 (5.8%) |
| 75 Years and over | 27 (21.1%) | 0 (0.0%) |
Disability Class: Ambulatory Difficulty
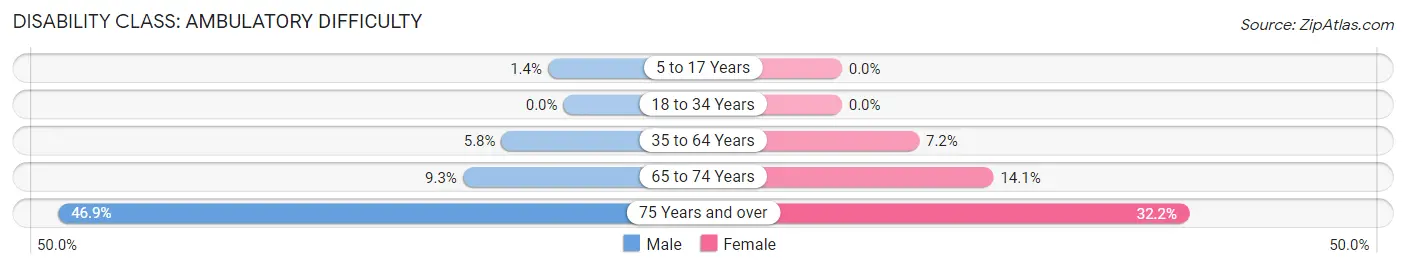
| Age Bracket | Male | Female |
| 5 to 17 Years | 7 (1.4%) | 0 (0.0%) |
| 18 to 34 Years | 0 (0.0%) | 0 (0.0%) |
| 35 to 64 Years | 54 (5.8%) | 56 (7.2%) |
| 65 to 74 Years | 24 (9.3%) | 29 (14.1%) |
| 75 Years and over | 60 (46.9%) | 57 (32.2%) |
Disability Class: Self-Care Difficulty
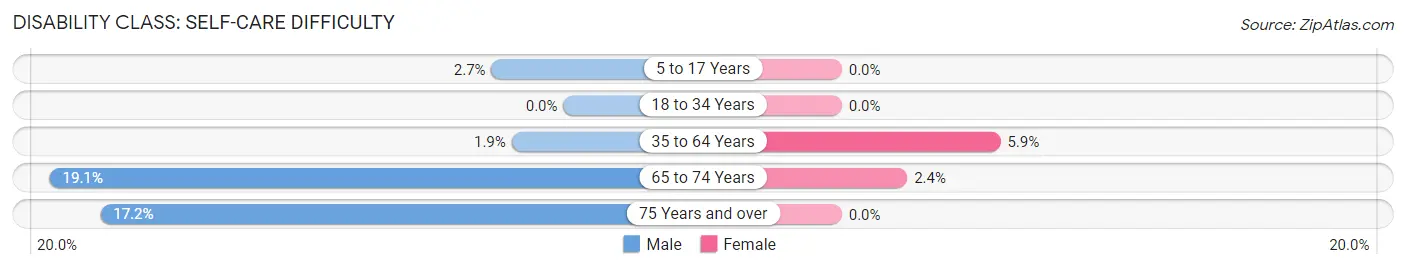
| Age Bracket | Male | Female |
| 5 to 17 Years | 13 (2.7%) | 0 (0.0%) |
| 18 to 34 Years | 0 (0.0%) | 0 (0.0%) |
| 35 to 64 Years | 18 (1.9%) | 46 (5.9%) |
| 65 to 74 Years | 49 (19.1%) | 5 (2.4%) |
| 75 Years and over | 22 (17.2%) | 0 (0.0%) |
Technology Access in Negaunee
Computing Device Access in Negaunee
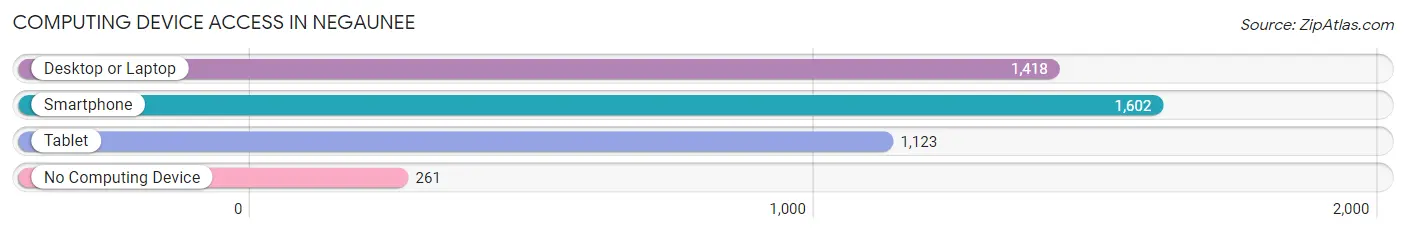
| Device Type | # Households | % Households |
| Desktop or Laptop | 1,418 | 69.9% |
| Smartphone | 1,602 | 78.9% |
| Tablet | 1,123 | 55.3% |
| No Computing Device | 261 | 12.9% |
| Total | 2,030 | 100.0% |
Internet Access in Negaunee
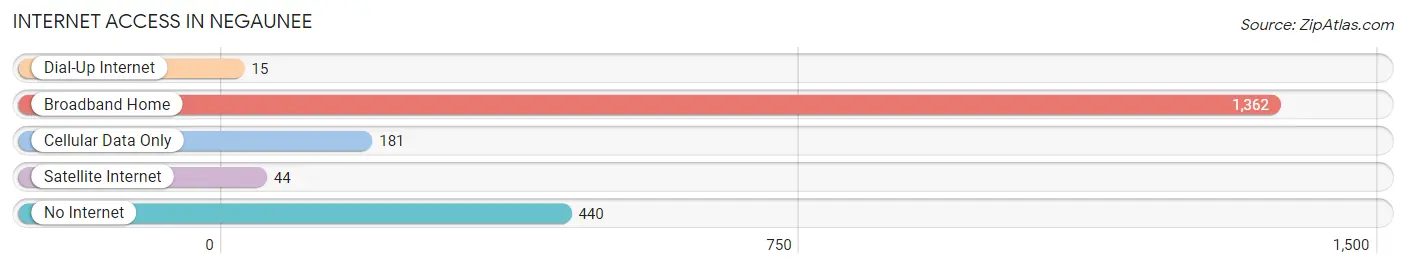
| Internet Type | # Households | % Households |
| Dial-Up Internet | 15 | 0.7% |
| Broadband Home | 1,362 | 67.1% |
| Cellular Data Only | 181 | 8.9% |
| Satellite Internet | 44 | 2.2% |
| No Internet | 440 | 21.7% |
| Total | 2,030 | 100.0% |
Negaunee Summary
History
The city of Negaunee, Michigan is located in the Upper Peninsula of Michigan and is part of Marquette County. The city was founded in 1868 and was originally known as Negauneeville. The name was changed to Negaunee in 1871. The city was founded by a group of miners who were looking for iron ore. The city quickly grew and became a major center for iron ore mining.
The city was also home to a number of other industries, including lumber, paper, and textiles. The city was also home to a number of immigrants, including Finnish, Swedish, and Italian immigrants. These immigrants helped to shape the culture of the city and the surrounding area.
The city was also home to a number of important historical events. In 1871, the first public school in the city was established. In 1873, the first public library in the city was established. In 1876, the first newspaper in the city was established.
In the late 19th century, the city was home to a number of important businesses, including the Negaunee Iron Company, the Negaunee Lumber Company, and the Negaunee Paper Company. These businesses helped to shape the economy of the city and the surrounding area.
The city was also home to a number of important events in the early 20th century. In 1908, the first hospital in the city was established. In 1910, the first movie theater in the city was established. In 1912, the first bank in the city was established.
Geography
Negaunee is located in the Upper Peninsula of Michigan. The city is located in the center of Marquette County and is bordered by the cities of Ishpeming, Gwinn, and Marquette. The city is located on the shores of Lake Superior and is surrounded by forests and hills.
The city has a total area of 4.2 square miles, of which 4.1 square miles is land and 0.1 square miles is water. The city has a humid continental climate, with cold winters and warm summers.
Economy
The economy of Negaunee is largely based on the mining industry. The city is home to a number of iron ore mines, as well as other mining operations. The city is also home to a number of other industries, including lumber, paper, and textiles.
The city is also home to a number of businesses, including restaurants, retail stores, and hotels. The city is also home to a number of educational institutions, including Northern Michigan University and the Negaunee Public Schools.
Demographics
As of the 2010 census, the city of Negaunee had a population of 4,837. The racial makeup of the city was 97.2% White, 0.7% African American, 0.3% Native American, 0.3% Asian, 0.1% Pacific Islander, 0.3% from other races, and 1.2% from two or more races. Hispanic or Latino of any race were 1.2% of the population.
The median income for a household in the city was $37,917, and the median income for a family was $45,938. The per capita income for the city was $19,945. About 11.2% of families and 14.2% of the population were below the poverty line, including 19.2% of those under age 18 and 8.2% of those age 65 or over.
Common Questions
What is Per Capita Income in Negaunee?
Per Capita income in Negaunee is $30,977.
What is the Median Family Income in Negaunee?
Median Family Income in Negaunee is $83,412.
What is the Median Household income in Negaunee?
Median Household Income in Negaunee is $61,077.
What is Income or Wage Gap in Negaunee?
Income or Wage Gap in Negaunee is 31.3%.
Women in Negaunee earn 68.7 cents for every dollar earned by a man.
What is Inequality or Gini Index in Negaunee?
Inequality or Gini Index in Negaunee is 0.39.
What is the Total Population of Negaunee?
Total Population of Negaunee is 4,650.
What is the Total Male Population of Negaunee?
Total Male Population of Negaunee is 2,392.
What is the Total Female Population of Negaunee?
Total Female Population of Negaunee is 2,258.
What is the Ratio of Males per 100 Females in Negaunee?
There are 105.93 Males per 100 Females in Negaunee.
What is the Ratio of Females per 100 Males in Negaunee?
There are 94.40 Females per 100 Males in Negaunee.
What is the Median Population Age in Negaunee?
Median Population Age in Negaunee is 37.0 Years.
What is the Average Family Size in Negaunee
Average Family Size in Negaunee is 3.0 People.
What is the Average Household Size in Negaunee
Average Household Size in Negaunee is 2.2 People.
How Large is the Labor Force in Negaunee?
There are 2,225 People in the Labor Forcein in Negaunee.
What is the Percentage of People in the Labor Force in Negaunee?
62.5% of People are in the Labor Force in Negaunee.
What is the Unemployment Rate in Negaunee?
Unemployment Rate in Negaunee is 2.7%.