Nashville, MI Map & Demographics
Nashville Map
Nashville Overview
$27,831
PER CAPITA INCOME
$58,750
AVG FAMILY INCOME
$50,938
AVG HOUSEHOLD INCOME
43.3%
WAGE / INCOME GAP [ % ]
56.7¢/ $1
WAGE / INCOME GAP [ $ ]
0.38
INEQUALITY / GINI INDEX
1,440
TOTAL POPULATION
735
MALE POPULATION
705
FEMALE POPULATION
104.26
MALES / 100 FEMALES
95.92
FEMALES / 100 MALES
48.9
MEDIAN AGE
2.9
AVG FAMILY SIZE
2.4
AVG HOUSEHOLD SIZE
719
LABOR FORCE [ PEOPLE ]
57.0%
PERCENT IN LABOR FORCE
4.2%
UNEMPLOYMENT RATE
Nashville Zip Codes
Income in Nashville
Income Overview in Nashville
Per Capita Income in Nashville is $27,831, while median incomes of families and households are $58,750 and $50,938 respectively.
| Characteristic | Number | Measure |
| Per Capita Income | 1,440 | $27,831 |
| Median Family Income | 385 | $58,750 |
| Mean Family Income | 385 | $68,781 |
| Median Household Income | 606 | $50,938 |
| Mean Household Income | 606 | $57,023 |
| Income Deficit | 385 | $0 |
| Wage / Income Gap (%) | 1,440 | 43.29% |
| Wage / Income Gap ($) | 1,440 | 56.71¢ per $1 |
| Gini / Inequality Index | 1,440 | 0.38 |
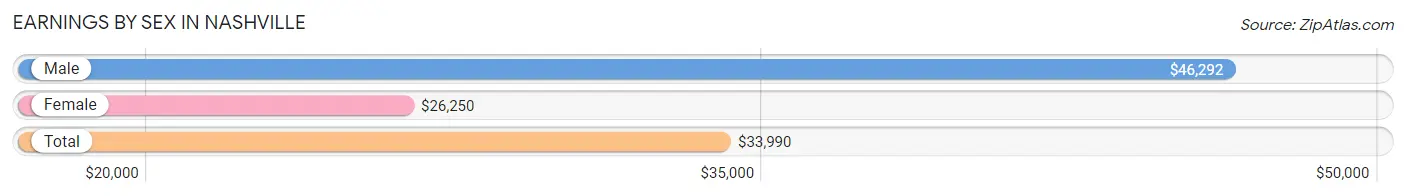
Earnings by Sex in Nashville
Average Earnings in Nashville are $33,990, $46,292 for men and $26,250 for women, a difference of 43.3%.
| Sex | Number | Average Earnings |
| Male | 371 (50.7%) | $46,292 |
| Female | 360 (49.2%) | $26,250 |
| Total | 731 (100.0%) | $33,990 |
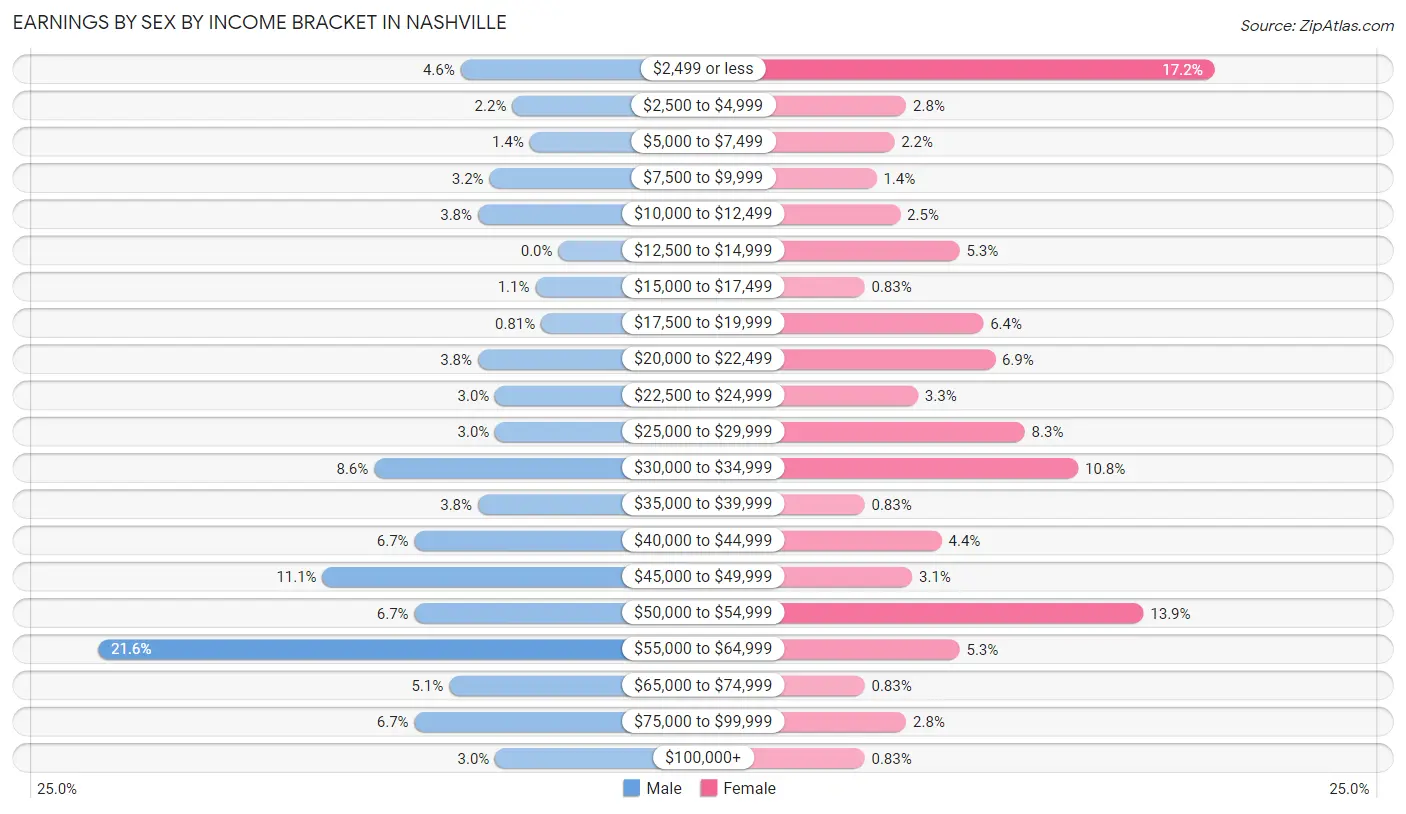
Earnings by Sex by Income Bracket in Nashville
The most common earnings brackets in Nashville are $55,000 to $64,999 for men (80 | 21.6%) and $2,499 or less for women (62 | 17.2%).
| Income | Male | Female |
| $2,499 or less | 17 (4.6%) | 62 (17.2%) |
| $2,500 to $4,999 | 8 (2.2%) | 10 (2.8%) |
| $5,000 to $7,499 | 5 (1.3%) | 8 (2.2%) |
| $7,500 to $9,999 | 12 (3.2%) | 5 (1.4%) |
| $10,000 to $12,499 | 14 (3.8%) | 9 (2.5%) |
| $12,500 to $14,999 | 0 (0.0%) | 19 (5.3%) |
| $15,000 to $17,499 | 4 (1.1%) | 3 (0.8%) |
| $17,500 to $19,999 | 3 (0.8%) | 23 (6.4%) |
| $20,000 to $22,499 | 14 (3.8%) | 25 (6.9%) |
| $22,500 to $24,999 | 11 (3.0%) | 12 (3.3%) |
| $25,000 to $29,999 | 11 (3.0%) | 30 (8.3%) |
| $30,000 to $34,999 | 32 (8.6%) | 39 (10.8%) |
| $35,000 to $39,999 | 14 (3.8%) | 3 (0.8%) |
| $40,000 to $44,999 | 25 (6.7%) | 16 (4.4%) |
| $45,000 to $49,999 | 41 (11.1%) | 11 (3.1%) |
| $50,000 to $54,999 | 25 (6.7%) | 50 (13.9%) |
| $55,000 to $64,999 | 80 (21.6%) | 19 (5.3%) |
| $65,000 to $74,999 | 19 (5.1%) | 3 (0.8%) |
| $75,000 to $99,999 | 25 (6.7%) | 10 (2.8%) |
| $100,000+ | 11 (3.0%) | 3 (0.8%) |
| Total | 371 (100.0%) | 360 (100.0%) |
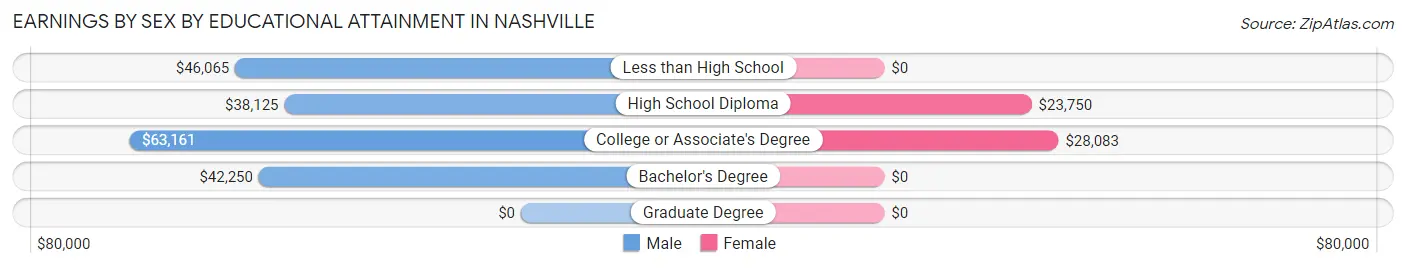
Earnings by Sex by Educational Attainment in Nashville
Average earnings in Nashville are $47,042 for men and $27,639 for women, a difference of 41.2%. Men with an educational attainment of college or associate's degree enjoy the highest average annual earnings of $63,161, while those with high school diploma education earn the least with $38,125. Women with an educational attainment of college or associate's degree earn the most with the average annual earnings of $28,083, while those with high school diploma education have the smallest earnings of $23,750.
| Educational Attainment | Male Income | Female Income |
| Less than High School | $46,065 | $0 |
| High School Diploma | $38,125 | $23,750 |
| College or Associate's Degree | $63,161 | $28,083 |
| Bachelor's Degree | $42,250 | $0 |
| Graduate Degree | - | - |
| Total | $47,042 | $27,639 |
Family Income in Nashville
Family Income Brackets in Nashville
According to the Nashville family income data, there are 131 families falling into the $50,000 to $74,999 income range, which is the most common income bracket and makes up 34.0% of all families.
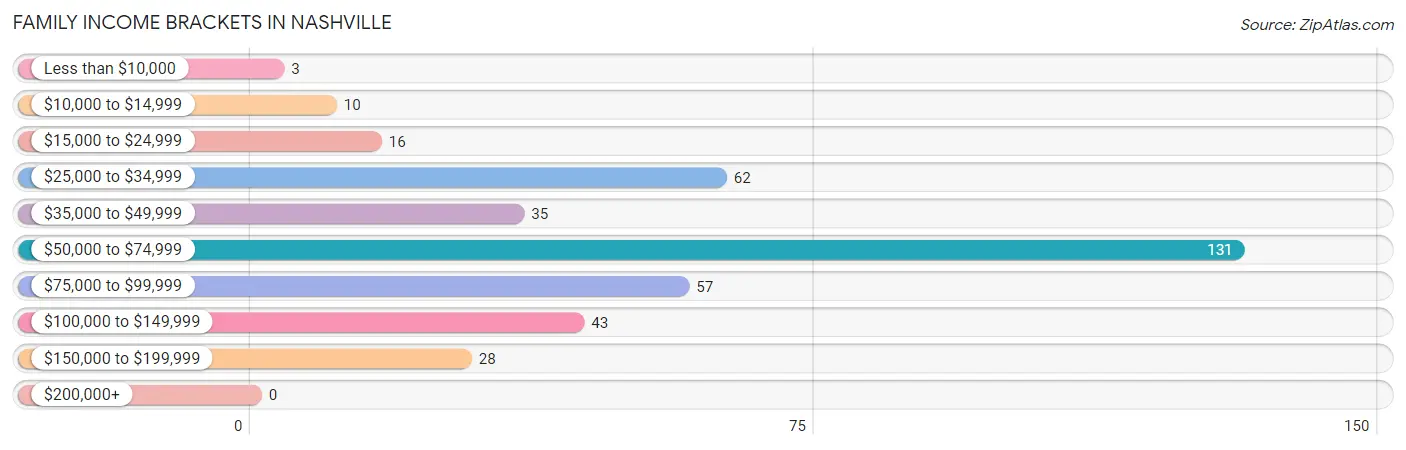
| Income Bracket | # Families | % Families |
| Less than $10,000 | 3 | 0.8% |
| $10,000 to $14,999 | 10 | 2.6% |
| $15,000 to $24,999 | 16 | 4.2% |
| $25,000 to $34,999 | 62 | 16.1% |
| $35,000 to $49,999 | 35 | 9.1% |
| $50,000 to $74,999 | 131 | 34.0% |
| $75,000 to $99,999 | 57 | 14.8% |
| $100,000 to $149,999 | 43 | 11.2% |
| $150,000 to $199,999 | 28 | 7.3% |
| $200,000+ | 0 | 0.0% |
Family Income by Famaliy Size in Nashville
6-person families (8 | 2.1%) account for the highest median family income in Nashville with $114,167 per family, while 2-person families (239 | 62.1%) have the highest median income of $28,646 per family member.
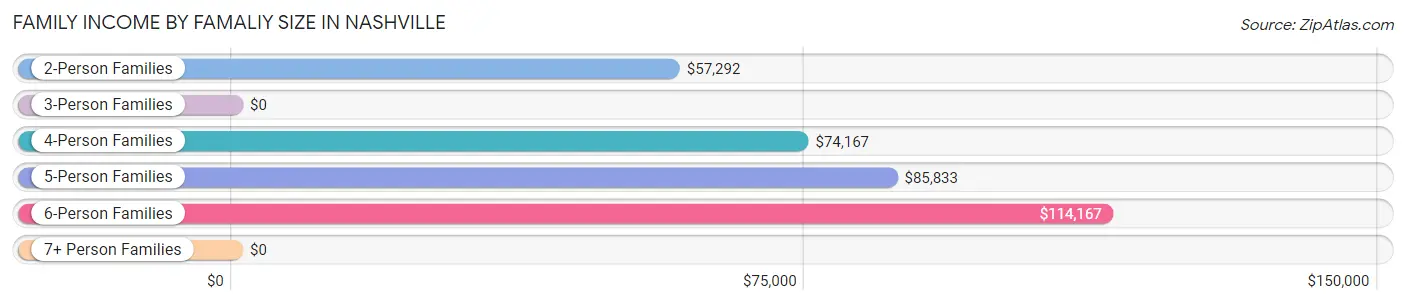
| Income Bracket | # Families | Median Income |
| 2-Person Families | 239 (62.1%) | $57,292 |
| 3-Person Families | 62 (16.1%) | $0 |
| 4-Person Families | 64 (16.6%) | $74,167 |
| 5-Person Families | 12 (3.1%) | $85,833 |
| 6-Person Families | 8 (2.1%) | $114,167 |
| 7+ Person Families | 0 (0.0%) | $0 |
| Total | 385 (100.0%) | $58,750 |
Family Income by Number of Earners in Nashville
The median family income in Nashville is $58,750, with families comprising 3+ earners (36) having the highest median family income of $116,000, while families with no earners (90) have the lowest median family income of $49,375, accounting for 9.3% and 23.4% of families, respectively.
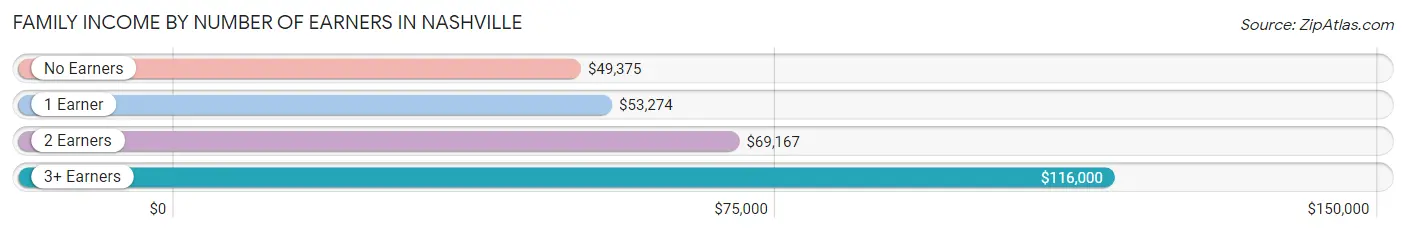
| Number of Earners | # Families | Median Income |
| No Earners | 90 (23.4%) | $49,375 |
| 1 Earner | 119 (30.9%) | $53,274 |
| 2 Earners | 140 (36.4%) | $69,167 |
| 3+ Earners | 36 (9.3%) | $116,000 |
| Total | 385 (100.0%) | $58,750 |
Household Income in Nashville
Household Income Brackets in Nashville
With 155 households falling in the category, the $50,000 to $74,999 income range is the most frequent in Nashville, accounting for 25.6% of all households. In contrast, only 2 households (0.3%) fall into the $200,000+ income bracket, making it the least populous group.
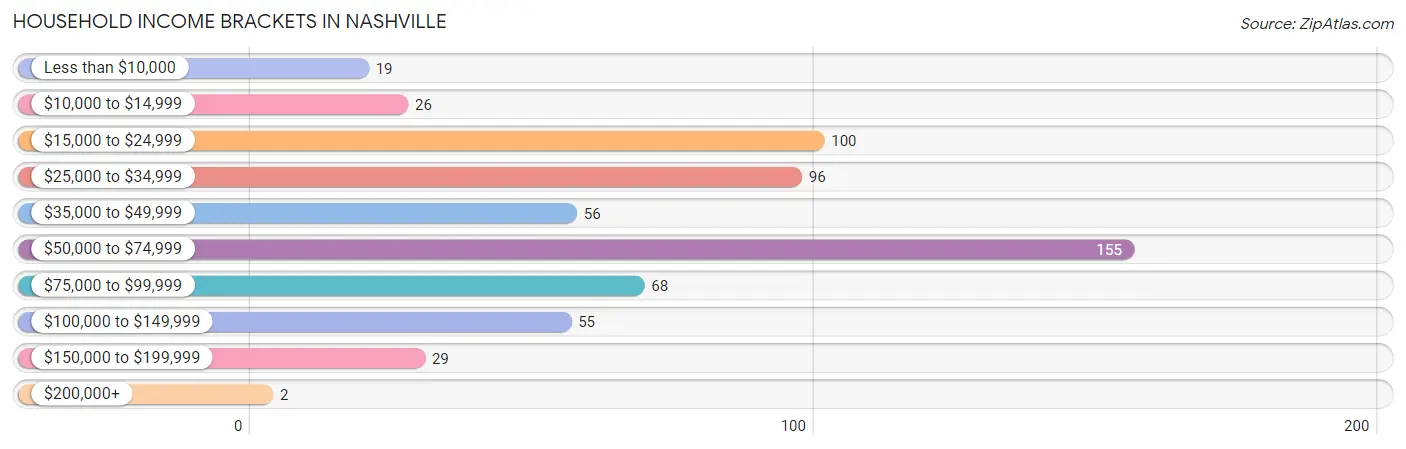
| Income Bracket | # Households | % Households |
| Less than $10,000 | 19 | 3.1% |
| $10,000 to $14,999 | 26 | 4.3% |
| $15,000 to $24,999 | 100 | 16.5% |
| $25,000 to $34,999 | 96 | 15.8% |
| $35,000 to $49,999 | 56 | 9.2% |
| $50,000 to $74,999 | 155 | 25.6% |
| $75,000 to $99,999 | 68 | 11.2% |
| $100,000 to $149,999 | 55 | 9.1% |
| $150,000 to $199,999 | 29 | 4.8% |
| $200,000+ | 2 | 0.3% |
Household Income by Householder Age in Nashville
The median household income in Nashville is $50,938, with the highest median household income of $53,158 found in the 45 to 64 years age bracket for the primary householder. A total of 218 households (36.0%) fall into this category. Meanwhile, the 15 to 24 years age bracket for the primary householder has the lowest median household income of $0, with 14 households (2.3%) in this group.
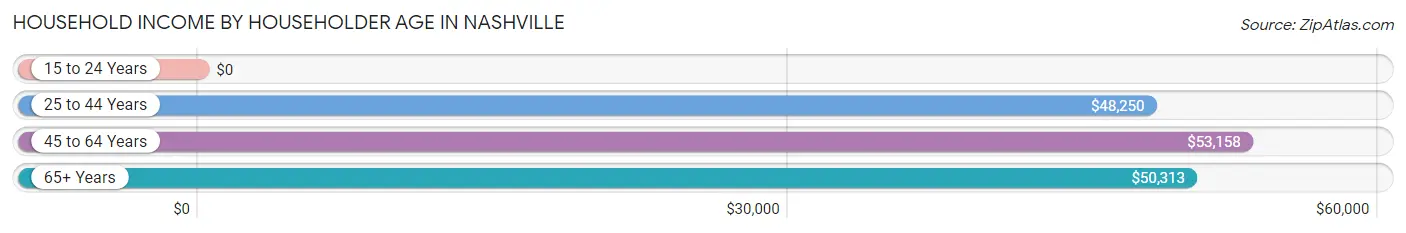
| Income Bracket | # Households | Median Income |
| 15 to 24 Years | 14 (2.3%) | $0 |
| 25 to 44 Years | 142 (23.4%) | $48,250 |
| 45 to 64 Years | 218 (36.0%) | $53,158 |
| 65+ Years | 232 (38.3%) | $50,313 |
| Total | 606 (100.0%) | $50,938 |
Poverty in Nashville
Income Below Poverty by Sex and Age in Nashville
With 9.4% poverty level for males and 14.2% for females among the residents of Nashville, 6 to 11 year old males and 15 year old females are the most vulnerable to poverty, with 14 males (26.9%) and 2 females (100.0%) in their respective age groups living below the poverty level.
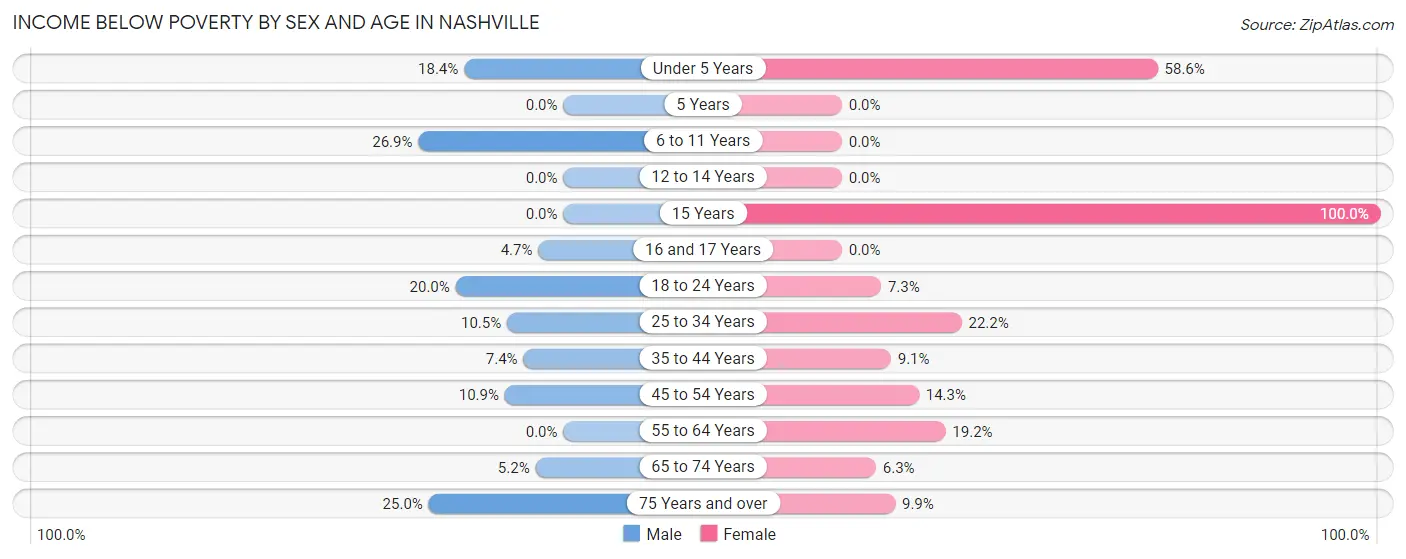
| Age Bracket | Male | Female |
| Under 5 Years | 7 (18.4%) | 17 (58.6%) |
| 5 Years | 0 (0.0%) | 0 (0.0%) |
| 6 to 11 Years | 14 (26.9%) | 0 (0.0%) |
| 12 to 14 Years | 0 (0.0%) | 0 (0.0%) |
| 15 Years | 0 (0.0%) | 2 (100.0%) |
| 16 and 17 Years | 2 (4.6%) | 0 (0.0%) |
| 18 to 24 Years | 6 (20.0%) | 4 (7.3%) |
| 25 to 34 Years | 7 (10.4%) | 16 (22.2%) |
| 35 to 44 Years | 8 (7.4%) | 7 (9.1%) |
| 45 to 54 Years | 15 (10.9%) | 20 (14.3%) |
| 55 to 64 Years | 0 (0.0%) | 20 (19.2%) |
| 65 to 74 Years | 6 (5.2%) | 6 (6.3%) |
| 75 Years and over | 4 (25.0%) | 8 (9.9%) |
| Total | 69 (9.4%) | 100 (14.2%) |
Income Above Poverty by Sex and Age in Nashville
According to the poverty statistics in Nashville, males aged 5 years and females aged 5 years are the age groups that are most secure financially, with 100.0% of males and 100.0% of females in these age groups living above the poverty line.
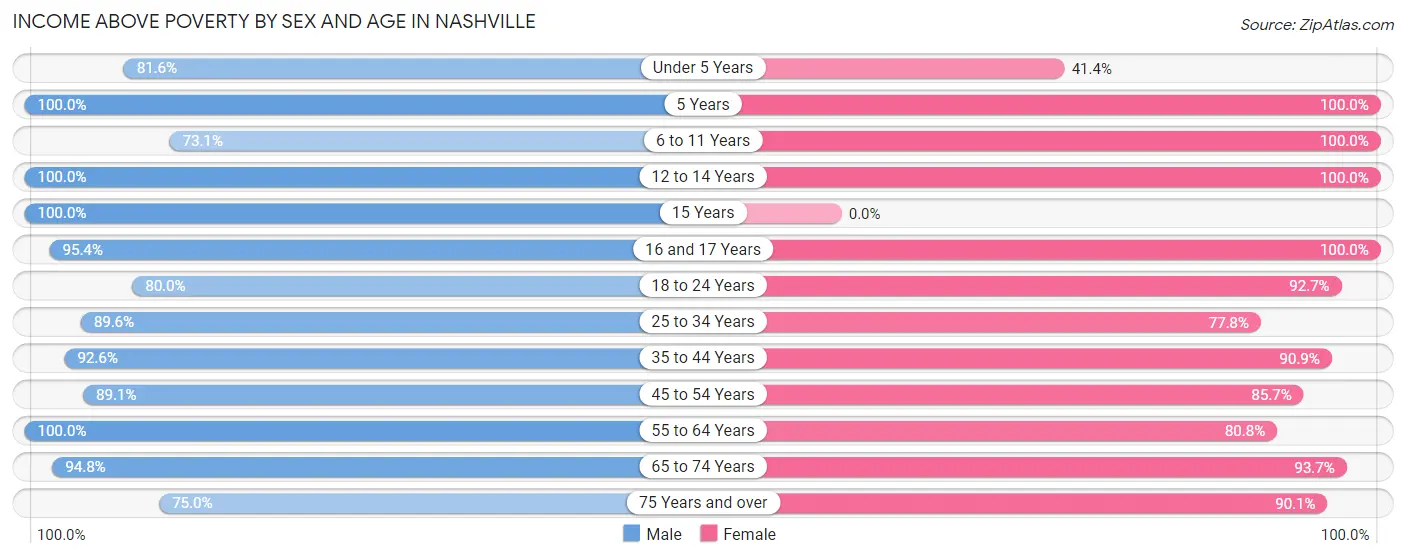
| Age Bracket | Male | Female |
| Under 5 Years | 31 (81.6%) | 12 (41.4%) |
| 5 Years | 3 (100.0%) | 3 (100.0%) |
| 6 to 11 Years | 38 (73.1%) | 14 (100.0%) |
| 12 to 14 Years | 19 (100.0%) | 17 (100.0%) |
| 15 Years | 2 (100.0%) | 0 (0.0%) |
| 16 and 17 Years | 41 (95.4%) | 16 (100.0%) |
| 18 to 24 Years | 24 (80.0%) | 51 (92.7%) |
| 25 to 34 Years | 60 (89.5%) | 56 (77.8%) |
| 35 to 44 Years | 100 (92.6%) | 70 (90.9%) |
| 45 to 54 Years | 123 (89.1%) | 120 (85.7%) |
| 55 to 64 Years | 103 (100.0%) | 84 (80.8%) |
| 65 to 74 Years | 110 (94.8%) | 89 (93.7%) |
| 75 Years and over | 12 (75.0%) | 73 (90.1%) |
| Total | 666 (90.6%) | 605 (85.8%) |
Income Below Poverty Among Married-Couple Families in Nashville
The poverty statistics for married-couple families in Nashville show that 1.4% or 3 of the total 221 families live below the poverty line. Families with no children have the highest poverty rate of 2.1%, comprising of 3 families. On the other hand, families with 1 or 2 children have the lowest poverty rate of 0.0%, which includes 0 families.
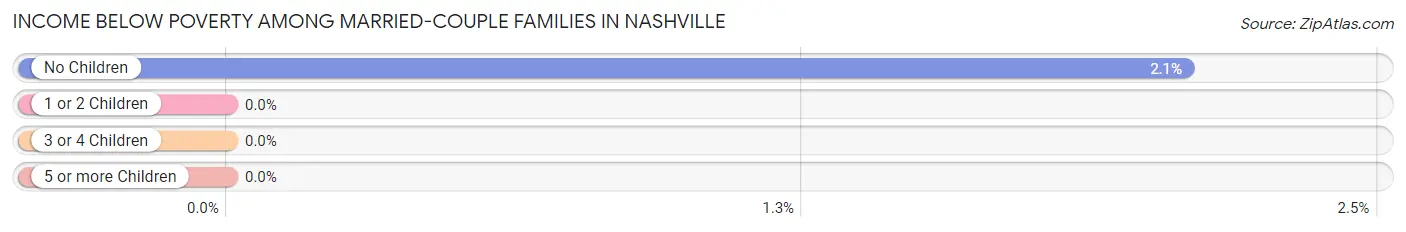
| Children | Above Poverty | Below Poverty |
| No Children | 141 (97.9%) | 3 (2.1%) |
| 1 or 2 Children | 75 (100.0%) | 0 (0.0%) |
| 3 or 4 Children | 2 (100.0%) | 0 (0.0%) |
| 5 or more Children | 0 (0.0%) | 0 (0.0%) |
| Total | 218 (98.6%) | 3 (1.4%) |
Income Below Poverty Among Single-Parent Households in Nashville
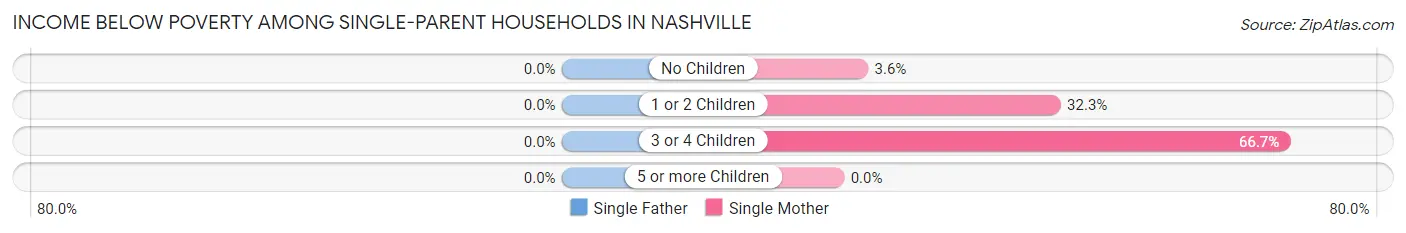
| Children | Single Father | Single Mother |
| No Children | 0 (0.0%) | 3 (3.6%) |
| 1 or 2 Children | 0 (0.0%) | 10 (32.3%) |
| 3 or 4 Children | 0 (0.0%) | 6 (66.7%) |
| 5 or more Children | 0 (0.0%) | 0 (0.0%) |
| Total | 0 (0.0%) | 19 (15.3%) |
Income Below Poverty Among Married-Couple vs Single-Parent Households in Nashville
The poverty data for Nashville shows that 3 of the married-couple family households (1.4%) and 19 of the single-parent households (11.6%) are living below the poverty level. Within the married-couple family households, those with no children have the highest poverty rate, with 3 households (2.1%) falling below the poverty line. Among the single-parent households, those with 3 or 4 children have the highest poverty rate, with 6 household (66.7%) living below poverty.
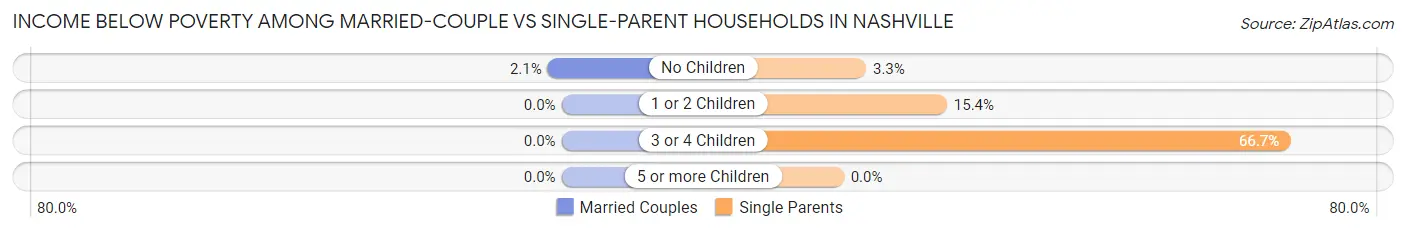
| Children | Married-Couple Families | Single-Parent Households |
| No Children | 3 (2.1%) | 3 (3.3%) |
| 1 or 2 Children | 0 (0.0%) | 10 (15.4%) |
| 3 or 4 Children | 0 (0.0%) | 6 (66.7%) |
| 5 or more Children | 0 (0.0%) | 0 (0.0%) |
| Total | 3 (1.4%) | 19 (11.6%) |
Race in Nashville
The most populous races in Nashville are White / Caucasian (1,349 | 93.7%), Hispanic or Latino (88 | 6.1%), and Two or more Races (73 | 5.1%).
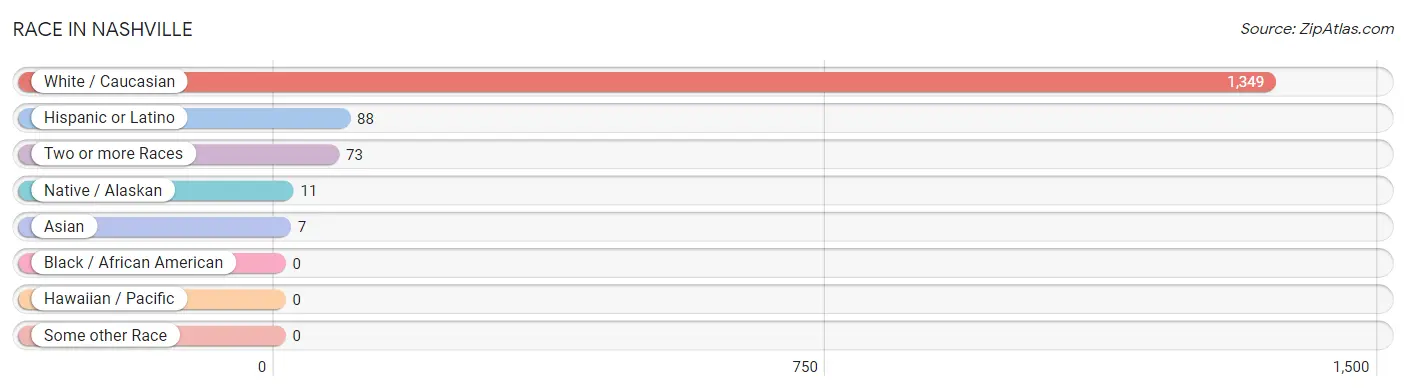
| Race | # Population | % Population |
| Asian | 7 | 0.5% |
| Black / African American | 0 | 0.0% |
| Hawaiian / Pacific | 0 | 0.0% |
| Hispanic or Latino | 88 | 6.1% |
| Native / Alaskan | 11 | 0.8% |
| White / Caucasian | 1,349 | 93.7% |
| Two or more Races | 73 | 5.1% |
| Some other Race | 0 | 0.0% |
| Total | 1,440 | 100.0% |
Ancestry in Nashville
The most populous ancestries reported in Nashville are English (356 | 24.7%), German (288 | 20.0%), Irish (131 | 9.1%), American (121 | 8.4%), and Mexican (85 | 5.9%), together accounting for 68.1% of all Nashville residents.
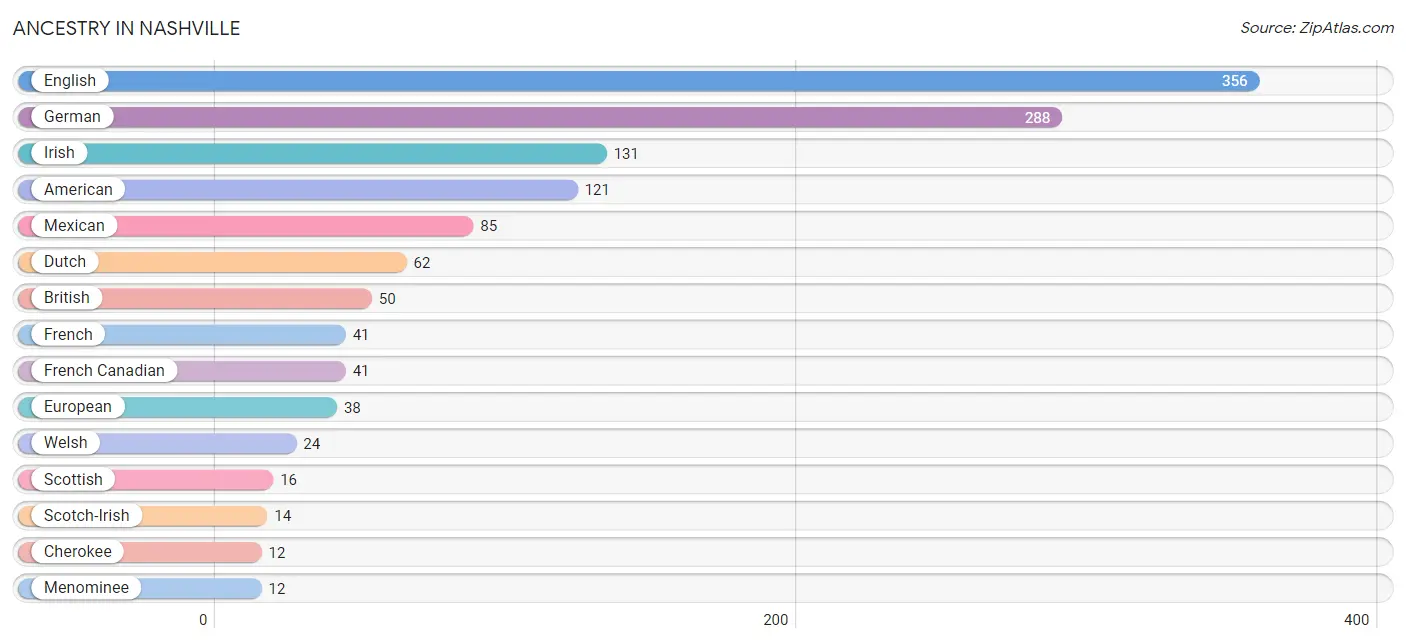
| Ancestry | # Population | % Population |
| African | 3 | 0.2% |
| American | 121 | 8.4% |
| Arab | 2 | 0.1% |
| British | 50 | 3.5% |
| Canadian | 8 | 0.6% |
| Cherokee | 12 | 0.8% |
| Chippewa | 5 | 0.4% |
| Dutch | 62 | 4.3% |
| English | 356 | 24.7% |
| European | 38 | 2.6% |
| Finnish | 4 | 0.3% |
| French | 41 | 2.9% |
| French Canadian | 41 | 2.9% |
| German | 288 | 20.0% |
| Greek | 11 | 0.8% |
| Irish | 131 | 9.1% |
| Italian | 6 | 0.4% |
| Lebanese | 2 | 0.1% |
| Menominee | 12 | 0.8% |
| Mexican | 85 | 5.9% |
| Native Hawaiian | 3 | 0.2% |
| Norwegian | 4 | 0.3% |
| Peruvian | 3 | 0.2% |
| Polish | 5 | 0.4% |
| Russian | 5 | 0.4% |
| Scotch-Irish | 14 | 1.0% |
| Scottish | 16 | 1.1% |
| South American | 3 | 0.2% |
| Sri Lankan | 9 | 0.6% |
| Subsaharan African | 3 | 0.2% |
| Swedish | 8 | 0.6% |
| Thai | 7 | 0.5% |
| Welsh | 24 | 1.7% | View All 33 Rows |
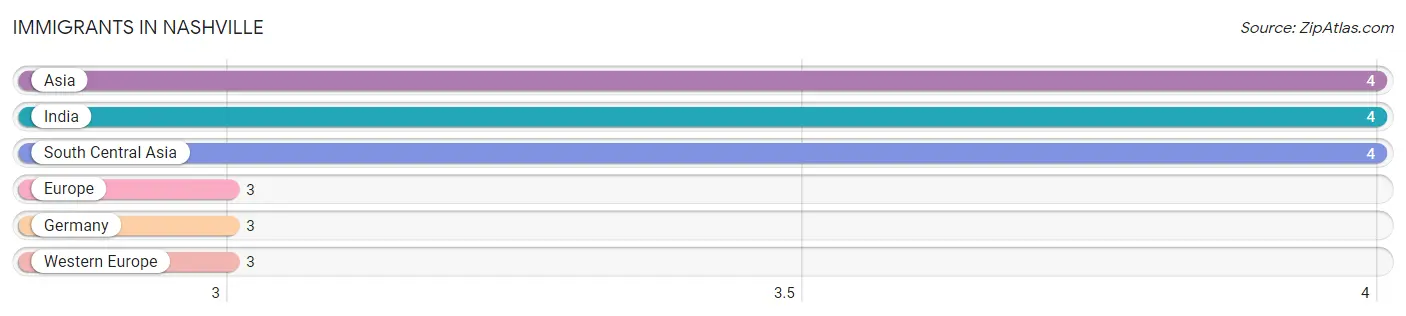
Immigrants in Nashville
The most numerous immigrant groups reported in Nashville came from Asia (4 | 0.3%), India (4 | 0.3%), South Central Asia (4 | 0.3%), Europe (3 | 0.2%), and Germany (3 | 0.2%), together accounting for 1.3% of all Nashville residents.
| Immigration Origin | # Population | % Population |
| Asia | 4 | 0.3% |
| Europe | 3 | 0.2% |
| Germany | 3 | 0.2% |
| India | 4 | 0.3% |
| South Central Asia | 4 | 0.3% |
| Western Europe | 3 | 0.2% | View All 6 Rows |
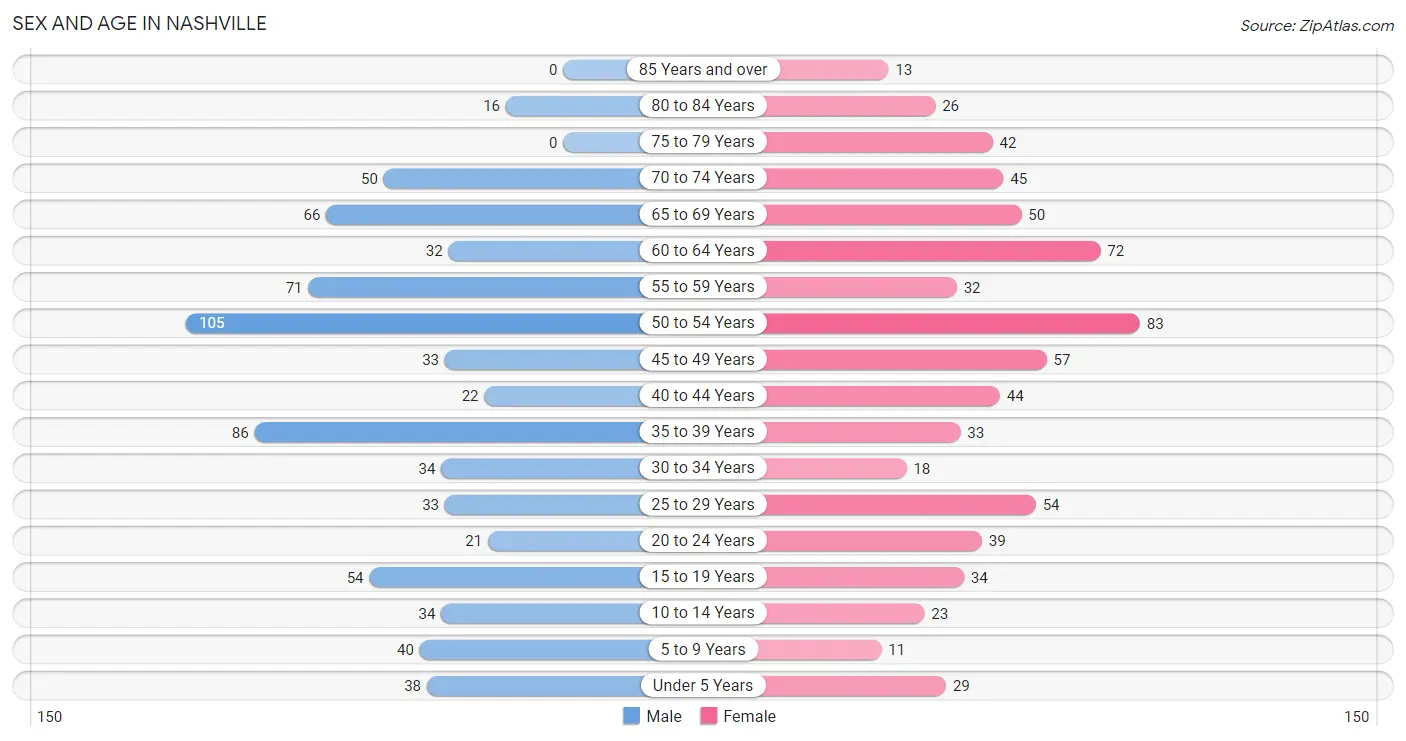
Sex and Age in Nashville
Sex and Age in Nashville
The most populous age groups in Nashville are 50 to 54 Years (105 | 14.3%) for men and 50 to 54 Years (83 | 11.8%) for women.
| Age Bracket | Male | Female |
| Under 5 Years | 38 (5.2%) | 29 (4.1%) |
| 5 to 9 Years | 40 (5.4%) | 11 (1.6%) |
| 10 to 14 Years | 34 (4.6%) | 23 (3.3%) |
| 15 to 19 Years | 54 (7.3%) | 34 (4.8%) |
| 20 to 24 Years | 21 (2.9%) | 39 (5.5%) |
| 25 to 29 Years | 33 (4.5%) | 54 (7.7%) |
| 30 to 34 Years | 34 (4.6%) | 18 (2.5%) |
| 35 to 39 Years | 86 (11.7%) | 33 (4.7%) |
| 40 to 44 Years | 22 (3.0%) | 44 (6.2%) |
| 45 to 49 Years | 33 (4.5%) | 57 (8.1%) |
| 50 to 54 Years | 105 (14.3%) | 83 (11.8%) |
| 55 to 59 Years | 71 (9.7%) | 32 (4.5%) |
| 60 to 64 Years | 32 (4.3%) | 72 (10.2%) |
| 65 to 69 Years | 66 (9.0%) | 50 (7.1%) |
| 70 to 74 Years | 50 (6.8%) | 45 (6.4%) |
| 75 to 79 Years | 0 (0.0%) | 42 (6.0%) |
| 80 to 84 Years | 16 (2.2%) | 26 (3.7%) |
| 85 Years and over | 0 (0.0%) | 13 (1.8%) |
| Total | 735 (100.0%) | 705 (100.0%) |
Families and Households in Nashville
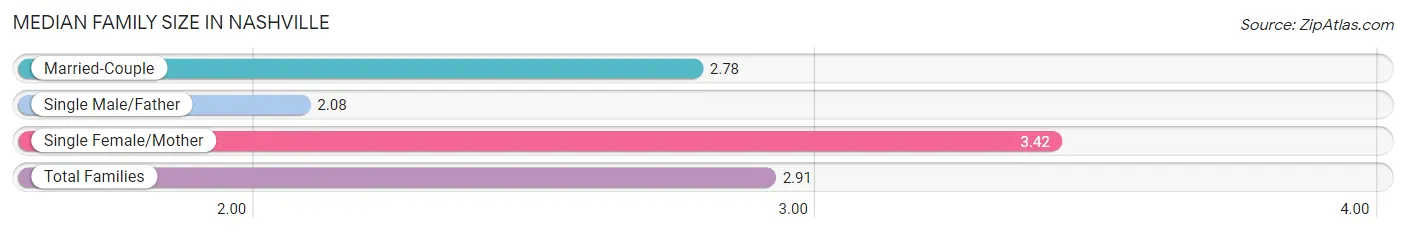
Median Family Size in Nashville
The median family size in Nashville is 2.91 persons per family, with single female/mother families (124 | 32.2%) accounting for the largest median family size of 3.42 persons per family. On the other hand, single male/father families (40 | 10.4%) represent the smallest median family size with 2.08 persons per family.
| Family Type | # Families | Family Size |
| Married-Couple | 221 (57.4%) | 2.78 |
| Single Male/Father | 40 (10.4%) | 2.08 |
| Single Female/Mother | 124 (32.2%) | 3.42 |
| Total Families | 385 (100.0%) | 2.91 |
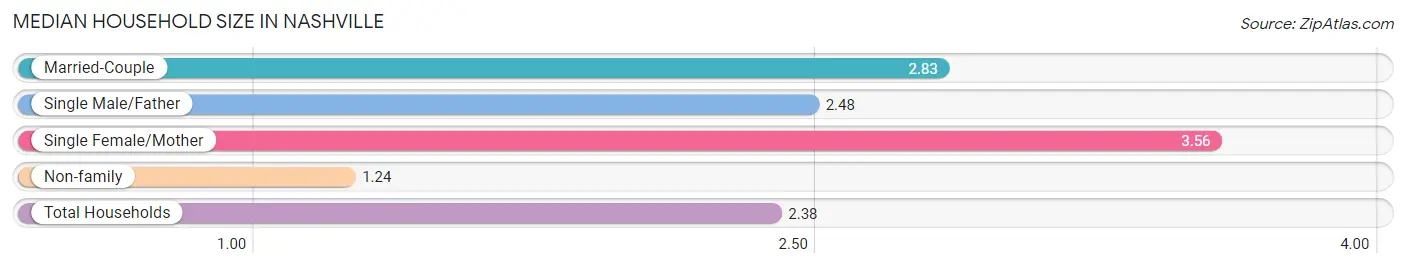
Median Household Size in Nashville
The median household size in Nashville is 2.38 persons per household, with single female/mother households (124 | 20.5%) accounting for the largest median household size of 3.56 persons per household. non-family households (221 | 36.5%) represent the smallest median household size with 1.24 persons per household.
| Household Type | # Households | Household Size |
| Married-Couple | 221 (36.5%) | 2.83 |
| Single Male/Father | 40 (6.6%) | 2.48 |
| Single Female/Mother | 124 (20.5%) | 3.56 |
| Non-family | 221 (36.5%) | 1.24 |
| Total Households | 606 (100.0%) | 2.38 |
Household Size by Marriage Status in Nashville
Out of a total of 606 households in Nashville, 385 (63.5%) are family households, while 221 (36.5%) are nonfamily households. The most numerous type of family households are 2-person households, comprising 229, and the most common type of nonfamily households are 1-person households, comprising 172.
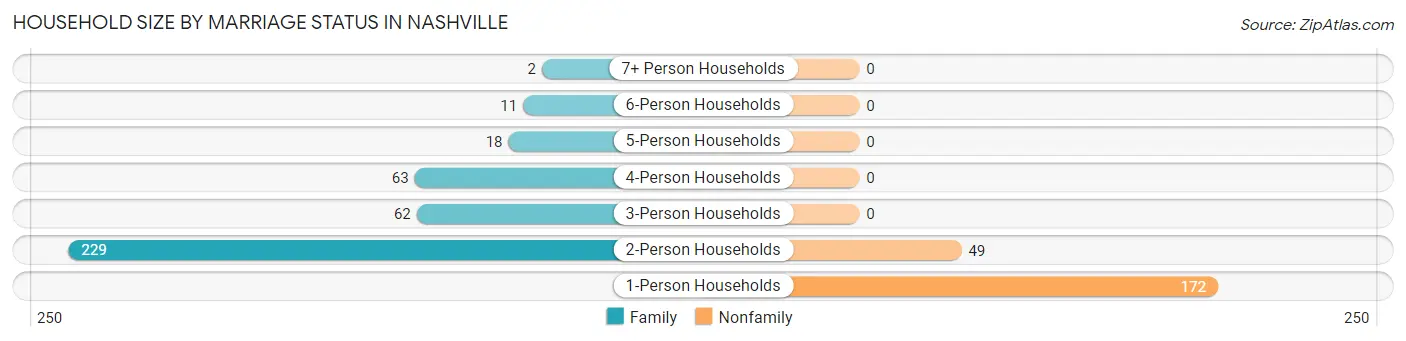
| Household Size | Family Households | Nonfamily Households |
| 1-Person Households | - | 172 (28.4%) |
| 2-Person Households | 229 (37.8%) | 49 (8.1%) |
| 3-Person Households | 62 (10.2%) | 0 (0.0%) |
| 4-Person Households | 63 (10.4%) | 0 (0.0%) |
| 5-Person Households | 18 (3.0%) | 0 (0.0%) |
| 6-Person Households | 11 (1.8%) | 0 (0.0%) |
| 7+ Person Households | 2 (0.3%) | 0 (0.0%) |
| Total | 385 (63.5%) | 221 (36.5%) |
Female Fertility in Nashville
Fertility by Age in Nashville
Average fertility rate in Nashville is 14.0 births per 1,000 women. Women in the age bracket of 15 to 19 years have the highest fertility rate with 118.0 births per 1,000 women. Women in the age bracket of 15 to 19 years acount for 100.0% of all women with births.
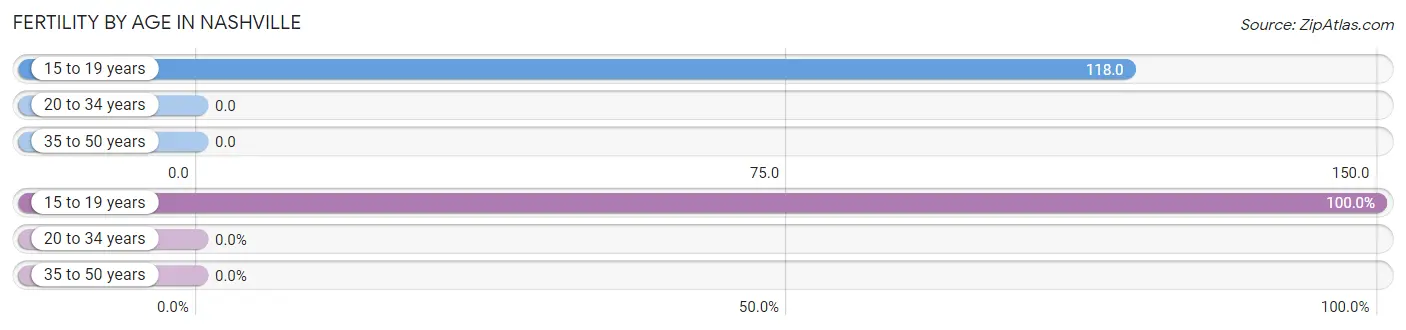
| Age Bracket | Women with Births | Births / 1,000 Women |
| 15 to 19 years | 4 (100.0%) | 118.0 |
| 20 to 34 years | 0 (0.0%) | 0.0 |
| 35 to 50 years | 0 (0.0%) | 0.0 |
| Total | 4 (100.0%) | 14.0 |
Fertility by Age by Marriage Status in Nashville
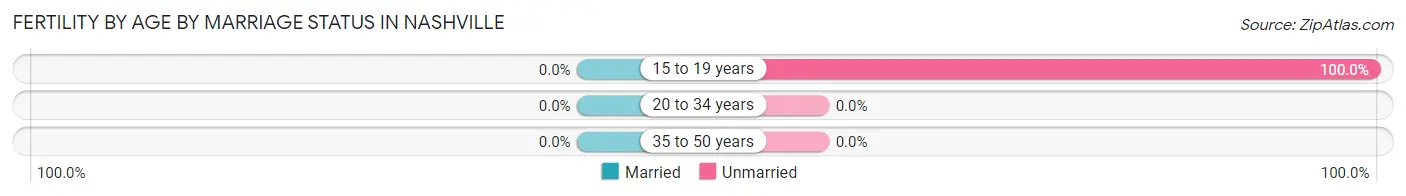
| Age Bracket | Married | Unmarried |
| 15 to 19 years | 0 (0.0%) | 4 (100.0%) |
| 20 to 34 years | 0 (0.0%) | 0 (0.0%) |
| 35 to 50 years | 0 (0.0%) | 0 (0.0%) |
| Total | 0 (0.0%) | 4 (100.0%) |
Fertility by Education in Nashville
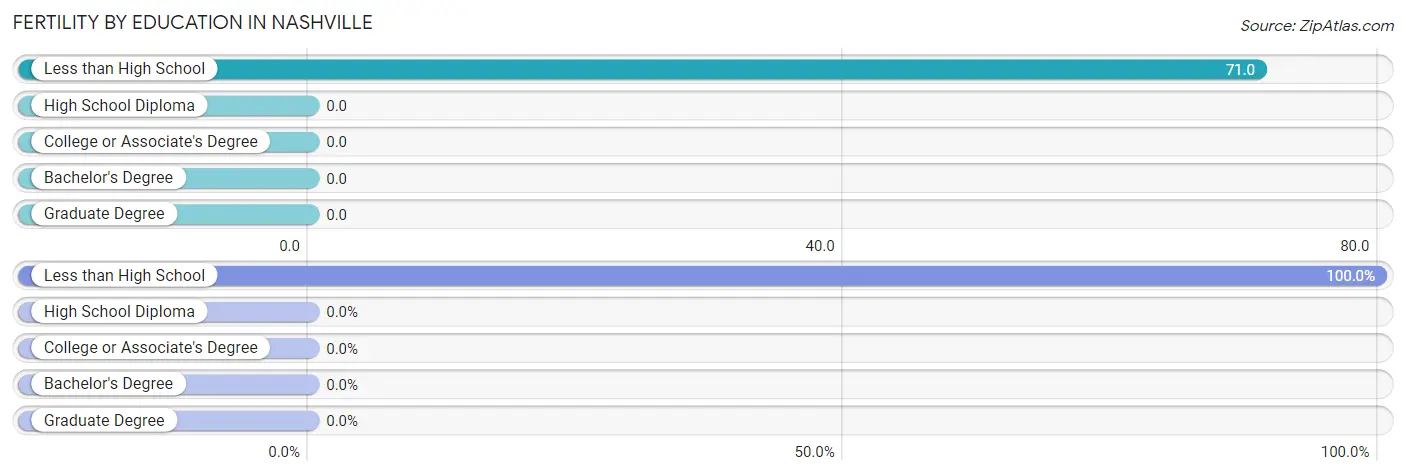
| Educational Attainment | Women with Births | Births / 1,000 Women |
| Less than High School | 4 (100.0%) | 71.0 |
| High School Diploma | 0 (0.0%) | 0.0 |
| College or Associate's Degree | 0 (0.0%) | 0.0 |
| Bachelor's Degree | 0 (0.0%) | 0.0 |
| Graduate Degree | 0 (0.0%) | 0.0 |
| Total | 4 (100.0%) | 14.0 |
Fertility by Education by Marriage Status in Nashville
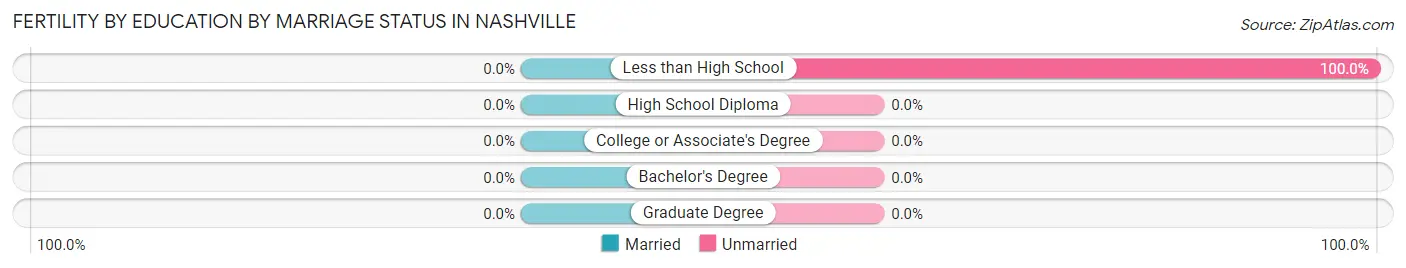
| Educational Attainment | Married | Unmarried |
| Less than High School | 0 (0.0%) | 4 (100.0%) |
| High School Diploma | 0 (0.0%) | 0 (0.0%) |
| College or Associate's Degree | 0 (0.0%) | 0 (0.0%) |
| Bachelor's Degree | 0 (0.0%) | 0 (0.0%) |
| Graduate Degree | 0 (0.0%) | 0 (0.0%) |
| Total | 0 (0.0%) | 4 (100.0%) |
Employment Characteristics in Nashville
Employment by Class of Employer in Nashville
Among the 678 employed individuals in Nashville, private company employees (545 | 80.4%), not-for-profit organizations (55 | 8.1%), and self-employed (not incorporated) (29 | 4.3%) make up the most common classes of employment.
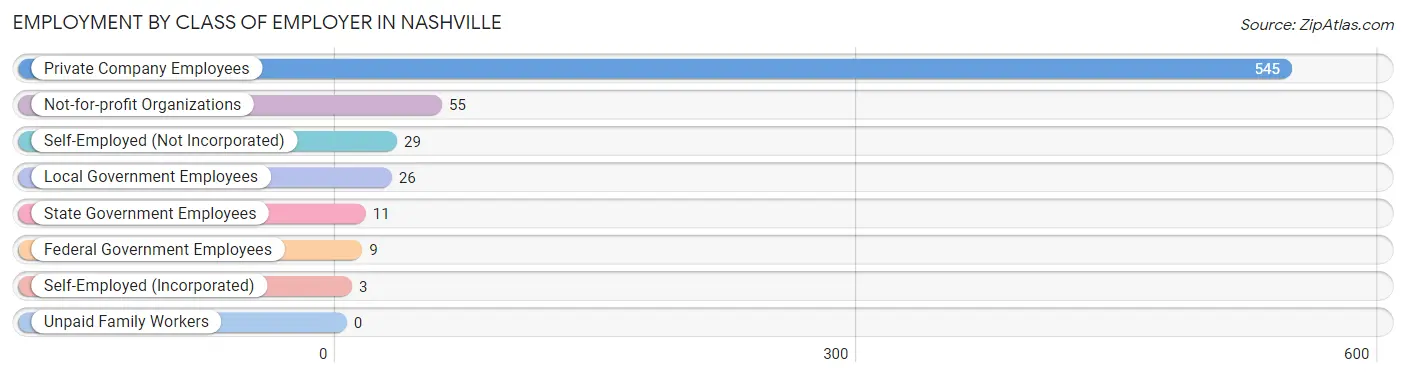
| Employer Class | # Employees | % Employees |
| Private Company Employees | 545 | 80.4% |
| Self-Employed (Incorporated) | 3 | 0.4% |
| Self-Employed (Not Incorporated) | 29 | 4.3% |
| Not-for-profit Organizations | 55 | 8.1% |
| Local Government Employees | 26 | 3.8% |
| State Government Employees | 11 | 1.6% |
| Federal Government Employees | 9 | 1.3% |
| Unpaid Family Workers | 0 | 0.0% |
| Total | 678 | 100.0% |
Employment Status by Age in Nashville
According to the labor force statistics for Nashville, out of the total population over 16 years of age (1,261), 57.0% or 719 individuals are in the labor force, with 4.2% or 30 of them unemployed. The age group with the highest labor force participation rate is 25 to 29 years, with 83.9% or 73 individuals in the labor force. Within the labor force, the 60 to 64 years age range has the highest percentage of unemployed individuals, with 27.1% or 19 of them being unemployed.
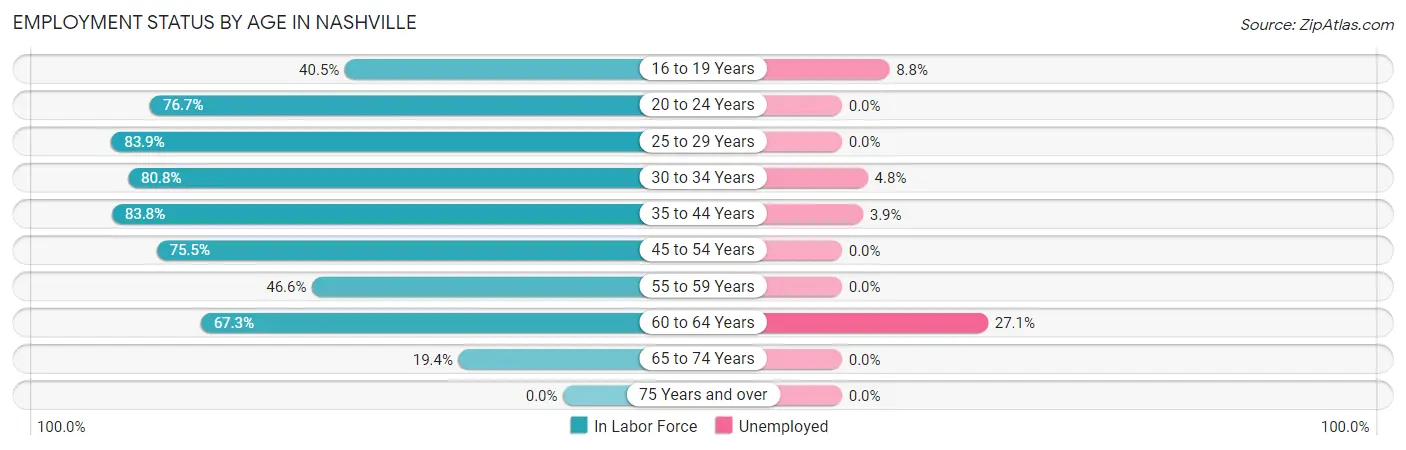
| Age Bracket | In Labor Force | Unemployed |
| 16 to 19 Years | 34 (40.5%) | 3 (8.8%) |
| 20 to 24 Years | 46 (76.7%) | 0 (0.0%) |
| 25 to 29 Years | 73 (83.9%) | 0 (0.0%) |
| 30 to 34 Years | 42 (80.8%) | 2 (4.8%) |
| 35 to 44 Years | 155 (83.8%) | 6 (3.9%) |
| 45 to 54 Years | 210 (75.5%) | 0 (0.0%) |
| 55 to 59 Years | 48 (46.6%) | 0 (0.0%) |
| 60 to 64 Years | 70 (67.3%) | 19 (27.1%) |
| 65 to 74 Years | 41 (19.4%) | 0 (0.0%) |
| 75 Years and over | 0 (0.0%) | 0 (0.0%) |
| Total | 719 (57.0%) | 30 (4.2%) |
Employment Status by Educational Attainment in Nashville
According to labor force statistics for Nashville, 73.9% of individuals (598) out of the total population between 25 and 64 years of age (809) are in the labor force, with 4.5% or 27 of them being unemployed. The group with the highest labor force participation rate are those with the educational attainment of college / associate degree, with 85.2% or 219 individuals in the labor force. Within the labor force, individuals with high school diploma education have the highest percentage of unemployment, with 9.1% or 25 of them being unemployed.
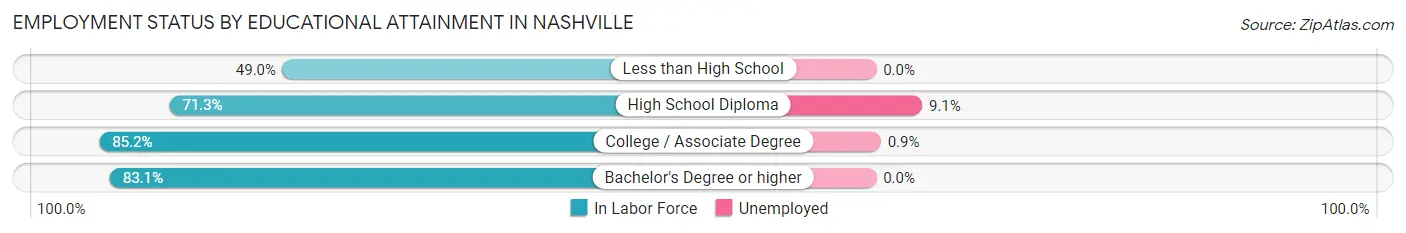
| Educational Attainment | In Labor Force | Unemployed |
| Less than High School | 49 (49.0%) | 0 (0.0%) |
| High School Diploma | 276 (71.3%) | 35 (9.1%) |
| College / Associate Degree | 219 (85.2%) | 2 (0.9%) |
| Bachelor's Degree or higher | 54 (83.1%) | 0 (0.0%) |
| Total | 598 (73.9%) | 36 (4.5%) |
Employment Occupations by Sex in Nashville
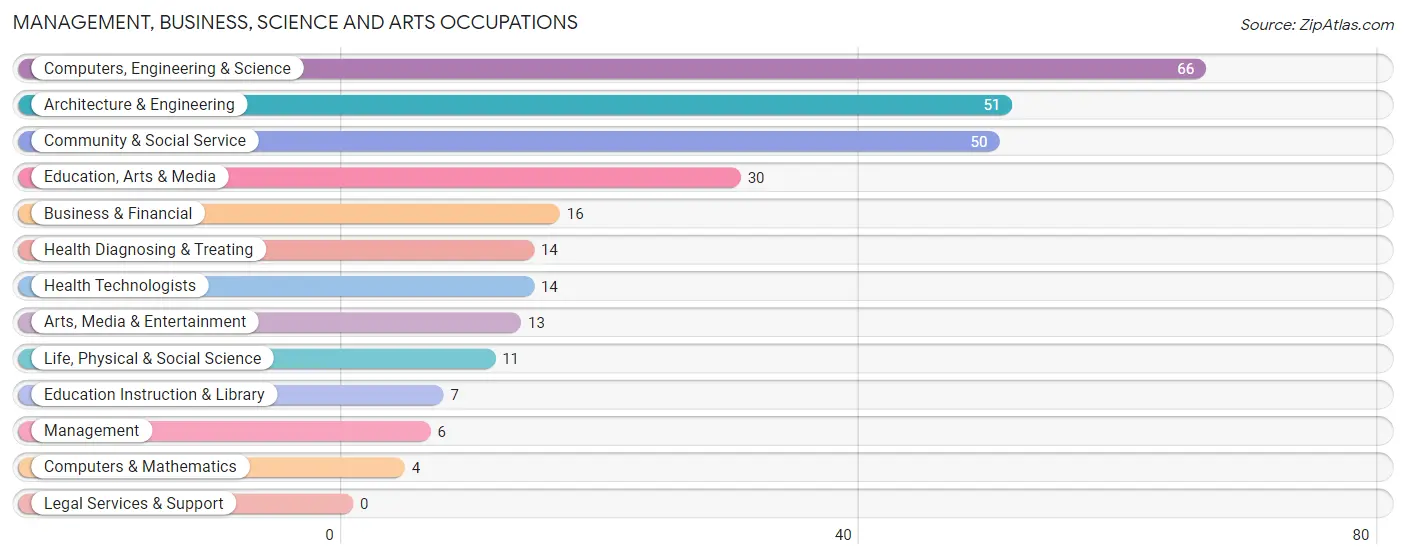
Management, Business, Science and Arts Occupations
The most common Management, Business, Science and Arts occupations in Nashville are Computers, Engineering & Science (66 | 9.6%), Architecture & Engineering (51 | 7.4%), Community & Social Service (50 | 7.3%), Education, Arts & Media (30 | 4.3%), and Business & Financial (16 | 2.3%).
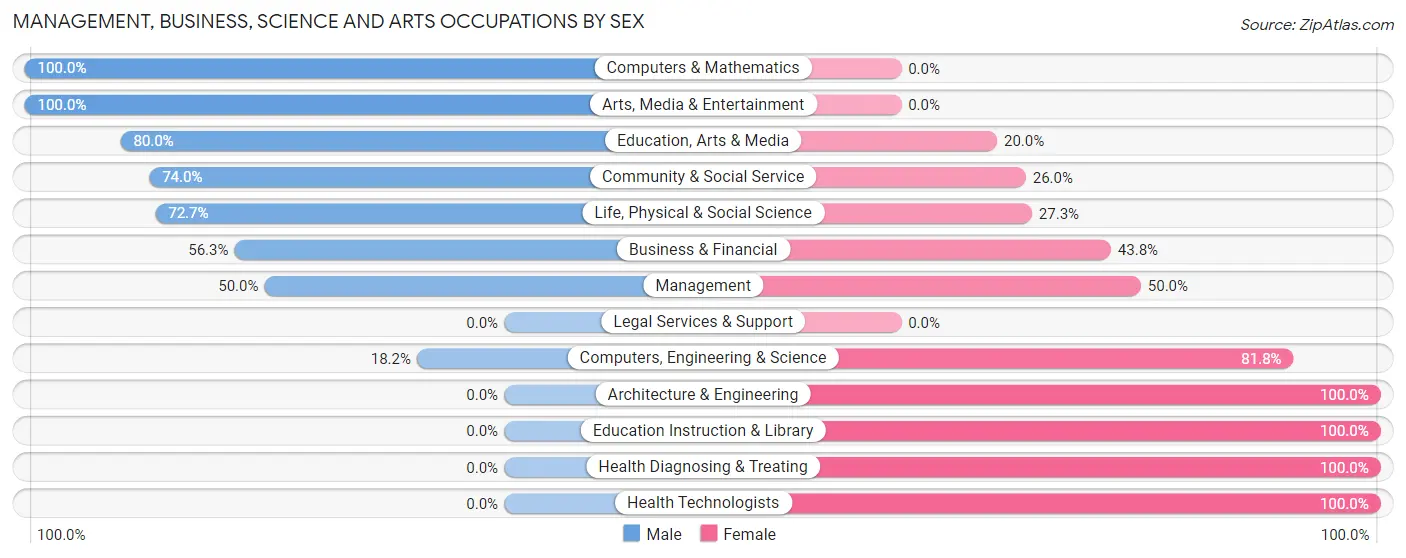
Management, Business, Science and Arts Occupations by Sex
Within the Management, Business, Science and Arts occupations in Nashville, the most male-oriented occupations are Computers & Mathematics (100.0%), Arts, Media & Entertainment (100.0%), and Education, Arts & Media (80.0%), while the most female-oriented occupations are Architecture & Engineering (100.0%), Education Instruction & Library (100.0%), and Health Diagnosing & Treating (100.0%).
| Occupation | Male | Female |
| Management | 3 (50.0%) | 3 (50.0%) |
| Business & Financial | 9 (56.2%) | 7 (43.8%) |
| Computers, Engineering & Science | 12 (18.2%) | 54 (81.8%) |
| Computers & Mathematics | 4 (100.0%) | 0 (0.0%) |
| Architecture & Engineering | 0 (0.0%) | 51 (100.0%) |
| Life, Physical & Social Science | 8 (72.7%) | 3 (27.3%) |
| Community & Social Service | 37 (74.0%) | 13 (26.0%) |
| Education, Arts & Media | 24 (80.0%) | 6 (20.0%) |
| Legal Services & Support | 0 (0.0%) | 0 (0.0%) |
| Education Instruction & Library | 0 (0.0%) | 7 (100.0%) |
| Arts, Media & Entertainment | 13 (100.0%) | 0 (0.0%) |
| Health Diagnosing & Treating | 0 (0.0%) | 14 (100.0%) |
| Health Technologists | 0 (0.0%) | 14 (100.0%) |
| Total (Category) | 61 (40.1%) | 91 (59.9%) |
| Total (Overall) | 354 (51.4%) | 335 (48.6%) |
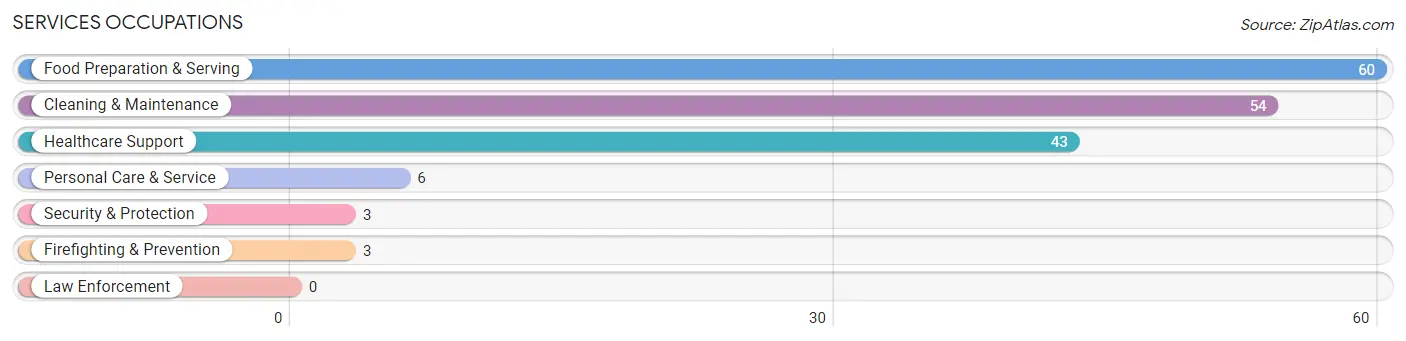
Services Occupations
The most common Services occupations in Nashville are Food Preparation & Serving (60 | 8.7%), Cleaning & Maintenance (54 | 7.8%), Healthcare Support (43 | 6.2%), Personal Care & Service (6 | 0.9%), and Security & Protection (3 | 0.4%).
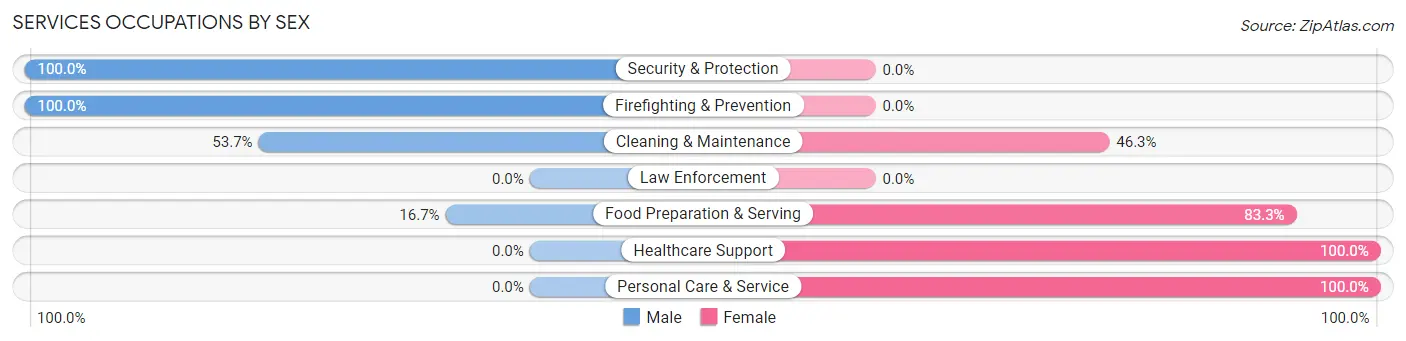
Services Occupations by Sex
Within the Services occupations in Nashville, the most male-oriented occupations are Security & Protection (100.0%), Firefighting & Prevention (100.0%), and Cleaning & Maintenance (53.7%), while the most female-oriented occupations are Healthcare Support (100.0%), Personal Care & Service (100.0%), and Food Preparation & Serving (83.3%).
| Occupation | Male | Female |
| Healthcare Support | 0 (0.0%) | 43 (100.0%) |
| Security & Protection | 3 (100.0%) | 0 (0.0%) |
| Firefighting & Prevention | 3 (100.0%) | 0 (0.0%) |
| Law Enforcement | 0 (0.0%) | 0 (0.0%) |
| Food Preparation & Serving | 10 (16.7%) | 50 (83.3%) |
| Cleaning & Maintenance | 29 (53.7%) | 25 (46.3%) |
| Personal Care & Service | 0 (0.0%) | 6 (100.0%) |
| Total (Category) | 42 (25.3%) | 124 (74.7%) |
| Total (Overall) | 354 (51.4%) | 335 (48.6%) |
Sales and Office Occupations
The most common Sales and Office occupations in Nashville are Office & Administration (53 | 7.7%), and Sales & Related (51 | 7.4%).

Sales and Office Occupations by Sex
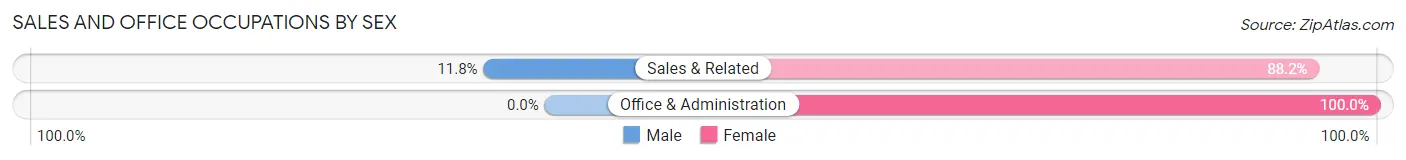
| Occupation | Male | Female |
| Sales & Related | 6 (11.8%) | 45 (88.2%) |
| Office & Administration | 0 (0.0%) | 53 (100.0%) |
| Total (Category) | 6 (5.8%) | 98 (94.2%) |
| Total (Overall) | 354 (51.4%) | 335 (48.6%) |
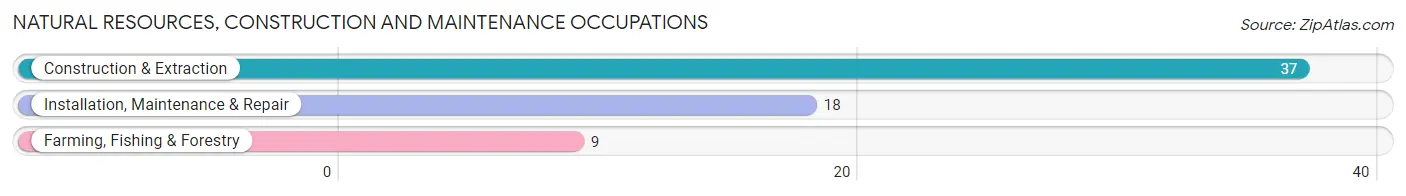
Natural Resources, Construction and Maintenance Occupations
The most common Natural Resources, Construction and Maintenance occupations in Nashville are Construction & Extraction (37 | 5.4%), Installation, Maintenance & Repair (18 | 2.6%), and Farming, Fishing & Forestry (9 | 1.3%).
Natural Resources, Construction and Maintenance Occupations by Sex
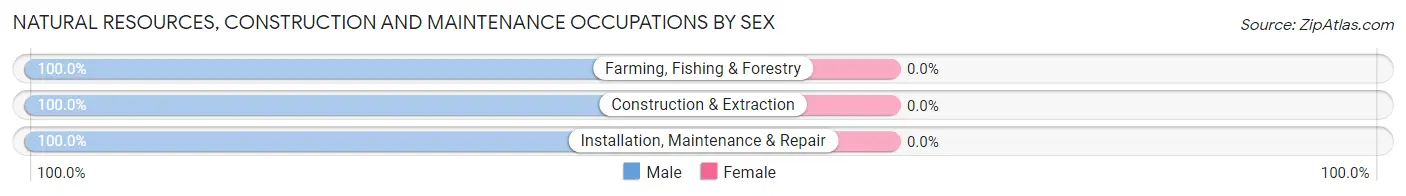
| Occupation | Male | Female |
| Farming, Fishing & Forestry | 9 (100.0%) | 0 (0.0%) |
| Construction & Extraction | 37 (100.0%) | 0 (0.0%) |
| Installation, Maintenance & Repair | 18 (100.0%) | 0 (0.0%) |
| Total (Category) | 64 (100.0%) | 0 (0.0%) |
| Total (Overall) | 354 (51.4%) | 335 (48.6%) |
Production, Transportation and Moving Occupations
The most common Production, Transportation and Moving occupations in Nashville are Production (158 | 22.9%), Material Moving (31 | 4.5%), and Transportation (14 | 2.0%).
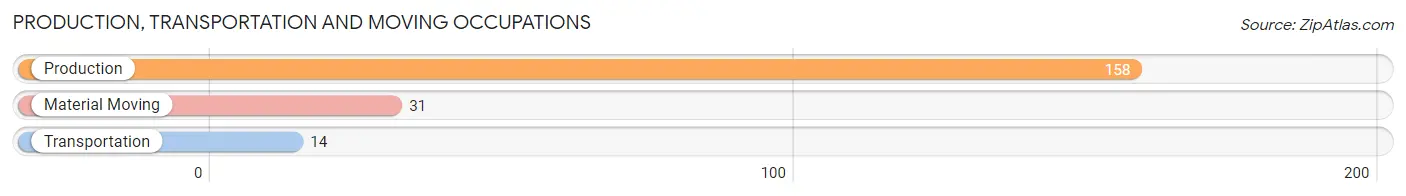
Production, Transportation and Moving Occupations by Sex
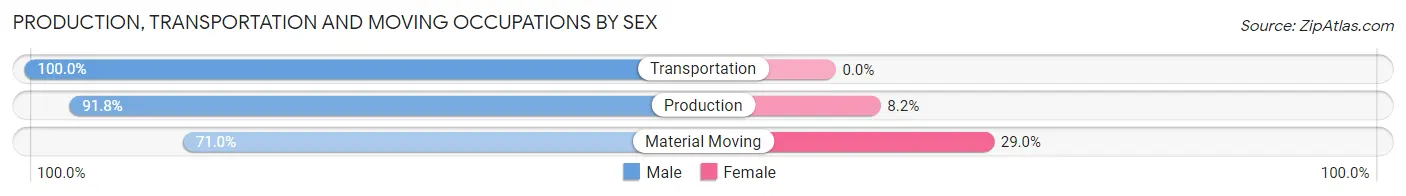
| Occupation | Male | Female |
| Production | 145 (91.8%) | 13 (8.2%) |
| Transportation | 14 (100.0%) | 0 (0.0%) |
| Material Moving | 22 (71.0%) | 9 (29.0%) |
| Total (Category) | 181 (89.2%) | 22 (10.8%) |
| Total (Overall) | 354 (51.4%) | 335 (48.6%) |
Employment Industries by Sex in Nashville
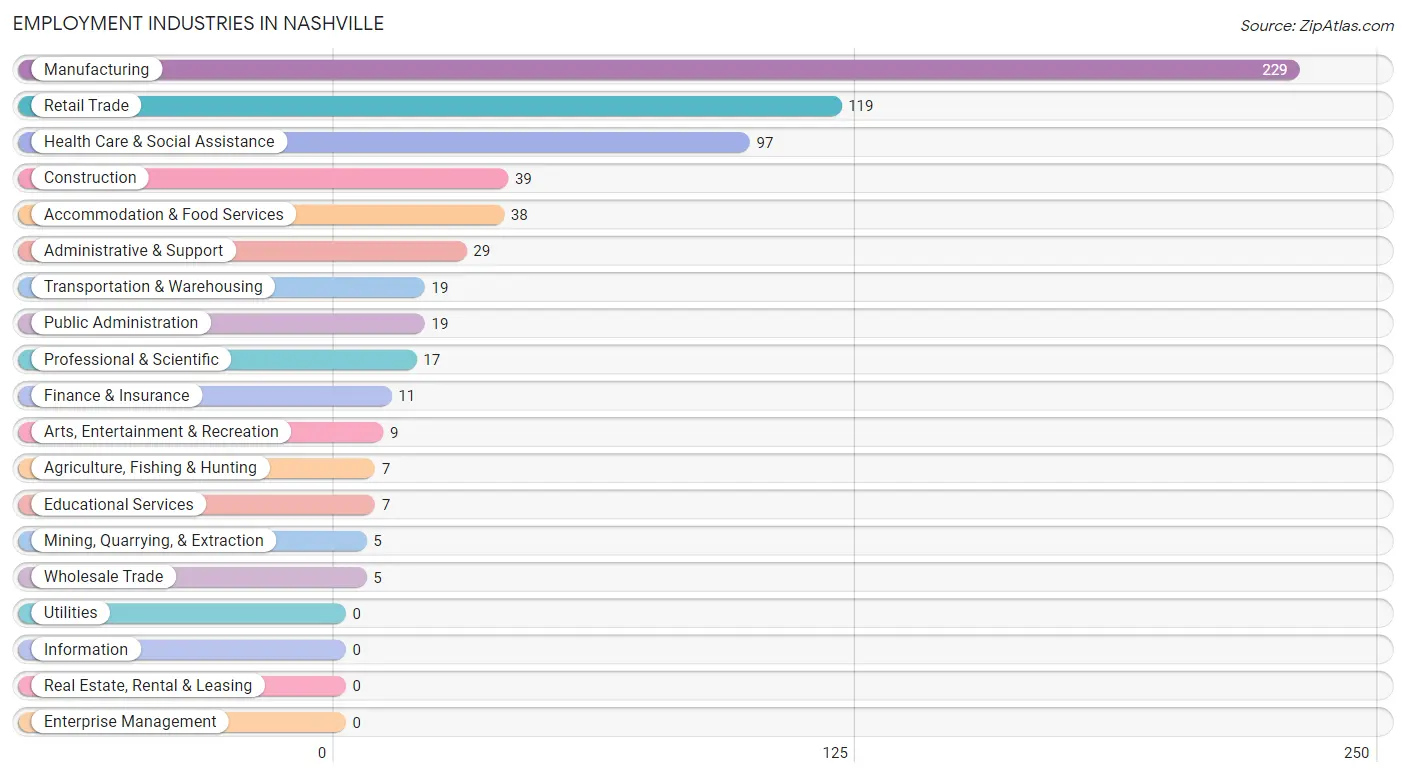
Employment Industries in Nashville
The major employment industries in Nashville include Manufacturing (229 | 33.2%), Retail Trade (119 | 17.3%), Health Care & Social Assistance (97 | 14.1%), Construction (39 | 5.7%), and Accommodation & Food Services (38 | 5.5%).
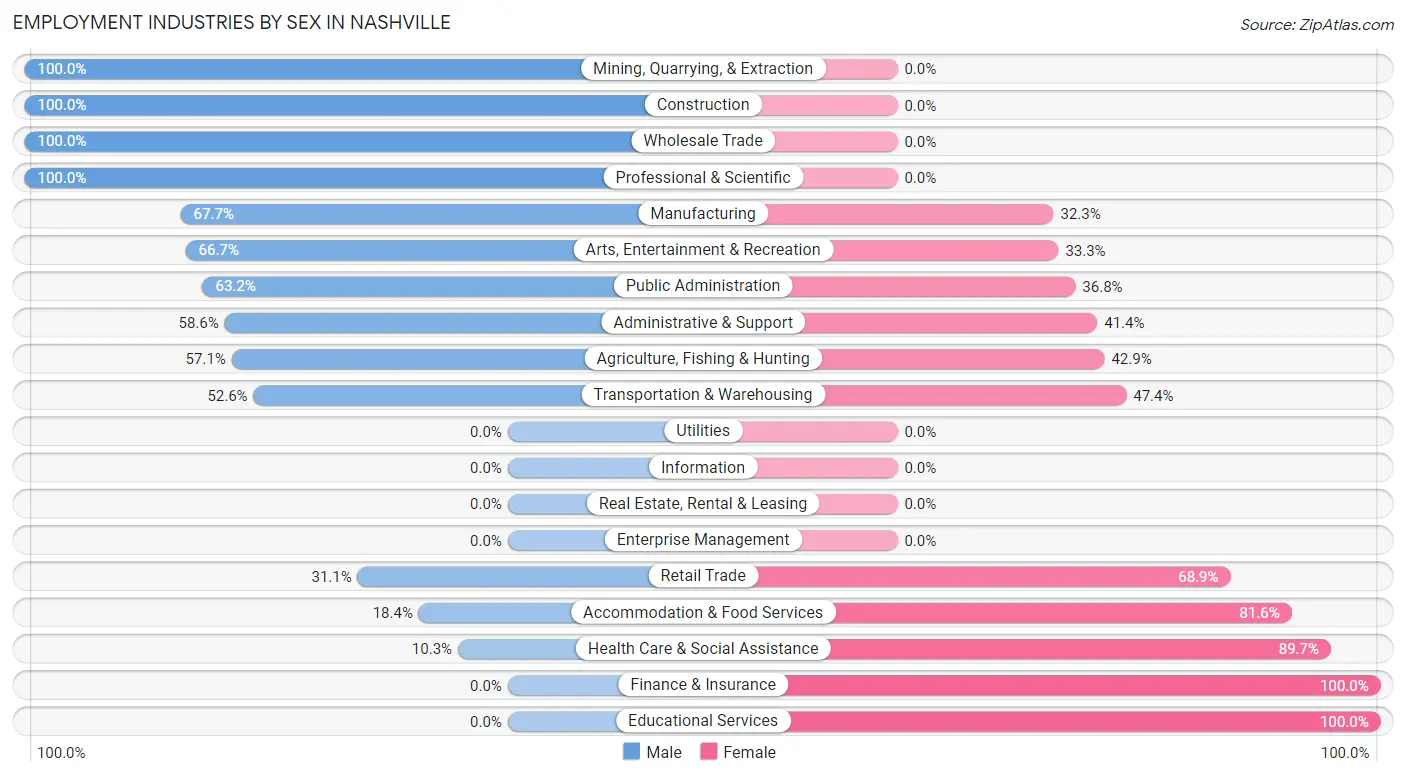
Employment Industries by Sex in Nashville
The Nashville industries that see more men than women are Mining, Quarrying, & Extraction (100.0%), Construction (100.0%), and Wholesale Trade (100.0%), whereas the industries that tend to have a higher number of women are Finance & Insurance (100.0%), Educational Services (100.0%), and Health Care & Social Assistance (89.7%).
| Industry | Male | Female |
| Agriculture, Fishing & Hunting | 4 (57.1%) | 3 (42.9%) |
| Mining, Quarrying, & Extraction | 5 (100.0%) | 0 (0.0%) |
| Construction | 39 (100.0%) | 0 (0.0%) |
| Manufacturing | 155 (67.7%) | 74 (32.3%) |
| Wholesale Trade | 5 (100.0%) | 0 (0.0%) |
| Retail Trade | 37 (31.1%) | 82 (68.9%) |
| Transportation & Warehousing | 10 (52.6%) | 9 (47.4%) |
| Utilities | 0 (0.0%) | 0 (0.0%) |
| Information | 0 (0.0%) | 0 (0.0%) |
| Finance & Insurance | 0 (0.0%) | 11 (100.0%) |
| Real Estate, Rental & Leasing | 0 (0.0%) | 0 (0.0%) |
| Professional & Scientific | 17 (100.0%) | 0 (0.0%) |
| Enterprise Management | 0 (0.0%) | 0 (0.0%) |
| Administrative & Support | 17 (58.6%) | 12 (41.4%) |
| Educational Services | 0 (0.0%) | 7 (100.0%) |
| Health Care & Social Assistance | 10 (10.3%) | 87 (89.7%) |
| Arts, Entertainment & Recreation | 6 (66.7%) | 3 (33.3%) |
| Accommodation & Food Services | 7 (18.4%) | 31 (81.6%) |
| Public Administration | 12 (63.2%) | 7 (36.8%) |
| Total | 354 (51.4%) | 335 (48.6%) |
Education in Nashville
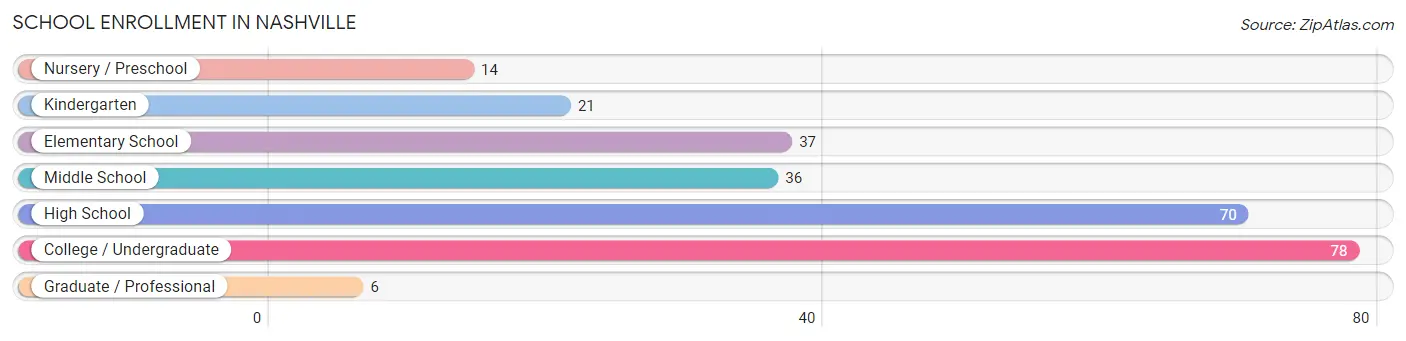
School Enrollment in Nashville
The most common levels of schooling among the 262 students in Nashville are college / undergraduate (78 | 29.8%), high school (70 | 26.7%), and elementary school (37 | 14.1%).
| School Level | # Students | % Students |
| Nursery / Preschool | 14 | 5.3% |
| Kindergarten | 21 | 8.0% |
| Elementary School | 37 | 14.1% |
| Middle School | 36 | 13.7% |
| High School | 70 | 26.7% |
| College / Undergraduate | 78 | 29.8% |
| Graduate / Professional | 6 | 2.3% |
| Total | 262 | 100.0% |
School Enrollment by Age by Funding Source in Nashville
Out of a total of 262 students who are enrolled in schools in Nashville, 6 (2.3%) attend a private institution, while the remaining 256 (97.7%) are enrolled in public schools. The age group of 20 to 24 year olds has the highest likelihood of being enrolled in private schools, with 3 (42.9% in the age bracket) enrolled. Conversely, the age group of 3 to 4 year olds has the lowest likelihood of being enrolled in a private school, with 14 (100.0% in the age bracket) attending a public institution.
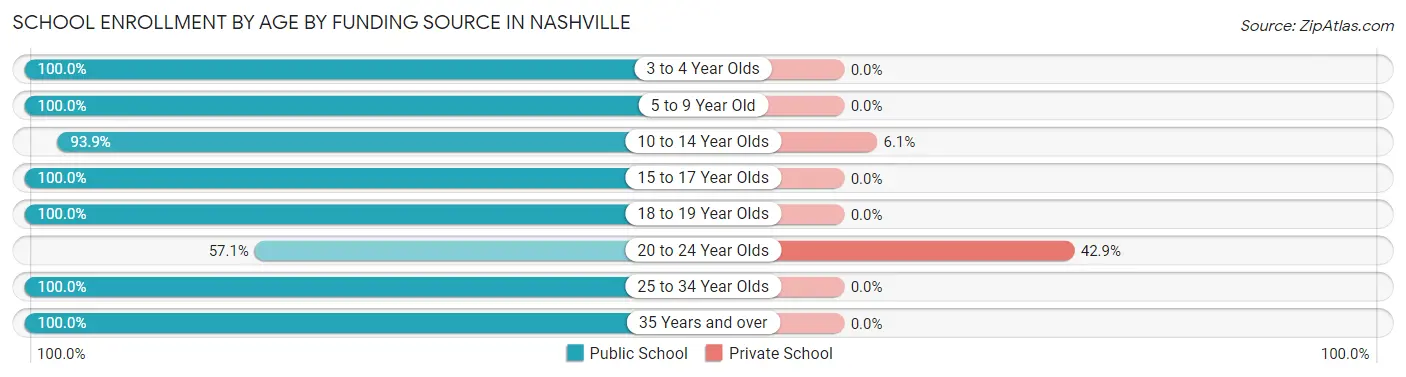
| Age Bracket | Public School | Private School |
| 3 to 4 Year Olds | 14 (100.0%) | 0 (0.0%) |
| 5 to 9 Year Old | 48 (100.0%) | 0 (0.0%) |
| 10 to 14 Year Olds | 46 (93.9%) | 3 (6.1%) |
| 15 to 17 Year Olds | 59 (100.0%) | 0 (0.0%) |
| 18 to 19 Year Olds | 8 (100.0%) | 0 (0.0%) |
| 20 to 24 Year Olds | 4 (57.1%) | 3 (42.9%) |
| 25 to 34 Year Olds | 7 (100.0%) | 0 (0.0%) |
| 35 Years and over | 70 (100.0%) | 0 (0.0%) |
| Total | 256 (97.7%) | 6 (2.3%) |
Educational Attainment by Field of Study in Nashville
Business (19 | 17.8%), social sciences (16 | 14.9%), education (16 | 14.9%), arts & humanities (14 | 13.1%), and literature & languages (9 | 8.4%) are the most common fields of study among 107 individuals in Nashville who have obtained a bachelor's degree or higher.
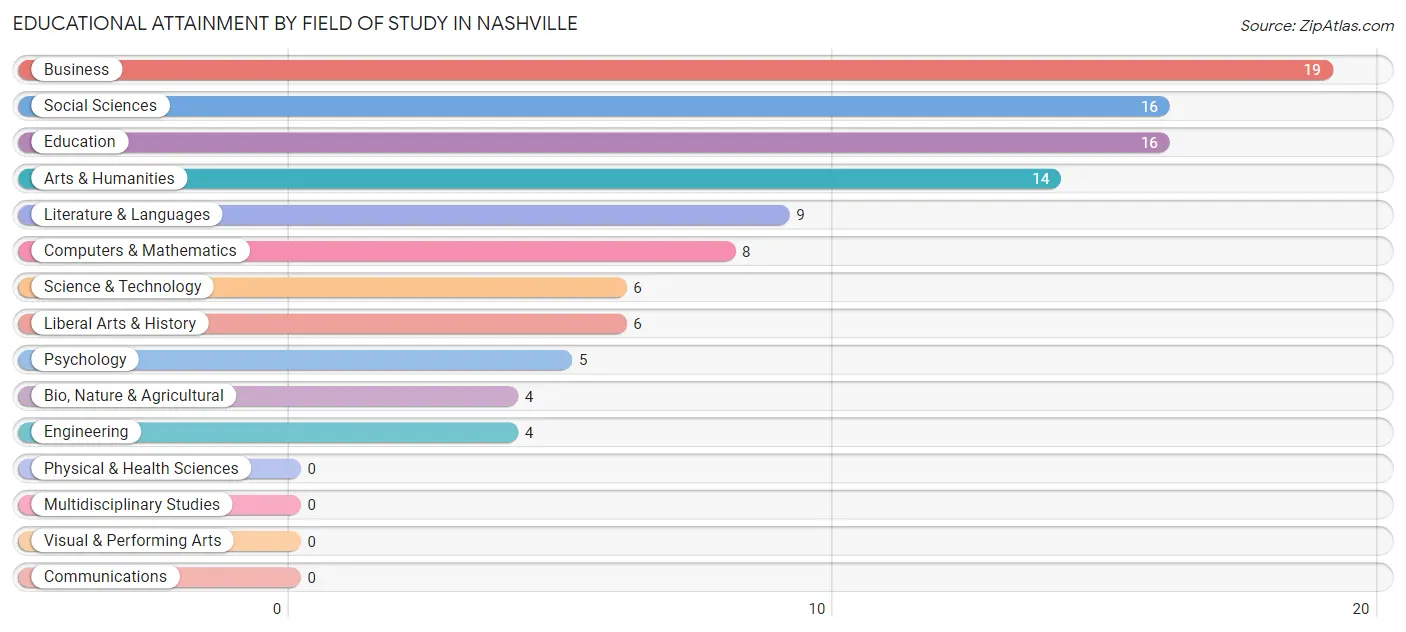
| Field of Study | # Graduates | % Graduates |
| Computers & Mathematics | 8 | 7.5% |
| Bio, Nature & Agricultural | 4 | 3.7% |
| Physical & Health Sciences | 0 | 0.0% |
| Psychology | 5 | 4.7% |
| Social Sciences | 16 | 14.9% |
| Engineering | 4 | 3.7% |
| Multidisciplinary Studies | 0 | 0.0% |
| Science & Technology | 6 | 5.6% |
| Business | 19 | 17.8% |
| Education | 16 | 14.9% |
| Literature & Languages | 9 | 8.4% |
| Liberal Arts & History | 6 | 5.6% |
| Visual & Performing Arts | 0 | 0.0% |
| Communications | 0 | 0.0% |
| Arts & Humanities | 14 | 13.1% |
| Total | 107 | 100.0% |
Transportation & Commute in Nashville
Vehicle Availability by Sex in Nashville
The most prevalent vehicle ownership categories in Nashville are males with 3 vehicles (120, accounting for 34.6%) and females with 3 vehicles (102, making up 36.2%).
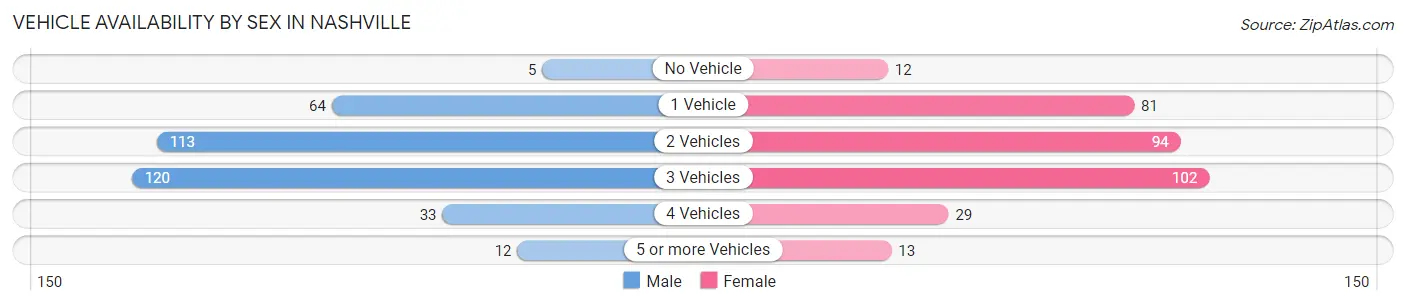
| Vehicles Available | Male | Female |
| No Vehicle | 5 (1.4%) | 12 (3.6%) |
| 1 Vehicle | 64 (18.4%) | 81 (24.5%) |
| 2 Vehicles | 113 (32.6%) | 94 (28.4%) |
| 3 Vehicles | 120 (34.6%) | 102 (30.8%) |
| 4 Vehicles | 33 (9.5%) | 29 (8.8%) |
| 5 or more Vehicles | 12 (3.5%) | 13 (3.9%) |
| Total | 347 (100.0%) | 331 (100.0%) |
Commute Time in Nashville
The most frequently occuring commute durations in Nashville are 40 to 44 minutes (151 commuters, 23.2%), 30 to 34 minutes (101 commuters, 15.5%), and 20 to 24 minutes (77 commuters, 11.8%).
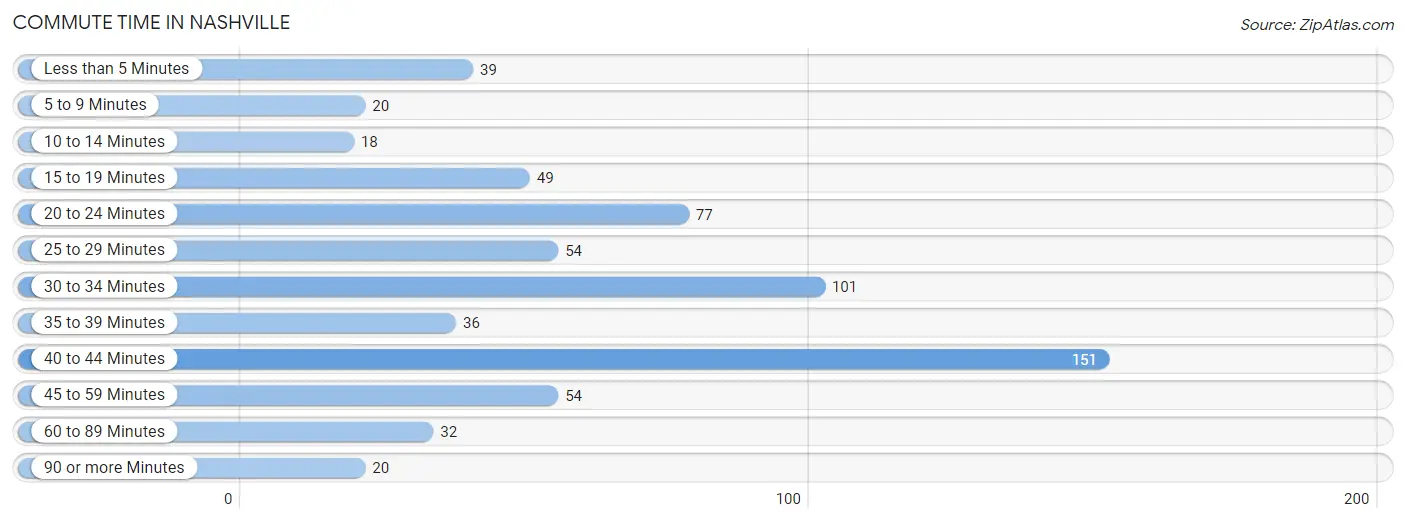
| Commute Time | # Commuters | % Commuters |
| Less than 5 Minutes | 39 | 6.0% |
| 5 to 9 Minutes | 20 | 3.1% |
| 10 to 14 Minutes | 18 | 2.8% |
| 15 to 19 Minutes | 49 | 7.5% |
| 20 to 24 Minutes | 77 | 11.8% |
| 25 to 29 Minutes | 54 | 8.3% |
| 30 to 34 Minutes | 101 | 15.5% |
| 35 to 39 Minutes | 36 | 5.5% |
| 40 to 44 Minutes | 151 | 23.2% |
| 45 to 59 Minutes | 54 | 8.3% |
| 60 to 89 Minutes | 32 | 4.9% |
| 90 or more Minutes | 20 | 3.1% |
Commute Time by Sex in Nashville
The most common commute times in Nashville are 40 to 44 minutes (82 commuters, 24.0%) for males and 40 to 44 minutes (69 commuters, 22.3%) for females.
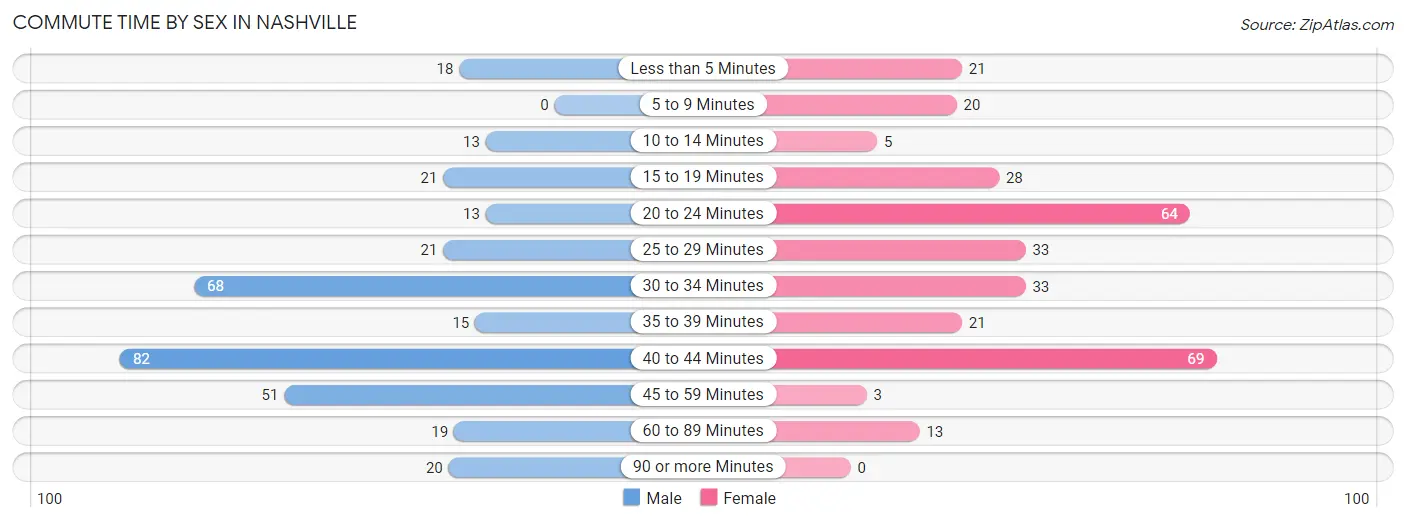
| Commute Time | Male | Female |
| Less than 5 Minutes | 18 (5.3%) | 21 (6.8%) |
| 5 to 9 Minutes | 0 (0.0%) | 20 (6.5%) |
| 10 to 14 Minutes | 13 (3.8%) | 5 (1.6%) |
| 15 to 19 Minutes | 21 (6.2%) | 28 (9.0%) |
| 20 to 24 Minutes | 13 (3.8%) | 64 (20.6%) |
| 25 to 29 Minutes | 21 (6.2%) | 33 (10.6%) |
| 30 to 34 Minutes | 68 (19.9%) | 33 (10.6%) |
| 35 to 39 Minutes | 15 (4.4%) | 21 (6.8%) |
| 40 to 44 Minutes | 82 (24.0%) | 69 (22.3%) |
| 45 to 59 Minutes | 51 (15.0%) | 3 (1.0%) |
| 60 to 89 Minutes | 19 (5.6%) | 13 (4.2%) |
| 90 or more Minutes | 20 (5.9%) | 0 (0.0%) |
Time of Departure to Work by Sex in Nashville
The most frequent times of departure to work in Nashville are 12:00 PM to 3:59 PM (91, 26.7%) for males and 5:30 AM to 5:59 AM (57, 18.4%) for females.
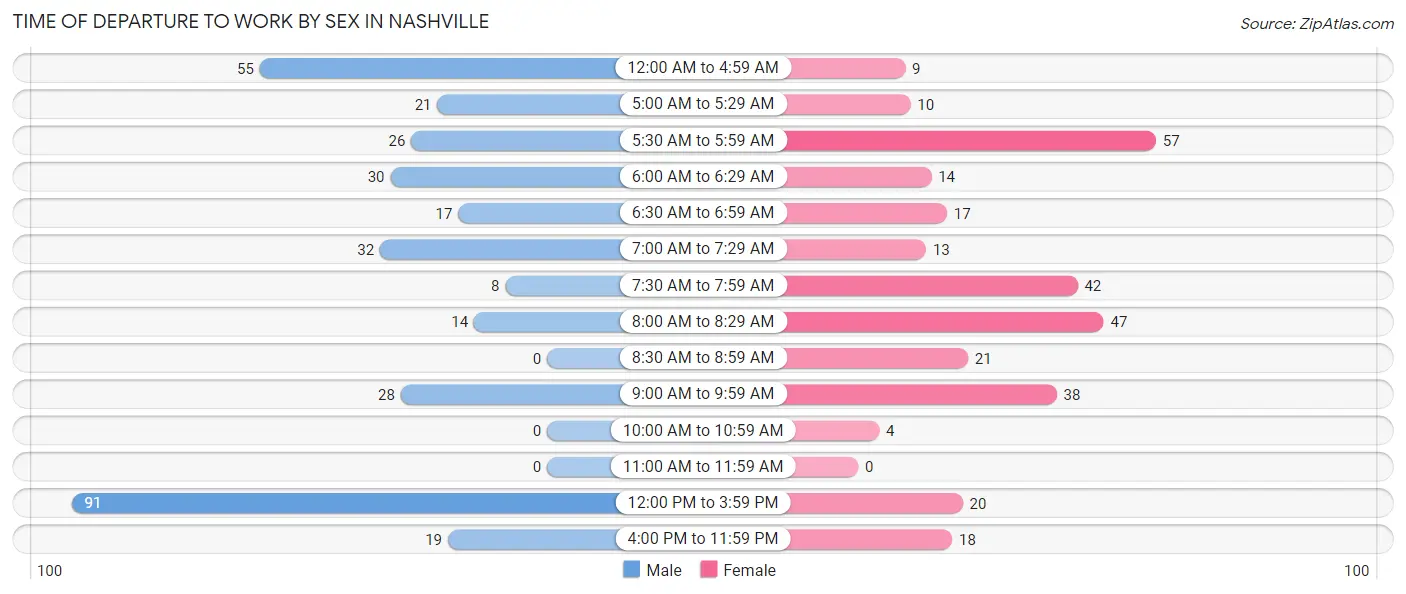
| Time of Departure | Male | Female |
| 12:00 AM to 4:59 AM | 55 (16.1%) | 9 (2.9%) |
| 5:00 AM to 5:29 AM | 21 (6.2%) | 10 (3.2%) |
| 5:30 AM to 5:59 AM | 26 (7.6%) | 57 (18.4%) |
| 6:00 AM to 6:29 AM | 30 (8.8%) | 14 (4.5%) |
| 6:30 AM to 6:59 AM | 17 (5.0%) | 17 (5.5%) |
| 7:00 AM to 7:29 AM | 32 (9.4%) | 13 (4.2%) |
| 7:30 AM to 7:59 AM | 8 (2.4%) | 42 (13.6%) |
| 8:00 AM to 8:29 AM | 14 (4.1%) | 47 (15.2%) |
| 8:30 AM to 8:59 AM | 0 (0.0%) | 21 (6.8%) |
| 9:00 AM to 9:59 AM | 28 (8.2%) | 38 (12.3%) |
| 10:00 AM to 10:59 AM | 0 (0.0%) | 4 (1.3%) |
| 11:00 AM to 11:59 AM | 0 (0.0%) | 0 (0.0%) |
| 12:00 PM to 3:59 PM | 91 (26.7%) | 20 (6.5%) |
| 4:00 PM to 11:59 PM | 19 (5.6%) | 18 (5.8%) |
| Total | 341 (100.0%) | 310 (100.0%) |
Housing Occupancy in Nashville
Occupancy by Ownership in Nashville
Of the total 606 dwellings in Nashville, owner-occupied units account for 380 (62.7%), while renter-occupied units make up 226 (37.3%).
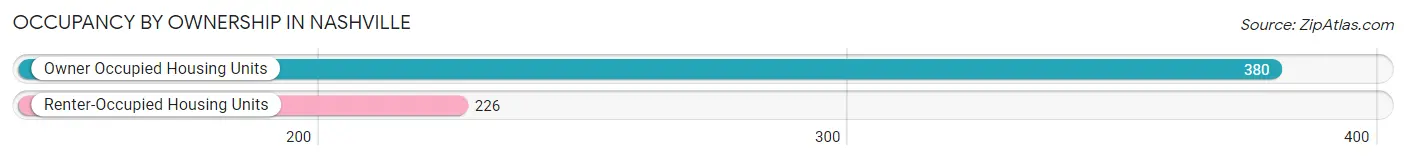
| Occupancy | # Housing Units | % Housing Units |
| Owner Occupied Housing Units | 380 | 62.7% |
| Renter-Occupied Housing Units | 226 | 37.3% |
| Total Occupied Housing Units | 606 | 100.0% |
Occupancy by Household Size in Nashville
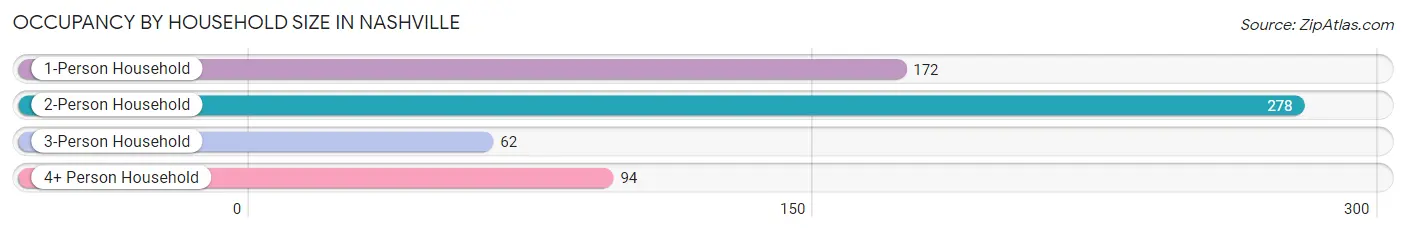
| Household Size | # Housing Units | % Housing Units |
| 1-Person Household | 172 | 28.4% |
| 2-Person Household | 278 | 45.9% |
| 3-Person Household | 62 | 10.2% |
| 4+ Person Household | 94 | 15.5% |
| Total Housing Units | 606 | 100.0% |
Occupancy by Ownership by Household Size in Nashville
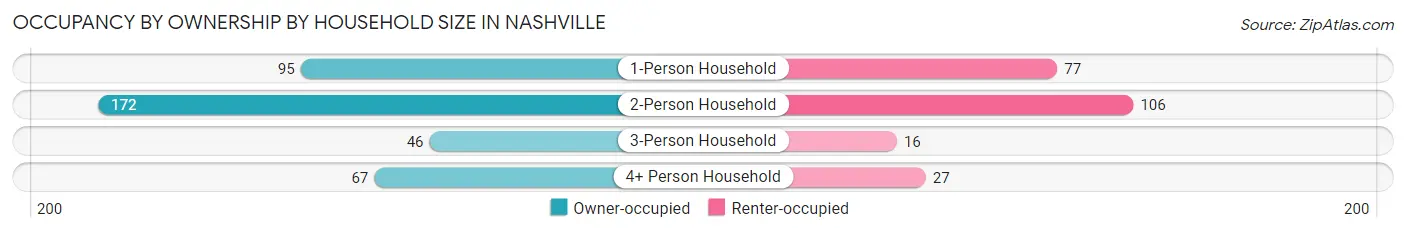
| Household Size | Owner-occupied | Renter-occupied |
| 1-Person Household | 95 (55.2%) | 77 (44.8%) |
| 2-Person Household | 172 (61.9%) | 106 (38.1%) |
| 3-Person Household | 46 (74.2%) | 16 (25.8%) |
| 4+ Person Household | 67 (71.3%) | 27 (28.7%) |
| Total Housing Units | 380 (62.7%) | 226 (37.3%) |
Occupancy by Educational Attainment in Nashville
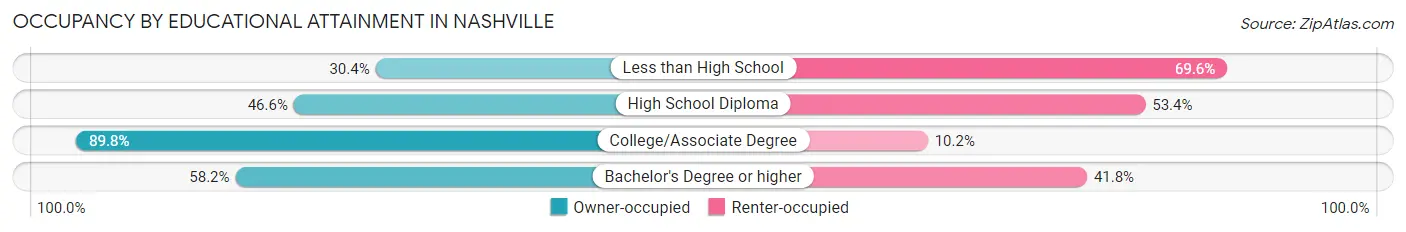
| Household Size | Owner-occupied | Renter-occupied |
| Less than High School | 14 (30.4%) | 32 (69.6%) |
| High School Diploma | 125 (46.6%) | 143 (53.4%) |
| College/Associate Degree | 202 (89.8%) | 23 (10.2%) |
| Bachelor's Degree or higher | 39 (58.2%) | 28 (41.8%) |
Occupancy by Age of Householder in Nashville
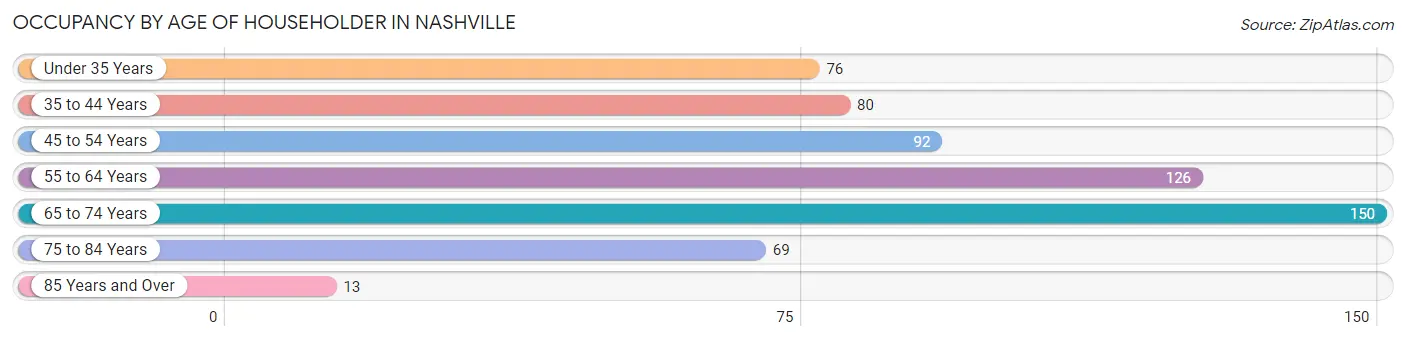
| Age Bracket | # Households | % Households |
| Under 35 Years | 76 | 12.5% |
| 35 to 44 Years | 80 | 13.2% |
| 45 to 54 Years | 92 | 15.2% |
| 55 to 64 Years | 126 | 20.8% |
| 65 to 74 Years | 150 | 24.7% |
| 75 to 84 Years | 69 | 11.4% |
| 85 Years and Over | 13 | 2.1% |
| Total | 606 | 100.0% |
Housing Finances in Nashville
Median Income by Occupancy in Nashville
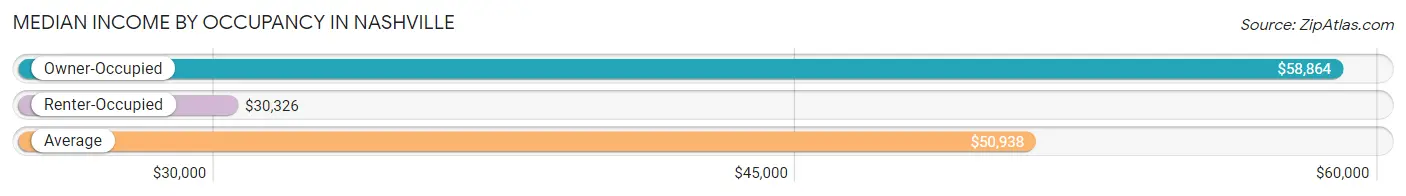
| Occupancy Type | # Households | Median Income |
| Owner-Occupied | 380 (62.7%) | $58,864 |
| Renter-Occupied | 226 (37.3%) | $30,326 |
| Average | 606 (100.0%) | $50,938 |
Occupancy by Householder Income Bracket in Nashville
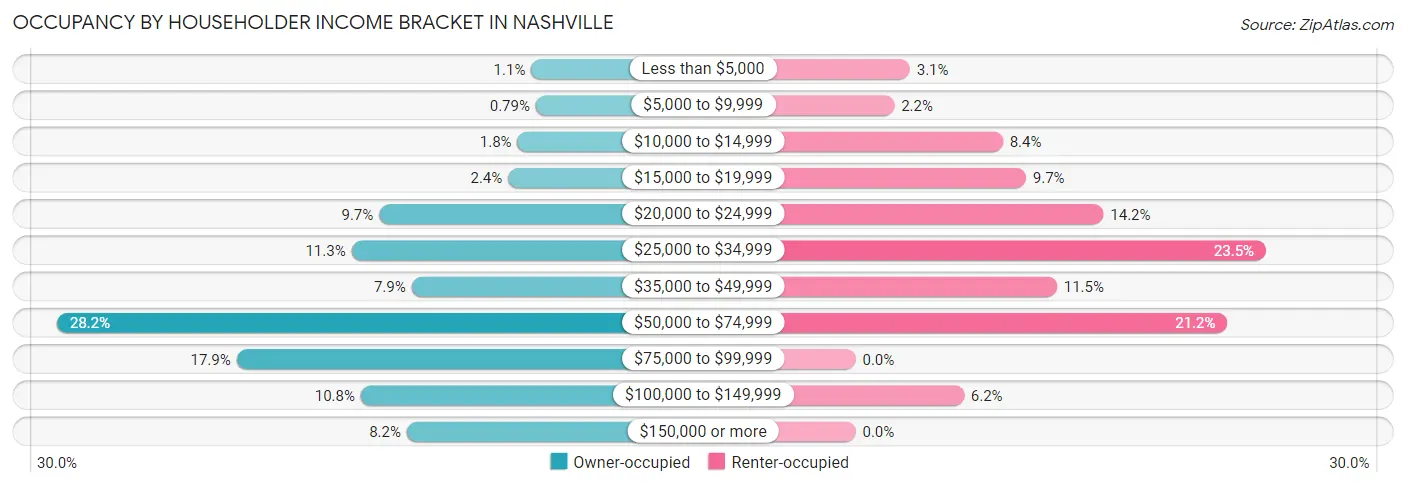
| Income Bracket | Owner-occupied | Renter-occupied |
| Less than $5,000 | 4 (1.1%) | 7 (3.1%) |
| $5,000 to $9,999 | 3 (0.8%) | 5 (2.2%) |
| $10,000 to $14,999 | 7 (1.8%) | 19 (8.4%) |
| $15,000 to $19,999 | 9 (2.4%) | 22 (9.7%) |
| $20,000 to $24,999 | 37 (9.7%) | 32 (14.2%) |
| $25,000 to $34,999 | 43 (11.3%) | 53 (23.4%) |
| $35,000 to $49,999 | 30 (7.9%) | 26 (11.5%) |
| $50,000 to $74,999 | 107 (28.2%) | 48 (21.2%) |
| $75,000 to $99,999 | 68 (17.9%) | 0 (0.0%) |
| $100,000 to $149,999 | 41 (10.8%) | 14 (6.2%) |
| $150,000 or more | 31 (8.2%) | 0 (0.0%) |
| Total | 380 (100.0%) | 226 (100.0%) |
Monthly Housing Cost Tiers in Nashville
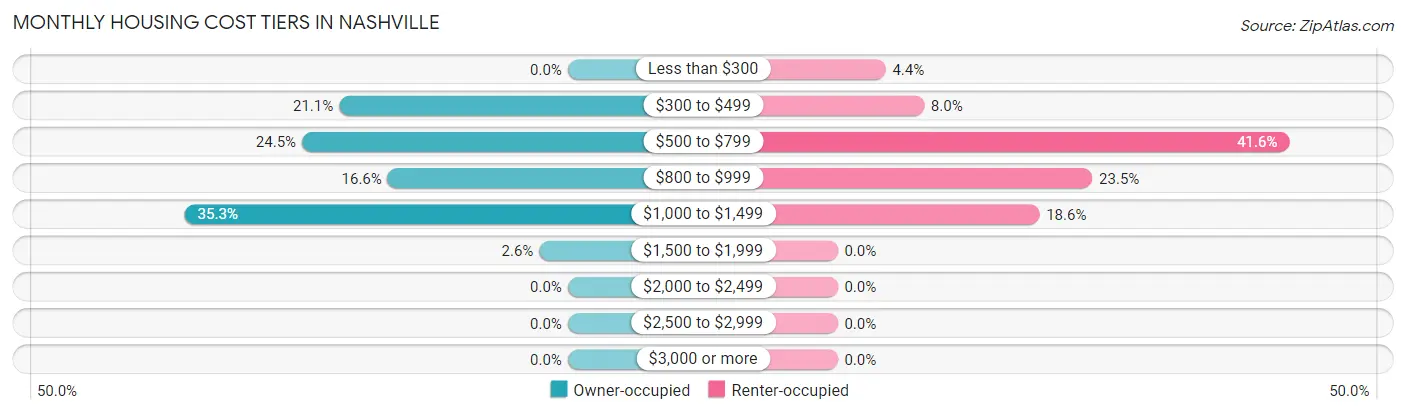
| Monthly Cost | Owner-occupied | Renter-occupied |
| Less than $300 | 0 (0.0%) | 10 (4.4%) |
| $300 to $499 | 80 (21.0%) | 18 (8.0%) |
| $500 to $799 | 93 (24.5%) | 94 (41.6%) |
| $800 to $999 | 63 (16.6%) | 53 (23.4%) |
| $1,000 to $1,499 | 134 (35.3%) | 42 (18.6%) |
| $1,500 to $1,999 | 10 (2.6%) | 0 (0.0%) |
| $2,000 to $2,499 | 0 (0.0%) | 0 (0.0%) |
| $2,500 to $2,999 | 0 (0.0%) | 0 (0.0%) |
| $3,000 or more | 0 (0.0%) | 0 (0.0%) |
| Total | 380 (100.0%) | 226 (100.0%) |
Physical Housing Characteristics in Nashville
Housing Structures in Nashville
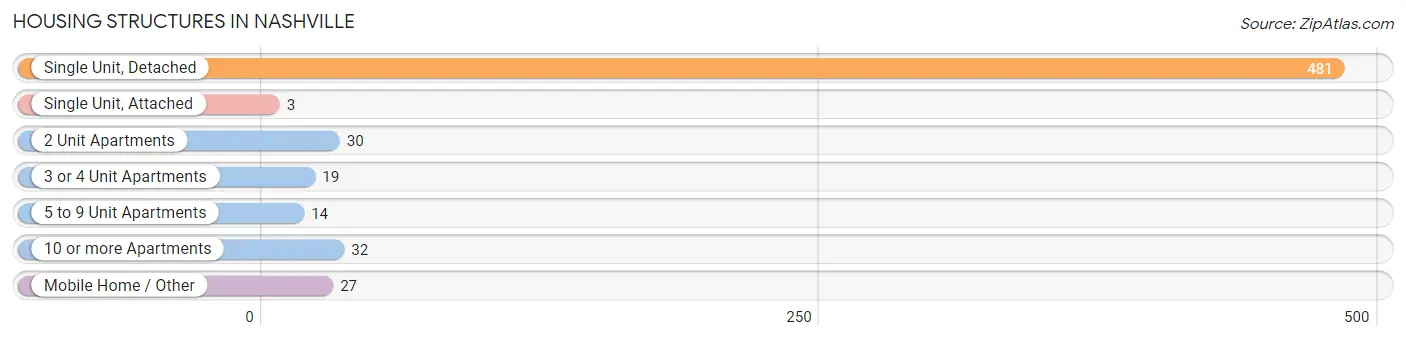
| Structure Type | # Housing Units | % Housing Units |
| Single Unit, Detached | 481 | 79.4% |
| Single Unit, Attached | 3 | 0.5% |
| 2 Unit Apartments | 30 | 5.0% |
| 3 or 4 Unit Apartments | 19 | 3.1% |
| 5 to 9 Unit Apartments | 14 | 2.3% |
| 10 or more Apartments | 32 | 5.3% |
| Mobile Home / Other | 27 | 4.5% |
| Total | 606 | 100.0% |
Housing Structures by Occupancy in Nashville
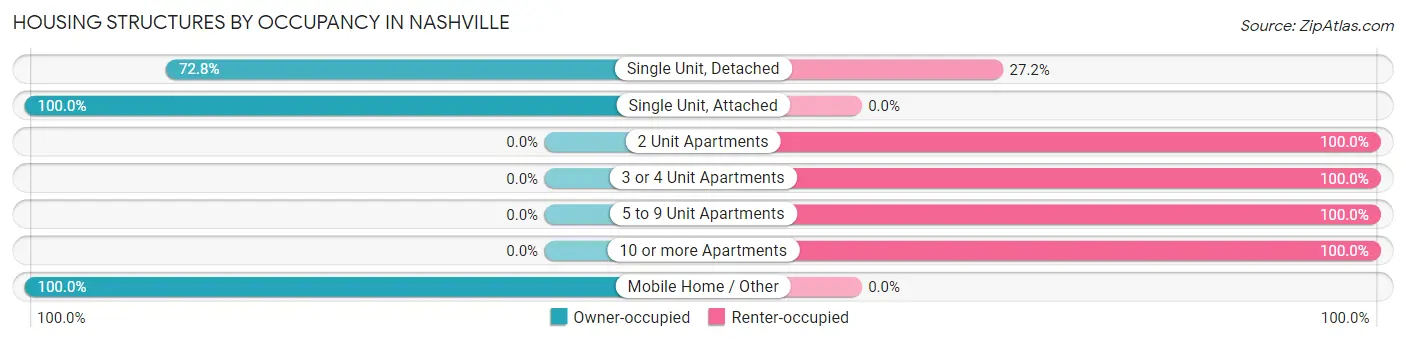
| Structure Type | Owner-occupied | Renter-occupied |
| Single Unit, Detached | 350 (72.8%) | 131 (27.2%) |
| Single Unit, Attached | 3 (100.0%) | 0 (0.0%) |
| 2 Unit Apartments | 0 (0.0%) | 30 (100.0%) |
| 3 or 4 Unit Apartments | 0 (0.0%) | 19 (100.0%) |
| 5 to 9 Unit Apartments | 0 (0.0%) | 14 (100.0%) |
| 10 or more Apartments | 0 (0.0%) | 32 (100.0%) |
| Mobile Home / Other | 27 (100.0%) | 0 (0.0%) |
| Total | 380 (62.7%) | 226 (37.3%) |
Housing Structures by Number of Rooms in Nashville
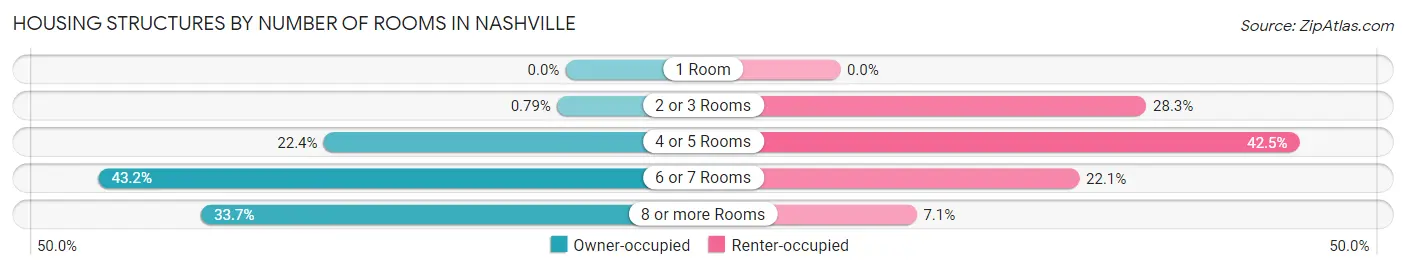
| Number of Rooms | Owner-occupied | Renter-occupied |
| 1 Room | 0 (0.0%) | 0 (0.0%) |
| 2 or 3 Rooms | 3 (0.8%) | 64 (28.3%) |
| 4 or 5 Rooms | 85 (22.4%) | 96 (42.5%) |
| 6 or 7 Rooms | 164 (43.2%) | 50 (22.1%) |
| 8 or more Rooms | 128 (33.7%) | 16 (7.1%) |
| Total | 380 (100.0%) | 226 (100.0%) |
Housing Structure by Heating Type in Nashville
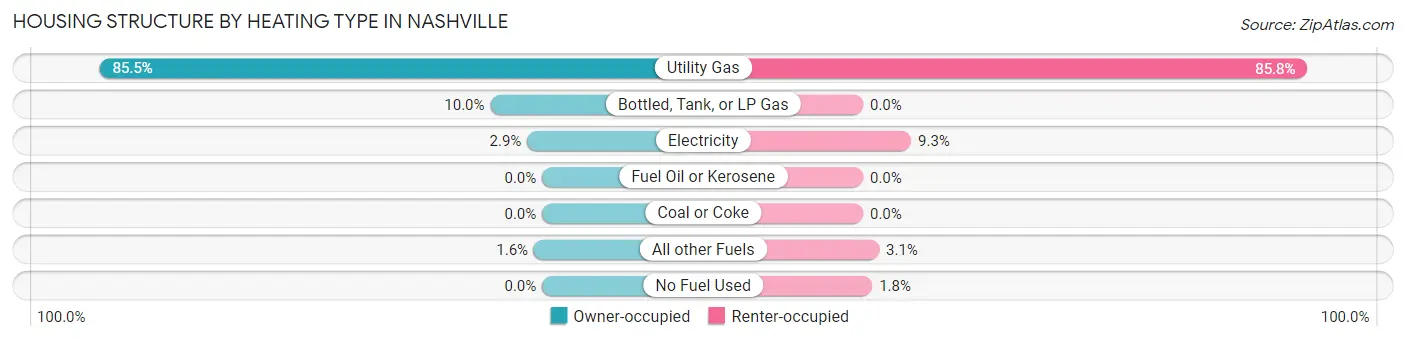
| Heating Type | Owner-occupied | Renter-occupied |
| Utility Gas | 325 (85.5%) | 194 (85.8%) |
| Bottled, Tank, or LP Gas | 38 (10.0%) | 0 (0.0%) |
| Electricity | 11 (2.9%) | 21 (9.3%) |
| Fuel Oil or Kerosene | 0 (0.0%) | 0 (0.0%) |
| Coal or Coke | 0 (0.0%) | 0 (0.0%) |
| All other Fuels | 6 (1.6%) | 7 (3.1%) |
| No Fuel Used | 0 (0.0%) | 4 (1.8%) |
| Total | 380 (100.0%) | 226 (100.0%) |
Household Vehicle Usage in Nashville
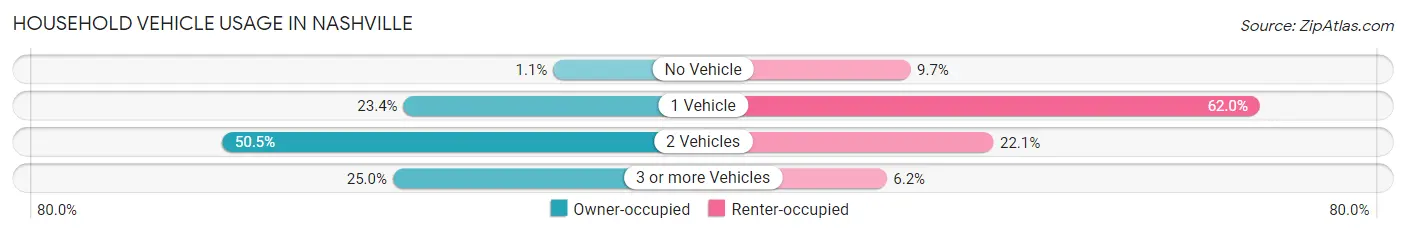
| Vehicles per Household | Owner-occupied | Renter-occupied |
| No Vehicle | 4 (1.1%) | 22 (9.7%) |
| 1 Vehicle | 89 (23.4%) | 140 (62.0%) |
| 2 Vehicles | 192 (50.5%) | 50 (22.1%) |
| 3 or more Vehicles | 95 (25.0%) | 14 (6.2%) |
| Total | 380 (100.0%) | 226 (100.0%) |
Real Estate & Mortgages in Nashville
Real Estate and Mortgage Overview in Nashville
| Characteristic | Without Mortgage | With Mortgage |
| Housing Units | 130 | 250 |
| Median Property Value | $82,000 | $117,300 |
| Median Household Income | $56,429 | $28 |
| Monthly Housing Costs | $470 | $0 |
| Real Estate Taxes | $1,319 | $3 |
Property Value by Mortgage Status in Nashville
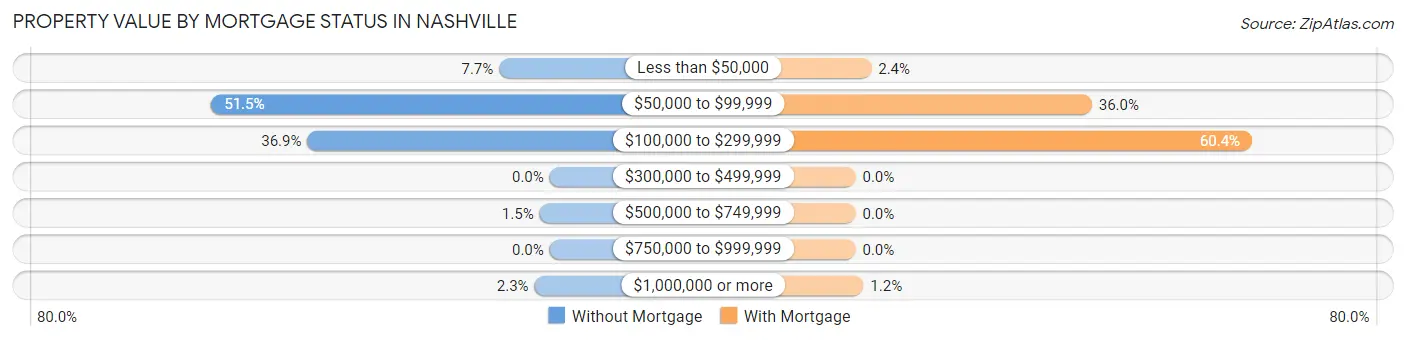
| Property Value | Without Mortgage | With Mortgage |
| Less than $50,000 | 10 (7.7%) | 6 (2.4%) |
| $50,000 to $99,999 | 67 (51.5%) | 90 (36.0%) |
| $100,000 to $299,999 | 48 (36.9%) | 151 (60.4%) |
| $300,000 to $499,999 | 0 (0.0%) | 0 (0.0%) |
| $500,000 to $749,999 | 2 (1.5%) | 0 (0.0%) |
| $750,000 to $999,999 | 0 (0.0%) | 0 (0.0%) |
| $1,000,000 or more | 3 (2.3%) | 3 (1.2%) |
| Total | 130 (100.0%) | 250 (100.0%) |
Household Income by Mortgage Status in Nashville
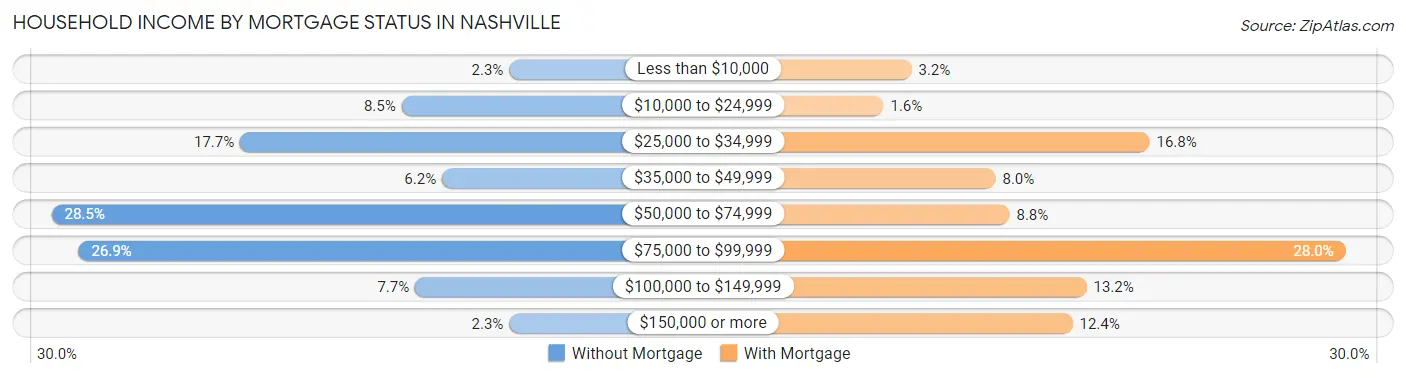
| Household Income | Without Mortgage | With Mortgage |
| Less than $10,000 | 3 (2.3%) | 8 (3.2%) |
| $10,000 to $24,999 | 11 (8.5%) | 4 (1.6%) |
| $25,000 to $34,999 | 23 (17.7%) | 42 (16.8%) |
| $35,000 to $49,999 | 8 (6.1%) | 20 (8.0%) |
| $50,000 to $74,999 | 37 (28.5%) | 22 (8.8%) |
| $75,000 to $99,999 | 35 (26.9%) | 70 (28.0%) |
| $100,000 to $149,999 | 10 (7.7%) | 33 (13.2%) |
| $150,000 or more | 3 (2.3%) | 31 (12.4%) |
| Total | 130 (100.0%) | 250 (100.0%) |
Property Value to Household Income Ratio in Nashville
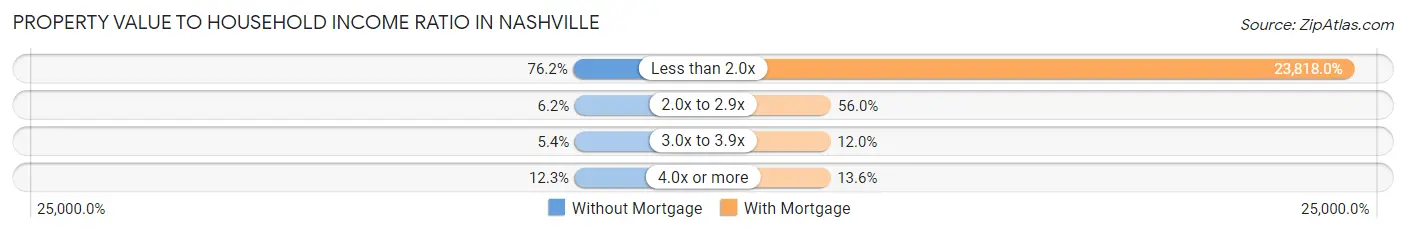
| Value-to-Income Ratio | Without Mortgage | With Mortgage |
| Less than 2.0x | 99 (76.1%) | 59,545 (23,818.0%) |
| 2.0x to 2.9x | 8 (6.1%) | 140 (56.0%) |
| 3.0x to 3.9x | 7 (5.4%) | 30 (12.0%) |
| 4.0x or more | 16 (12.3%) | 34 (13.6%) |
| Total | 130 (100.0%) | 250 (100.0%) |
Real Estate Taxes by Mortgage Status in Nashville
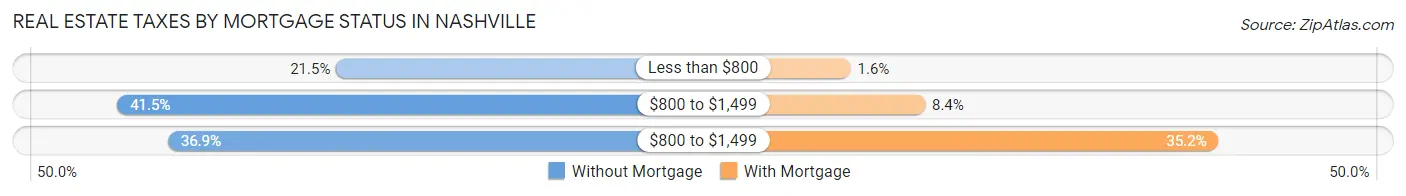
| Property Taxes | Without Mortgage | With Mortgage |
| Less than $800 | 28 (21.5%) | 4 (1.6%) |
| $800 to $1,499 | 54 (41.5%) | 21 (8.4%) |
| $800 to $1,499 | 48 (36.9%) | 88 (35.2%) |
| Total | 130 (100.0%) | 250 (100.0%) |
Health & Disability in Nashville
Health Insurance Coverage by Age in Nashville
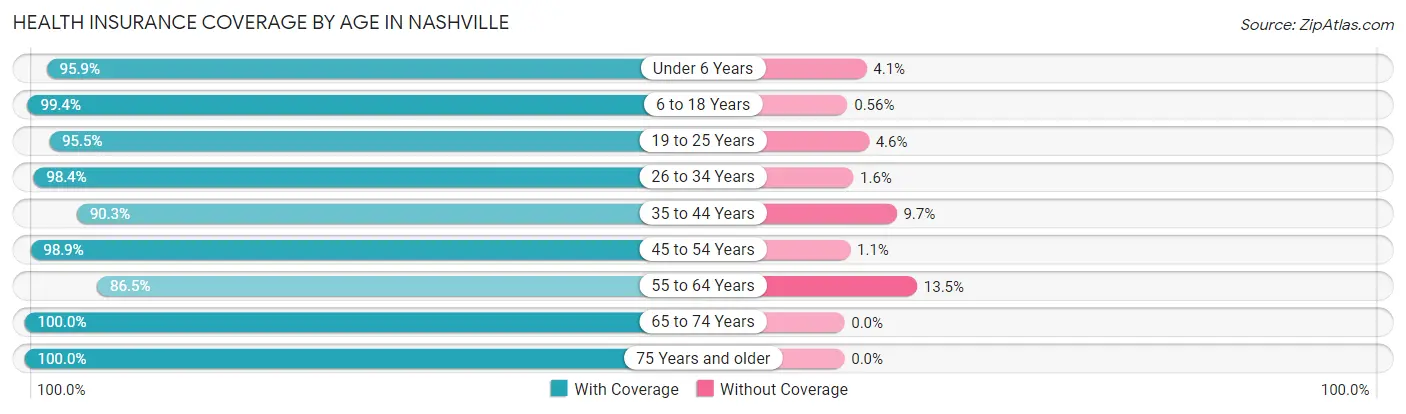
| Age Bracket | With Coverage | Without Coverage |
| Under 6 Years | 70 (95.9%) | 3 (4.1%) |
| 6 to 18 Years | 178 (99.4%) | 1 (0.6%) |
| 19 to 25 Years | 84 (95.5%) | 4 (4.5%) |
| 26 to 34 Years | 120 (98.4%) | 2 (1.6%) |
| 35 to 44 Years | 167 (90.3%) | 18 (9.7%) |
| 45 to 54 Years | 275 (98.9%) | 3 (1.1%) |
| 55 to 64 Years | 179 (86.5%) | 28 (13.5%) |
| 65 to 74 Years | 211 (100.0%) | 0 (0.0%) |
| 75 Years and older | 97 (100.0%) | 0 (0.0%) |
| Total | 1,381 (95.9%) | 59 (4.1%) |
Health Insurance Coverage by Citizenship Status in Nashville
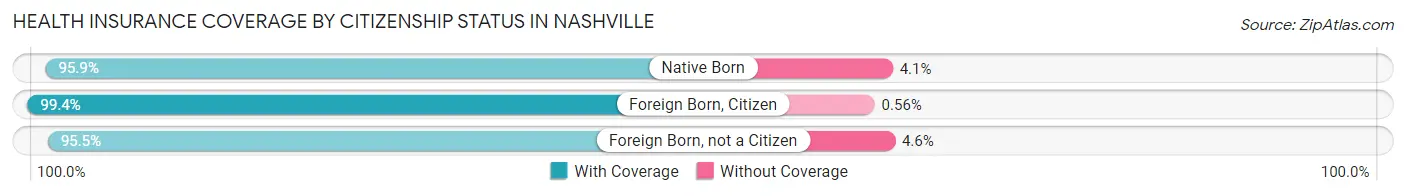
| Citizenship Status | With Coverage | Without Coverage |
| Native Born | 70 (95.9%) | 3 (4.1%) |
| Foreign Born, Citizen | 178 (99.4%) | 1 (0.6%) |
| Foreign Born, not a Citizen | 84 (95.5%) | 4 (4.5%) |
Health Insurance Coverage by Household Income in Nashville
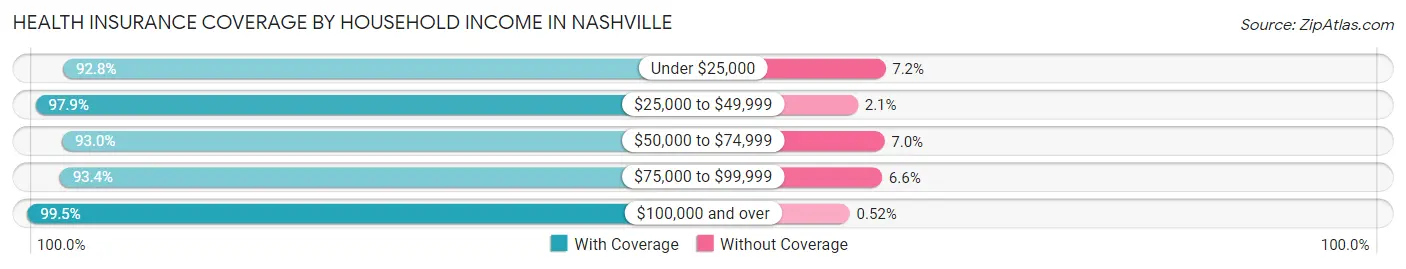
| Household Income | With Coverage | Without Coverage |
| Under $25,000 | 193 (92.8%) | 15 (7.2%) |
| $25,000 to $49,999 | 333 (97.9%) | 7 (2.1%) |
| $50,000 to $74,999 | 330 (93.0%) | 25 (7.0%) |
| $75,000 to $99,999 | 142 (93.4%) | 10 (6.6%) |
| $100,000 and over | 383 (99.5%) | 2 (0.5%) |
Public vs Private Health Insurance Coverage by Age in Nashville
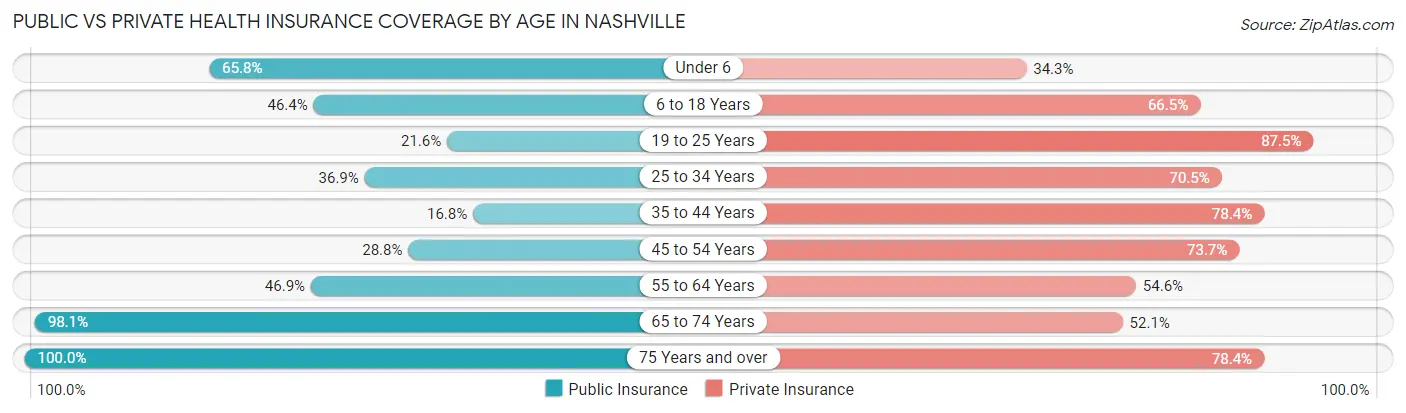
| Age Bracket | Public Insurance | Private Insurance |
| Under 6 | 48 (65.7%) | 25 (34.3%) |
| 6 to 18 Years | 83 (46.4%) | 119 (66.5%) |
| 19 to 25 Years | 19 (21.6%) | 77 (87.5%) |
| 25 to 34 Years | 45 (36.9%) | 86 (70.5%) |
| 35 to 44 Years | 31 (16.8%) | 145 (78.4%) |
| 45 to 54 Years | 80 (28.8%) | 205 (73.7%) |
| 55 to 64 Years | 97 (46.9%) | 113 (54.6%) |
| 65 to 74 Years | 207 (98.1%) | 110 (52.1%) |
| 75 Years and over | 97 (100.0%) | 76 (78.3%) |
| Total | 707 (49.1%) | 956 (66.4%) |
Disability Status by Sex by Age in Nashville
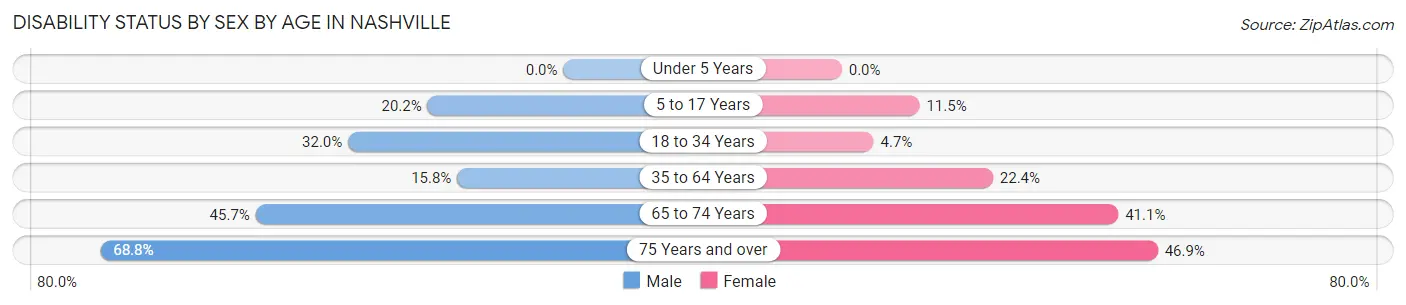
| Age Bracket | Male | Female |
| Under 5 Years | 0 (0.0%) | 0 (0.0%) |
| 5 to 17 Years | 24 (20.2%) | 6 (11.5%) |
| 18 to 34 Years | 31 (32.0%) | 6 (4.7%) |
| 35 to 64 Years | 55 (15.8%) | 72 (22.4%) |
| 65 to 74 Years | 53 (45.7%) | 39 (41.0%) |
| 75 Years and over | 11 (68.8%) | 38 (46.9%) |
Disability Class by Sex by Age in Nashville
Disability Class: Hearing Difficulty
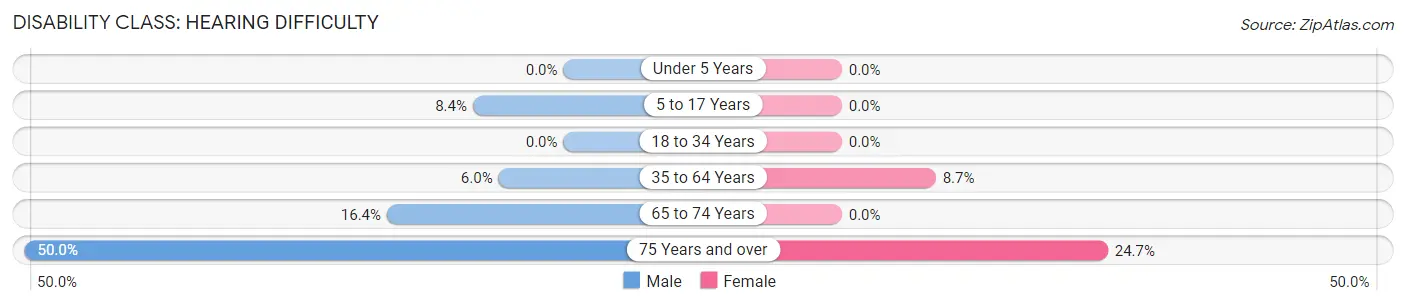
| Age Bracket | Male | Female |
| Under 5 Years | 0 (0.0%) | 0 (0.0%) |
| 5 to 17 Years | 10 (8.4%) | 0 (0.0%) |
| 18 to 34 Years | 0 (0.0%) | 0 (0.0%) |
| 35 to 64 Years | 21 (6.0%) | 28 (8.7%) |
| 65 to 74 Years | 19 (16.4%) | 0 (0.0%) |
| 75 Years and over | 8 (50.0%) | 20 (24.7%) |
Disability Class: Vision Difficulty
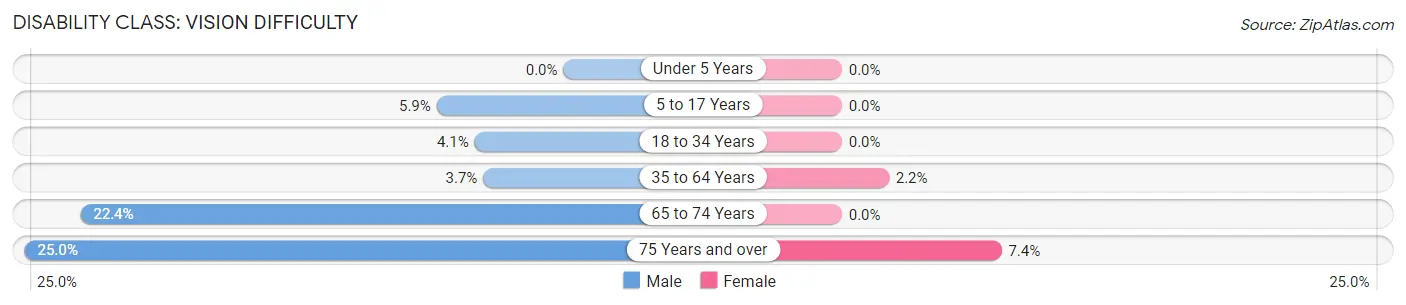
| Age Bracket | Male | Female |
| Under 5 Years | 0 (0.0%) | 0 (0.0%) |
| 5 to 17 Years | 7 (5.9%) | 0 (0.0%) |
| 18 to 34 Years | 4 (4.1%) | 0 (0.0%) |
| 35 to 64 Years | 13 (3.7%) | 7 (2.2%) |
| 65 to 74 Years | 26 (22.4%) | 0 (0.0%) |
| 75 Years and over | 4 (25.0%) | 6 (7.4%) |
Disability Class: Cognitive Difficulty
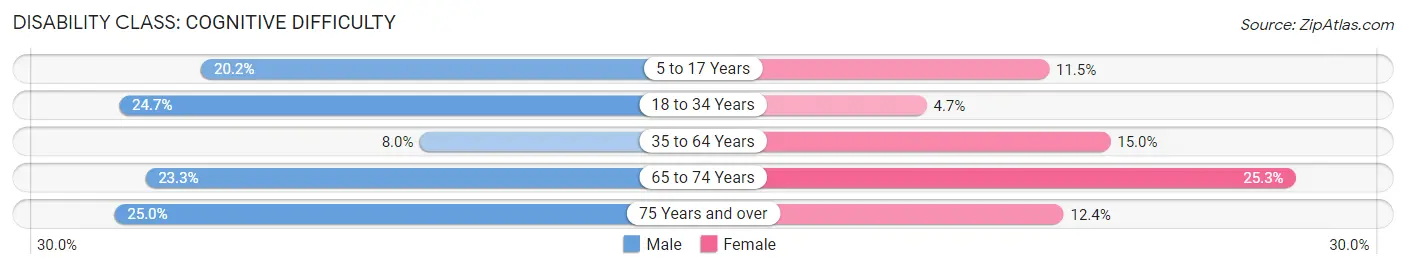
| Age Bracket | Male | Female |
| 5 to 17 Years | 24 (20.2%) | 6 (11.5%) |
| 18 to 34 Years | 24 (24.7%) | 6 (4.7%) |
| 35 to 64 Years | 28 (8.0%) | 48 (14.9%) |
| 65 to 74 Years | 27 (23.3%) | 24 (25.3%) |
| 75 Years and over | 4 (25.0%) | 10 (12.3%) |
Disability Class: Ambulatory Difficulty
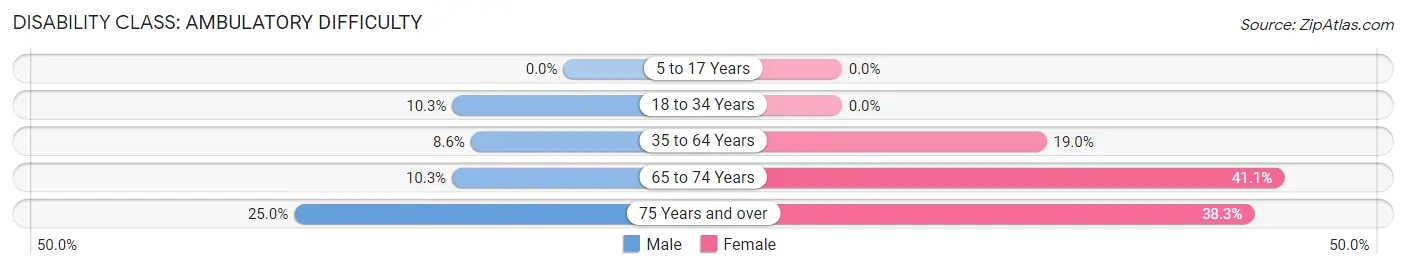
| Age Bracket | Male | Female |
| 5 to 17 Years | 0 (0.0%) | 0 (0.0%) |
| 18 to 34 Years | 10 (10.3%) | 0 (0.0%) |
| 35 to 64 Years | 30 (8.6%) | 61 (19.0%) |
| 65 to 74 Years | 12 (10.3%) | 39 (41.0%) |
| 75 Years and over | 4 (25.0%) | 31 (38.3%) |
Disability Class: Self-Care Difficulty
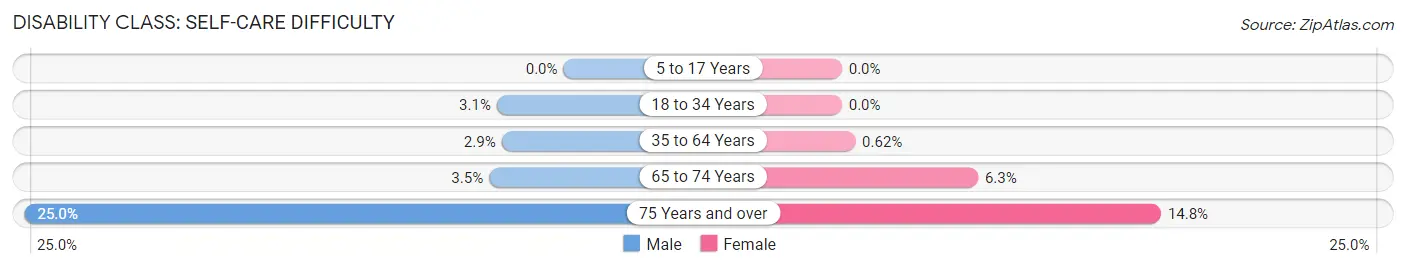
| Age Bracket | Male | Female |
| 5 to 17 Years | 0 (0.0%) | 0 (0.0%) |
| 18 to 34 Years | 3 (3.1%) | 0 (0.0%) |
| 35 to 64 Years | 10 (2.9%) | 2 (0.6%) |
| 65 to 74 Years | 4 (3.5%) | 6 (6.3%) |
| 75 Years and over | 4 (25.0%) | 12 (14.8%) |
Technology Access in Nashville
Computing Device Access in Nashville
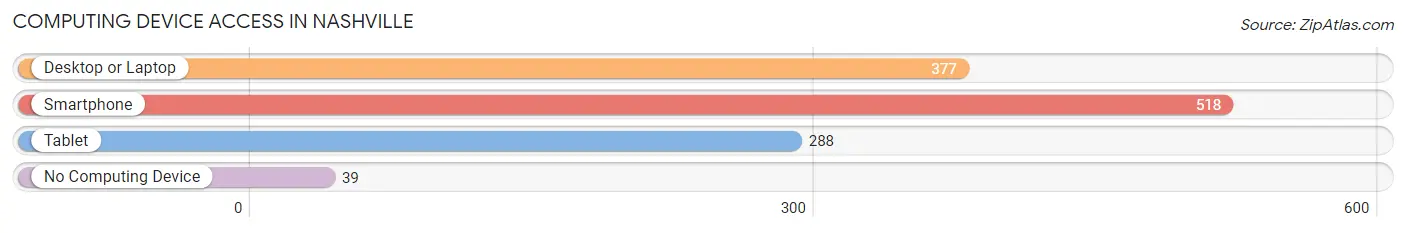
| Device Type | # Households | % Households |
| Desktop or Laptop | 377 | 62.2% |
| Smartphone | 518 | 85.5% |
| Tablet | 288 | 47.5% |
| No Computing Device | 39 | 6.4% |
| Total | 606 | 100.0% |
Internet Access in Nashville
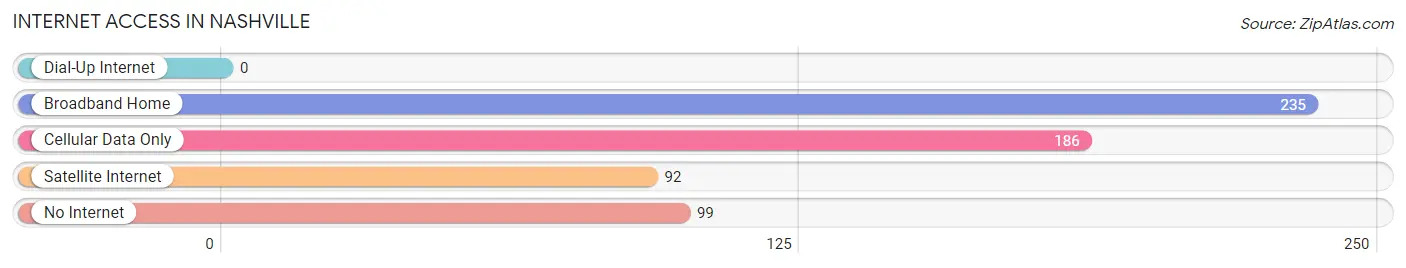
| Internet Type | # Households | % Households |
| Dial-Up Internet | 0 | 0.0% |
| Broadband Home | 235 | 38.8% |
| Cellular Data Only | 186 | 30.7% |
| Satellite Internet | 92 | 15.2% |
| No Internet | 99 | 16.3% |
| Total | 606 | 100.0% |
Nashville Summary
Nashville is a small unincorporated community located in Barry County, Michigan. It is situated in the northeast corner of the county, approximately 10 miles south of Hastings and 15 miles north of Battle Creek. The community is located on the banks of the Thornapple River, which is a tributary of the Grand River.
History
Nashville was first settled in 1836 by a group of settlers from New York. The settlement was named after the city of Nashville, Tennessee. The first post office was established in 1837 and the first school was built in 1845. The first church was built in 1848 and the first store was opened in 1849.
In 1851, the first bridge was built across the Thornapple River. This bridge was replaced in 1871 by a new bridge that was built by the Michigan Central Railroad. The railroad was a major factor in the growth of the community.
In 1872, the first newspaper, the Nashville News, was established. The first bank was opened in 1873 and the first telephone exchange was established in 1883.
Geography
Nashville is located in the northeast corner of Barry County, Michigan. It is situated on the banks of the Thornapple River, which is a tributary of the Grand River. The community is located approximately 10 miles south of Hastings and 15 miles north of Battle Creek.
The terrain of the area is mostly flat with some rolling hills. The soil is mostly sandy loam and is well suited for farming. The climate is humid continental with cold winters and warm summers.
Economy
The economy of Nashville is largely based on agriculture. The area is known for its production of corn, soybeans, wheat, and hay. There are also several small businesses in the area, including a grocery store, a hardware store, and a restaurant.
The community is also home to a number of small manufacturing companies, including a furniture factory, a plastics factory, and a metal fabrication shop.
Demographics
As of the 2010 census, the population of Nashville was 1,845. The racial makeup of the community was 97.3% White, 0.7% African American, 0.3% Native American, 0.2% Asian, 0.1% Pacific Islander, 0.3% from other races, and 1.1% from two or more races. Hispanic or Latino of any race were 1.2% of the population.
The median household income in Nashville was $41,250 and the median family income was $48,750. The per capita income was $20,945. About 11.2% of families and 14.2% of the population were below the poverty line, including 19.2% of those under age 18 and 8.3% of those age 65 or over.
Common Questions
What is Per Capita Income in Nashville?
Per Capita income in Nashville is $27,831.
What is the Median Family Income in Nashville?
Median Family Income in Nashville is $58,750.
What is the Median Household income in Nashville?
Median Household Income in Nashville is $50,938.
What is Income or Wage Gap in Nashville?
Income or Wage Gap in Nashville is 43.3%.
Women in Nashville earn 56.7 cents for every dollar earned by a man.
What is Inequality or Gini Index in Nashville?
Inequality or Gini Index in Nashville is 0.38.
What is the Total Population of Nashville?
Total Population of Nashville is 1,440.
What is the Total Male Population of Nashville?
Total Male Population of Nashville is 735.
What is the Total Female Population of Nashville?
Total Female Population of Nashville is 705.
What is the Ratio of Males per 100 Females in Nashville?
There are 104.26 Males per 100 Females in Nashville.
What is the Ratio of Females per 100 Males in Nashville?
There are 95.92 Females per 100 Males in Nashville.
What is the Median Population Age in Nashville?
Median Population Age in Nashville is 48.9 Years.
What is the Average Family Size in Nashville
Average Family Size in Nashville is 2.9 People.
What is the Average Household Size in Nashville
Average Household Size in Nashville is 2.4 People.
How Large is the Labor Force in Nashville?
There are 719 People in the Labor Forcein in Nashville.
What is the Percentage of People in the Labor Force in Nashville?
57.0% of People are in the Labor Force in Nashville.
What is the Unemployment Rate in Nashville?
Unemployment Rate in Nashville is 4.2%.