Munising, MI Map & Demographics
Munising Map
Munising Overview
$27,255
PER CAPITA INCOME
$59,352
AVG FAMILY INCOME
$50,069
AVG HOUSEHOLD INCOME
33.3%
WAGE / INCOME GAP [ % ]
66.7¢/ $1
WAGE / INCOME GAP [ $ ]
0.37
INEQUALITY / GINI INDEX
2,003
TOTAL POPULATION
968
MALE POPULATION
1,035
FEMALE POPULATION
93.53
MALES / 100 FEMALES
106.92
FEMALES / 100 MALES
47.5
MEDIAN AGE
3.0
AVG FAMILY SIZE
2.1
AVG HOUSEHOLD SIZE
852
LABOR FORCE [ PEOPLE ]
51.6%
PERCENT IN LABOR FORCE
4.1%
UNEMPLOYMENT RATE
Munising Zip Codes
Munising Area Codes
Income in Munising
Income Overview in Munising
Per Capita Income in Munising is $27,255, while median incomes of families and households are $59,352 and $50,069 respectively.
| Characteristic | Number | Measure |
| Per Capita Income | 2,003 | $27,255 |
| Median Family Income | 480 | $59,352 |
| Mean Family Income | 480 | $73,733 |
| Median Household Income | 908 | $50,069 |
| Mean Household Income | 908 | $56,534 |
| Income Deficit | 480 | $0 |
| Wage / Income Gap (%) | 2,003 | 33.26% |
| Wage / Income Gap ($) | 2,003 | 66.74¢ per $1 |
| Gini / Inequality Index | 2,003 | 0.37 |
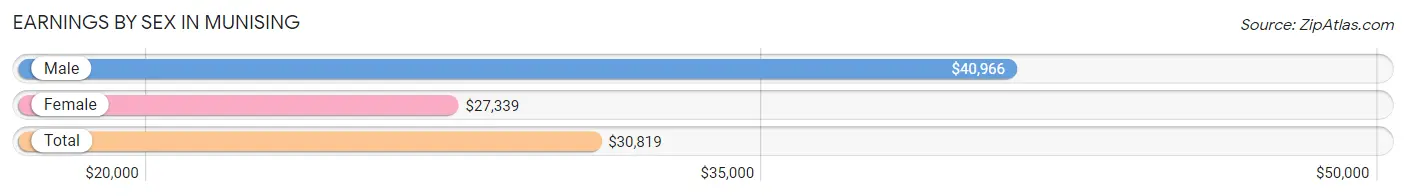
Earnings by Sex in Munising
Average Earnings in Munising are $30,819, $40,966 for men and $27,339 for women, a difference of 33.3%.
| Sex | Number | Average Earnings |
| Male | 499 (52.6%) | $40,966 |
| Female | 450 (47.4%) | $27,339 |
| Total | 949 (100.0%) | $30,819 |
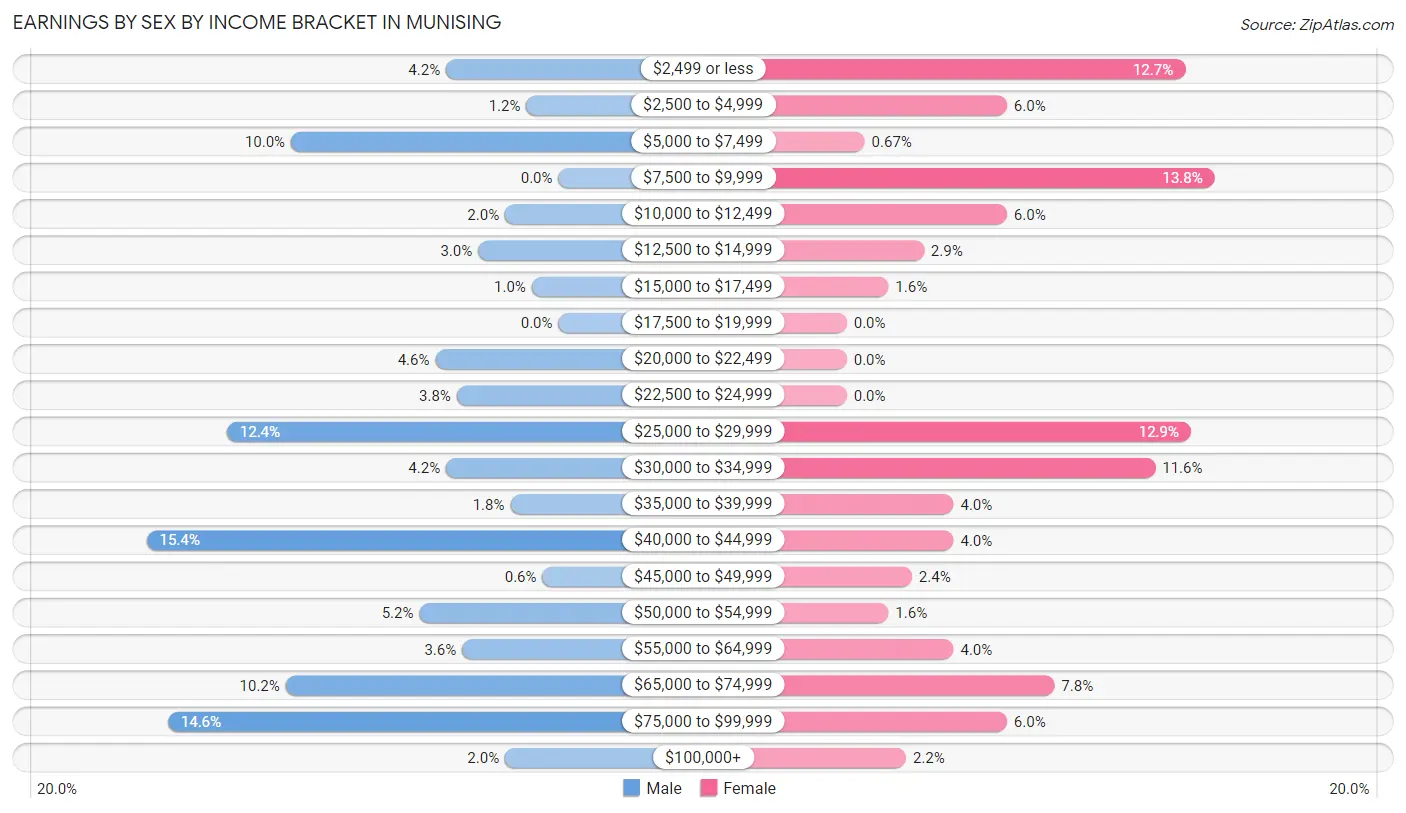
Earnings by Sex by Income Bracket in Munising
The most common earnings brackets in Munising are $40,000 to $44,999 for men (77 | 15.4%) and $7,500 to $9,999 for women (62 | 13.8%).
| Income | Male | Female |
| $2,499 or less | 21 (4.2%) | 57 (12.7%) |
| $2,500 to $4,999 | 6 (1.2%) | 27 (6.0%) |
| $5,000 to $7,499 | 50 (10.0%) | 3 (0.7%) |
| $7,500 to $9,999 | 0 (0.0%) | 62 (13.8%) |
| $10,000 to $12,499 | 10 (2.0%) | 27 (6.0%) |
| $12,500 to $14,999 | 15 (3.0%) | 13 (2.9%) |
| $15,000 to $17,499 | 5 (1.0%) | 7 (1.6%) |
| $17,500 to $19,999 | 0 (0.0%) | 0 (0.0%) |
| $20,000 to $22,499 | 23 (4.6%) | 0 (0.0%) |
| $22,500 to $24,999 | 19 (3.8%) | 0 (0.0%) |
| $25,000 to $29,999 | 62 (12.4%) | 58 (12.9%) |
| $30,000 to $34,999 | 21 (4.2%) | 52 (11.6%) |
| $35,000 to $39,999 | 9 (1.8%) | 18 (4.0%) |
| $40,000 to $44,999 | 77 (15.4%) | 18 (4.0%) |
| $45,000 to $49,999 | 3 (0.6%) | 11 (2.4%) |
| $50,000 to $54,999 | 26 (5.2%) | 7 (1.6%) |
| $55,000 to $64,999 | 18 (3.6%) | 18 (4.0%) |
| $65,000 to $74,999 | 51 (10.2%) | 35 (7.8%) |
| $75,000 to $99,999 | 73 (14.6%) | 27 (6.0%) |
| $100,000+ | 10 (2.0%) | 10 (2.2%) |
| Total | 499 (100.0%) | 450 (100.0%) |
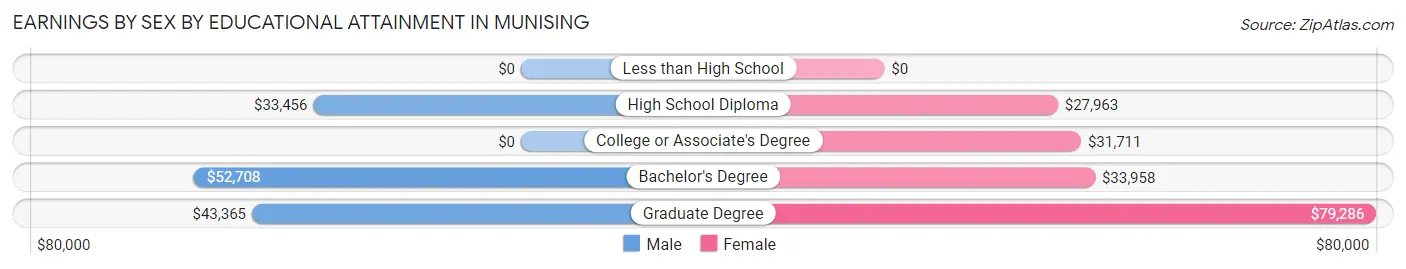
Earnings by Sex by Educational Attainment in Munising
Average earnings in Munising are $42,721 for men and $30,885 for women, a difference of 27.7%. Men with an educational attainment of bachelor's degree enjoy the highest average annual earnings of $52,708, while those with high school diploma education earn the least with $33,456. Women with an educational attainment of graduate degree earn the most with the average annual earnings of $79,286, while those with high school diploma education have the smallest earnings of $27,963.
| Educational Attainment | Male Income | Female Income |
| Less than High School | - | - |
| High School Diploma | $33,456 | $27,963 |
| College or Associate's Degree | - | - |
| Bachelor's Degree | $52,708 | $33,958 |
| Graduate Degree | $43,365 | $79,286 |
| Total | $42,721 | $30,885 |
Family Income in Munising
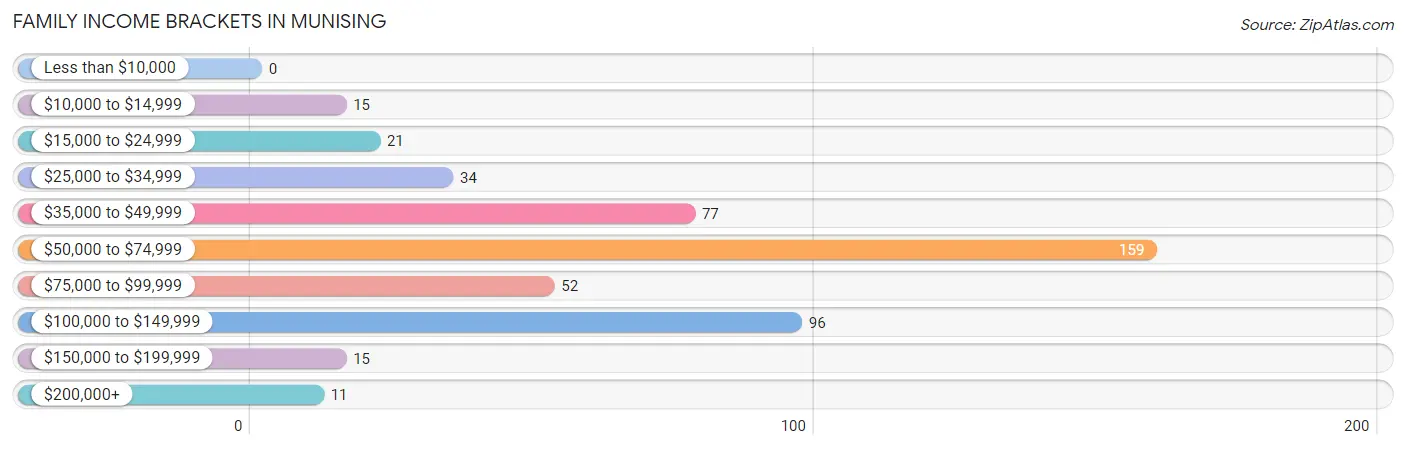
Family Income Brackets in Munising
According to the Munising family income data, there are 159 families falling into the $50,000 to $74,999 income range, which is the most common income bracket and makes up 33.1% of all families.
| Income Bracket | # Families | % Families |
| Less than $10,000 | 0 | 0.0% |
| $10,000 to $14,999 | 15 | 3.1% |
| $15,000 to $24,999 | 21 | 4.4% |
| $25,000 to $34,999 | 34 | 7.1% |
| $35,000 to $49,999 | 77 | 16.0% |
| $50,000 to $74,999 | 159 | 33.1% |
| $75,000 to $99,999 | 52 | 10.8% |
| $100,000 to $149,999 | 96 | 20.0% |
| $150,000 to $199,999 | 15 | 3.1% |
| $200,000+ | 11 | 2.3% |
Family Income by Famaliy Size in Munising
5-person families (34 | 7.1%) account for the highest median family income in Munising with $116,154 per family, while 2-person families (235 | 49.0%) have the highest median income of $26,614 per family member.

| Income Bracket | # Families | Median Income |
| 2-Person Families | 235 (49.0%) | $53,229 |
| 3-Person Families | 146 (30.4%) | $61,429 |
| 4-Person Families | 65 (13.5%) | $55,391 |
| 5-Person Families | 34 (7.1%) | $116,154 |
| 6-Person Families | 0 (0.0%) | $0 |
| 7+ Person Families | 0 (0.0%) | $0 |
| Total | 480 (100.0%) | $59,352 |
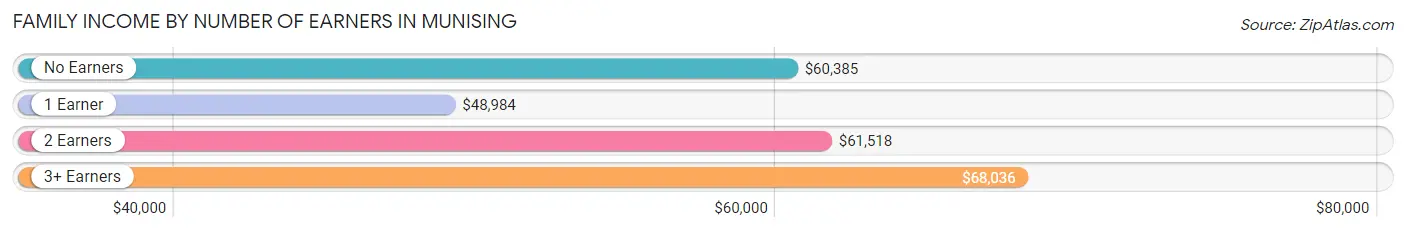
Family Income by Number of Earners in Munising
The median family income in Munising is $59,352, with families comprising 3+ earners (45) having the highest median family income of $68,036, while families with 1 earner (135) have the lowest median family income of $48,984, accounting for 9.4% and 28.1% of families, respectively.
| Number of Earners | # Families | Median Income |
| No Earners | 74 (15.4%) | $60,385 |
| 1 Earner | 135 (28.1%) | $48,984 |
| 2 Earners | 226 (47.1%) | $61,518 |
| 3+ Earners | 45 (9.4%) | $68,036 |
| Total | 480 (100.0%) | $59,352 |
Household Income in Munising
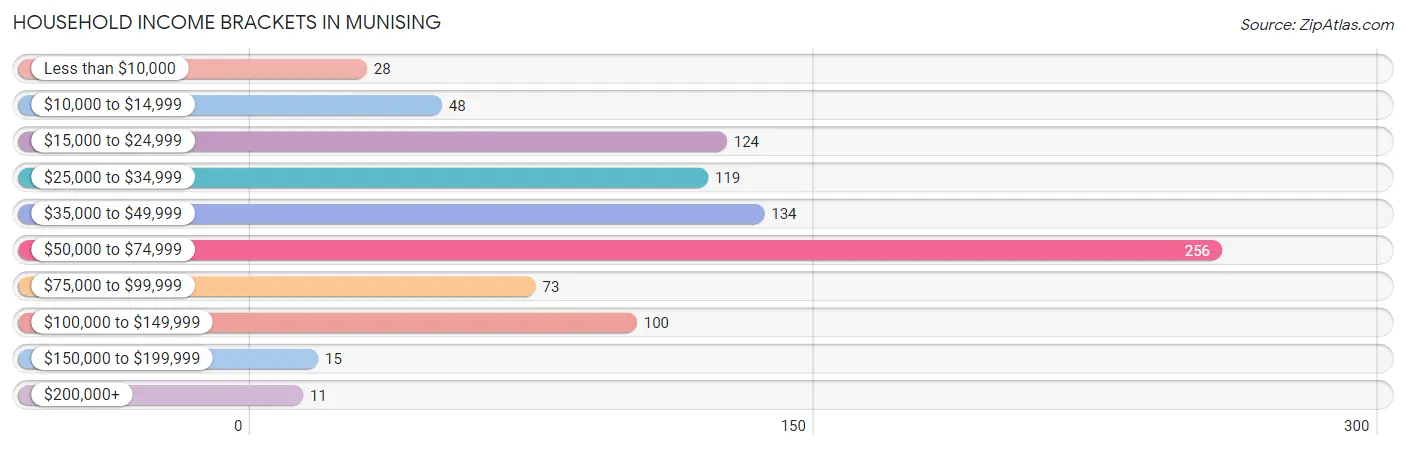
Household Income Brackets in Munising
With 256 households falling in the category, the $50,000 to $74,999 income range is the most frequent in Munising, accounting for 28.2% of all households. In contrast, only 11 households (1.2%) fall into the $200,000+ income bracket, making it the least populous group.
| Income Bracket | # Households | % Households |
| Less than $10,000 | 28 | 3.1% |
| $10,000 to $14,999 | 48 | 5.3% |
| $15,000 to $24,999 | 124 | 13.7% |
| $25,000 to $34,999 | 119 | 13.1% |
| $35,000 to $49,999 | 134 | 14.8% |
| $50,000 to $74,999 | 256 | 28.2% |
| $75,000 to $99,999 | 73 | 8.0% |
| $100,000 to $149,999 | 100 | 11.0% |
| $150,000 to $199,999 | 15 | 1.7% |
| $200,000+ | 11 | 1.2% |
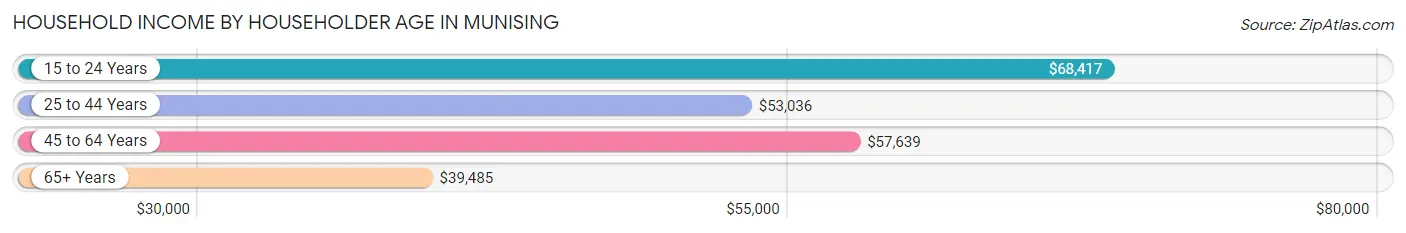
Household Income by Householder Age in Munising
The median household income in Munising is $50,069, with the highest median household income of $68,417 found in the 15 to 24 years age bracket for the primary householder. A total of 29 households (3.2%) fall into this category. Meanwhile, the 65+ years age bracket for the primary householder has the lowest median household income of $39,485, with 283 households (31.2%) in this group.
| Income Bracket | # Households | Median Income |
| 15 to 24 Years | 29 (3.2%) | $68,417 |
| 25 to 44 Years | 239 (26.3%) | $53,036 |
| 45 to 64 Years | 357 (39.3%) | $57,639 |
| 65+ Years | 283 (31.2%) | $39,485 |
| Total | 908 (100.0%) | $50,069 |
Poverty in Munising
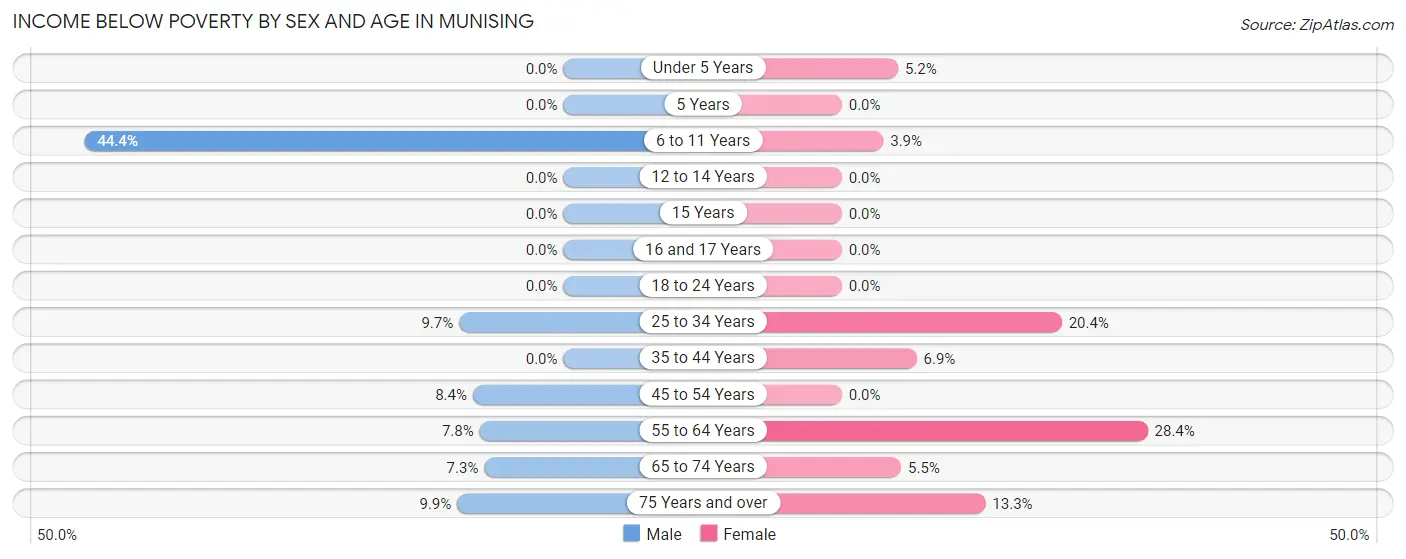
Income Below Poverty by Sex and Age in Munising
With 8.7% poverty level for males and 9.7% for females among the residents of Munising, 6 to 11 year old males and 55 to 64 year old females are the most vulnerable to poverty, with 24 males (44.4%) and 42 females (28.4%) in their respective age groups living below the poverty level.
| Age Bracket | Male | Female |
| Under 5 Years | 0 (0.0%) | 5 (5.2%) |
| 5 Years | 0 (0.0%) | 0 (0.0%) |
| 6 to 11 Years | 24 (44.4%) | 5 (3.8%) |
| 12 to 14 Years | 0 (0.0%) | 0 (0.0%) |
| 15 Years | 0 (0.0%) | 0 (0.0%) |
| 16 and 17 Years | 0 (0.0%) | 0 (0.0%) |
| 18 to 24 Years | 0 (0.0%) | 0 (0.0%) |
| 25 to 34 Years | 15 (9.7%) | 20 (20.4%) |
| 35 to 44 Years | 0 (0.0%) | 5 (6.9%) |
| 45 to 54 Years | 11 (8.4%) | 0 (0.0%) |
| 55 to 64 Years | 13 (7.8%) | 42 (28.4%) |
| 65 to 74 Years | 8 (7.3%) | 6 (5.5%) |
| 75 Years and over | 7 (9.9%) | 14 (13.3%) |
| Total | 78 (8.7%) | 97 (9.7%) |
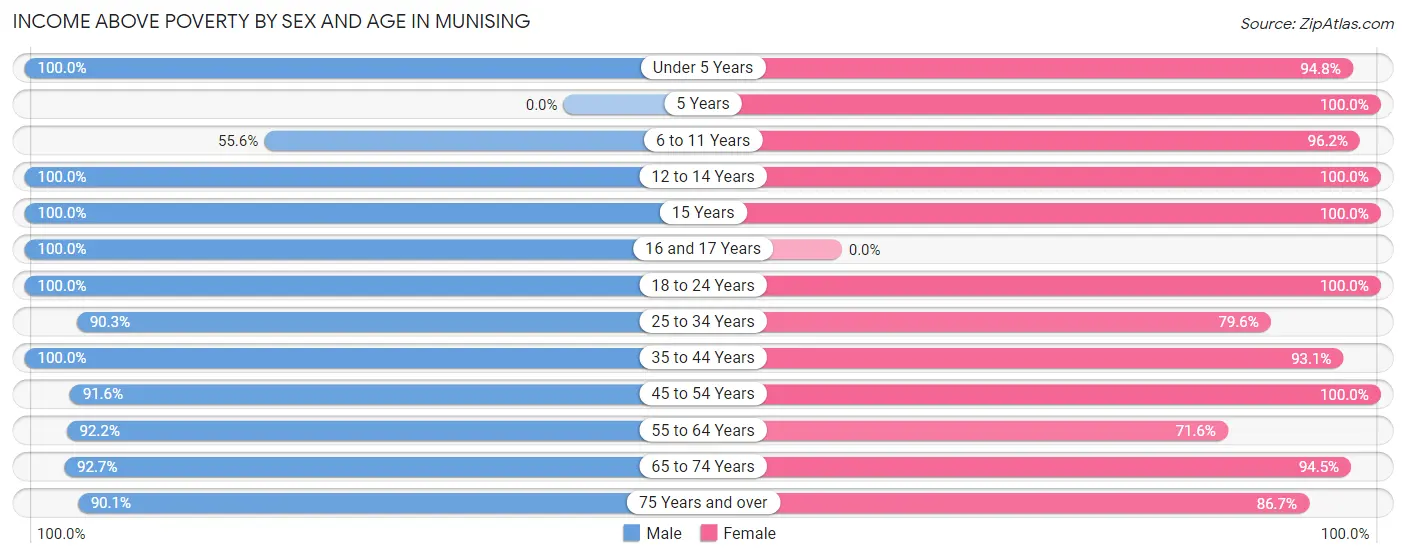
Income Above Poverty by Sex and Age in Munising
According to the poverty statistics in Munising, males aged under 5 years and females aged 5 years are the age groups that are most secure financially, with 100.0% of males and 100.0% of females in these age groups living above the poverty line.
| Age Bracket | Male | Female |
| Under 5 Years | 15 (100.0%) | 91 (94.8%) |
| 5 Years | 0 (0.0%) | 9 (100.0%) |
| 6 to 11 Years | 30 (55.6%) | 125 (96.2%) |
| 12 to 14 Years | 20 (100.0%) | 13 (100.0%) |
| 15 Years | 5 (100.0%) | 6 (100.0%) |
| 16 and 17 Years | 29 (100.0%) | 0 (0.0%) |
| 18 to 24 Years | 57 (100.0%) | 97 (100.0%) |
| 25 to 34 Years | 140 (90.3%) | 78 (79.6%) |
| 35 to 44 Years | 85 (100.0%) | 67 (93.1%) |
| 45 to 54 Years | 120 (91.6%) | 117 (100.0%) |
| 55 to 64 Years | 154 (92.2%) | 106 (71.6%) |
| 65 to 74 Years | 101 (92.7%) | 103 (94.5%) |
| 75 Years and over | 64 (90.1%) | 91 (86.7%) |
| Total | 820 (91.3%) | 903 (90.3%) |
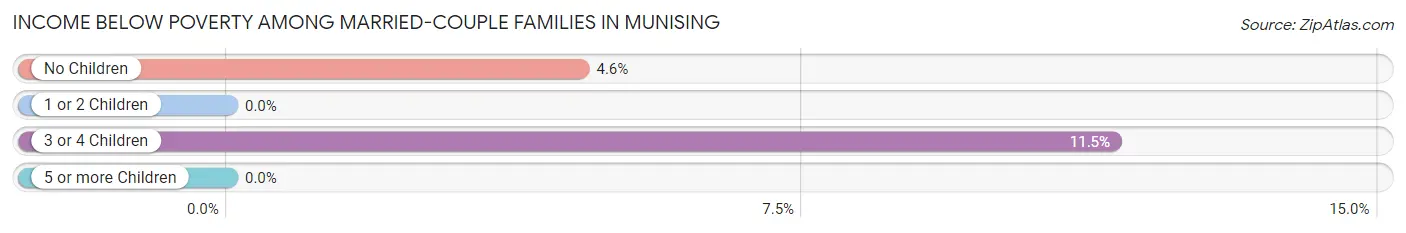
Income Below Poverty Among Married-Couple Families in Munising
The poverty statistics for married-couple families in Munising show that 3.6% or 13 of the total 361 families live below the poverty line. Families with 3 or 4 children have the highest poverty rate of 11.5%, comprising of 3 families. On the other hand, families with 1 or 2 children have the lowest poverty rate of 0.0%, which includes 0 families.
| Children | Above Poverty | Below Poverty |
| No Children | 208 (95.4%) | 10 (4.6%) |
| 1 or 2 Children | 117 (100.0%) | 0 (0.0%) |
| 3 or 4 Children | 23 (88.5%) | 3 (11.5%) |
| 5 or more Children | 0 (0.0%) | 0 (0.0%) |
| Total | 348 (96.4%) | 13 (3.6%) |
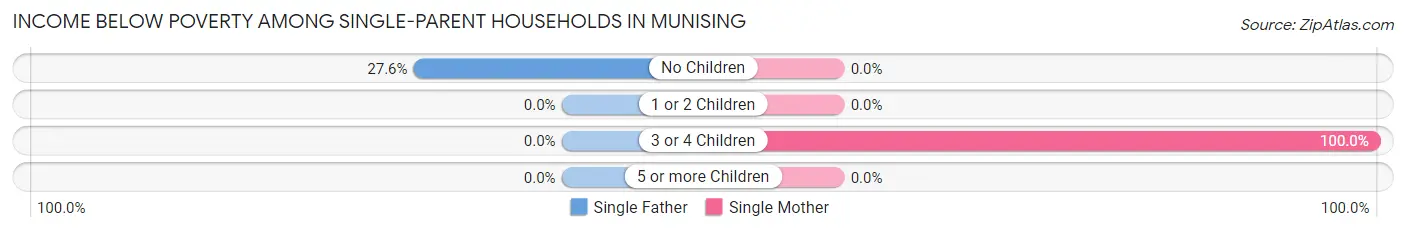
Income Below Poverty Among Single-Parent Households in Munising
According to the poverty data in Munising, 21.6% or 8 single-father households and 11.0% or 9 single-mother households are living below the poverty line. Among single-father households, those with no children have the highest poverty rate, with 8 households (27.6%) experiencing poverty. Likewise, among single-mother households, those with 3 or 4 children have the highest poverty rate, with 9 households (100.0%) falling below the poverty line.
| Children | Single Father | Single Mother |
| No Children | 8 (27.6%) | 0 (0.0%) |
| 1 or 2 Children | 0 (0.0%) | 0 (0.0%) |
| 3 or 4 Children | 0 (0.0%) | 9 (100.0%) |
| 5 or more Children | 0 (0.0%) | 0 (0.0%) |
| Total | 8 (21.6%) | 9 (11.0%) |
Income Below Poverty Among Married-Couple vs Single-Parent Households in Munising
The poverty data for Munising shows that 13 of the married-couple family households (3.6%) and 17 of the single-parent households (14.3%) are living below the poverty level. Within the married-couple family households, those with 3 or 4 children have the highest poverty rate, with 3 households (11.5%) falling below the poverty line. Among the single-parent households, those with 3 or 4 children have the highest poverty rate, with 9 household (100.0%) living below poverty.
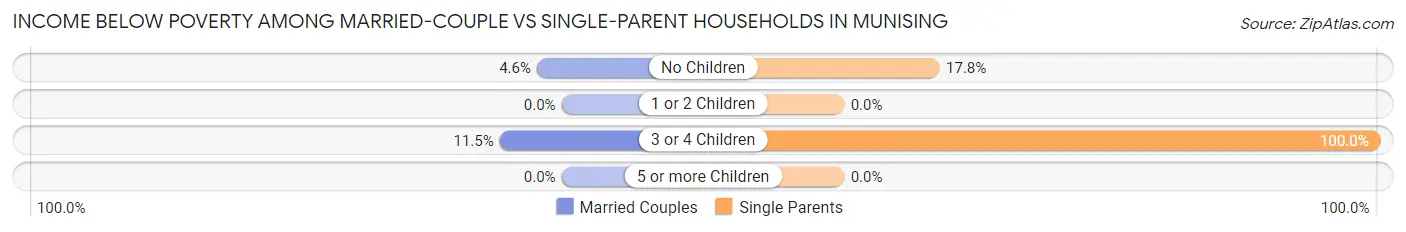
| Children | Married-Couple Families | Single-Parent Households |
| No Children | 10 (4.6%) | 8 (17.8%) |
| 1 or 2 Children | 0 (0.0%) | 0 (0.0%) |
| 3 or 4 Children | 3 (11.5%) | 9 (100.0%) |
| 5 or more Children | 0 (0.0%) | 0 (0.0%) |
| Total | 13 (3.6%) | 17 (14.3%) |
Race in Munising
The most populous races in Munising are White / Caucasian (1,748 | 87.3%), Two or more Races (154 | 7.7%), and Native / Alaskan (82 | 4.1%).
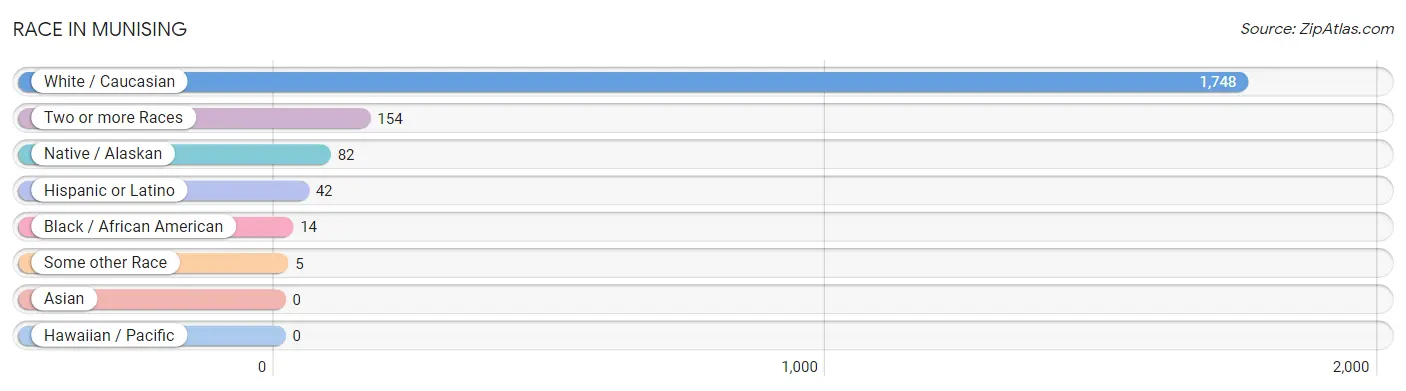
| Race | # Population | % Population |
| Asian | 0 | 0.0% |
| Black / African American | 14 | 0.7% |
| Hawaiian / Pacific | 0 | 0.0% |
| Hispanic or Latino | 42 | 2.1% |
| Native / Alaskan | 82 | 4.1% |
| White / Caucasian | 1,748 | 87.3% |
| Two or more Races | 154 | 7.7% |
| Some other Race | 5 | 0.3% |
| Total | 2,003 | 100.0% |
Ancestry in Munising
The most populous ancestries reported in Munising are German (392 | 19.6%), English (351 | 17.5%), Finnish (284 | 14.2%), Irish (280 | 14.0%), and French (232 | 11.6%), together accounting for 76.8% of all Munising residents.
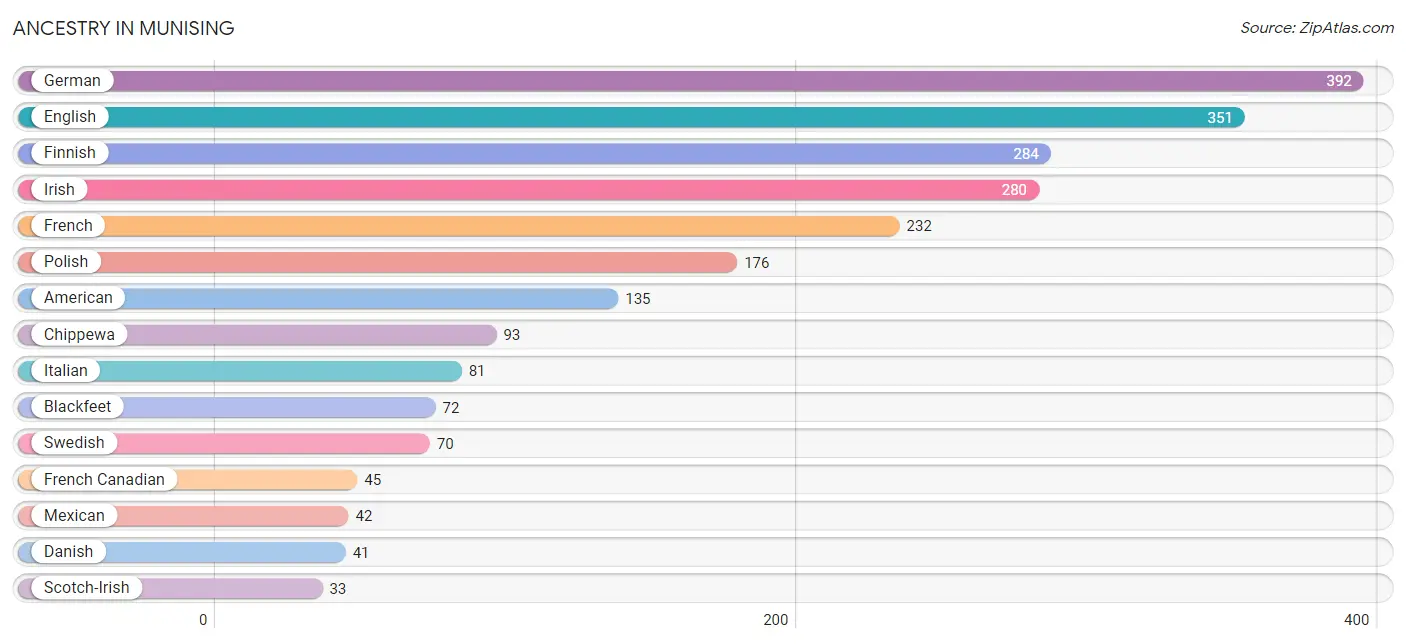
| Ancestry | # Population | % Population |
| American | 135 | 6.7% |
| Austrian | 15 | 0.7% |
| Belgian | 18 | 0.9% |
| Blackfeet | 72 | 3.6% |
| Canadian | 11 | 0.5% |
| Cherokee | 6 | 0.3% |
| Chippewa | 93 | 4.6% |
| Danish | 41 | 2.1% |
| Dutch | 9 | 0.4% |
| English | 351 | 17.5% |
| European | 14 | 0.7% |
| Finnish | 284 | 14.2% |
| French | 232 | 11.6% |
| French Canadian | 45 | 2.2% |
| German | 392 | 19.6% |
| Hungarian | 8 | 0.4% |
| Irish | 280 | 14.0% |
| Italian | 81 | 4.0% |
| Mexican | 42 | 2.1% |
| Norwegian | 8 | 0.4% |
| Polish | 176 | 8.8% |
| Potawatomi | 10 | 0.5% |
| Russian | 12 | 0.6% |
| Scotch-Irish | 33 | 1.7% |
| Scottish | 17 | 0.9% |
| Slovene | 4 | 0.2% |
| Swedish | 70 | 3.5% |
| Swiss | 5 | 0.3% |
| Ukrainian | 6 | 0.3% | View All 29 Rows |
Immigrants in Munising
The most numerous immigrant groups reported in Munising came from , and Canada (4 | 0.2%), together accounting for 0.2% of all Munising residents.

| Immigration Origin | # Population | % Population |
| Canada | 4 | 0.2% | View All 1 Rows |
Sex and Age in Munising
Sex and Age in Munising
The most populous age groups in Munising are 25 to 29 Years (96 | 9.9%) for men and 5 to 9 Years (129 | 12.5%) for women.
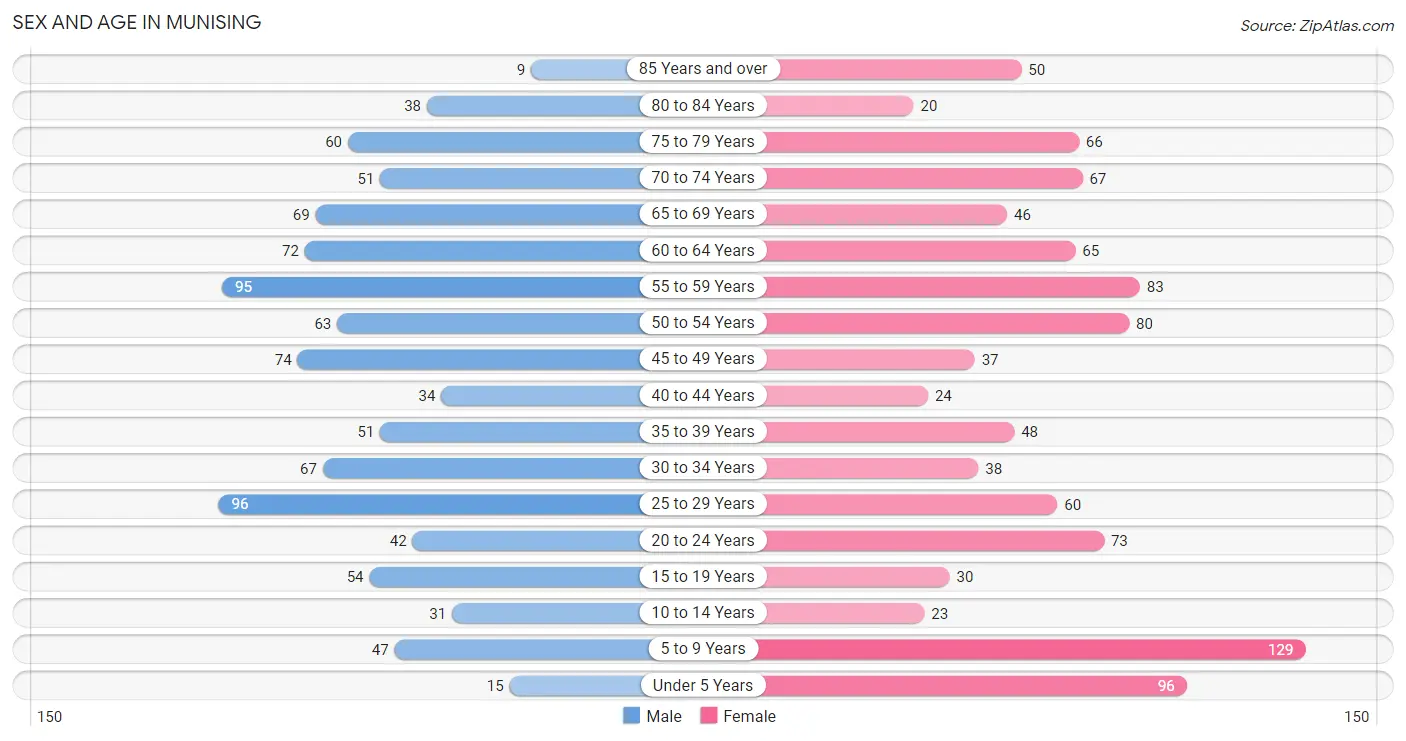
| Age Bracket | Male | Female |
| Under 5 Years | 15 (1.5%) | 96 (9.3%) |
| 5 to 9 Years | 47 (4.9%) | 129 (12.5%) |
| 10 to 14 Years | 31 (3.2%) | 23 (2.2%) |
| 15 to 19 Years | 54 (5.6%) | 30 (2.9%) |
| 20 to 24 Years | 42 (4.3%) | 73 (7.0%) |
| 25 to 29 Years | 96 (9.9%) | 60 (5.8%) |
| 30 to 34 Years | 67 (6.9%) | 38 (3.7%) |
| 35 to 39 Years | 51 (5.3%) | 48 (4.6%) |
| 40 to 44 Years | 34 (3.5%) | 24 (2.3%) |
| 45 to 49 Years | 74 (7.6%) | 37 (3.6%) |
| 50 to 54 Years | 63 (6.5%) | 80 (7.7%) |
| 55 to 59 Years | 95 (9.8%) | 83 (8.0%) |
| 60 to 64 Years | 72 (7.4%) | 65 (6.3%) |
| 65 to 69 Years | 69 (7.1%) | 46 (4.4%) |
| 70 to 74 Years | 51 (5.3%) | 67 (6.5%) |
| 75 to 79 Years | 60 (6.2%) | 66 (6.4%) |
| 80 to 84 Years | 38 (3.9%) | 20 (1.9%) |
| 85 Years and over | 9 (0.9%) | 50 (4.8%) |
| Total | 968 (100.0%) | 1,035 (100.0%) |
Families and Households in Munising
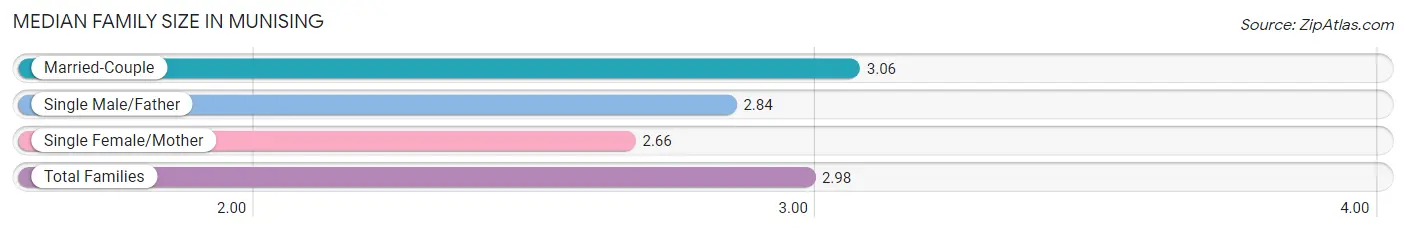
Median Family Size in Munising
The median family size in Munising is 2.98 persons per family, with married-couple families (361 | 75.2%) accounting for the largest median family size of 3.06 persons per family. On the other hand, single female/mother families (82 | 17.1%) represent the smallest median family size with 2.66 persons per family.
| Family Type | # Families | Family Size |
| Married-Couple | 361 (75.2%) | 3.06 |
| Single Male/Father | 37 (7.7%) | 2.84 |
| Single Female/Mother | 82 (17.1%) | 2.66 |
| Total Families | 480 (100.0%) | 2.98 |
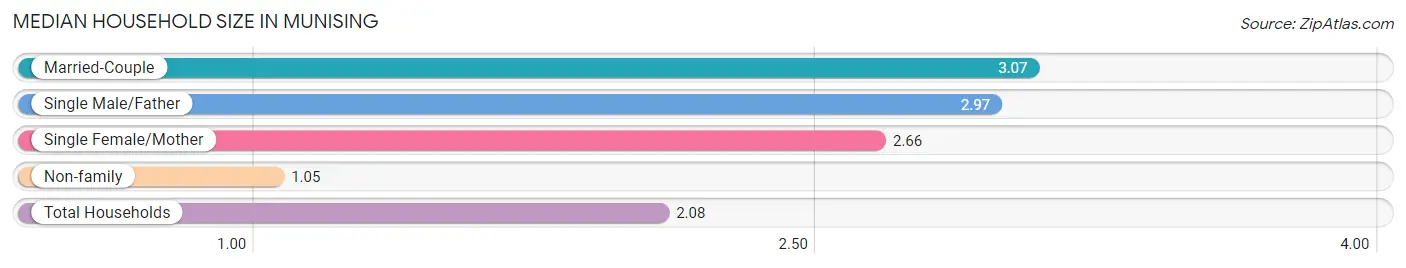
Median Household Size in Munising
The median household size in Munising is 2.08 persons per household, with married-couple households (361 | 39.8%) accounting for the largest median household size of 3.07 persons per household. non-family households (428 | 47.1%) represent the smallest median household size with 1.05 persons per household.
| Household Type | # Households | Household Size |
| Married-Couple | 361 (39.8%) | 3.07 |
| Single Male/Father | 37 (4.1%) | 2.97 |
| Single Female/Mother | 82 (9.0%) | 2.66 |
| Non-family | 428 (47.1%) | 1.05 |
| Total Households | 908 (100.0%) | 2.08 |
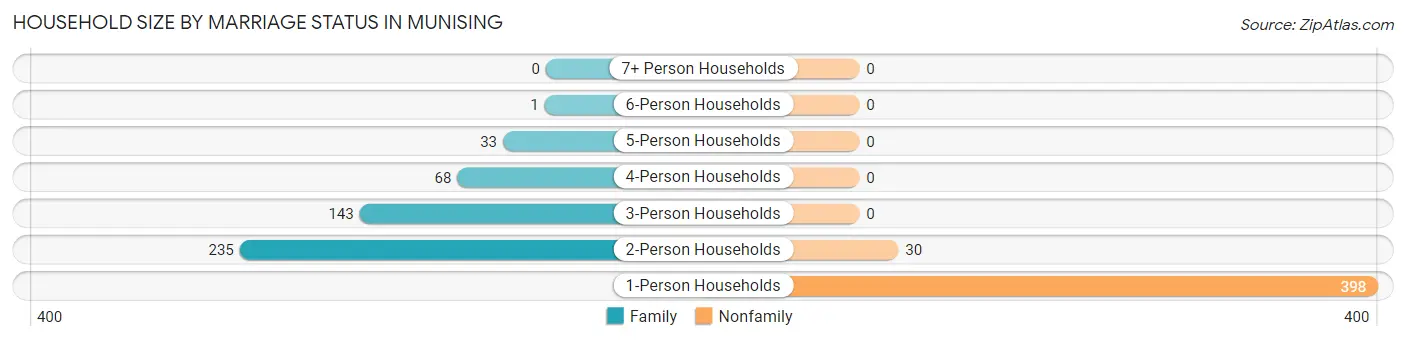
Household Size by Marriage Status in Munising
Out of a total of 908 households in Munising, 480 (52.9%) are family households, while 428 (47.1%) are nonfamily households. The most numerous type of family households are 2-person households, comprising 235, and the most common type of nonfamily households are 1-person households, comprising 398.
| Household Size | Family Households | Nonfamily Households |
| 1-Person Households | - | 398 (43.8%) |
| 2-Person Households | 235 (25.9%) | 30 (3.3%) |
| 3-Person Households | 143 (15.8%) | 0 (0.0%) |
| 4-Person Households | 68 (7.5%) | 0 (0.0%) |
| 5-Person Households | 33 (3.6%) | 0 (0.0%) |
| 6-Person Households | 1 (0.1%) | 0 (0.0%) |
| 7+ Person Households | 0 (0.0%) | 0 (0.0%) |
| Total | 480 (52.9%) | 428 (47.1%) |
Female Fertility in Munising
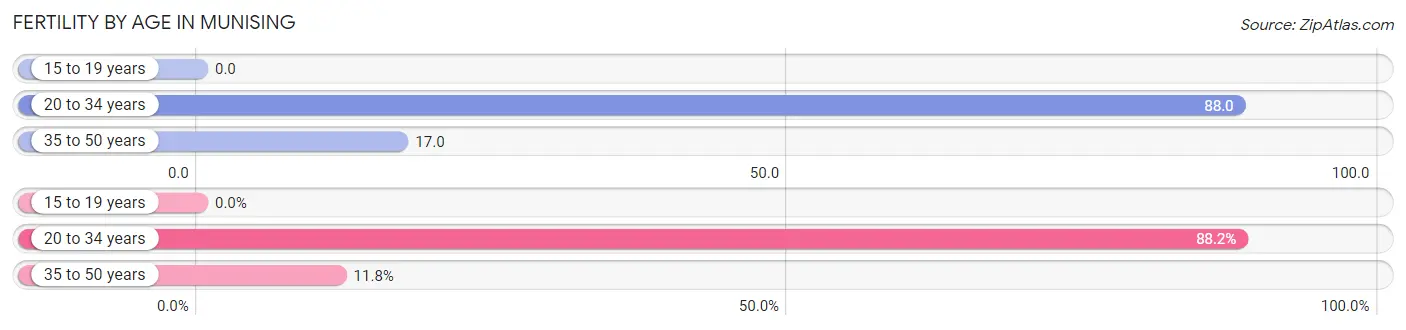
Fertility by Age in Munising
Average fertility rate in Munising is 53.0 births per 1,000 women. Women in the age bracket of 20 to 34 years have the highest fertility rate with 88.0 births per 1,000 women. Women in the age bracket of 20 to 34 years acount for 88.2% of all women with births.
| Age Bracket | Women with Births | Births / 1,000 Women |
| 15 to 19 years | 0 (0.0%) | 0.0 |
| 20 to 34 years | 15 (88.2%) | 88.0 |
| 35 to 50 years | 2 (11.8%) | 17.0 |
| Total | 17 (100.0%) | 53.0 |
Fertility by Age by Marriage Status in Munising
11.8% of women with births (17) in Munising are married. The highest percentage of unmarried women with births falls into 20 to 34 years age bracket with 100.0% of them unmarried at the time of birth, while the lowest percentage of unmarried women with births belong to 35 to 50 years age bracket with 0.0% of them unmarried.
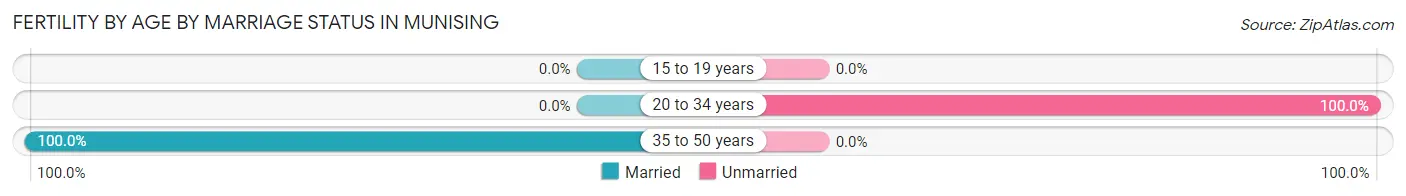
| Age Bracket | Married | Unmarried |
| 15 to 19 years | 0 (0.0%) | 0 (0.0%) |
| 20 to 34 years | 0 (0.0%) | 15 (100.0%) |
| 35 to 50 years | 2 (100.0%) | 0 (0.0%) |
| Total | 2 (11.8%) | 15 (88.2%) |
Fertility by Education in Munising
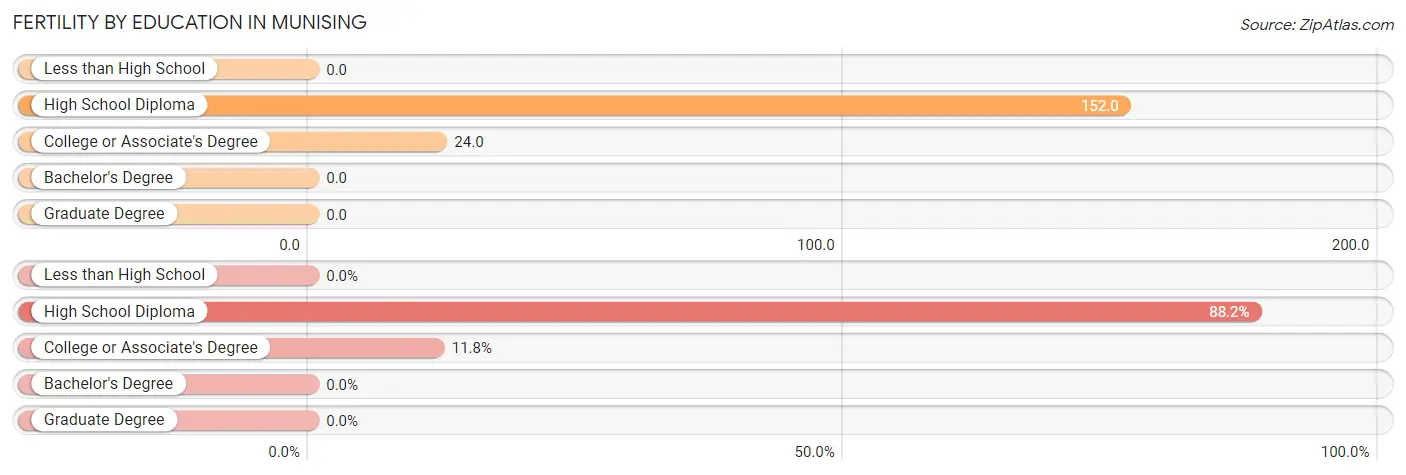
| Educational Attainment | Women with Births | Births / 1,000 Women |
| Less than High School | 0 (0.0%) | 0.0 |
| High School Diploma | 15 (88.2%) | 152.0 |
| College or Associate's Degree | 2 (11.8%) | 24.0 |
| Bachelor's Degree | 0 (0.0%) | 0.0 |
| Graduate Degree | 0 (0.0%) | 0.0 |
| Total | 17 (100.0%) | 53.0 |
Fertility by Education by Marriage Status in Munising
88.2% of women with births in Munising are unmarried. Women with the educational attainment of college or associate's degree are most likely to be married with 100.0% of them married at childbirth, while women with the educational attainment of high school diploma are least likely to be married with 100.0% of them unmarried at childbirth.
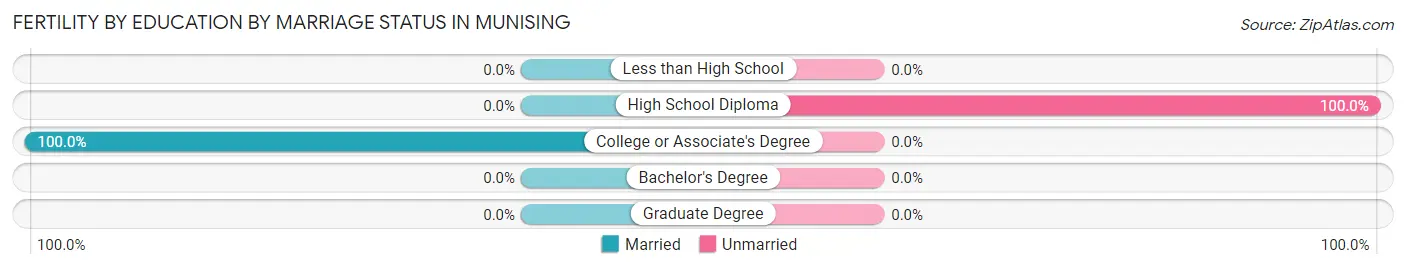
| Educational Attainment | Married | Unmarried |
| Less than High School | 0 (0.0%) | 0 (0.0%) |
| High School Diploma | 0 (0.0%) | 15 (100.0%) |
| College or Associate's Degree | 2 (100.0%) | 0 (0.0%) |
| Bachelor's Degree | 0 (0.0%) | 0 (0.0%) |
| Graduate Degree | 0 (0.0%) | 0 (0.0%) |
| Total | 2 (11.8%) | 15 (88.2%) |
Employment Characteristics in Munising
Employment by Class of Employer in Munising
Among the 817 employed individuals in Munising, private company employees (567 | 69.4%), local government employees (86 | 10.5%), and state government employees (84 | 10.3%) make up the most common classes of employment.
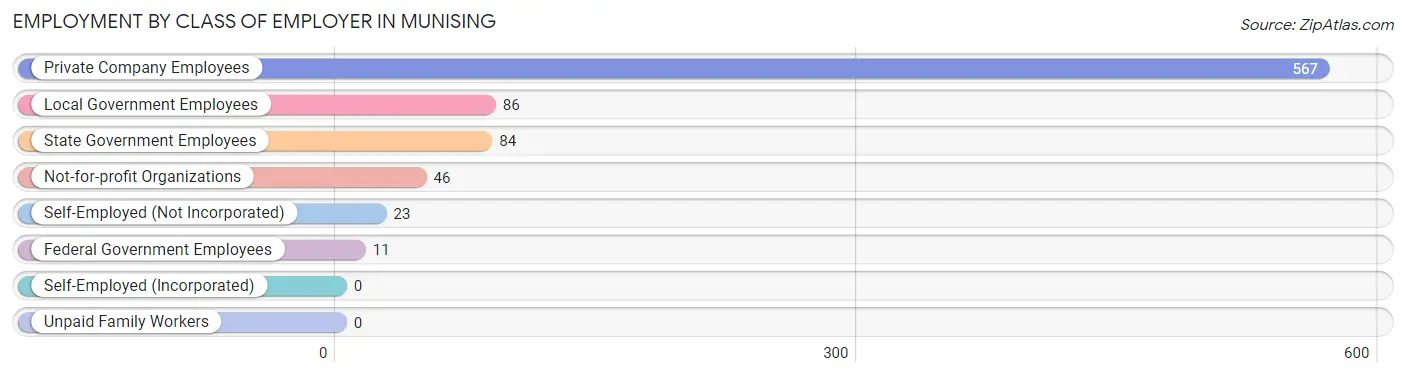
| Employer Class | # Employees | % Employees |
| Private Company Employees | 567 | 69.4% |
| Self-Employed (Incorporated) | 0 | 0.0% |
| Self-Employed (Not Incorporated) | 23 | 2.8% |
| Not-for-profit Organizations | 46 | 5.6% |
| Local Government Employees | 86 | 10.5% |
| State Government Employees | 84 | 10.3% |
| Federal Government Employees | 11 | 1.3% |
| Unpaid Family Workers | 0 | 0.0% |
| Total | 817 | 100.0% |
Employment Status by Age in Munising
According to the labor force statistics for Munising, out of the total population over 16 years of age (1,651), 51.6% or 852 individuals are in the labor force, with 4.1% or 35 of them unemployed. The age group with the highest labor force participation rate is 35 to 44 years, with 95.5% or 150 individuals in the labor force. Within the labor force, the 60 to 64 years age range has the highest percentage of unemployed individuals, with 18.6% or 8 of them being unemployed.
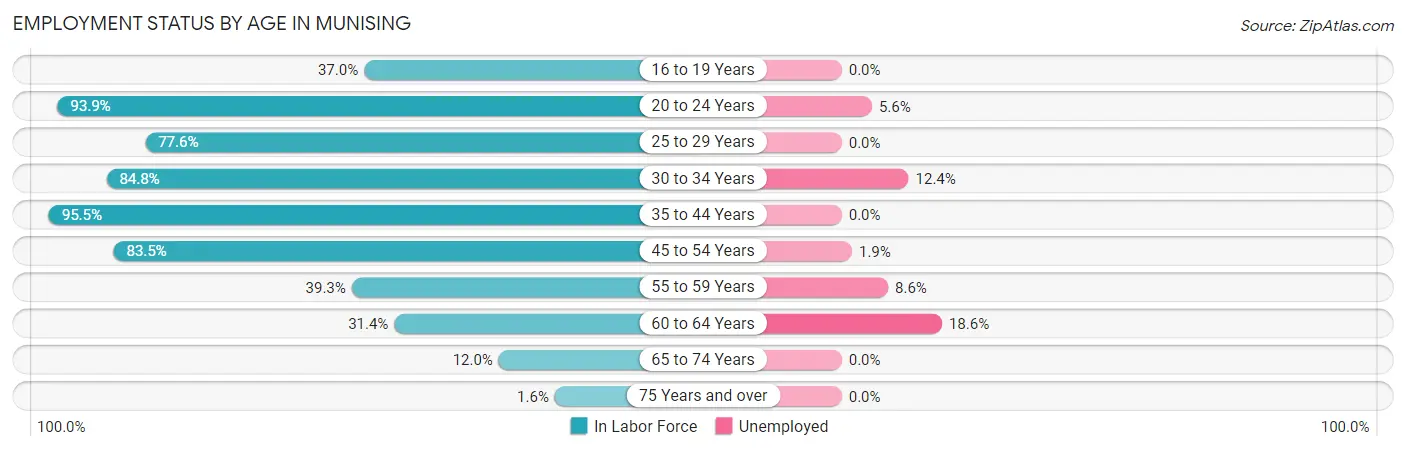
| Age Bracket | In Labor Force | Unemployed |
| 16 to 19 Years | 27 (37.0%) | 0 (0.0%) |
| 20 to 24 Years | 108 (93.9%) | 6 (5.6%) |
| 25 to 29 Years | 121 (77.6%) | 0 (0.0%) |
| 30 to 34 Years | 89 (84.8%) | 11 (12.4%) |
| 35 to 44 Years | 150 (95.5%) | 0 (0.0%) |
| 45 to 54 Years | 212 (83.5%) | 4 (1.9%) |
| 55 to 59 Years | 70 (39.3%) | 6 (8.6%) |
| 60 to 64 Years | 43 (31.4%) | 8 (18.6%) |
| 65 to 74 Years | 28 (12.0%) | 0 (0.0%) |
| 75 Years and over | 4 (1.6%) | 0 (0.0%) |
| Total | 852 (51.6%) | 35 (4.1%) |
Employment Status by Educational Attainment in Munising
According to labor force statistics for Munising, 69.4% of individuals (685) out of the total population between 25 and 64 years of age (987) are in the labor force, with 4.2% or 29 of them being unemployed. The group with the highest labor force participation rate are those with the educational attainment of bachelor's degree or higher, with 86.0% or 233 individuals in the labor force. Within the labor force, individuals with less than high school education have the highest percentage of unemployment, with 15.8% or 3 of them being unemployed.
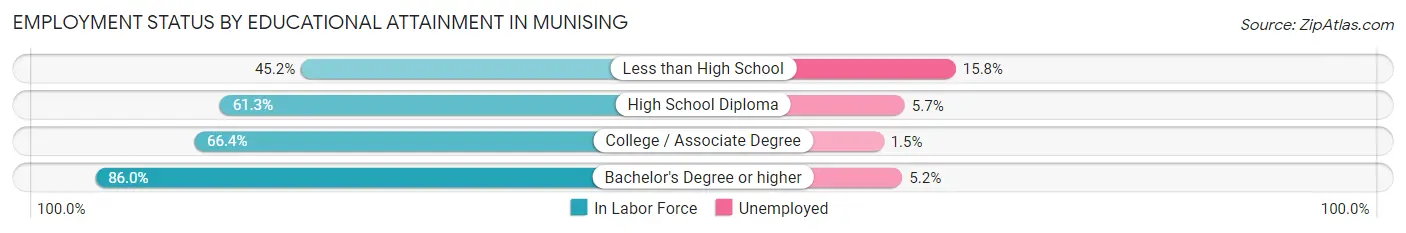
| Educational Attainment | In Labor Force | Unemployed |
| Less than High School | 19 (45.2%) | 7 (15.8%) |
| High School Diploma | 174 (61.3%) | 16 (5.7%) |
| College / Associate Degree | 259 (66.4%) | 6 (1.5%) |
| Bachelor's Degree or higher | 233 (86.0%) | 14 (5.2%) |
| Total | 685 (69.4%) | 41 (4.2%) |
Employment Occupations by Sex in Munising
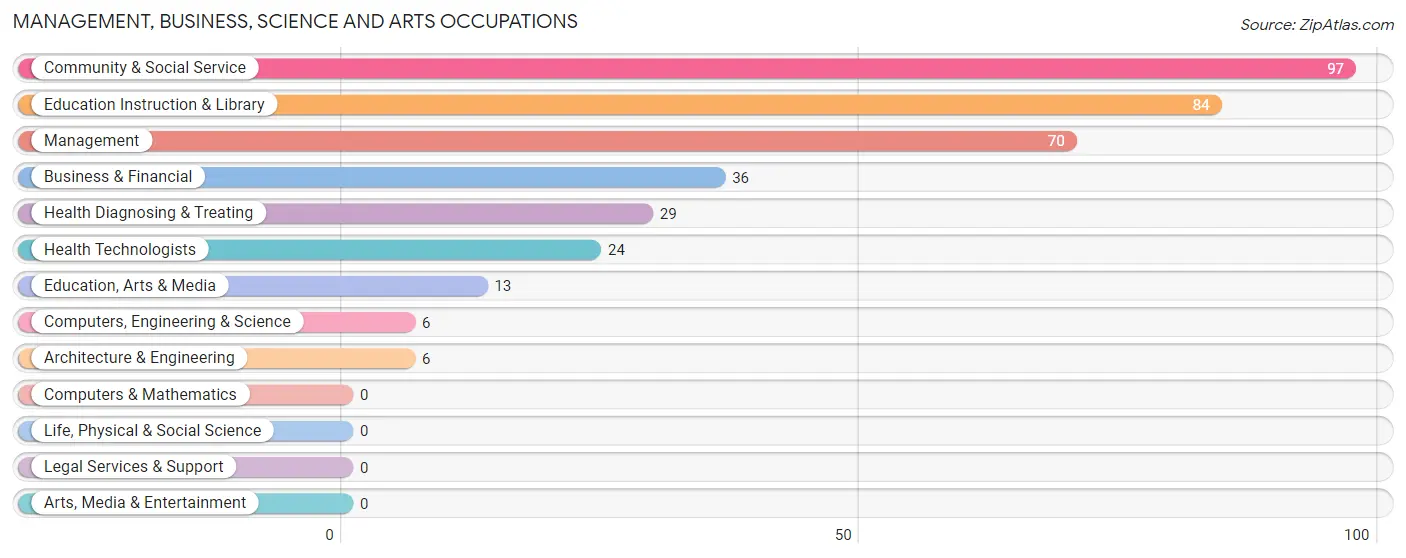
Management, Business, Science and Arts Occupations
The most common Management, Business, Science and Arts occupations in Munising are Community & Social Service (97 | 11.9%), Education Instruction & Library (84 | 10.3%), Management (70 | 8.6%), Business & Financial (36 | 4.4%), and Health Diagnosing & Treating (29 | 3.5%).
Management, Business, Science and Arts Occupations by Sex
Within the Management, Business, Science and Arts occupations in Munising, the most male-oriented occupations are Computers, Engineering & Science (100.0%), Architecture & Engineering (100.0%), and Management (70.0%), while the most female-oriented occupations are Education, Arts & Media (100.0%), Health Diagnosing & Treating (72.4%), and Health Technologists (66.7%).
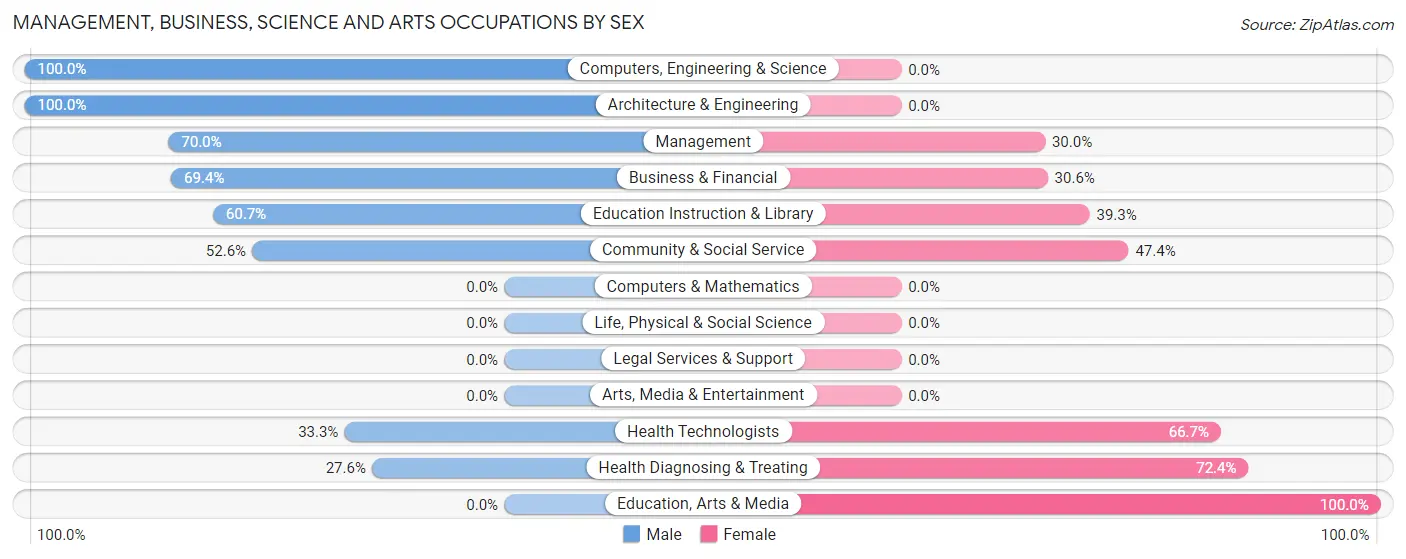
| Occupation | Male | Female |
| Management | 49 (70.0%) | 21 (30.0%) |
| Business & Financial | 25 (69.4%) | 11 (30.6%) |
| Computers, Engineering & Science | 6 (100.0%) | 0 (0.0%) |
| Computers & Mathematics | 0 (0.0%) | 0 (0.0%) |
| Architecture & Engineering | 6 (100.0%) | 0 (0.0%) |
| Life, Physical & Social Science | 0 (0.0%) | 0 (0.0%) |
| Community & Social Service | 51 (52.6%) | 46 (47.4%) |
| Education, Arts & Media | 0 (0.0%) | 13 (100.0%) |
| Legal Services & Support | 0 (0.0%) | 0 (0.0%) |
| Education Instruction & Library | 51 (60.7%) | 33 (39.3%) |
| Arts, Media & Entertainment | 0 (0.0%) | 0 (0.0%) |
| Health Diagnosing & Treating | 8 (27.6%) | 21 (72.4%) |
| Health Technologists | 8 (33.3%) | 16 (66.7%) |
| Total (Category) | 139 (58.4%) | 99 (41.6%) |
| Total (Overall) | 443 (54.2%) | 374 (45.8%) |
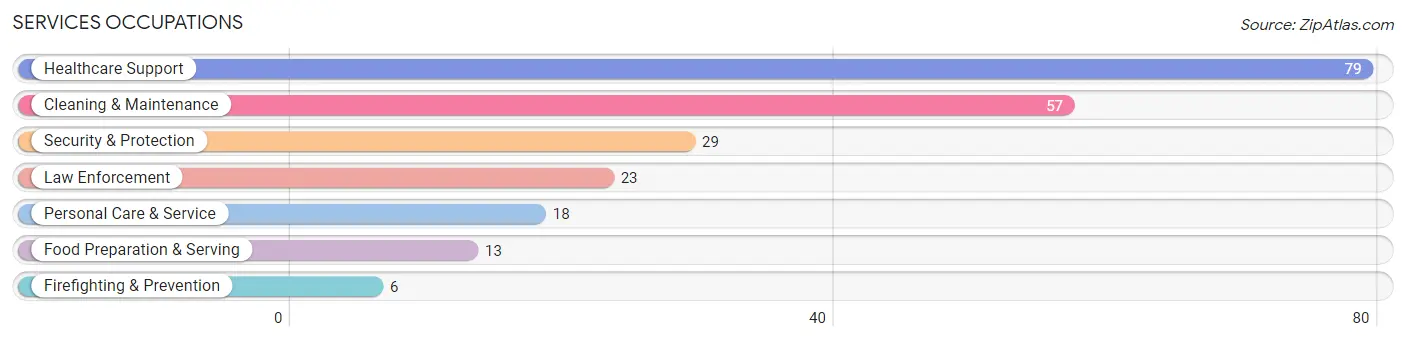
Services Occupations
The most common Services occupations in Munising are Healthcare Support (79 | 9.7%), Cleaning & Maintenance (57 | 7.0%), Security & Protection (29 | 3.5%), Law Enforcement (23 | 2.8%), and Personal Care & Service (18 | 2.2%).
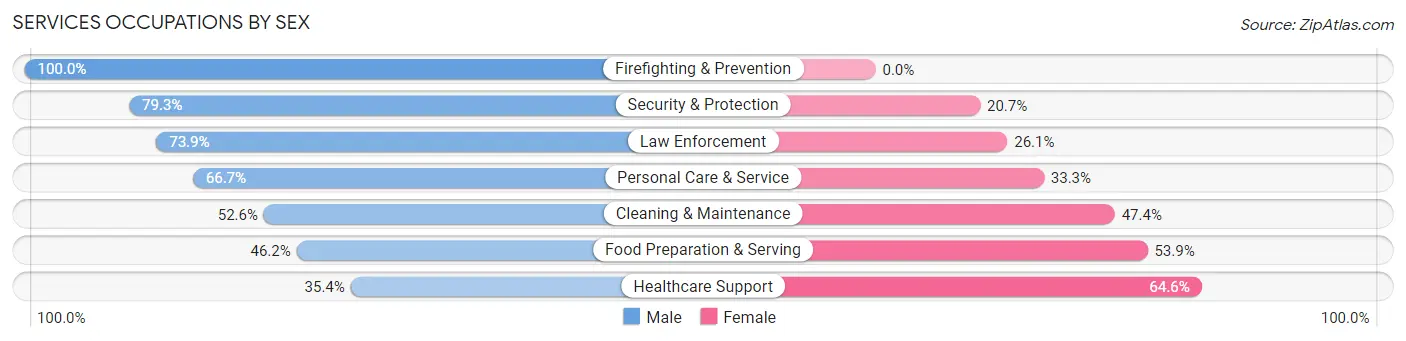
Services Occupations by Sex
Within the Services occupations in Munising, the most male-oriented occupations are Firefighting & Prevention (100.0%), Security & Protection (79.3%), and Law Enforcement (73.9%), while the most female-oriented occupations are Healthcare Support (64.6%), Food Preparation & Serving (53.8%), and Cleaning & Maintenance (47.4%).
| Occupation | Male | Female |
| Healthcare Support | 28 (35.4%) | 51 (64.6%) |
| Security & Protection | 23 (79.3%) | 6 (20.7%) |
| Firefighting & Prevention | 6 (100.0%) | 0 (0.0%) |
| Law Enforcement | 17 (73.9%) | 6 (26.1%) |
| Food Preparation & Serving | 6 (46.2%) | 7 (53.8%) |
| Cleaning & Maintenance | 30 (52.6%) | 27 (47.4%) |
| Personal Care & Service | 12 (66.7%) | 6 (33.3%) |
| Total (Category) | 99 (50.5%) | 97 (49.5%) |
| Total (Overall) | 443 (54.2%) | 374 (45.8%) |
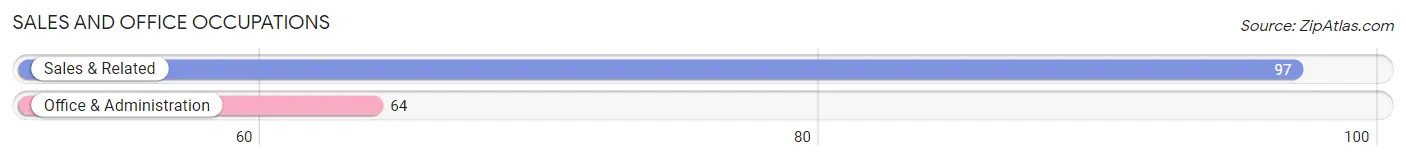
Sales and Office Occupations
The most common Sales and Office occupations in Munising are Sales & Related (97 | 11.9%), and Office & Administration (64 | 7.8%).
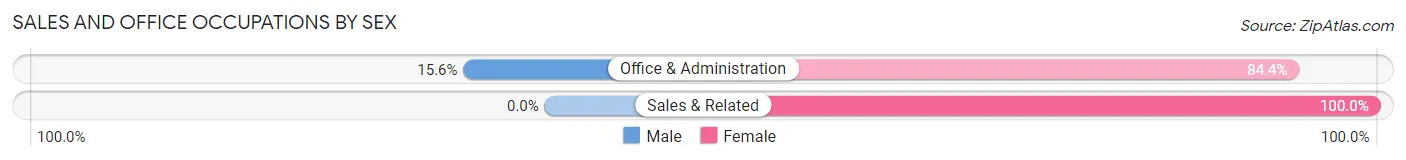
Sales and Office Occupations by Sex
| Occupation | Male | Female |
| Sales & Related | 0 (0.0%) | 97 (100.0%) |
| Office & Administration | 10 (15.6%) | 54 (84.4%) |
| Total (Category) | 10 (6.2%) | 151 (93.8%) |
| Total (Overall) | 443 (54.2%) | 374 (45.8%) |
Natural Resources, Construction and Maintenance Occupations
The most common Natural Resources, Construction and Maintenance occupations in Munising are Installation, Maintenance & Repair (37 | 4.5%), and Construction & Extraction (24 | 2.9%).
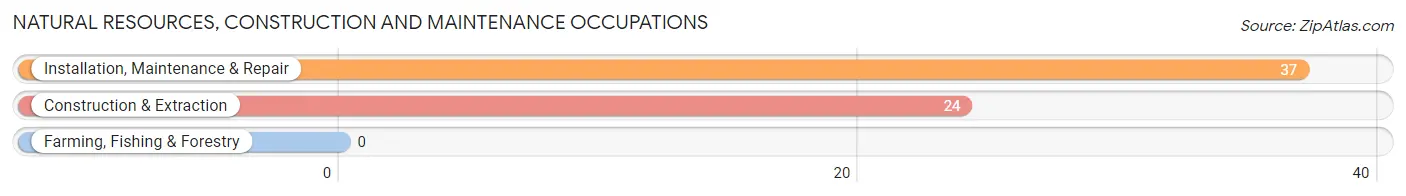
Natural Resources, Construction and Maintenance Occupations by Sex
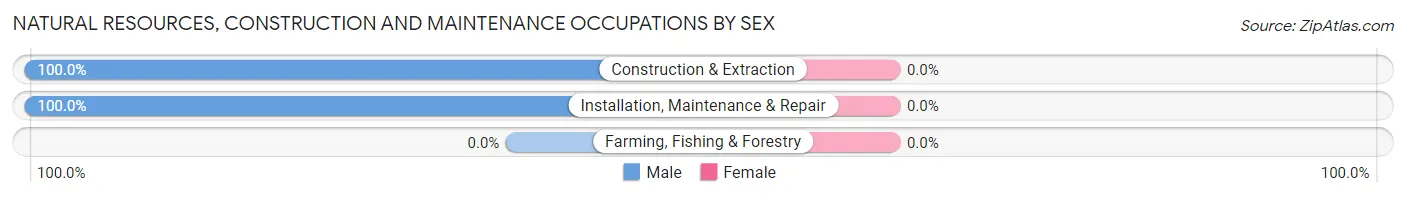
| Occupation | Male | Female |
| Farming, Fishing & Forestry | 0 (0.0%) | 0 (0.0%) |
| Construction & Extraction | 24 (100.0%) | 0 (0.0%) |
| Installation, Maintenance & Repair | 37 (100.0%) | 0 (0.0%) |
| Total (Category) | 61 (100.0%) | 0 (0.0%) |
| Total (Overall) | 443 (54.2%) | 374 (45.8%) |
Production, Transportation and Moving Occupations
The most common Production, Transportation and Moving occupations in Munising are Production (78 | 9.6%), Material Moving (70 | 8.6%), and Transportation (13 | 1.6%).
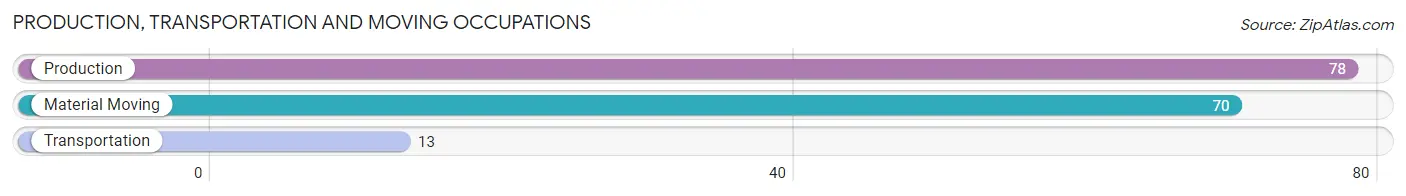
Production, Transportation and Moving Occupations by Sex
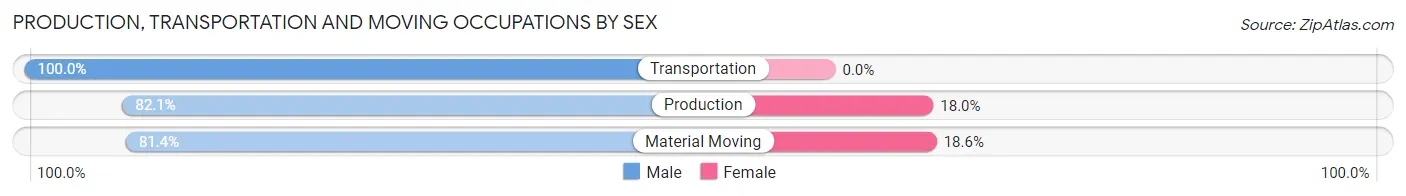
| Occupation | Male | Female |
| Production | 64 (82.1%) | 14 (17.9%) |
| Transportation | 13 (100.0%) | 0 (0.0%) |
| Material Moving | 57 (81.4%) | 13 (18.6%) |
| Total (Category) | 134 (83.2%) | 27 (16.8%) |
| Total (Overall) | 443 (54.2%) | 374 (45.8%) |
Employment Industries by Sex in Munising
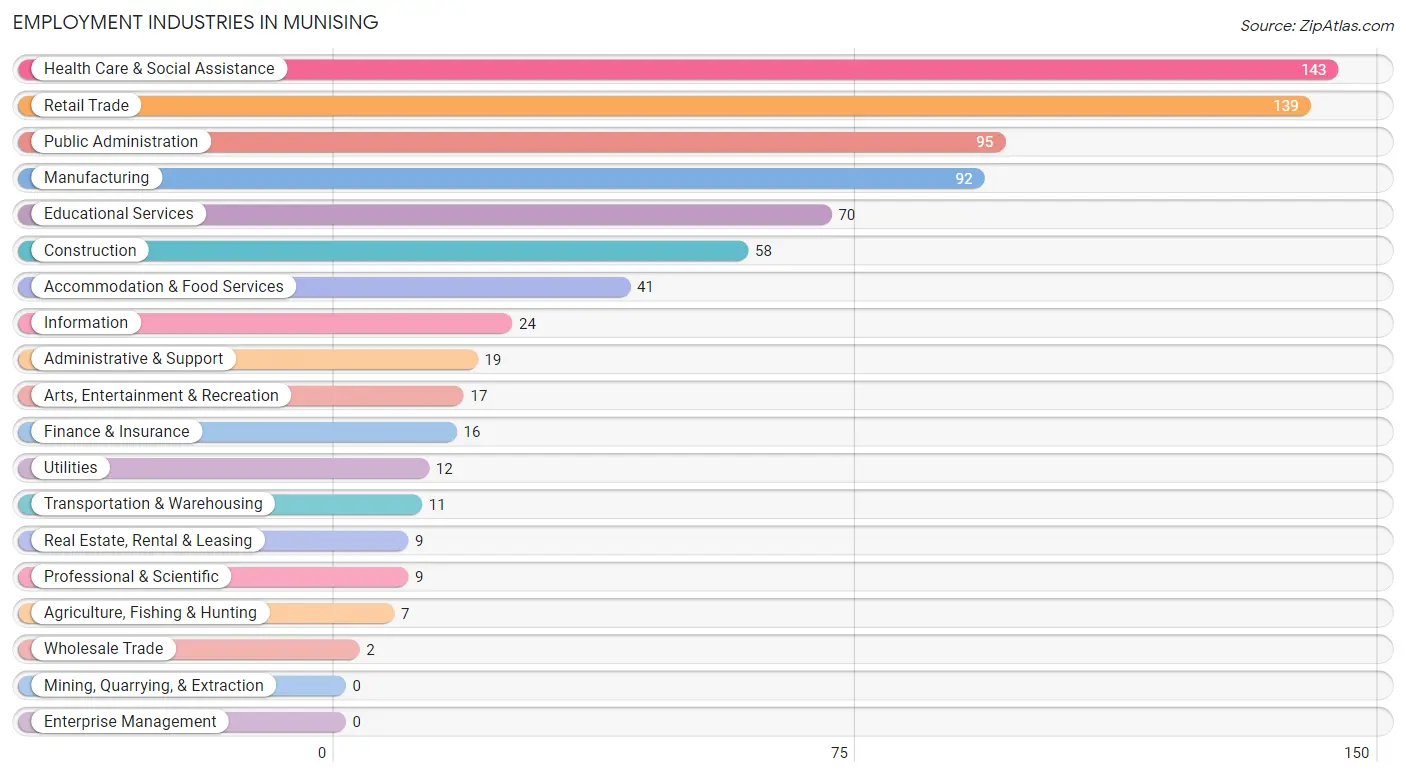
Employment Industries in Munising
The major employment industries in Munising include Health Care & Social Assistance (143 | 17.5%), Retail Trade (139 | 17.0%), Public Administration (95 | 11.6%), Manufacturing (92 | 11.3%), and Educational Services (70 | 8.6%).
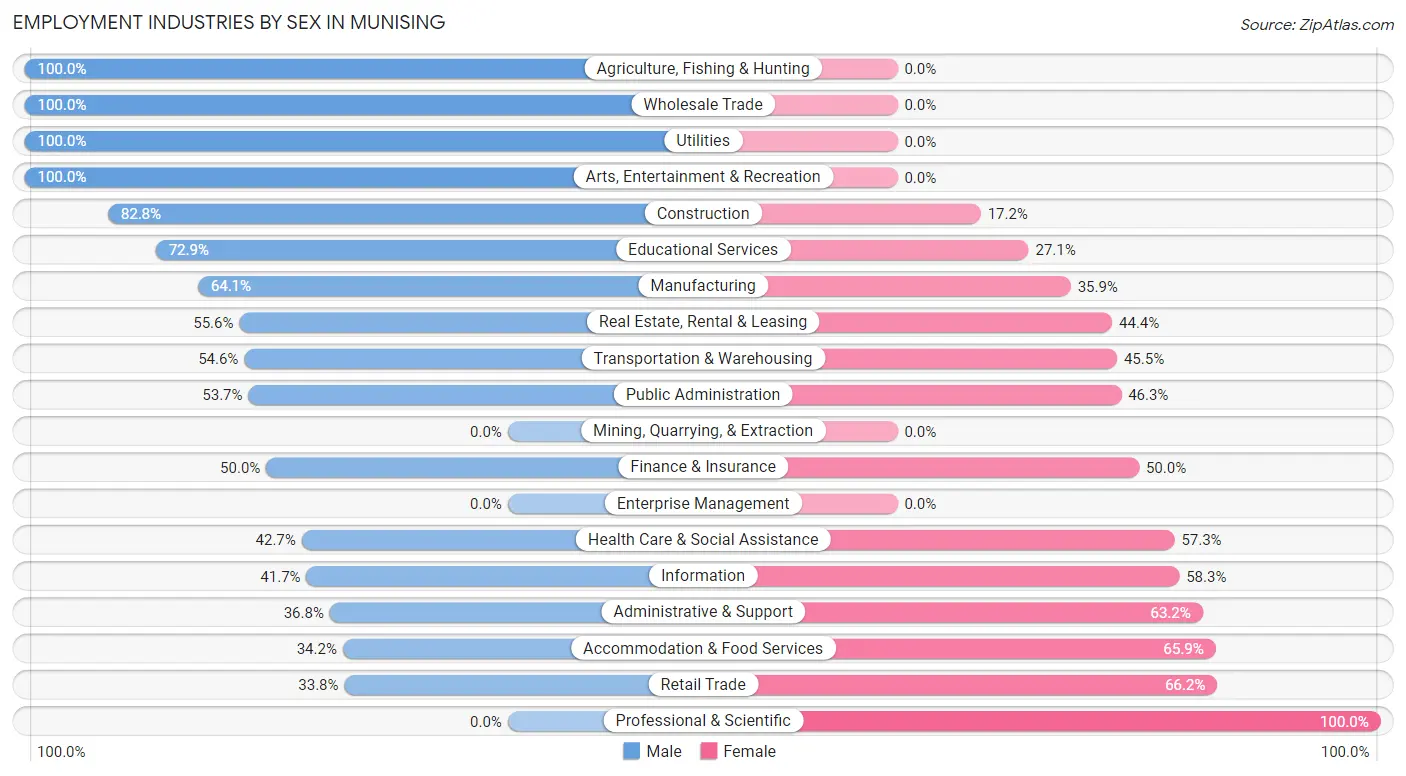
Employment Industries by Sex in Munising
The Munising industries that see more men than women are Agriculture, Fishing & Hunting (100.0%), Wholesale Trade (100.0%), and Utilities (100.0%), whereas the industries that tend to have a higher number of women are Professional & Scientific (100.0%), Retail Trade (66.2%), and Accommodation & Food Services (65.8%).
| Industry | Male | Female |
| Agriculture, Fishing & Hunting | 7 (100.0%) | 0 (0.0%) |
| Mining, Quarrying, & Extraction | 0 (0.0%) | 0 (0.0%) |
| Construction | 48 (82.8%) | 10 (17.2%) |
| Manufacturing | 59 (64.1%) | 33 (35.9%) |
| Wholesale Trade | 2 (100.0%) | 0 (0.0%) |
| Retail Trade | 47 (33.8%) | 92 (66.2%) |
| Transportation & Warehousing | 6 (54.5%) | 5 (45.5%) |
| Utilities | 12 (100.0%) | 0 (0.0%) |
| Information | 10 (41.7%) | 14 (58.3%) |
| Finance & Insurance | 8 (50.0%) | 8 (50.0%) |
| Real Estate, Rental & Leasing | 5 (55.6%) | 4 (44.4%) |
| Professional & Scientific | 0 (0.0%) | 9 (100.0%) |
| Enterprise Management | 0 (0.0%) | 0 (0.0%) |
| Administrative & Support | 7 (36.8%) | 12 (63.2%) |
| Educational Services | 51 (72.9%) | 19 (27.1%) |
| Health Care & Social Assistance | 61 (42.7%) | 82 (57.3%) |
| Arts, Entertainment & Recreation | 17 (100.0%) | 0 (0.0%) |
| Accommodation & Food Services | 14 (34.2%) | 27 (65.8%) |
| Public Administration | 51 (53.7%) | 44 (46.3%) |
| Total | 443 (54.2%) | 374 (45.8%) |
Education in Munising
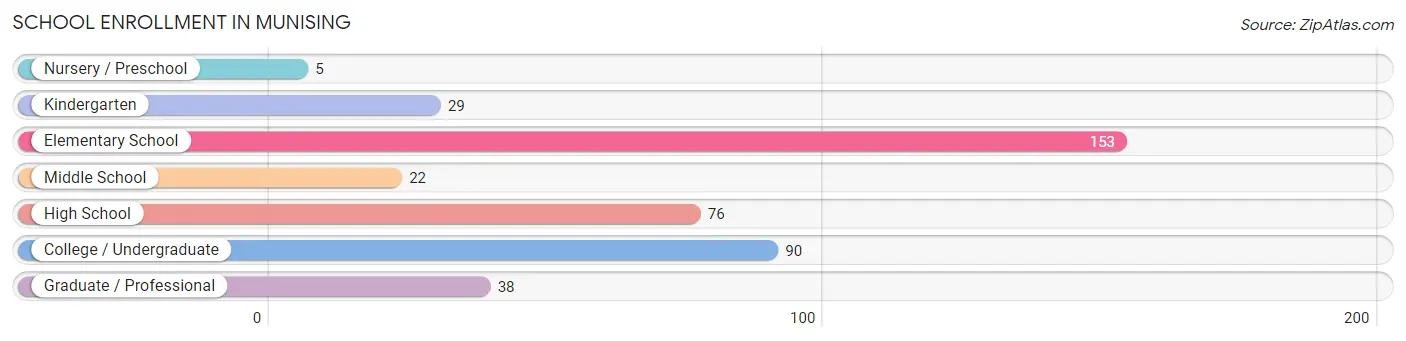
School Enrollment in Munising
The most common levels of schooling among the 413 students in Munising are elementary school (153 | 37.0%), college / undergraduate (90 | 21.8%), and high school (76 | 18.4%).
| School Level | # Students | % Students |
| Nursery / Preschool | 5 | 1.2% |
| Kindergarten | 29 | 7.0% |
| Elementary School | 153 | 37.0% |
| Middle School | 22 | 5.3% |
| High School | 76 | 18.4% |
| College / Undergraduate | 90 | 21.8% |
| Graduate / Professional | 38 | 9.2% |
| Total | 413 | 100.0% |
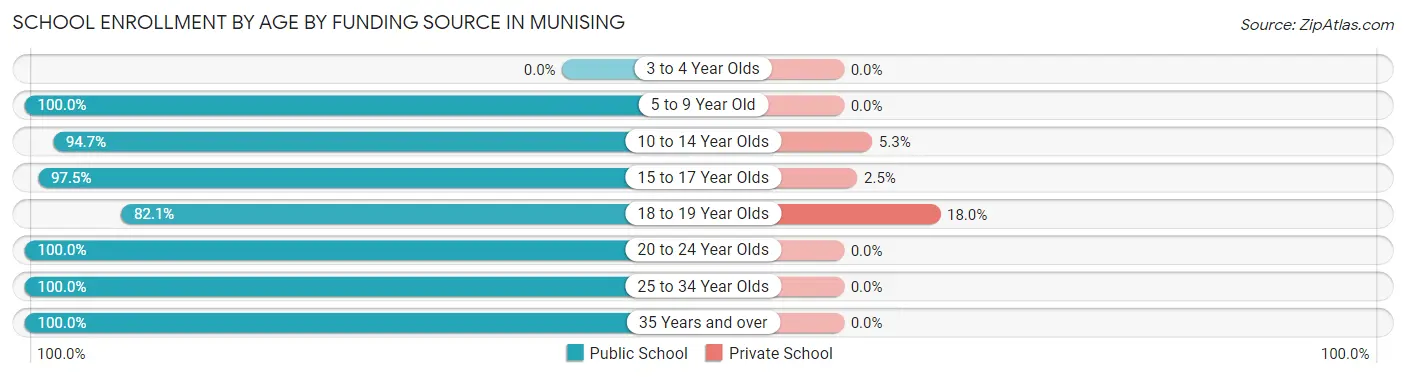
School Enrollment by Age by Funding Source in Munising
Out of a total of 413 students who are enrolled in schools in Munising, 10 (2.4%) attend a private institution, while the remaining 403 (97.6%) are enrolled in public schools. The age group of 18 to 19 year olds has the highest likelihood of being enrolled in private schools, with 7 (17.9% in the age bracket) enrolled. Conversely, the age group of 5 to 9 year old has the lowest likelihood of being enrolled in a private school, with 176 (100.0% in the age bracket) attending a public institution.
| Age Bracket | Public School | Private School |
| 3 to 4 Year Olds | 0 (0.0%) | 0 (0.0%) |
| 5 to 9 Year Old | 176 (100.0%) | 0 (0.0%) |
| 10 to 14 Year Olds | 36 (94.7%) | 2 (5.3%) |
| 15 to 17 Year Olds | 39 (97.5%) | 1 (2.5%) |
| 18 to 19 Year Olds | 32 (82.1%) | 7 (17.9%) |
| 20 to 24 Year Olds | 38 (100.0%) | 0 (0.0%) |
| 25 to 34 Year Olds | 38 (100.0%) | 0 (0.0%) |
| 35 Years and over | 44 (100.0%) | 0 (0.0%) |
| Total | 403 (97.6%) | 10 (2.4%) |
Educational Attainment by Field of Study in Munising
Business (90 | 19.0%), science & technology (68 | 14.4%), education (63 | 13.3%), bio, nature & agricultural (56 | 11.8%), and liberal arts & history (50 | 10.6%) are the most common fields of study among 473 individuals in Munising who have obtained a bachelor's degree or higher.
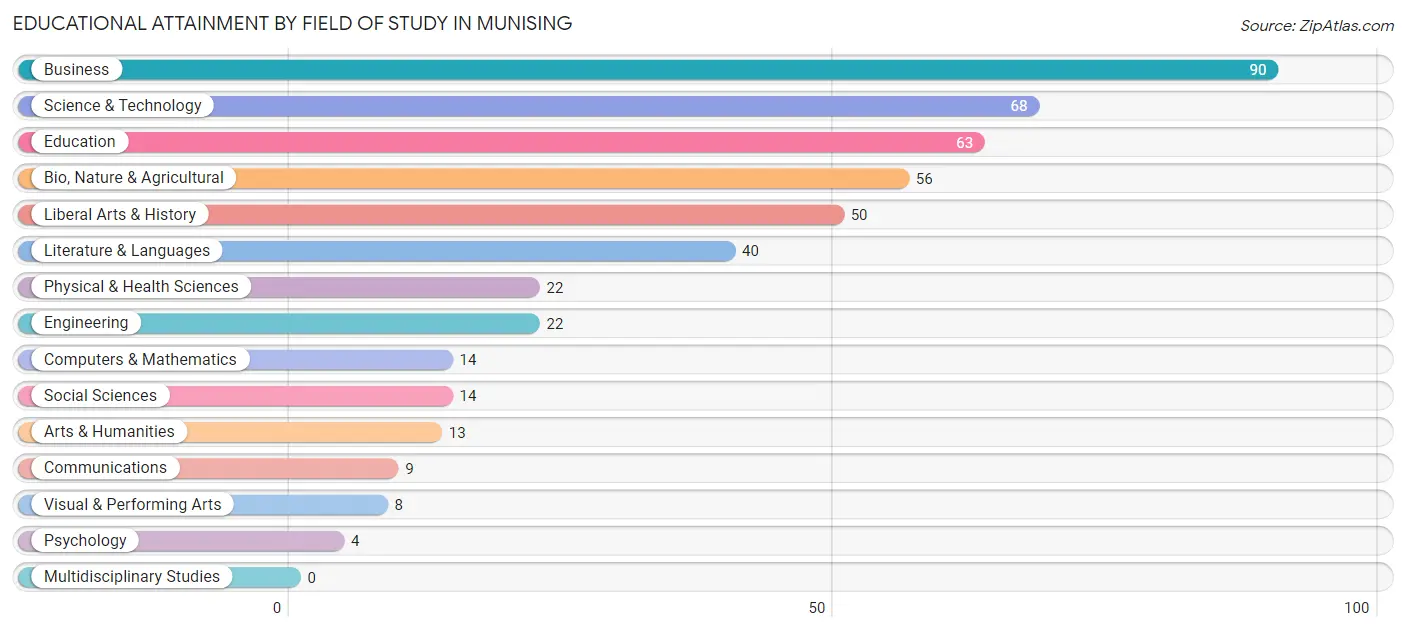
| Field of Study | # Graduates | % Graduates |
| Computers & Mathematics | 14 | 3.0% |
| Bio, Nature & Agricultural | 56 | 11.8% |
| Physical & Health Sciences | 22 | 4.6% |
| Psychology | 4 | 0.9% |
| Social Sciences | 14 | 3.0% |
| Engineering | 22 | 4.6% |
| Multidisciplinary Studies | 0 | 0.0% |
| Science & Technology | 68 | 14.4% |
| Business | 90 | 19.0% |
| Education | 63 | 13.3% |
| Literature & Languages | 40 | 8.5% |
| Liberal Arts & History | 50 | 10.6% |
| Visual & Performing Arts | 8 | 1.7% |
| Communications | 9 | 1.9% |
| Arts & Humanities | 13 | 2.8% |
| Total | 473 | 100.0% |
Transportation & Commute in Munising
Vehicle Availability by Sex in Munising
The most prevalent vehicle ownership categories in Munising are males with 1 vehicle (170, accounting for 38.4%) and females with 1 vehicle (115, making up 45.5%).
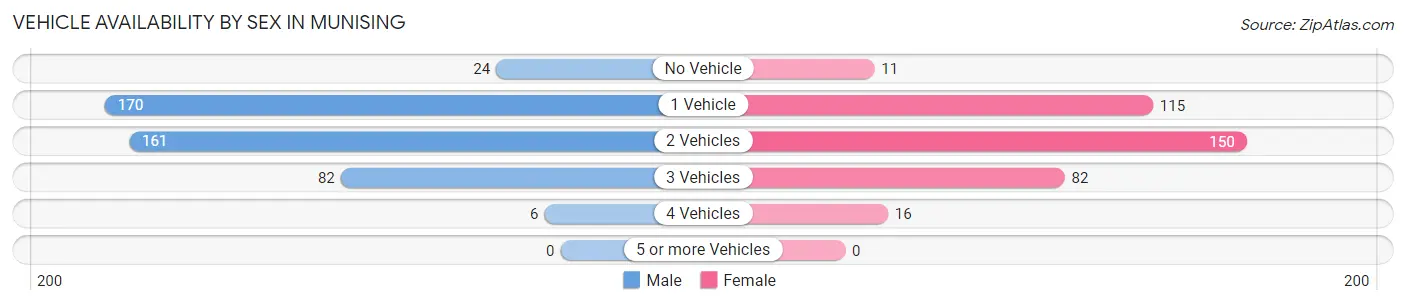
| Vehicles Available | Male | Female |
| No Vehicle | 24 (5.4%) | 11 (2.9%) |
| 1 Vehicle | 170 (38.4%) | 115 (30.7%) |
| 2 Vehicles | 161 (36.3%) | 150 (40.1%) |
| 3 Vehicles | 82 (18.5%) | 82 (21.9%) |
| 4 Vehicles | 6 (1.3%) | 16 (4.3%) |
| 5 or more Vehicles | 0 (0.0%) | 0 (0.0%) |
| Total | 443 (100.0%) | 374 (100.0%) |
Commute Time in Munising
The most frequently occuring commute durations in Munising are 5 to 9 minutes (245 commuters, 33.0%), less than 5 minutes (160 commuters, 21.5%), and 10 to 14 minutes (133 commuters, 17.9%).
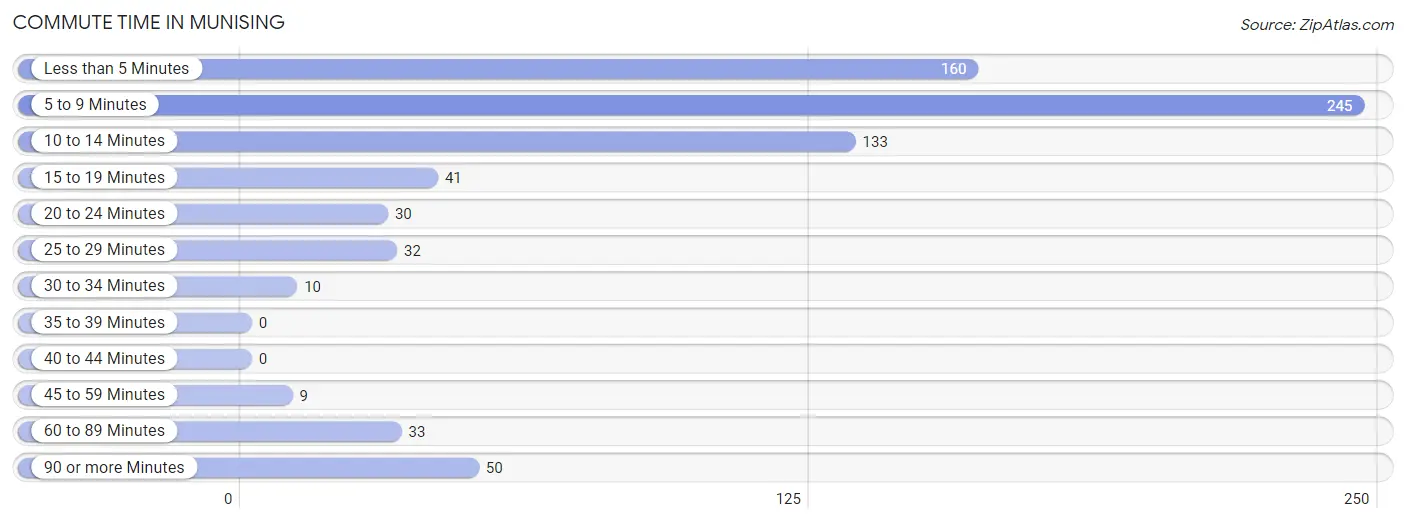
| Commute Time | # Commuters | % Commuters |
| Less than 5 Minutes | 160 | 21.5% |
| 5 to 9 Minutes | 245 | 33.0% |
| 10 to 14 Minutes | 133 | 17.9% |
| 15 to 19 Minutes | 41 | 5.5% |
| 20 to 24 Minutes | 30 | 4.0% |
| 25 to 29 Minutes | 32 | 4.3% |
| 30 to 34 Minutes | 10 | 1.3% |
| 35 to 39 Minutes | 0 | 0.0% |
| 40 to 44 Minutes | 0 | 0.0% |
| 45 to 59 Minutes | 9 | 1.2% |
| 60 to 89 Minutes | 33 | 4.4% |
| 90 or more Minutes | 50 | 6.7% |
Commute Time by Sex in Munising
The most common commute times in Munising are 5 to 9 minutes (105 commuters, 27.3%) for males and 5 to 9 minutes (140 commuters, 39.1%) for females.
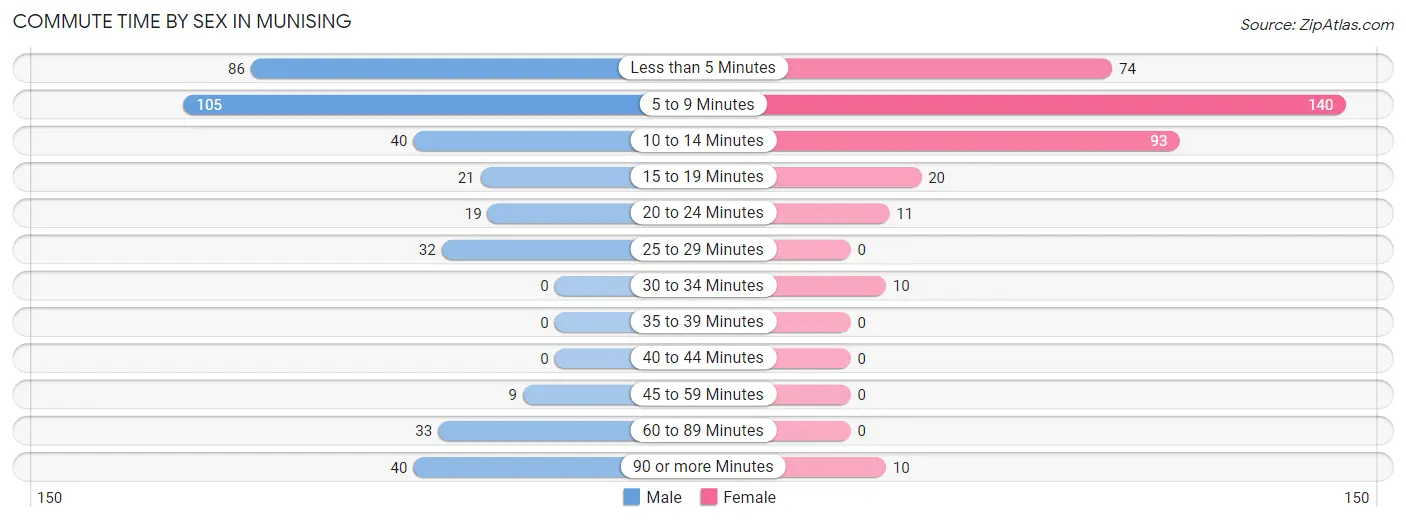
| Commute Time | Male | Female |
| Less than 5 Minutes | 86 (22.3%) | 74 (20.7%) |
| 5 to 9 Minutes | 105 (27.3%) | 140 (39.1%) |
| 10 to 14 Minutes | 40 (10.4%) | 93 (26.0%) |
| 15 to 19 Minutes | 21 (5.4%) | 20 (5.6%) |
| 20 to 24 Minutes | 19 (4.9%) | 11 (3.1%) |
| 25 to 29 Minutes | 32 (8.3%) | 0 (0.0%) |
| 30 to 34 Minutes | 0 (0.0%) | 10 (2.8%) |
| 35 to 39 Minutes | 0 (0.0%) | 0 (0.0%) |
| 40 to 44 Minutes | 0 (0.0%) | 0 (0.0%) |
| 45 to 59 Minutes | 9 (2.3%) | 0 (0.0%) |
| 60 to 89 Minutes | 33 (8.6%) | 0 (0.0%) |
| 90 or more Minutes | 40 (10.4%) | 10 (2.8%) |
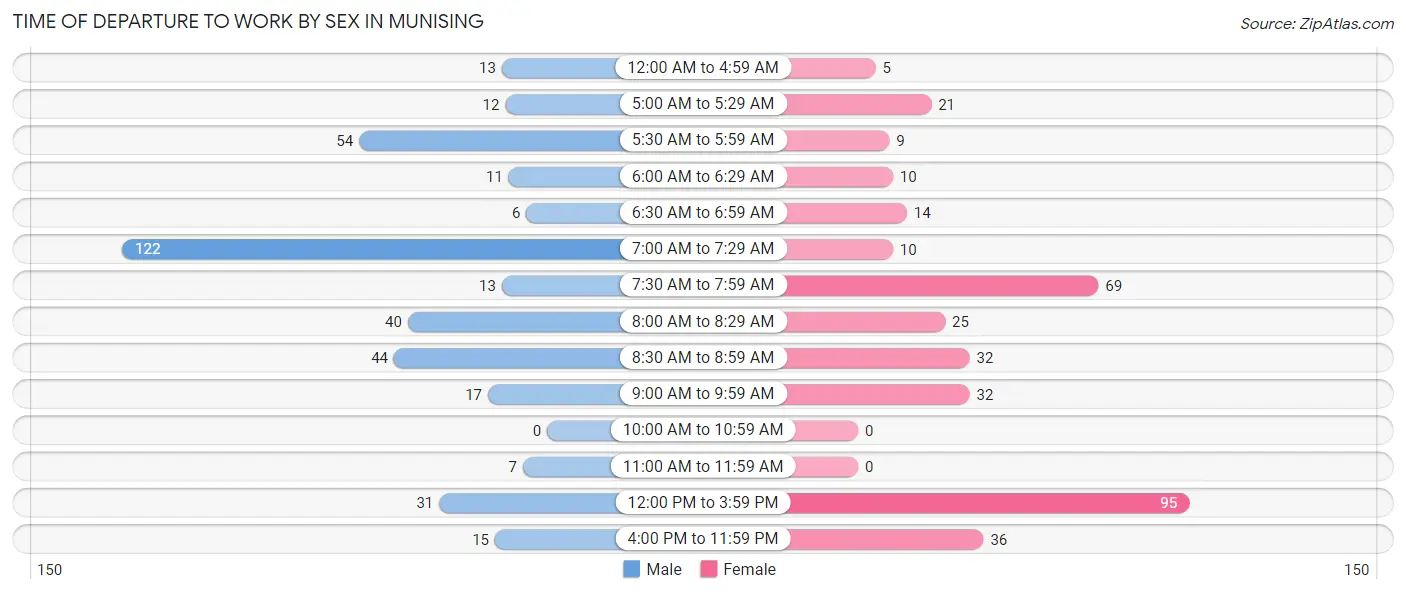
Time of Departure to Work by Sex in Munising
The most frequent times of departure to work in Munising are 7:00 AM to 7:29 AM (122, 31.7%) for males and 12:00 PM to 3:59 PM (95, 26.5%) for females.
| Time of Departure | Male | Female |
| 12:00 AM to 4:59 AM | 13 (3.4%) | 5 (1.4%) |
| 5:00 AM to 5:29 AM | 12 (3.1%) | 21 (5.9%) |
| 5:30 AM to 5:59 AM | 54 (14.0%) | 9 (2.5%) |
| 6:00 AM to 6:29 AM | 11 (2.9%) | 10 (2.8%) |
| 6:30 AM to 6:59 AM | 6 (1.6%) | 14 (3.9%) |
| 7:00 AM to 7:29 AM | 122 (31.7%) | 10 (2.8%) |
| 7:30 AM to 7:59 AM | 13 (3.4%) | 69 (19.3%) |
| 8:00 AM to 8:29 AM | 40 (10.4%) | 25 (7.0%) |
| 8:30 AM to 8:59 AM | 44 (11.4%) | 32 (8.9%) |
| 9:00 AM to 9:59 AM | 17 (4.4%) | 32 (8.9%) |
| 10:00 AM to 10:59 AM | 0 (0.0%) | 0 (0.0%) |
| 11:00 AM to 11:59 AM | 7 (1.8%) | 0 (0.0%) |
| 12:00 PM to 3:59 PM | 31 (8.1%) | 95 (26.5%) |
| 4:00 PM to 11:59 PM | 15 (3.9%) | 36 (10.1%) |
| Total | 385 (100.0%) | 358 (100.0%) |
Housing Occupancy in Munising
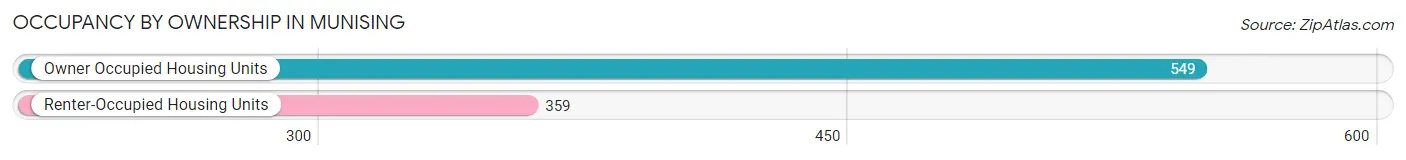
Occupancy by Ownership in Munising
Of the total 908 dwellings in Munising, owner-occupied units account for 549 (60.5%), while renter-occupied units make up 359 (39.5%).
| Occupancy | # Housing Units | % Housing Units |
| Owner Occupied Housing Units | 549 | 60.5% |
| Renter-Occupied Housing Units | 359 | 39.5% |
| Total Occupied Housing Units | 908 | 100.0% |
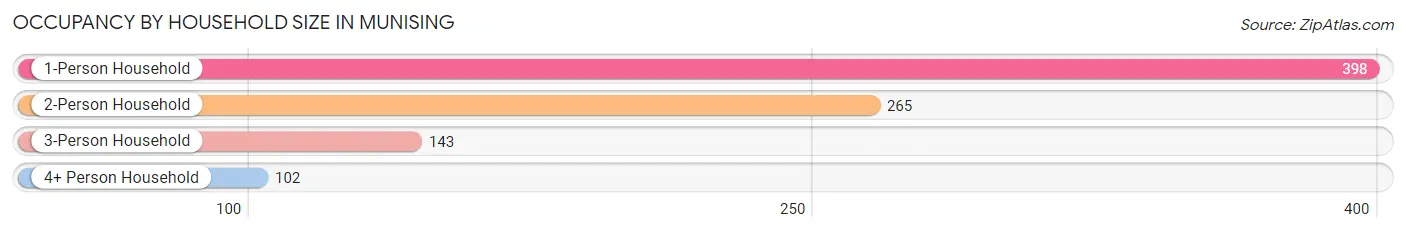
Occupancy by Household Size in Munising
| Household Size | # Housing Units | % Housing Units |
| 1-Person Household | 398 | 43.8% |
| 2-Person Household | 265 | 29.2% |
| 3-Person Household | 143 | 15.8% |
| 4+ Person Household | 102 | 11.2% |
| Total Housing Units | 908 | 100.0% |
Occupancy by Ownership by Household Size in Munising
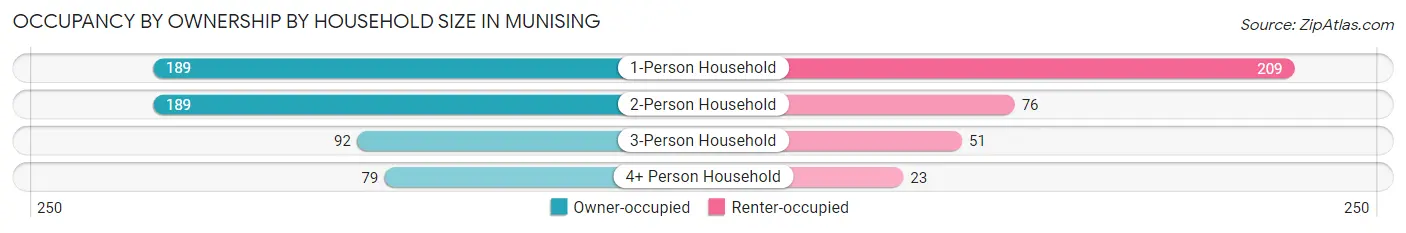
| Household Size | Owner-occupied | Renter-occupied |
| 1-Person Household | 189 (47.5%) | 209 (52.5%) |
| 2-Person Household | 189 (71.3%) | 76 (28.7%) |
| 3-Person Household | 92 (64.3%) | 51 (35.7%) |
| 4+ Person Household | 79 (77.4%) | 23 (22.6%) |
| Total Housing Units | 549 (60.5%) | 359 (39.5%) |
Occupancy by Educational Attainment in Munising
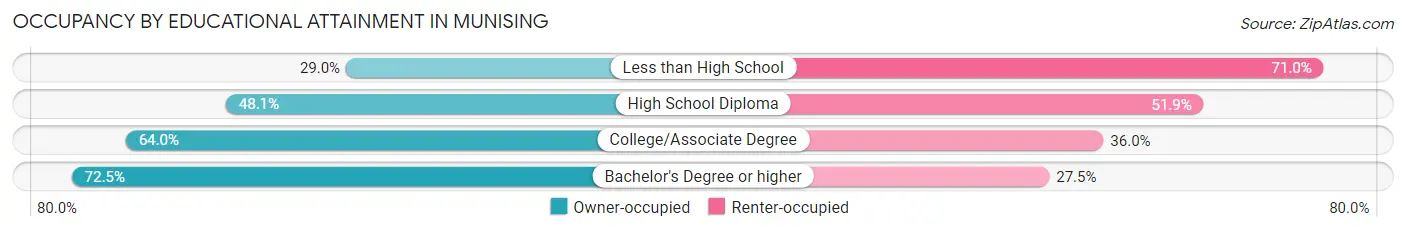
| Household Size | Owner-occupied | Renter-occupied |
| Less than High School | 9 (29.0%) | 22 (71.0%) |
| High School Diploma | 137 (48.1%) | 148 (51.9%) |
| College/Associate Degree | 197 (64.0%) | 111 (36.0%) |
| Bachelor's Degree or higher | 206 (72.5%) | 78 (27.5%) |
Occupancy by Age of Householder in Munising
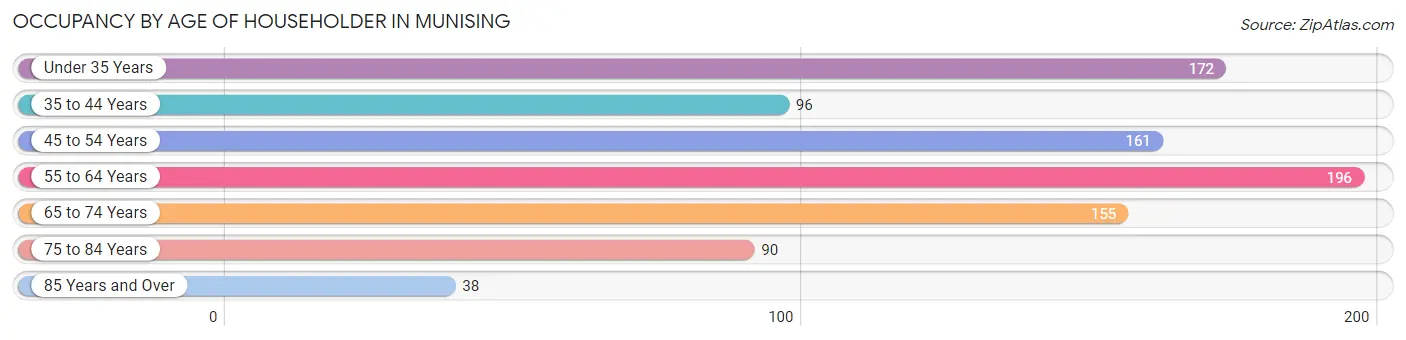
| Age Bracket | # Households | % Households |
| Under 35 Years | 172 | 18.9% |
| 35 to 44 Years | 96 | 10.6% |
| 45 to 54 Years | 161 | 17.7% |
| 55 to 64 Years | 196 | 21.6% |
| 65 to 74 Years | 155 | 17.1% |
| 75 to 84 Years | 90 | 9.9% |
| 85 Years and Over | 38 | 4.2% |
| Total | 908 | 100.0% |
Housing Finances in Munising
Median Income by Occupancy in Munising
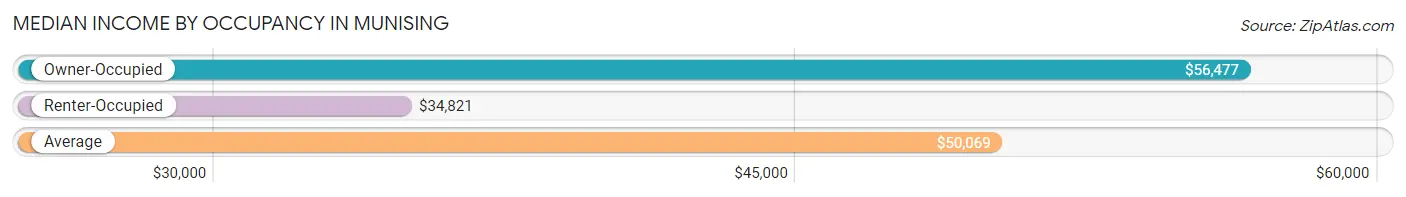
| Occupancy Type | # Households | Median Income |
| Owner-Occupied | 549 (60.5%) | $56,477 |
| Renter-Occupied | 359 (39.5%) | $34,821 |
| Average | 908 (100.0%) | $50,069 |
Occupancy by Householder Income Bracket in Munising
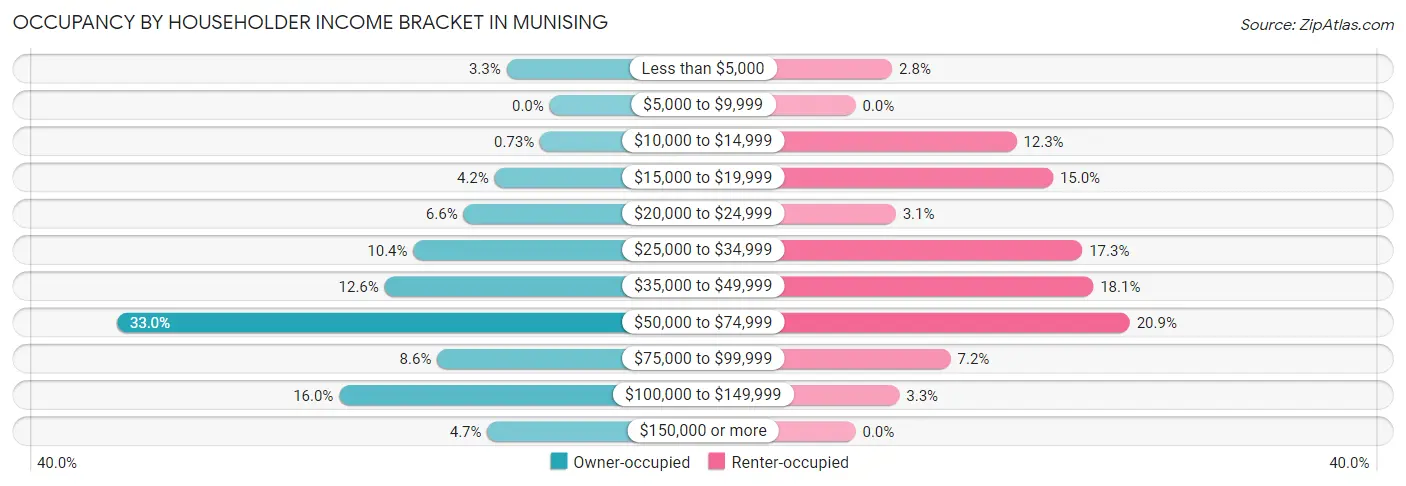
| Income Bracket | Owner-occupied | Renter-occupied |
| Less than $5,000 | 18 (3.3%) | 10 (2.8%) |
| $5,000 to $9,999 | 0 (0.0%) | 0 (0.0%) |
| $10,000 to $14,999 | 4 (0.7%) | 44 (12.3%) |
| $15,000 to $19,999 | 23 (4.2%) | 54 (15.0%) |
| $20,000 to $24,999 | 36 (6.6%) | 11 (3.1%) |
| $25,000 to $34,999 | 57 (10.4%) | 62 (17.3%) |
| $35,000 to $49,999 | 69 (12.6%) | 65 (18.1%) |
| $50,000 to $74,999 | 181 (33.0%) | 75 (20.9%) |
| $75,000 to $99,999 | 47 (8.6%) | 26 (7.2%) |
| $100,000 to $149,999 | 88 (16.0%) | 12 (3.3%) |
| $150,000 or more | 26 (4.7%) | 0 (0.0%) |
| Total | 549 (100.0%) | 359 (100.0%) |
Monthly Housing Cost Tiers in Munising
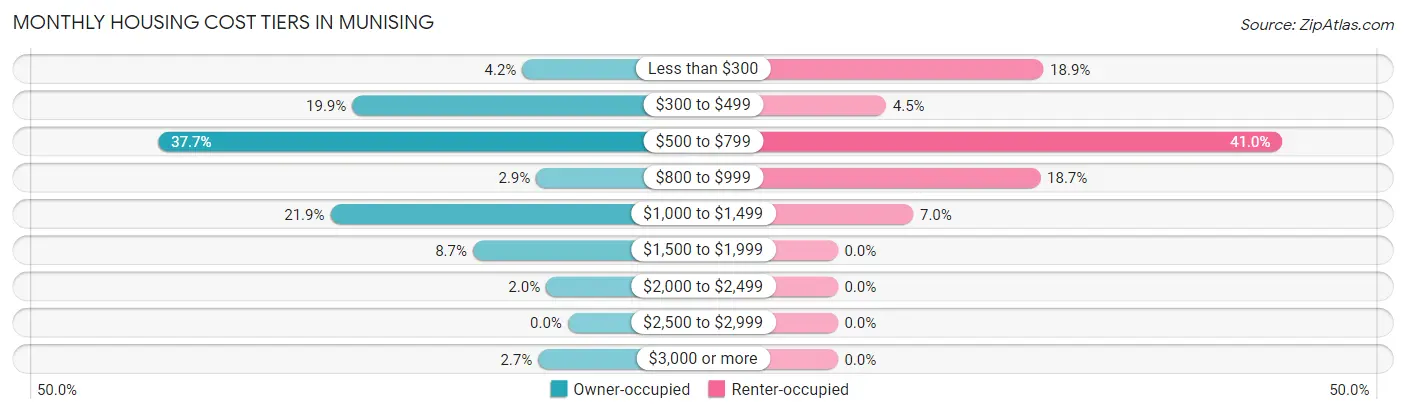
| Monthly Cost | Owner-occupied | Renter-occupied |
| Less than $300 | 23 (4.2%) | 68 (18.9%) |
| $300 to $499 | 109 (19.9%) | 16 (4.5%) |
| $500 to $799 | 207 (37.7%) | 147 (40.9%) |
| $800 to $999 | 16 (2.9%) | 67 (18.7%) |
| $1,000 to $1,499 | 120 (21.9%) | 25 (7.0%) |
| $1,500 to $1,999 | 48 (8.7%) | 0 (0.0%) |
| $2,000 to $2,499 | 11 (2.0%) | 0 (0.0%) |
| $2,500 to $2,999 | 0 (0.0%) | 0 (0.0%) |
| $3,000 or more | 15 (2.7%) | 0 (0.0%) |
| Total | 549 (100.0%) | 359 (100.0%) |
Physical Housing Characteristics in Munising
Housing Structures in Munising
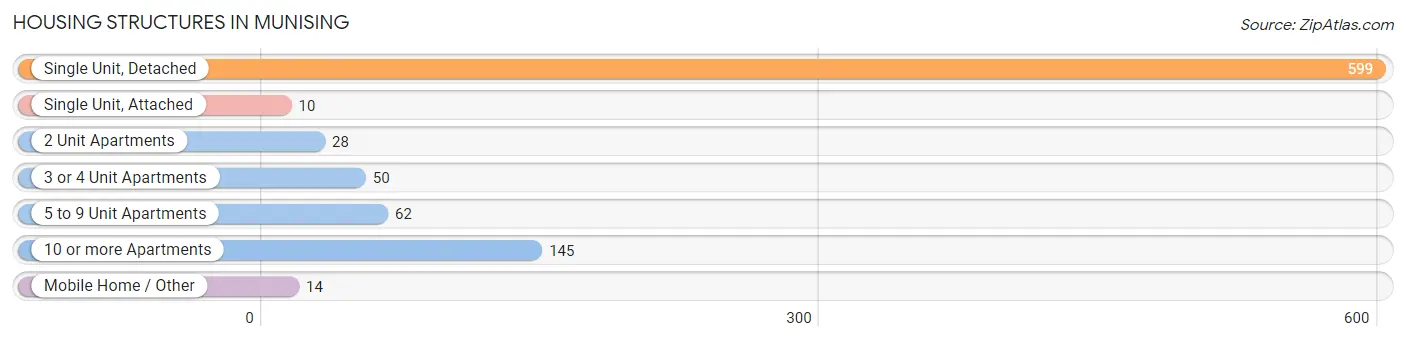
| Structure Type | # Housing Units | % Housing Units |
| Single Unit, Detached | 599 | 66.0% |
| Single Unit, Attached | 10 | 1.1% |
| 2 Unit Apartments | 28 | 3.1% |
| 3 or 4 Unit Apartments | 50 | 5.5% |
| 5 to 9 Unit Apartments | 62 | 6.8% |
| 10 or more Apartments | 145 | 16.0% |
| Mobile Home / Other | 14 | 1.5% |
| Total | 908 | 100.0% |
Housing Structures by Occupancy in Munising
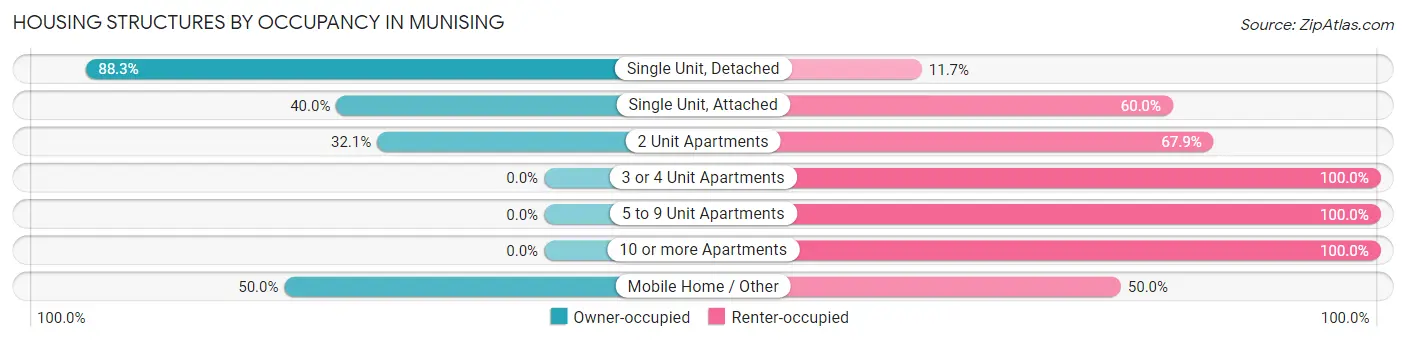
| Structure Type | Owner-occupied | Renter-occupied |
| Single Unit, Detached | 529 (88.3%) | 70 (11.7%) |
| Single Unit, Attached | 4 (40.0%) | 6 (60.0%) |
| 2 Unit Apartments | 9 (32.1%) | 19 (67.9%) |
| 3 or 4 Unit Apartments | 0 (0.0%) | 50 (100.0%) |
| 5 to 9 Unit Apartments | 0 (0.0%) | 62 (100.0%) |
| 10 or more Apartments | 0 (0.0%) | 145 (100.0%) |
| Mobile Home / Other | 7 (50.0%) | 7 (50.0%) |
| Total | 549 (60.5%) | 359 (39.5%) |
Housing Structures by Number of Rooms in Munising
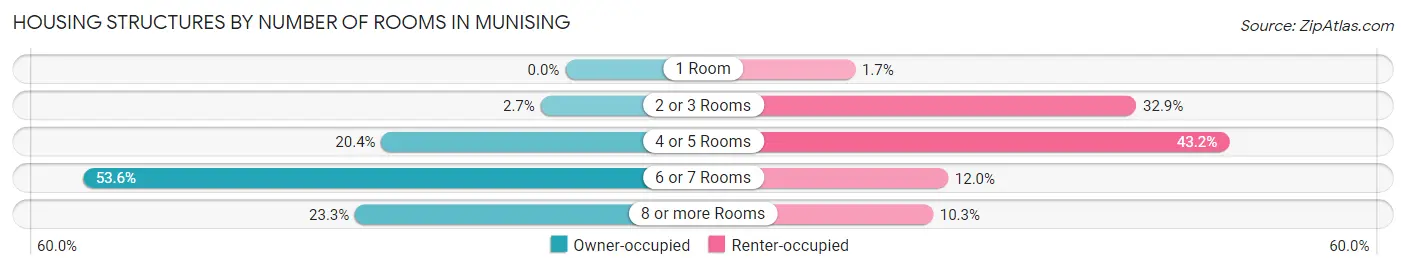
| Number of Rooms | Owner-occupied | Renter-occupied |
| 1 Room | 0 (0.0%) | 6 (1.7%) |
| 2 or 3 Rooms | 15 (2.7%) | 118 (32.9%) |
| 4 or 5 Rooms | 112 (20.4%) | 155 (43.2%) |
| 6 or 7 Rooms | 294 (53.5%) | 43 (12.0%) |
| 8 or more Rooms | 128 (23.3%) | 37 (10.3%) |
| Total | 549 (100.0%) | 359 (100.0%) |
Housing Structure by Heating Type in Munising
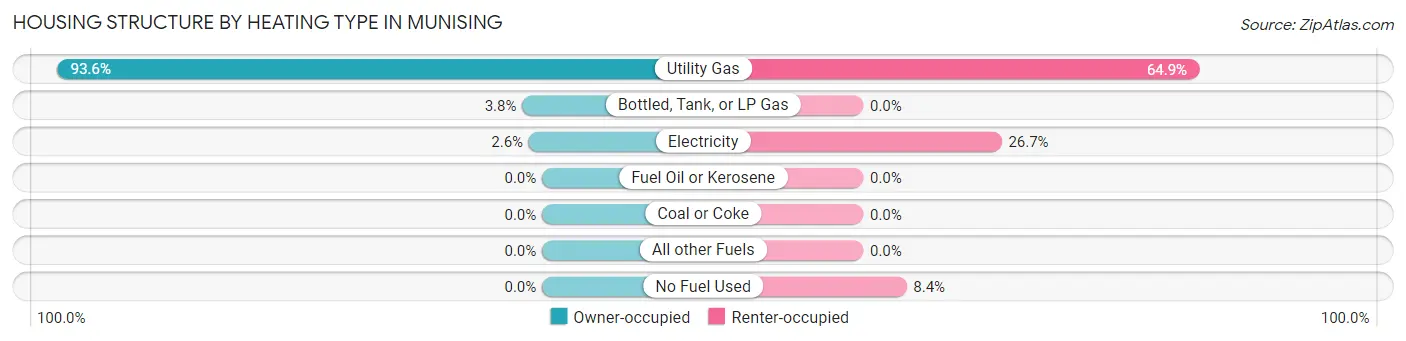
| Heating Type | Owner-occupied | Renter-occupied |
| Utility Gas | 514 (93.6%) | 233 (64.9%) |
| Bottled, Tank, or LP Gas | 21 (3.8%) | 0 (0.0%) |
| Electricity | 14 (2.5%) | 96 (26.7%) |
| Fuel Oil or Kerosene | 0 (0.0%) | 0 (0.0%) |
| Coal or Coke | 0 (0.0%) | 0 (0.0%) |
| All other Fuels | 0 (0.0%) | 0 (0.0%) |
| No Fuel Used | 0 (0.0%) | 30 (8.4%) |
| Total | 549 (100.0%) | 359 (100.0%) |
Household Vehicle Usage in Munising
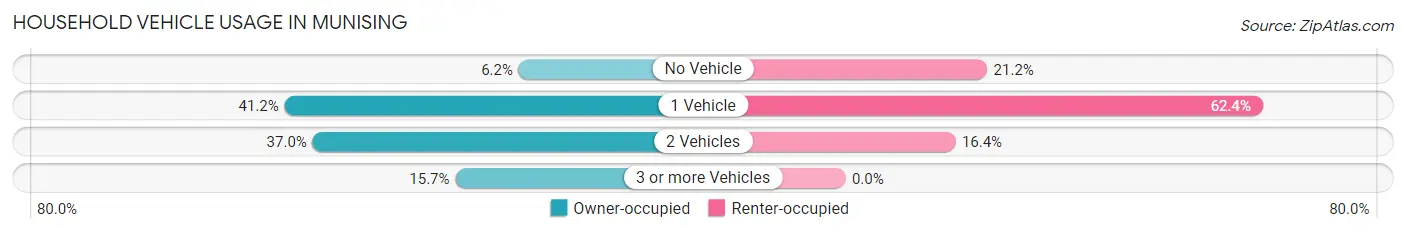
| Vehicles per Household | Owner-occupied | Renter-occupied |
| No Vehicle | 34 (6.2%) | 76 (21.2%) |
| 1 Vehicle | 226 (41.2%) | 224 (62.4%) |
| 2 Vehicles | 203 (37.0%) | 59 (16.4%) |
| 3 or more Vehicles | 86 (15.7%) | 0 (0.0%) |
| Total | 549 (100.0%) | 359 (100.0%) |
Real Estate & Mortgages in Munising
Real Estate and Mortgage Overview in Munising
| Characteristic | Without Mortgage | With Mortgage |
| Housing Units | 260 | 289 |
| Median Property Value | $103,500 | $119,800 |
| Median Household Income | $49,500 | $23 |
| Monthly Housing Costs | $503 | $15 |
| Real Estate Taxes | $1,620 | $2 |
Property Value by Mortgage Status in Munising
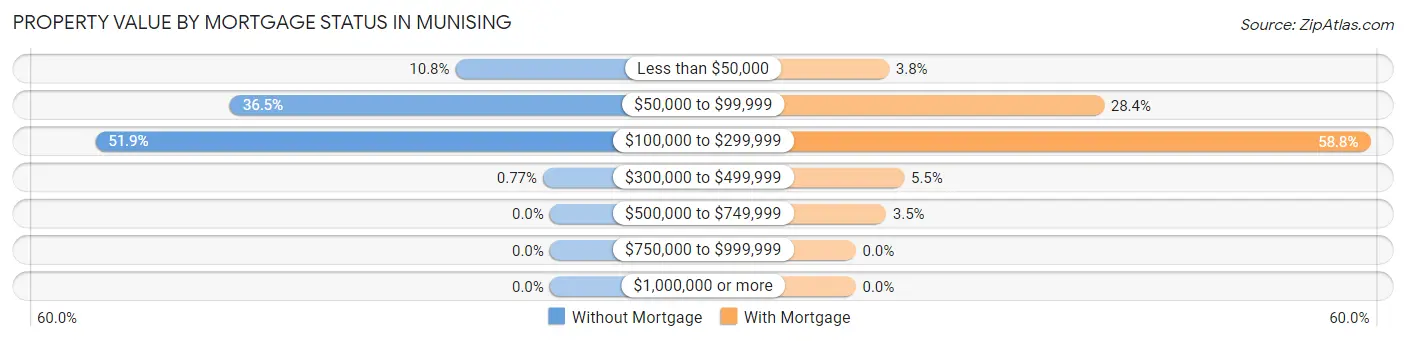
| Property Value | Without Mortgage | With Mortgage |
| Less than $50,000 | 28 (10.8%) | 11 (3.8%) |
| $50,000 to $99,999 | 95 (36.5%) | 82 (28.4%) |
| $100,000 to $299,999 | 135 (51.9%) | 170 (58.8%) |
| $300,000 to $499,999 | 2 (0.8%) | 16 (5.5%) |
| $500,000 to $749,999 | 0 (0.0%) | 10 (3.5%) |
| $750,000 to $999,999 | 0 (0.0%) | 0 (0.0%) |
| $1,000,000 or more | 0 (0.0%) | 0 (0.0%) |
| Total | 260 (100.0%) | 289 (100.0%) |
Household Income by Mortgage Status in Munising
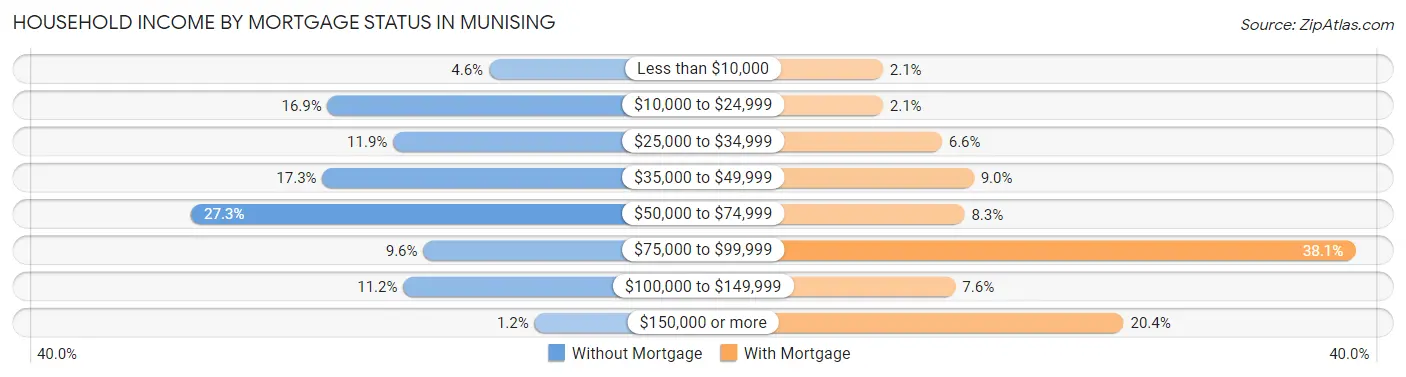
| Household Income | Without Mortgage | With Mortgage |
| Less than $10,000 | 12 (4.6%) | 6 (2.1%) |
| $10,000 to $24,999 | 44 (16.9%) | 6 (2.1%) |
| $25,000 to $34,999 | 31 (11.9%) | 19 (6.6%) |
| $35,000 to $49,999 | 45 (17.3%) | 26 (9.0%) |
| $50,000 to $74,999 | 71 (27.3%) | 24 (8.3%) |
| $75,000 to $99,999 | 25 (9.6%) | 110 (38.1%) |
| $100,000 to $149,999 | 29 (11.2%) | 22 (7.6%) |
| $150,000 or more | 3 (1.1%) | 59 (20.4%) |
| Total | 260 (100.0%) | 289 (100.0%) |
Property Value to Household Income Ratio in Munising
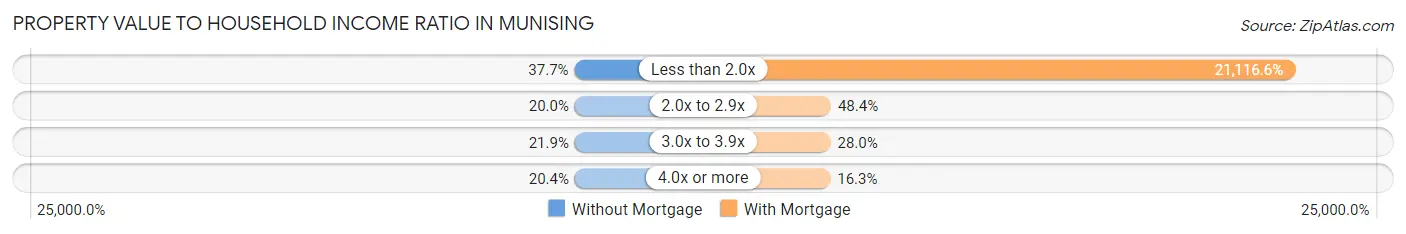
| Value-to-Income Ratio | Without Mortgage | With Mortgage |
| Less than 2.0x | 98 (37.7%) | 61,027 (21,116.6%) |
| 2.0x to 2.9x | 52 (20.0%) | 140 (48.4%) |
| 3.0x to 3.9x | 57 (21.9%) | 81 (28.0%) |
| 4.0x or more | 53 (20.4%) | 47 (16.3%) |
| Total | 260 (100.0%) | 289 (100.0%) |
Real Estate Taxes by Mortgage Status in Munising
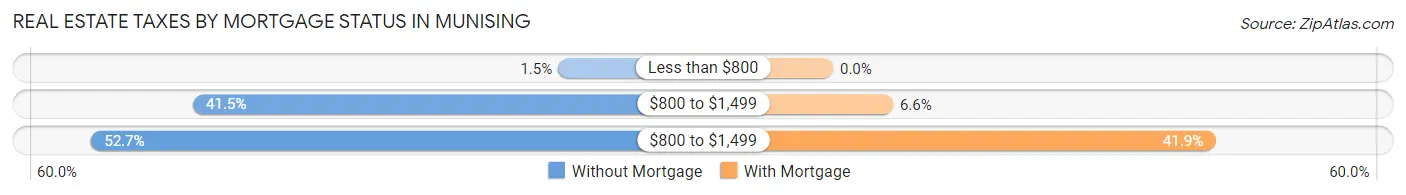
| Property Taxes | Without Mortgage | With Mortgage |
| Less than $800 | 4 (1.5%) | 0 (0.0%) |
| $800 to $1,499 | 108 (41.5%) | 19 (6.6%) |
| $800 to $1,499 | 137 (52.7%) | 121 (41.9%) |
| Total | 260 (100.0%) | 289 (100.0%) |
Health & Disability in Munising
Health Insurance Coverage by Age in Munising
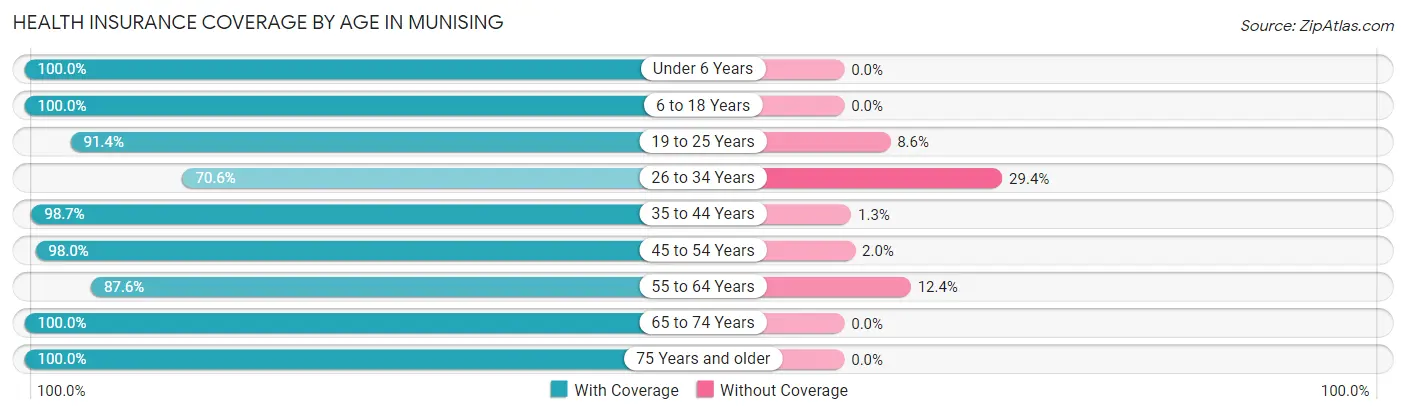
| Age Bracket | With Coverage | Without Coverage |
| Under 6 Years | 124 (100.0%) | 0 (0.0%) |
| 6 to 18 Years | 275 (100.0%) | 0 (0.0%) |
| 19 to 25 Years | 160 (91.4%) | 15 (8.6%) |
| 26 to 34 Years | 151 (70.6%) | 63 (29.4%) |
| 35 to 44 Years | 155 (98.7%) | 2 (1.3%) |
| 45 to 54 Years | 243 (98.0%) | 5 (2.0%) |
| 55 to 64 Years | 276 (87.6%) | 39 (12.4%) |
| 65 to 74 Years | 218 (100.0%) | 0 (0.0%) |
| 75 Years and older | 176 (100.0%) | 0 (0.0%) |
| Total | 1,778 (93.5%) | 124 (6.5%) |
Health Insurance Coverage by Citizenship Status in Munising
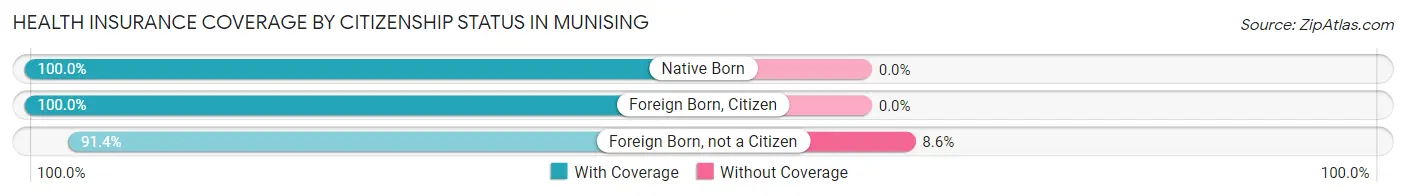
| Citizenship Status | With Coverage | Without Coverage |
| Native Born | 124 (100.0%) | 0 (0.0%) |
| Foreign Born, Citizen | 275 (100.0%) | 0 (0.0%) |
| Foreign Born, not a Citizen | 160 (91.4%) | 15 (8.6%) |
Health Insurance Coverage by Household Income in Munising
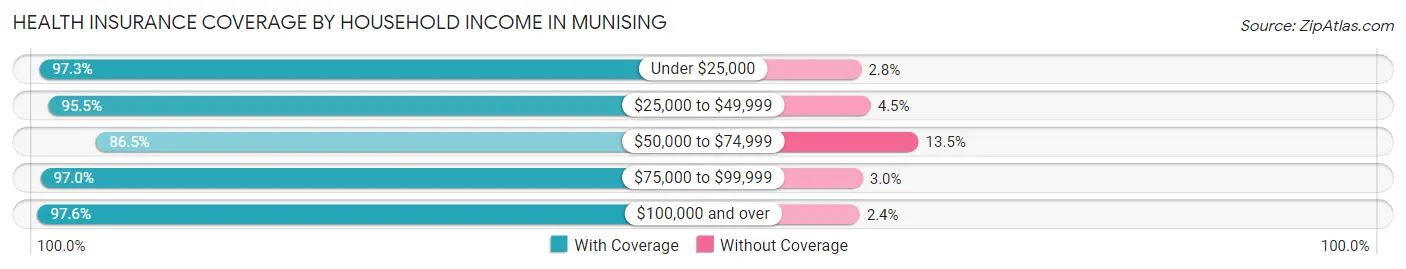
| Household Income | With Coverage | Without Coverage |
| Under $25,000 | 248 (97.3%) | 7 (2.8%) |
| $25,000 to $49,999 | 424 (95.5%) | 20 (4.5%) |
| $50,000 to $74,999 | 527 (86.5%) | 82 (13.5%) |
| $75,000 to $99,999 | 162 (97.0%) | 5 (3.0%) |
| $100,000 and over | 402 (97.6%) | 10 (2.4%) |
Public vs Private Health Insurance Coverage by Age in Munising
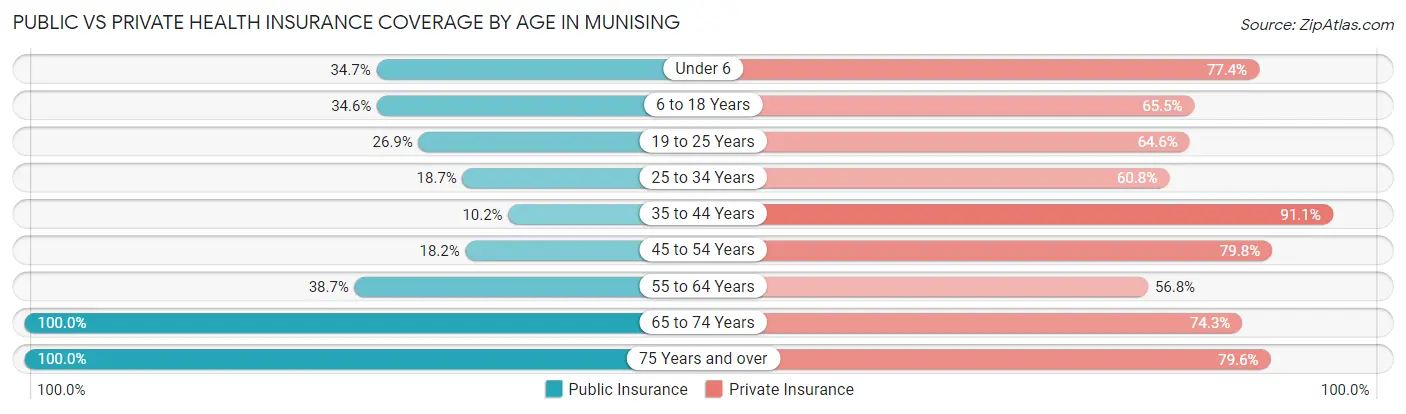
| Age Bracket | Public Insurance | Private Insurance |
| Under 6 | 43 (34.7%) | 96 (77.4%) |
| 6 to 18 Years | 95 (34.5%) | 180 (65.4%) |
| 19 to 25 Years | 47 (26.9%) | 113 (64.6%) |
| 25 to 34 Years | 40 (18.7%) | 130 (60.8%) |
| 35 to 44 Years | 16 (10.2%) | 143 (91.1%) |
| 45 to 54 Years | 45 (18.1%) | 198 (79.8%) |
| 55 to 64 Years | 122 (38.7%) | 179 (56.8%) |
| 65 to 74 Years | 218 (100.0%) | 162 (74.3%) |
| 75 Years and over | 176 (100.0%) | 140 (79.5%) |
| Total | 802 (42.2%) | 1,341 (70.5%) |
Disability Status by Sex by Age in Munising
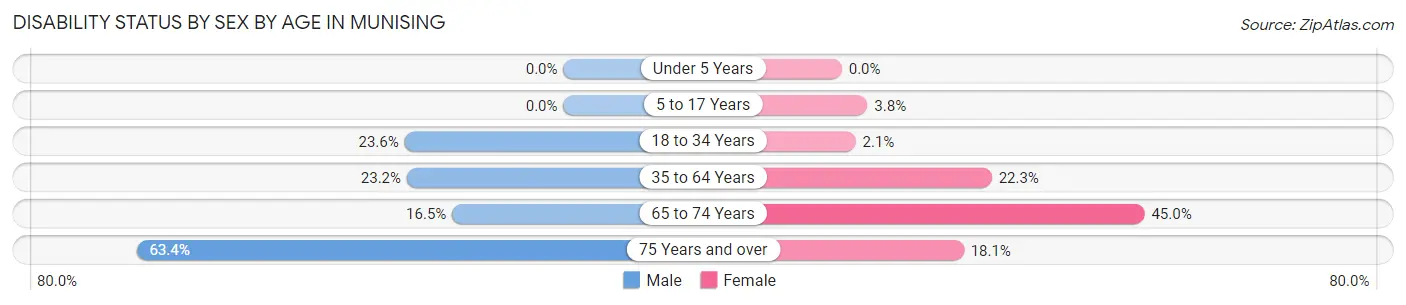
| Age Bracket | Male | Female |
| Under 5 Years | 0 (0.0%) | 0 (0.0%) |
| 5 to 17 Years | 0 (0.0%) | 6 (3.8%) |
| 18 to 34 Years | 50 (23.6%) | 4 (2.1%) |
| 35 to 64 Years | 89 (23.2%) | 75 (22.3%) |
| 65 to 74 Years | 18 (16.5%) | 49 (45.0%) |
| 75 Years and over | 45 (63.4%) | 19 (18.1%) |
Disability Class by Sex by Age in Munising
Disability Class: Hearing Difficulty
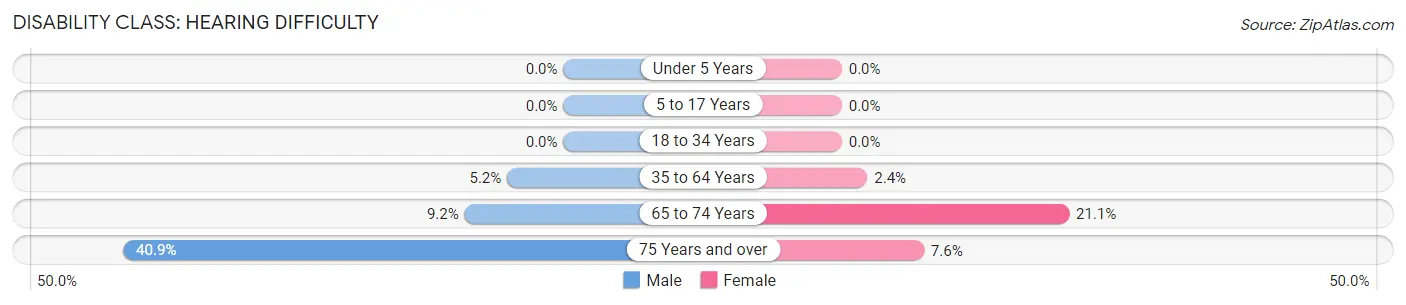
| Age Bracket | Male | Female |
| Under 5 Years | 0 (0.0%) | 0 (0.0%) |
| 5 to 17 Years | 0 (0.0%) | 0 (0.0%) |
| 18 to 34 Years | 0 (0.0%) | 0 (0.0%) |
| 35 to 64 Years | 20 (5.2%) | 8 (2.4%) |
| 65 to 74 Years | 10 (9.2%) | 23 (21.1%) |
| 75 Years and over | 29 (40.8%) | 8 (7.6%) |
Disability Class: Vision Difficulty
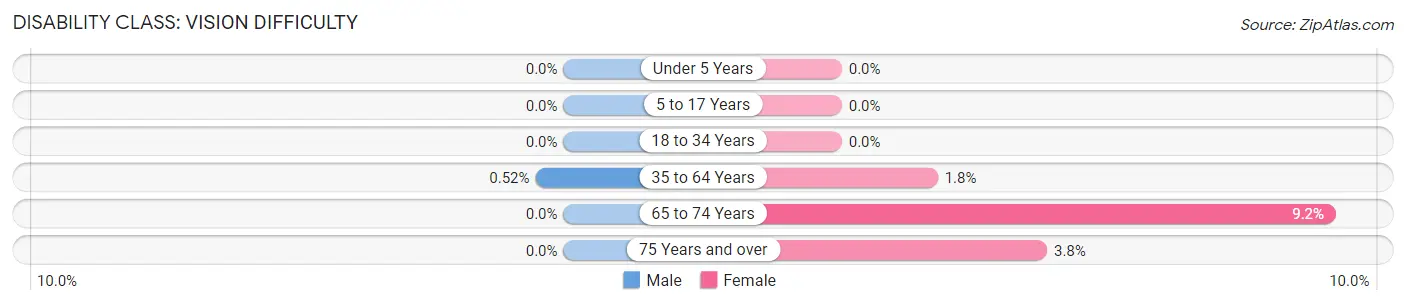
| Age Bracket | Male | Female |
| Under 5 Years | 0 (0.0%) | 0 (0.0%) |
| 5 to 17 Years | 0 (0.0%) | 0 (0.0%) |
| 18 to 34 Years | 0 (0.0%) | 0 (0.0%) |
| 35 to 64 Years | 2 (0.5%) | 6 (1.8%) |
| 65 to 74 Years | 0 (0.0%) | 10 (9.2%) |
| 75 Years and over | 0 (0.0%) | 4 (3.8%) |
Disability Class: Cognitive Difficulty
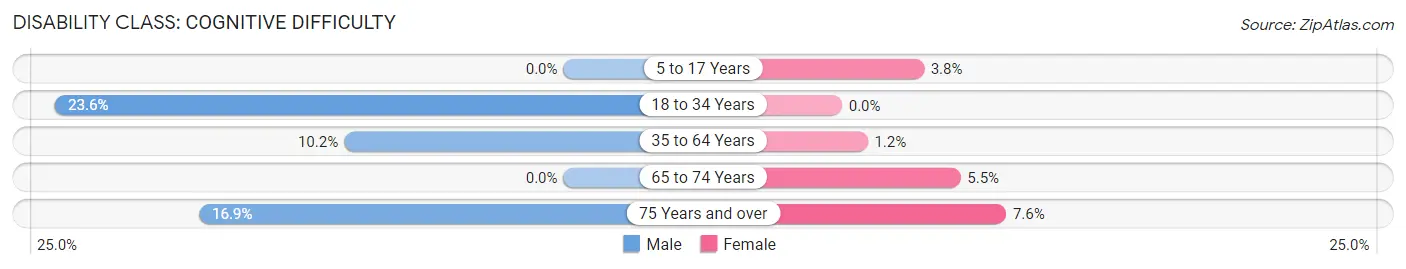
| Age Bracket | Male | Female |
| 5 to 17 Years | 0 (0.0%) | 6 (3.8%) |
| 18 to 34 Years | 50 (23.6%) | 0 (0.0%) |
| 35 to 64 Years | 39 (10.2%) | 4 (1.2%) |
| 65 to 74 Years | 0 (0.0%) | 6 (5.5%) |
| 75 Years and over | 12 (16.9%) | 8 (7.6%) |
Disability Class: Ambulatory Difficulty
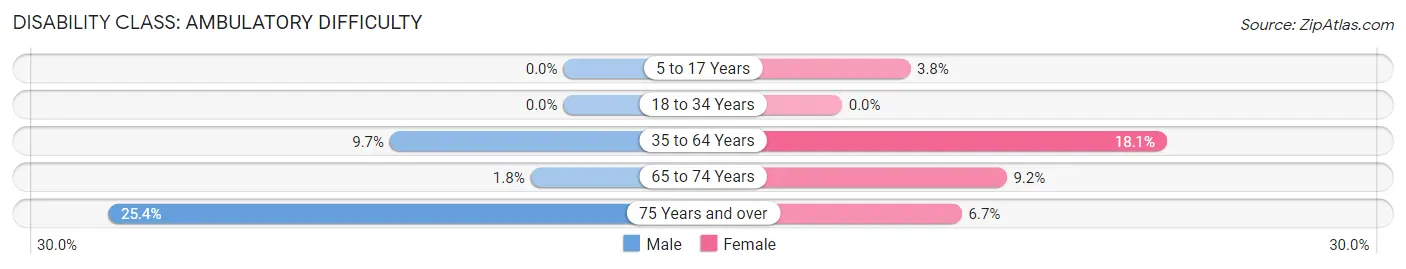
| Age Bracket | Male | Female |
| 5 to 17 Years | 0 (0.0%) | 6 (3.8%) |
| 18 to 34 Years | 0 (0.0%) | 0 (0.0%) |
| 35 to 64 Years | 37 (9.7%) | 61 (18.1%) |
| 65 to 74 Years | 2 (1.8%) | 10 (9.2%) |
| 75 Years and over | 18 (25.4%) | 7 (6.7%) |
Disability Class: Self-Care Difficulty
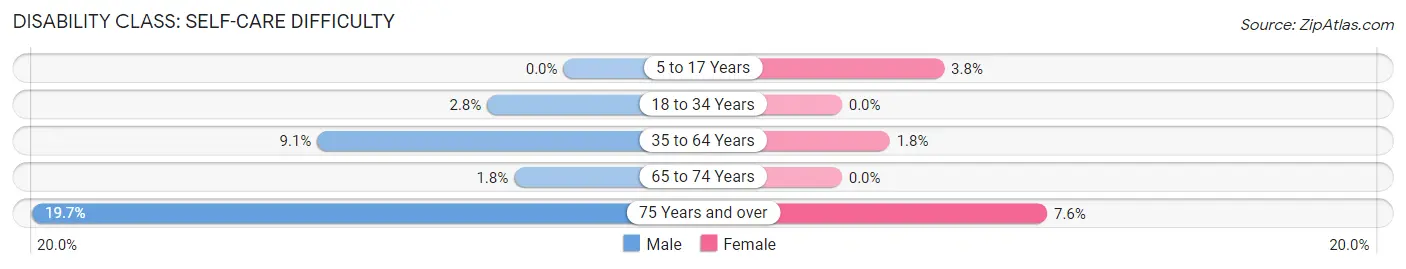
| Age Bracket | Male | Female |
| 5 to 17 Years | 0 (0.0%) | 6 (3.8%) |
| 18 to 34 Years | 6 (2.8%) | 0 (0.0%) |
| 35 to 64 Years | 35 (9.1%) | 6 (1.8%) |
| 65 to 74 Years | 2 (1.8%) | 0 (0.0%) |
| 75 Years and over | 14 (19.7%) | 8 (7.6%) |
Technology Access in Munising
Computing Device Access in Munising
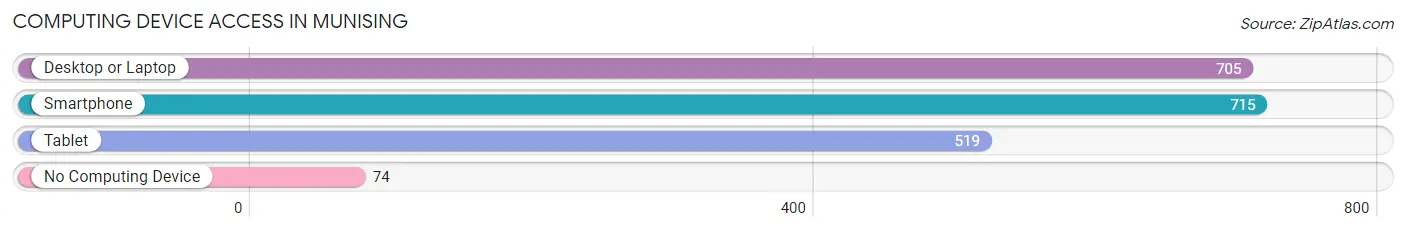
| Device Type | # Households | % Households |
| Desktop or Laptop | 705 | 77.6% |
| Smartphone | 715 | 78.7% |
| Tablet | 519 | 57.2% |
| No Computing Device | 74 | 8.2% |
| Total | 908 | 100.0% |
Internet Access in Munising
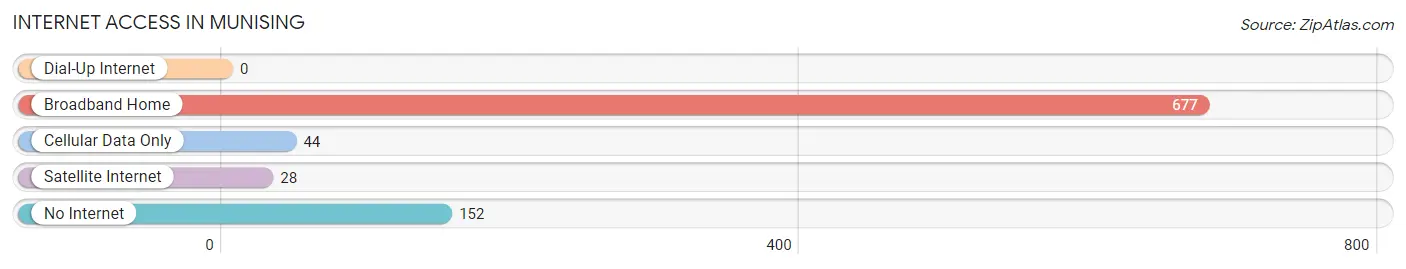
| Internet Type | # Households | % Households |
| Dial-Up Internet | 0 | 0.0% |
| Broadband Home | 677 | 74.6% |
| Cellular Data Only | 44 | 4.9% |
| Satellite Internet | 28 | 3.1% |
| No Internet | 152 | 16.7% |
| Total | 908 | 100.0% |
Munising Summary
Munising is a city located in Alger County in the Upper Peninsula of Michigan. It is situated on the southern shore of Lake Superior, and is the county seat of Alger County. The city is home to a population of 2,355 people, as of the 2010 census.
History
Munising was first settled in 1844 by French-Canadian lumberjacks, who named the area after the Ojibwe word for “island”. The city was incorporated in 1887, and was initially a lumber town. The city’s economy was largely based on the lumber industry until the early 20th century, when the industry began to decline.
In the early 1900s, the city began to focus on tourism, and the area became a popular destination for outdoor recreation. The city is home to the Pictured Rocks National Lakeshore, which was established in 1966. The lakeshore is a popular destination for camping, hiking, and sightseeing.
Geography
Munising is located on the southern shore of Lake Superior, in the Upper Peninsula of Michigan. The city is situated on the northern edge of the Pictured Rocks National Lakeshore, and is surrounded by forests and lakes. The city is located approximately 40 miles east of Marquette, and is accessible by US Highway 41.
The city has a total area of 4.2 square miles, of which 4.1 square miles is land and 0.1 square miles is water. The city is located at an elevation of 602 feet above sea level.
Economy
Munising’s economy is largely based on tourism. The city is home to the Pictured Rocks National Lakeshore, which is a popular destination for camping, hiking, and sightseeing. The city is also home to several restaurants, hotels, and other tourist attractions.
The city is also home to several manufacturing companies, including a paper mill and a wood products plant. The city is also home to several retail stores, including a grocery store, a hardware store, and a sporting goods store.
Demographics
As of the 2010 census, the city had a population of 2,355 people. The racial makeup of the city was 97.2% White, 0.3% African American, 0.7% Native American, 0.2% Asian, 0.1% Pacific Islander, 0.2% from other races, and 1.3% from two or more races. Hispanic or Latino of any race were 1.2% of the population.
The median household income in the city was $31,250, and the median family income was $37,500. The per capita income for the city was $17,845. About 17.2% of families and 20.2% of the population were below the poverty line, including 28.3% of those under age 18 and 8.3% of those age 65 or over.
Common Questions
What is Per Capita Income in Munising?
Per Capita income in Munising is $27,255.
What is the Median Family Income in Munising?
Median Family Income in Munising is $59,352.
What is the Median Household income in Munising?
Median Household Income in Munising is $50,069.
What is Income or Wage Gap in Munising?
Income or Wage Gap in Munising is 33.3%.
Women in Munising earn 66.7 cents for every dollar earned by a man.
What is Inequality or Gini Index in Munising?
Inequality or Gini Index in Munising is 0.37.
What is the Total Population of Munising?
Total Population of Munising is 2,003.
What is the Total Male Population of Munising?
Total Male Population of Munising is 968.
What is the Total Female Population of Munising?
Total Female Population of Munising is 1,035.
What is the Ratio of Males per 100 Females in Munising?
There are 93.53 Males per 100 Females in Munising.
What is the Ratio of Females per 100 Males in Munising?
There are 106.92 Females per 100 Males in Munising.
What is the Median Population Age in Munising?
Median Population Age in Munising is 47.5 Years.
What is the Average Family Size in Munising
Average Family Size in Munising is 3.0 People.
What is the Average Household Size in Munising
Average Household Size in Munising is 2.1 People.
How Large is the Labor Force in Munising?
There are 852 People in the Labor Forcein in Munising.
What is the Percentage of People in the Labor Force in Munising?
51.6% of People are in the Labor Force in Munising.
What is the Unemployment Rate in Munising?
Unemployment Rate in Munising is 4.1%.