Muir, MI Map & Demographics
Muir Map
Muir Overview
$29,146
PER CAPITA INCOME
$64,250
AVG FAMILY INCOME
$49,297
AVG HOUSEHOLD INCOME
52.1%
WAGE / INCOME GAP [ % ]
47.9¢/ $1
WAGE / INCOME GAP [ $ ]
$12,464
FAMILY INCOME DEFICIT
0.47
INEQUALITY / GINI INDEX
591
TOTAL POPULATION
271
MALE POPULATION
320
FEMALE POPULATION
84.69
MALES / 100 FEMALES
118.08
FEMALES / 100 MALES
33.0
MEDIAN AGE
3.5
AVG FAMILY SIZE
2.4
AVG HOUSEHOLD SIZE
292
LABOR FORCE [ PEOPLE ]
64.6%
PERCENT IN LABOR FORCE
9.2%
UNEMPLOYMENT RATE
Muir Zip Codes
Muir Area Codes
Income in Muir
Income Overview in Muir
Per Capita Income in Muir is $29,146, while median incomes of families and households are $64,250 and $49,297 respectively.
| Characteristic | Number | Measure |
| Per Capita Income | 591 | $29,146 |
| Median Family Income | 127 | $64,250 |
| Mean Family Income | 127 | $84,300 |
| Median Household Income | 243 | $49,297 |
| Mean Household Income | 243 | $65,082 |
| Income Deficit | 127 | $12,464 |
| Wage / Income Gap (%) | 591 | 52.10% |
| Wage / Income Gap ($) | 591 | 47.90¢ per $1 |
| Gini / Inequality Index | 591 | 0.47 |
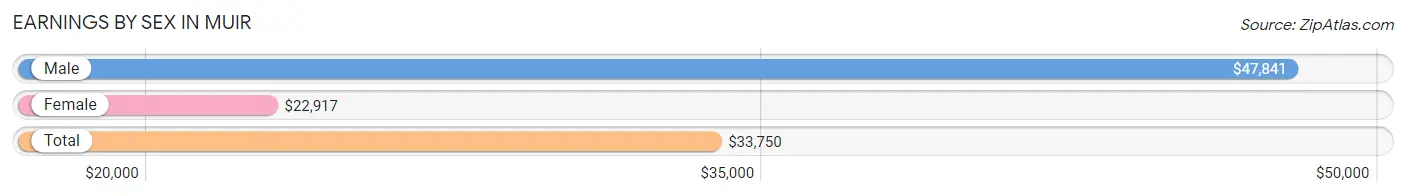
Earnings by Sex in Muir
Average Earnings in Muir are $33,750, $47,841 for men and $22,917 for women, a difference of 52.1%.
| Sex | Number | Average Earnings |
| Male | 145 (50.0%) | $47,841 |
| Female | 145 (50.0%) | $22,917 |
| Total | 290 (100.0%) | $33,750 |
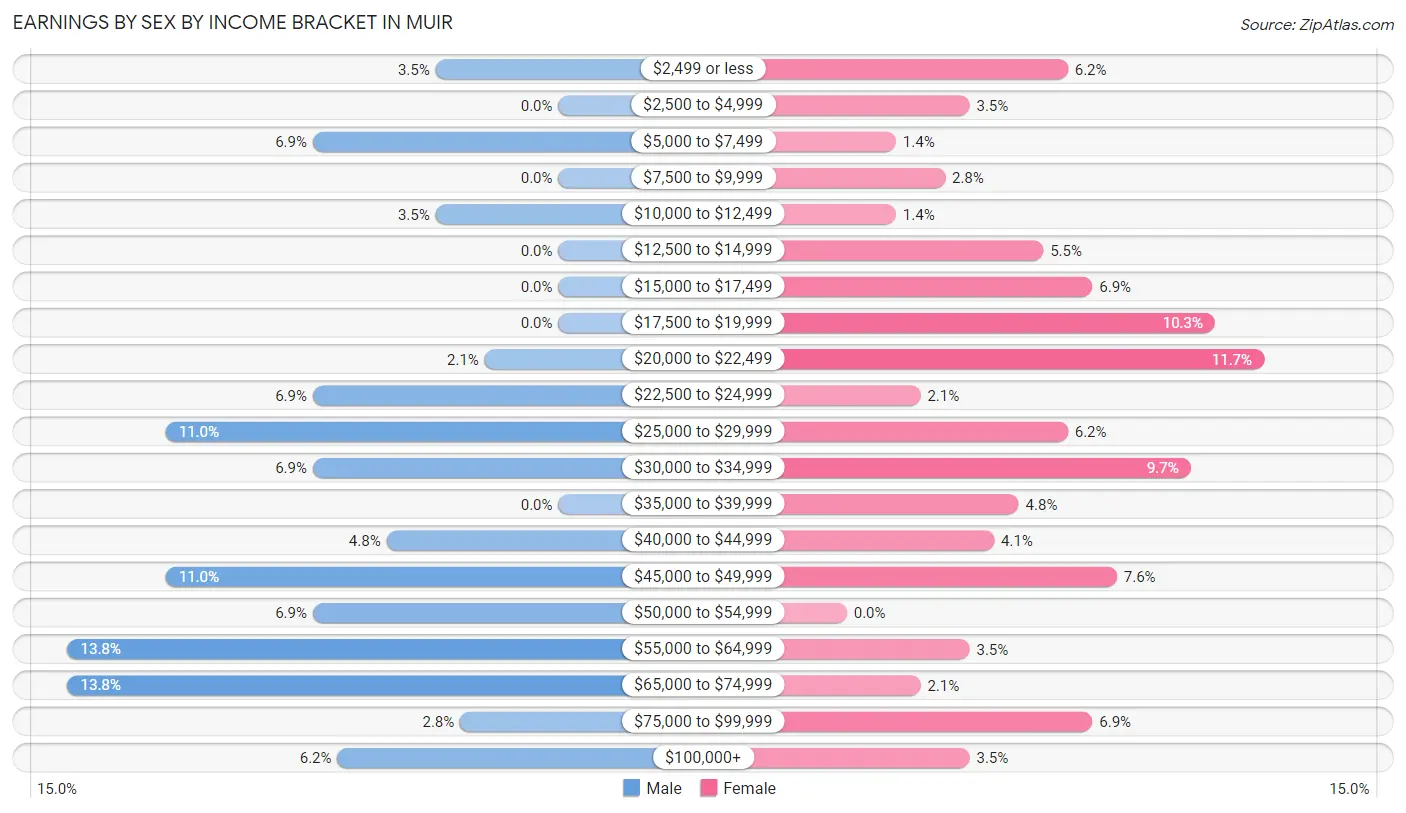
Earnings by Sex by Income Bracket in Muir
The most common earnings brackets in Muir are $55,000 to $64,999 for men (20 | 13.8%) and $20,000 to $22,499 for women (17 | 11.7%).
| Income | Male | Female |
| $2,499 or less | 5 (3.5%) | 9 (6.2%) |
| $2,500 to $4,999 | 0 (0.0%) | 5 (3.5%) |
| $5,000 to $7,499 | 10 (6.9%) | 2 (1.4%) |
| $7,500 to $9,999 | 0 (0.0%) | 4 (2.8%) |
| $10,000 to $12,499 | 5 (3.5%) | 2 (1.4%) |
| $12,500 to $14,999 | 0 (0.0%) | 8 (5.5%) |
| $15,000 to $17,499 | 0 (0.0%) | 10 (6.9%) |
| $17,500 to $19,999 | 0 (0.0%) | 15 (10.3%) |
| $20,000 to $22,499 | 3 (2.1%) | 17 (11.7%) |
| $22,500 to $24,999 | 10 (6.9%) | 3 (2.1%) |
| $25,000 to $29,999 | 16 (11.0%) | 9 (6.2%) |
| $30,000 to $34,999 | 10 (6.9%) | 14 (9.7%) |
| $35,000 to $39,999 | 0 (0.0%) | 7 (4.8%) |
| $40,000 to $44,999 | 7 (4.8%) | 6 (4.1%) |
| $45,000 to $49,999 | 16 (11.0%) | 11 (7.6%) |
| $50,000 to $54,999 | 10 (6.9%) | 0 (0.0%) |
| $55,000 to $64,999 | 20 (13.8%) | 5 (3.5%) |
| $65,000 to $74,999 | 20 (13.8%) | 3 (2.1%) |
| $75,000 to $99,999 | 4 (2.8%) | 10 (6.9%) |
| $100,000+ | 9 (6.2%) | 5 (3.5%) |
| Total | 145 (100.0%) | 145 (100.0%) |
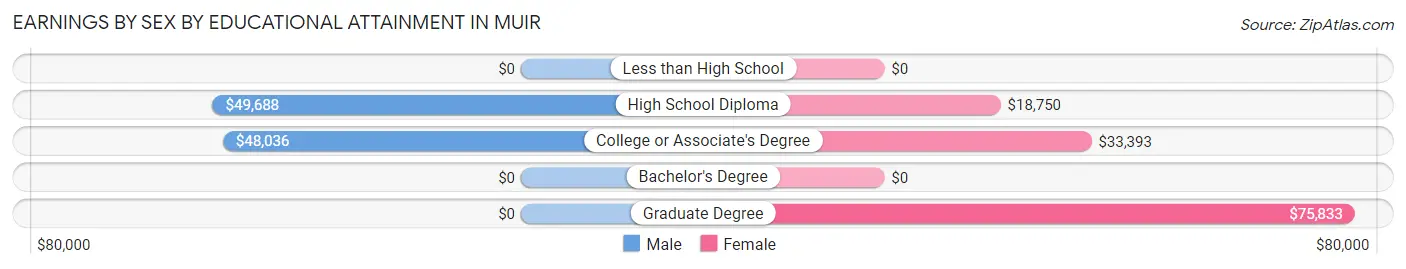
Earnings by Sex by Educational Attainment in Muir
Average earnings in Muir are $48,636 for men and $21,691 for women, a difference of 55.4%. Men with an educational attainment of high school diploma enjoy the highest average annual earnings of $49,688, while those with college or associate's degree education earn the least with $48,036. Women with an educational attainment of graduate degree earn the most with the average annual earnings of $75,833, while those with high school diploma education have the smallest earnings of $18,750.
| Educational Attainment | Male Income | Female Income |
| Less than High School | - | - |
| High School Diploma | $49,688 | $18,750 |
| College or Associate's Degree | $48,036 | $33,393 |
| Bachelor's Degree | - | - |
| Graduate Degree | - | - |
| Total | $48,636 | $21,691 |
Family Income in Muir
Family Income Brackets in Muir
According to the Muir family income data, there are 42 families falling into the $50,000 to $74,999 income range, which is the most common income bracket and makes up 33.1% of all families. Conversely, the $15,000 to $24,999 income bracket is the least frequent group with only 5 families (3.9%) belonging to this category.
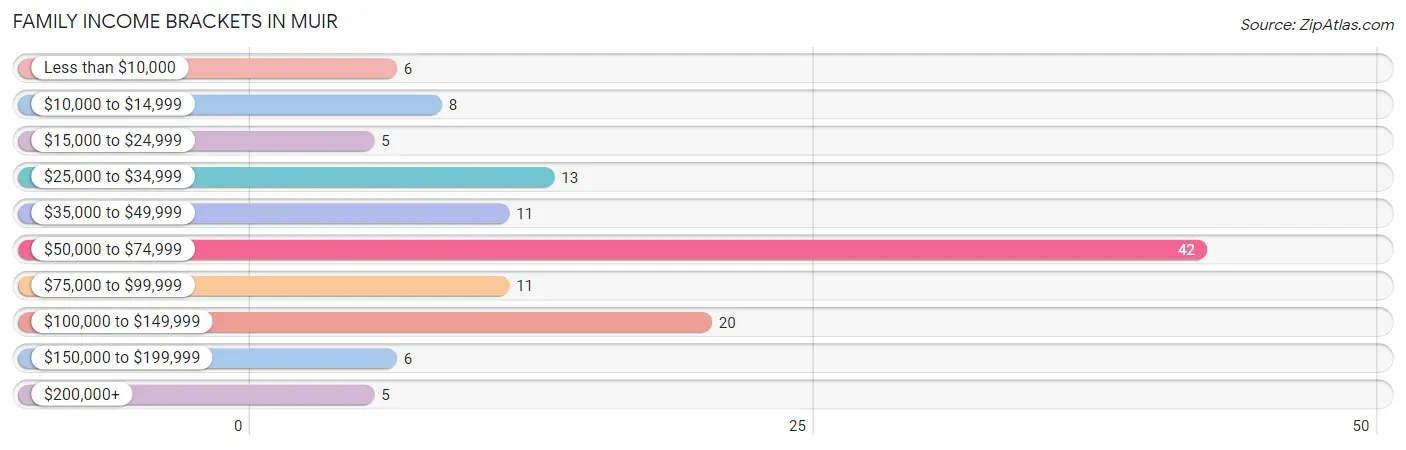
| Income Bracket | # Families | % Families |
| Less than $10,000 | 6 | 4.7% |
| $10,000 to $14,999 | 8 | 6.3% |
| $15,000 to $24,999 | 5 | 3.9% |
| $25,000 to $34,999 | 13 | 10.2% |
| $35,000 to $49,999 | 11 | 8.7% |
| $50,000 to $74,999 | 42 | 33.1% |
| $75,000 to $99,999 | 11 | 8.7% |
| $100,000 to $149,999 | 20 | 15.7% |
| $150,000 to $199,999 | 6 | 4.7% |
| $200,000+ | 5 | 3.9% |
Family Income by Famaliy Size in Muir
5-person families (11 | 8.7%) account for the highest median family income in Muir with $110,625 per family, while 2-person families (48 | 37.8%) have the highest median income of $25,416 per family member.
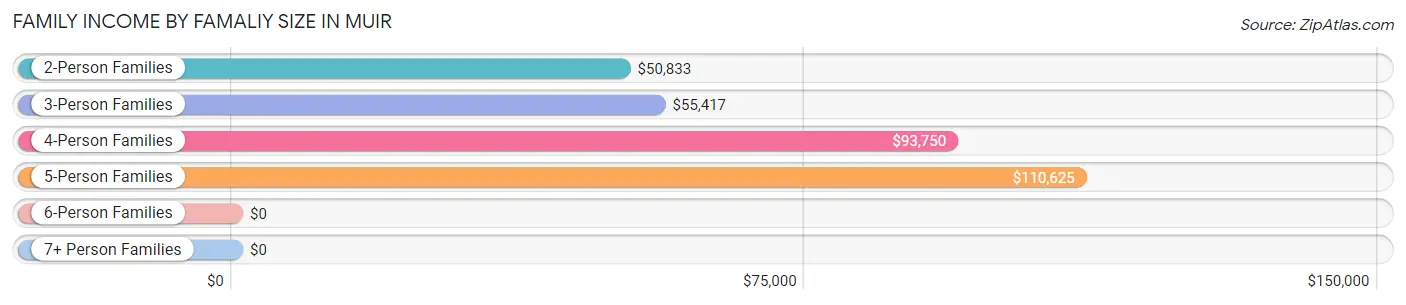
| Income Bracket | # Families | Median Income |
| 2-Person Families | 48 (37.8%) | $50,833 |
| 3-Person Families | 41 (32.3%) | $55,417 |
| 4-Person Families | 24 (18.9%) | $93,750 |
| 5-Person Families | 11 (8.7%) | $110,625 |
| 6-Person Families | 3 (2.4%) | $0 |
| 7+ Person Families | 0 (0.0%) | $0 |
| Total | 127 (100.0%) | $64,250 |
Family Income by Number of Earners in Muir
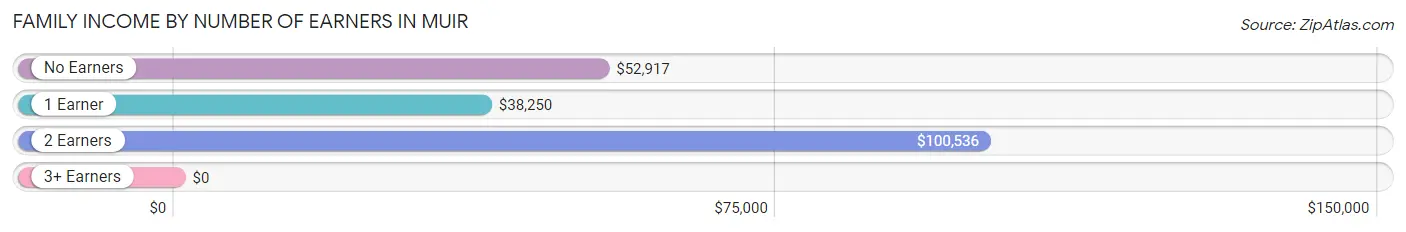
| Number of Earners | # Families | Median Income |
| No Earners | 25 (19.7%) | $52,917 |
| 1 Earner | 51 (40.2%) | $38,250 |
| 2 Earners | 49 (38.6%) | $100,536 |
| 3+ Earners | 2 (1.6%) | $0 |
| Total | 127 (100.0%) | $64,250 |
Household Income in Muir
Household Income Brackets in Muir
With 63 households falling in the category, the $50,000 to $74,999 income range is the most frequent in Muir, accounting for 25.9% of all households. In contrast, only 5 households (2.1%) fall into the $200,000+ income bracket, making it the least populous group.
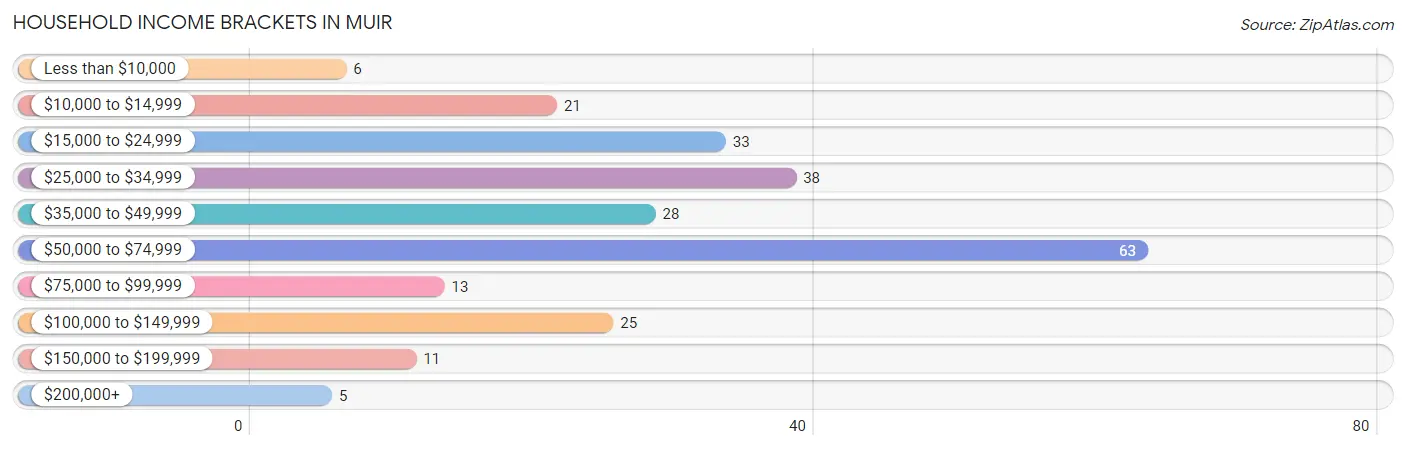
| Income Bracket | # Households | % Households |
| Less than $10,000 | 6 | 2.5% |
| $10,000 to $14,999 | 21 | 8.6% |
| $15,000 to $24,999 | 33 | 13.6% |
| $25,000 to $34,999 | 38 | 15.6% |
| $35,000 to $49,999 | 28 | 11.5% |
| $50,000 to $74,999 | 63 | 25.9% |
| $75,000 to $99,999 | 13 | 5.3% |
| $100,000 to $149,999 | 25 | 10.3% |
| $150,000 to $199,999 | 11 | 4.5% |
| $200,000+ | 5 | 2.1% |
Household Income by Householder Age in Muir
The median household income in Muir is $49,297, with the highest median household income of $52,500 found in the 25 to 44 years age bracket for the primary householder. A total of 100 households (41.1%) fall into this category. Meanwhile, the 15 to 24 years age bracket for the primary householder has the lowest median household income of $0, with 16 households (6.6%) in this group.
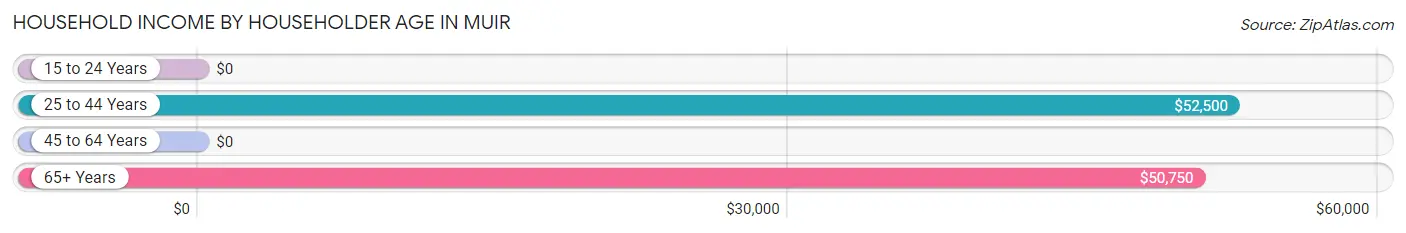
| Income Bracket | # Households | Median Income |
| 15 to 24 Years | 16 (6.6%) | $0 |
| 25 to 44 Years | 100 (41.1%) | $52,500 |
| 45 to 64 Years | 92 (37.9%) | $0 |
| 65+ Years | 35 (14.4%) | $50,750 |
| Total | 243 (100.0%) | $49,297 |
Poverty in Muir
Income Below Poverty by Sex and Age in Muir
With 7.4% poverty level for males and 11.6% for females among the residents of Muir, 6 to 11 year old males and 5 year old females are the most vulnerable to poverty, with 7 males (50.0%) and 6 females (100.0%) in their respective age groups living below the poverty level.
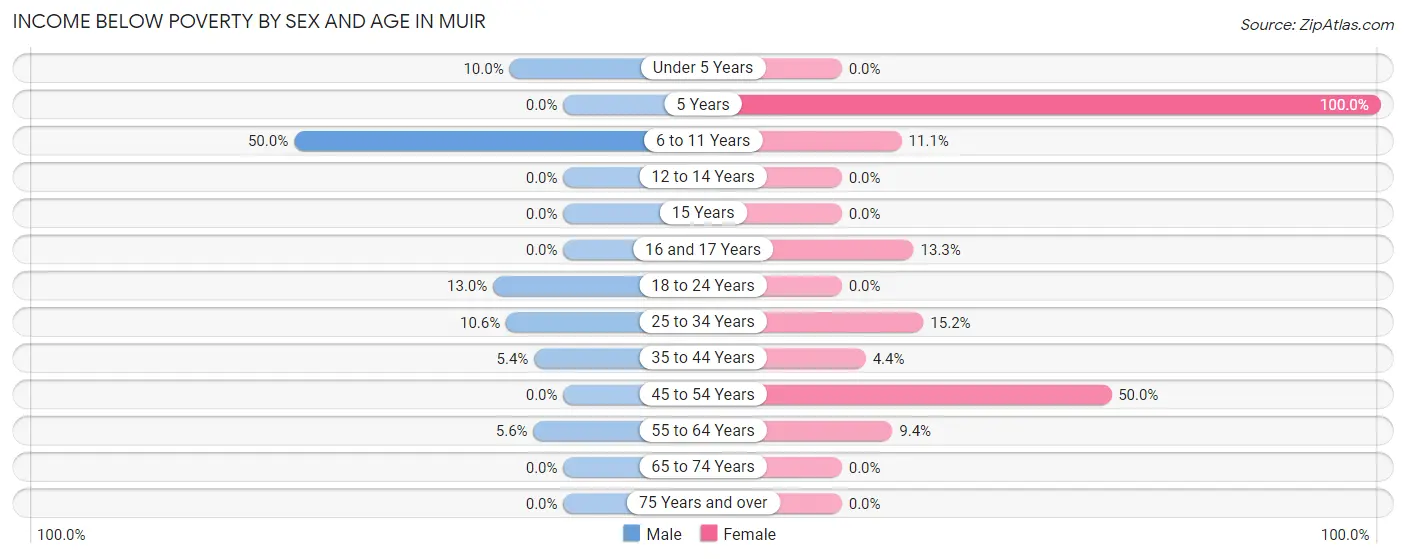
| Age Bracket | Male | Female |
| Under 5 Years | 1 (10.0%) | 0 (0.0%) |
| 5 Years | 0 (0.0%) | 6 (100.0%) |
| 6 to 11 Years | 7 (50.0%) | 6 (11.1%) |
| 12 to 14 Years | 0 (0.0%) | 0 (0.0%) |
| 15 Years | 0 (0.0%) | 0 (0.0%) |
| 16 and 17 Years | 0 (0.0%) | 2 (13.3%) |
| 18 to 24 Years | 3 (13.0%) | 0 (0.0%) |
| 25 to 34 Years | 5 (10.6%) | 10 (15.1%) |
| 35 to 44 Years | 2 (5.4%) | 2 (4.4%) |
| 45 to 54 Years | 0 (0.0%) | 8 (50.0%) |
| 55 to 64 Years | 2 (5.6%) | 3 (9.4%) |
| 65 to 74 Years | 0 (0.0%) | 0 (0.0%) |
| 75 Years and over | 0 (0.0%) | 0 (0.0%) |
| Total | 20 (7.4%) | 37 (11.6%) |
Income Above Poverty by Sex and Age in Muir
According to the poverty statistics in Muir, males aged 5 years and females aged under 5 years are the age groups that are most secure financially, with 100.0% of males and 100.0% of females in these age groups living above the poverty line.
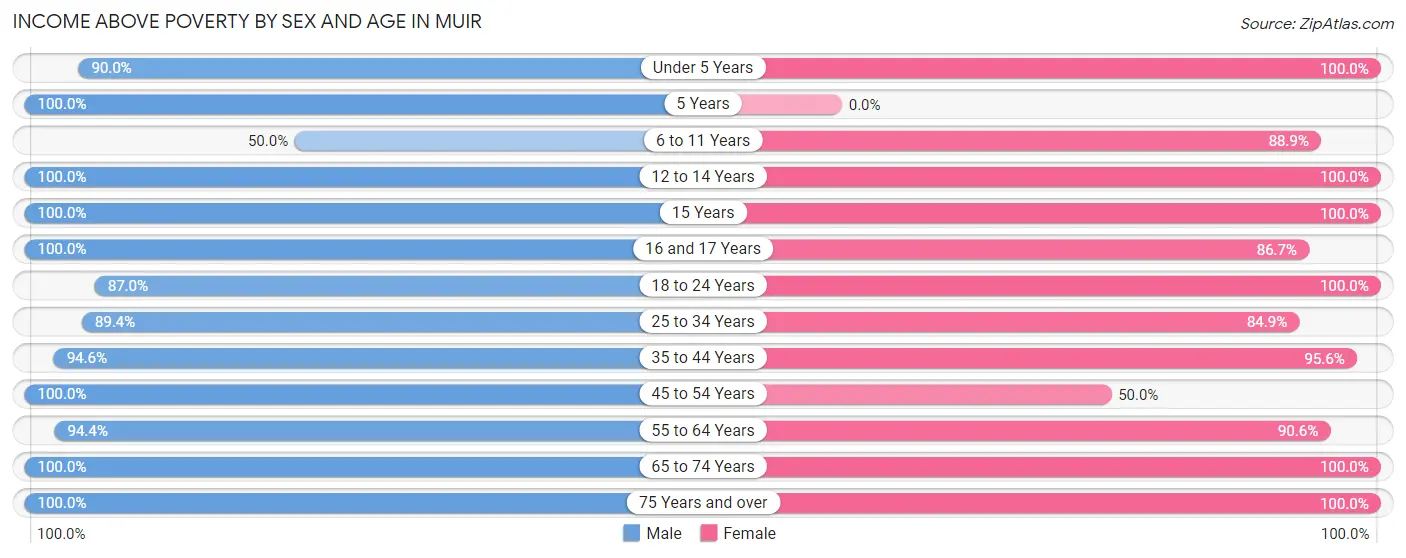
| Age Bracket | Male | Female |
| Under 5 Years | 9 (90.0%) | 9 (100.0%) |
| 5 Years | 6 (100.0%) | 0 (0.0%) |
| 6 to 11 Years | 7 (50.0%) | 48 (88.9%) |
| 12 to 14 Years | 11 (100.0%) | 3 (100.0%) |
| 15 Years | 17 (100.0%) | 9 (100.0%) |
| 16 and 17 Years | 3 (100.0%) | 13 (86.7%) |
| 18 to 24 Years | 20 (87.0%) | 27 (100.0%) |
| 25 to 34 Years | 42 (89.4%) | 56 (84.9%) |
| 35 to 44 Years | 35 (94.6%) | 43 (95.6%) |
| 45 to 54 Years | 30 (100.0%) | 8 (50.0%) |
| 55 to 64 Years | 34 (94.4%) | 29 (90.6%) |
| 65 to 74 Years | 27 (100.0%) | 24 (100.0%) |
| 75 Years and over | 10 (100.0%) | 14 (100.0%) |
| Total | 251 (92.6%) | 283 (88.4%) |
Income Below Poverty Among Married-Couple Families in Muir
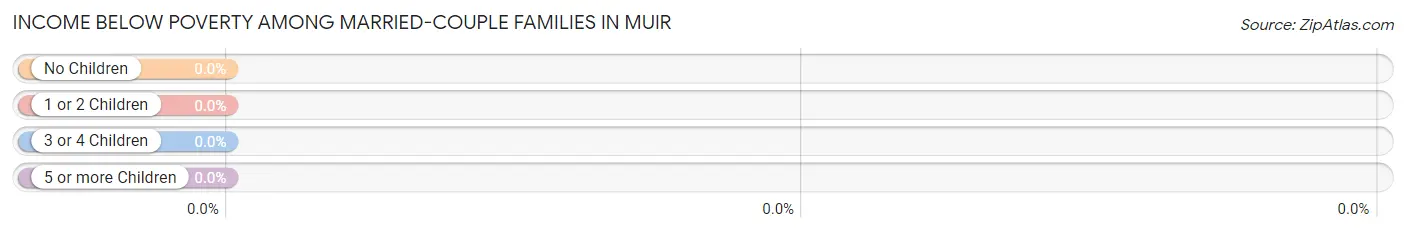
| Children | Above Poverty | Below Poverty |
| No Children | 33 (100.0%) | 0 (0.0%) |
| 1 or 2 Children | 35 (100.0%) | 0 (0.0%) |
| 3 or 4 Children | 6 (100.0%) | 0 (0.0%) |
| 5 or more Children | 0 (0.0%) | 0 (0.0%) |
| Total | 74 (100.0%) | 0 (0.0%) |
Income Below Poverty Among Single-Parent Households in Muir
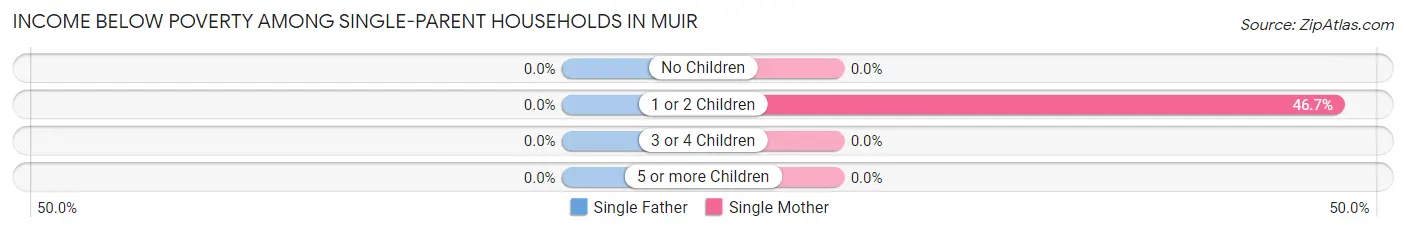
| Children | Single Father | Single Mother |
| No Children | 0 (0.0%) | 0 (0.0%) |
| 1 or 2 Children | 0 (0.0%) | 14 (46.7%) |
| 3 or 4 Children | 0 (0.0%) | 0 (0.0%) |
| 5 or more Children | 0 (0.0%) | 0 (0.0%) |
| Total | 0 (0.0%) | 14 (40.0%) |
Income Below Poverty Among Married-Couple vs Single-Parent Households in Muir
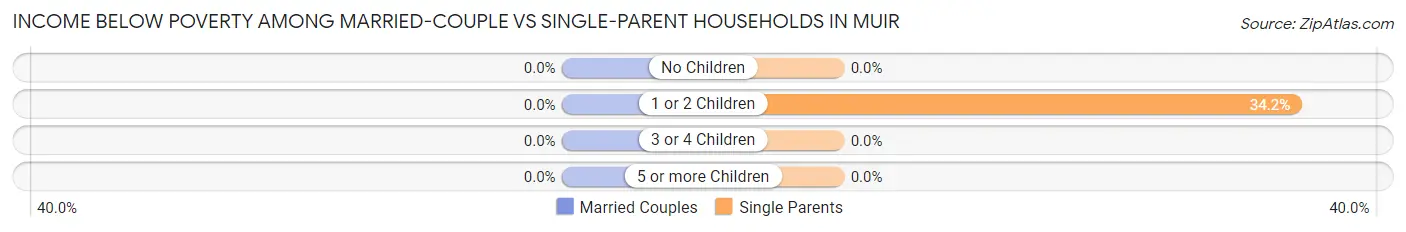
| Children | Married-Couple Families | Single-Parent Households |
| No Children | 0 (0.0%) | 0 (0.0%) |
| 1 or 2 Children | 0 (0.0%) | 14 (34.2%) |
| 3 or 4 Children | 0 (0.0%) | 0 (0.0%) |
| 5 or more Children | 0 (0.0%) | 0 (0.0%) |
| Total | 0 (0.0%) | 14 (26.4%) |
Race in Muir
The most populous races in Muir are White / Caucasian (564 | 95.4%), Hispanic or Latino (34 | 5.8%), and Two or more Races (24 | 4.1%).
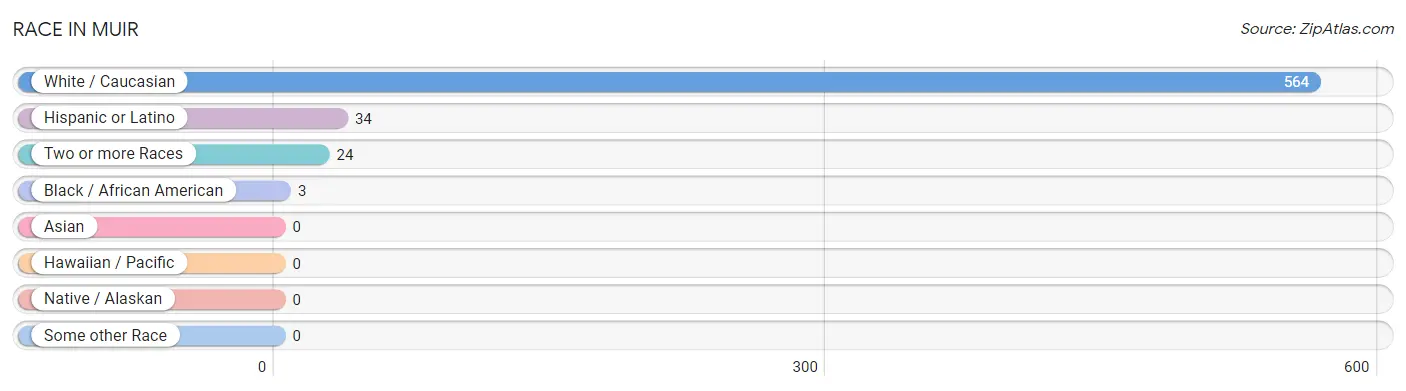
| Race | # Population | % Population |
| Asian | 0 | 0.0% |
| Black / African American | 3 | 0.5% |
| Hawaiian / Pacific | 0 | 0.0% |
| Hispanic or Latino | 34 | 5.8% |
| Native / Alaskan | 0 | 0.0% |
| White / Caucasian | 564 | 95.4% |
| Two or more Races | 24 | 4.1% |
| Some other Race | 0 | 0.0% |
| Total | 591 | 100.0% |
Ancestry in Muir
The most populous ancestries reported in Muir are German (148 | 25.0%), Irish (82 | 13.9%), English (69 | 11.7%), American (54 | 9.1%), and European (46 | 7.8%), together accounting for 67.5% of all Muir residents.
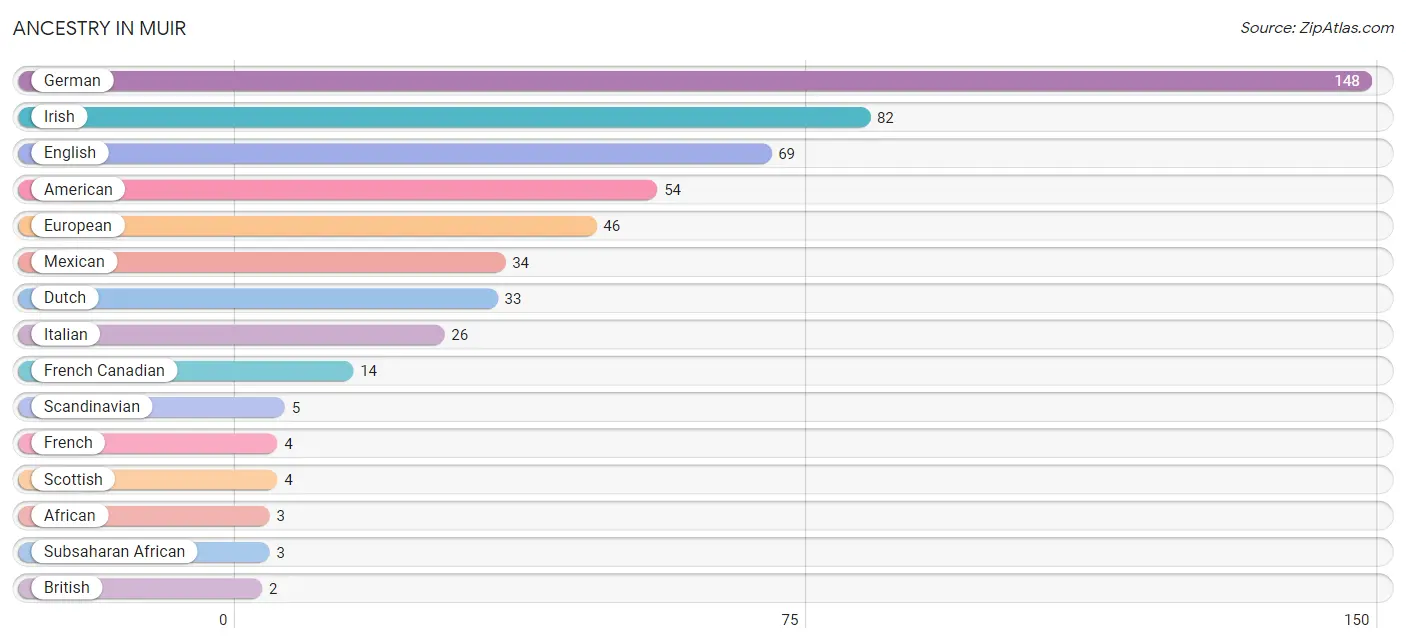
| Ancestry | # Population | % Population |
| African | 3 | 0.5% |
| American | 54 | 9.1% |
| British | 2 | 0.3% |
| Dutch | 33 | 5.6% |
| English | 69 | 11.7% |
| European | 46 | 7.8% |
| Finnish | 2 | 0.3% |
| French | 4 | 0.7% |
| French Canadian | 14 | 2.4% |
| German | 148 | 25.0% |
| Irish | 82 | 13.9% |
| Italian | 26 | 4.4% |
| Mexican | 34 | 5.8% |
| Norwegian | 2 | 0.3% |
| Portuguese | 1 | 0.2% |
| Scandinavian | 5 | 0.9% |
| Scottish | 4 | 0.7% |
| Slavic | 2 | 0.3% |
| Subsaharan African | 3 | 0.5% | View All 19 Rows |
Immigrants in Muir

| Immigration Origin | # Population | % Population | View All 0 Rows |
Sex and Age in Muir
Sex and Age in Muir
The most populous age groups in Muir are 15 to 19 Years (29 | 10.7%) for men and 5 to 9 Years (46 | 14.4%) for women.
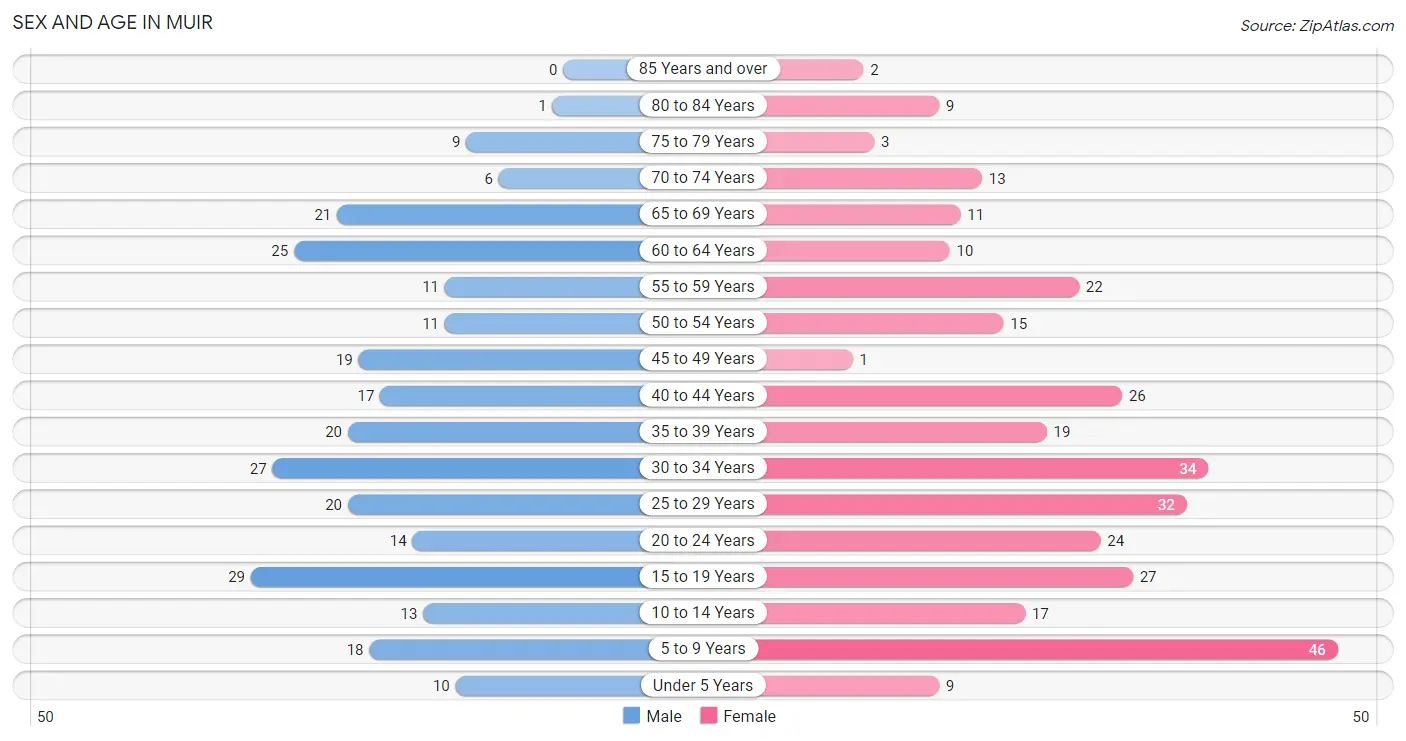
| Age Bracket | Male | Female |
| Under 5 Years | 10 (3.7%) | 9 (2.8%) |
| 5 to 9 Years | 18 (6.6%) | 46 (14.4%) |
| 10 to 14 Years | 13 (4.8%) | 17 (5.3%) |
| 15 to 19 Years | 29 (10.7%) | 27 (8.4%) |
| 20 to 24 Years | 14 (5.2%) | 24 (7.5%) |
| 25 to 29 Years | 20 (7.4%) | 32 (10.0%) |
| 30 to 34 Years | 27 (10.0%) | 34 (10.6%) |
| 35 to 39 Years | 20 (7.4%) | 19 (5.9%) |
| 40 to 44 Years | 17 (6.3%) | 26 (8.1%) |
| 45 to 49 Years | 19 (7.0%) | 1 (0.3%) |
| 50 to 54 Years | 11 (4.1%) | 15 (4.7%) |
| 55 to 59 Years | 11 (4.1%) | 22 (6.9%) |
| 60 to 64 Years | 25 (9.2%) | 10 (3.1%) |
| 65 to 69 Years | 21 (7.7%) | 11 (3.4%) |
| 70 to 74 Years | 6 (2.2%) | 13 (4.1%) |
| 75 to 79 Years | 9 (3.3%) | 3 (0.9%) |
| 80 to 84 Years | 1 (0.4%) | 9 (2.8%) |
| 85 Years and over | 0 (0.0%) | 2 (0.6%) |
| Total | 271 (100.0%) | 320 (100.0%) |
Families and Households in Muir
Median Family Size in Muir
The median family size in Muir is 3.54 persons per family, with married-couple families (74 | 58.3%) accounting for the largest median family size of 3.76 persons per family. On the other hand, single male/father families (18 | 14.2%) represent the smallest median family size with 3.00 persons per family.
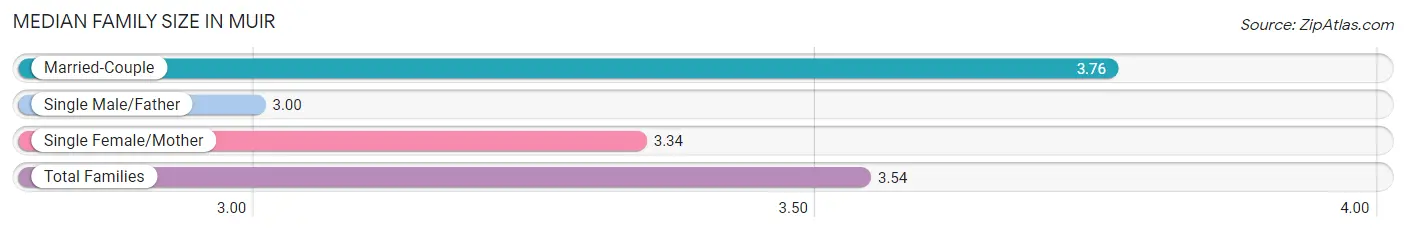
| Family Type | # Families | Family Size |
| Married-Couple | 74 (58.3%) | 3.76 |
| Single Male/Father | 18 (14.2%) | 3.00 |
| Single Female/Mother | 35 (27.6%) | 3.34 |
| Total Families | 127 (100.0%) | 3.54 |
Median Household Size in Muir
The median household size in Muir is 2.43 persons per household, with single female/mother households (35 | 14.4%) accounting for the largest median household size of 3.77 persons per household. non-family households (116 | 47.7%) represent the smallest median household size with 1.08 persons per household.
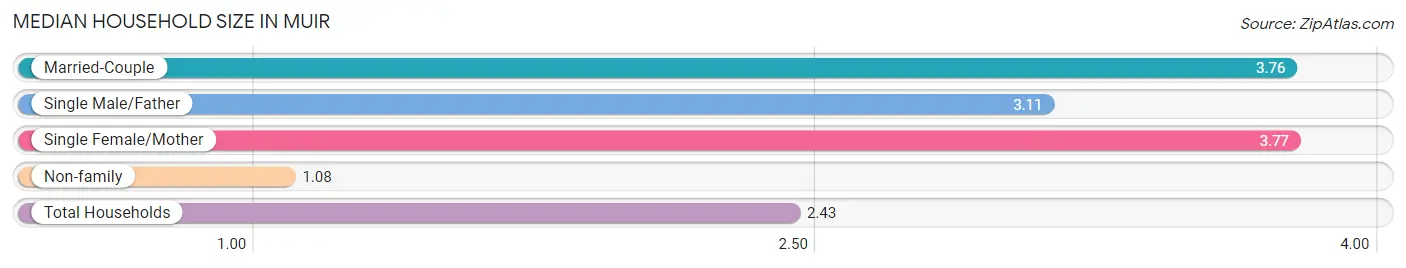
| Household Type | # Households | Household Size |
| Married-Couple | 74 (30.4%) | 3.76 |
| Single Male/Father | 18 (7.4%) | 3.11 |
| Single Female/Mother | 35 (14.4%) | 3.77 |
| Non-family | 116 (47.7%) | 1.08 |
| Total Households | 243 (100.0%) | 2.43 |
Household Size by Marriage Status in Muir
Out of a total of 243 households in Muir, 127 (52.3%) are family households, while 116 (47.7%) are nonfamily households. The most numerous type of family households are 3-person households, comprising 51, and the most common type of nonfamily households are 1-person households, comprising 110.
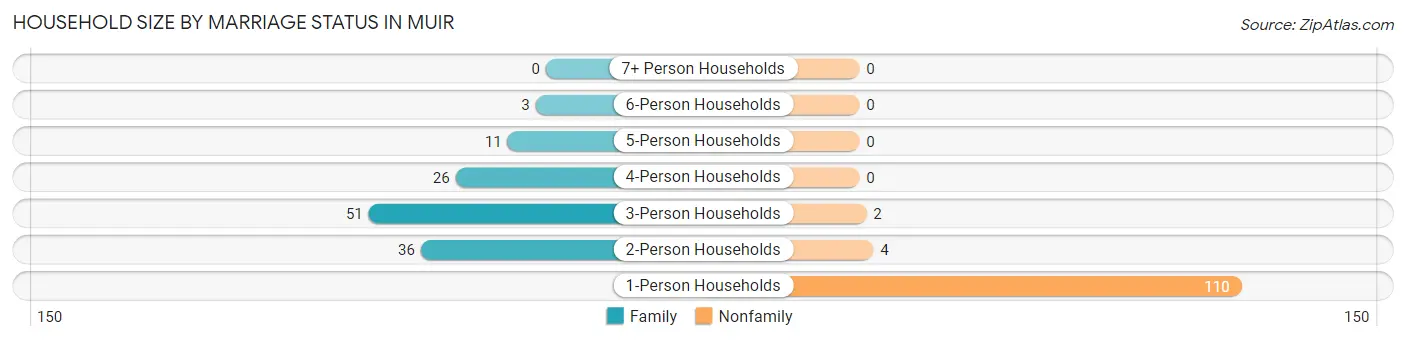
| Household Size | Family Households | Nonfamily Households |
| 1-Person Households | - | 110 (45.3%) |
| 2-Person Households | 36 (14.8%) | 4 (1.7%) |
| 3-Person Households | 51 (21.0%) | 2 (0.8%) |
| 4-Person Households | 26 (10.7%) | 0 (0.0%) |
| 5-Person Households | 11 (4.5%) | 0 (0.0%) |
| 6-Person Households | 3 (1.2%) | 0 (0.0%) |
| 7+ Person Households | 0 (0.0%) | 0 (0.0%) |
| Total | 127 (52.3%) | 116 (47.7%) |
Female Fertility in Muir
Fertility by Age in Muir
| Age Bracket | Women with Births | Births / 1,000 Women |
| 15 to 19 years | 0 (0.0%) | 0.0 |
| 20 to 34 years | 0 (0.0%) | 0.0 |
| 35 to 50 years | 0 (0.0%) | 0.0 |
| Total | 0 (0.0%) | 0.0 |
Fertility by Age by Marriage Status in Muir
| Age Bracket | Married | Unmarried |
| 15 to 19 years | 0 (0.0%) | 0 (0.0%) |
| 20 to 34 years | 0 (0.0%) | 0 (0.0%) |
| 35 to 50 years | 0 (0.0%) | 0 (0.0%) |
| Total | 0 (0.0%) | 0 (0.0%) |
Fertility by Education in Muir
| Educational Attainment | Women with Births | Births / 1,000 Women |
| Less than High School | 0 (0.0%) | 0.0 |
| High School Diploma | 0 (0.0%) | 0.0 |
| College or Associate's Degree | 0 (0.0%) | 0.0 |
| Bachelor's Degree | 0 (0.0%) | 0.0 |
| Graduate Degree | 0 (0.0%) | 0.0 |
| Total | 0 (0.0%) | 0.0 |
Fertility by Education by Marriage Status in Muir
| Educational Attainment | Married | Unmarried |
| Less than High School | 0 (0.0%) | 0 (0.0%) |
| High School Diploma | 0 (0.0%) | 0 (0.0%) |
| College or Associate's Degree | 0 (0.0%) | 0 (0.0%) |
| Bachelor's Degree | 0 (0.0%) | 0 (0.0%) |
| Graduate Degree | 0 (0.0%) | 0 (0.0%) |
| Total | 0 (0.0%) | 0 (0.0%) |
Employment Characteristics in Muir
Employment by Class of Employer in Muir
Among the 256 employed individuals in Muir, private company employees (212 | 82.8%), local government employees (11 | 4.3%), and self-employed (incorporated) (10 | 3.9%) make up the most common classes of employment.
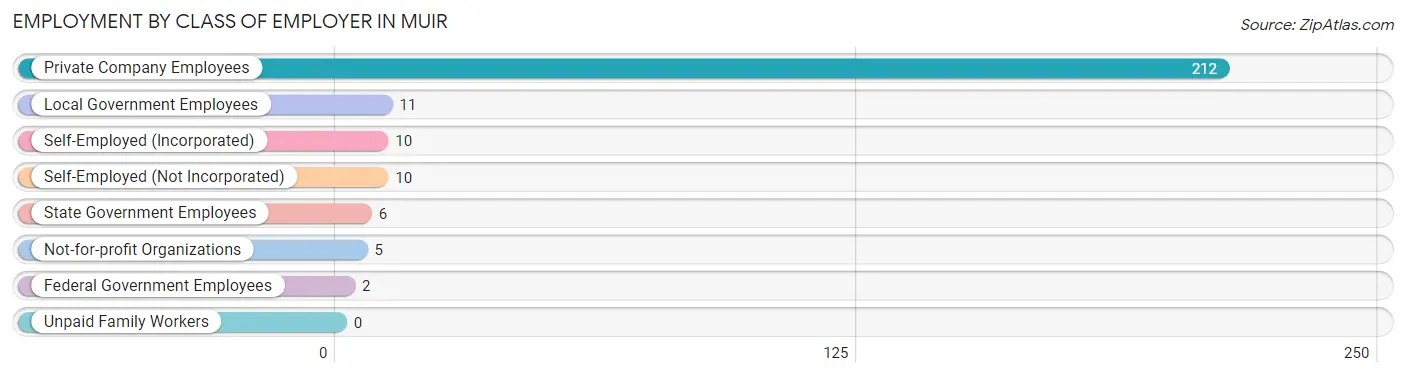
| Employer Class | # Employees | % Employees |
| Private Company Employees | 212 | 82.8% |
| Self-Employed (Incorporated) | 10 | 3.9% |
| Self-Employed (Not Incorporated) | 10 | 3.9% |
| Not-for-profit Organizations | 5 | 1.9% |
| Local Government Employees | 11 | 4.3% |
| State Government Employees | 6 | 2.3% |
| Federal Government Employees | 2 | 0.8% |
| Unpaid Family Workers | 0 | 0.0% |
| Total | 256 | 100.0% |
Employment Status by Age in Muir
According to the labor force statistics for Muir, out of the total population over 16 years of age (452), 64.6% or 292 individuals are in the labor force, with 9.2% or 27 of them unemployed. The age group with the highest labor force participation rate is 55 to 59 years, with 100.0% or 33 individuals in the labor force. Within the labor force, the 65 to 74 years age range has the highest percentage of unemployed individuals, with 100.0% or 1 of them being unemployed.
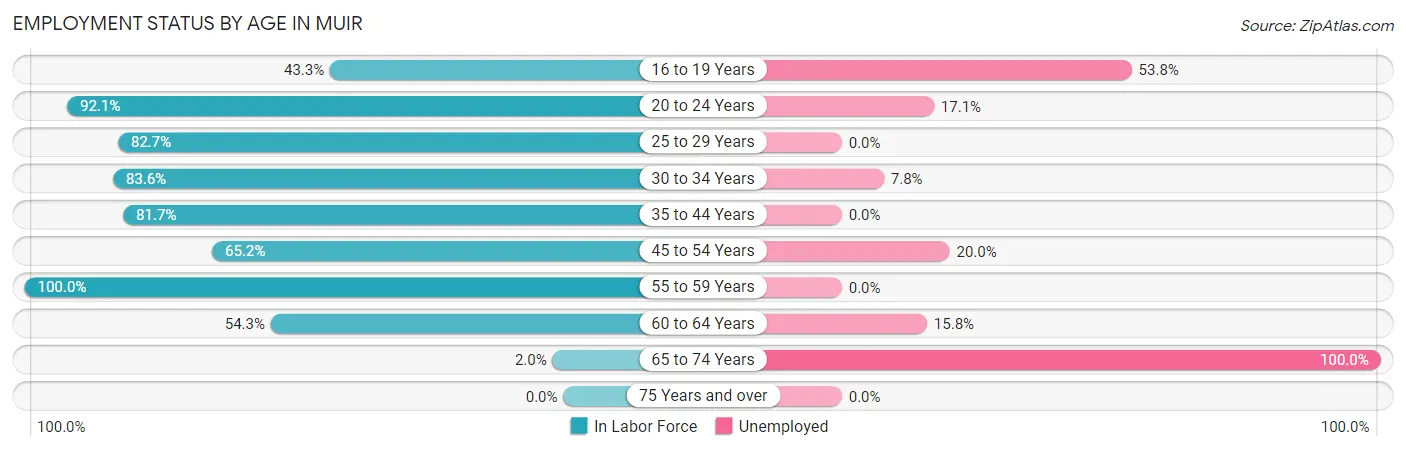
| Age Bracket | In Labor Force | Unemployed |
| 16 to 19 Years | 13 (43.3%) | 7 (53.8%) |
| 20 to 24 Years | 35 (92.1%) | 6 (17.1%) |
| 25 to 29 Years | 43 (82.7%) | 0 (0.0%) |
| 30 to 34 Years | 51 (83.6%) | 4 (7.8%) |
| 35 to 44 Years | 67 (81.7%) | 0 (0.0%) |
| 45 to 54 Years | 30 (65.2%) | 6 (20.0%) |
| 55 to 59 Years | 33 (100.0%) | 0 (0.0%) |
| 60 to 64 Years | 19 (54.3%) | 3 (15.8%) |
| 65 to 74 Years | 1 (2.0%) | 1 (100.0%) |
| 75 Years and over | 0 (0.0%) | 0 (0.0%) |
| Total | 292 (64.6%) | 27 (9.2%) |
Employment Status by Educational Attainment in Muir
According to labor force statistics for Muir, 78.6% of individuals (243) out of the total population between 25 and 64 years of age (309) are in the labor force, with 5.3% or 13 of them being unemployed. The group with the highest labor force participation rate are those with the educational attainment of bachelor's degree or higher, with 94.4% or 17 individuals in the labor force. Within the labor force, individuals with less than high school education have the highest percentage of unemployment, with 16.7% or 4 of them being unemployed.
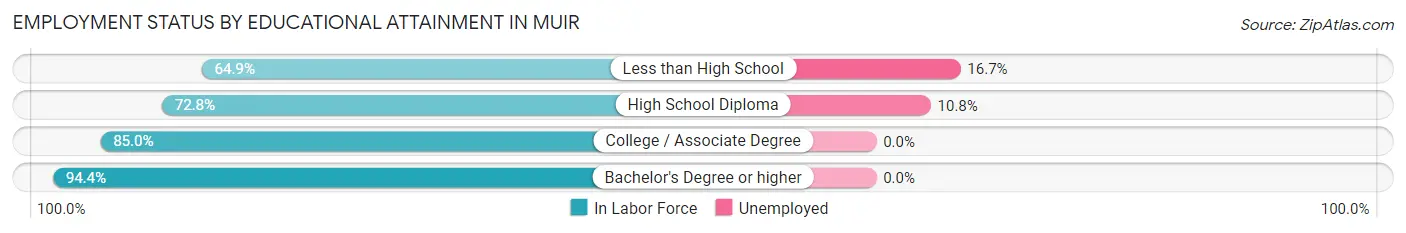
| Educational Attainment | In Labor Force | Unemployed |
| Less than High School | 24 (64.9%) | 6 (16.7%) |
| High School Diploma | 83 (72.8%) | 12 (10.8%) |
| College / Associate Degree | 119 (85.0%) | 0 (0.0%) |
| Bachelor's Degree or higher | 17 (94.4%) | 0 (0.0%) |
| Total | 243 (78.6%) | 16 (5.3%) |
Employment Occupations by Sex in Muir
Management, Business, Science and Arts Occupations
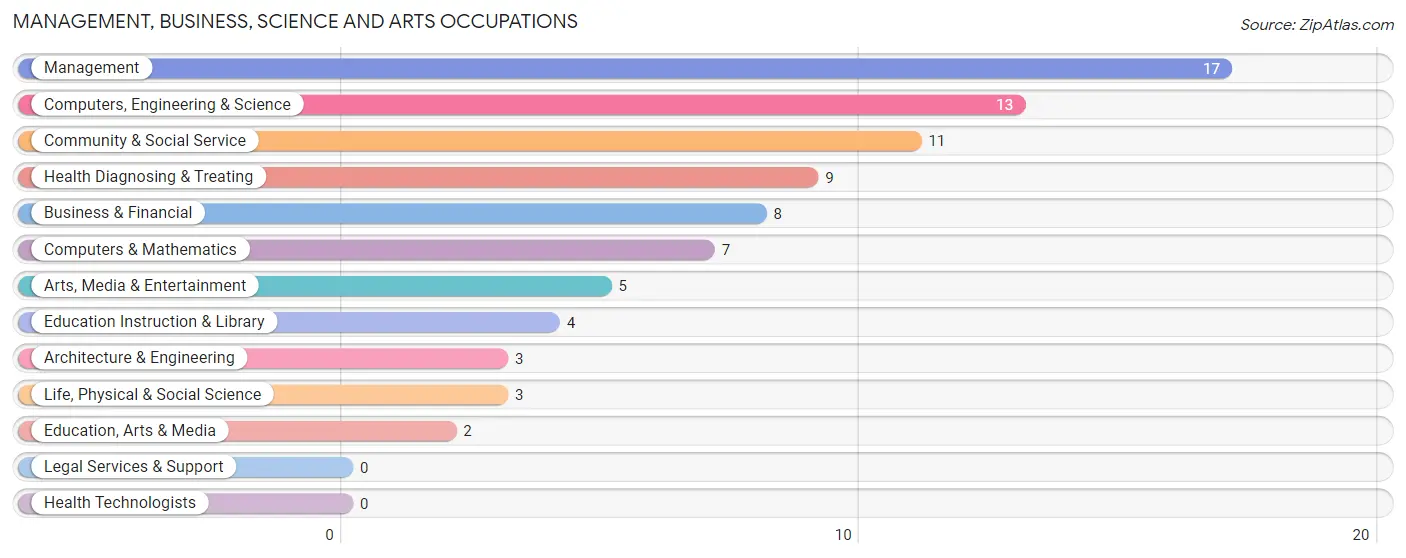
The most common Management, Business, Science and Arts occupations in Muir are Management (17 | 6.4%), Computers, Engineering & Science (13 | 4.9%), Community & Social Service (11 | 4.2%), Health Diagnosing & Treating (9 | 3.4%), and Business & Financial (8 | 3.0%).
Management, Business, Science and Arts Occupations by Sex
Within the Management, Business, Science and Arts occupations in Muir, the most male-oriented occupations are Architecture & Engineering (100.0%), Computers & Mathematics (85.7%), and Computers, Engineering & Science (69.2%), while the most female-oriented occupations are Life, Physical & Social Science (100.0%), Community & Social Service (100.0%), and Education, Arts & Media (100.0%).
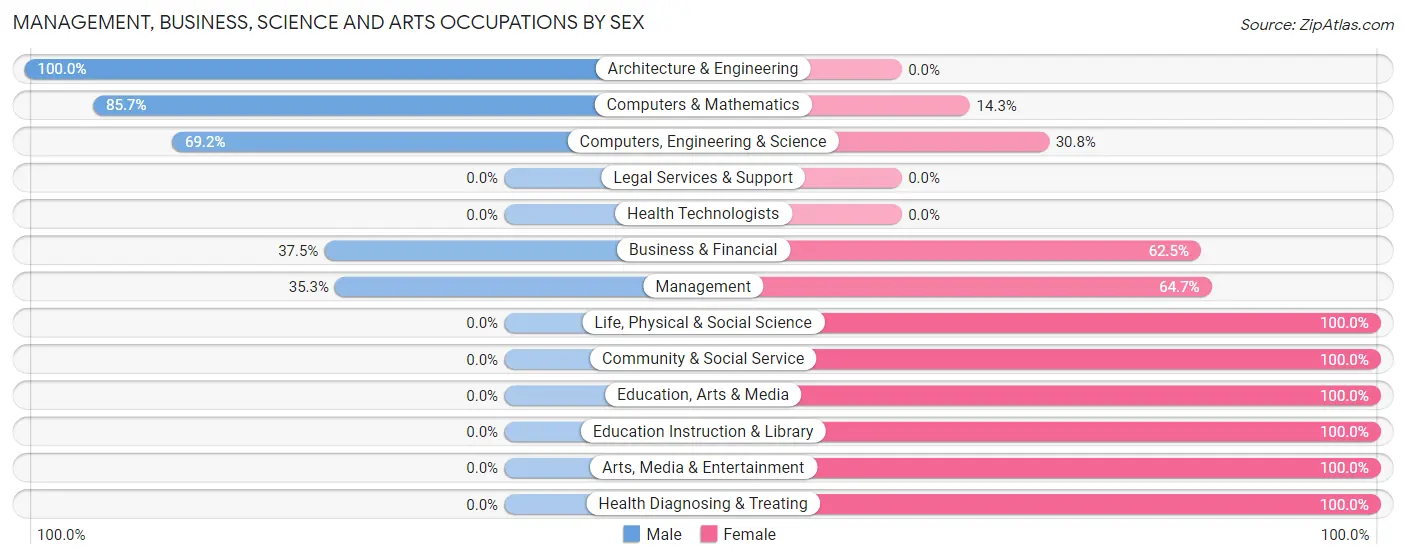
| Occupation | Male | Female |
| Management | 6 (35.3%) | 11 (64.7%) |
| Business & Financial | 3 (37.5%) | 5 (62.5%) |
| Computers, Engineering & Science | 9 (69.2%) | 4 (30.8%) |
| Computers & Mathematics | 6 (85.7%) | 1 (14.3%) |
| Architecture & Engineering | 3 (100.0%) | 0 (0.0%) |
| Life, Physical & Social Science | 0 (0.0%) | 3 (100.0%) |
| Community & Social Service | 0 (0.0%) | 11 (100.0%) |
| Education, Arts & Media | 0 (0.0%) | 2 (100.0%) |
| Legal Services & Support | 0 (0.0%) | 0 (0.0%) |
| Education Instruction & Library | 0 (0.0%) | 4 (100.0%) |
| Arts, Media & Entertainment | 0 (0.0%) | 5 (100.0%) |
| Health Diagnosing & Treating | 0 (0.0%) | 9 (100.0%) |
| Health Technologists | 0 (0.0%) | 0 (0.0%) |
| Total (Category) | 18 (31.0%) | 40 (69.0%) |
| Total (Overall) | 123 (46.4%) | 142 (53.6%) |
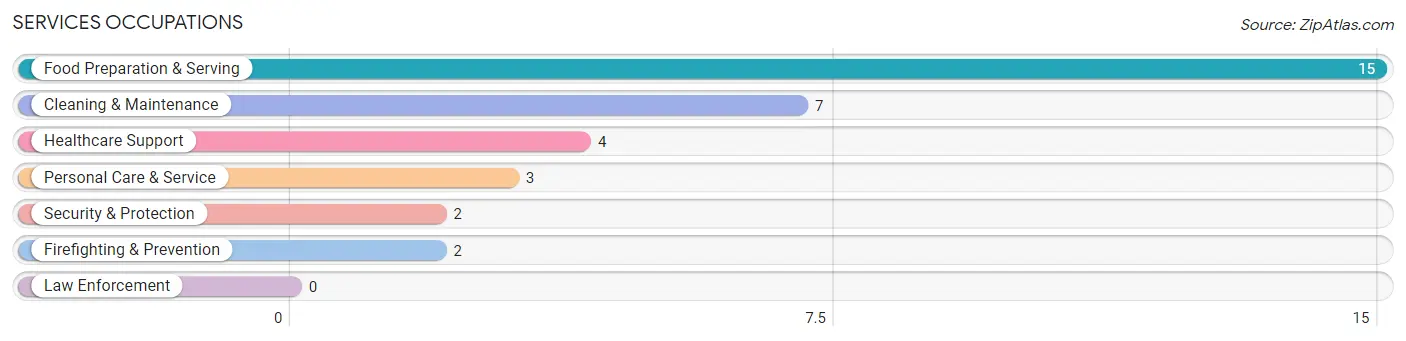
Services Occupations
The most common Services occupations in Muir are Food Preparation & Serving (15 | 5.7%), Cleaning & Maintenance (7 | 2.6%), Healthcare Support (4 | 1.5%), Personal Care & Service (3 | 1.1%), and Security & Protection (2 | 0.7%).
Services Occupations by Sex
Within the Services occupations in Muir, the most male-oriented occupations are Security & Protection (100.0%), Firefighting & Prevention (100.0%), and Cleaning & Maintenance (42.9%), while the most female-oriented occupations are Healthcare Support (100.0%), Personal Care & Service (100.0%), and Food Preparation & Serving (86.7%).
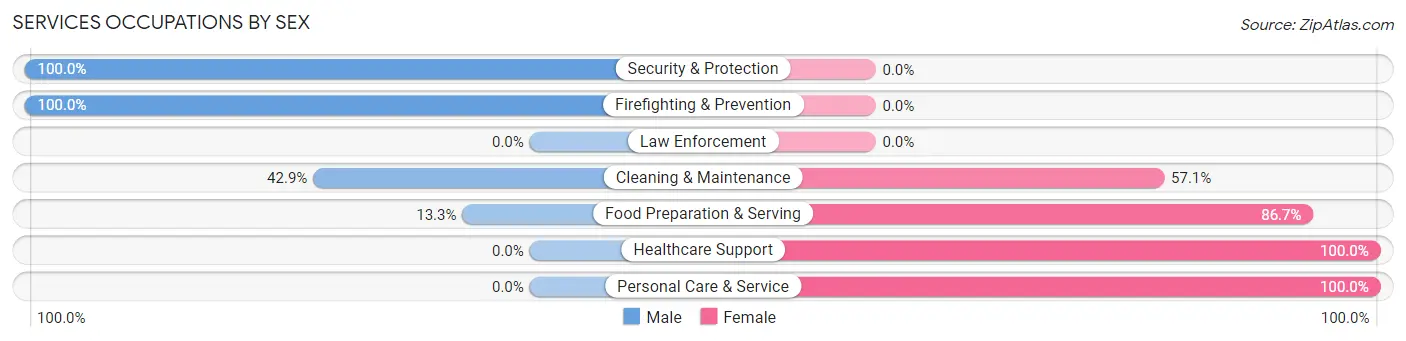
| Occupation | Male | Female |
| Healthcare Support | 0 (0.0%) | 4 (100.0%) |
| Security & Protection | 2 (100.0%) | 0 (0.0%) |
| Firefighting & Prevention | 2 (100.0%) | 0 (0.0%) |
| Law Enforcement | 0 (0.0%) | 0 (0.0%) |
| Food Preparation & Serving | 2 (13.3%) | 13 (86.7%) |
| Cleaning & Maintenance | 3 (42.9%) | 4 (57.1%) |
| Personal Care & Service | 0 (0.0%) | 3 (100.0%) |
| Total (Category) | 7 (22.6%) | 24 (77.4%) |
| Total (Overall) | 123 (46.4%) | 142 (53.6%) |
Sales and Office Occupations
The most common Sales and Office occupations in Muir are Sales & Related (43 | 16.2%), and Office & Administration (42 | 15.9%).

Sales and Office Occupations by Sex

| Occupation | Male | Female |
| Sales & Related | 15 (34.9%) | 28 (65.1%) |
| Office & Administration | 7 (16.7%) | 35 (83.3%) |
| Total (Category) | 22 (25.9%) | 63 (74.1%) |
| Total (Overall) | 123 (46.4%) | 142 (53.6%) |
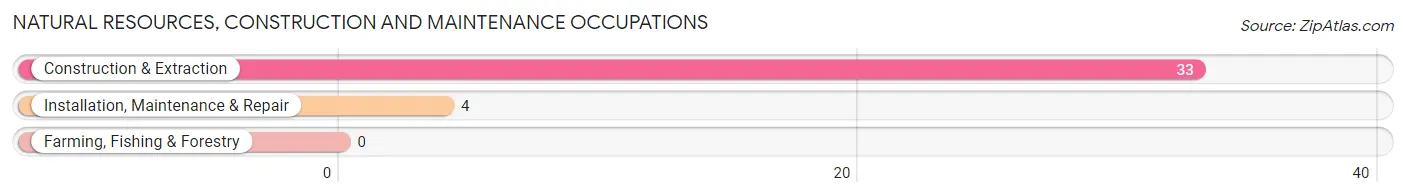
Natural Resources, Construction and Maintenance Occupations
The most common Natural Resources, Construction and Maintenance occupations in Muir are Construction & Extraction (33 | 12.4%), and Installation, Maintenance & Repair (4 | 1.5%).
Natural Resources, Construction and Maintenance Occupations by Sex

| Occupation | Male | Female |
| Farming, Fishing & Forestry | 0 (0.0%) | 0 (0.0%) |
| Construction & Extraction | 33 (100.0%) | 0 (0.0%) |
| Installation, Maintenance & Repair | 4 (100.0%) | 0 (0.0%) |
| Total (Category) | 37 (100.0%) | 0 (0.0%) |
| Total (Overall) | 123 (46.4%) | 142 (53.6%) |
Production, Transportation and Moving Occupations
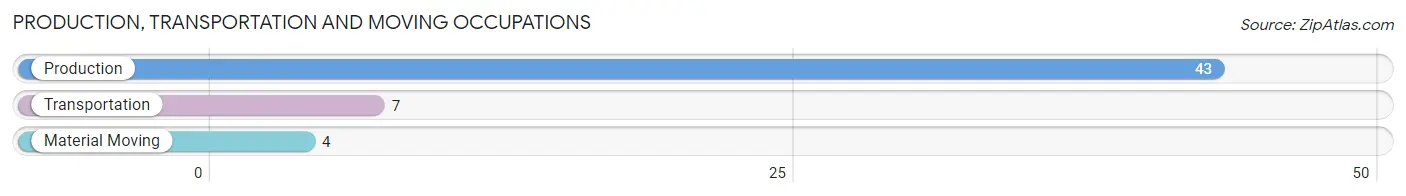
The most common Production, Transportation and Moving occupations in Muir are Production (43 | 16.2%), Transportation (7 | 2.6%), and Material Moving (4 | 1.5%).
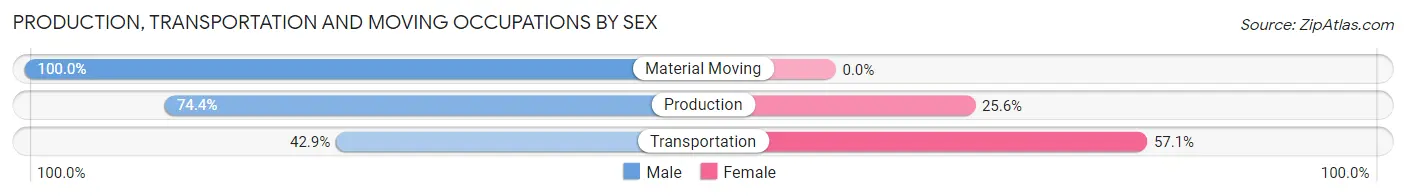
Production, Transportation and Moving Occupations by Sex
| Occupation | Male | Female |
| Production | 32 (74.4%) | 11 (25.6%) |
| Transportation | 3 (42.9%) | 4 (57.1%) |
| Material Moving | 4 (100.0%) | 0 (0.0%) |
| Total (Category) | 39 (72.2%) | 15 (27.8%) |
| Total (Overall) | 123 (46.4%) | 142 (53.6%) |
Employment Industries by Sex in Muir
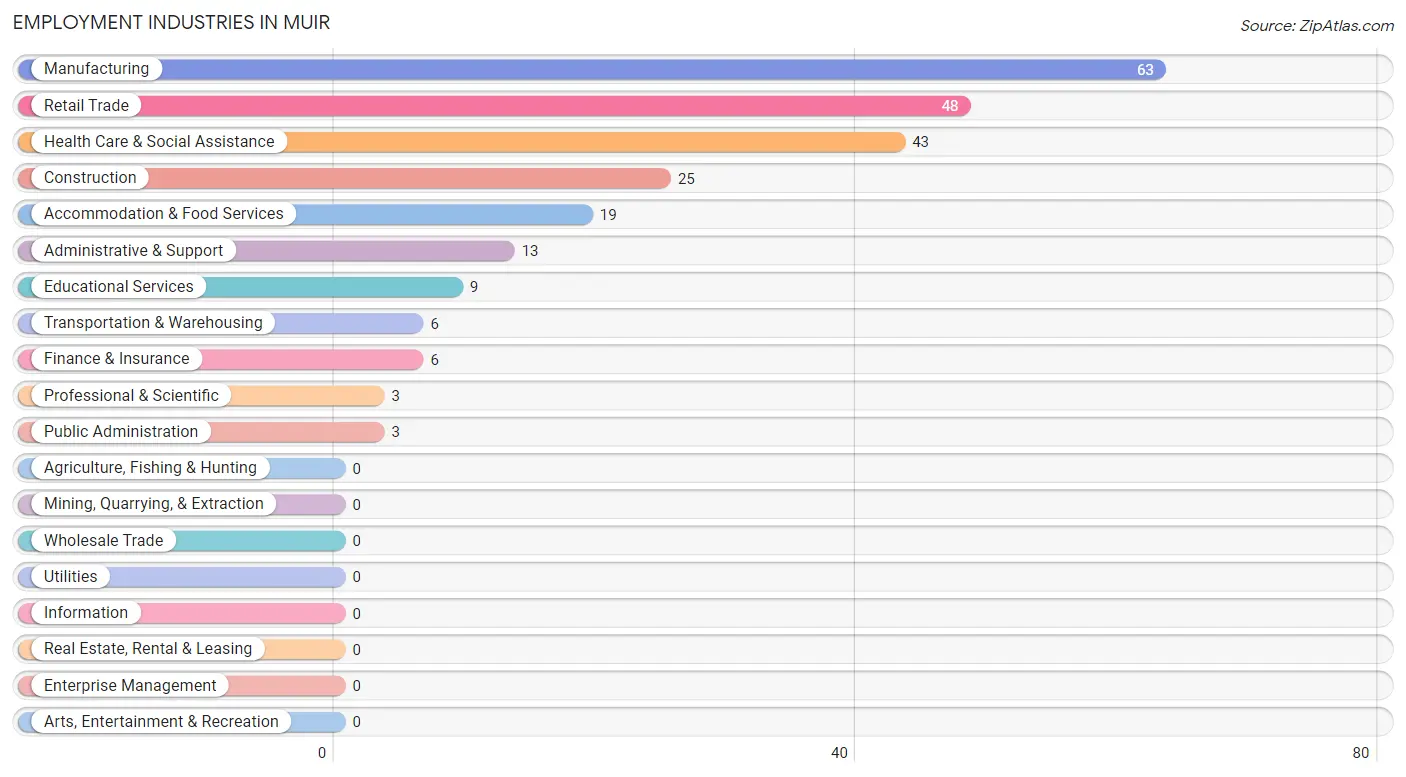
Employment Industries in Muir
The major employment industries in Muir include Manufacturing (63 | 23.8%), Retail Trade (48 | 18.1%), Health Care & Social Assistance (43 | 16.2%), Construction (25 | 9.4%), and Accommodation & Food Services (19 | 7.2%).
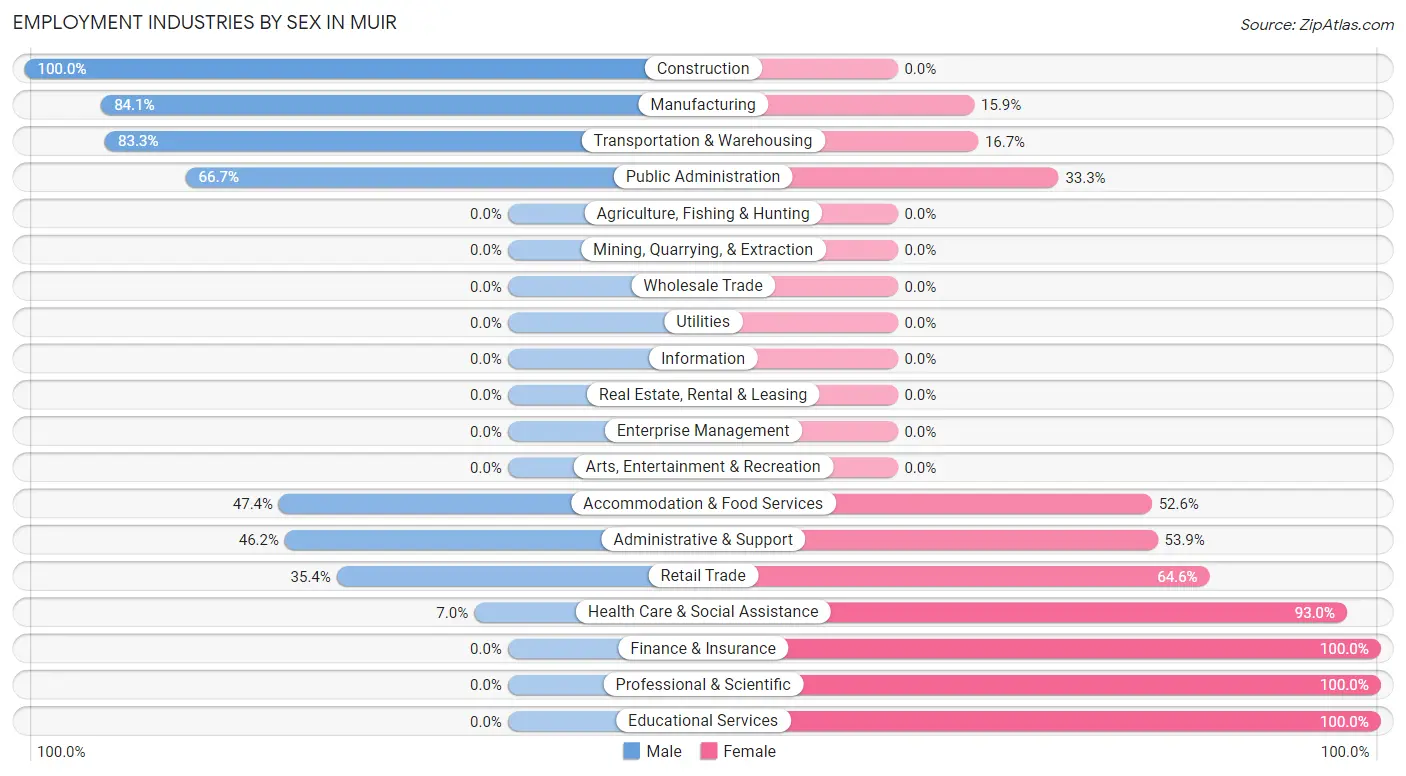
Employment Industries by Sex in Muir
The Muir industries that see more men than women are Construction (100.0%), Manufacturing (84.1%), and Transportation & Warehousing (83.3%), whereas the industries that tend to have a higher number of women are Finance & Insurance (100.0%), Professional & Scientific (100.0%), and Educational Services (100.0%).
| Industry | Male | Female |
| Agriculture, Fishing & Hunting | 0 (0.0%) | 0 (0.0%) |
| Mining, Quarrying, & Extraction | 0 (0.0%) | 0 (0.0%) |
| Construction | 25 (100.0%) | 0 (0.0%) |
| Manufacturing | 53 (84.1%) | 10 (15.9%) |
| Wholesale Trade | 0 (0.0%) | 0 (0.0%) |
| Retail Trade | 17 (35.4%) | 31 (64.6%) |
| Transportation & Warehousing | 5 (83.3%) | 1 (16.7%) |
| Utilities | 0 (0.0%) | 0 (0.0%) |
| Information | 0 (0.0%) | 0 (0.0%) |
| Finance & Insurance | 0 (0.0%) | 6 (100.0%) |
| Real Estate, Rental & Leasing | 0 (0.0%) | 0 (0.0%) |
| Professional & Scientific | 0 (0.0%) | 3 (100.0%) |
| Enterprise Management | 0 (0.0%) | 0 (0.0%) |
| Administrative & Support | 6 (46.2%) | 7 (53.8%) |
| Educational Services | 0 (0.0%) | 9 (100.0%) |
| Health Care & Social Assistance | 3 (7.0%) | 40 (93.0%) |
| Arts, Entertainment & Recreation | 0 (0.0%) | 0 (0.0%) |
| Accommodation & Food Services | 9 (47.4%) | 10 (52.6%) |
| Public Administration | 2 (66.7%) | 1 (33.3%) |
| Total | 123 (46.4%) | 142 (53.6%) |
Education in Muir
School Enrollment in Muir
The most common levels of schooling among the 148 students in Muir are elementary school (52 | 35.1%), high school (45 | 30.4%), and middle school (25 | 16.9%).
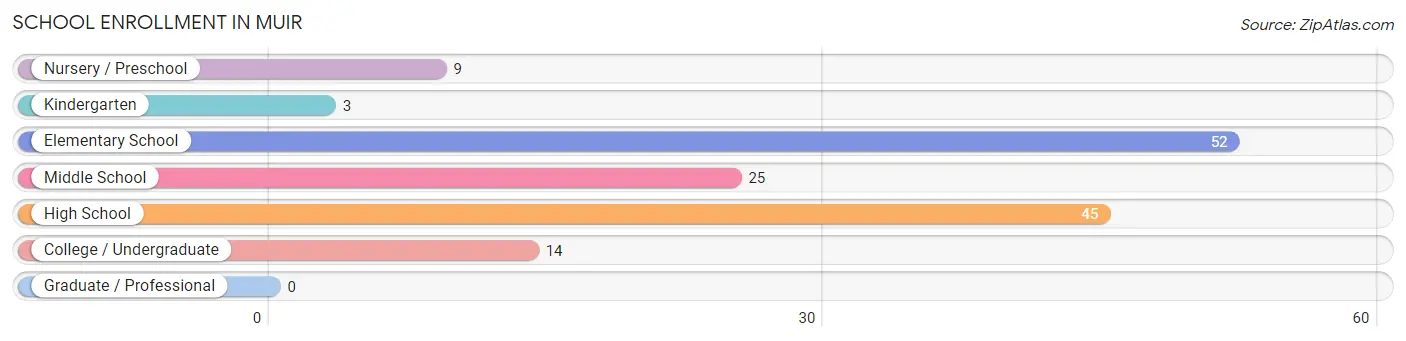
| School Level | # Students | % Students |
| Nursery / Preschool | 9 | 6.1% |
| Kindergarten | 3 | 2.0% |
| Elementary School | 52 | 35.1% |
| Middle School | 25 | 16.9% |
| High School | 45 | 30.4% |
| College / Undergraduate | 14 | 9.5% |
| Graduate / Professional | 0 | 0.0% |
| Total | 148 | 100.0% |
School Enrollment by Age by Funding Source in Muir
Out of a total of 148 students who are enrolled in schools in Muir, 12 (8.1%) attend a private institution, while the remaining 136 (91.9%) are enrolled in public schools. The age group of 15 to 17 year olds has the highest likelihood of being enrolled in private schools, with 4 (10.8% in the age bracket) enrolled. Conversely, the age group of 18 to 19 year olds has the lowest likelihood of being enrolled in a private school, with 3 (100.0% in the age bracket) attending a public institution.
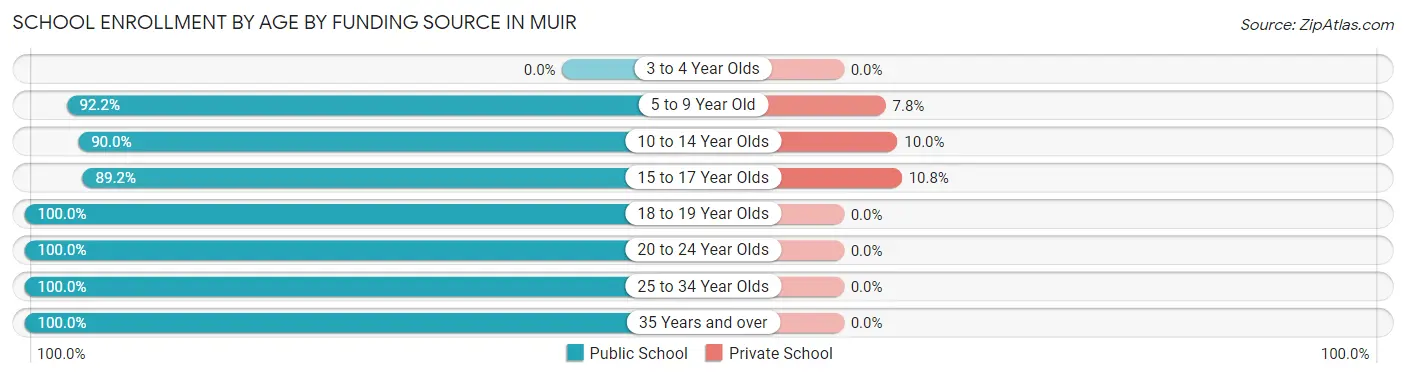
| Age Bracket | Public School | Private School |
| 3 to 4 Year Olds | 0 (0.0%) | 0 (0.0%) |
| 5 to 9 Year Old | 59 (92.2%) | 5 (7.8%) |
| 10 to 14 Year Olds | 27 (90.0%) | 3 (10.0%) |
| 15 to 17 Year Olds | 33 (89.2%) | 4 (10.8%) |
| 18 to 19 Year Olds | 3 (100.0%) | 0 (0.0%) |
| 20 to 24 Year Olds | 4 (100.0%) | 0 (0.0%) |
| 25 to 34 Year Olds | 8 (100.0%) | 0 (0.0%) |
| 35 Years and over | 2 (100.0%) | 0 (0.0%) |
| Total | 136 (91.9%) | 12 (8.1%) |
Educational Attainment by Field of Study in Muir
Arts & humanities (7 | 29.2%), communications (5 | 20.8%), social sciences (4 | 16.7%), psychology (3 | 12.5%), and visual & performing arts (3 | 12.5%) are the most common fields of study among 24 individuals in Muir who have obtained a bachelor's degree or higher.
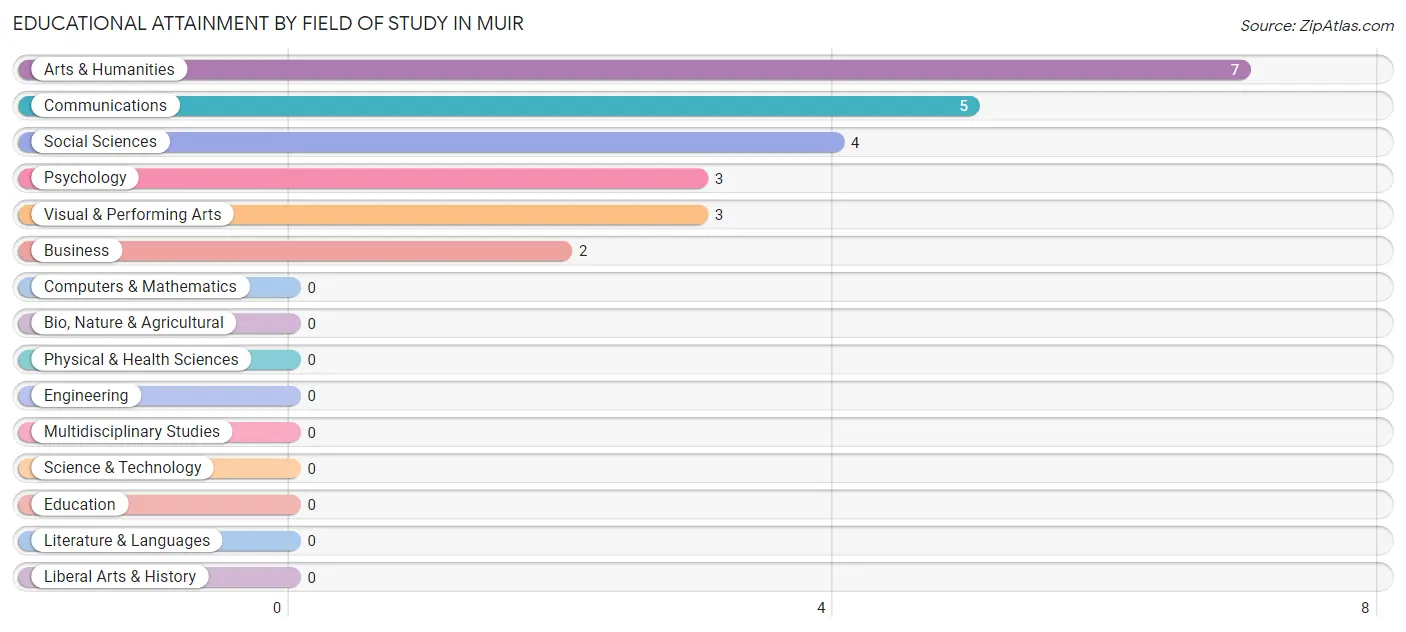
| Field of Study | # Graduates | % Graduates |
| Computers & Mathematics | 0 | 0.0% |
| Bio, Nature & Agricultural | 0 | 0.0% |
| Physical & Health Sciences | 0 | 0.0% |
| Psychology | 3 | 12.5% |
| Social Sciences | 4 | 16.7% |
| Engineering | 0 | 0.0% |
| Multidisciplinary Studies | 0 | 0.0% |
| Science & Technology | 0 | 0.0% |
| Business | 2 | 8.3% |
| Education | 0 | 0.0% |
| Literature & Languages | 0 | 0.0% |
| Liberal Arts & History | 0 | 0.0% |
| Visual & Performing Arts | 3 | 12.5% |
| Communications | 5 | 20.8% |
| Arts & Humanities | 7 | 29.2% |
| Total | 24 | 100.0% |
Transportation & Commute in Muir
Vehicle Availability by Sex in Muir
The most prevalent vehicle ownership categories in Muir are males with 2 vehicles (60, accounting for 50.4%) and females with 2 vehicles (30, making up 43.8%).
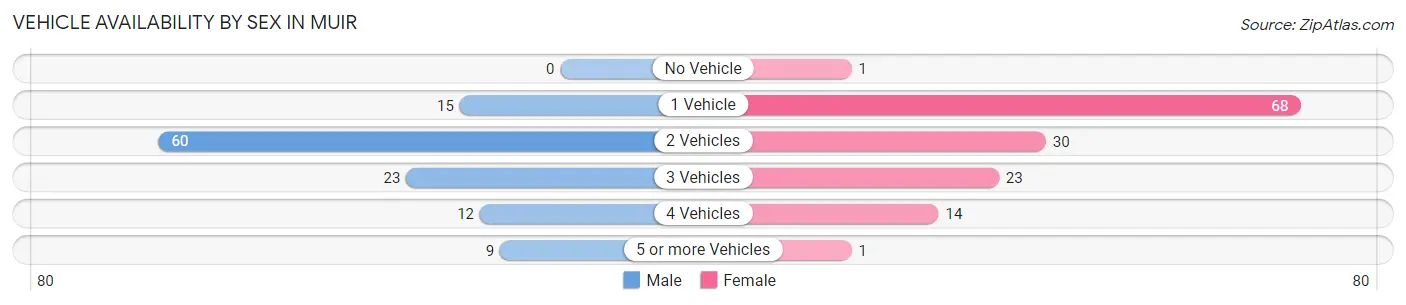
| Vehicles Available | Male | Female |
| No Vehicle | 0 (0.0%) | 1 (0.7%) |
| 1 Vehicle | 15 (12.6%) | 68 (49.6%) |
| 2 Vehicles | 60 (50.4%) | 30 (21.9%) |
| 3 Vehicles | 23 (19.3%) | 23 (16.8%) |
| 4 Vehicles | 12 (10.1%) | 14 (10.2%) |
| 5 or more Vehicles | 9 (7.6%) | 1 (0.7%) |
| Total | 119 (100.0%) | 137 (100.0%) |
Commute Time in Muir
The most frequently occuring commute durations in Muir are 10 to 14 minutes (50 commuters, 19.8%), 45 to 59 minutes (49 commuters, 19.4%), and 15 to 19 minutes (32 commuters, 12.7%).
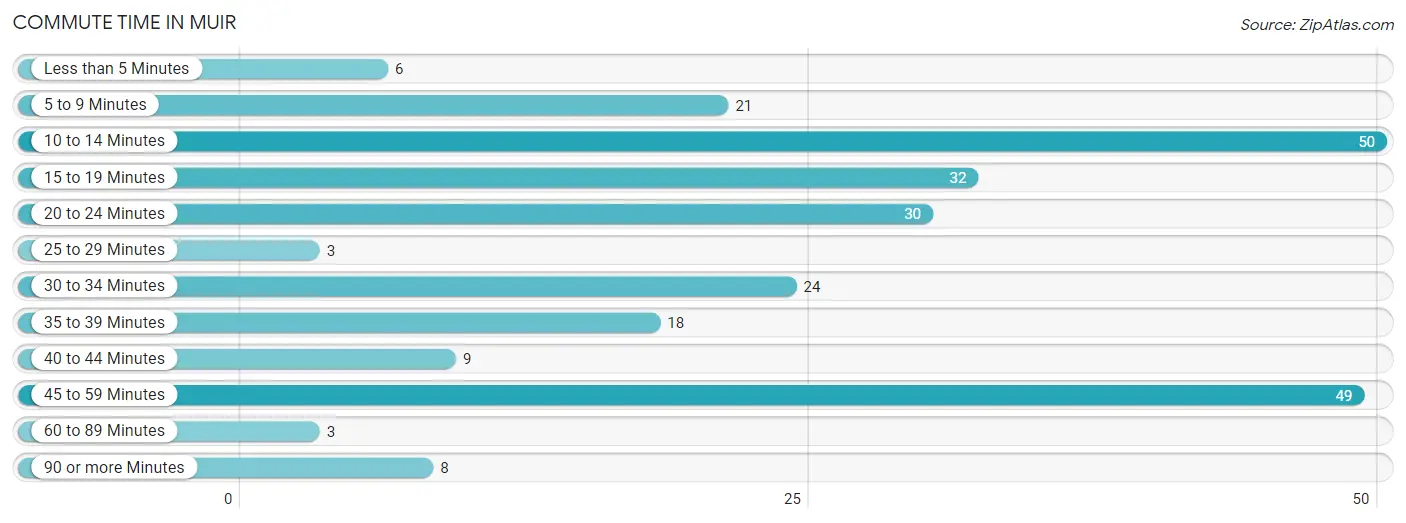
| Commute Time | # Commuters | % Commuters |
| Less than 5 Minutes | 6 | 2.4% |
| 5 to 9 Minutes | 21 | 8.3% |
| 10 to 14 Minutes | 50 | 19.8% |
| 15 to 19 Minutes | 32 | 12.7% |
| 20 to 24 Minutes | 30 | 11.9% |
| 25 to 29 Minutes | 3 | 1.2% |
| 30 to 34 Minutes | 24 | 9.5% |
| 35 to 39 Minutes | 18 | 7.1% |
| 40 to 44 Minutes | 9 | 3.6% |
| 45 to 59 Minutes | 49 | 19.4% |
| 60 to 89 Minutes | 3 | 1.2% |
| 90 or more Minutes | 8 | 3.2% |
Commute Time by Sex in Muir
The most common commute times in Muir are 45 to 59 minutes (37 commuters, 31.1%) for males and 10 to 14 minutes (39 commuters, 29.1%) for females.
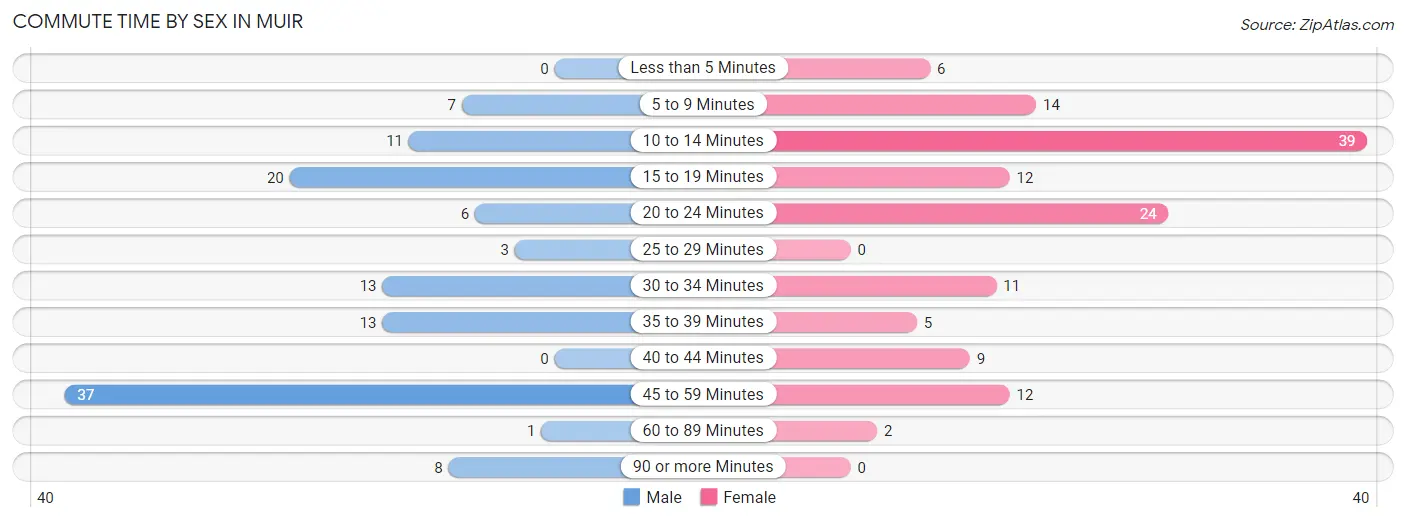
| Commute Time | Male | Female |
| Less than 5 Minutes | 0 (0.0%) | 6 (4.5%) |
| 5 to 9 Minutes | 7 (5.9%) | 14 (10.4%) |
| 10 to 14 Minutes | 11 (9.2%) | 39 (29.1%) |
| 15 to 19 Minutes | 20 (16.8%) | 12 (9.0%) |
| 20 to 24 Minutes | 6 (5.0%) | 24 (17.9%) |
| 25 to 29 Minutes | 3 (2.5%) | 0 (0.0%) |
| 30 to 34 Minutes | 13 (10.9%) | 11 (8.2%) |
| 35 to 39 Minutes | 13 (10.9%) | 5 (3.7%) |
| 40 to 44 Minutes | 0 (0.0%) | 9 (6.7%) |
| 45 to 59 Minutes | 37 (31.1%) | 12 (9.0%) |
| 60 to 89 Minutes | 1 (0.8%) | 2 (1.5%) |
| 90 or more Minutes | 8 (6.7%) | 0 (0.0%) |
Time of Departure to Work by Sex in Muir
The most frequent times of departure to work in Muir are 6:00 AM to 6:29 AM (23, 19.3%) for males and 6:00 AM to 6:29 AM (19, 14.2%) for females.
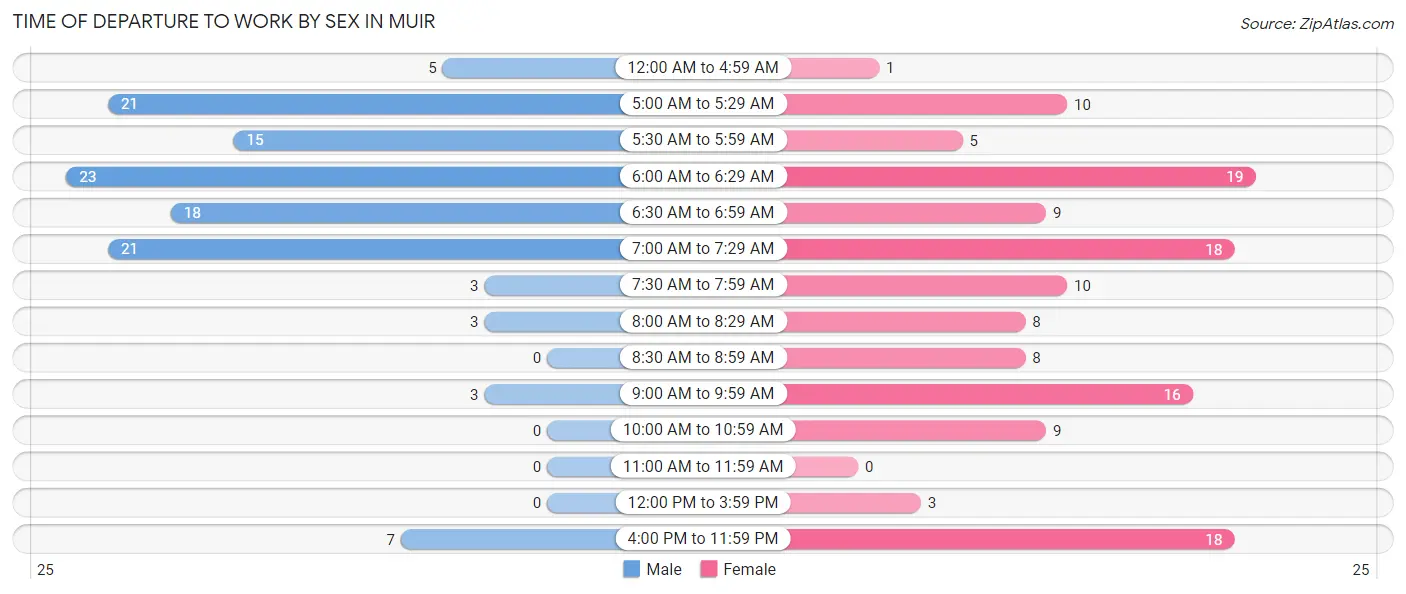
| Time of Departure | Male | Female |
| 12:00 AM to 4:59 AM | 5 (4.2%) | 1 (0.7%) |
| 5:00 AM to 5:29 AM | 21 (17.6%) | 10 (7.5%) |
| 5:30 AM to 5:59 AM | 15 (12.6%) | 5 (3.7%) |
| 6:00 AM to 6:29 AM | 23 (19.3%) | 19 (14.2%) |
| 6:30 AM to 6:59 AM | 18 (15.1%) | 9 (6.7%) |
| 7:00 AM to 7:29 AM | 21 (17.6%) | 18 (13.4%) |
| 7:30 AM to 7:59 AM | 3 (2.5%) | 10 (7.5%) |
| 8:00 AM to 8:29 AM | 3 (2.5%) | 8 (6.0%) |
| 8:30 AM to 8:59 AM | 0 (0.0%) | 8 (6.0%) |
| 9:00 AM to 9:59 AM | 3 (2.5%) | 16 (11.9%) |
| 10:00 AM to 10:59 AM | 0 (0.0%) | 9 (6.7%) |
| 11:00 AM to 11:59 AM | 0 (0.0%) | 0 (0.0%) |
| 12:00 PM to 3:59 PM | 0 (0.0%) | 3 (2.2%) |
| 4:00 PM to 11:59 PM | 7 (5.9%) | 18 (13.4%) |
| Total | 119 (100.0%) | 134 (100.0%) |
Housing Occupancy in Muir
Occupancy by Ownership in Muir
Of the total 243 dwellings in Muir, owner-occupied units account for 124 (51.0%), while renter-occupied units make up 119 (49.0%).
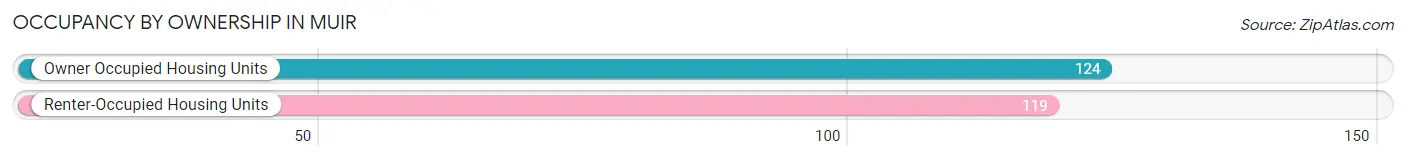
| Occupancy | # Housing Units | % Housing Units |
| Owner Occupied Housing Units | 124 | 51.0% |
| Renter-Occupied Housing Units | 119 | 49.0% |
| Total Occupied Housing Units | 243 | 100.0% |
Occupancy by Household Size in Muir
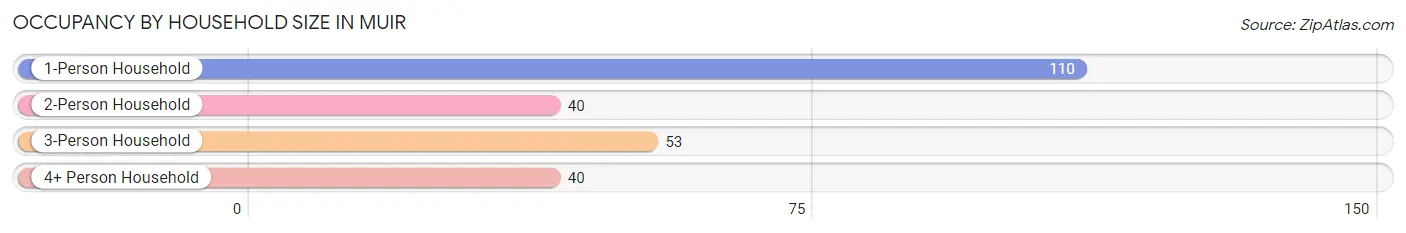
| Household Size | # Housing Units | % Housing Units |
| 1-Person Household | 110 | 45.3% |
| 2-Person Household | 40 | 16.5% |
| 3-Person Household | 53 | 21.8% |
| 4+ Person Household | 40 | 16.5% |
| Total Housing Units | 243 | 100.0% |
Occupancy by Ownership by Household Size in Muir
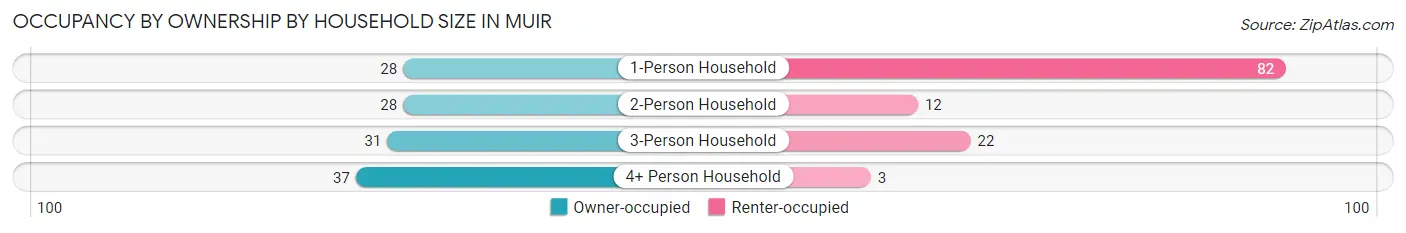
| Household Size | Owner-occupied | Renter-occupied |
| 1-Person Household | 28 (25.5%) | 82 (74.6%) |
| 2-Person Household | 28 (70.0%) | 12 (30.0%) |
| 3-Person Household | 31 (58.5%) | 22 (41.5%) |
| 4+ Person Household | 37 (92.5%) | 3 (7.5%) |
| Total Housing Units | 124 (51.0%) | 119 (49.0%) |
Occupancy by Educational Attainment in Muir
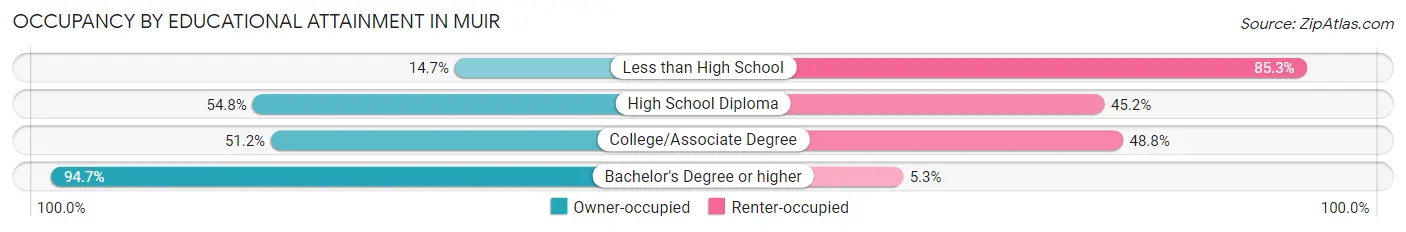
| Household Size | Owner-occupied | Renter-occupied |
| Less than High School | 5 (14.7%) | 29 (85.3%) |
| High School Diploma | 57 (54.8%) | 47 (45.2%) |
| College/Associate Degree | 44 (51.2%) | 42 (48.8%) |
| Bachelor's Degree or higher | 18 (94.7%) | 1 (5.3%) |
Occupancy by Age of Householder in Muir
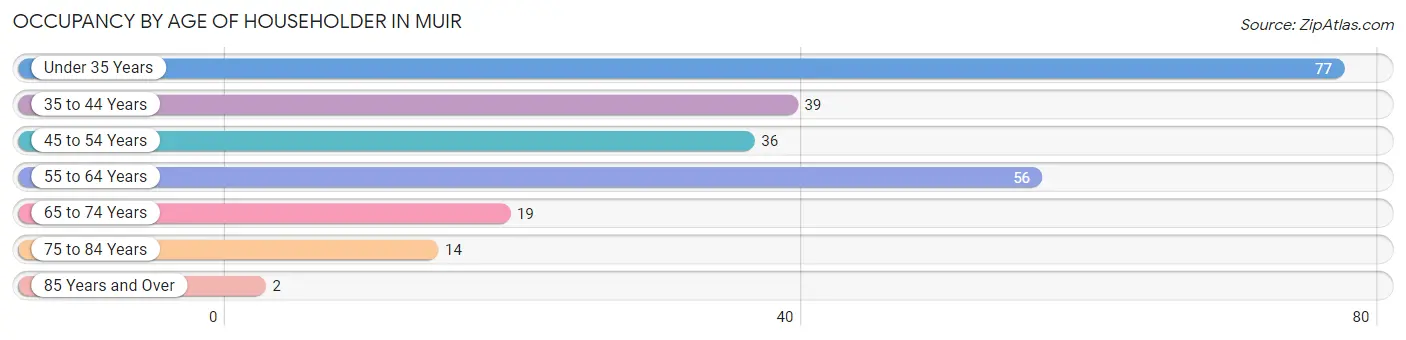
| Age Bracket | # Households | % Households |
| Under 35 Years | 77 | 31.7% |
| 35 to 44 Years | 39 | 16.1% |
| 45 to 54 Years | 36 | 14.8% |
| 55 to 64 Years | 56 | 23.1% |
| 65 to 74 Years | 19 | 7.8% |
| 75 to 84 Years | 14 | 5.8% |
| 85 Years and Over | 2 | 0.8% |
| Total | 243 | 100.0% |
Housing Finances in Muir
Median Income by Occupancy in Muir
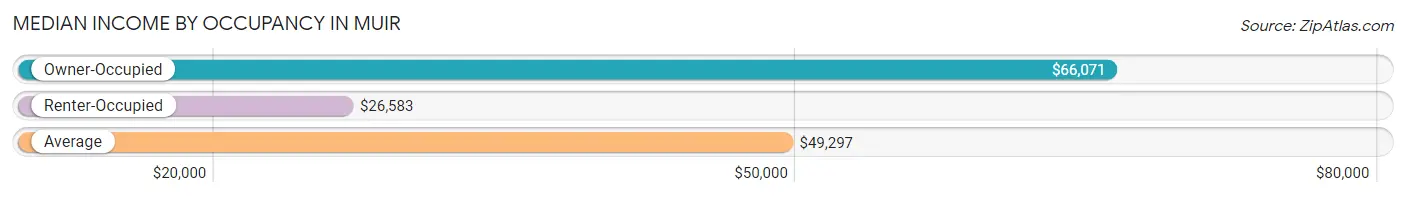
| Occupancy Type | # Households | Median Income |
| Owner-Occupied | 124 (51.0%) | $66,071 |
| Renter-Occupied | 119 (49.0%) | $26,583 |
| Average | 243 (100.0%) | $49,297 |
Occupancy by Householder Income Bracket in Muir
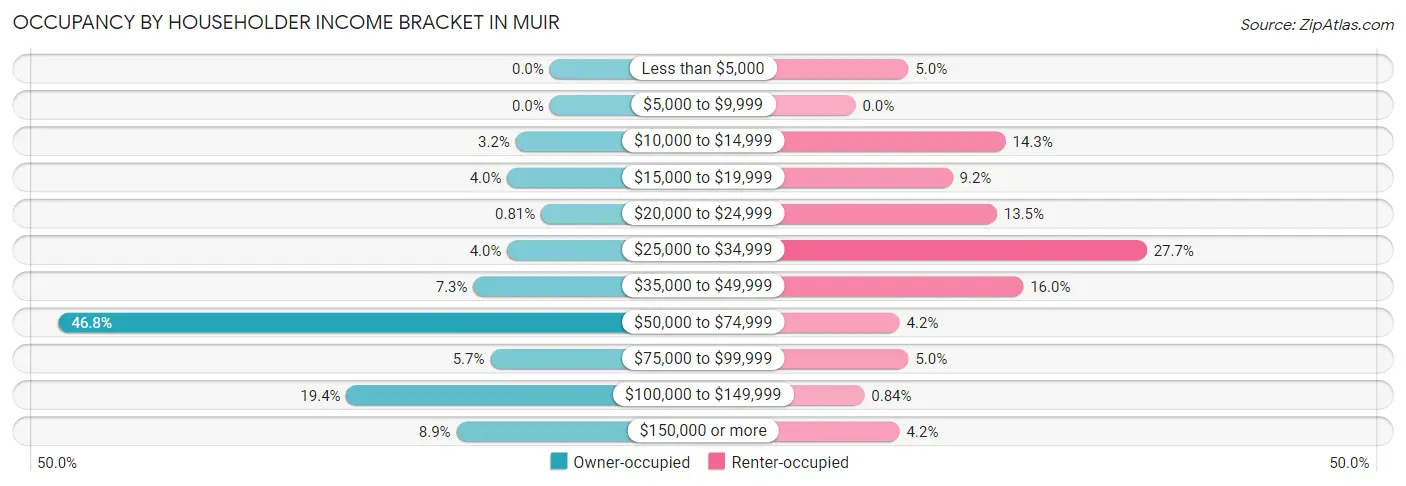
| Income Bracket | Owner-occupied | Renter-occupied |
| Less than $5,000 | 0 (0.0%) | 6 (5.0%) |
| $5,000 to $9,999 | 0 (0.0%) | 0 (0.0%) |
| $10,000 to $14,999 | 4 (3.2%) | 17 (14.3%) |
| $15,000 to $19,999 | 5 (4.0%) | 11 (9.2%) |
| $20,000 to $24,999 | 1 (0.8%) | 16 (13.5%) |
| $25,000 to $34,999 | 5 (4.0%) | 33 (27.7%) |
| $35,000 to $49,999 | 9 (7.3%) | 19 (16.0%) |
| $50,000 to $74,999 | 58 (46.8%) | 5 (4.2%) |
| $75,000 to $99,999 | 7 (5.7%) | 6 (5.0%) |
| $100,000 to $149,999 | 24 (19.4%) | 1 (0.8%) |
| $150,000 or more | 11 (8.9%) | 5 (4.2%) |
| Total | 124 (100.0%) | 119 (100.0%) |
Monthly Housing Cost Tiers in Muir
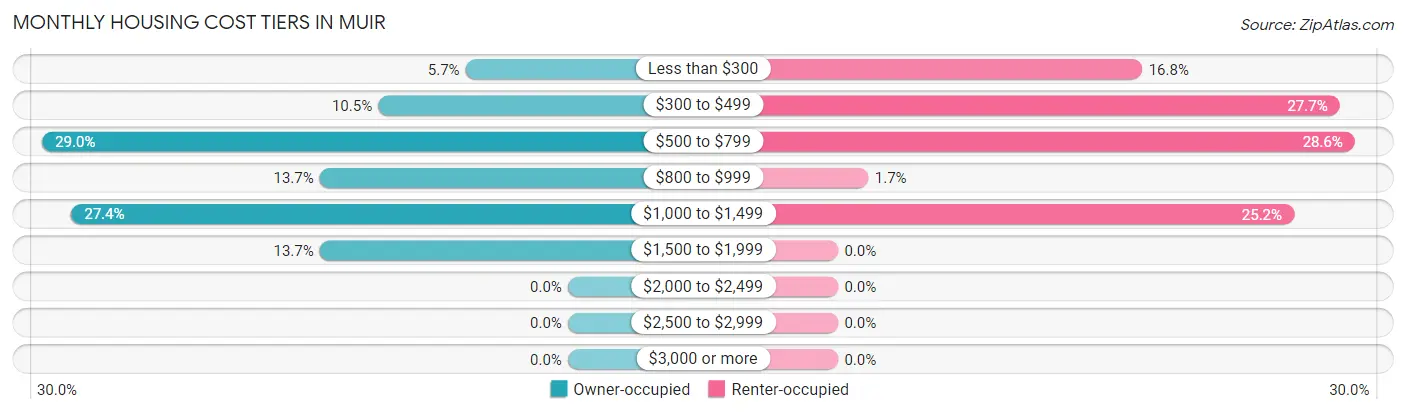
| Monthly Cost | Owner-occupied | Renter-occupied |
| Less than $300 | 7 (5.7%) | 20 (16.8%) |
| $300 to $499 | 13 (10.5%) | 33 (27.7%) |
| $500 to $799 | 36 (29.0%) | 34 (28.6%) |
| $800 to $999 | 17 (13.7%) | 2 (1.7%) |
| $1,000 to $1,499 | 34 (27.4%) | 30 (25.2%) |
| $1,500 to $1,999 | 17 (13.7%) | 0 (0.0%) |
| $2,000 to $2,499 | 0 (0.0%) | 0 (0.0%) |
| $2,500 to $2,999 | 0 (0.0%) | 0 (0.0%) |
| $3,000 or more | 0 (0.0%) | 0 (0.0%) |
| Total | 124 (100.0%) | 119 (100.0%) |
Physical Housing Characteristics in Muir
Housing Structures in Muir
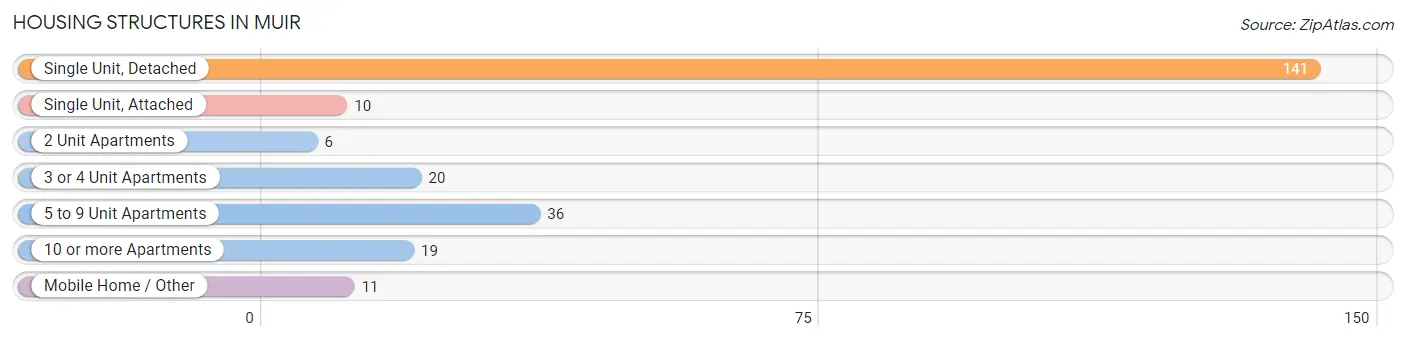
| Structure Type | # Housing Units | % Housing Units |
| Single Unit, Detached | 141 | 58.0% |
| Single Unit, Attached | 10 | 4.1% |
| 2 Unit Apartments | 6 | 2.5% |
| 3 or 4 Unit Apartments | 20 | 8.2% |
| 5 to 9 Unit Apartments | 36 | 14.8% |
| 10 or more Apartments | 19 | 7.8% |
| Mobile Home / Other | 11 | 4.5% |
| Total | 243 | 100.0% |
Housing Structures by Occupancy in Muir
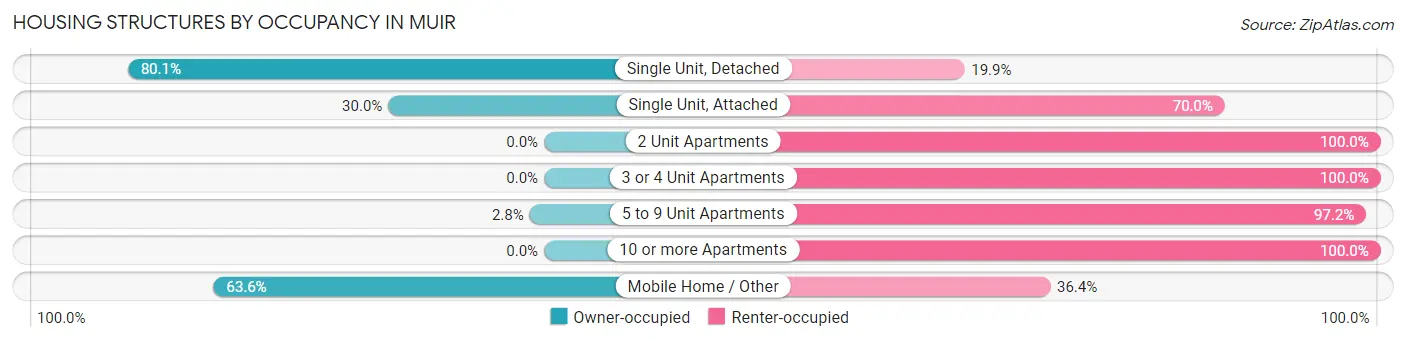
| Structure Type | Owner-occupied | Renter-occupied |
| Single Unit, Detached | 113 (80.1%) | 28 (19.9%) |
| Single Unit, Attached | 3 (30.0%) | 7 (70.0%) |
| 2 Unit Apartments | 0 (0.0%) | 6 (100.0%) |
| 3 or 4 Unit Apartments | 0 (0.0%) | 20 (100.0%) |
| 5 to 9 Unit Apartments | 1 (2.8%) | 35 (97.2%) |
| 10 or more Apartments | 0 (0.0%) | 19 (100.0%) |
| Mobile Home / Other | 7 (63.6%) | 4 (36.4%) |
| Total | 124 (51.0%) | 119 (49.0%) |
Housing Structures by Number of Rooms in Muir
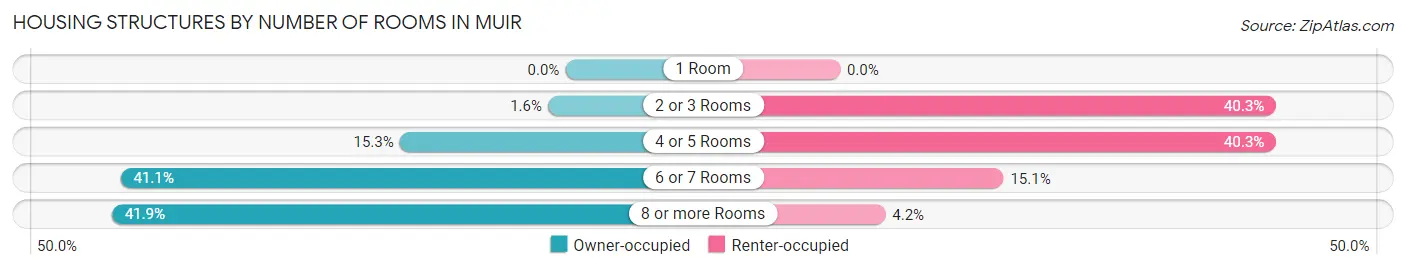
| Number of Rooms | Owner-occupied | Renter-occupied |
| 1 Room | 0 (0.0%) | 0 (0.0%) |
| 2 or 3 Rooms | 2 (1.6%) | 48 (40.3%) |
| 4 or 5 Rooms | 19 (15.3%) | 48 (40.3%) |
| 6 or 7 Rooms | 51 (41.1%) | 18 (15.1%) |
| 8 or more Rooms | 52 (41.9%) | 5 (4.2%) |
| Total | 124 (100.0%) | 119 (100.0%) |
Housing Structure by Heating Type in Muir
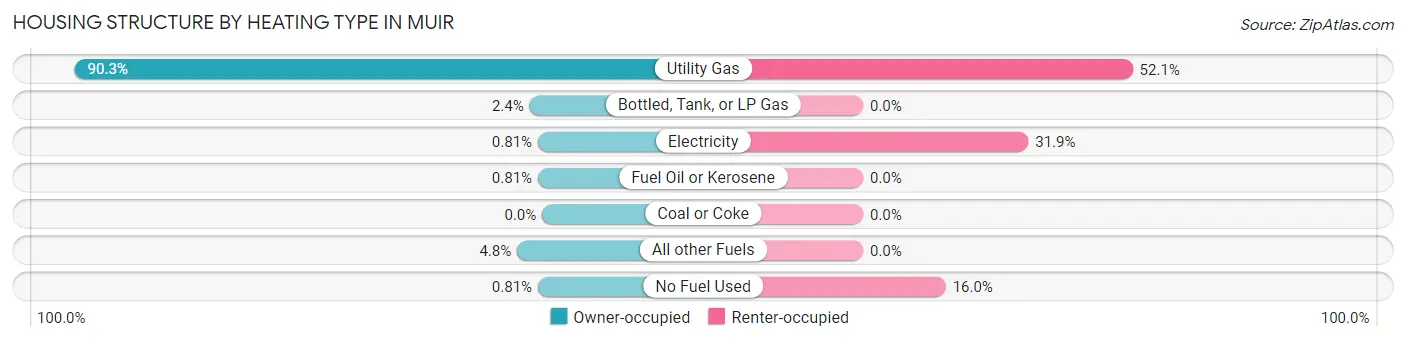
| Heating Type | Owner-occupied | Renter-occupied |
| Utility Gas | 112 (90.3%) | 62 (52.1%) |
| Bottled, Tank, or LP Gas | 3 (2.4%) | 0 (0.0%) |
| Electricity | 1 (0.8%) | 38 (31.9%) |
| Fuel Oil or Kerosene | 1 (0.8%) | 0 (0.0%) |
| Coal or Coke | 0 (0.0%) | 0 (0.0%) |
| All other Fuels | 6 (4.8%) | 0 (0.0%) |
| No Fuel Used | 1 (0.8%) | 19 (16.0%) |
| Total | 124 (100.0%) | 119 (100.0%) |
Household Vehicle Usage in Muir
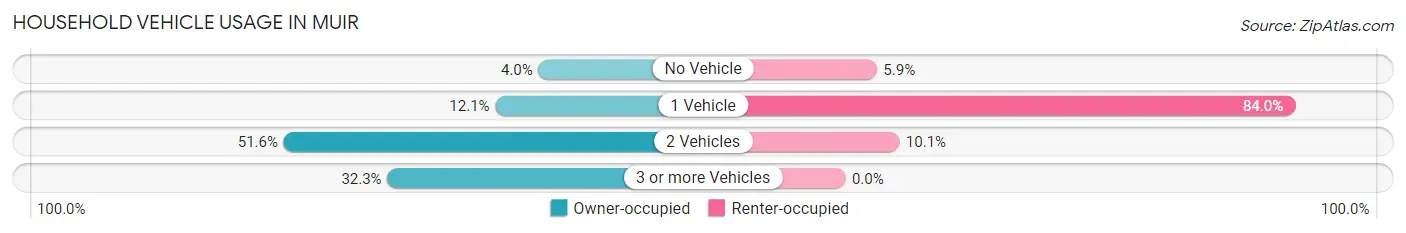
| Vehicles per Household | Owner-occupied | Renter-occupied |
| No Vehicle | 5 (4.0%) | 7 (5.9%) |
| 1 Vehicle | 15 (12.1%) | 100 (84.0%) |
| 2 Vehicles | 64 (51.6%) | 12 (10.1%) |
| 3 or more Vehicles | 40 (32.3%) | 0 (0.0%) |
| Total | 124 (100.0%) | 119 (100.0%) |
Real Estate & Mortgages in Muir
Real Estate and Mortgage Overview in Muir
| Characteristic | Without Mortgage | With Mortgage |
| Housing Units | 52 | 72 |
| Median Property Value | $108,300 | $133,800 |
| Median Household Income | $55,833 | $6 |
| Monthly Housing Costs | $535 | $0 |
| Real Estate Taxes | $1,536 | $0 |
Property Value by Mortgage Status in Muir
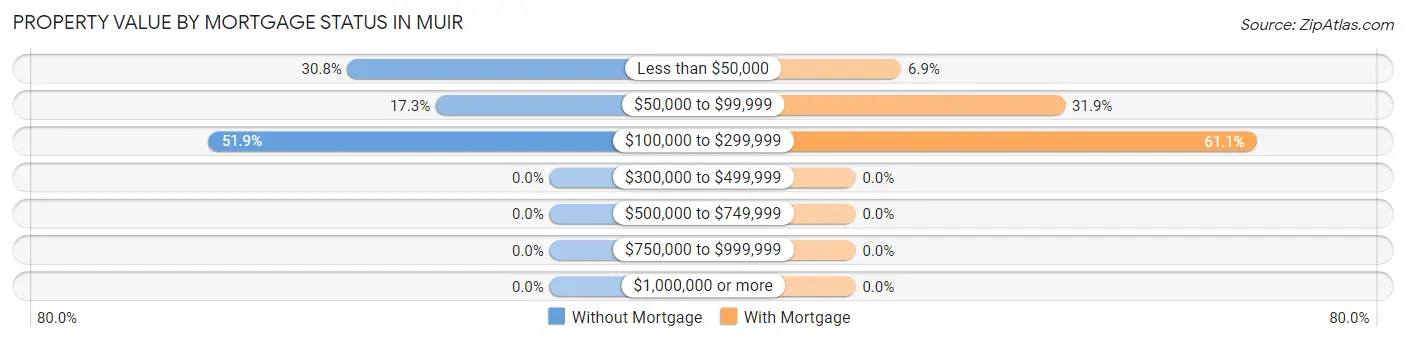
| Property Value | Without Mortgage | With Mortgage |
| Less than $50,000 | 16 (30.8%) | 5 (6.9%) |
| $50,000 to $99,999 | 9 (17.3%) | 23 (31.9%) |
| $100,000 to $299,999 | 27 (51.9%) | 44 (61.1%) |
| $300,000 to $499,999 | 0 (0.0%) | 0 (0.0%) |
| $500,000 to $749,999 | 0 (0.0%) | 0 (0.0%) |
| $750,000 to $999,999 | 0 (0.0%) | 0 (0.0%) |
| $1,000,000 or more | 0 (0.0%) | 0 (0.0%) |
| Total | 52 (100.0%) | 72 (100.0%) |
Household Income by Mortgage Status in Muir
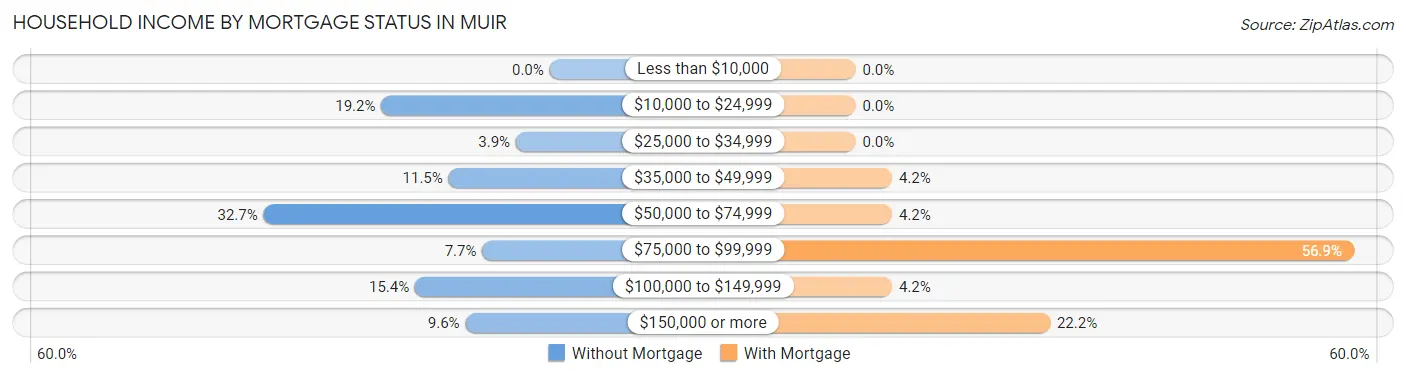
| Household Income | Without Mortgage | With Mortgage |
| Less than $10,000 | 0 (0.0%) | 0 (0.0%) |
| $10,000 to $24,999 | 10 (19.2%) | 0 (0.0%) |
| $25,000 to $34,999 | 2 (3.8%) | 0 (0.0%) |
| $35,000 to $49,999 | 6 (11.5%) | 3 (4.2%) |
| $50,000 to $74,999 | 17 (32.7%) | 3 (4.2%) |
| $75,000 to $99,999 | 4 (7.7%) | 41 (56.9%) |
| $100,000 to $149,999 | 8 (15.4%) | 3 (4.2%) |
| $150,000 or more | 5 (9.6%) | 16 (22.2%) |
| Total | 52 (100.0%) | 72 (100.0%) |
Property Value to Household Income Ratio in Muir
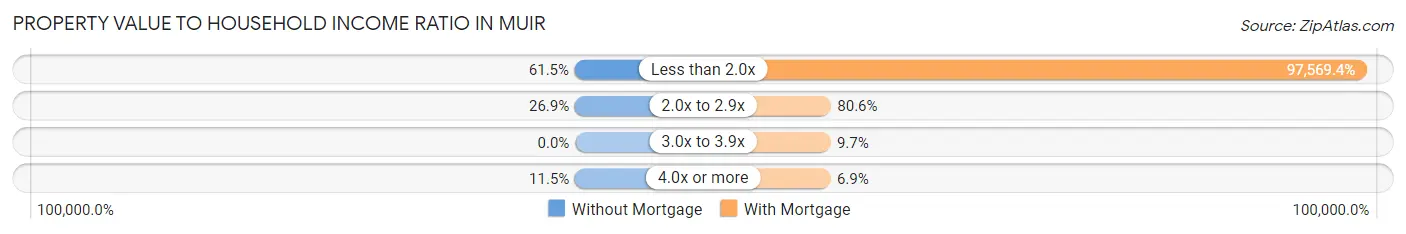
| Value-to-Income Ratio | Without Mortgage | With Mortgage |
| Less than 2.0x | 32 (61.5%) | 70,250 (97,569.4%) |
| 2.0x to 2.9x | 14 (26.9%) | 58 (80.6%) |
| 3.0x to 3.9x | 0 (0.0%) | 7 (9.7%) |
| 4.0x or more | 6 (11.5%) | 5 (6.9%) |
| Total | 52 (100.0%) | 72 (100.0%) |
Real Estate Taxes by Mortgage Status in Muir
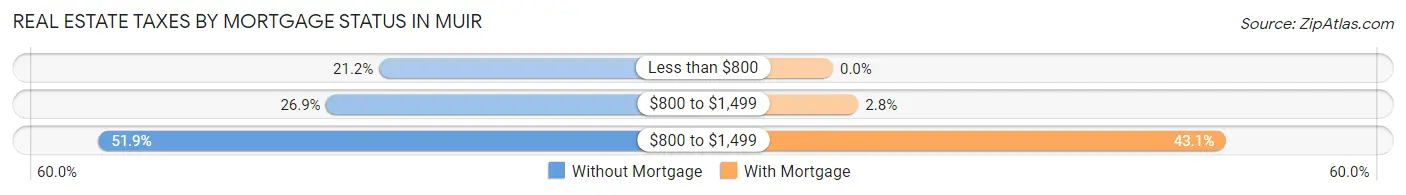
| Property Taxes | Without Mortgage | With Mortgage |
| Less than $800 | 11 (21.1%) | 0 (0.0%) |
| $800 to $1,499 | 14 (26.9%) | 2 (2.8%) |
| $800 to $1,499 | 27 (51.9%) | 31 (43.1%) |
| Total | 52 (100.0%) | 72 (100.0%) |
Health & Disability in Muir
Health Insurance Coverage by Age in Muir
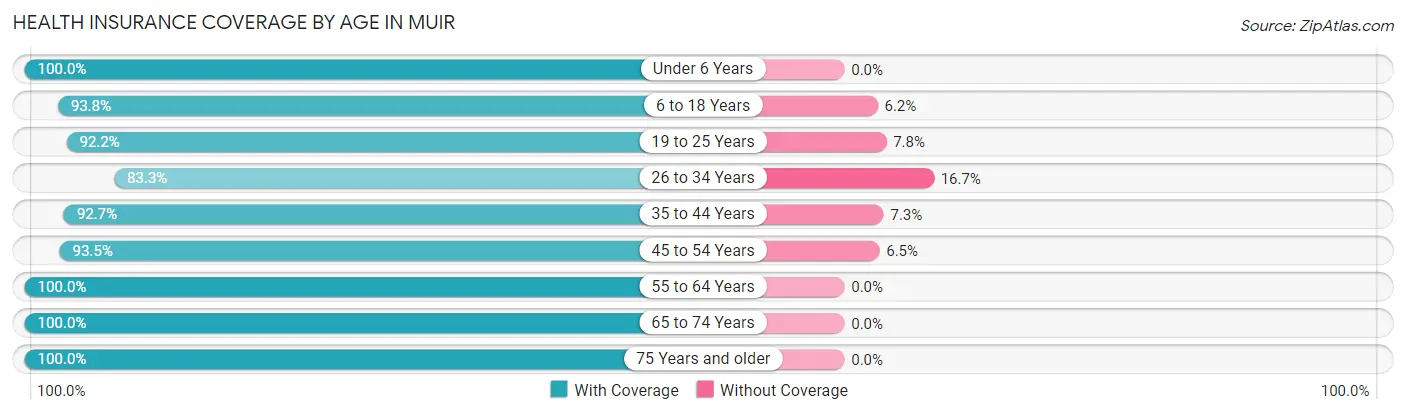
| Age Bracket | With Coverage | Without Coverage |
| Under 6 Years | 31 (100.0%) | 0 (0.0%) |
| 6 to 18 Years | 121 (93.8%) | 8 (6.2%) |
| 19 to 25 Years | 59 (92.2%) | 5 (7.8%) |
| 26 to 34 Years | 80 (83.3%) | 16 (16.7%) |
| 35 to 44 Years | 76 (92.7%) | 6 (7.3%) |
| 45 to 54 Years | 43 (93.5%) | 3 (6.5%) |
| 55 to 64 Years | 68 (100.0%) | 0 (0.0%) |
| 65 to 74 Years | 51 (100.0%) | 0 (0.0%) |
| 75 Years and older | 24 (100.0%) | 0 (0.0%) |
| Total | 553 (93.6%) | 38 (6.4%) |
Health Insurance Coverage by Citizenship Status in Muir
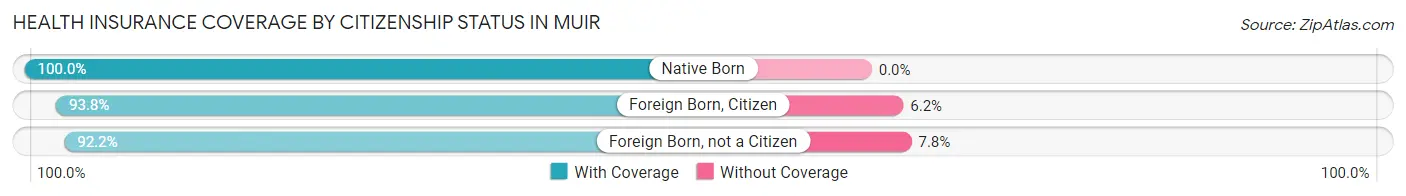
| Citizenship Status | With Coverage | Without Coverage |
| Native Born | 31 (100.0%) | 0 (0.0%) |
| Foreign Born, Citizen | 121 (93.8%) | 8 (6.2%) |
| Foreign Born, not a Citizen | 59 (92.2%) | 5 (7.8%) |
Health Insurance Coverage by Household Income in Muir
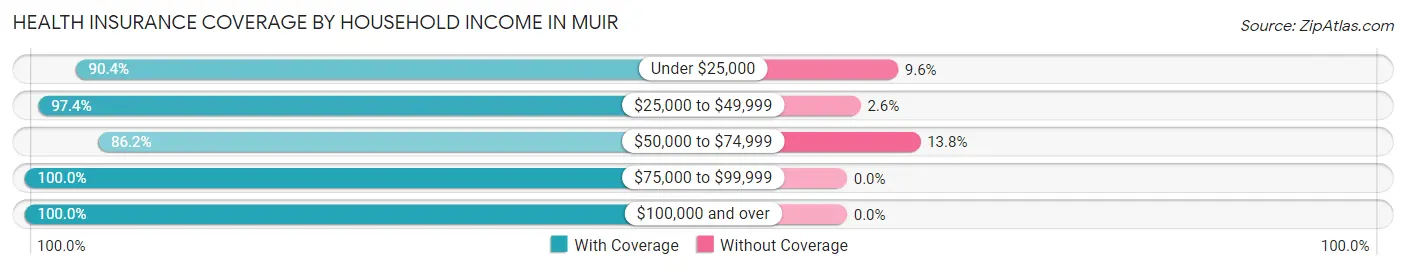
| Household Income | With Coverage | Without Coverage |
| Under $25,000 | 85 (90.4%) | 9 (9.6%) |
| $25,000 to $49,999 | 114 (97.4%) | 3 (2.6%) |
| $50,000 to $74,999 | 163 (86.2%) | 26 (13.8%) |
| $75,000 to $99,999 | 31 (100.0%) | 0 (0.0%) |
| $100,000 and over | 160 (100.0%) | 0 (0.0%) |
Public vs Private Health Insurance Coverage by Age in Muir
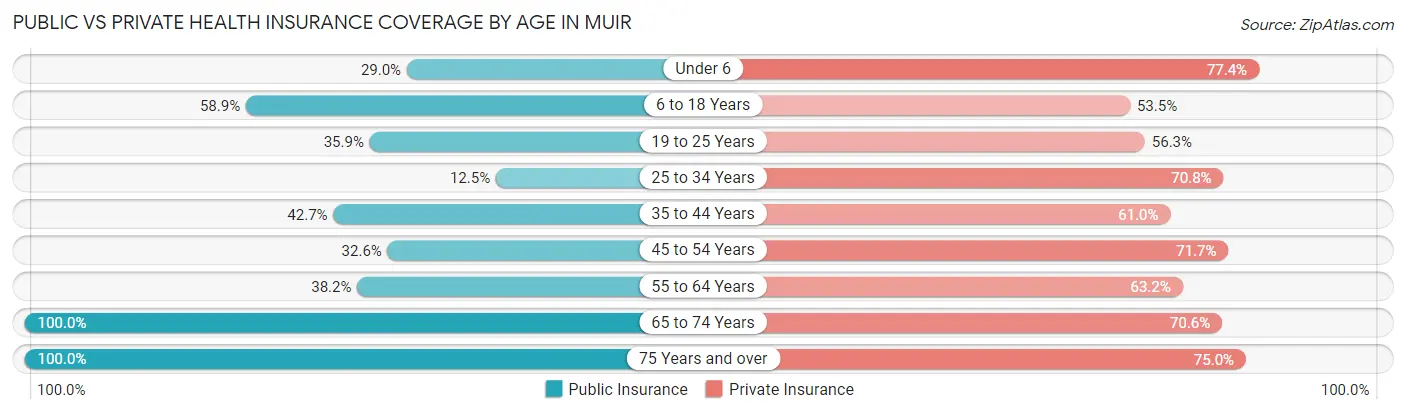
| Age Bracket | Public Insurance | Private Insurance |
| Under 6 | 9 (29.0%) | 24 (77.4%) |
| 6 to 18 Years | 76 (58.9%) | 69 (53.5%) |
| 19 to 25 Years | 23 (35.9%) | 36 (56.2%) |
| 25 to 34 Years | 12 (12.5%) | 68 (70.8%) |
| 35 to 44 Years | 35 (42.7%) | 50 (61.0%) |
| 45 to 54 Years | 15 (32.6%) | 33 (71.7%) |
| 55 to 64 Years | 26 (38.2%) | 43 (63.2%) |
| 65 to 74 Years | 51 (100.0%) | 36 (70.6%) |
| 75 Years and over | 24 (100.0%) | 18 (75.0%) |
| Total | 271 (45.9%) | 377 (63.8%) |
Disability Status by Sex by Age in Muir
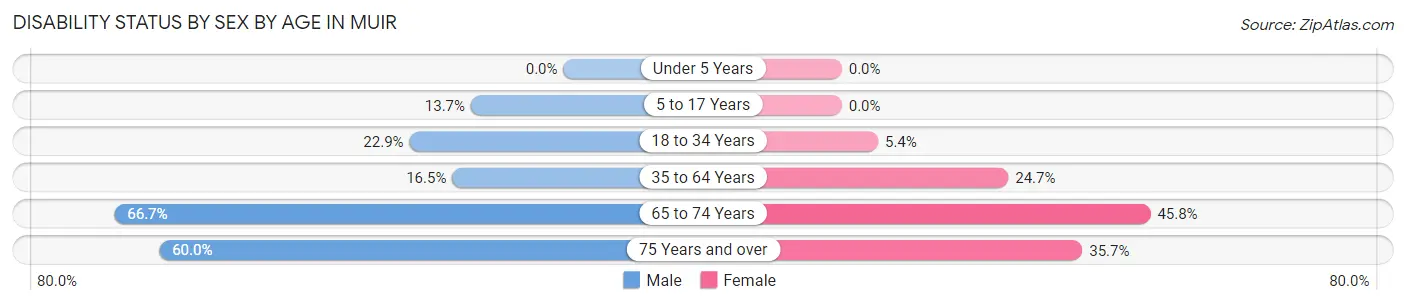
| Age Bracket | Male | Female |
| Under 5 Years | 0 (0.0%) | 0 (0.0%) |
| 5 to 17 Years | 7 (13.7%) | 0 (0.0%) |
| 18 to 34 Years | 16 (22.9%) | 5 (5.4%) |
| 35 to 64 Years | 17 (16.5%) | 23 (24.7%) |
| 65 to 74 Years | 18 (66.7%) | 11 (45.8%) |
| 75 Years and over | 6 (60.0%) | 5 (35.7%) |
Disability Class by Sex by Age in Muir
Disability Class: Hearing Difficulty
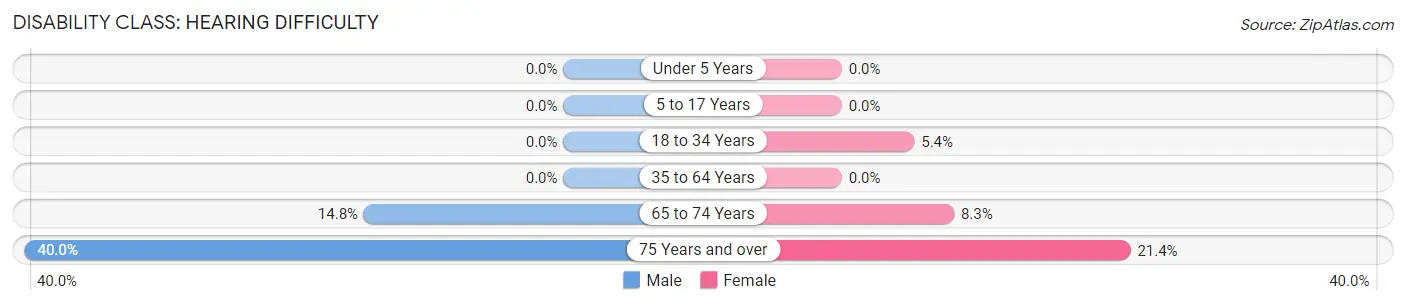
| Age Bracket | Male | Female |
| Under 5 Years | 0 (0.0%) | 0 (0.0%) |
| 5 to 17 Years | 0 (0.0%) | 0 (0.0%) |
| 18 to 34 Years | 0 (0.0%) | 5 (5.4%) |
| 35 to 64 Years | 0 (0.0%) | 0 (0.0%) |
| 65 to 74 Years | 4 (14.8%) | 2 (8.3%) |
| 75 Years and over | 4 (40.0%) | 3 (21.4%) |
Disability Class: Vision Difficulty
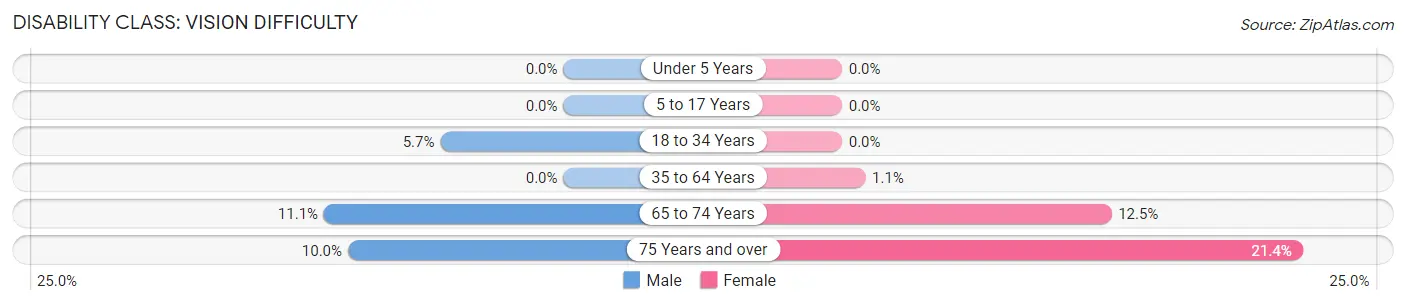
| Age Bracket | Male | Female |
| Under 5 Years | 0 (0.0%) | 0 (0.0%) |
| 5 to 17 Years | 0 (0.0%) | 0 (0.0%) |
| 18 to 34 Years | 4 (5.7%) | 0 (0.0%) |
| 35 to 64 Years | 0 (0.0%) | 1 (1.1%) |
| 65 to 74 Years | 3 (11.1%) | 3 (12.5%) |
| 75 Years and over | 1 (10.0%) | 3 (21.4%) |
Disability Class: Cognitive Difficulty
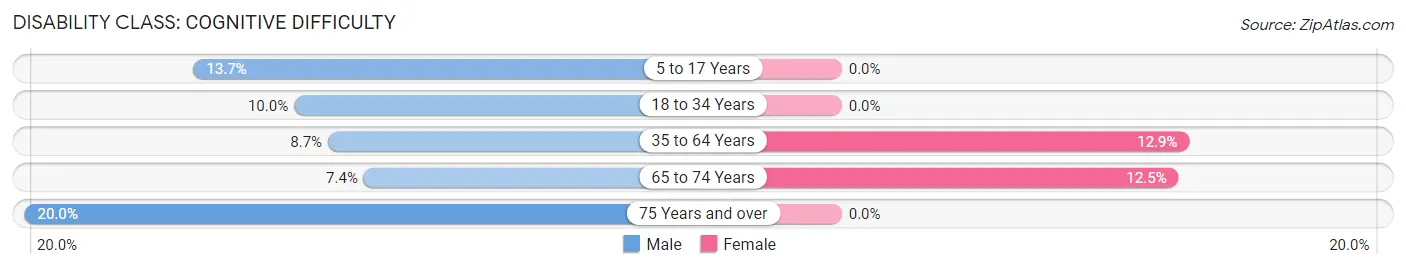
| Age Bracket | Male | Female |
| 5 to 17 Years | 7 (13.7%) | 0 (0.0%) |
| 18 to 34 Years | 7 (10.0%) | 0 (0.0%) |
| 35 to 64 Years | 9 (8.7%) | 12 (12.9%) |
| 65 to 74 Years | 2 (7.4%) | 3 (12.5%) |
| 75 Years and over | 2 (20.0%) | 0 (0.0%) |
Disability Class: Ambulatory Difficulty
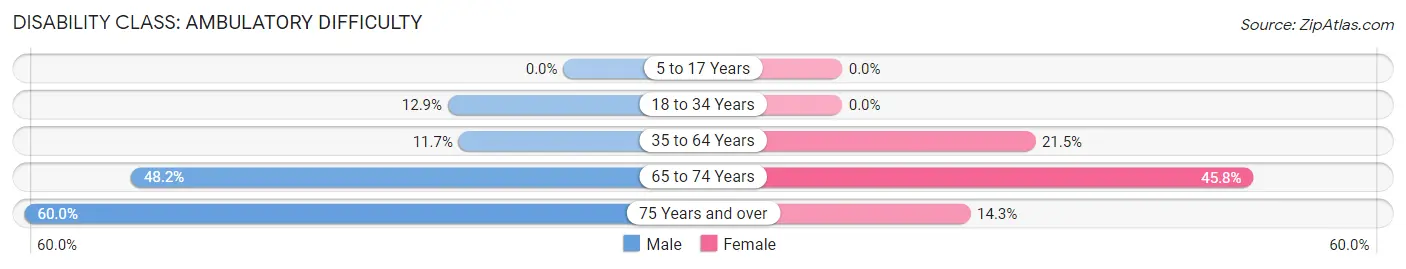
| Age Bracket | Male | Female |
| 5 to 17 Years | 0 (0.0%) | 0 (0.0%) |
| 18 to 34 Years | 9 (12.9%) | 0 (0.0%) |
| 35 to 64 Years | 12 (11.7%) | 20 (21.5%) |
| 65 to 74 Years | 13 (48.1%) | 11 (45.8%) |
| 75 Years and over | 6 (60.0%) | 2 (14.3%) |
Disability Class: Self-Care Difficulty
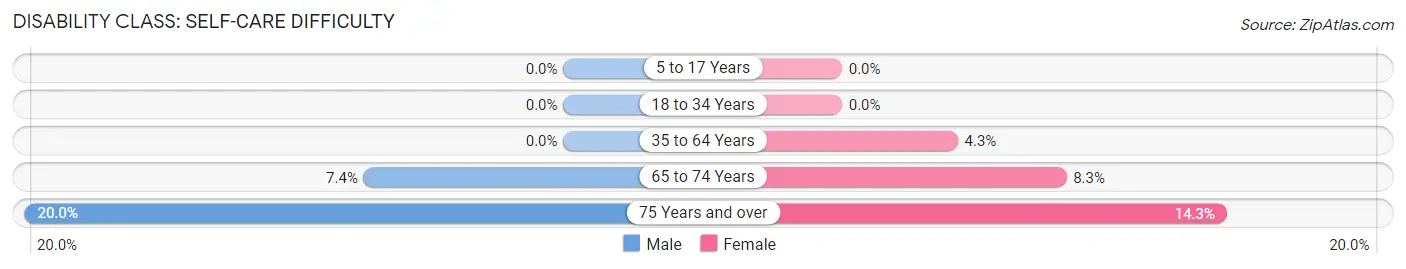
| Age Bracket | Male | Female |
| 5 to 17 Years | 0 (0.0%) | 0 (0.0%) |
| 18 to 34 Years | 0 (0.0%) | 0 (0.0%) |
| 35 to 64 Years | 0 (0.0%) | 4 (4.3%) |
| 65 to 74 Years | 2 (7.4%) | 2 (8.3%) |
| 75 Years and over | 2 (20.0%) | 2 (14.3%) |
Technology Access in Muir
Computing Device Access in Muir
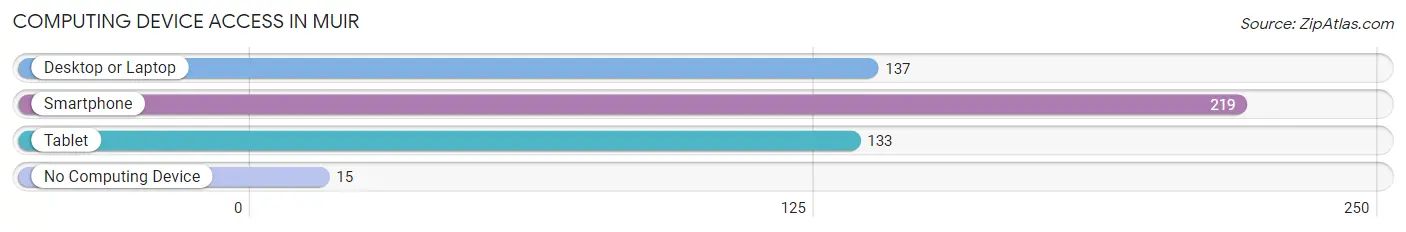
| Device Type | # Households | % Households |
| Desktop or Laptop | 137 | 56.4% |
| Smartphone | 219 | 90.1% |
| Tablet | 133 | 54.7% |
| No Computing Device | 15 | 6.2% |
| Total | 243 | 100.0% |
Internet Access in Muir
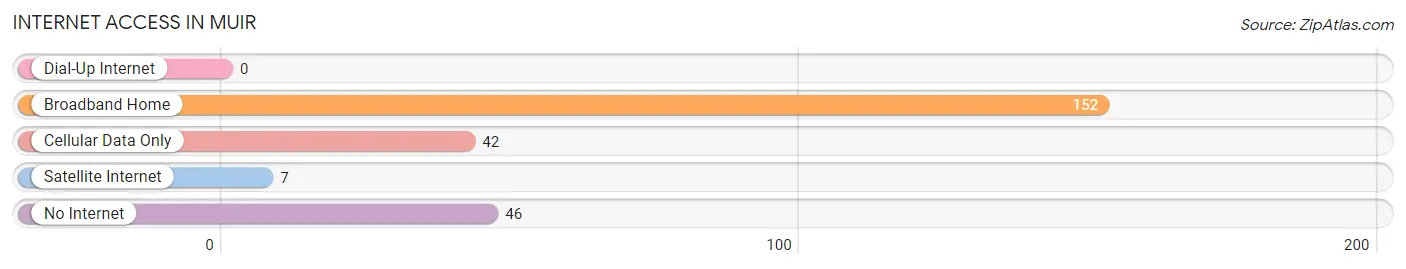
| Internet Type | # Households | % Households |
| Dial-Up Internet | 0 | 0.0% |
| Broadband Home | 152 | 62.5% |
| Cellular Data Only | 42 | 17.3% |
| Satellite Internet | 7 | 2.9% |
| No Internet | 46 | 18.9% |
| Total | 243 | 100.0% |
Muir Summary
Muir is a small village located in Ionia County, Michigan. It is situated on the banks of the Grand River, approximately 20 miles east of Lansing. The village has a population of approximately 1,000 people and is part of the greater Lansing metropolitan area.
History
Muir was founded in 1837 by a group of settlers from New York. The village was named after John Muir, a Scottish-American naturalist and explorer. The settlers were attracted to the area due to its abundance of natural resources, including timber and water. The village quickly grew and by the late 19th century, it had become a thriving community.
In the early 20th century, Muir was a major center for the lumber industry. The village was home to several sawmills and lumber yards, which provided employment for many of the residents. The village also had a thriving agricultural sector, with many farmers growing crops such as corn, wheat, and oats.
Geography
Muir is located in the central part of Ionia County, approximately 20 miles east of Lansing. The village is situated on the banks of the Grand River, which flows through the area. The terrain is mostly flat, with some rolling hills in the surrounding area. The climate is humid continental, with hot summers and cold winters.
Economy
The economy of Muir is largely based on agriculture and tourism. The village is home to several farms, which produce a variety of crops, including corn, wheat, and oats. The village also has a thriving tourism industry, with many visitors coming to the area to enjoy the natural beauty of the Grand River and the surrounding countryside.
Demographics
As of the 2010 census, the population of Muir was 1,000 people. The racial makeup of the village was 97.2% White, 0.7% African American, 0.3% Native American, 0.2% Asian, and 1.6% from other races. The median household income was $41,250, and the median family income was $50,000. The per capita income was $20,000.
Conclusion
Muir is a small village located in Ionia County, Michigan. It is situated on the banks of the Grand River and has a population of approximately 1,000 people. The village has a long history, dating back to 1837, and has a thriving economy based on agriculture and tourism. The racial makeup of the village is mostly White, with a small percentage of African American, Native American, and Asian residents. The median household income is $41,250, and the per capita income is $20,000.
Common Questions
What is Per Capita Income in Muir?
Per Capita income in Muir is $29,146.
What is the Median Family Income in Muir?
Median Family Income in Muir is $64,250.
What is the Median Household income in Muir?
Median Household Income in Muir is $49,297.
What is Income or Wage Gap in Muir?
Income or Wage Gap in Muir is 52.1%.
Women in Muir earn 47.9 cents for every dollar earned by a man.
What is Family Income Deficit in Muir?
Family Income Deficit in Muir is $12,464.
Families that are below poverty line in Muir earn $12,464 less on average than the poverty threshold level.
What is Inequality or Gini Index in Muir?
Inequality or Gini Index in Muir is 0.47.
What is the Total Population of Muir?
Total Population of Muir is 591.
What is the Total Male Population of Muir?
Total Male Population of Muir is 271.
What is the Total Female Population of Muir?
Total Female Population of Muir is 320.
What is the Ratio of Males per 100 Females in Muir?
There are 84.69 Males per 100 Females in Muir.
What is the Ratio of Females per 100 Males in Muir?
There are 118.08 Females per 100 Males in Muir.
What is the Median Population Age in Muir?
Median Population Age in Muir is 33.0 Years.
What is the Average Family Size in Muir
Average Family Size in Muir is 3.5 People.
What is the Average Household Size in Muir
Average Household Size in Muir is 2.4 People.
How Large is the Labor Force in Muir?
There are 292 People in the Labor Forcein in Muir.
What is the Percentage of People in the Labor Force in Muir?
64.6% of People are in the Labor Force in Muir.
What is the Unemployment Rate in Muir?
Unemployment Rate in Muir is 9.2%.