Mio, MI Map & Demographics
Mio Map
Mio Overview
$24,903
PER CAPITA INCOME
$46,420
AVG FAMILY INCOME
$43,750
AVG HOUSEHOLD INCOME
13.4%
WAGE / INCOME GAP [ % ]
86.6¢/ $1
WAGE / INCOME GAP [ $ ]
0.42
INEQUALITY / GINI INDEX
1,358
TOTAL POPULATION
616
MALE POPULATION
742
FEMALE POPULATION
83.02
MALES / 100 FEMALES
120.45
FEMALES / 100 MALES
42.8
MEDIAN AGE
2.9
AVG FAMILY SIZE
2.4
AVG HOUSEHOLD SIZE
638
LABOR FORCE [ PEOPLE ]
57.3%
PERCENT IN LABOR FORCE
15.5%
UNEMPLOYMENT RATE
Mio Zip Codes
Mio Area Codes
Income in Mio
Income Overview in Mio
Per Capita Income in Mio is $24,903, while median incomes of families and households are $46,420 and $43,750 respectively.
| Characteristic | Number | Measure |
| Per Capita Income | 1,358 | $24,903 |
| Median Family Income | 366 | $46,420 |
| Mean Family Income | 366 | $63,050 |
| Median Household Income | 577 | $43,750 |
| Mean Household Income | 577 | $56,293 |
| Income Deficit | 366 | $0 |
| Wage / Income Gap (%) | 1,358 | 13.39% |
| Wage / Income Gap ($) | 1,358 | 86.61¢ per $1 |
| Gini / Inequality Index | 1,358 | 0.42 |
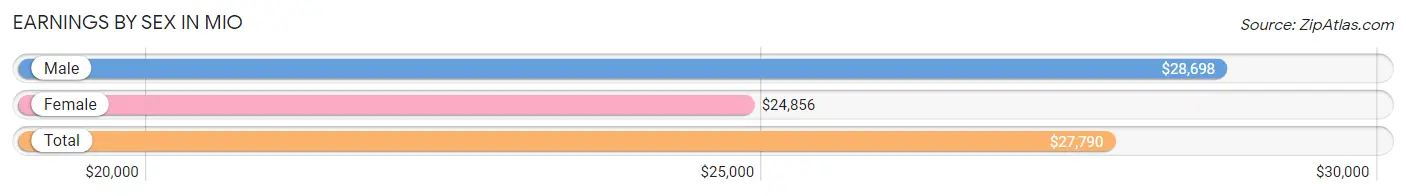
Earnings by Sex in Mio
Average Earnings in Mio are $27,790, $28,698 for men and $24,856 for women, a difference of 13.4%.
| Sex | Number | Average Earnings |
| Male | 291 (44.8%) | $28,698 |
| Female | 359 (55.2%) | $24,856 |
| Total | 650 (100.0%) | $27,790 |
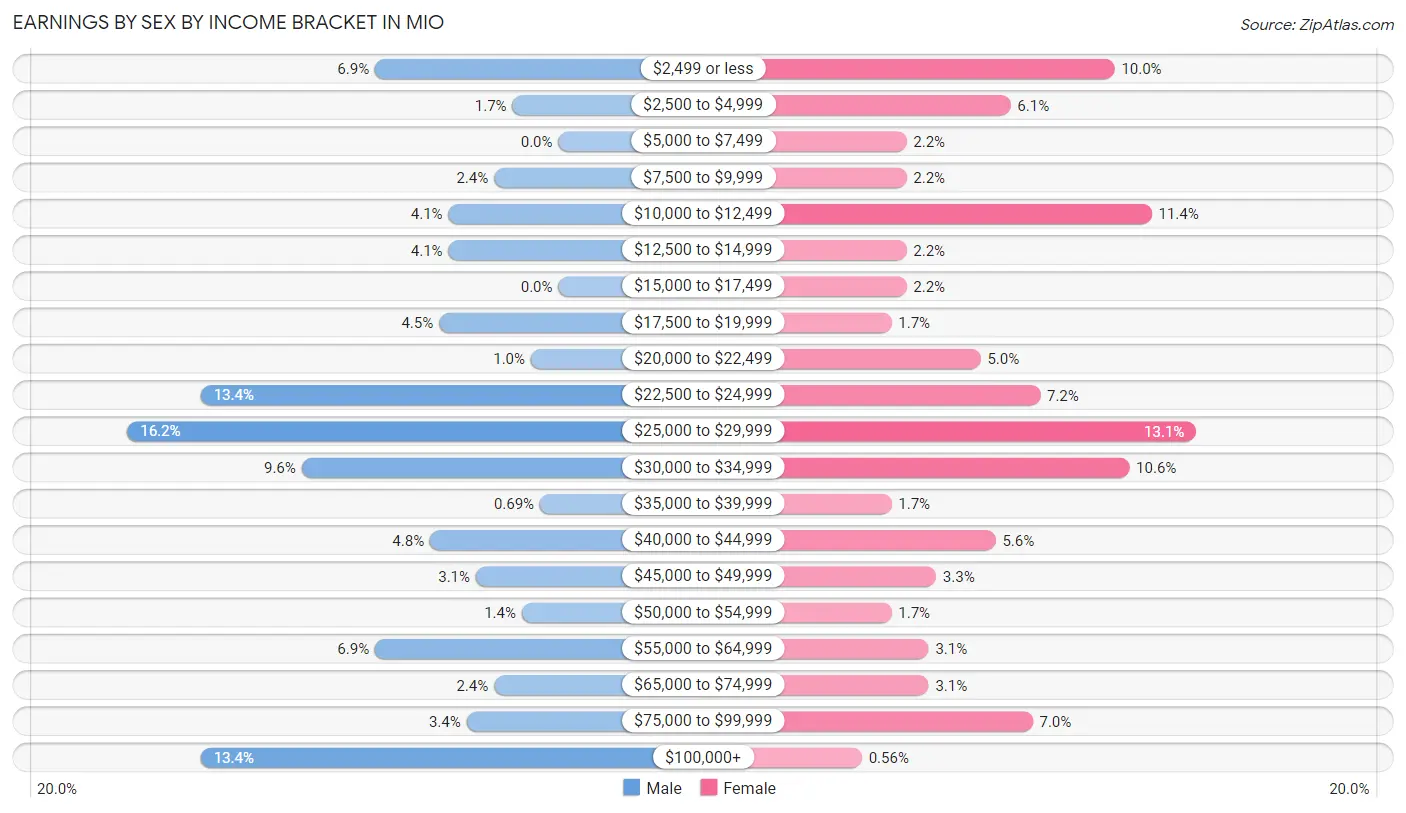
Earnings by Sex by Income Bracket in Mio
The most common earnings brackets in Mio are $25,000 to $29,999 for men (47 | 16.2%) and $25,000 to $29,999 for women (47 | 13.1%).
| Income | Male | Female |
| $2,499 or less | 20 (6.9%) | 36 (10.0%) |
| $2,500 to $4,999 | 5 (1.7%) | 22 (6.1%) |
| $5,000 to $7,499 | 0 (0.0%) | 8 (2.2%) |
| $7,500 to $9,999 | 7 (2.4%) | 8 (2.2%) |
| $10,000 to $12,499 | 12 (4.1%) | 41 (11.4%) |
| $12,500 to $14,999 | 12 (4.1%) | 8 (2.2%) |
| $15,000 to $17,499 | 0 (0.0%) | 8 (2.2%) |
| $17,500 to $19,999 | 13 (4.5%) | 6 (1.7%) |
| $20,000 to $22,499 | 3 (1.0%) | 18 (5.0%) |
| $22,500 to $24,999 | 39 (13.4%) | 26 (7.2%) |
| $25,000 to $29,999 | 47 (16.2%) | 47 (13.1%) |
| $30,000 to $34,999 | 28 (9.6%) | 38 (10.6%) |
| $35,000 to $39,999 | 2 (0.7%) | 6 (1.7%) |
| $40,000 to $44,999 | 14 (4.8%) | 20 (5.6%) |
| $45,000 to $49,999 | 9 (3.1%) | 12 (3.3%) |
| $50,000 to $54,999 | 4 (1.4%) | 6 (1.7%) |
| $55,000 to $64,999 | 20 (6.9%) | 11 (3.1%) |
| $65,000 to $74,999 | 7 (2.4%) | 11 (3.1%) |
| $75,000 to $99,999 | 10 (3.4%) | 25 (7.0%) |
| $100,000+ | 39 (13.4%) | 2 (0.6%) |
| Total | 291 (100.0%) | 359 (100.0%) |
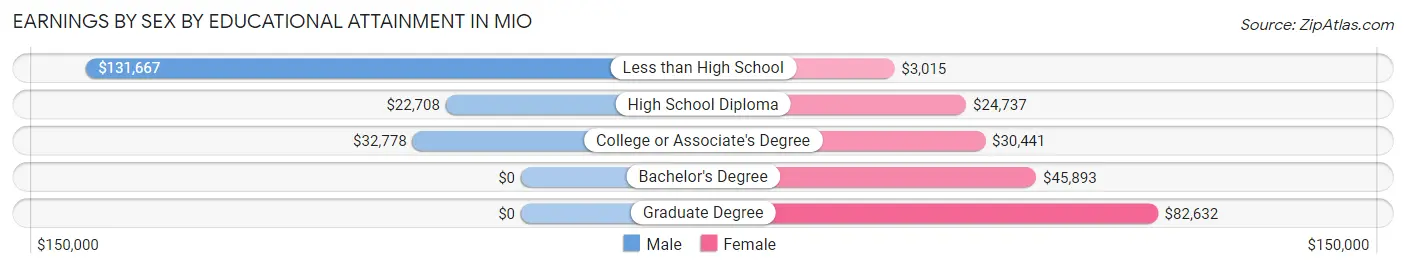
Earnings by Sex by Educational Attainment in Mio
Average earnings in Mio are $31,806 for men and $28,000 for women, a difference of 12.0%. Men with an educational attainment of less than high school enjoy the highest average annual earnings of $131,667, while those with high school diploma education earn the least with $22,708. Women with an educational attainment of graduate degree earn the most with the average annual earnings of $82,632, while those with less than high school education have the smallest earnings of $3,015.
| Educational Attainment | Male Income | Female Income |
| Less than High School | $131,667 | $3,015 |
| High School Diploma | $22,708 | $24,737 |
| College or Associate's Degree | $32,778 | $30,441 |
| Bachelor's Degree | - | - |
| Graduate Degree | - | - |
| Total | $31,806 | $28,000 |
Family Income in Mio
Family Income Brackets in Mio
According to the Mio family income data, there are 121 families falling into the $35,000 to $49,999 income range, which is the most common income bracket and makes up 33.1% of all families. Conversely, the $200,000+ income bracket is the least frequent group with only 9 families (2.5%) belonging to this category.
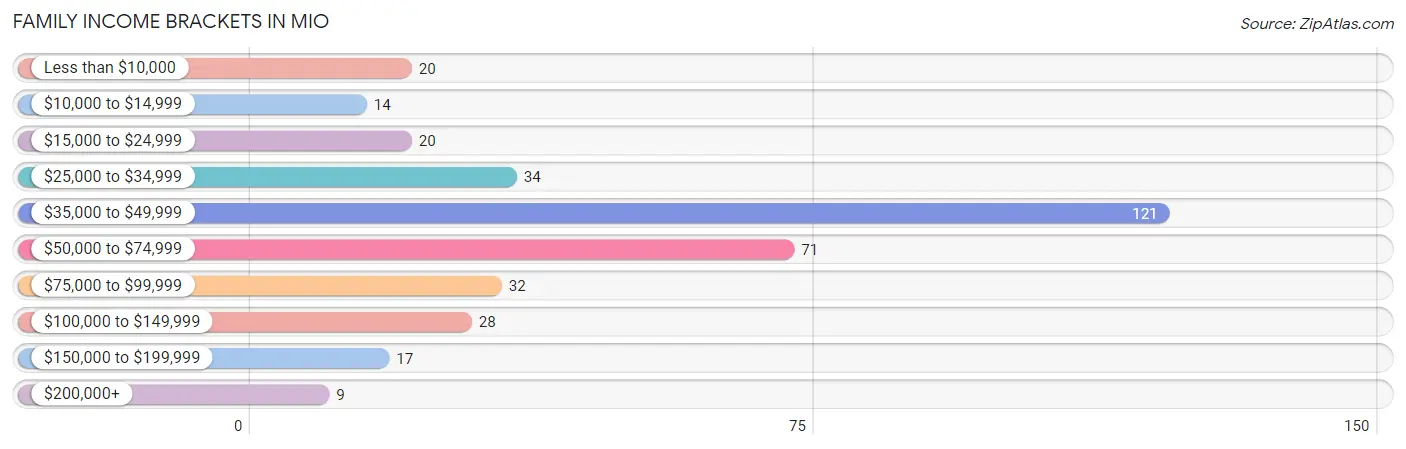
| Income Bracket | # Families | % Families |
| Less than $10,000 | 20 | 5.5% |
| $10,000 to $14,999 | 14 | 3.8% |
| $15,000 to $24,999 | 20 | 5.5% |
| $25,000 to $34,999 | 34 | 9.3% |
| $35,000 to $49,999 | 121 | 33.1% |
| $50,000 to $74,999 | 71 | 19.4% |
| $75,000 to $99,999 | 32 | 8.7% |
| $100,000 to $149,999 | 28 | 7.7% |
| $150,000 to $199,999 | 17 | 4.6% |
| $200,000+ | 9 | 2.5% |
Family Income by Famaliy Size in Mio
3-person families (60 | 16.4%) account for the highest median family income in Mio with $60,625 per family, while 2-person families (223 | 60.9%) have the highest median income of $22,890 per family member.
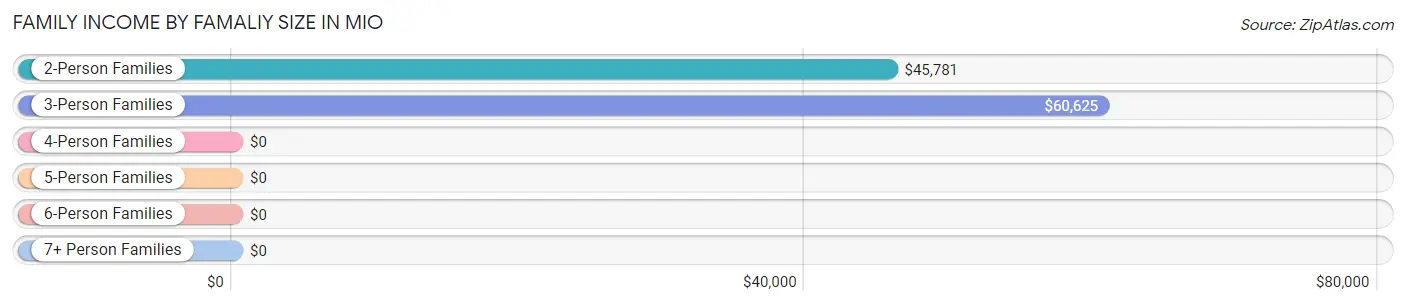
| Income Bracket | # Families | Median Income |
| 2-Person Families | 223 (60.9%) | $45,781 |
| 3-Person Families | 60 (16.4%) | $60,625 |
| 4-Person Families | 15 (4.1%) | $0 |
| 5-Person Families | 68 (18.6%) | $0 |
| 6-Person Families | 0 (0.0%) | $0 |
| 7+ Person Families | 0 (0.0%) | $0 |
| Total | 366 (100.0%) | $46,420 |
Family Income by Number of Earners in Mio
The median family income in Mio is $46,420, with families comprising 3+ earners (27) having the highest median family income of $185,250, while families with no earners (73) have the lowest median family income of $28,906, accounting for 7.4% and 20.0% of families, respectively.
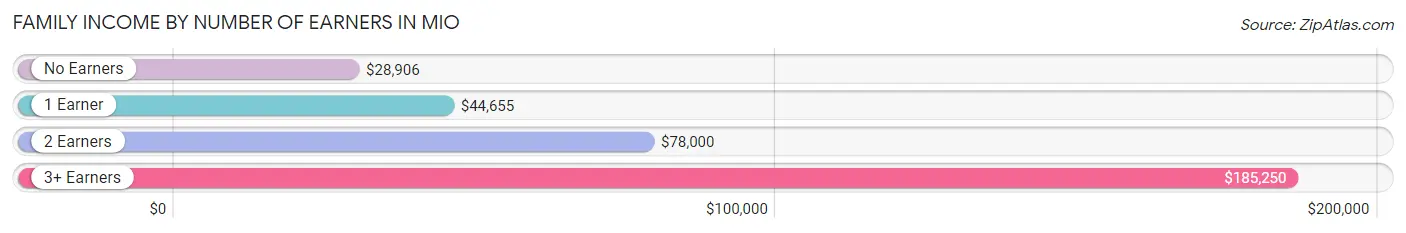
| Number of Earners | # Families | Median Income |
| No Earners | 73 (20.0%) | $28,906 |
| 1 Earner | 158 (43.2%) | $44,655 |
| 2 Earners | 108 (29.5%) | $78,000 |
| 3+ Earners | 27 (7.4%) | $185,250 |
| Total | 366 (100.0%) | $46,420 |
Household Income in Mio
Household Income Brackets in Mio
With 136 households falling in the category, the $35,000 to $49,999 income range is the most frequent in Mio, accounting for 23.6% of all households. In contrast, only 14 households (2.4%) fall into the $200,000+ income bracket, making it the least populous group.
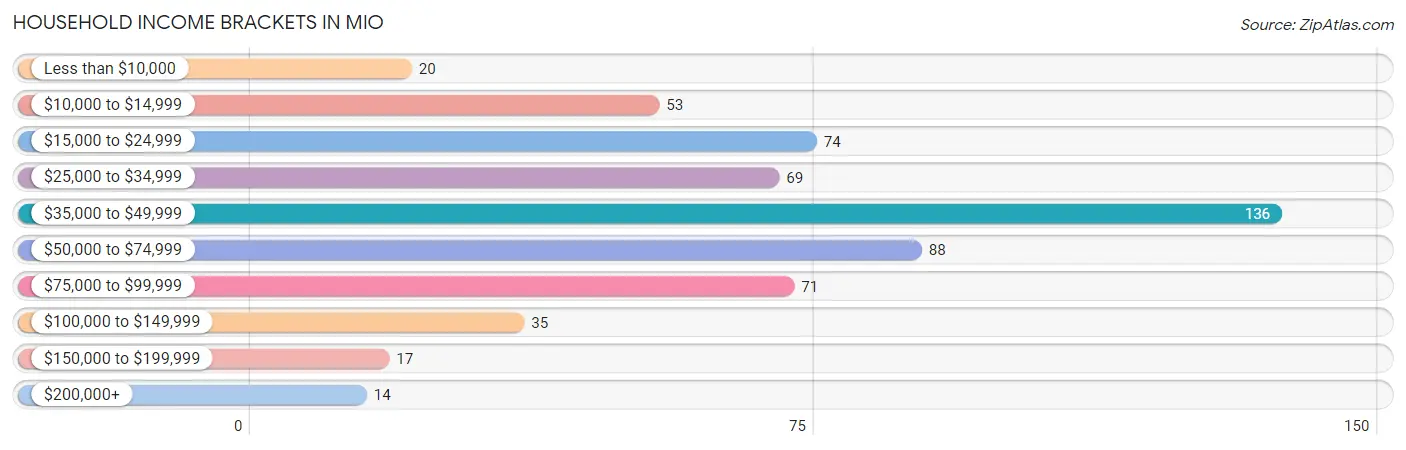
| Income Bracket | # Households | % Households |
| Less than $10,000 | 20 | 3.5% |
| $10,000 to $14,999 | 53 | 9.2% |
| $15,000 to $24,999 | 74 | 12.8% |
| $25,000 to $34,999 | 69 | 12.0% |
| $35,000 to $49,999 | 136 | 23.6% |
| $50,000 to $74,999 | 88 | 15.3% |
| $75,000 to $99,999 | 71 | 12.3% |
| $100,000 to $149,999 | 35 | 6.1% |
| $150,000 to $199,999 | 17 | 2.9% |
| $200,000+ | 14 | 2.4% |
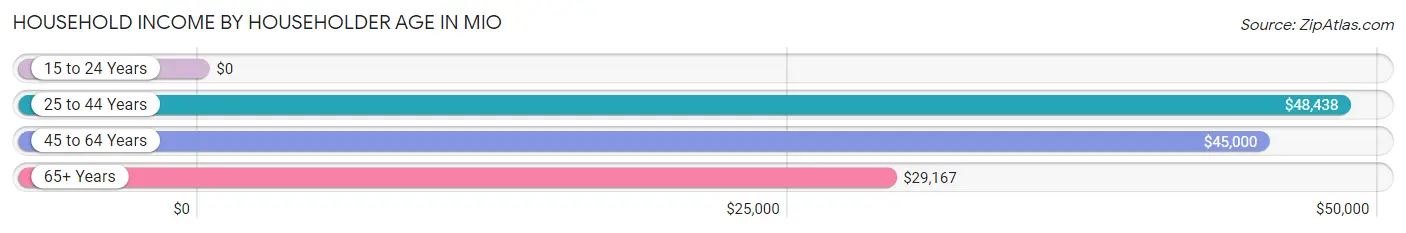
Household Income by Householder Age in Mio
The median household income in Mio is $43,750, with the highest median household income of $48,438 found in the 25 to 44 years age bracket for the primary householder. A total of 146 households (25.3%) fall into this category. Meanwhile, the 15 to 24 years age bracket for the primary householder has the lowest median household income of $0, with 1 households (0.2%) in this group.
| Income Bracket | # Households | Median Income |
| 15 to 24 Years | 1 (0.2%) | $0 |
| 25 to 44 Years | 146 (25.3%) | $48,438 |
| 45 to 64 Years | 220 (38.1%) | $45,000 |
| 65+ Years | 210 (36.4%) | $29,167 |
| Total | 577 (100.0%) | $43,750 |
Poverty in Mio
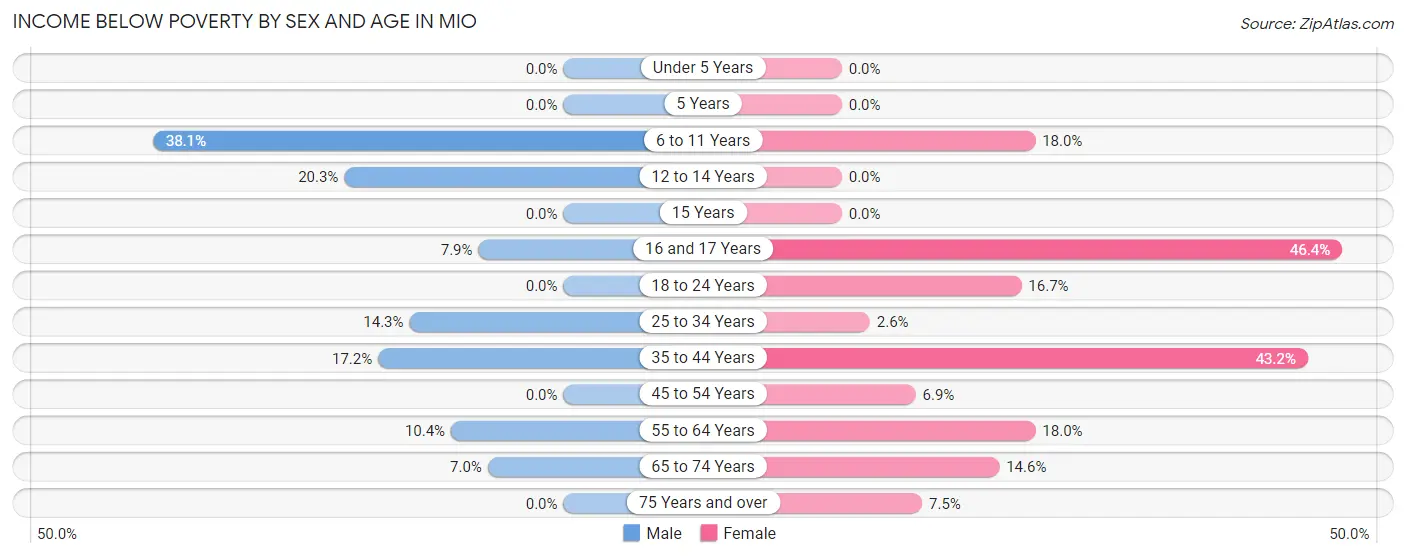
Income Below Poverty by Sex and Age in Mio
With 11.0% poverty level for males and 15.1% for females among the residents of Mio, 6 to 11 year old males and 16 and 17 year old females are the most vulnerable to poverty, with 8 males (38.1%) and 13 females (46.4%) in their respective age groups living below the poverty level.
| Age Bracket | Male | Female |
| Under 5 Years | 0 (0.0%) | 0 (0.0%) |
| 5 Years | 0 (0.0%) | 0 (0.0%) |
| 6 to 11 Years | 8 (38.1%) | 7 (17.9%) |
| 12 to 14 Years | 12 (20.3%) | 0 (0.0%) |
| 15 Years | 0 (0.0%) | 0 (0.0%) |
| 16 and 17 Years | 3 (7.9%) | 13 (46.4%) |
| 18 to 24 Years | 0 (0.0%) | 10 (16.7%) |
| 25 to 34 Years | 12 (14.3%) | 2 (2.6%) |
| 35 to 44 Years | 16 (17.2%) | 32 (43.2%) |
| 45 to 54 Years | 0 (0.0%) | 5 (6.9%) |
| 55 to 64 Years | 12 (10.4%) | 23 (18.0%) |
| 65 to 74 Years | 4 (7.0%) | 13 (14.6%) |
| 75 Years and over | 0 (0.0%) | 7 (7.4%) |
| Total | 67 (11.0%) | 112 (15.1%) |
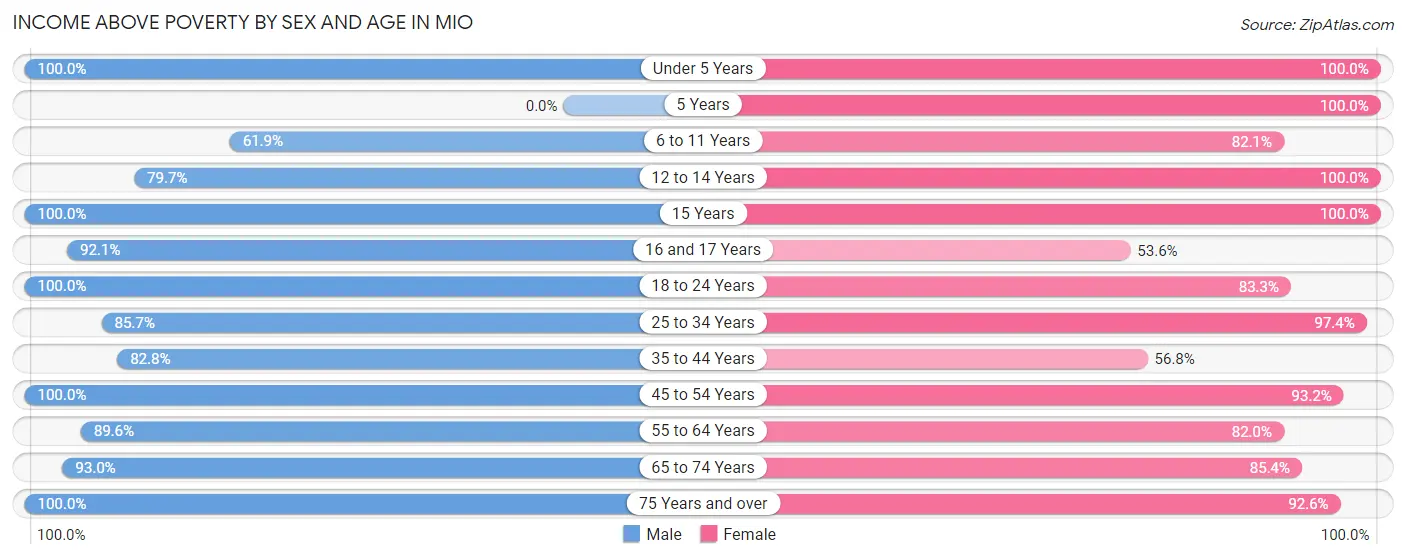
Income Above Poverty by Sex and Age in Mio
According to the poverty statistics in Mio, males aged under 5 years and females aged under 5 years are the age groups that are most secure financially, with 100.0% of males and 100.0% of females in these age groups living above the poverty line.
| Age Bracket | Male | Female |
| Under 5 Years | 39 (100.0%) | 31 (100.0%) |
| 5 Years | 0 (0.0%) | 4 (100.0%) |
| 6 to 11 Years | 13 (61.9%) | 32 (82.1%) |
| 12 to 14 Years | 47 (79.7%) | 33 (100.0%) |
| 15 Years | 1 (100.0%) | 12 (100.0%) |
| 16 and 17 Years | 35 (92.1%) | 15 (53.6%) |
| 18 to 24 Years | 23 (100.0%) | 50 (83.3%) |
| 25 to 34 Years | 72 (85.7%) | 75 (97.4%) |
| 35 to 44 Years | 77 (82.8%) | 42 (56.8%) |
| 45 to 54 Years | 42 (100.0%) | 68 (93.1%) |
| 55 to 64 Years | 103 (89.6%) | 105 (82.0%) |
| 65 to 74 Years | 53 (93.0%) | 76 (85.4%) |
| 75 Years and over | 38 (100.0%) | 87 (92.5%) |
| Total | 543 (89.0%) | 630 (84.9%) |
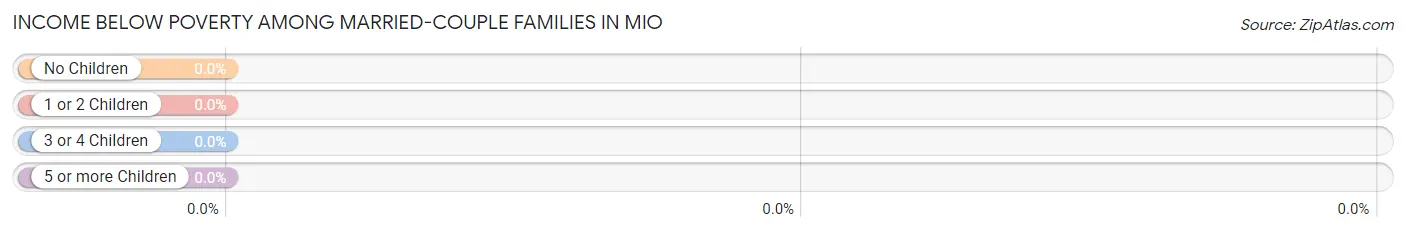
Income Below Poverty Among Married-Couple Families in Mio
| Children | Above Poverty | Below Poverty |
| No Children | 138 (100.0%) | 0 (0.0%) |
| 1 or 2 Children | 34 (100.0%) | 0 (0.0%) |
| 3 or 4 Children | 31 (100.0%) | 0 (0.0%) |
| 5 or more Children | 0 (0.0%) | 0 (0.0%) |
| Total | 203 (100.0%) | 0 (0.0%) |
Income Below Poverty Among Single-Parent Households in Mio
According to the poverty data in Mio, 23.4% or 15 single-father households and 19.2% or 19 single-mother households are living below the poverty line. Among single-father households, those with 1 or 2 children have the highest poverty rate, with 12 households (75.0%) experiencing poverty. Likewise, among single-mother households, those with 3 or 4 children have the highest poverty rate, with 8 households (40.0%) falling below the poverty line.
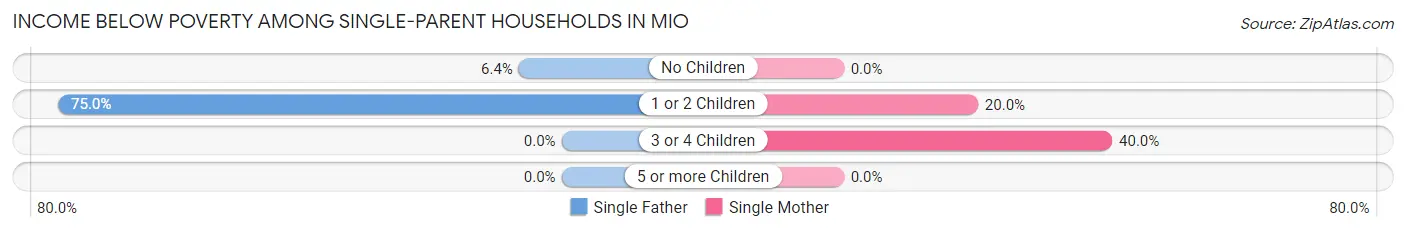
| Children | Single Father | Single Mother |
| No Children | 3 (6.4%) | 0 (0.0%) |
| 1 or 2 Children | 12 (75.0%) | 11 (20.0%) |
| 3 or 4 Children | 0 (0.0%) | 8 (40.0%) |
| 5 or more Children | 0 (0.0%) | 0 (0.0%) |
| Total | 15 (23.4%) | 19 (19.2%) |
Income Below Poverty Among Married-Couple vs Single-Parent Households in Mio
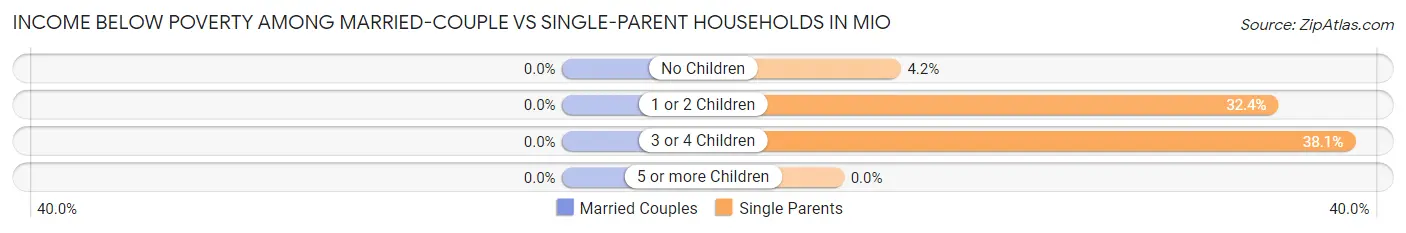
| Children | Married-Couple Families | Single-Parent Households |
| No Children | 0 (0.0%) | 3 (4.2%) |
| 1 or 2 Children | 0 (0.0%) | 23 (32.4%) |
| 3 or 4 Children | 0 (0.0%) | 8 (38.1%) |
| 5 or more Children | 0 (0.0%) | 0 (0.0%) |
| Total | 0 (0.0%) | 34 (20.9%) |
Race in Mio
The most populous races in Mio are White / Caucasian (1,226 | 90.3%), Two or more Races (75 | 5.5%), and Hispanic or Latino (50 | 3.7%).
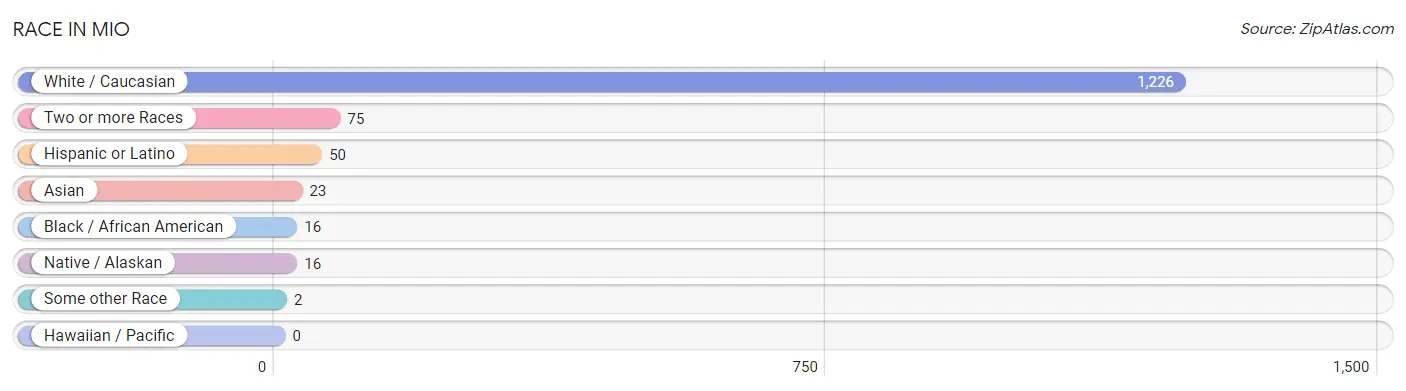
| Race | # Population | % Population |
| Asian | 23 | 1.7% |
| Black / African American | 16 | 1.2% |
| Hawaiian / Pacific | 0 | 0.0% |
| Hispanic or Latino | 50 | 3.7% |
| Native / Alaskan | 16 | 1.2% |
| White / Caucasian | 1,226 | 90.3% |
| Two or more Races | 75 | 5.5% |
| Some other Race | 2 | 0.2% |
| Total | 1,358 | 100.0% |
Ancestry in Mio
The most populous ancestries reported in Mio are German (368 | 27.1%), English (218 | 16.1%), Dutch (89 | 6.6%), Polish (82 | 6.0%), and Irish (80 | 5.9%), together accounting for 61.6% of all Mio residents.
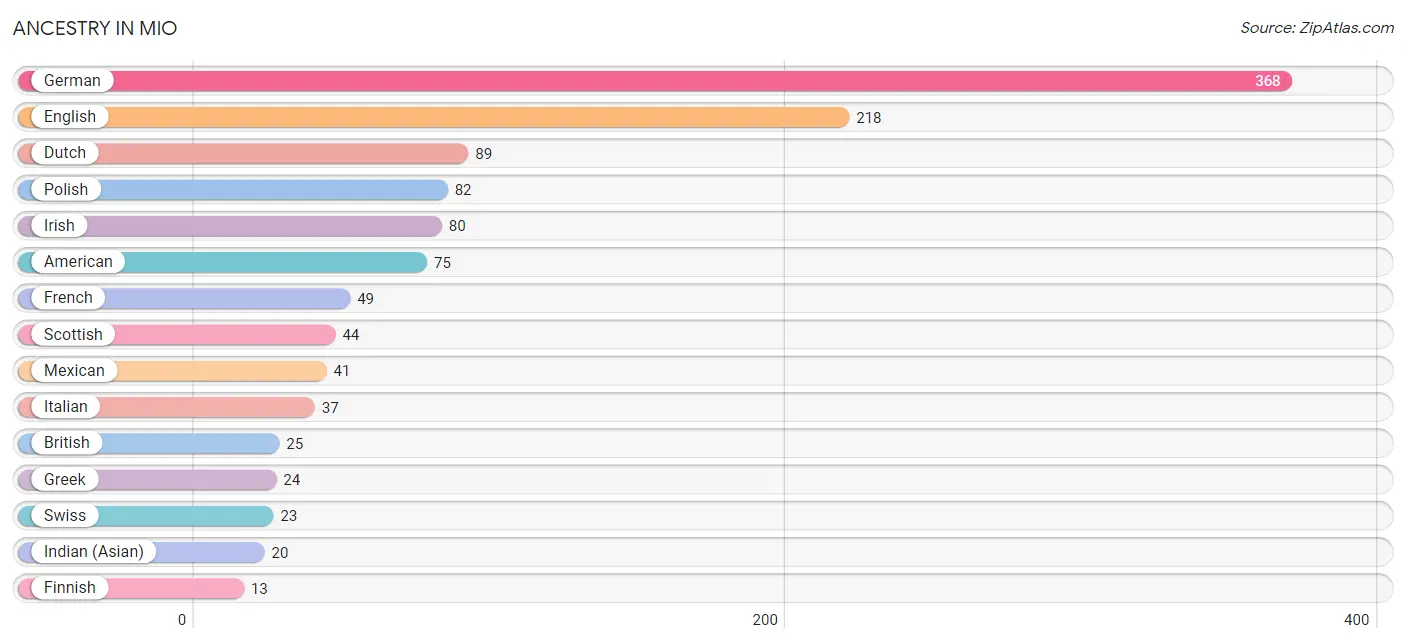
| Ancestry | # Population | % Population |
| American | 75 | 5.5% |
| Austrian | 4 | 0.3% |
| British | 25 | 1.8% |
| Central American | 3 | 0.2% |
| Central American Indian | 3 | 0.2% |
| Cherokee | 4 | 0.3% |
| Cuban | 2 | 0.2% |
| Czech | 4 | 0.3% |
| Dutch | 89 | 6.6% |
| English | 218 | 16.1% |
| European | 2 | 0.2% |
| Finnish | 13 | 1.0% |
| French | 49 | 3.6% |
| French Canadian | 12 | 0.9% |
| German | 368 | 27.1% |
| Greek | 24 | 1.8% |
| Honduran | 3 | 0.2% |
| Hungarian | 10 | 0.7% |
| Indian (Asian) | 20 | 1.5% |
| Irish | 80 | 5.9% |
| Italian | 37 | 2.7% |
| Korean | 3 | 0.2% |
| Mexican | 41 | 3.0% |
| Norwegian | 5 | 0.4% |
| Polish | 82 | 6.0% |
| Potawatomi | 13 | 1.0% |
| Puerto Rican | 4 | 0.3% |
| Scandinavian | 9 | 0.7% |
| Scotch-Irish | 2 | 0.2% |
| Scottish | 44 | 3.2% |
| Slovak | 4 | 0.3% |
| Swedish | 2 | 0.2% |
| Swiss | 23 | 1.7% |
| U.S. Virgin Islander | 4 | 0.3% | View All 34 Rows |
Immigrants in Mio
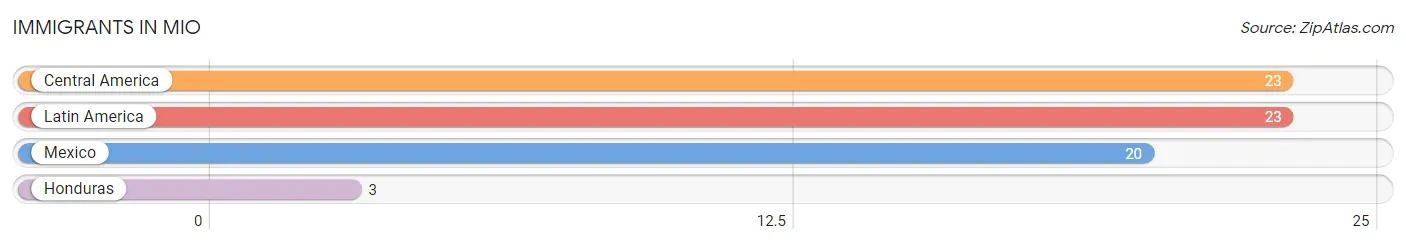
The most numerous immigrant groups reported in Mio came from Central America (23 | 1.7%), Latin America (23 | 1.7%), Mexico (20 | 1.5%), and Honduras (3 | 0.2%), together accounting for 5.1% of all Mio residents.
| Immigration Origin | # Population | % Population |
| Central America | 23 | 1.7% |
| Honduras | 3 | 0.2% |
| Latin America | 23 | 1.7% |
| Mexico | 20 | 1.5% | View All 4 Rows |
Sex and Age in Mio
Sex and Age in Mio
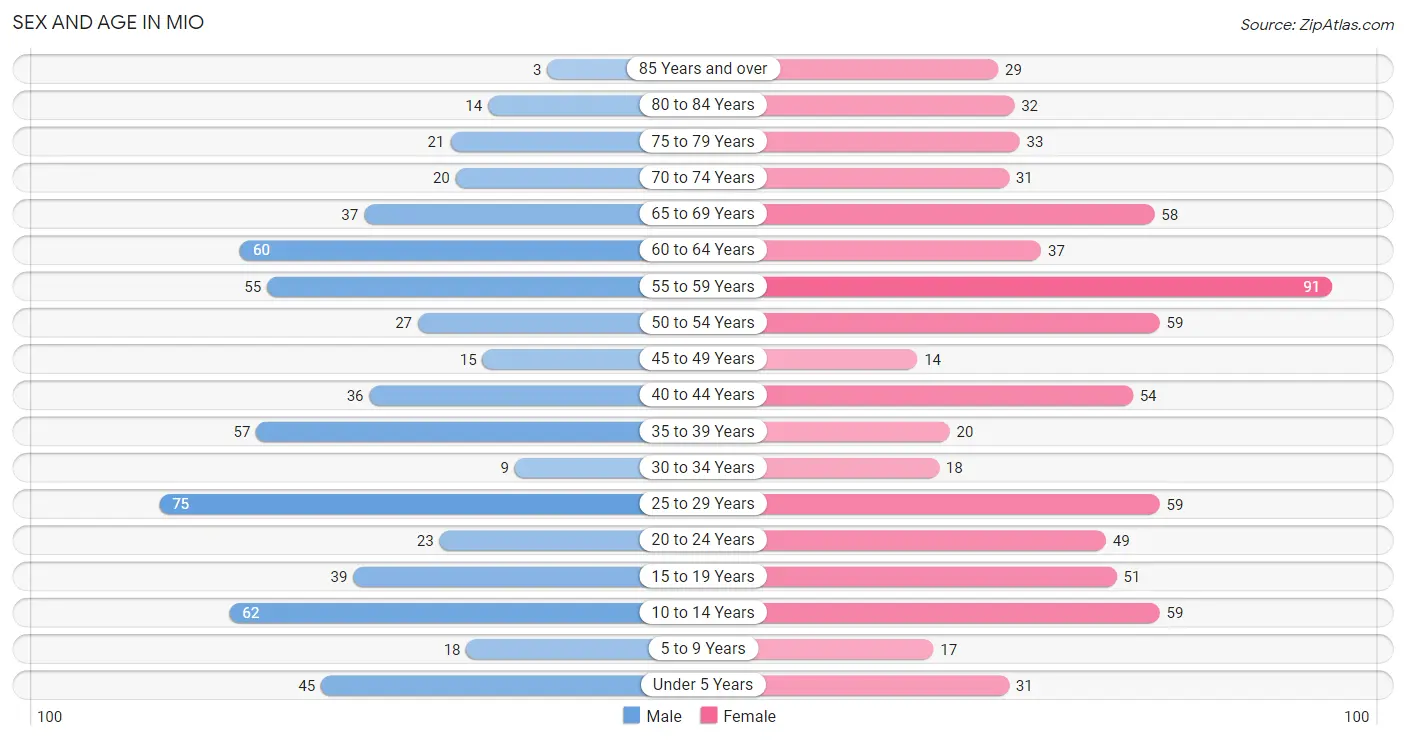
The most populous age groups in Mio are 25 to 29 Years (75 | 12.2%) for men and 55 to 59 Years (91 | 12.3%) for women.
| Age Bracket | Male | Female |
| Under 5 Years | 45 (7.3%) | 31 (4.2%) |
| 5 to 9 Years | 18 (2.9%) | 17 (2.3%) |
| 10 to 14 Years | 62 (10.1%) | 59 (8.0%) |
| 15 to 19 Years | 39 (6.3%) | 51 (6.9%) |
| 20 to 24 Years | 23 (3.7%) | 49 (6.6%) |
| 25 to 29 Years | 75 (12.2%) | 59 (8.0%) |
| 30 to 34 Years | 9 (1.5%) | 18 (2.4%) |
| 35 to 39 Years | 57 (9.2%) | 20 (2.7%) |
| 40 to 44 Years | 36 (5.8%) | 54 (7.3%) |
| 45 to 49 Years | 15 (2.4%) | 14 (1.9%) |
| 50 to 54 Years | 27 (4.4%) | 59 (8.0%) |
| 55 to 59 Years | 55 (8.9%) | 91 (12.3%) |
| 60 to 64 Years | 60 (9.7%) | 37 (5.0%) |
| 65 to 69 Years | 37 (6.0%) | 58 (7.8%) |
| 70 to 74 Years | 20 (3.3%) | 31 (4.2%) |
| 75 to 79 Years | 21 (3.4%) | 33 (4.4%) |
| 80 to 84 Years | 14 (2.3%) | 32 (4.3%) |
| 85 Years and over | 3 (0.5%) | 29 (3.9%) |
| Total | 616 (100.0%) | 742 (100.0%) |
Families and Households in Mio
Median Family Size in Mio
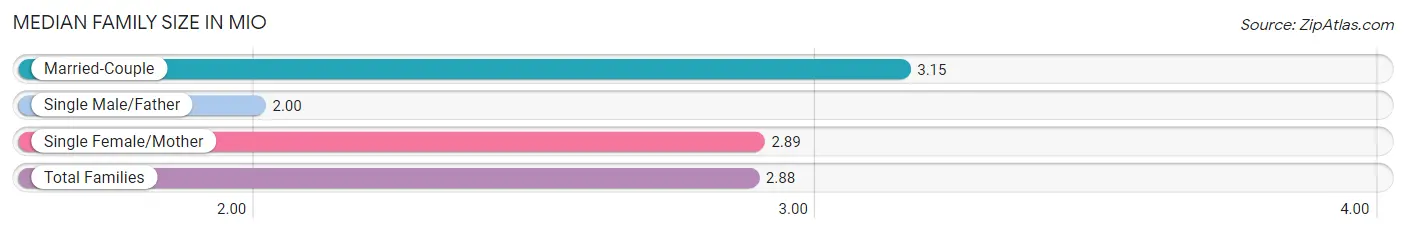
The median family size in Mio is 2.88 persons per family, with married-couple families (203 | 55.5%) accounting for the largest median family size of 3.15 persons per family. On the other hand, single male/father families (64 | 17.5%) represent the smallest median family size with 2.00 persons per family.
| Family Type | # Families | Family Size |
| Married-Couple | 203 (55.5%) | 3.15 |
| Single Male/Father | 64 (17.5%) | 2.00 |
| Single Female/Mother | 99 (27.1%) | 2.89 |
| Total Families | 366 (100.0%) | 2.88 |
Median Household Size in Mio
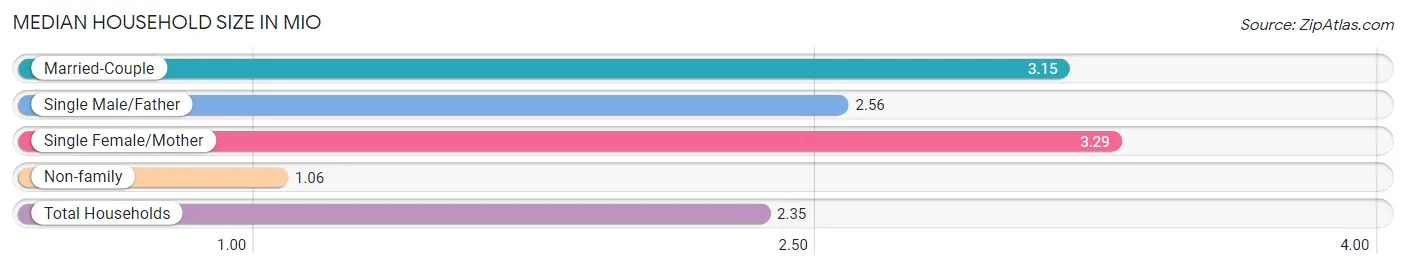
The median household size in Mio is 2.35 persons per household, with single female/mother households (99 | 17.2%) accounting for the largest median household size of 3.29 persons per household. non-family households (211 | 36.6%) represent the smallest median household size with 1.06 persons per household.
| Household Type | # Households | Household Size |
| Married-Couple | 203 (35.2%) | 3.15 |
| Single Male/Father | 64 (11.1%) | 2.56 |
| Single Female/Mother | 99 (17.2%) | 3.29 |
| Non-family | 211 (36.6%) | 1.06 |
| Total Households | 577 (100.0%) | 2.35 |
Household Size by Marriage Status in Mio
Out of a total of 577 households in Mio, 366 (63.4%) are family households, while 211 (36.6%) are nonfamily households. The most numerous type of family households are 2-person households, comprising 181, and the most common type of nonfamily households are 1-person households, comprising 196.
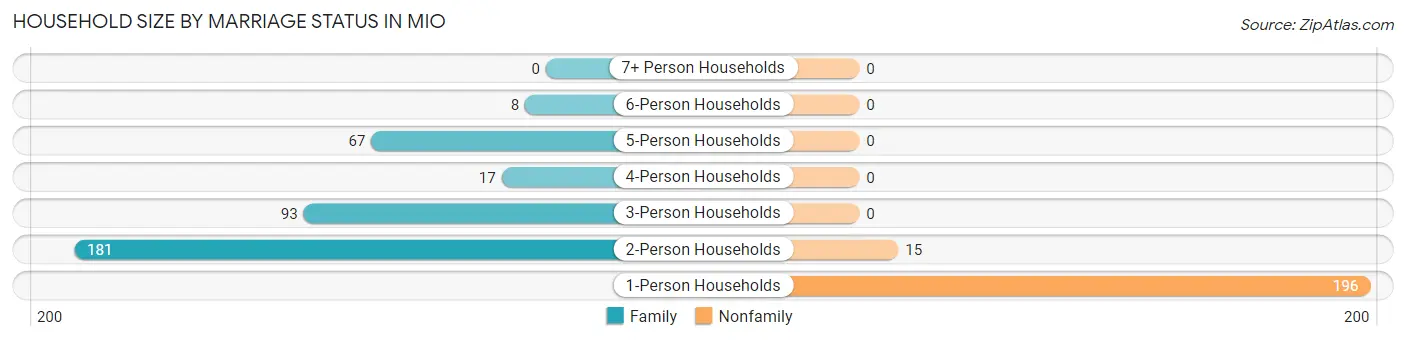
| Household Size | Family Households | Nonfamily Households |
| 1-Person Households | - | 196 (34.0%) |
| 2-Person Households | 181 (31.4%) | 15 (2.6%) |
| 3-Person Households | 93 (16.1%) | 0 (0.0%) |
| 4-Person Households | 17 (2.9%) | 0 (0.0%) |
| 5-Person Households | 67 (11.6%) | 0 (0.0%) |
| 6-Person Households | 8 (1.4%) | 0 (0.0%) |
| 7+ Person Households | 0 (0.0%) | 0 (0.0%) |
| Total | 366 (63.4%) | 211 (36.6%) |
Female Fertility in Mio
Fertility by Age in Mio
Average fertility rate in Mio is 25.0 births per 1,000 women. Women in the age bracket of 20 to 34 years have the highest fertility rate with 56.0 births per 1,000 women. Women in the age bracket of 20 to 34 years acount for 100.0% of all women with births.
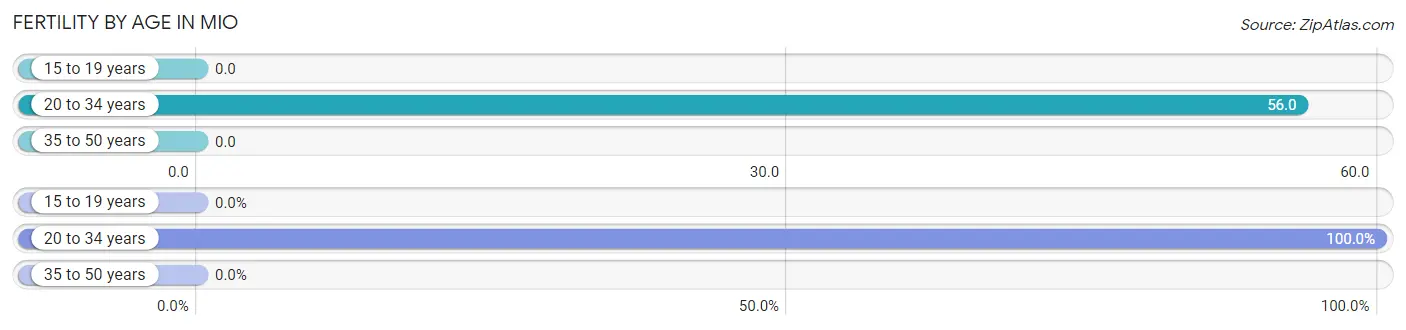
| Age Bracket | Women with Births | Births / 1,000 Women |
| 15 to 19 years | 0 (0.0%) | 0.0 |
| 20 to 34 years | 7 (100.0%) | 56.0 |
| 35 to 50 years | 0 (0.0%) | 0.0 |
| Total | 7 (100.0%) | 25.0 |
Fertility by Age by Marriage Status in Mio
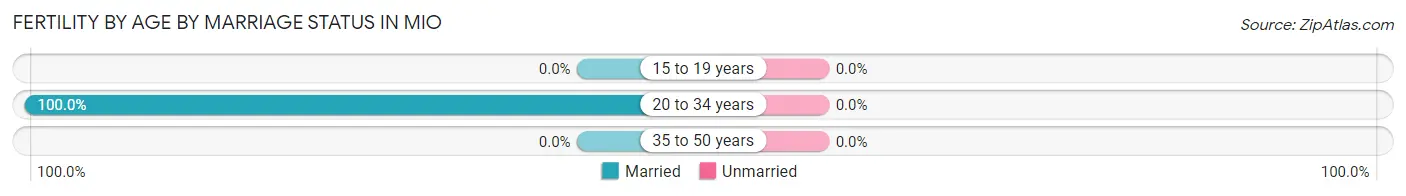
| Age Bracket | Married | Unmarried |
| 15 to 19 years | 0 (0.0%) | 0 (0.0%) |
| 20 to 34 years | 7 (100.0%) | 0 (0.0%) |
| 35 to 50 years | 0 (0.0%) | 0 (0.0%) |
| Total | 7 (100.0%) | 0 (0.0%) |
Fertility by Education in Mio

| Educational Attainment | Women with Births | Births / 1,000 Women |
| Less than High School | 0 (0.0%) | 0.0 |
| High School Diploma | 0 (0.0%) | 0.0 |
| College or Associate's Degree | 0 (0.0%) | 0.0 |
| Bachelor's Degree | 7 (100.0%) | 538.0 |
| Graduate Degree | 0 (0.0%) | 0.0 |
| Total | 7 (100.0%) | 25.0 |
Fertility by Education by Marriage Status in Mio
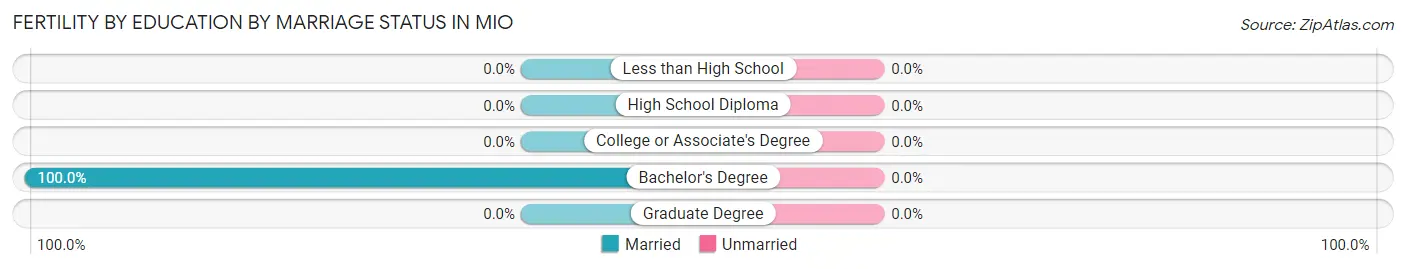
| Educational Attainment | Married | Unmarried |
| Less than High School | 0 (0.0%) | 0 (0.0%) |
| High School Diploma | 0 (0.0%) | 0 (0.0%) |
| College or Associate's Degree | 0 (0.0%) | 0 (0.0%) |
| Bachelor's Degree | 7 (100.0%) | 0 (0.0%) |
| Graduate Degree | 0 (0.0%) | 0 (0.0%) |
| Total | 7 (100.0%) | 0 (0.0%) |
Employment Characteristics in Mio
Employment by Class of Employer in Mio
Among the 508 employed individuals in Mio, private company employees (372 | 73.2%), local government employees (67 | 13.2%), and self-employed (not incorporated) (22 | 4.3%) make up the most common classes of employment.
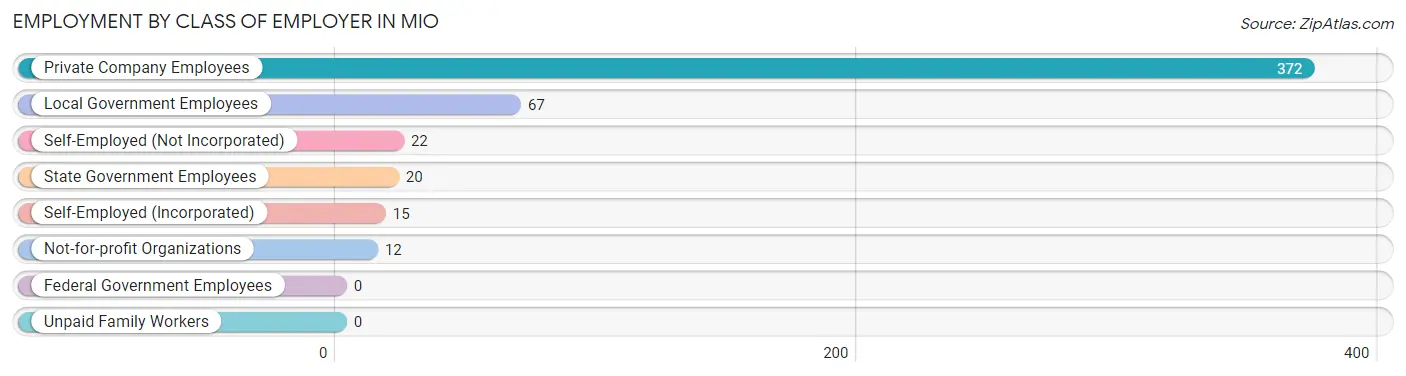
| Employer Class | # Employees | % Employees |
| Private Company Employees | 372 | 73.2% |
| Self-Employed (Incorporated) | 15 | 2.9% |
| Self-Employed (Not Incorporated) | 22 | 4.3% |
| Not-for-profit Organizations | 12 | 2.4% |
| Local Government Employees | 67 | 13.2% |
| State Government Employees | 20 | 3.9% |
| Federal Government Employees | 0 | 0.0% |
| Unpaid Family Workers | 0 | 0.0% |
| Total | 508 | 100.0% |
Employment Status by Age in Mio
According to the labor force statistics for Mio, out of the total population over 16 years of age (1,113), 57.3% or 638 individuals are in the labor force, with 15.5% or 99 of them unemployed. The age group with the highest labor force participation rate is 25 to 29 years, with 96.3% or 129 individuals in the labor force. Within the labor force, the 75 years and over age range has the highest percentage of unemployed individuals, with 77.8% or 7 of them being unemployed.
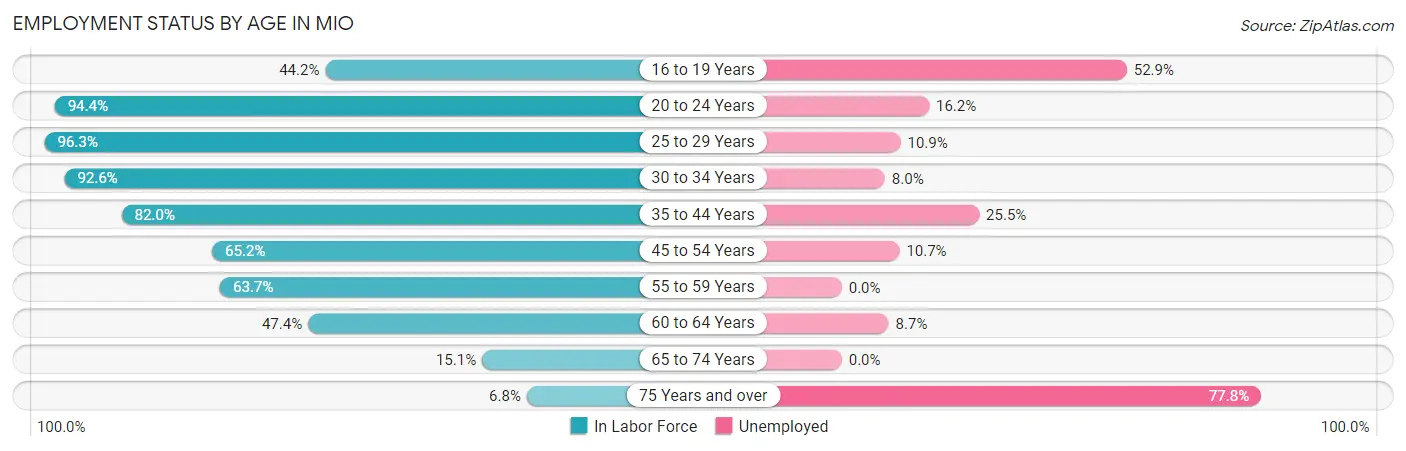
| Age Bracket | In Labor Force | Unemployed |
| 16 to 19 Years | 34 (44.2%) | 18 (52.9%) |
| 20 to 24 Years | 68 (94.4%) | 11 (16.2%) |
| 25 to 29 Years | 129 (96.3%) | 14 (10.9%) |
| 30 to 34 Years | 25 (92.6%) | 2 (8.0%) |
| 35 to 44 Years | 137 (82.0%) | 35 (25.5%) |
| 45 to 54 Years | 75 (65.2%) | 8 (10.7%) |
| 55 to 59 Years | 93 (63.7%) | 0 (0.0%) |
| 60 to 64 Years | 46 (47.4%) | 4 (8.7%) |
| 65 to 74 Years | 22 (15.1%) | 0 (0.0%) |
| 75 Years and over | 9 (6.8%) | 7 (77.8%) |
| Total | 638 (57.3%) | 99 (15.5%) |
Employment Status by Educational Attainment in Mio
According to labor force statistics for Mio, 73.6% of individuals (505) out of the total population between 25 and 64 years of age (686) are in the labor force, with 12.5% or 63 of them being unemployed. The group with the highest labor force participation rate are those with the educational attainment of college / associate degree, with 80.6% or 225 individuals in the labor force. Within the labor force, individuals with less than high school education have the highest percentage of unemployment, with 54.2% or 26 of them being unemployed.
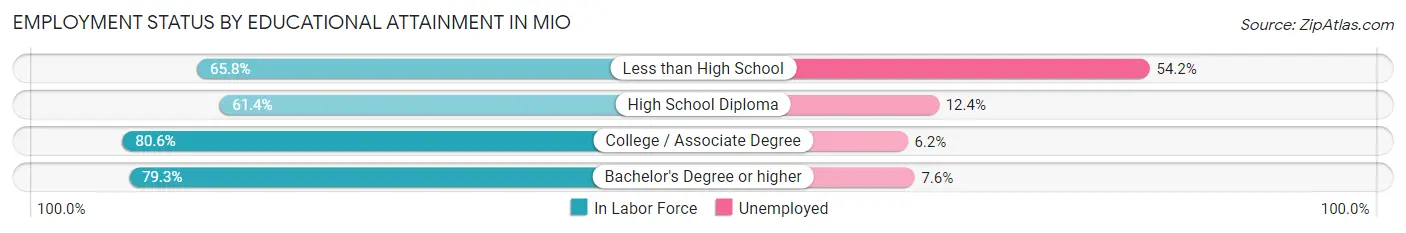
| Educational Attainment | In Labor Force | Unemployed |
| Less than High School | 48 (65.8%) | 40 (54.2%) |
| High School Diploma | 113 (61.4%) | 23 (12.4%) |
| College / Associate Degree | 225 (80.6%) | 17 (6.2%) |
| Bachelor's Degree or higher | 119 (79.3%) | 11 (7.6%) |
| Total | 505 (73.6%) | 86 (12.5%) |
Employment Occupations by Sex in Mio
Management, Business, Science and Arts Occupations
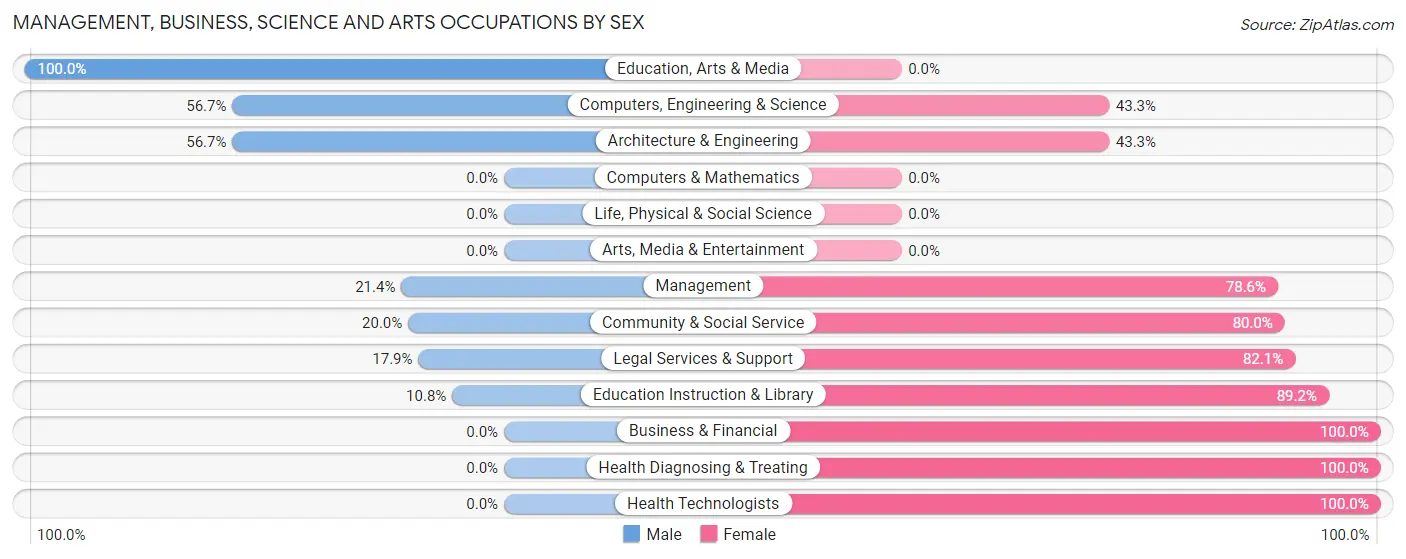
The most common Management, Business, Science and Arts occupations in Mio are Community & Social Service (70 | 13.0%), Education Instruction & Library (37 | 6.9%), Computers, Engineering & Science (30 | 5.6%), Architecture & Engineering (30 | 5.6%), and Legal Services & Support (28 | 5.2%).
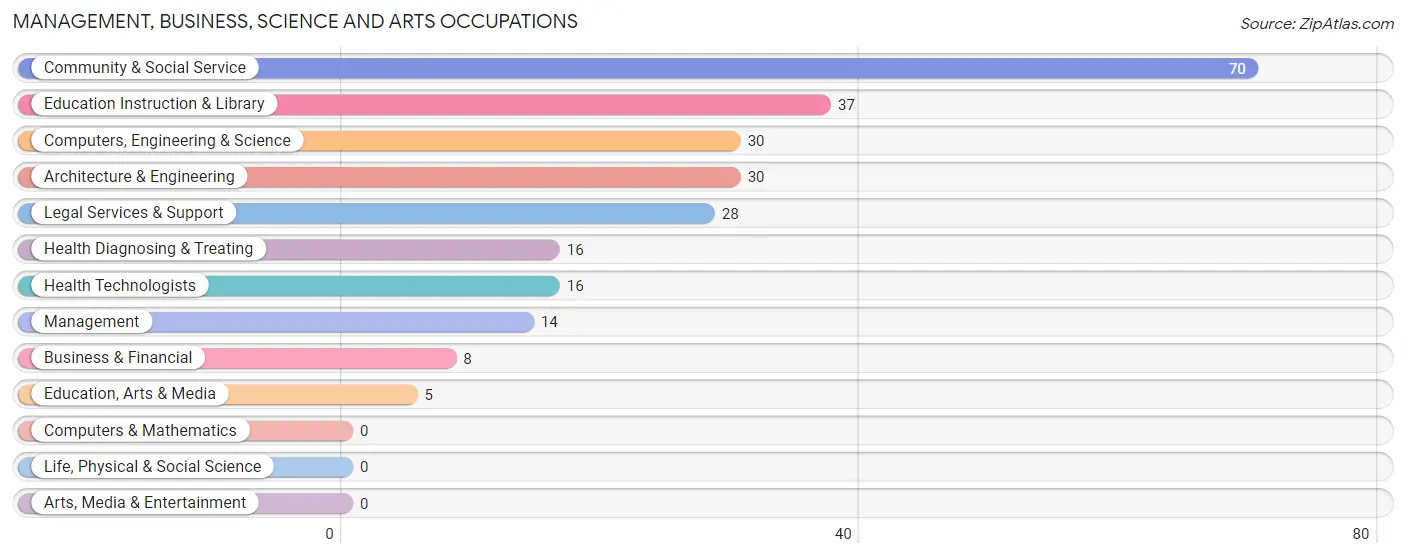
Management, Business, Science and Arts Occupations by Sex
Within the Management, Business, Science and Arts occupations in Mio, the most male-oriented occupations are Education, Arts & Media (100.0%), Computers, Engineering & Science (56.7%), and Architecture & Engineering (56.7%), while the most female-oriented occupations are Business & Financial (100.0%), Health Diagnosing & Treating (100.0%), and Health Technologists (100.0%).
| Occupation | Male | Female |
| Management | 3 (21.4%) | 11 (78.6%) |
| Business & Financial | 0 (0.0%) | 8 (100.0%) |
| Computers, Engineering & Science | 17 (56.7%) | 13 (43.3%) |
| Computers & Mathematics | 0 (0.0%) | 0 (0.0%) |
| Architecture & Engineering | 17 (56.7%) | 13 (43.3%) |
| Life, Physical & Social Science | 0 (0.0%) | 0 (0.0%) |
| Community & Social Service | 14 (20.0%) | 56 (80.0%) |
| Education, Arts & Media | 5 (100.0%) | 0 (0.0%) |
| Legal Services & Support | 5 (17.9%) | 23 (82.1%) |
| Education Instruction & Library | 4 (10.8%) | 33 (89.2%) |
| Arts, Media & Entertainment | 0 (0.0%) | 0 (0.0%) |
| Health Diagnosing & Treating | 0 (0.0%) | 16 (100.0%) |
| Health Technologists | 0 (0.0%) | 16 (100.0%) |
| Total (Category) | 34 (24.6%) | 104 (75.4%) |
| Total (Overall) | 224 (41.6%) | 315 (58.4%) |
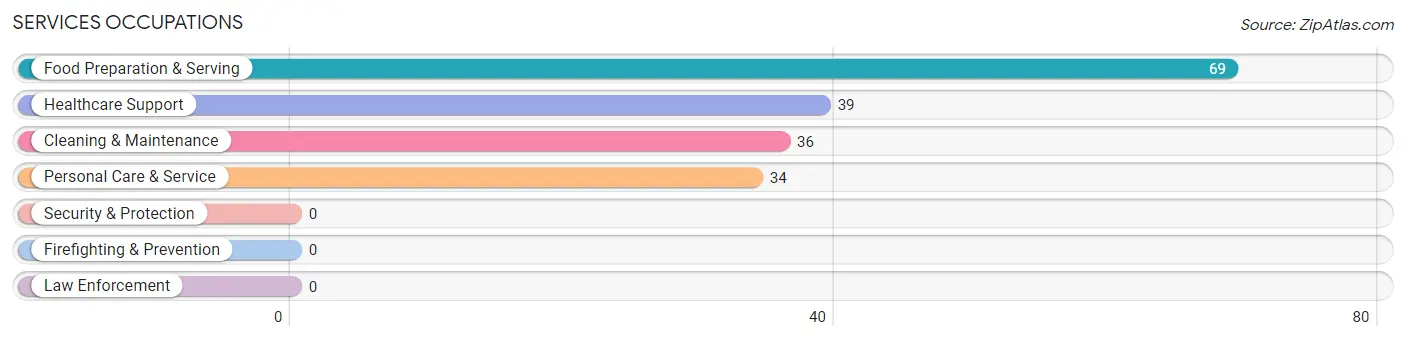
Services Occupations
The most common Services occupations in Mio are Food Preparation & Serving (69 | 12.8%), Healthcare Support (39 | 7.2%), Cleaning & Maintenance (36 | 6.7%), and Personal Care & Service (34 | 6.3%).
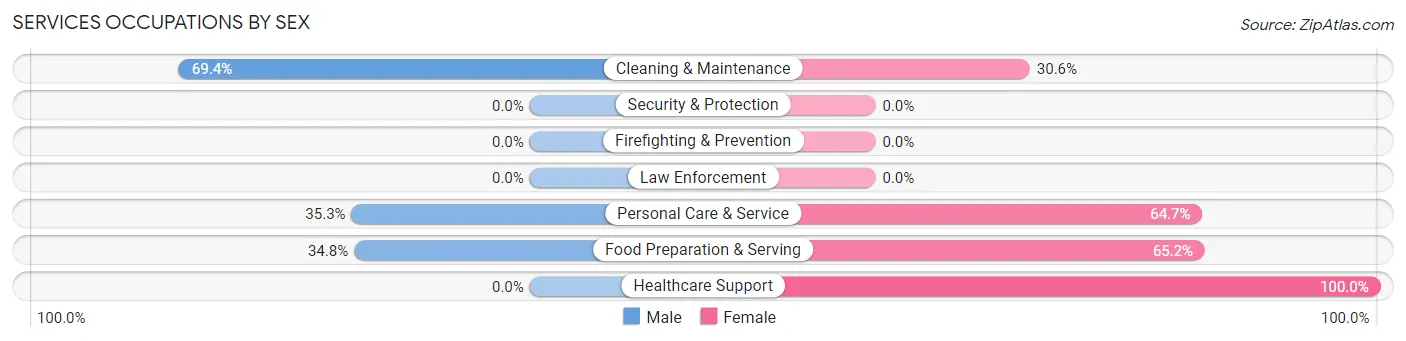
Services Occupations by Sex
Within the Services occupations in Mio, the most male-oriented occupations are Cleaning & Maintenance (69.4%), Personal Care & Service (35.3%), and Food Preparation & Serving (34.8%), while the most female-oriented occupations are Healthcare Support (100.0%), Food Preparation & Serving (65.2%), and Personal Care & Service (64.7%).
| Occupation | Male | Female |
| Healthcare Support | 0 (0.0%) | 39 (100.0%) |
| Security & Protection | 0 (0.0%) | 0 (0.0%) |
| Firefighting & Prevention | 0 (0.0%) | 0 (0.0%) |
| Law Enforcement | 0 (0.0%) | 0 (0.0%) |
| Food Preparation & Serving | 24 (34.8%) | 45 (65.2%) |
| Cleaning & Maintenance | 25 (69.4%) | 11 (30.6%) |
| Personal Care & Service | 12 (35.3%) | 22 (64.7%) |
| Total (Category) | 61 (34.3%) | 117 (65.7%) |
| Total (Overall) | 224 (41.6%) | 315 (58.4%) |
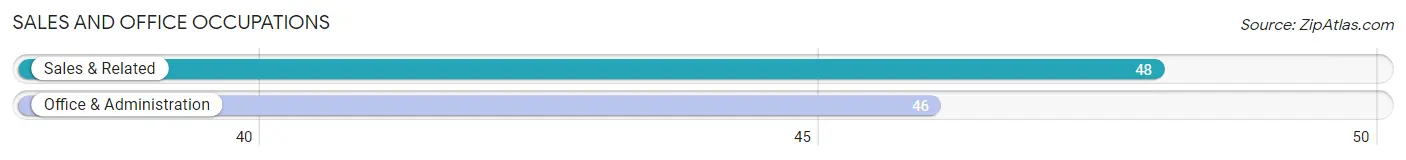
Sales and Office Occupations
The most common Sales and Office occupations in Mio are Sales & Related (48 | 8.9%), and Office & Administration (46 | 8.5%).
Sales and Office Occupations by Sex
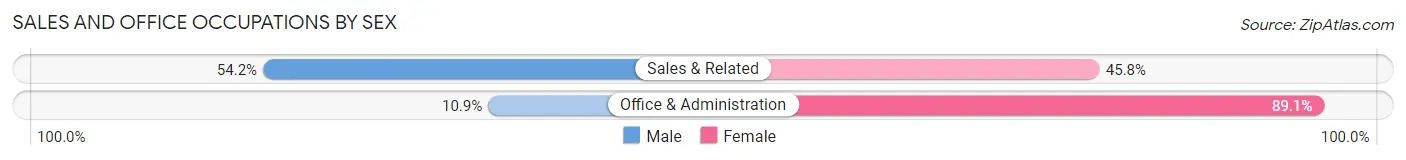
| Occupation | Male | Female |
| Sales & Related | 26 (54.2%) | 22 (45.8%) |
| Office & Administration | 5 (10.9%) | 41 (89.1%) |
| Total (Category) | 31 (33.0%) | 63 (67.0%) |
| Total (Overall) | 224 (41.6%) | 315 (58.4%) |
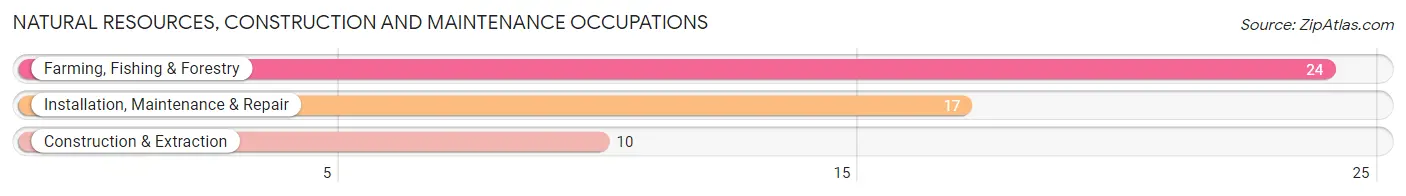
Natural Resources, Construction and Maintenance Occupations
The most common Natural Resources, Construction and Maintenance occupations in Mio are Farming, Fishing & Forestry (24 | 4.4%), Installation, Maintenance & Repair (17 | 3.2%), and Construction & Extraction (10 | 1.9%).
Natural Resources, Construction and Maintenance Occupations by Sex
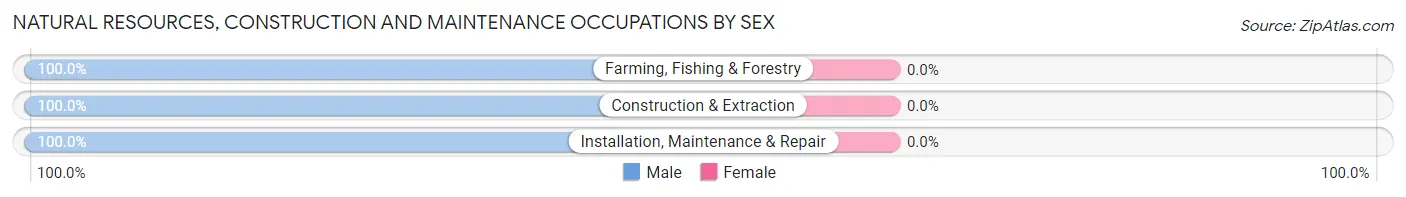
| Occupation | Male | Female |
| Farming, Fishing & Forestry | 24 (100.0%) | 0 (0.0%) |
| Construction & Extraction | 10 (100.0%) | 0 (0.0%) |
| Installation, Maintenance & Repair | 17 (100.0%) | 0 (0.0%) |
| Total (Category) | 51 (100.0%) | 0 (0.0%) |
| Total (Overall) | 224 (41.6%) | 315 (58.4%) |
Production, Transportation and Moving Occupations
The most common Production, Transportation and Moving occupations in Mio are Production (44 | 8.2%), Transportation (21 | 3.9%), and Material Moving (13 | 2.4%).
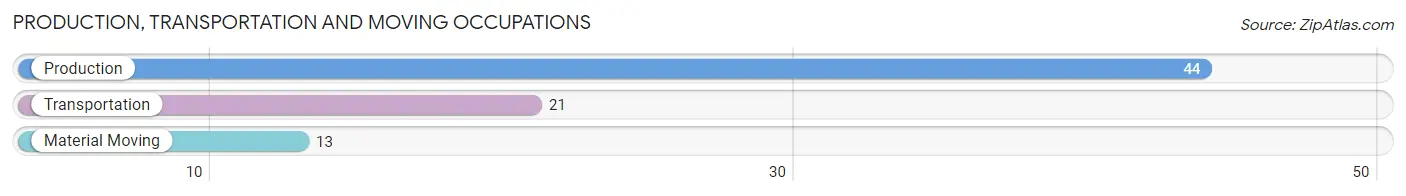
Production, Transportation and Moving Occupations by Sex
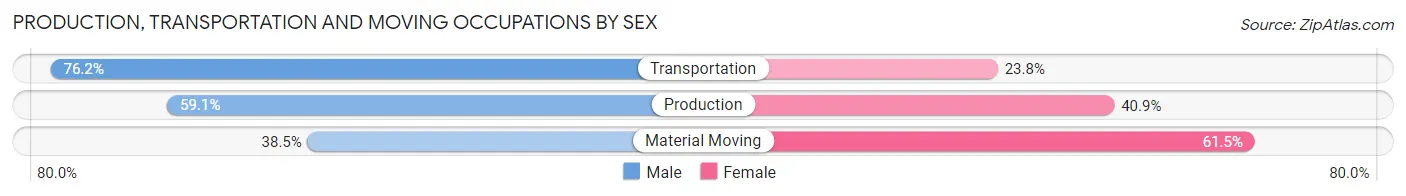
| Occupation | Male | Female |
| Production | 26 (59.1%) | 18 (40.9%) |
| Transportation | 16 (76.2%) | 5 (23.8%) |
| Material Moving | 5 (38.5%) | 8 (61.5%) |
| Total (Category) | 47 (60.3%) | 31 (39.7%) |
| Total (Overall) | 224 (41.6%) | 315 (58.4%) |
Employment Industries by Sex in Mio
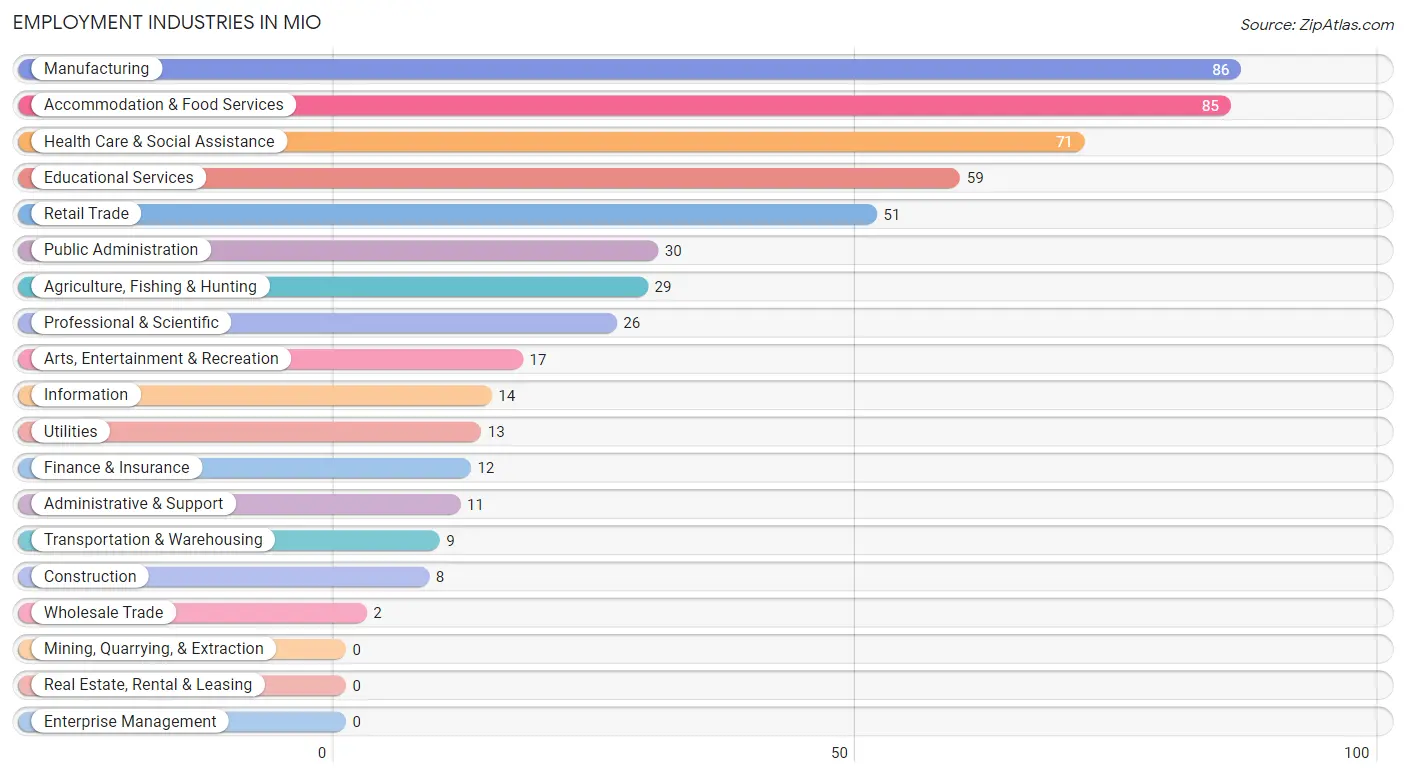
Employment Industries in Mio
The major employment industries in Mio include Manufacturing (86 | 16.0%), Accommodation & Food Services (85 | 15.8%), Health Care & Social Assistance (71 | 13.2%), Educational Services (59 | 11.0%), and Retail Trade (51 | 9.5%).
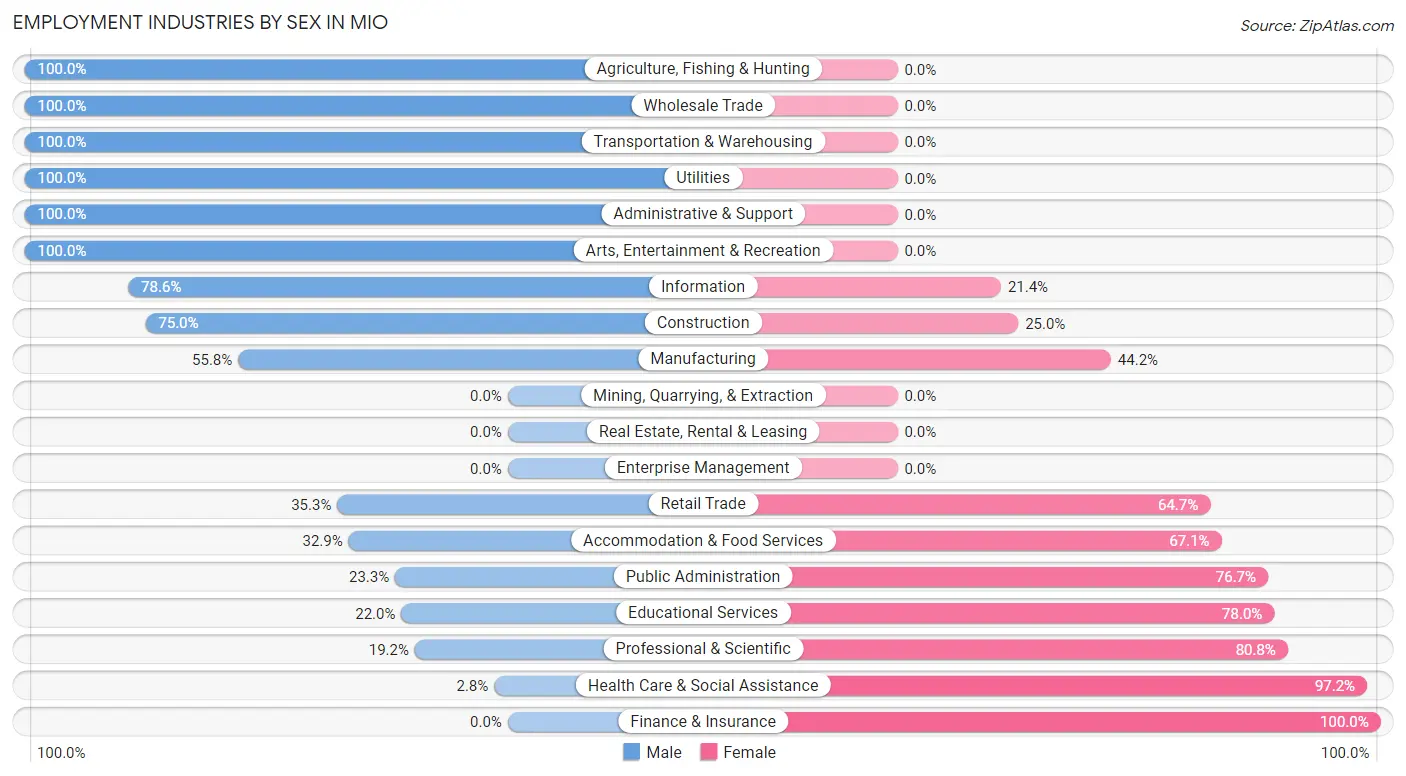
Employment Industries by Sex in Mio
The Mio industries that see more men than women are Agriculture, Fishing & Hunting (100.0%), Wholesale Trade (100.0%), and Transportation & Warehousing (100.0%), whereas the industries that tend to have a higher number of women are Finance & Insurance (100.0%), Health Care & Social Assistance (97.2%), and Professional & Scientific (80.8%).
| Industry | Male | Female |
| Agriculture, Fishing & Hunting | 29 (100.0%) | 0 (0.0%) |
| Mining, Quarrying, & Extraction | 0 (0.0%) | 0 (0.0%) |
| Construction | 6 (75.0%) | 2 (25.0%) |
| Manufacturing | 48 (55.8%) | 38 (44.2%) |
| Wholesale Trade | 2 (100.0%) | 0 (0.0%) |
| Retail Trade | 18 (35.3%) | 33 (64.7%) |
| Transportation & Warehousing | 9 (100.0%) | 0 (0.0%) |
| Utilities | 13 (100.0%) | 0 (0.0%) |
| Information | 11 (78.6%) | 3 (21.4%) |
| Finance & Insurance | 0 (0.0%) | 12 (100.0%) |
| Real Estate, Rental & Leasing | 0 (0.0%) | 0 (0.0%) |
| Professional & Scientific | 5 (19.2%) | 21 (80.8%) |
| Enterprise Management | 0 (0.0%) | 0 (0.0%) |
| Administrative & Support | 11 (100.0%) | 0 (0.0%) |
| Educational Services | 13 (22.0%) | 46 (78.0%) |
| Health Care & Social Assistance | 2 (2.8%) | 69 (97.2%) |
| Arts, Entertainment & Recreation | 17 (100.0%) | 0 (0.0%) |
| Accommodation & Food Services | 28 (32.9%) | 57 (67.1%) |
| Public Administration | 7 (23.3%) | 23 (76.7%) |
| Total | 224 (41.6%) | 315 (58.4%) |
Education in Mio
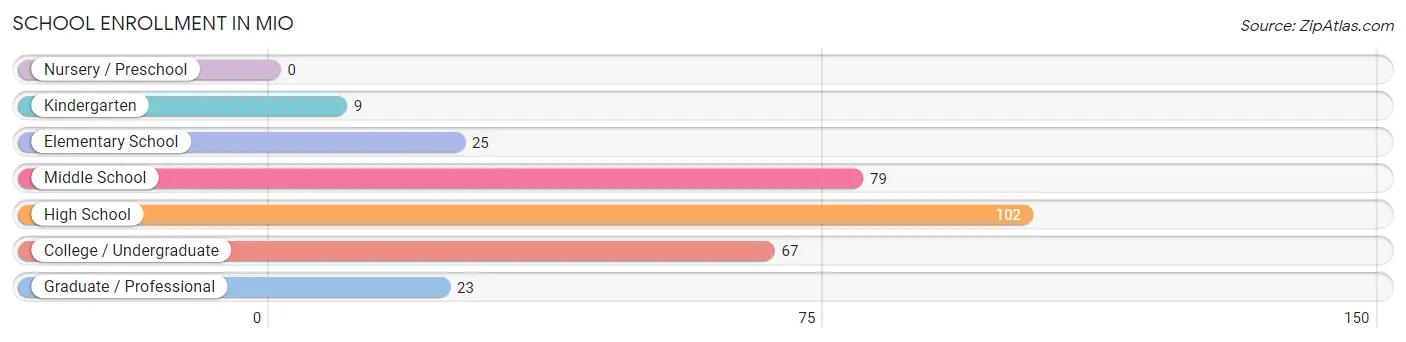
School Enrollment in Mio
The most common levels of schooling among the 305 students in Mio are high school (102 | 33.4%), middle school (79 | 25.9%), and college / undergraduate (67 | 22.0%).
| School Level | # Students | % Students |
| Nursery / Preschool | 0 | 0.0% |
| Kindergarten | 9 | 2.9% |
| Elementary School | 25 | 8.2% |
| Middle School | 79 | 25.9% |
| High School | 102 | 33.4% |
| College / Undergraduate | 67 | 22.0% |
| Graduate / Professional | 23 | 7.5% |
| Total | 305 | 100.0% |
School Enrollment by Age by Funding Source in Mio
Out of a total of 305 students who are enrolled in schools in Mio, 24 (7.9%) attend a private institution, while the remaining 281 (92.1%) are enrolled in public schools. The age group of 15 to 17 year olds has the highest likelihood of being enrolled in private schools, with 10 (16.4% in the age bracket) enrolled. Conversely, the age group of 5 to 9 year old has the lowest likelihood of being enrolled in a private school, with 35 (100.0% in the age bracket) attending a public institution.
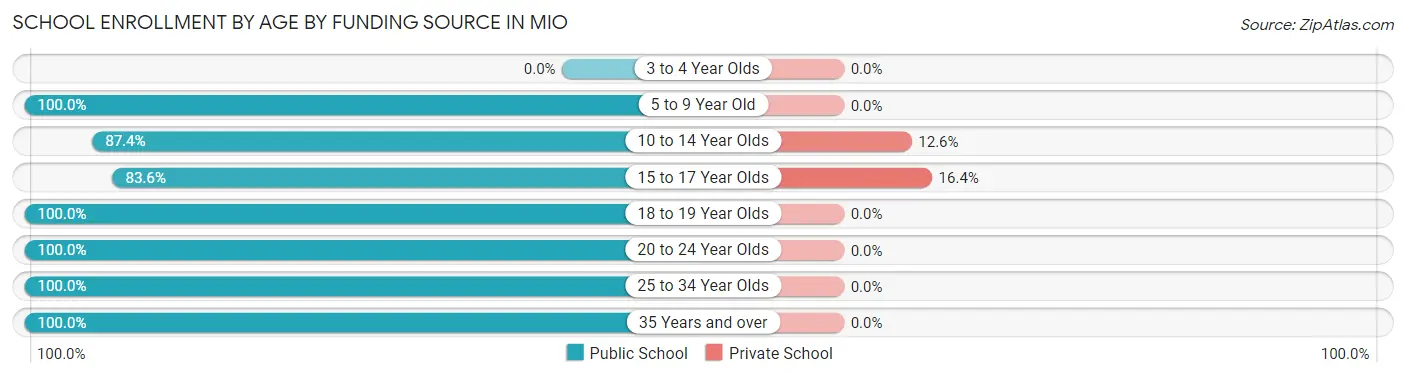
| Age Bracket | Public School | Private School |
| 3 to 4 Year Olds | 0 (0.0%) | 0 (0.0%) |
| 5 to 9 Year Old | 35 (100.0%) | 0 (0.0%) |
| 10 to 14 Year Olds | 97 (87.4%) | 14 (12.6%) |
| 15 to 17 Year Olds | 51 (83.6%) | 10 (16.4%) |
| 18 to 19 Year Olds | 8 (100.0%) | 0 (0.0%) |
| 20 to 24 Year Olds | 56 (100.0%) | 0 (0.0%) |
| 25 to 34 Year Olds | 18 (100.0%) | 0 (0.0%) |
| 35 Years and over | 16 (100.0%) | 0 (0.0%) |
| Total | 281 (92.1%) | 24 (7.9%) |
Educational Attainment by Field of Study in Mio
Education (74 | 37.8%), arts & humanities (39 | 19.9%), engineering (34 | 17.3%), business (19 | 9.7%), and science & technology (10 | 5.1%) are the most common fields of study among 196 individuals in Mio who have obtained a bachelor's degree or higher.
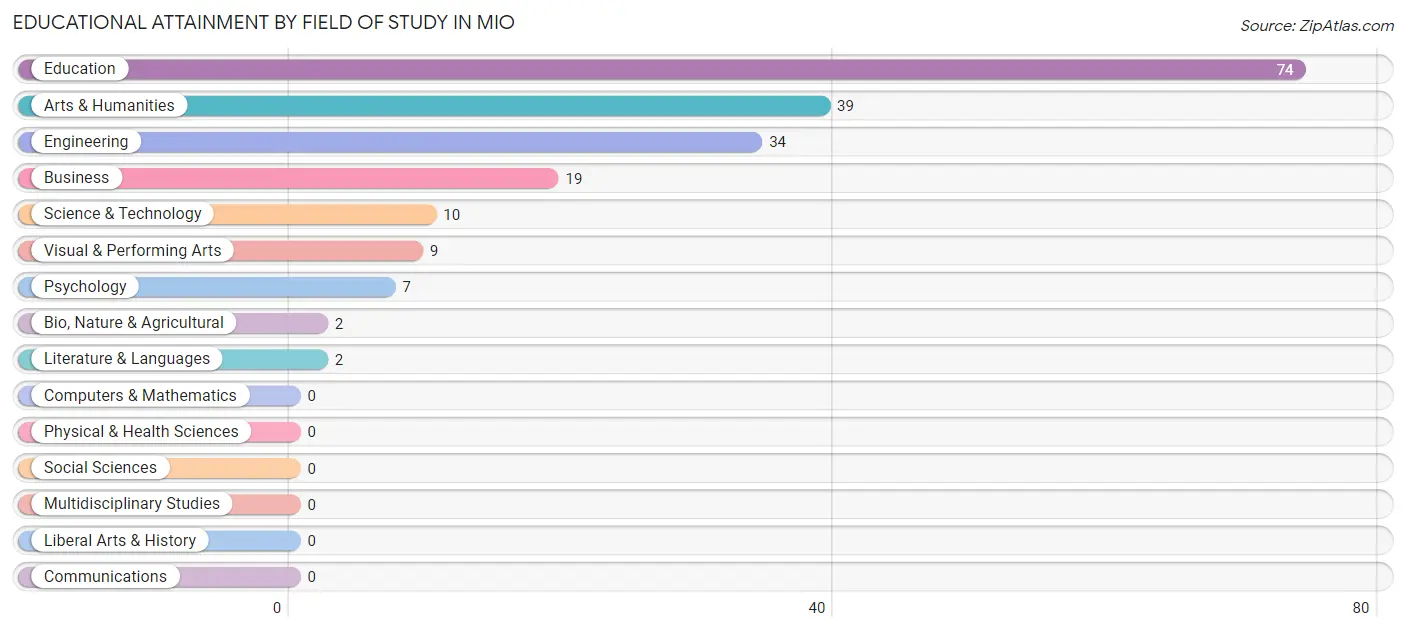
| Field of Study | # Graduates | % Graduates |
| Computers & Mathematics | 0 | 0.0% |
| Bio, Nature & Agricultural | 2 | 1.0% |
| Physical & Health Sciences | 0 | 0.0% |
| Psychology | 7 | 3.6% |
| Social Sciences | 0 | 0.0% |
| Engineering | 34 | 17.3% |
| Multidisciplinary Studies | 0 | 0.0% |
| Science & Technology | 10 | 5.1% |
| Business | 19 | 9.7% |
| Education | 74 | 37.8% |
| Literature & Languages | 2 | 1.0% |
| Liberal Arts & History | 0 | 0.0% |
| Visual & Performing Arts | 9 | 4.6% |
| Communications | 0 | 0.0% |
| Arts & Humanities | 39 | 19.9% |
| Total | 196 | 100.0% |
Transportation & Commute in Mio
Vehicle Availability by Sex in Mio
The most prevalent vehicle ownership categories in Mio are males with 2 vehicles (61, accounting for 31.6%) and females with 2 vehicles (124, making up 19.4%).
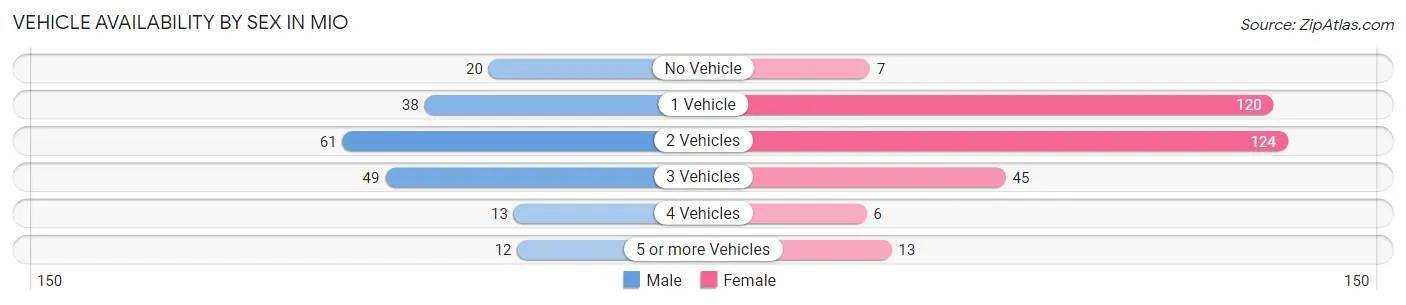
| Vehicles Available | Male | Female |
| No Vehicle | 20 (10.4%) | 7 (2.2%) |
| 1 Vehicle | 38 (19.7%) | 120 (38.1%) |
| 2 Vehicles | 61 (31.6%) | 124 (39.4%) |
| 3 Vehicles | 49 (25.4%) | 45 (14.3%) |
| 4 Vehicles | 13 (6.7%) | 6 (1.9%) |
| 5 or more Vehicles | 12 (6.2%) | 13 (4.1%) |
| Total | 193 (100.0%) | 315 (100.0%) |
Commute Time in Mio
The most frequently occuring commute durations in Mio are 5 to 9 minutes (135 commuters, 29.7%), less than 5 minutes (76 commuters, 16.7%), and 15 to 19 minutes (67 commuters, 14.8%).
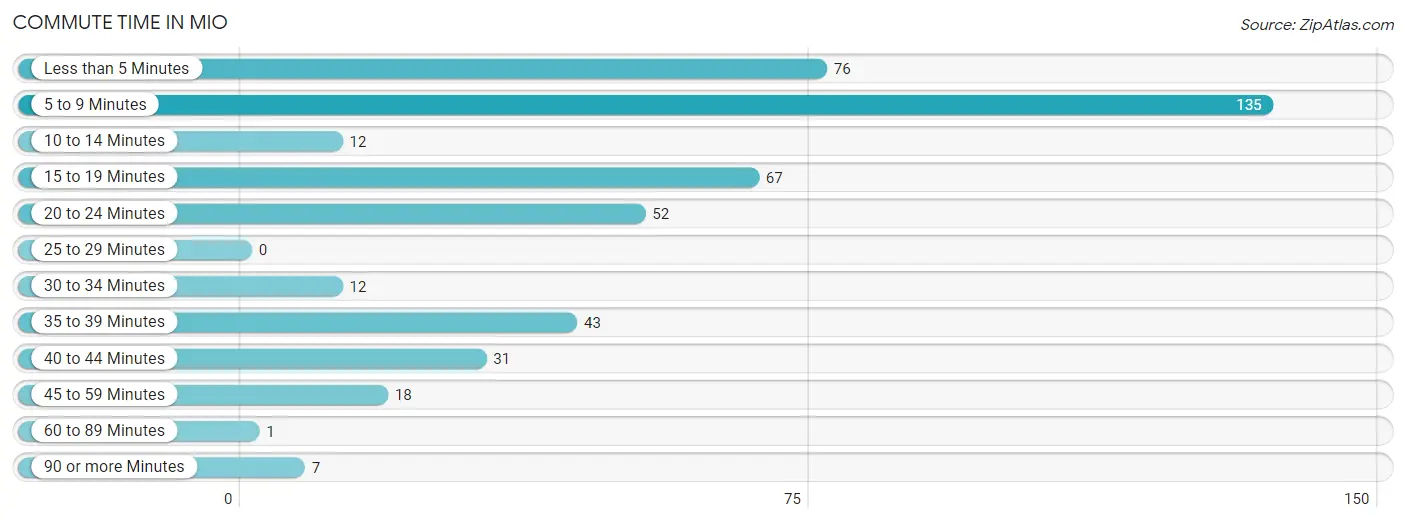
| Commute Time | # Commuters | % Commuters |
| Less than 5 Minutes | 76 | 16.7% |
| 5 to 9 Minutes | 135 | 29.7% |
| 10 to 14 Minutes | 12 | 2.6% |
| 15 to 19 Minutes | 67 | 14.8% |
| 20 to 24 Minutes | 52 | 11.5% |
| 25 to 29 Minutes | 0 | 0.0% |
| 30 to 34 Minutes | 12 | 2.6% |
| 35 to 39 Minutes | 43 | 9.5% |
| 40 to 44 Minutes | 31 | 6.8% |
| 45 to 59 Minutes | 18 | 4.0% |
| 60 to 89 Minutes | 1 | 0.2% |
| 90 or more Minutes | 7 | 1.5% |
Commute Time by Sex in Mio
The most common commute times in Mio are 5 to 9 minutes (48 commuters, 30.8%) for males and 5 to 9 minutes (87 commuters, 29.2%) for females.
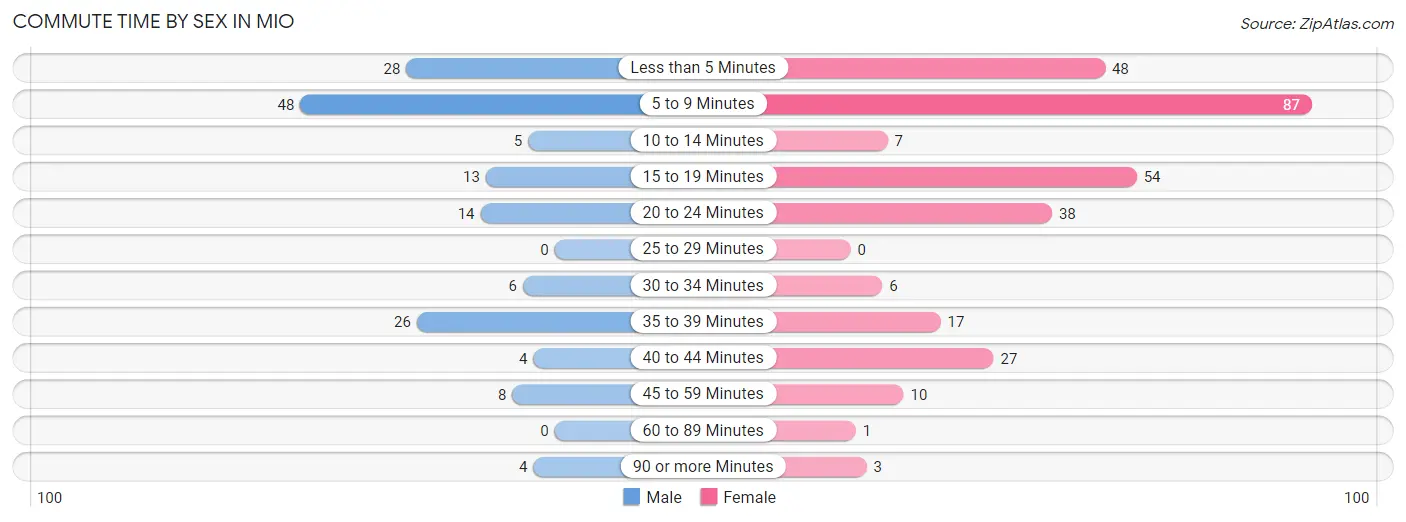
| Commute Time | Male | Female |
| Less than 5 Minutes | 28 (17.9%) | 48 (16.1%) |
| 5 to 9 Minutes | 48 (30.8%) | 87 (29.2%) |
| 10 to 14 Minutes | 5 (3.2%) | 7 (2.4%) |
| 15 to 19 Minutes | 13 (8.3%) | 54 (18.1%) |
| 20 to 24 Minutes | 14 (9.0%) | 38 (12.8%) |
| 25 to 29 Minutes | 0 (0.0%) | 0 (0.0%) |
| 30 to 34 Minutes | 6 (3.8%) | 6 (2.0%) |
| 35 to 39 Minutes | 26 (16.7%) | 17 (5.7%) |
| 40 to 44 Minutes | 4 (2.6%) | 27 (9.1%) |
| 45 to 59 Minutes | 8 (5.1%) | 10 (3.4%) |
| 60 to 89 Minutes | 0 (0.0%) | 1 (0.3%) |
| 90 or more Minutes | 4 (2.6%) | 3 (1.0%) |
Time of Departure to Work by Sex in Mio
The most frequent times of departure to work in Mio are 5:30 AM to 5:59 AM (34, 21.8%) for males and 12:00 PM to 3:59 PM (46, 15.4%) for females.
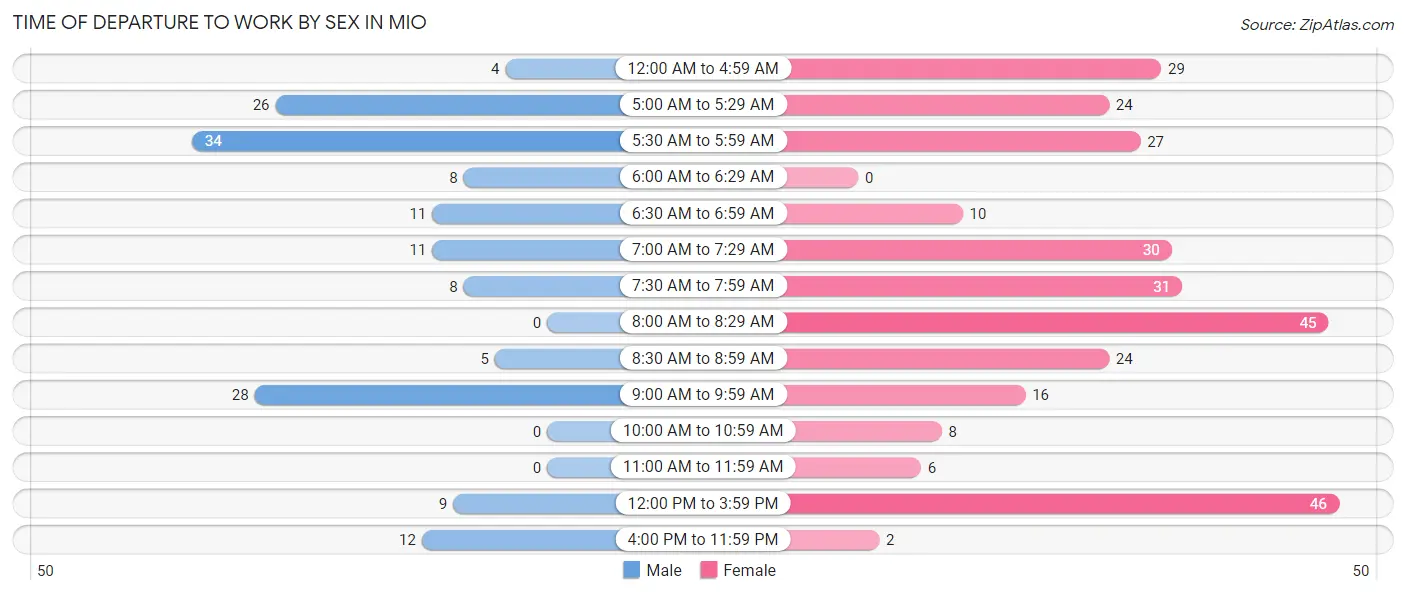
| Time of Departure | Male | Female |
| 12:00 AM to 4:59 AM | 4 (2.6%) | 29 (9.7%) |
| 5:00 AM to 5:29 AM | 26 (16.7%) | 24 (8.1%) |
| 5:30 AM to 5:59 AM | 34 (21.8%) | 27 (9.1%) |
| 6:00 AM to 6:29 AM | 8 (5.1%) | 0 (0.0%) |
| 6:30 AM to 6:59 AM | 11 (7.0%) | 10 (3.4%) |
| 7:00 AM to 7:29 AM | 11 (7.0%) | 30 (10.1%) |
| 7:30 AM to 7:59 AM | 8 (5.1%) | 31 (10.4%) |
| 8:00 AM to 8:29 AM | 0 (0.0%) | 45 (15.1%) |
| 8:30 AM to 8:59 AM | 5 (3.2%) | 24 (8.1%) |
| 9:00 AM to 9:59 AM | 28 (17.9%) | 16 (5.4%) |
| 10:00 AM to 10:59 AM | 0 (0.0%) | 8 (2.7%) |
| 11:00 AM to 11:59 AM | 0 (0.0%) | 6 (2.0%) |
| 12:00 PM to 3:59 PM | 9 (5.8%) | 46 (15.4%) |
| 4:00 PM to 11:59 PM | 12 (7.7%) | 2 (0.7%) |
| Total | 156 (100.0%) | 298 (100.0%) |
Housing Occupancy in Mio
Occupancy by Ownership in Mio
Of the total 577 dwellings in Mio, owner-occupied units account for 431 (74.7%), while renter-occupied units make up 146 (25.3%).
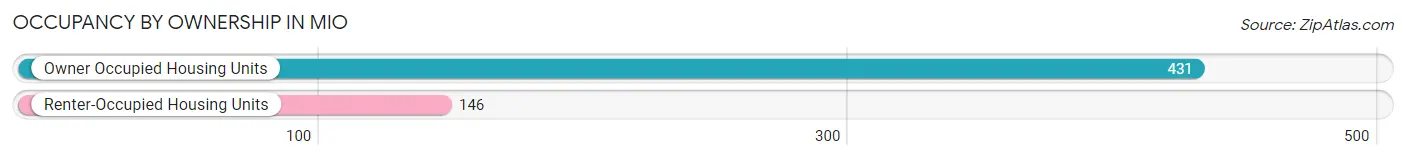
| Occupancy | # Housing Units | % Housing Units |
| Owner Occupied Housing Units | 431 | 74.7% |
| Renter-Occupied Housing Units | 146 | 25.3% |
| Total Occupied Housing Units | 577 | 100.0% |
Occupancy by Household Size in Mio
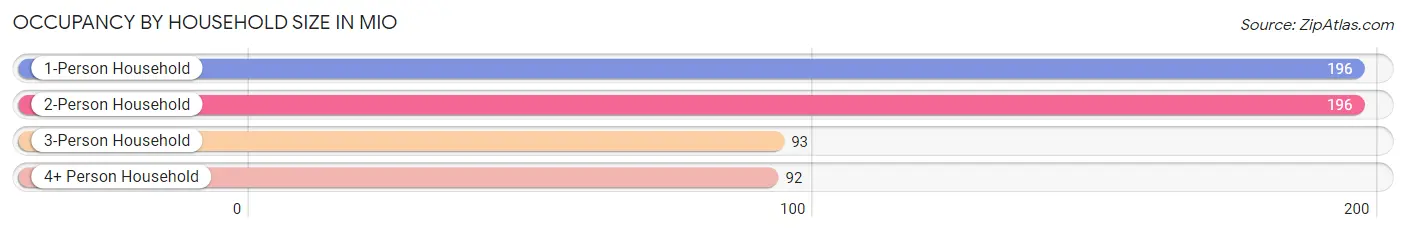
| Household Size | # Housing Units | % Housing Units |
| 1-Person Household | 196 | 34.0% |
| 2-Person Household | 196 | 34.0% |
| 3-Person Household | 93 | 16.1% |
| 4+ Person Household | 92 | 15.9% |
| Total Housing Units | 577 | 100.0% |
Occupancy by Ownership by Household Size in Mio
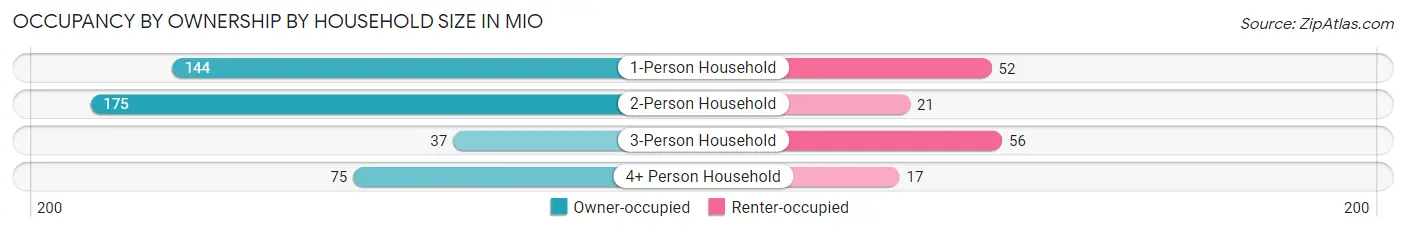
| Household Size | Owner-occupied | Renter-occupied |
| 1-Person Household | 144 (73.5%) | 52 (26.5%) |
| 2-Person Household | 175 (89.3%) | 21 (10.7%) |
| 3-Person Household | 37 (39.8%) | 56 (60.2%) |
| 4+ Person Household | 75 (81.5%) | 17 (18.5%) |
| Total Housing Units | 431 (74.7%) | 146 (25.3%) |
Occupancy by Educational Attainment in Mio
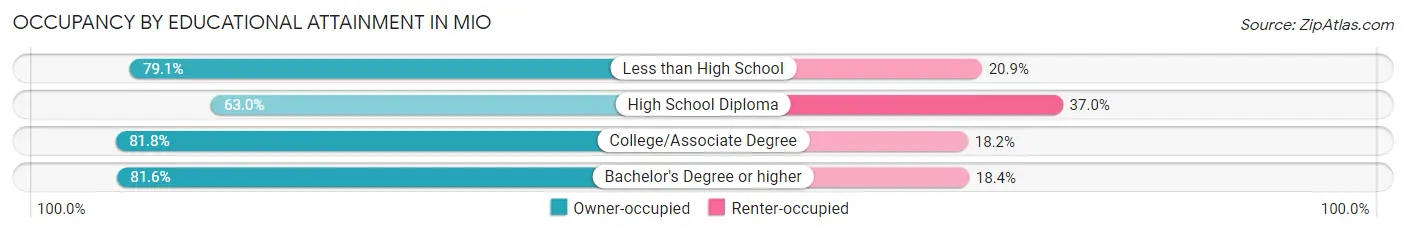
| Household Size | Owner-occupied | Renter-occupied |
| Less than High School | 34 (79.1%) | 9 (20.9%) |
| High School Diploma | 133 (63.0%) | 78 (37.0%) |
| College/Associate Degree | 153 (81.8%) | 34 (18.2%) |
| Bachelor's Degree or higher | 111 (81.6%) | 25 (18.4%) |
Occupancy by Age of Householder in Mio
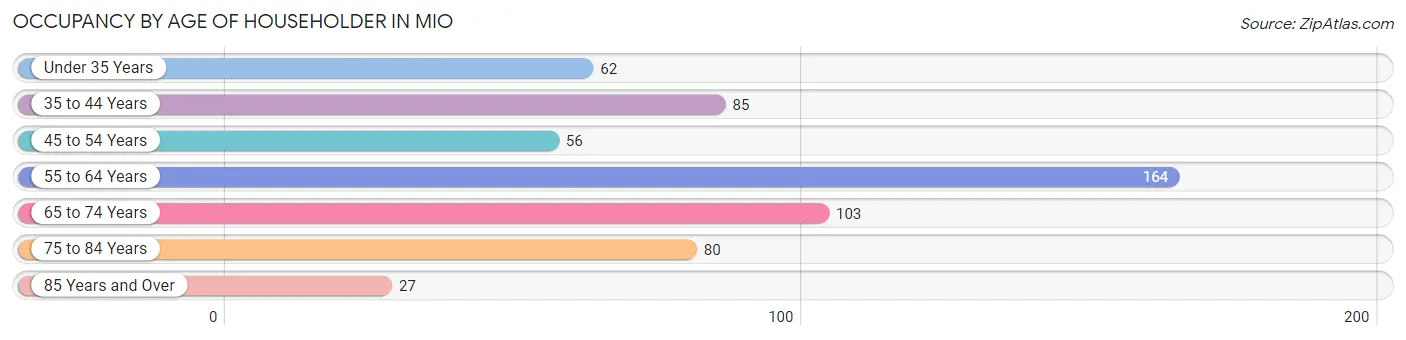
| Age Bracket | # Households | % Households |
| Under 35 Years | 62 | 10.7% |
| 35 to 44 Years | 85 | 14.7% |
| 45 to 54 Years | 56 | 9.7% |
| 55 to 64 Years | 164 | 28.4% |
| 65 to 74 Years | 103 | 17.8% |
| 75 to 84 Years | 80 | 13.9% |
| 85 Years and Over | 27 | 4.7% |
| Total | 577 | 100.0% |
Housing Finances in Mio
Median Income by Occupancy in Mio
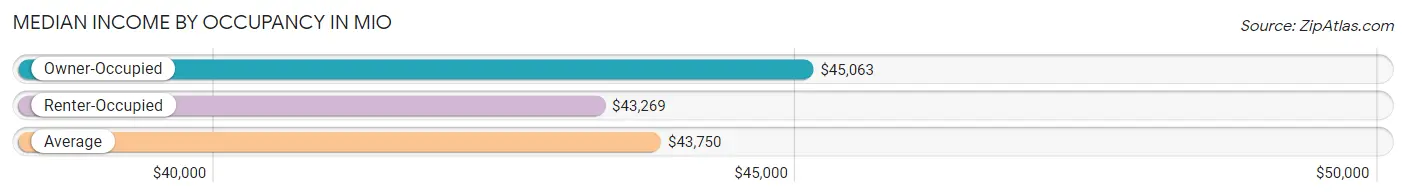
| Occupancy Type | # Households | Median Income |
| Owner-Occupied | 431 (74.7%) | $45,063 |
| Renter-Occupied | 146 (25.3%) | $43,269 |
| Average | 577 (100.0%) | $43,750 |
Occupancy by Householder Income Bracket in Mio
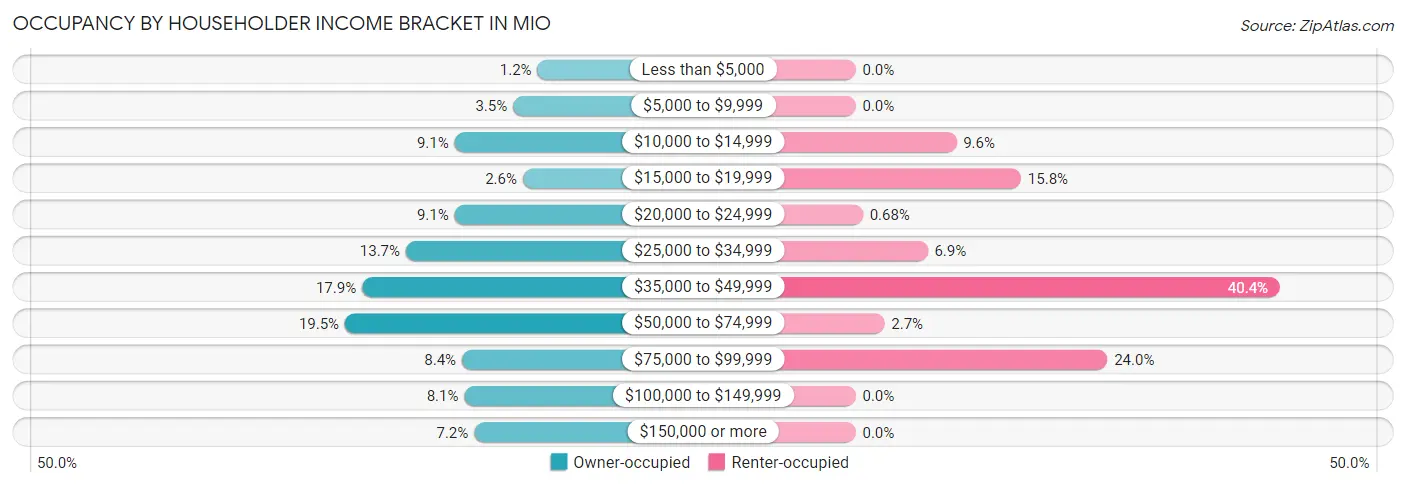
| Income Bracket | Owner-occupied | Renter-occupied |
| Less than $5,000 | 5 (1.2%) | 0 (0.0%) |
| $5,000 to $9,999 | 15 (3.5%) | 0 (0.0%) |
| $10,000 to $14,999 | 39 (9.0%) | 14 (9.6%) |
| $15,000 to $19,999 | 11 (2.5%) | 23 (15.8%) |
| $20,000 to $24,999 | 39 (9.0%) | 1 (0.7%) |
| $25,000 to $34,999 | 59 (13.7%) | 10 (6.9%) |
| $35,000 to $49,999 | 77 (17.9%) | 59 (40.4%) |
| $50,000 to $74,999 | 84 (19.5%) | 4 (2.7%) |
| $75,000 to $99,999 | 36 (8.4%) | 35 (24.0%) |
| $100,000 to $149,999 | 35 (8.1%) | 0 (0.0%) |
| $150,000 or more | 31 (7.2%) | 0 (0.0%) |
| Total | 431 (100.0%) | 146 (100.0%) |
Monthly Housing Cost Tiers in Mio
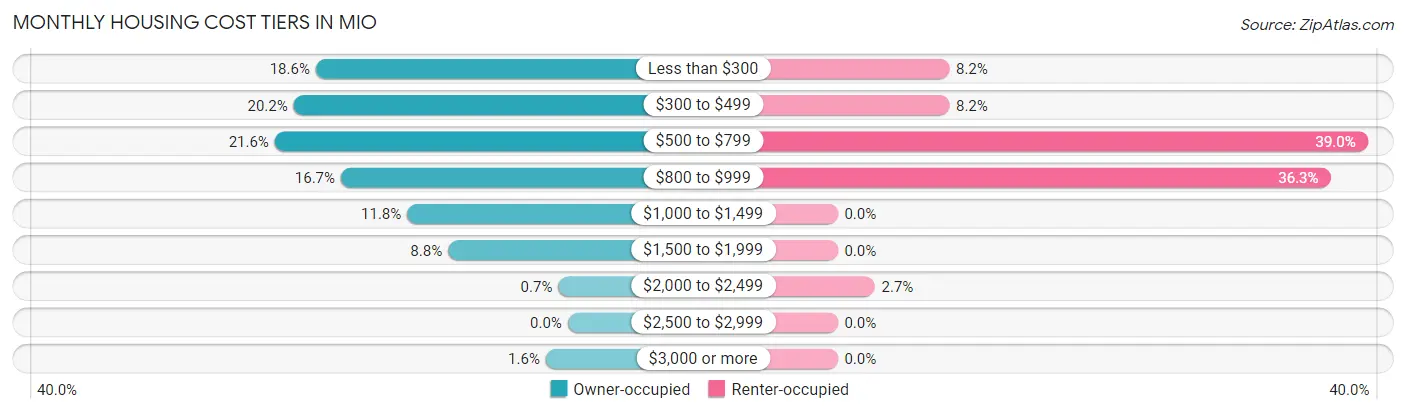
| Monthly Cost | Owner-occupied | Renter-occupied |
| Less than $300 | 80 (18.6%) | 12 (8.2%) |
| $300 to $499 | 87 (20.2%) | 12 (8.2%) |
| $500 to $799 | 93 (21.6%) | 57 (39.0%) |
| $800 to $999 | 72 (16.7%) | 53 (36.3%) |
| $1,000 to $1,499 | 51 (11.8%) | 0 (0.0%) |
| $1,500 to $1,999 | 38 (8.8%) | 0 (0.0%) |
| $2,000 to $2,499 | 3 (0.7%) | 4 (2.7%) |
| $2,500 to $2,999 | 0 (0.0%) | 0 (0.0%) |
| $3,000 or more | 7 (1.6%) | 0 (0.0%) |
| Total | 431 (100.0%) | 146 (100.0%) |
Physical Housing Characteristics in Mio
Housing Structures in Mio
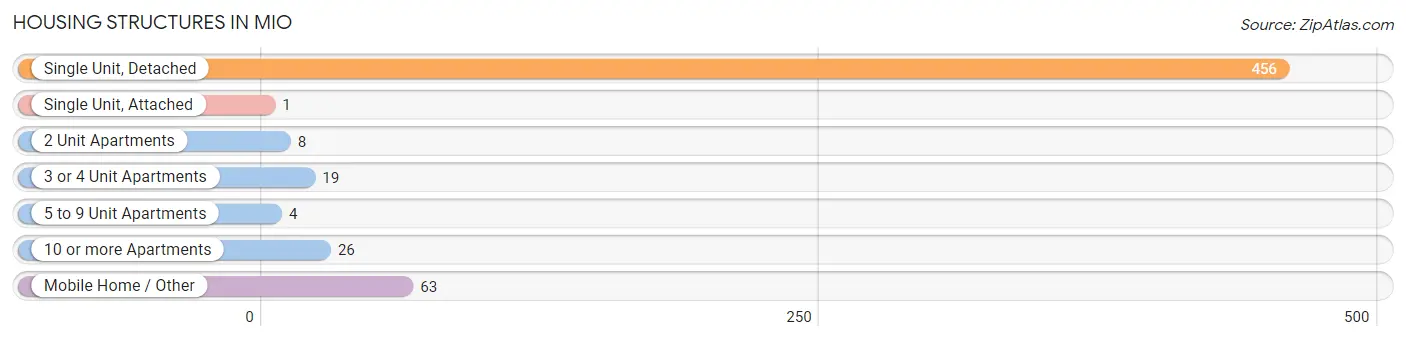
| Structure Type | # Housing Units | % Housing Units |
| Single Unit, Detached | 456 | 79.0% |
| Single Unit, Attached | 1 | 0.2% |
| 2 Unit Apartments | 8 | 1.4% |
| 3 or 4 Unit Apartments | 19 | 3.3% |
| 5 to 9 Unit Apartments | 4 | 0.7% |
| 10 or more Apartments | 26 | 4.5% |
| Mobile Home / Other | 63 | 10.9% |
| Total | 577 | 100.0% |
Housing Structures by Occupancy in Mio
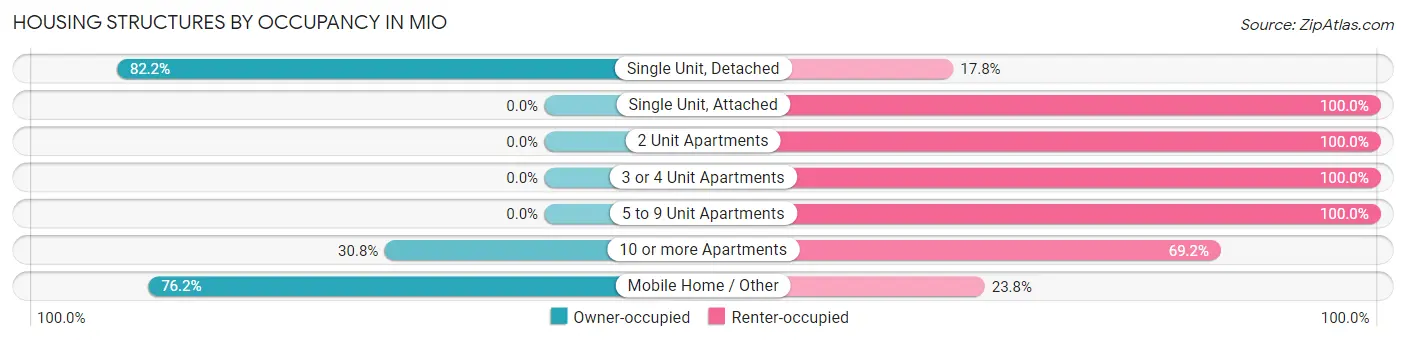
| Structure Type | Owner-occupied | Renter-occupied |
| Single Unit, Detached | 375 (82.2%) | 81 (17.8%) |
| Single Unit, Attached | 0 (0.0%) | 1 (100.0%) |
| 2 Unit Apartments | 0 (0.0%) | 8 (100.0%) |
| 3 or 4 Unit Apartments | 0 (0.0%) | 19 (100.0%) |
| 5 to 9 Unit Apartments | 0 (0.0%) | 4 (100.0%) |
| 10 or more Apartments | 8 (30.8%) | 18 (69.2%) |
| Mobile Home / Other | 48 (76.2%) | 15 (23.8%) |
| Total | 431 (74.7%) | 146 (25.3%) |
Housing Structures by Number of Rooms in Mio
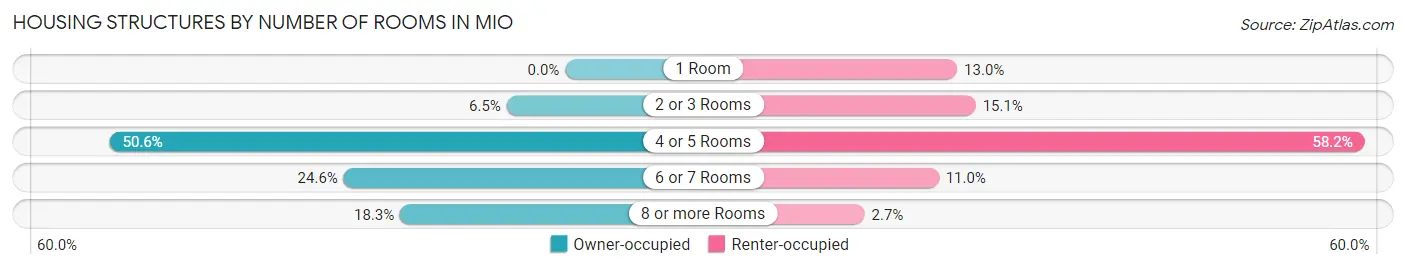
| Number of Rooms | Owner-occupied | Renter-occupied |
| 1 Room | 0 (0.0%) | 19 (13.0%) |
| 2 or 3 Rooms | 28 (6.5%) | 22 (15.1%) |
| 4 or 5 Rooms | 218 (50.6%) | 85 (58.2%) |
| 6 or 7 Rooms | 106 (24.6%) | 16 (11.0%) |
| 8 or more Rooms | 79 (18.3%) | 4 (2.7%) |
| Total | 431 (100.0%) | 146 (100.0%) |
Housing Structure by Heating Type in Mio
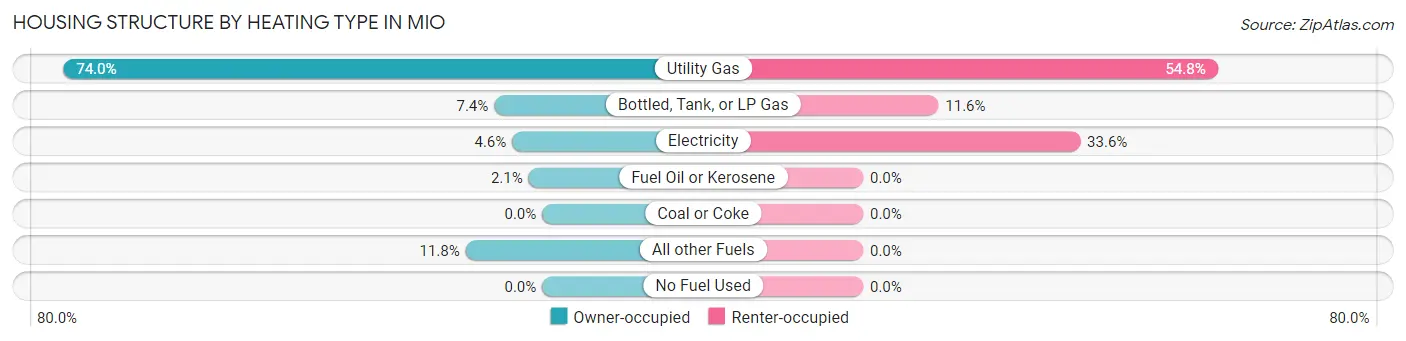
| Heating Type | Owner-occupied | Renter-occupied |
| Utility Gas | 319 (74.0%) | 80 (54.8%) |
| Bottled, Tank, or LP Gas | 32 (7.4%) | 17 (11.6%) |
| Electricity | 20 (4.6%) | 49 (33.6%) |
| Fuel Oil or Kerosene | 9 (2.1%) | 0 (0.0%) |
| Coal or Coke | 0 (0.0%) | 0 (0.0%) |
| All other Fuels | 51 (11.8%) | 0 (0.0%) |
| No Fuel Used | 0 (0.0%) | 0 (0.0%) |
| Total | 431 (100.0%) | 146 (100.0%) |
Household Vehicle Usage in Mio
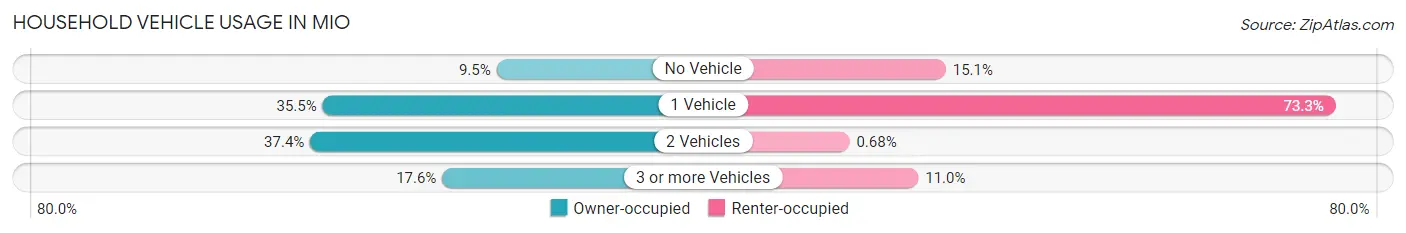
| Vehicles per Household | Owner-occupied | Renter-occupied |
| No Vehicle | 41 (9.5%) | 22 (15.1%) |
| 1 Vehicle | 153 (35.5%) | 107 (73.3%) |
| 2 Vehicles | 161 (37.3%) | 1 (0.7%) |
| 3 or more Vehicles | 76 (17.6%) | 16 (11.0%) |
| Total | 431 (100.0%) | 146 (100.0%) |
Real Estate & Mortgages in Mio
Real Estate and Mortgage Overview in Mio
| Characteristic | Without Mortgage | With Mortgage |
| Housing Units | 185 | 246 |
| Median Property Value | $72,400 | $103,000 |
| Median Household Income | $27,917 | $26 |
| Monthly Housing Costs | $330 | $7 |
| Real Estate Taxes | $719 | $2 |
Property Value by Mortgage Status in Mio
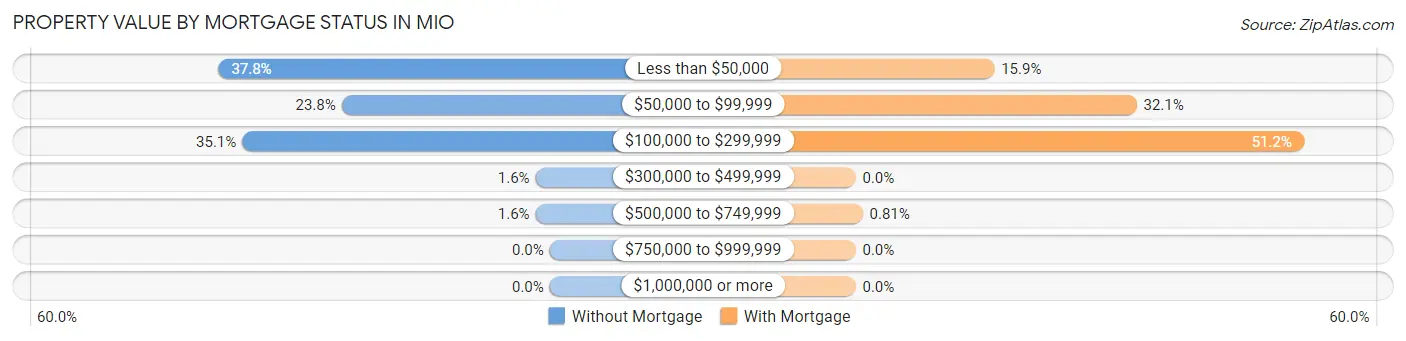
| Property Value | Without Mortgage | With Mortgage |
| Less than $50,000 | 70 (37.8%) | 39 (15.9%) |
| $50,000 to $99,999 | 44 (23.8%) | 79 (32.1%) |
| $100,000 to $299,999 | 65 (35.1%) | 126 (51.2%) |
| $300,000 to $499,999 | 3 (1.6%) | 0 (0.0%) |
| $500,000 to $749,999 | 3 (1.6%) | 2 (0.8%) |
| $750,000 to $999,999 | 0 (0.0%) | 0 (0.0%) |
| $1,000,000 or more | 0 (0.0%) | 0 (0.0%) |
| Total | 185 (100.0%) | 246 (100.0%) |
Household Income by Mortgage Status in Mio
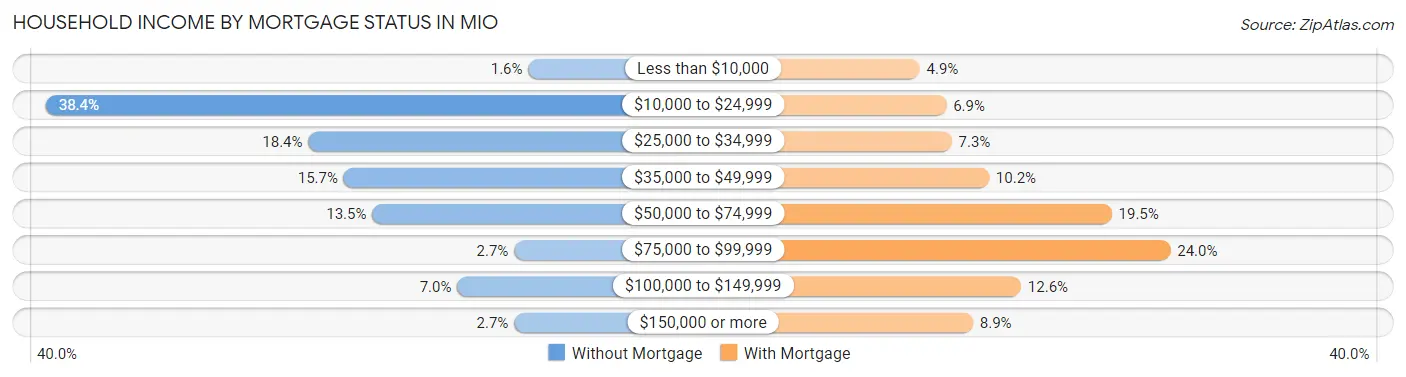
| Household Income | Without Mortgage | With Mortgage |
| Less than $10,000 | 3 (1.6%) | 12 (4.9%) |
| $10,000 to $24,999 | 71 (38.4%) | 17 (6.9%) |
| $25,000 to $34,999 | 34 (18.4%) | 18 (7.3%) |
| $35,000 to $49,999 | 29 (15.7%) | 25 (10.2%) |
| $50,000 to $74,999 | 25 (13.5%) | 48 (19.5%) |
| $75,000 to $99,999 | 5 (2.7%) | 59 (24.0%) |
| $100,000 to $149,999 | 13 (7.0%) | 31 (12.6%) |
| $150,000 or more | 5 (2.7%) | 22 (8.9%) |
| Total | 185 (100.0%) | 246 (100.0%) |
Property Value to Household Income Ratio in Mio
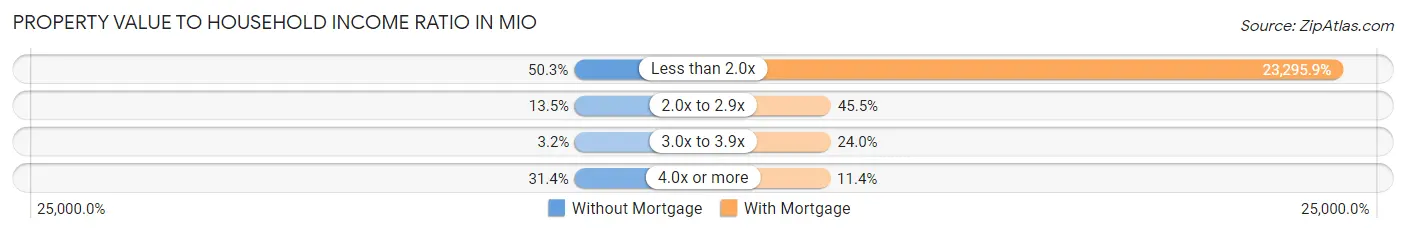
| Value-to-Income Ratio | Without Mortgage | With Mortgage |
| Less than 2.0x | 93 (50.3%) | 57,308 (23,295.9%) |
| 2.0x to 2.9x | 25 (13.5%) | 112 (45.5%) |
| 3.0x to 3.9x | 6 (3.2%) | 59 (24.0%) |
| 4.0x or more | 58 (31.4%) | 28 (11.4%) |
| Total | 185 (100.0%) | 246 (100.0%) |
Real Estate Taxes by Mortgage Status in Mio
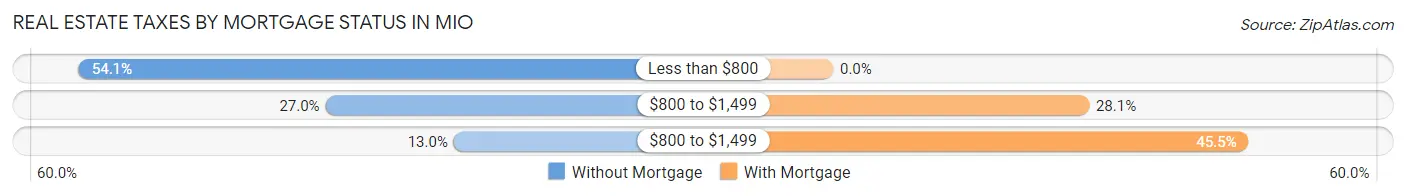
| Property Taxes | Without Mortgage | With Mortgage |
| Less than $800 | 100 (54.0%) | 0 (0.0%) |
| $800 to $1,499 | 50 (27.0%) | 69 (28.1%) |
| $800 to $1,499 | 24 (13.0%) | 112 (45.5%) |
| Total | 185 (100.0%) | 246 (100.0%) |
Health & Disability in Mio
Health Insurance Coverage by Age in Mio
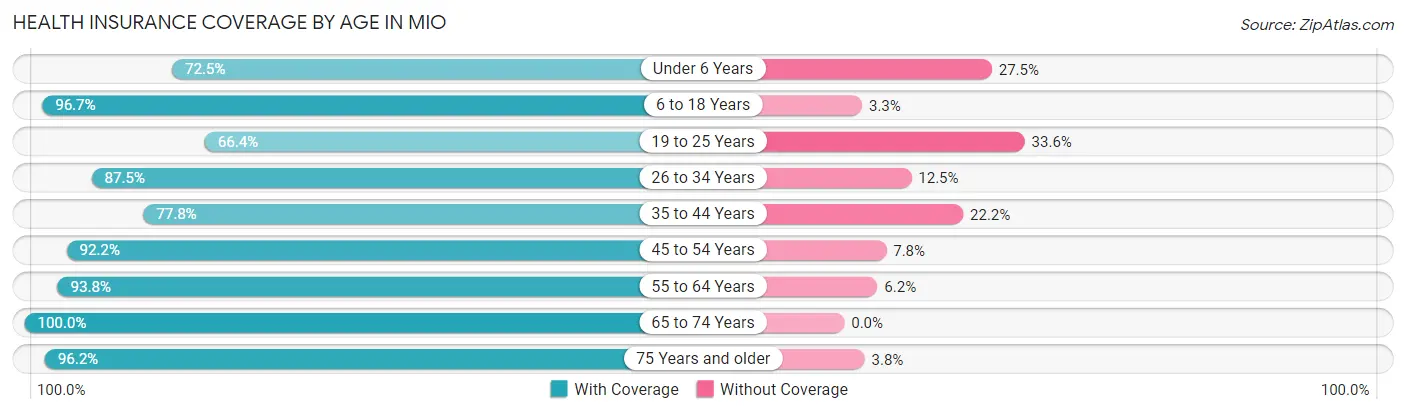
| Age Bracket | With Coverage | Without Coverage |
| Under 6 Years | 58 (72.5%) | 22 (27.5%) |
| 6 to 18 Years | 234 (96.7%) | 8 (3.3%) |
| 19 to 25 Years | 75 (66.4%) | 38 (33.6%) |
| 26 to 34 Years | 105 (87.5%) | 15 (12.5%) |
| 35 to 44 Years | 130 (77.8%) | 37 (22.2%) |
| 45 to 54 Years | 106 (92.2%) | 9 (7.8%) |
| 55 to 64 Years | 228 (93.8%) | 15 (6.2%) |
| 65 to 74 Years | 146 (100.0%) | 0 (0.0%) |
| 75 Years and older | 127 (96.2%) | 5 (3.8%) |
| Total | 1,209 (89.0%) | 149 (11.0%) |
Health Insurance Coverage by Citizenship Status in Mio
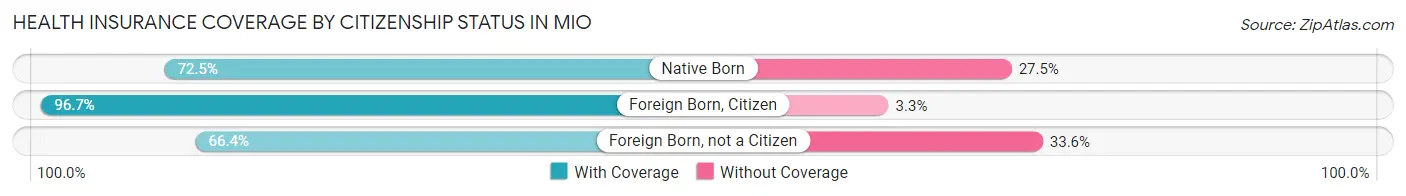
| Citizenship Status | With Coverage | Without Coverage |
| Native Born | 58 (72.5%) | 22 (27.5%) |
| Foreign Born, Citizen | 234 (96.7%) | 8 (3.3%) |
| Foreign Born, not a Citizen | 75 (66.4%) | 38 (33.6%) |
Health Insurance Coverage by Household Income in Mio
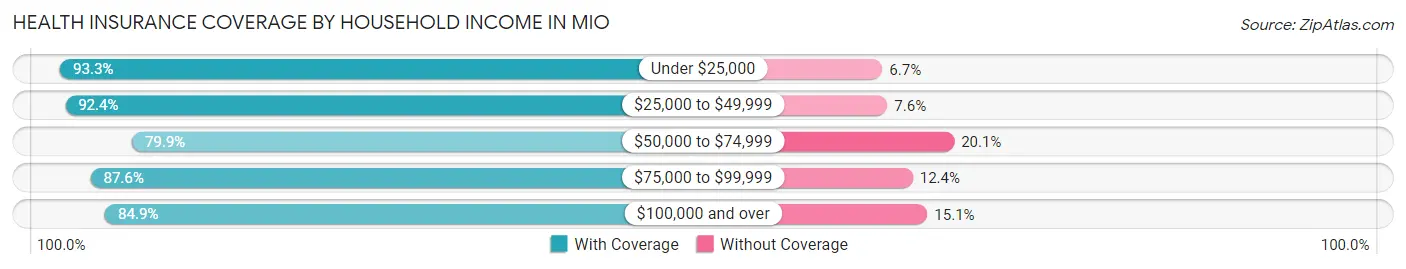
| Household Income | With Coverage | Without Coverage |
| Under $25,000 | 196 (93.3%) | 14 (6.7%) |
| $25,000 to $49,999 | 510 (92.4%) | 42 (7.6%) |
| $50,000 to $74,999 | 135 (79.9%) | 34 (20.1%) |
| $75,000 to $99,999 | 156 (87.6%) | 22 (12.4%) |
| $100,000 and over | 208 (84.9%) | 37 (15.1%) |
Public vs Private Health Insurance Coverage by Age in Mio
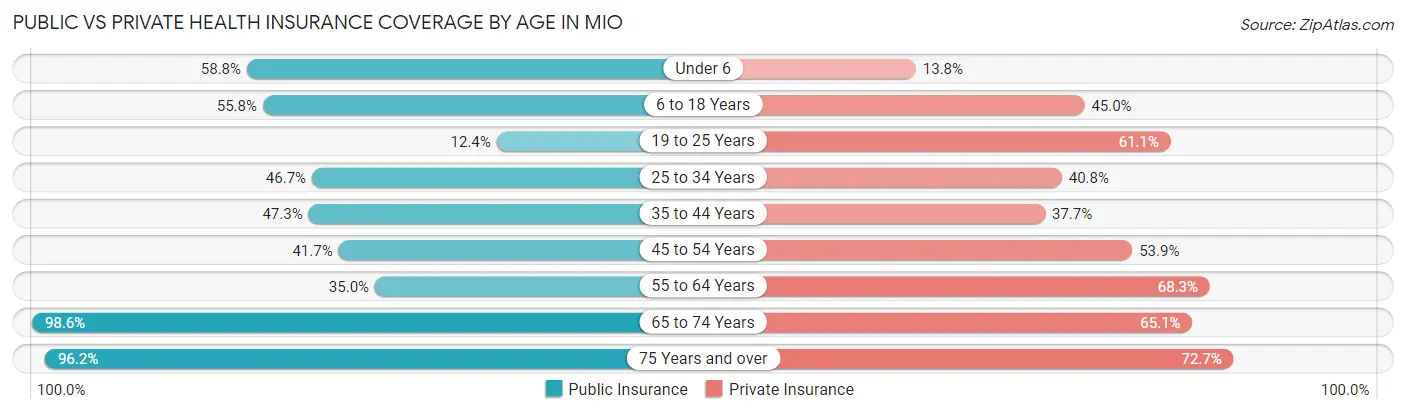
| Age Bracket | Public Insurance | Private Insurance |
| Under 6 | 47 (58.8%) | 11 (13.8%) |
| 6 to 18 Years | 135 (55.8%) | 109 (45.0%) |
| 19 to 25 Years | 14 (12.4%) | 69 (61.1%) |
| 25 to 34 Years | 56 (46.7%) | 49 (40.8%) |
| 35 to 44 Years | 79 (47.3%) | 63 (37.7%) |
| 45 to 54 Years | 48 (41.7%) | 62 (53.9%) |
| 55 to 64 Years | 85 (35.0%) | 166 (68.3%) |
| 65 to 74 Years | 144 (98.6%) | 95 (65.1%) |
| 75 Years and over | 127 (96.2%) | 96 (72.7%) |
| Total | 735 (54.1%) | 720 (53.0%) |
Disability Status by Sex by Age in Mio
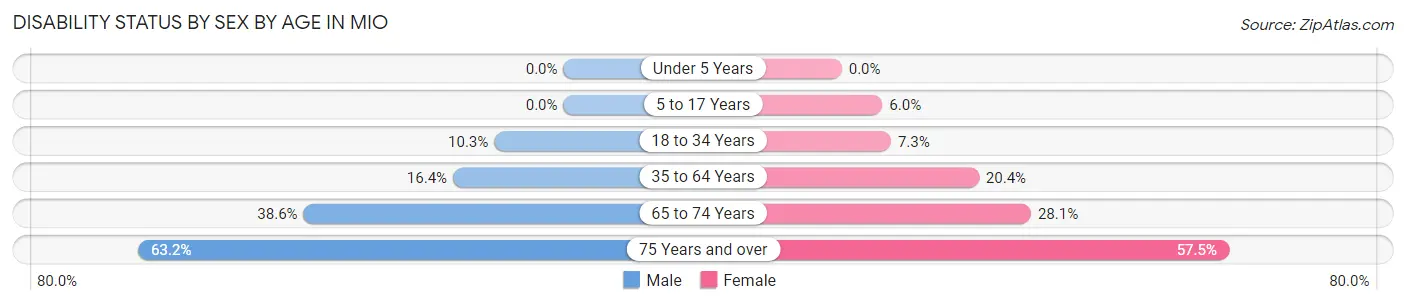
| Age Bracket | Male | Female |
| Under 5 Years | 0 (0.0%) | 0 (0.0%) |
| 5 to 17 Years | 0 (0.0%) | 7 (6.0%) |
| 18 to 34 Years | 11 (10.3%) | 10 (7.3%) |
| 35 to 64 Years | 41 (16.4%) | 56 (20.4%) |
| 65 to 74 Years | 22 (38.6%) | 25 (28.1%) |
| 75 Years and over | 24 (63.2%) | 54 (57.5%) |
Disability Class by Sex by Age in Mio
Disability Class: Hearing Difficulty
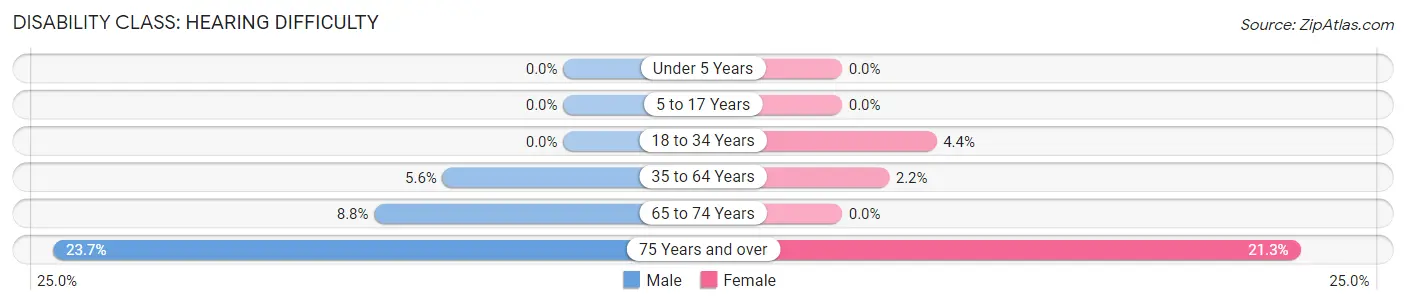
| Age Bracket | Male | Female |
| Under 5 Years | 0 (0.0%) | 0 (0.0%) |
| 5 to 17 Years | 0 (0.0%) | 0 (0.0%) |
| 18 to 34 Years | 0 (0.0%) | 6 (4.4%) |
| 35 to 64 Years | 14 (5.6%) | 6 (2.2%) |
| 65 to 74 Years | 5 (8.8%) | 0 (0.0%) |
| 75 Years and over | 9 (23.7%) | 20 (21.3%) |
Disability Class: Vision Difficulty
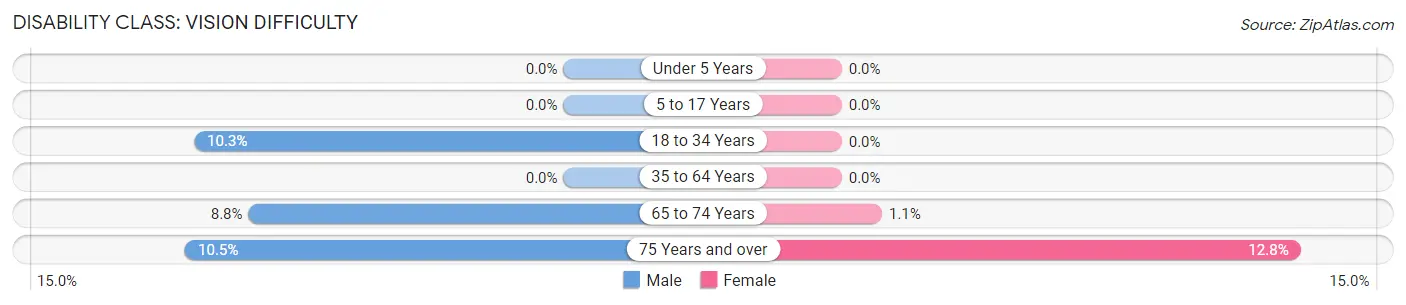
| Age Bracket | Male | Female |
| Under 5 Years | 0 (0.0%) | 0 (0.0%) |
| 5 to 17 Years | 0 (0.0%) | 0 (0.0%) |
| 18 to 34 Years | 11 (10.3%) | 0 (0.0%) |
| 35 to 64 Years | 0 (0.0%) | 0 (0.0%) |
| 65 to 74 Years | 5 (8.8%) | 1 (1.1%) |
| 75 Years and over | 4 (10.5%) | 12 (12.8%) |
Disability Class: Cognitive Difficulty
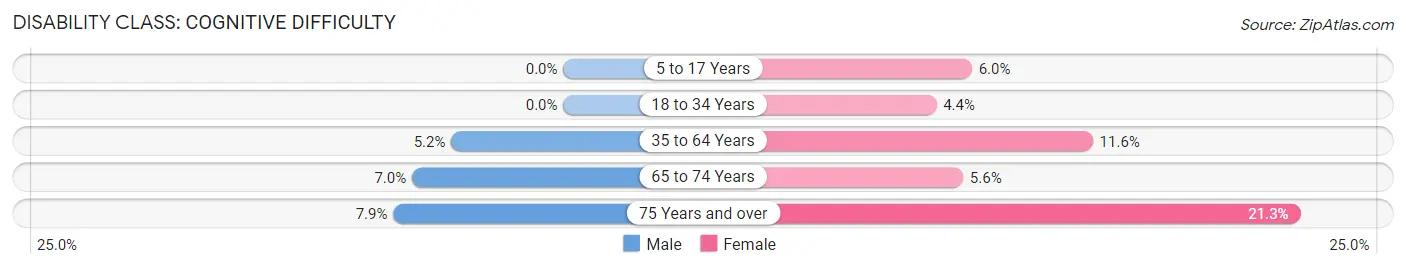
| Age Bracket | Male | Female |
| 5 to 17 Years | 0 (0.0%) | 7 (6.0%) |
| 18 to 34 Years | 0 (0.0%) | 6 (4.4%) |
| 35 to 64 Years | 13 (5.2%) | 32 (11.6%) |
| 65 to 74 Years | 4 (7.0%) | 5 (5.6%) |
| 75 Years and over | 3 (7.9%) | 20 (21.3%) |
Disability Class: Ambulatory Difficulty
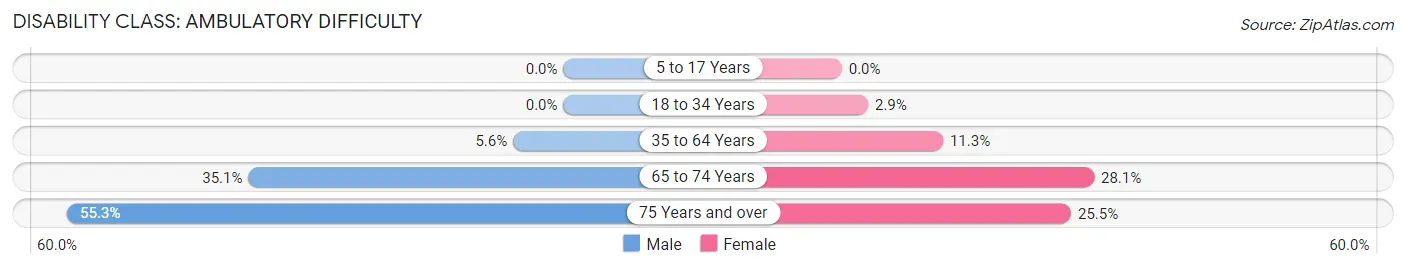
| Age Bracket | Male | Female |
| 5 to 17 Years | 0 (0.0%) | 0 (0.0%) |
| 18 to 34 Years | 0 (0.0%) | 4 (2.9%) |
| 35 to 64 Years | 14 (5.6%) | 31 (11.3%) |
| 65 to 74 Years | 20 (35.1%) | 25 (28.1%) |
| 75 Years and over | 21 (55.3%) | 24 (25.5%) |
Disability Class: Self-Care Difficulty
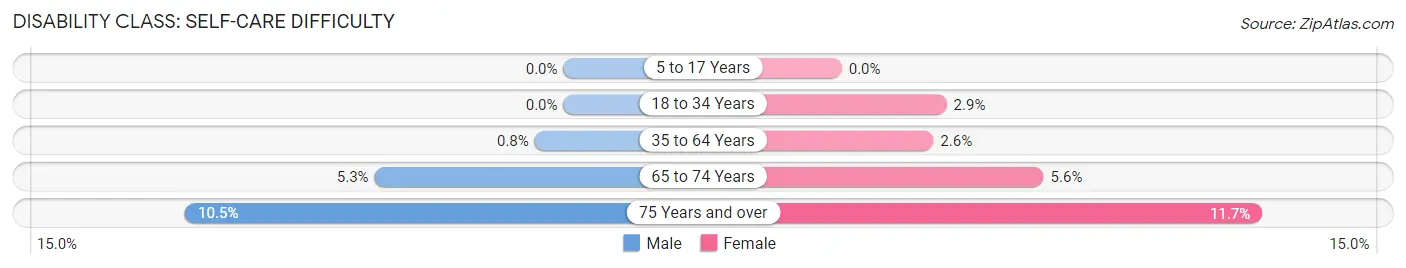
| Age Bracket | Male | Female |
| 5 to 17 Years | 0 (0.0%) | 0 (0.0%) |
| 18 to 34 Years | 0 (0.0%) | 4 (2.9%) |
| 35 to 64 Years | 2 (0.8%) | 7 (2.5%) |
| 65 to 74 Years | 3 (5.3%) | 5 (5.6%) |
| 75 Years and over | 4 (10.5%) | 11 (11.7%) |
Technology Access in Mio
Computing Device Access in Mio
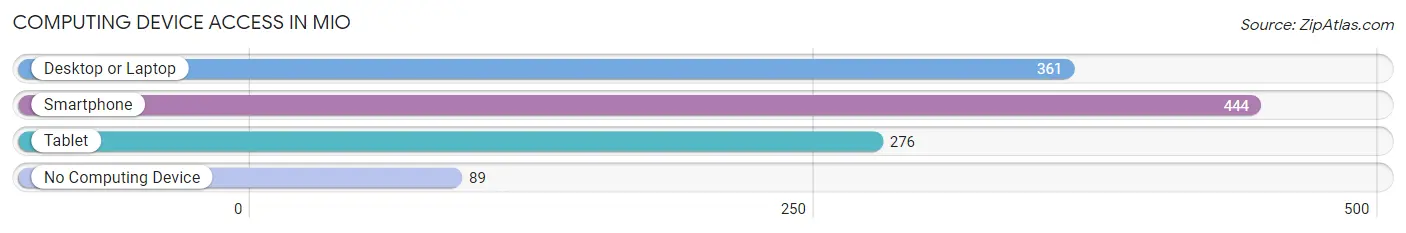
| Device Type | # Households | % Households |
| Desktop or Laptop | 361 | 62.6% |
| Smartphone | 444 | 76.9% |
| Tablet | 276 | 47.8% |
| No Computing Device | 89 | 15.4% |
| Total | 577 | 100.0% |
Internet Access in Mio
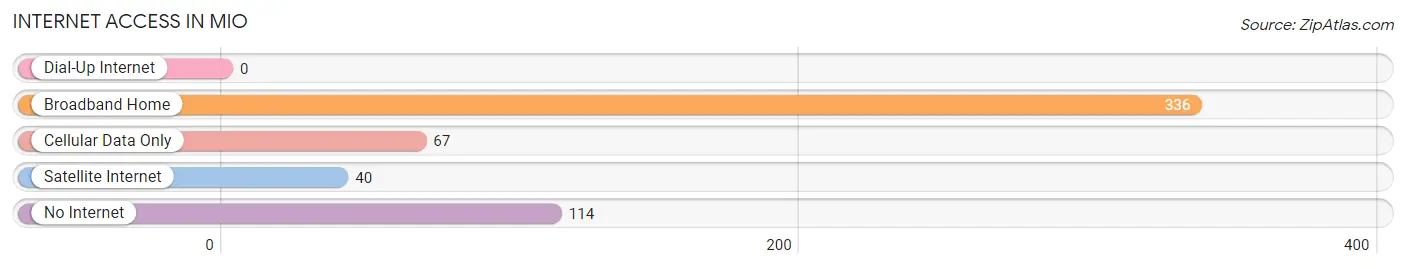
| Internet Type | # Households | % Households |
| Dial-Up Internet | 0 | 0.0% |
| Broadband Home | 336 | 58.2% |
| Cellular Data Only | 67 | 11.6% |
| Satellite Internet | 40 | 6.9% |
| No Internet | 114 | 19.8% |
| Total | 577 | 100.0% |
Mio Summary
Mio is a small unincorporated community located in Oscoda County, Michigan. It is situated in the northern part of the state, approximately 20 miles south of Alpena and 30 miles west of Tawas City. The population of Mio was 1,845 in the 2010 census.
History
Mio was first settled in 1875 by a group of lumberjacks from Canada. The town was originally called “Mio Station” and was a stop on the Detroit, Bay City and Alpena Railroad. The name was changed to Mio in 1882.
The town grew rapidly in the late 19th century due to the lumber industry. The town was home to several sawmills, a grist mill, a tannery, and a shingle mill. The lumber industry declined in the early 20th century, but the town continued to grow due to the tourism industry.
Geography
Mio is located in the northern part of Michigan, in Oscoda County. It is situated on the Au Sable River, which is a popular destination for canoeing and fishing. The town is surrounded by forests and lakes, including the Au Sable State Forest and the Huron National Forest.
The climate in Mio is humid continental, with cold winters and warm summers. The average temperature in January is 22°F (-6°C) and the average temperature in July is 73°F (23°C).
Economy
Mio’s economy is largely based on tourism. The town is home to several resorts and campgrounds, as well as a variety of outdoor activities such as fishing, hunting, and canoeing. The town is also home to several small businesses, including restaurants, shops, and a grocery store.
Demographics
As of the 2010 census, the population of Mio was 1,845. The racial makeup of the town was 95.3% White, 0.7% African American, 0.3% Native American, 0.2% Asian, 0.1% Pacific Islander, and 3.4% from other races. The median household income was $31,250 and the median family income was $37,500. The per capita income was $17,845.
Mio is a small, rural community with a strong sense of community. The town is home to a variety of churches, schools, and organizations that help to bring the community together. The town is also home to a variety of festivals and events throughout the year, including the Mio Summer Festival and the Mio Winter Festival.
Common Questions
What is Per Capita Income in Mio?
Per Capita income in Mio is $24,903.
What is the Median Family Income in Mio?
Median Family Income in Mio is $46,420.
What is the Median Household income in Mio?
Median Household Income in Mio is $43,750.
What is Income or Wage Gap in Mio?
Income or Wage Gap in Mio is 13.4%.
Women in Mio earn 86.6 cents for every dollar earned by a man.
What is Inequality or Gini Index in Mio?
Inequality or Gini Index in Mio is 0.42.
What is the Total Population of Mio?
Total Population of Mio is 1,358.
What is the Total Male Population of Mio?
Total Male Population of Mio is 616.
What is the Total Female Population of Mio?
Total Female Population of Mio is 742.
What is the Ratio of Males per 100 Females in Mio?
There are 83.02 Males per 100 Females in Mio.
What is the Ratio of Females per 100 Males in Mio?
There are 120.45 Females per 100 Males in Mio.
What is the Median Population Age in Mio?
Median Population Age in Mio is 42.8 Years.
What is the Average Family Size in Mio
Average Family Size in Mio is 2.9 People.
What is the Average Household Size in Mio
Average Household Size in Mio is 2.4 People.
How Large is the Labor Force in Mio?
There are 638 People in the Labor Forcein in Mio.
What is the Percentage of People in the Labor Force in Mio?
57.3% of People are in the Labor Force in Mio.
What is the Unemployment Rate in Mio?
Unemployment Rate in Mio is 15.5%.