Millersburg, MI Map & Demographics
Millersburg Map
Millersburg Overview
$21,107
PER CAPITA INCOME
$42,188
AVG FAMILY INCOME
$41,875
AVG HOUSEHOLD INCOME
23.0%
WAGE / INCOME GAP [ % ]
77.0¢/ $1
WAGE / INCOME GAP [ $ ]
0.41
INEQUALITY / GINI INDEX
162
TOTAL POPULATION
86
MALE POPULATION
76
FEMALE POPULATION
113.16
MALES / 100 FEMALES
88.37
FEMALES / 100 MALES
54.3
MEDIAN AGE
2.8
AVG FAMILY SIZE
2.4
AVG HOUSEHOLD SIZE
52
LABOR FORCE [ PEOPLE ]
37.7%
PERCENT IN LABOR FORCE
5.8%
UNEMPLOYMENT RATE
Millersburg Zip Codes
Millersburg Area Codes
Income in Millersburg
Income Overview in Millersburg
Per Capita Income in Millersburg is $21,107, while median incomes of families and households are $42,188 and $41,875 respectively.
| Characteristic | Number | Measure |
| Per Capita Income | 162 | $21,107 |
| Median Family Income | 45 | $42,188 |
| Mean Family Income | 45 | $49,691 |
| Median Household Income | 68 | $41,875 |
| Mean Household Income | 68 | $47,356 |
| Income Deficit | 45 | $0 |
| Wage / Income Gap (%) | 162 | 22.97% |
| Wage / Income Gap ($) | 162 | 77.03¢ per $1 |
| Gini / Inequality Index | 162 | 0.41 |
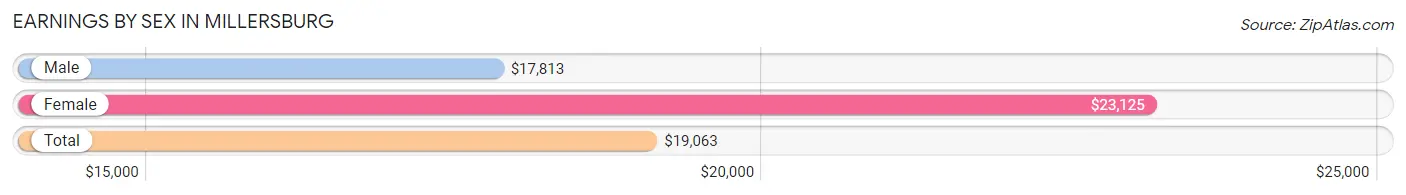
Earnings by Sex in Millersburg
Average Earnings in Millersburg are $19,063, $17,813 for men and $23,125 for women, a difference of 23.0%.
| Sex | Number | Average Earnings |
| Male | 45 (69.2%) | $17,813 |
| Female | 20 (30.8%) | $23,125 |
| Total | 65 (100.0%) | $19,063 |
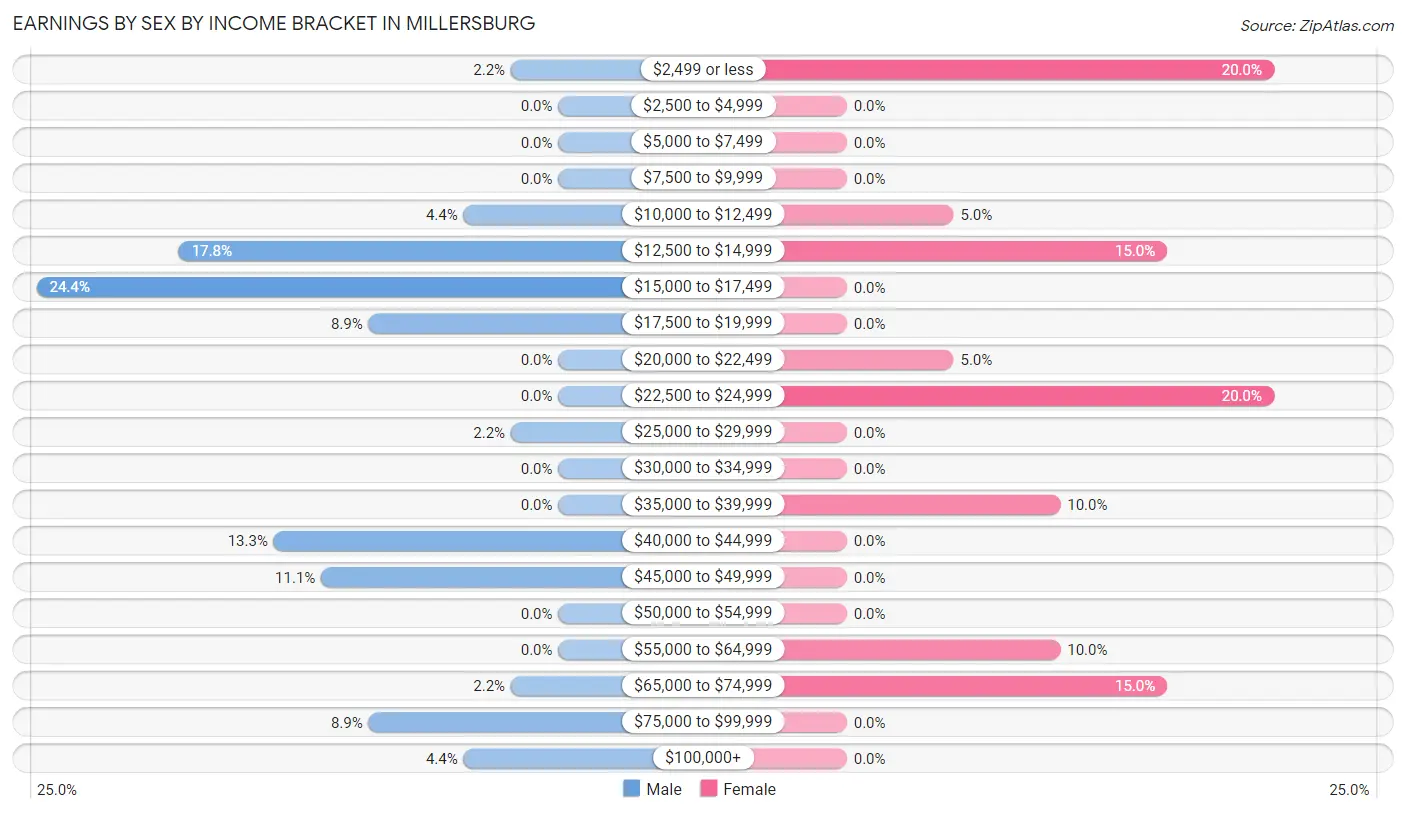
Earnings by Sex by Income Bracket in Millersburg
The most common earnings brackets in Millersburg are $15,000 to $17,499 for men (11 | 24.4%) and $2,499 or less for women (4 | 20.0%).
| Income | Male | Female |
| $2,499 or less | 1 (2.2%) | 4 (20.0%) |
| $2,500 to $4,999 | 0 (0.0%) | 0 (0.0%) |
| $5,000 to $7,499 | 0 (0.0%) | 0 (0.0%) |
| $7,500 to $9,999 | 0 (0.0%) | 0 (0.0%) |
| $10,000 to $12,499 | 2 (4.4%) | 1 (5.0%) |
| $12,500 to $14,999 | 8 (17.8%) | 3 (15.0%) |
| $15,000 to $17,499 | 11 (24.4%) | 0 (0.0%) |
| $17,500 to $19,999 | 4 (8.9%) | 0 (0.0%) |
| $20,000 to $22,499 | 0 (0.0%) | 1 (5.0%) |
| $22,500 to $24,999 | 0 (0.0%) | 4 (20.0%) |
| $25,000 to $29,999 | 1 (2.2%) | 0 (0.0%) |
| $30,000 to $34,999 | 0 (0.0%) | 0 (0.0%) |
| $35,000 to $39,999 | 0 (0.0%) | 2 (10.0%) |
| $40,000 to $44,999 | 6 (13.3%) | 0 (0.0%) |
| $45,000 to $49,999 | 5 (11.1%) | 0 (0.0%) |
| $50,000 to $54,999 | 0 (0.0%) | 0 (0.0%) |
| $55,000 to $64,999 | 0 (0.0%) | 2 (10.0%) |
| $65,000 to $74,999 | 1 (2.2%) | 3 (15.0%) |
| $75,000 to $99,999 | 4 (8.9%) | 0 (0.0%) |
| $100,000+ | 2 (4.4%) | 0 (0.0%) |
| Total | 45 (100.0%) | 20 (100.0%) |
Earnings by Sex by Educational Attainment in Millersburg
| Educational Attainment | Male Income | Female Income |
| Less than High School | - | - |
| High School Diploma | - | - |
| College or Associate's Degree | - | - |
| Bachelor's Degree | - | - |
| Graduate Degree | - | - |
| Total | $41,875 | $23,438 |
Family Income in Millersburg
Family Income Brackets in Millersburg
According to the Millersburg family income data, there are 13 families falling into the $35,000 to $49,999 income range, which is the most common income bracket and makes up 28.9% of all families.
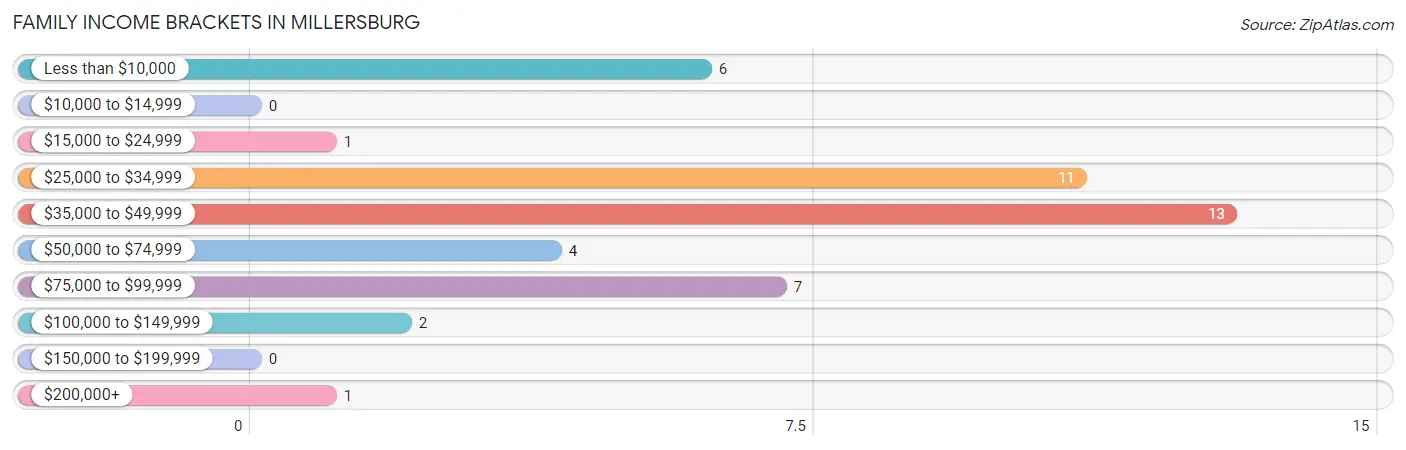
| Income Bracket | # Families | % Families |
| Less than $10,000 | 6 | 13.3% |
| $10,000 to $14,999 | 0 | 0.0% |
| $15,000 to $24,999 | 1 | 2.2% |
| $25,000 to $34,999 | 11 | 24.4% |
| $35,000 to $49,999 | 13 | 28.9% |
| $50,000 to $74,999 | 4 | 8.9% |
| $75,000 to $99,999 | 7 | 15.6% |
| $100,000 to $149,999 | 2 | 4.4% |
| $150,000 to $199,999 | 0 | 0.0% |
| $200,000+ | 1 | 2.2% |
Family Income by Famaliy Size in Millersburg
3-person families (16 | 35.6%) account for the highest median family income in Millersburg with $42,500 per family, while 3-person families (16 | 35.6%) have the highest median income of $14,167 per family member.
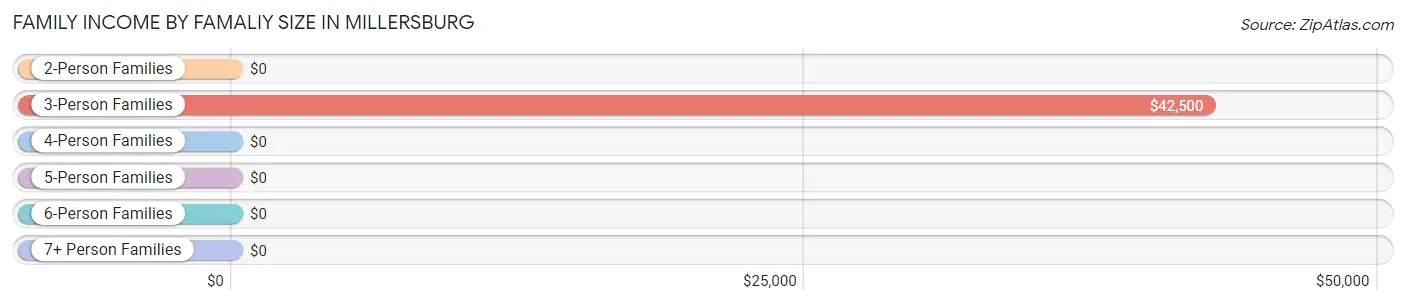
| Income Bracket | # Families | Median Income |
| 2-Person Families | 19 (42.2%) | $0 |
| 3-Person Families | 16 (35.6%) | $42,500 |
| 4-Person Families | 4 (8.9%) | $0 |
| 5-Person Families | 6 (13.3%) | $0 |
| 6-Person Families | 0 (0.0%) | $0 |
| 7+ Person Families | 0 (0.0%) | $0 |
| Total | 45 (100.0%) | $42,188 |
Family Income by Number of Earners in Millersburg
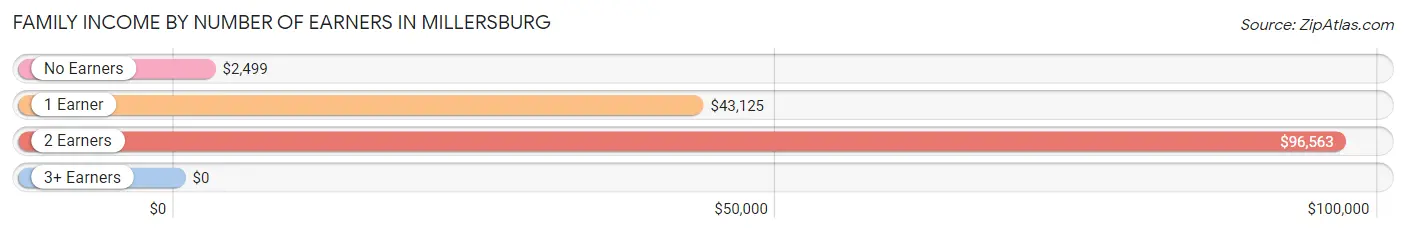
| Number of Earners | # Families | Median Income |
| No Earners | 10 (22.2%) | $2,499 |
| 1 Earner | 24 (53.3%) | $43,125 |
| 2 Earners | 9 (20.0%) | $96,563 |
| 3+ Earners | 2 (4.4%) | $0 |
| Total | 45 (100.0%) | $42,188 |
Household Income in Millersburg
Household Income Brackets in Millersburg
With 16 households falling in the category, the $50,000 to $74,999 income range is the most frequent in Millersburg, accounting for 23.5% of all households.
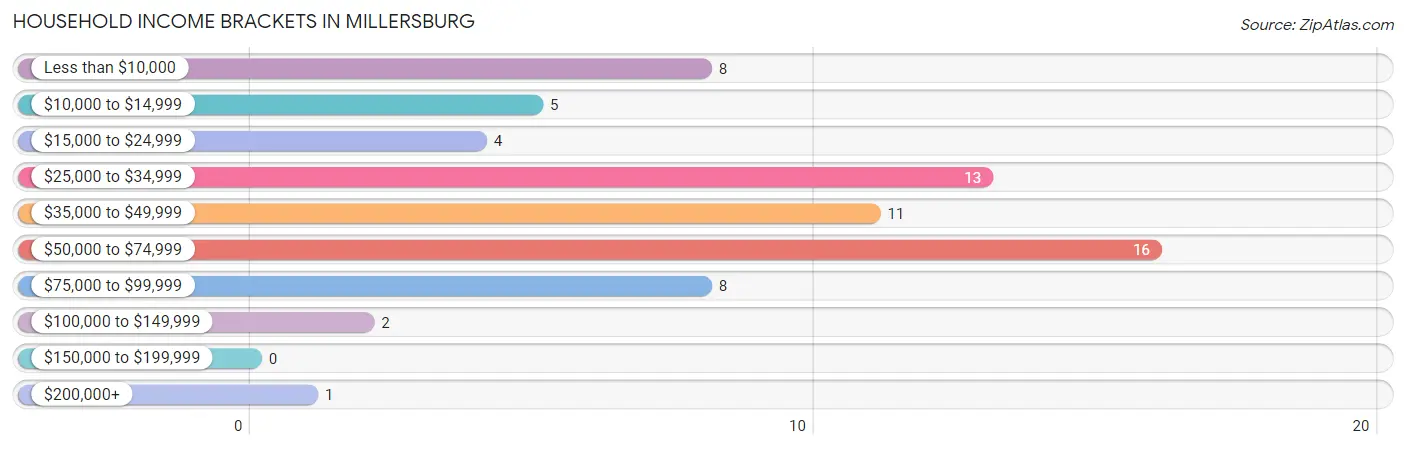
| Income Bracket | # Households | % Households |
| Less than $10,000 | 8 | 11.8% |
| $10,000 to $14,999 | 5 | 7.4% |
| $15,000 to $24,999 | 4 | 5.9% |
| $25,000 to $34,999 | 13 | 19.1% |
| $35,000 to $49,999 | 11 | 16.2% |
| $50,000 to $74,999 | 16 | 23.5% |
| $75,000 to $99,999 | 8 | 11.8% |
| $100,000 to $149,999 | 2 | 2.9% |
| $150,000 to $199,999 | 0 | 0.0% |
| $200,000+ | 1 | 1.5% |
Household Income by Householder Age in Millersburg
The median household income in Millersburg is $41,875, with the highest median household income of $56,875 found in the 25 to 44 years age bracket for the primary householder. A total of 14 households (20.6%) fall into this category.
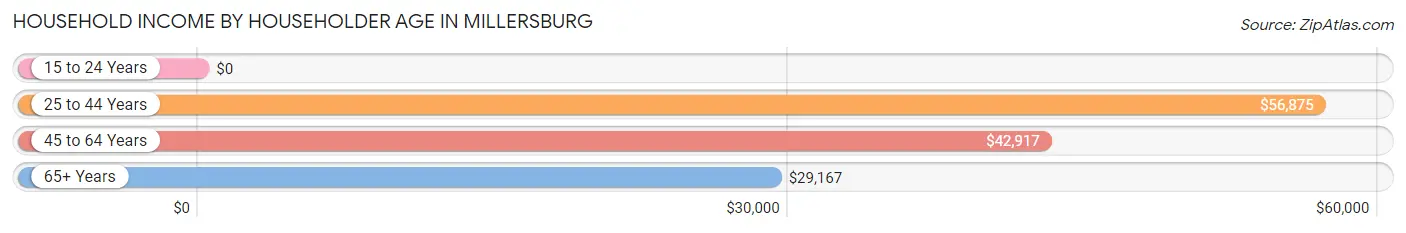
| Income Bracket | # Households | Median Income |
| 15 to 24 Years | 0 (0.0%) | $0 |
| 25 to 44 Years | 14 (20.6%) | $56,875 |
| 45 to 64 Years | 24 (35.3%) | $42,917 |
| 65+ Years | 30 (44.1%) | $29,167 |
| Total | 68 (100.0%) | $41,875 |
Poverty in Millersburg
Income Below Poverty by Sex and Age in Millersburg
With 20.0% poverty level for males and 36.8% for females among the residents of Millersburg, 15 year old males and 15 year old females are the most vulnerable to poverty, with 2 males (100.0%) and 2 females (100.0%) in their respective age groups living below the poverty level.
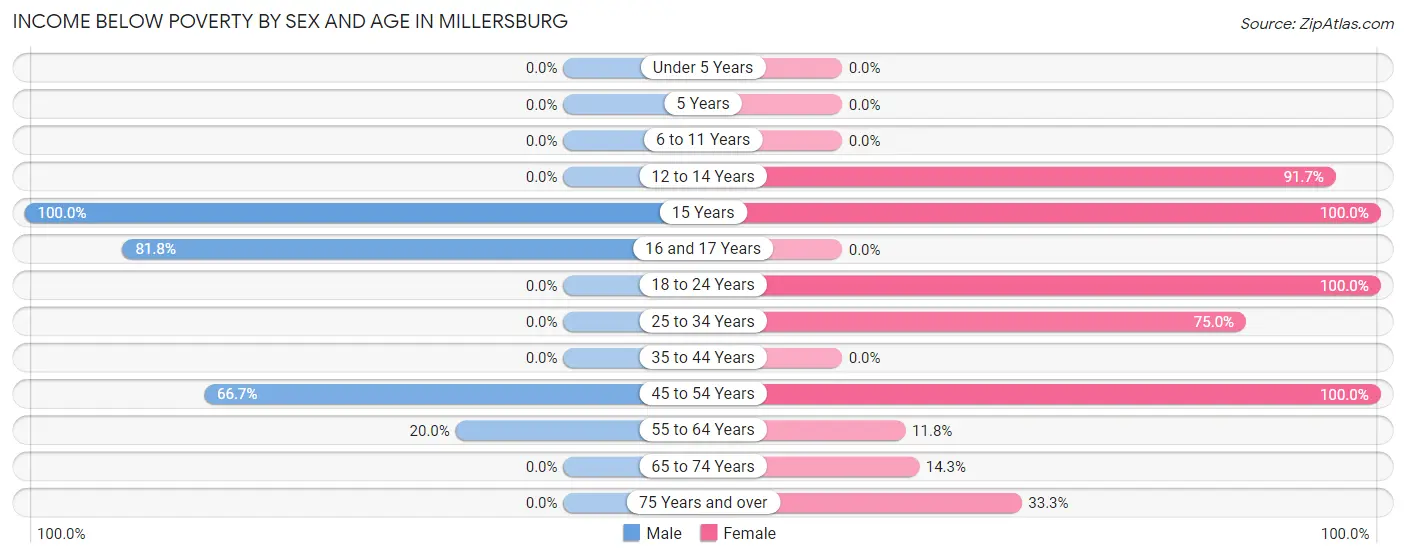
| Age Bracket | Male | Female |
| Under 5 Years | 0 (0.0%) | 0 (0.0%) |
| 5 Years | 0 (0.0%) | 0 (0.0%) |
| 6 to 11 Years | 0 (0.0%) | 0 (0.0%) |
| 12 to 14 Years | 0 (0.0%) | 11 (91.7%) |
| 15 Years | 2 (100.0%) | 2 (100.0%) |
| 16 and 17 Years | 9 (81.8%) | 0 (0.0%) |
| 18 to 24 Years | 0 (0.0%) | 1 (100.0%) |
| 25 to 34 Years | 0 (0.0%) | 3 (75.0%) |
| 35 to 44 Years | 0 (0.0%) | 0 (0.0%) |
| 45 to 54 Years | 2 (66.7%) | 4 (100.0%) |
| 55 to 64 Years | 4 (20.0%) | 2 (11.8%) |
| 65 to 74 Years | 0 (0.0%) | 2 (14.3%) |
| 75 Years and over | 0 (0.0%) | 3 (33.3%) |
| Total | 17 (20.0%) | 28 (36.8%) |
Income Above Poverty by Sex and Age in Millersburg
According to the poverty statistics in Millersburg, males aged 6 to 11 years and females aged 5 years are the age groups that are most secure financially, with 100.0% of males and 100.0% of females in these age groups living above the poverty line.
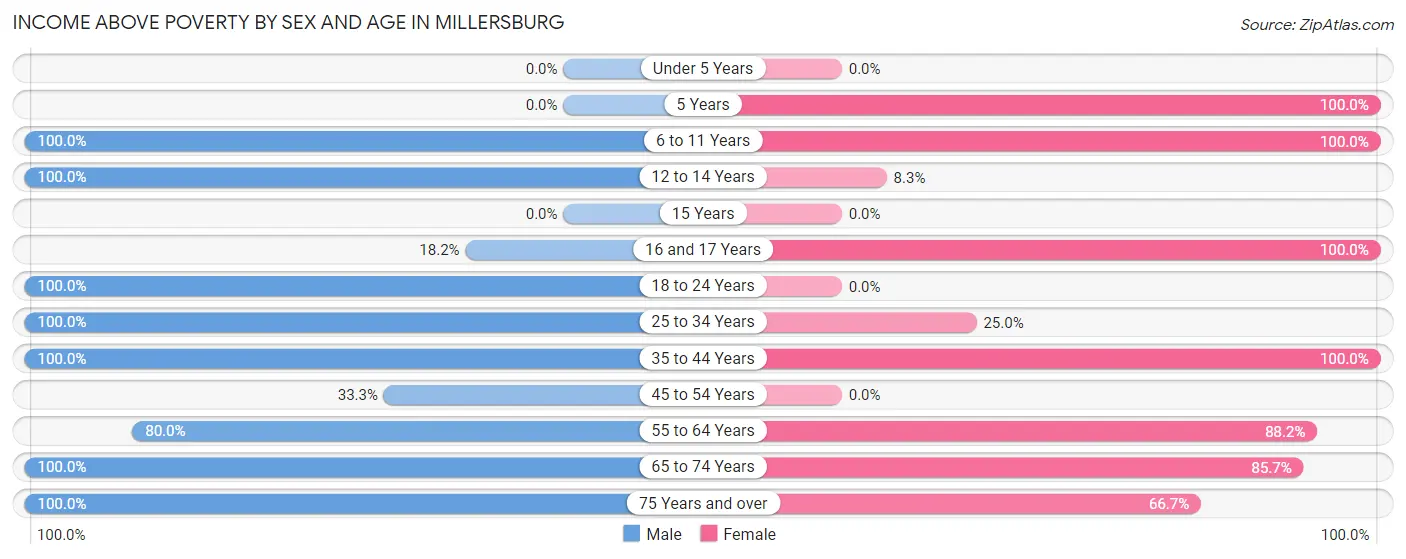
| Age Bracket | Male | Female |
| Under 5 Years | 0 (0.0%) | 0 (0.0%) |
| 5 Years | 0 (0.0%) | 1 (100.0%) |
| 6 to 11 Years | 2 (100.0%) | 2 (100.0%) |
| 12 to 14 Years | 2 (100.0%) | 1 (8.3%) |
| 15 Years | 0 (0.0%) | 0 (0.0%) |
| 16 and 17 Years | 2 (18.2%) | 5 (100.0%) |
| 18 to 24 Years | 12 (100.0%) | 0 (0.0%) |
| 25 to 34 Years | 9 (100.0%) | 1 (25.0%) |
| 35 to 44 Years | 6 (100.0%) | 5 (100.0%) |
| 45 to 54 Years | 1 (33.3%) | 0 (0.0%) |
| 55 to 64 Years | 16 (80.0%) | 15 (88.2%) |
| 65 to 74 Years | 9 (100.0%) | 12 (85.7%) |
| 75 Years and over | 9 (100.0%) | 6 (66.7%) |
| Total | 68 (80.0%) | 48 (63.2%) |
Income Below Poverty Among Married-Couple Families in Millersburg
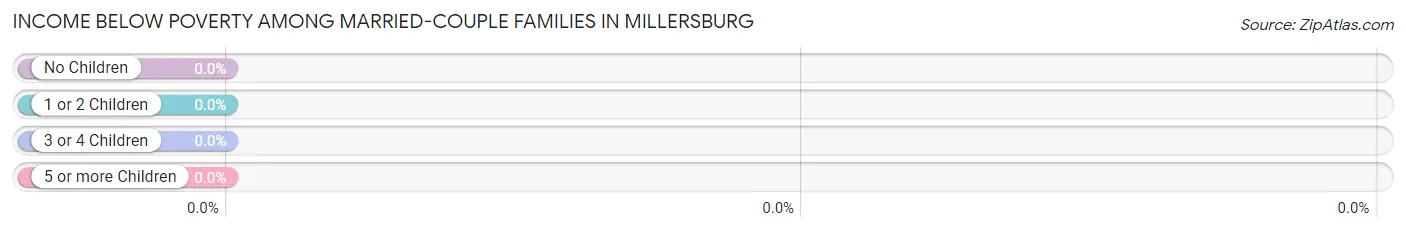
| Children | Above Poverty | Below Poverty |
| No Children | 18 (100.0%) | 0 (0.0%) |
| 1 or 2 Children | 4 (100.0%) | 0 (0.0%) |
| 3 or 4 Children | 0 (0.0%) | 0 (0.0%) |
| 5 or more Children | 0 (0.0%) | 0 (0.0%) |
| Total | 22 (100.0%) | 0 (0.0%) |
Income Below Poverty Among Single-Parent Households in Millersburg
According to the poverty data in Millersburg, 17.6% or 3 single-father households and 66.7% or 4 single-mother households are living below the poverty line. Among single-father households, those with 1 or 2 children have the highest poverty rate, with 3 households (60.0%) experiencing poverty. Likewise, among single-mother households, those with 3 or 4 children have the highest poverty rate, with 4 households (100.0%) falling below the poverty line.
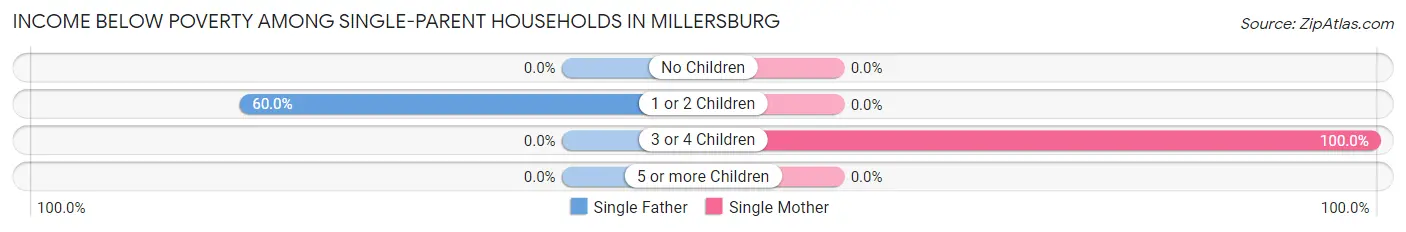
| Children | Single Father | Single Mother |
| No Children | 0 (0.0%) | 0 (0.0%) |
| 1 or 2 Children | 3 (60.0%) | 0 (0.0%) |
| 3 or 4 Children | 0 (0.0%) | 4 (100.0%) |
| 5 or more Children | 0 (0.0%) | 0 (0.0%) |
| Total | 3 (17.6%) | 4 (66.7%) |
Income Below Poverty Among Married-Couple vs Single-Parent Households in Millersburg
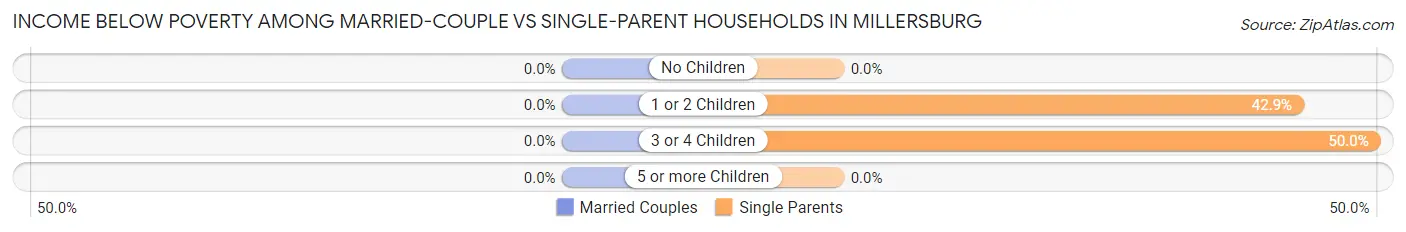
| Children | Married-Couple Families | Single-Parent Households |
| No Children | 0 (0.0%) | 0 (0.0%) |
| 1 or 2 Children | 0 (0.0%) | 3 (42.9%) |
| 3 or 4 Children | 0 (0.0%) | 4 (50.0%) |
| 5 or more Children | 0 (0.0%) | 0 (0.0%) |
| Total | 0 (0.0%) | 7 (30.4%) |
Race in Millersburg
The most populous races in Millersburg are White / Caucasian (152 | 93.8%), Black / African American (5 | 3.1%), and Two or more Races (5 | 3.1%).
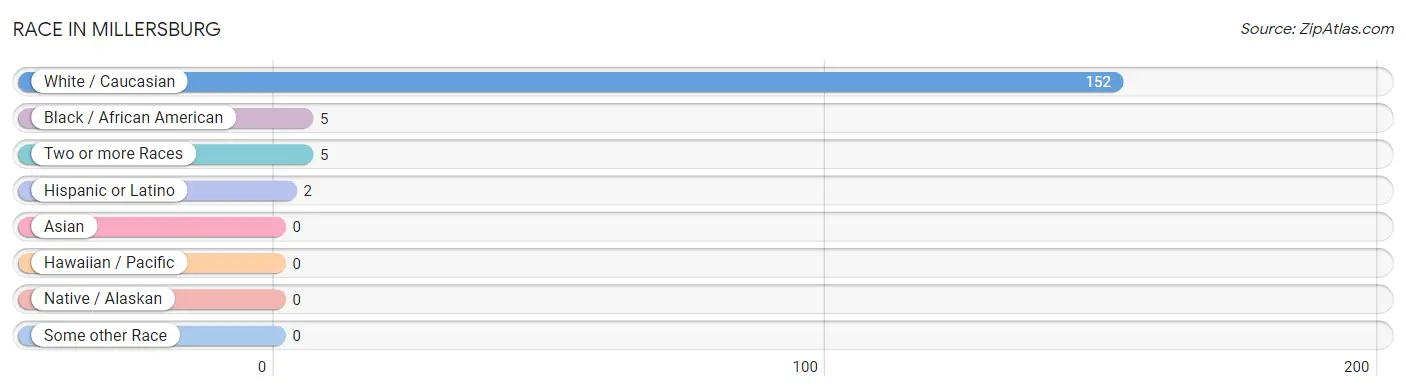
| Race | # Population | % Population |
| Asian | 0 | 0.0% |
| Black / African American | 5 | 3.1% |
| Hawaiian / Pacific | 0 | 0.0% |
| Hispanic or Latino | 2 | 1.2% |
| Native / Alaskan | 0 | 0.0% |
| White / Caucasian | 152 | 93.8% |
| Two or more Races | 5 | 3.1% |
| Some other Race | 0 | 0.0% |
| Total | 162 | 100.0% |
Ancestry in Millersburg
The most populous ancestries reported in Millersburg are German (48 | 29.6%), American (24 | 14.8%), English (13 | 8.0%), Irish (13 | 8.0%), and French (9 | 5.6%), together accounting for 66.0% of all Millersburg residents.
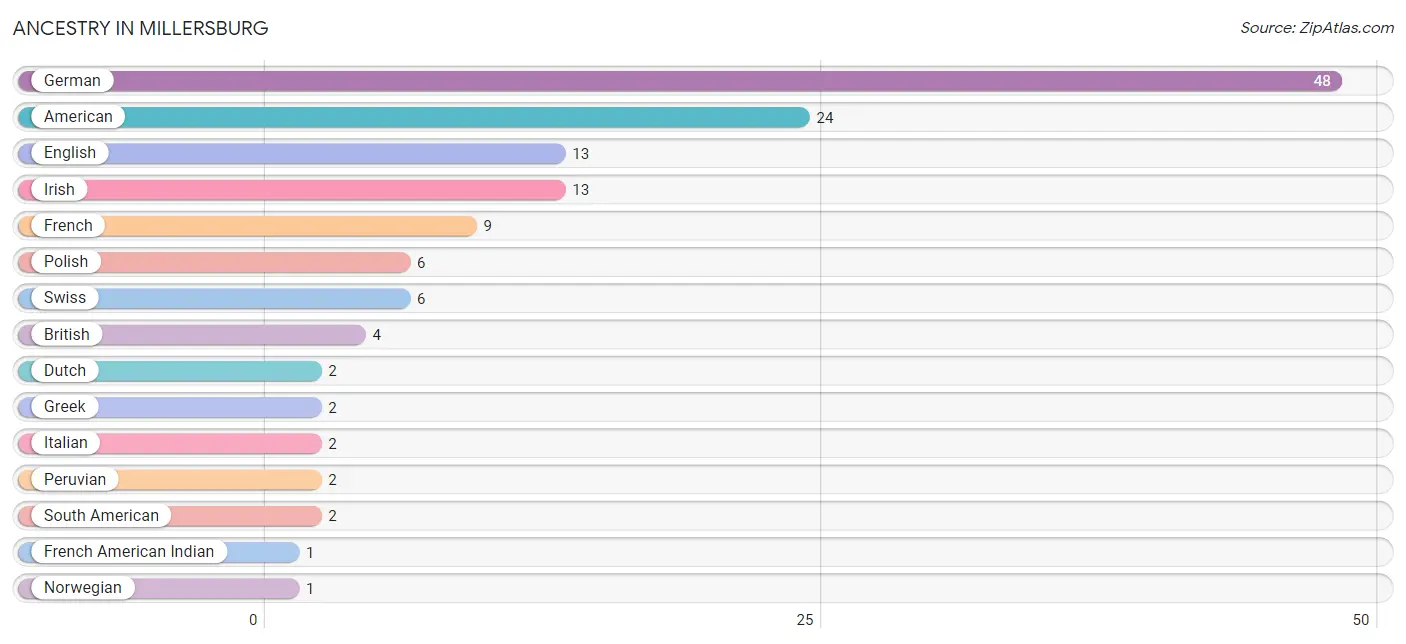
| Ancestry | # Population | % Population |
| American | 24 | 14.8% |
| British | 4 | 2.5% |
| Dutch | 2 | 1.2% |
| English | 13 | 8.0% |
| French | 9 | 5.6% |
| French American Indian | 1 | 0.6% |
| German | 48 | 29.6% |
| Greek | 2 | 1.2% |
| Irish | 13 | 8.0% |
| Italian | 2 | 1.2% |
| Norwegian | 1 | 0.6% |
| Peruvian | 2 | 1.2% |
| Polish | 6 | 3.7% |
| Scottish | 1 | 0.6% |
| South American | 2 | 1.2% |
| Swiss | 6 | 3.7% | View All 16 Rows |
Immigrants in Millersburg
The most numerous immigrant groups reported in Millersburg came from Latin America (2 | 1.2%), Peru (2 | 1.2%), and South America (2 | 1.2%), together accounting for 3.7% of all Millersburg residents.
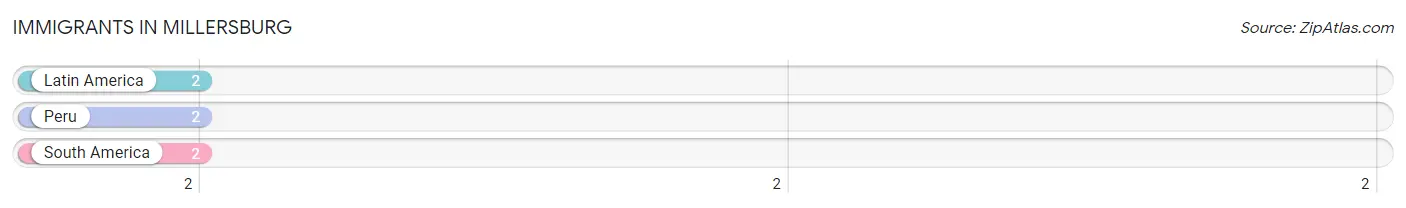
| Immigration Origin | # Population | % Population |
| Latin America | 2 | 1.2% |
| Peru | 2 | 1.2% |
| South America | 2 | 1.2% | View All 3 Rows |
Sex and Age in Millersburg
Sex and Age in Millersburg
The most populous age groups in Millersburg are 15 to 19 Years (13 | 15.1%) for men and 10 to 14 Years (14 | 18.4%) for women.
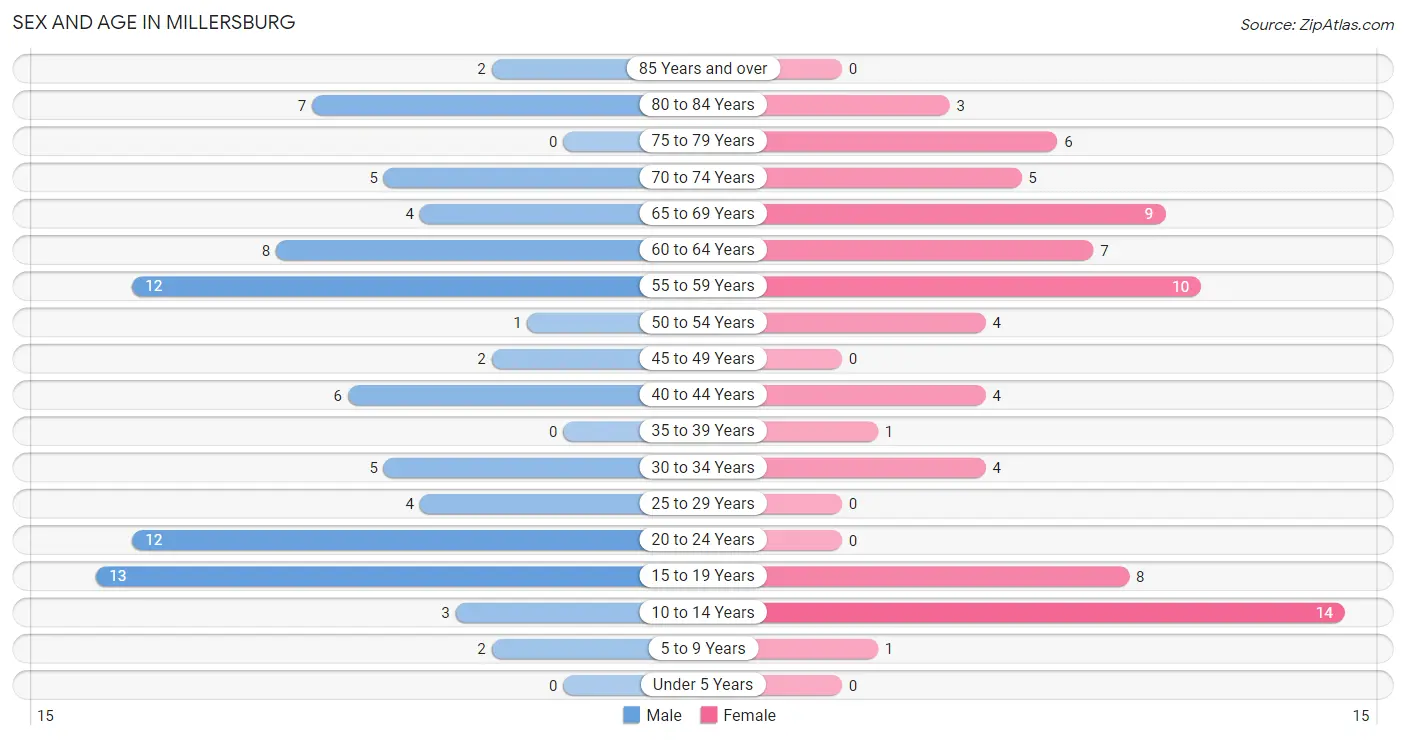
| Age Bracket | Male | Female |
| Under 5 Years | 0 (0.0%) | 0 (0.0%) |
| 5 to 9 Years | 2 (2.3%) | 1 (1.3%) |
| 10 to 14 Years | 3 (3.5%) | 14 (18.4%) |
| 15 to 19 Years | 13 (15.1%) | 8 (10.5%) |
| 20 to 24 Years | 12 (14.0%) | 0 (0.0%) |
| 25 to 29 Years | 4 (4.6%) | 0 (0.0%) |
| 30 to 34 Years | 5 (5.8%) | 4 (5.3%) |
| 35 to 39 Years | 0 (0.0%) | 1 (1.3%) |
| 40 to 44 Years | 6 (7.0%) | 4 (5.3%) |
| 45 to 49 Years | 2 (2.3%) | 0 (0.0%) |
| 50 to 54 Years | 1 (1.2%) | 4 (5.3%) |
| 55 to 59 Years | 12 (14.0%) | 10 (13.2%) |
| 60 to 64 Years | 8 (9.3%) | 7 (9.2%) |
| 65 to 69 Years | 4 (4.6%) | 9 (11.8%) |
| 70 to 74 Years | 5 (5.8%) | 5 (6.6%) |
| 75 to 79 Years | 0 (0.0%) | 6 (7.9%) |
| 80 to 84 Years | 7 (8.1%) | 3 (4.0%) |
| 85 Years and over | 2 (2.3%) | 0 (0.0%) |
| Total | 86 (100.0%) | 76 (100.0%) |
Families and Households in Millersburg
Median Family Size in Millersburg
The median family size in Millersburg is 2.84 persons per family, with single female/mother families (6 | 13.3%) accounting for the largest median family size of 4.17 persons per family. On the other hand, single male/father families (17 | 37.8%) represent the smallest median family size with 2.53 persons per family.
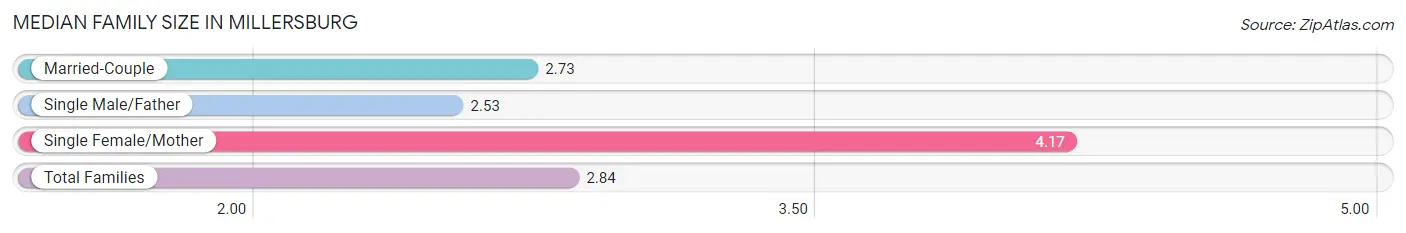
| Family Type | # Families | Family Size |
| Married-Couple | 22 (48.9%) | 2.73 |
| Single Male/Father | 17 (37.8%) | 2.53 |
| Single Female/Mother | 6 (13.3%) | 4.17 |
| Total Families | 45 (100.0%) | 2.84 |
Median Household Size in Millersburg
The median household size in Millersburg is 2.38 persons per household, with single female/mother households (6 | 8.8%) accounting for the largest median household size of 4.17 persons per household. non-family households (23 | 33.8%) represent the smallest median household size with 1.26 persons per household.
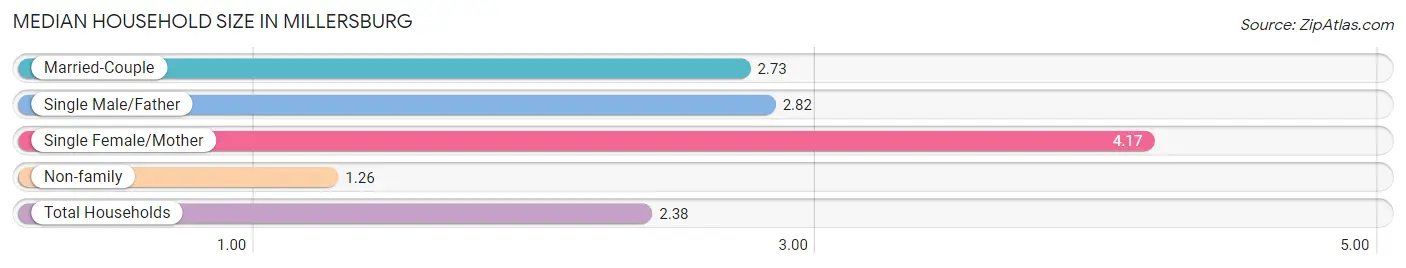
| Household Type | # Households | Household Size |
| Married-Couple | 22 (32.4%) | 2.73 |
| Single Male/Father | 17 (25.0%) | 2.82 |
| Single Female/Mother | 6 (8.8%) | 4.17 |
| Non-family | 23 (33.8%) | 1.26 |
| Total Households | 68 (100.0%) | 2.38 |
Household Size by Marriage Status in Millersburg
Out of a total of 68 households in Millersburg, 45 (66.2%) are family households, while 23 (33.8%) are nonfamily households. The most numerous type of family households are 2-person households, comprising 19, and the most common type of nonfamily households are 1-person households, comprising 20.
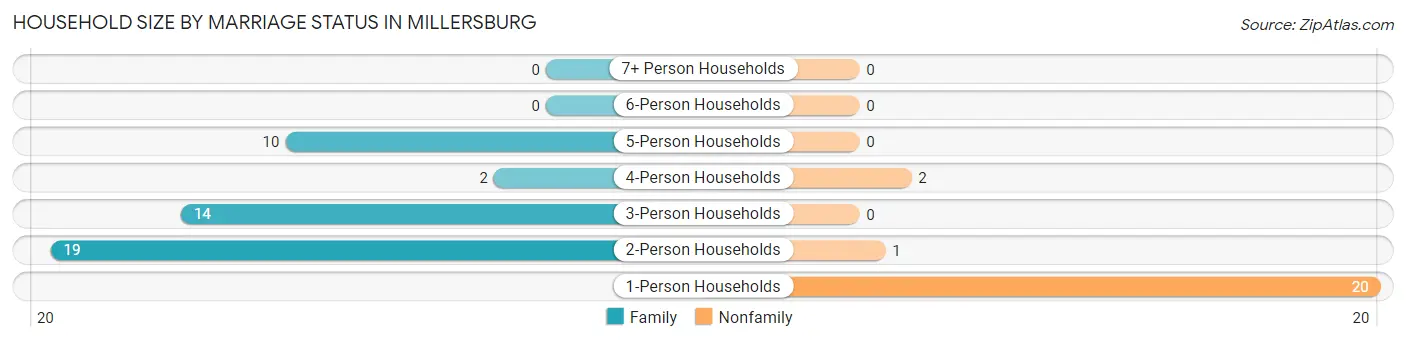
| Household Size | Family Households | Nonfamily Households |
| 1-Person Households | - | 20 (29.4%) |
| 2-Person Households | 19 (27.9%) | 1 (1.5%) |
| 3-Person Households | 14 (20.6%) | 0 (0.0%) |
| 4-Person Households | 2 (2.9%) | 2 (2.9%) |
| 5-Person Households | 10 (14.7%) | 0 (0.0%) |
| 6-Person Households | 0 (0.0%) | 0 (0.0%) |
| 7+ Person Households | 0 (0.0%) | 0 (0.0%) |
| Total | 45 (66.2%) | 23 (33.8%) |
Female Fertility in Millersburg
Fertility by Age in Millersburg
| Age Bracket | Women with Births | Births / 1,000 Women |
| 15 to 19 years | 0 (0.0%) | 0.0 |
| 20 to 34 years | 0 (0.0%) | 0.0 |
| 35 to 50 years | 0 (0.0%) | 0.0 |
| Total | 0 (0.0%) | 0.0 |
Fertility by Age by Marriage Status in Millersburg
| Age Bracket | Married | Unmarried |
| 15 to 19 years | 0 (0.0%) | 0 (0.0%) |
| 20 to 34 years | 0 (0.0%) | 0 (0.0%) |
| 35 to 50 years | 0 (0.0%) | 0 (0.0%) |
| Total | 0 (0.0%) | 0 (0.0%) |
Fertility by Education in Millersburg
| Educational Attainment | Women with Births | Births / 1,000 Women |
| Less than High School | 0 (0.0%) | 0.0 |
| High School Diploma | 0 (0.0%) | 0.0 |
| College or Associate's Degree | 0 (0.0%) | 0.0 |
| Bachelor's Degree | 0 (0.0%) | 0.0 |
| Graduate Degree | 0 (0.0%) | 0.0 |
| Total | 0 (0.0%) | 0.0 |
Fertility by Education by Marriage Status in Millersburg
| Educational Attainment | Married | Unmarried |
| Less than High School | 0 (0.0%) | 0 (0.0%) |
| High School Diploma | 0 (0.0%) | 0 (0.0%) |
| College or Associate's Degree | 0 (0.0%) | 0 (0.0%) |
| Bachelor's Degree | 0 (0.0%) | 0 (0.0%) |
| Graduate Degree | 0 (0.0%) | 0 (0.0%) |
| Total | 0 (0.0%) | 0 (0.0%) |
Employment Characteristics in Millersburg
Employment by Class of Employer in Millersburg
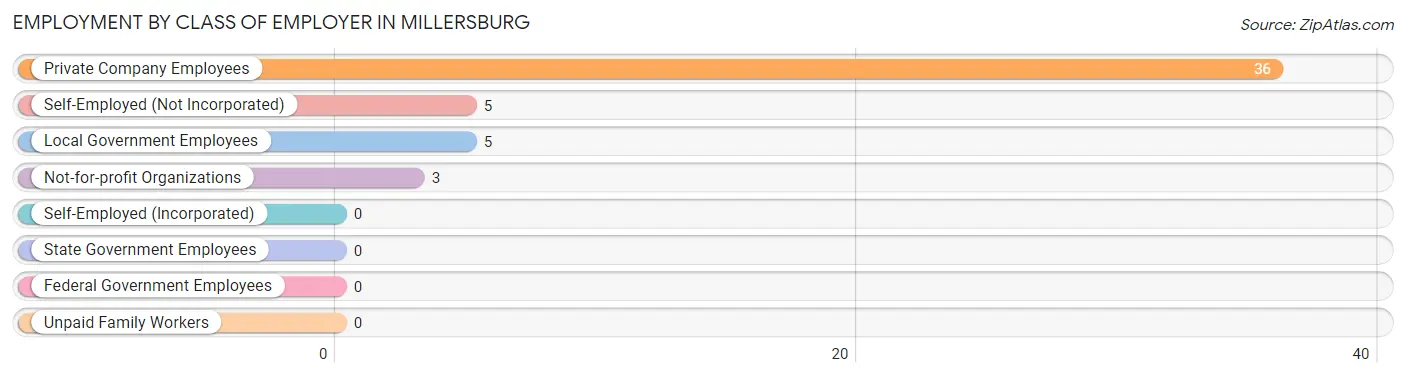
Among the 49 employed individuals in Millersburg, private company employees (36 | 73.5%), self-employed (not incorporated) (5 | 10.2%), and local government employees (5 | 10.2%) make up the most common classes of employment.
| Employer Class | # Employees | % Employees |
| Private Company Employees | 36 | 73.5% |
| Self-Employed (Incorporated) | 0 | 0.0% |
| Self-Employed (Not Incorporated) | 5 | 10.2% |
| Not-for-profit Organizations | 3 | 6.1% |
| Local Government Employees | 5 | 10.2% |
| State Government Employees | 0 | 0.0% |
| Federal Government Employees | 0 | 0.0% |
| Unpaid Family Workers | 0 | 0.0% |
| Total | 49 | 100.0% |
Employment Status by Age in Millersburg
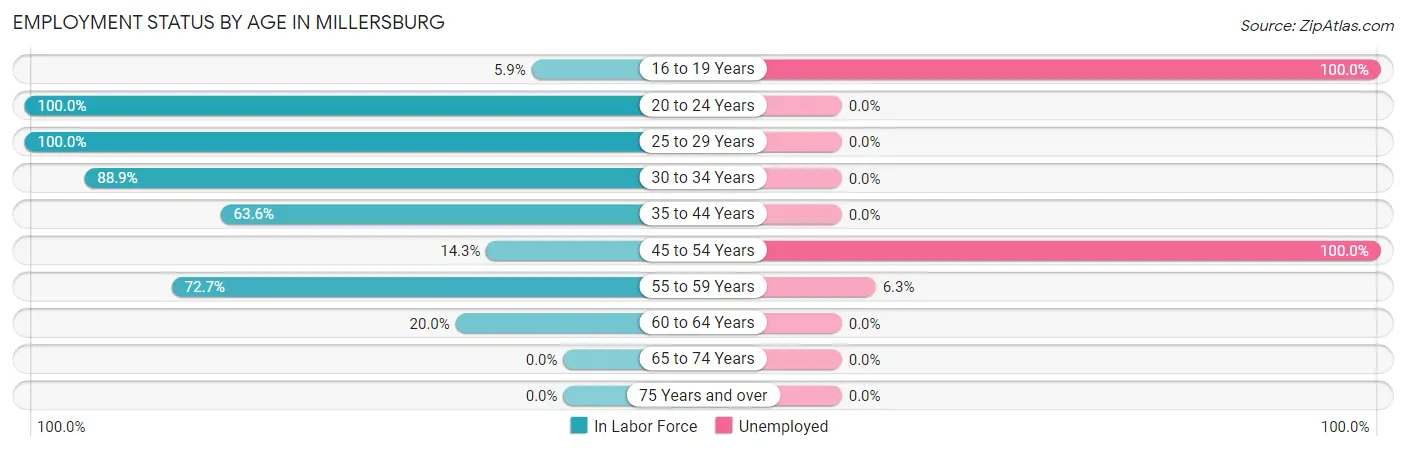
According to the labor force statistics for Millersburg, out of the total population over 16 years of age (138), 37.7% or 52 individuals are in the labor force, with 5.8% or 3 of them unemployed. The age group with the highest labor force participation rate is 20 to 24 years, with 100.0% or 12 individuals in the labor force. Within the labor force, the 16 to 19 years age range has the highest percentage of unemployed individuals, with 100.0% or 1 of them being unemployed.
| Age Bracket | In Labor Force | Unemployed |
| 16 to 19 Years | 1 (5.9%) | 1 (100.0%) |
| 20 to 24 Years | 12 (100.0%) | 0 (0.0%) |
| 25 to 29 Years | 4 (100.0%) | 0 (0.0%) |
| 30 to 34 Years | 8 (88.9%) | 0 (0.0%) |
| 35 to 44 Years | 7 (63.6%) | 0 (0.0%) |
| 45 to 54 Years | 1 (14.3%) | 1 (100.0%) |
| 55 to 59 Years | 16 (72.7%) | 1 (6.3%) |
| 60 to 64 Years | 3 (20.0%) | 0 (0.0%) |
| 65 to 74 Years | 0 (0.0%) | 0 (0.0%) |
| 75 Years and over | 0 (0.0%) | 0 (0.0%) |
| Total | 52 (37.7%) | 3 (5.8%) |
Employment Status by Educational Attainment in Millersburg
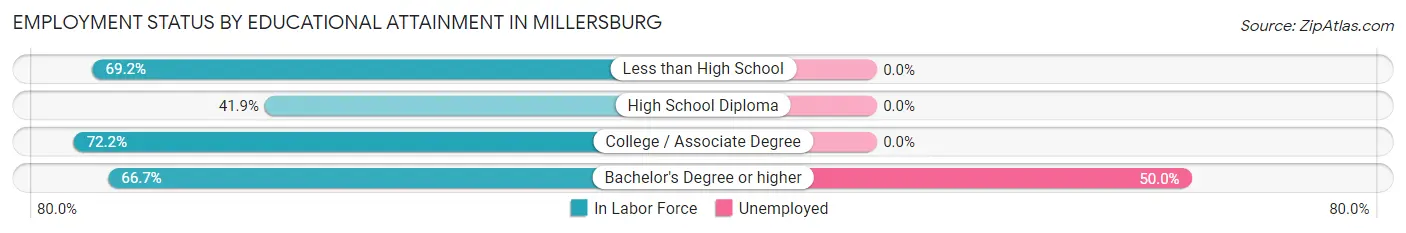
According to labor force statistics for Millersburg, 57.4% of individuals (39) out of the total population between 25 and 64 years of age (68) are in the labor force, with 5.1% or 2 of them being unemployed. The group with the highest labor force participation rate are those with the educational attainment of college / associate degree, with 72.2% or 13 individuals in the labor force. Within the labor force, individuals with bachelor's degree or higher education have the highest percentage of unemployment, with 50.0% or 2 of them being unemployed.
| Educational Attainment | In Labor Force | Unemployed |
| Less than High School | 9 (69.2%) | 0 (0.0%) |
| High School Diploma | 13 (41.9%) | 0 (0.0%) |
| College / Associate Degree | 13 (72.2%) | 0 (0.0%) |
| Bachelor's Degree or higher | 4 (66.7%) | 3 (50.0%) |
| Total | 39 (57.4%) | 3 (5.1%) |
Employment Occupations by Sex in Millersburg
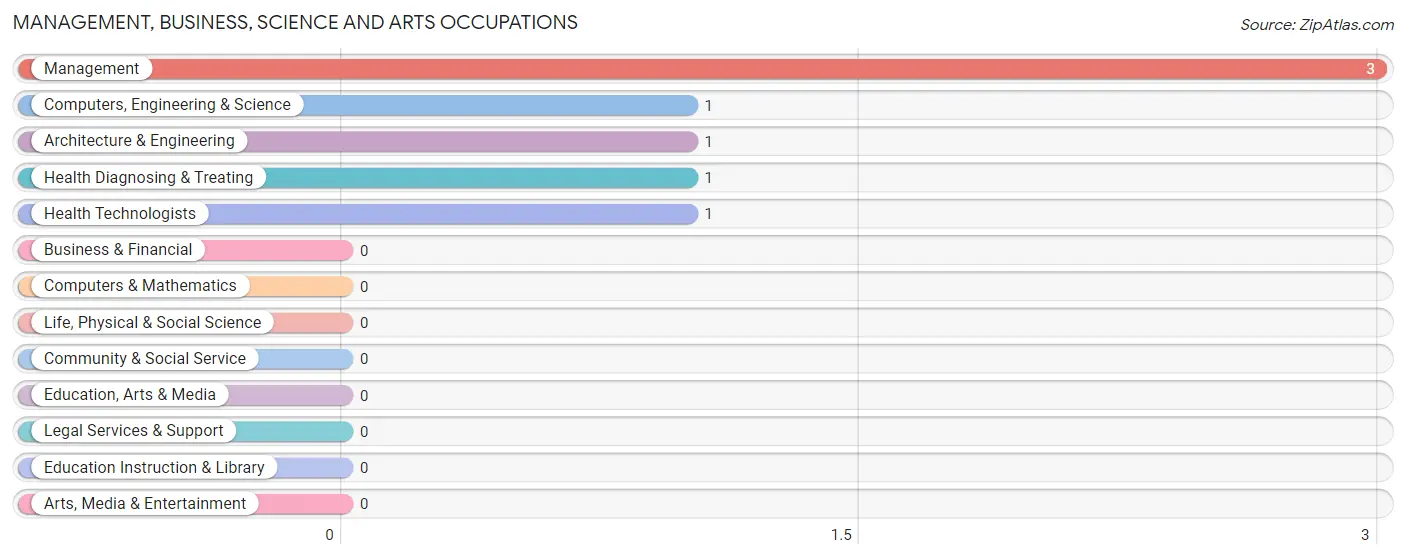
Management, Business, Science and Arts Occupations
The most common Management, Business, Science and Arts occupations in Millersburg are Management (3 | 6.1%), Computers, Engineering & Science (1 | 2.0%), Architecture & Engineering (1 | 2.0%), Health Diagnosing & Treating (1 | 2.0%), and Health Technologists (1 | 2.0%).
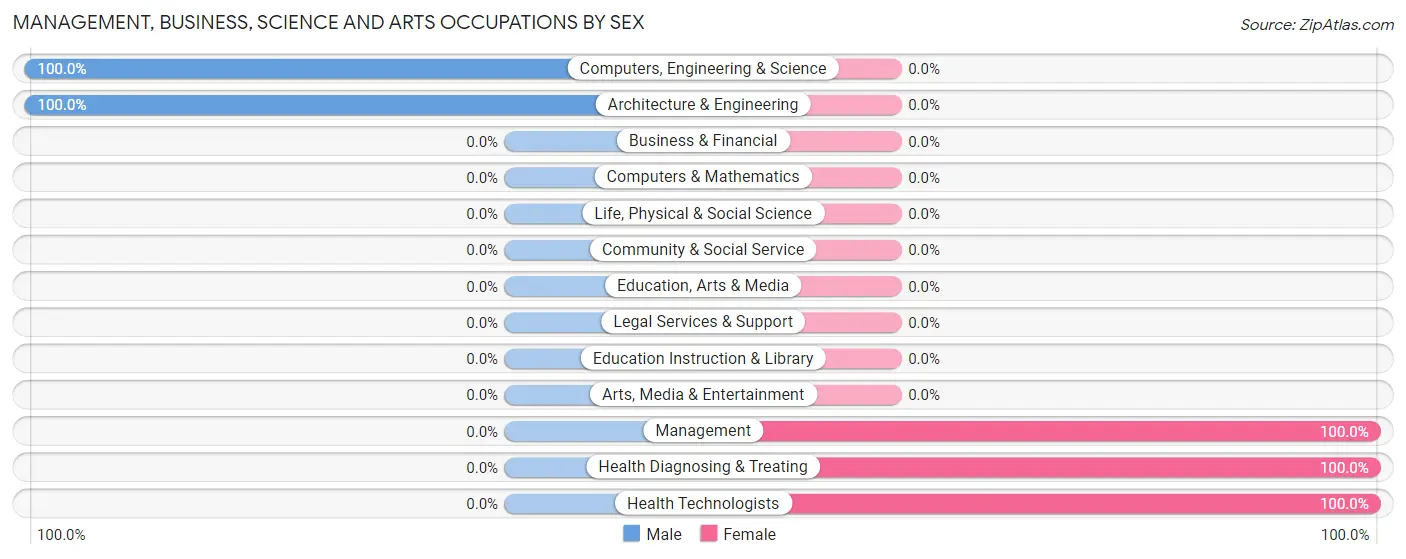
Management, Business, Science and Arts Occupations by Sex
Within the Management, Business, Science and Arts occupations in Millersburg, the most male-oriented occupations are Computers, Engineering & Science (100.0%), and Architecture & Engineering (100.0%), while the most female-oriented occupations are Management (100.0%), Health Diagnosing & Treating (100.0%), and Health Technologists (100.0%).
| Occupation | Male | Female |
| Management | 0 (0.0%) | 3 (100.0%) |
| Business & Financial | 0 (0.0%) | 0 (0.0%) |
| Computers, Engineering & Science | 1 (100.0%) | 0 (0.0%) |
| Computers & Mathematics | 0 (0.0%) | 0 (0.0%) |
| Architecture & Engineering | 1 (100.0%) | 0 (0.0%) |
| Life, Physical & Social Science | 0 (0.0%) | 0 (0.0%) |
| Community & Social Service | 0 (0.0%) | 0 (0.0%) |
| Education, Arts & Media | 0 (0.0%) | 0 (0.0%) |
| Legal Services & Support | 0 (0.0%) | 0 (0.0%) |
| Education Instruction & Library | 0 (0.0%) | 0 (0.0%) |
| Arts, Media & Entertainment | 0 (0.0%) | 0 (0.0%) |
| Health Diagnosing & Treating | 0 (0.0%) | 1 (100.0%) |
| Health Technologists | 0 (0.0%) | 1 (100.0%) |
| Total (Category) | 1 (20.0%) | 4 (80.0%) |
| Total (Overall) | 34 (69.4%) | 15 (30.6%) |
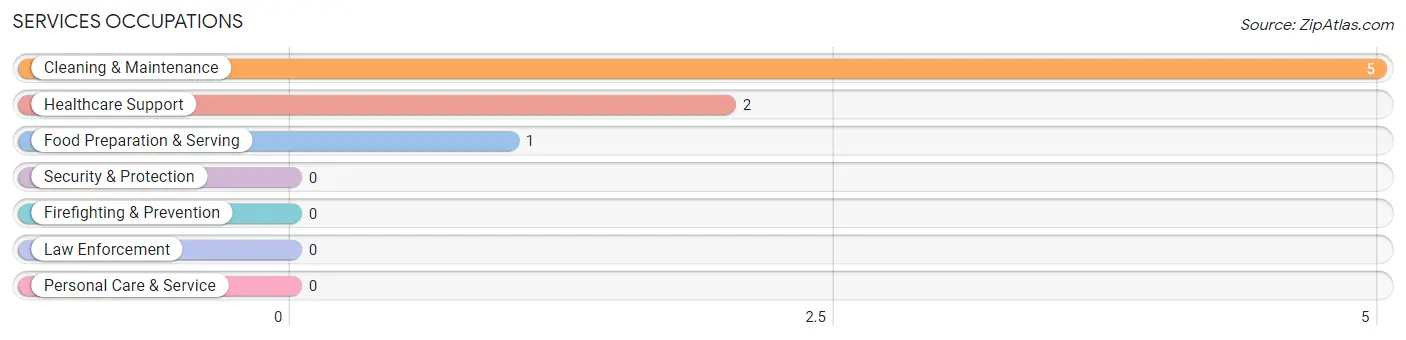
Services Occupations
The most common Services occupations in Millersburg are Cleaning & Maintenance (5 | 10.2%), Healthcare Support (2 | 4.1%), and Food Preparation & Serving (1 | 2.0%).
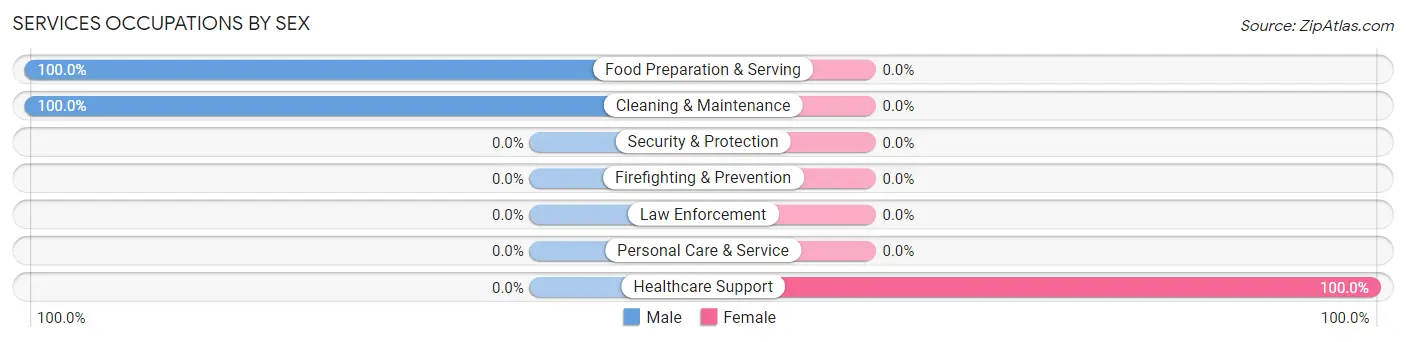
Services Occupations by Sex
| Occupation | Male | Female |
| Healthcare Support | 0 (0.0%) | 2 (100.0%) |
| Security & Protection | 0 (0.0%) | 0 (0.0%) |
| Firefighting & Prevention | 0 (0.0%) | 0 (0.0%) |
| Law Enforcement | 0 (0.0%) | 0 (0.0%) |
| Food Preparation & Serving | 1 (100.0%) | 0 (0.0%) |
| Cleaning & Maintenance | 5 (100.0%) | 0 (0.0%) |
| Personal Care & Service | 0 (0.0%) | 0 (0.0%) |
| Total (Category) | 6 (75.0%) | 2 (25.0%) |
| Total (Overall) | 34 (69.4%) | 15 (30.6%) |
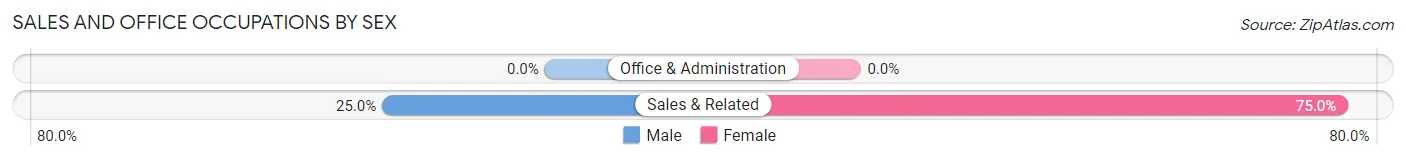
Sales and Office Occupations
The most common Sales and Office occupations in Millersburg are , and Sales & Related (8 | 16.3%).
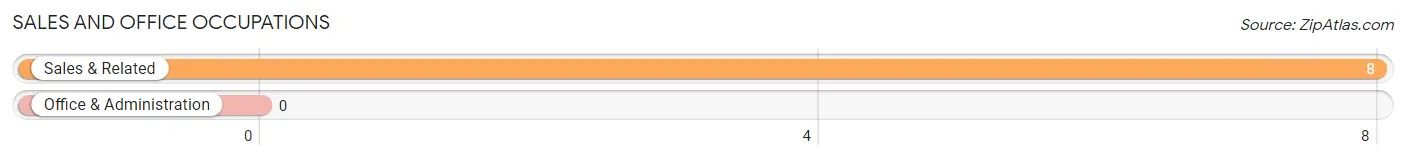
Sales and Office Occupations by Sex
| Occupation | Male | Female |
| Sales & Related | 2 (25.0%) | 6 (75.0%) |
| Office & Administration | 0 (0.0%) | 0 (0.0%) |
| Total (Category) | 2 (25.0%) | 6 (75.0%) |
| Total (Overall) | 34 (69.4%) | 15 (30.6%) |
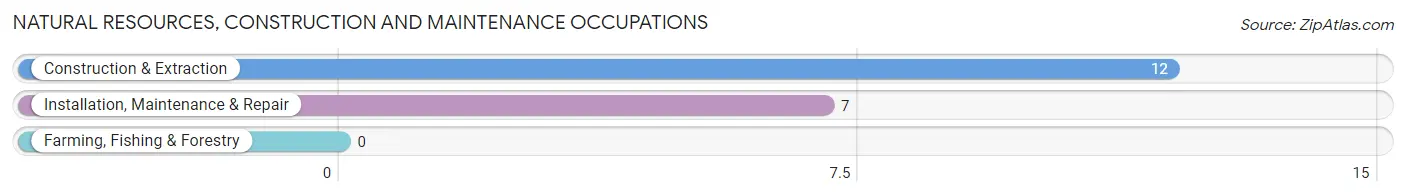
Natural Resources, Construction and Maintenance Occupations
The most common Natural Resources, Construction and Maintenance occupations in Millersburg are Construction & Extraction (12 | 24.5%), and Installation, Maintenance & Repair (7 | 14.3%).
Natural Resources, Construction and Maintenance Occupations by Sex
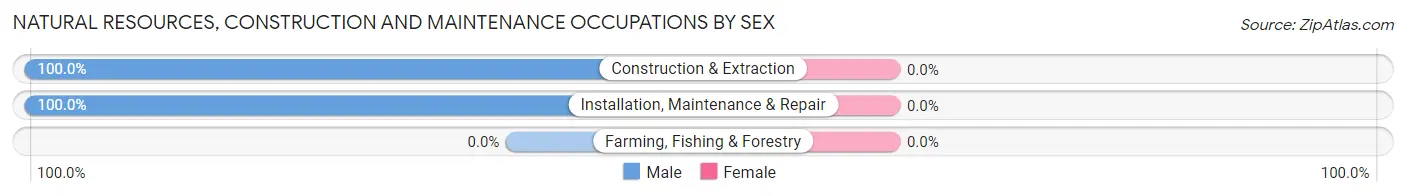
| Occupation | Male | Female |
| Farming, Fishing & Forestry | 0 (0.0%) | 0 (0.0%) |
| Construction & Extraction | 12 (100.0%) | 0 (0.0%) |
| Installation, Maintenance & Repair | 7 (100.0%) | 0 (0.0%) |
| Total (Category) | 19 (100.0%) | 0 (0.0%) |
| Total (Overall) | 34 (69.4%) | 15 (30.6%) |
Production, Transportation and Moving Occupations
The most common Production, Transportation and Moving occupations in Millersburg are Material Moving (5 | 10.2%), and Transportation (4 | 8.2%).
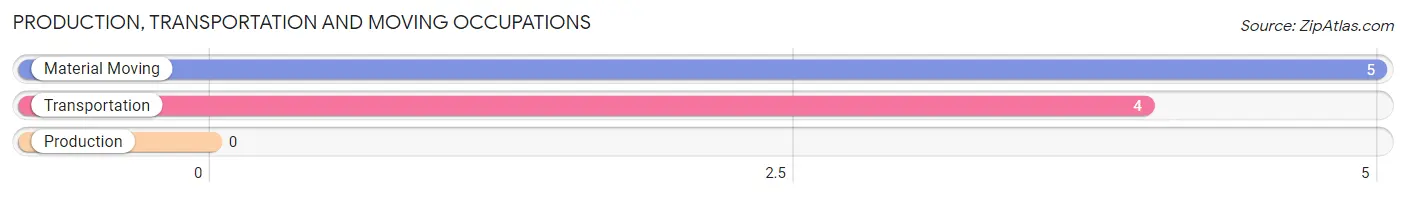
Production, Transportation and Moving Occupations by Sex
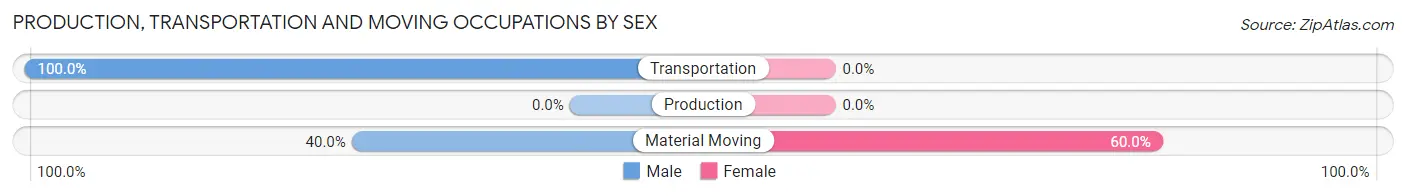
| Occupation | Male | Female |
| Production | 0 (0.0%) | 0 (0.0%) |
| Transportation | 4 (100.0%) | 0 (0.0%) |
| Material Moving | 2 (40.0%) | 3 (60.0%) |
| Total (Category) | 6 (66.7%) | 3 (33.3%) |
| Total (Overall) | 34 (69.4%) | 15 (30.6%) |
Employment Industries by Sex in Millersburg
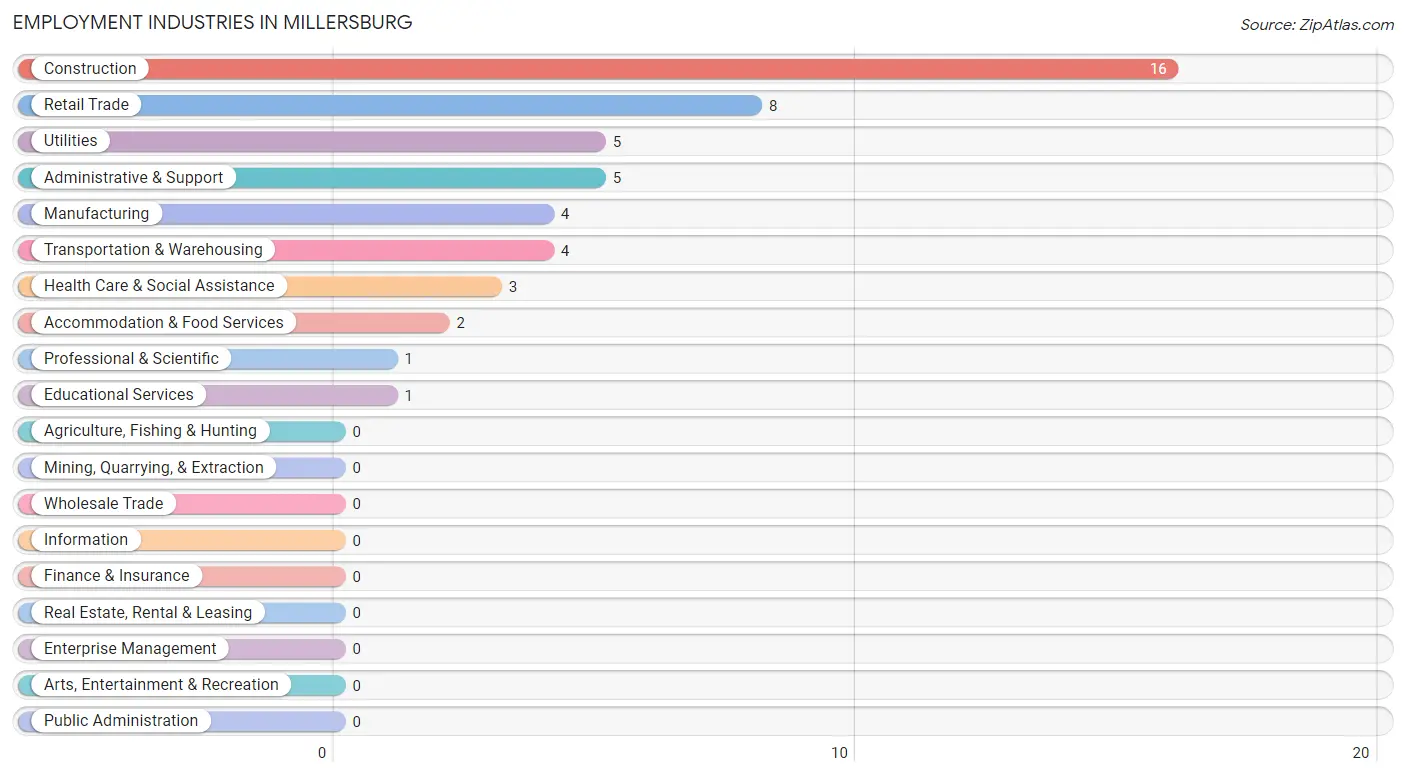
Employment Industries in Millersburg
The major employment industries in Millersburg include Construction (16 | 32.7%), Retail Trade (8 | 16.3%), Utilities (5 | 10.2%), Administrative & Support (5 | 10.2%), and Manufacturing (4 | 8.2%).
Employment Industries by Sex in Millersburg
The Millersburg industries that see more men than women are Construction (100.0%), Transportation & Warehousing (100.0%), and Administrative & Support (100.0%), whereas the industries that tend to have a higher number of women are Professional & Scientific (100.0%), Educational Services (100.0%), and Utilities (80.0%).
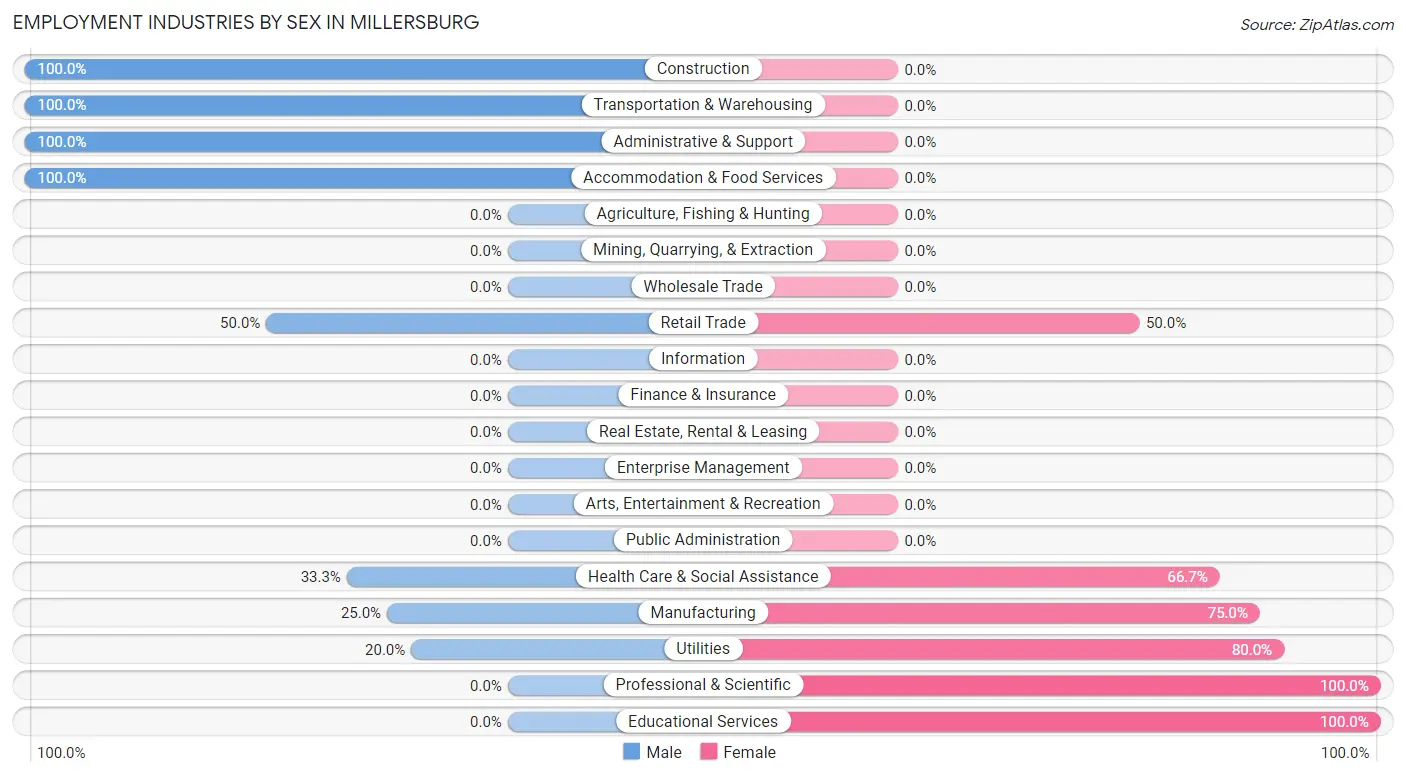
| Industry | Male | Female |
| Agriculture, Fishing & Hunting | 0 (0.0%) | 0 (0.0%) |
| Mining, Quarrying, & Extraction | 0 (0.0%) | 0 (0.0%) |
| Construction | 16 (100.0%) | 0 (0.0%) |
| Manufacturing | 1 (25.0%) | 3 (75.0%) |
| Wholesale Trade | 0 (0.0%) | 0 (0.0%) |
| Retail Trade | 4 (50.0%) | 4 (50.0%) |
| Transportation & Warehousing | 4 (100.0%) | 0 (0.0%) |
| Utilities | 1 (20.0%) | 4 (80.0%) |
| Information | 0 (0.0%) | 0 (0.0%) |
| Finance & Insurance | 0 (0.0%) | 0 (0.0%) |
| Real Estate, Rental & Leasing | 0 (0.0%) | 0 (0.0%) |
| Professional & Scientific | 0 (0.0%) | 1 (100.0%) |
| Enterprise Management | 0 (0.0%) | 0 (0.0%) |
| Administrative & Support | 5 (100.0%) | 0 (0.0%) |
| Educational Services | 0 (0.0%) | 1 (100.0%) |
| Health Care & Social Assistance | 1 (33.3%) | 2 (66.7%) |
| Arts, Entertainment & Recreation | 0 (0.0%) | 0 (0.0%) |
| Accommodation & Food Services | 2 (100.0%) | 0 (0.0%) |
| Public Administration | 0 (0.0%) | 0 (0.0%) |
| Total | 34 (69.4%) | 15 (30.6%) |
Education in Millersburg
School Enrollment in Millersburg
The most common levels of schooling among the 42 students in Millersburg are high school (26 | 61.9%), middle school (11 | 26.2%), and elementary school (2 | 4.8%).
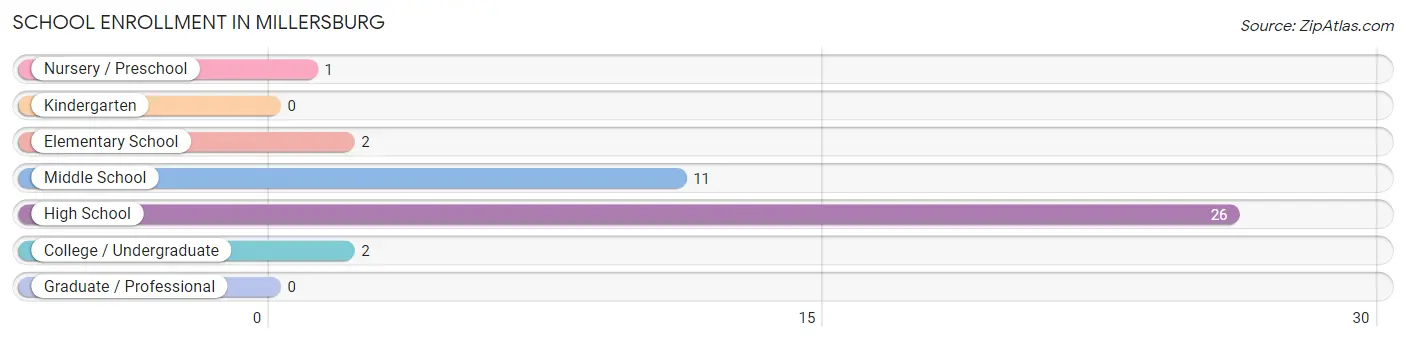
| School Level | # Students | % Students |
| Nursery / Preschool | 1 | 2.4% |
| Kindergarten | 0 | 0.0% |
| Elementary School | 2 | 4.8% |
| Middle School | 11 | 26.2% |
| High School | 26 | 61.9% |
| College / Undergraduate | 2 | 4.8% |
| Graduate / Professional | 0 | 0.0% |
| Total | 42 | 100.0% |
School Enrollment by Age by Funding Source in Millersburg
Out of a total of 42 students who are enrolled in schools in Millersburg, 4 (9.5%) attend a private institution, while the remaining 38 (90.5%) are enrolled in public schools. The age group of 20 to 24 year olds has the highest likelihood of being enrolled in private schools, with 1 (100.0% in the age bracket) enrolled. Conversely, the age group of 10 to 14 year olds has the lowest likelihood of being enrolled in a private school, with 17 (100.0% in the age bracket) attending a public institution.
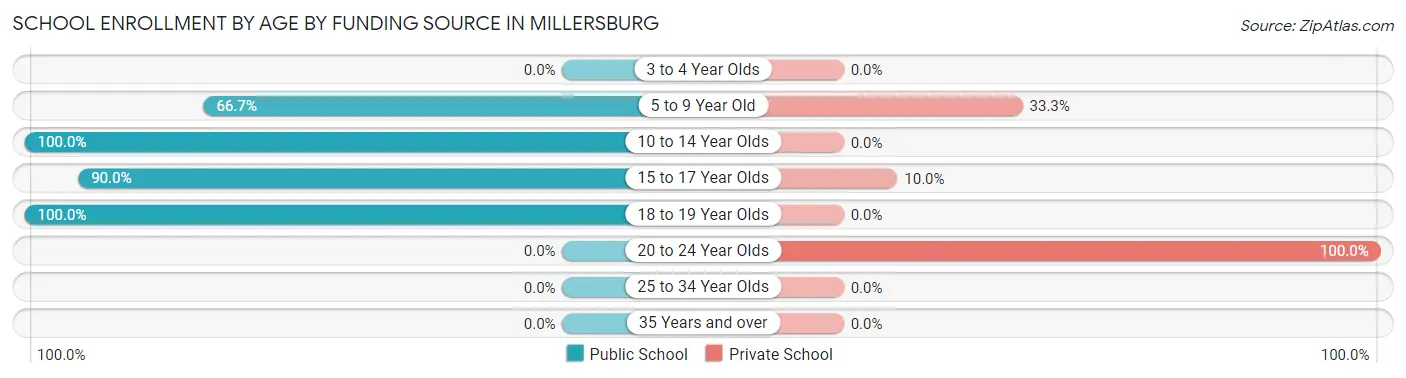
| Age Bracket | Public School | Private School |
| 3 to 4 Year Olds | 0 (0.0%) | 0 (0.0%) |
| 5 to 9 Year Old | 2 (66.7%) | 1 (33.3%) |
| 10 to 14 Year Olds | 17 (100.0%) | 0 (0.0%) |
| 15 to 17 Year Olds | 18 (90.0%) | 2 (10.0%) |
| 18 to 19 Year Olds | 1 (100.0%) | 0 (0.0%) |
| 20 to 24 Year Olds | 0 (0.0%) | 1 (100.0%) |
| 25 to 34 Year Olds | 0 (0.0%) | 0 (0.0%) |
| 35 Years and over | 0 (0.0%) | 0 (0.0%) |
| Total | 38 (90.5%) | 4 (9.5%) |
Educational Attainment by Field of Study in Millersburg
Education (7 | 53.8%), social sciences (3 | 23.1%), engineering (1 | 7.7%), business (1 | 7.7%), and literature & languages (1 | 7.7%) are the most common fields of study among 13 individuals in Millersburg who have obtained a bachelor's degree or higher.
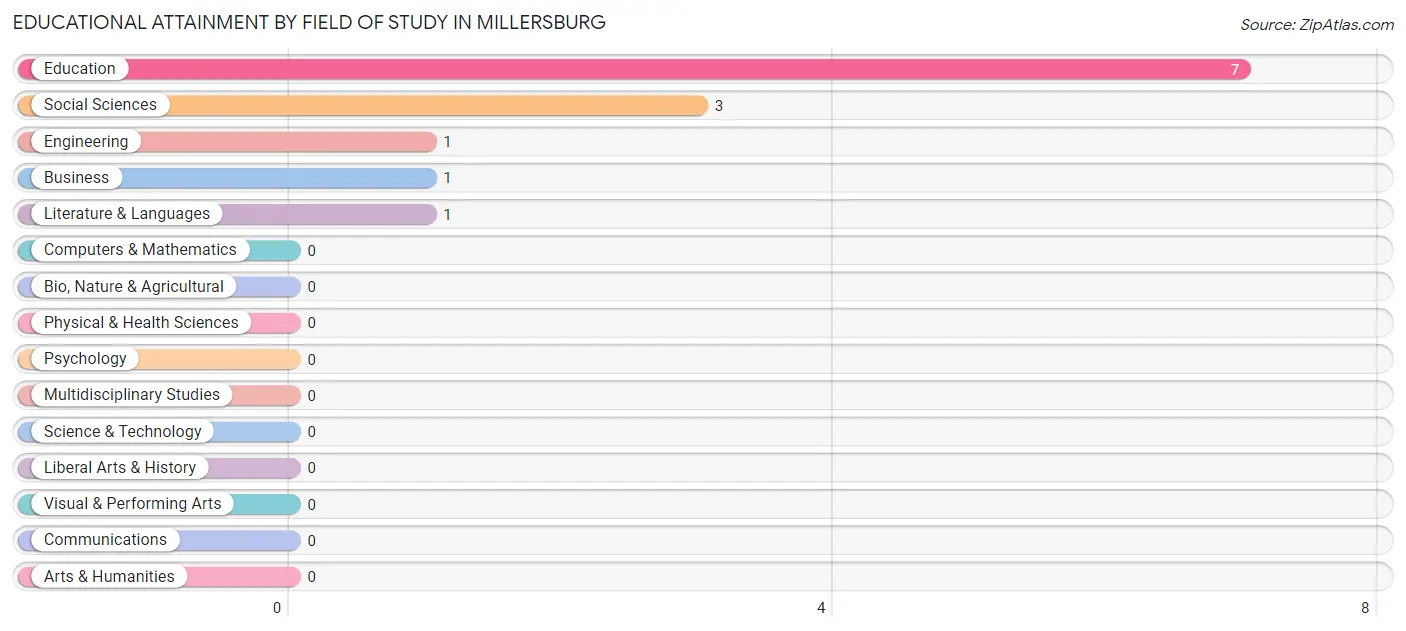
| Field of Study | # Graduates | % Graduates |
| Computers & Mathematics | 0 | 0.0% |
| Bio, Nature & Agricultural | 0 | 0.0% |
| Physical & Health Sciences | 0 | 0.0% |
| Psychology | 0 | 0.0% |
| Social Sciences | 3 | 23.1% |
| Engineering | 1 | 7.7% |
| Multidisciplinary Studies | 0 | 0.0% |
| Science & Technology | 0 | 0.0% |
| Business | 1 | 7.7% |
| Education | 7 | 53.8% |
| Literature & Languages | 1 | 7.7% |
| Liberal Arts & History | 0 | 0.0% |
| Visual & Performing Arts | 0 | 0.0% |
| Communications | 0 | 0.0% |
| Arts & Humanities | 0 | 0.0% |
| Total | 13 | 100.0% |
Transportation & Commute in Millersburg
Vehicle Availability by Sex in Millersburg
The most prevalent vehicle ownership categories in Millersburg are males with 2 vehicles (13, accounting for 38.2%) and females with 2 vehicles (4, making up 86.7%).
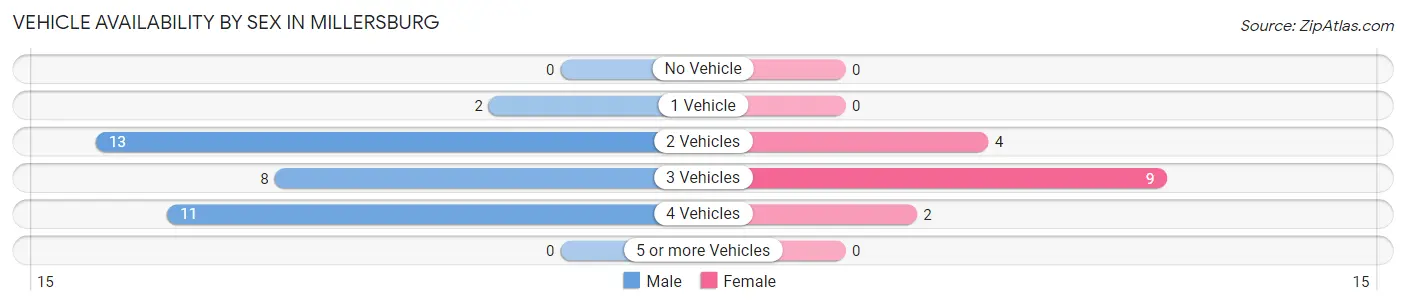
| Vehicles Available | Male | Female |
| No Vehicle | 0 (0.0%) | 0 (0.0%) |
| 1 Vehicle | 2 (5.9%) | 0 (0.0%) |
| 2 Vehicles | 13 (38.2%) | 4 (26.7%) |
| 3 Vehicles | 8 (23.5%) | 9 (60.0%) |
| 4 Vehicles | 11 (32.4%) | 2 (13.3%) |
| 5 or more Vehicles | 0 (0.0%) | 0 (0.0%) |
| Total | 34 (100.0%) | 15 (100.0%) |
Commute Time in Millersburg
The most frequently occuring commute durations in Millersburg are 15 to 19 minutes (10 commuters, 20.4%), 20 to 24 minutes (9 commuters, 18.4%), and 45 to 59 minutes (8 commuters, 16.3%).
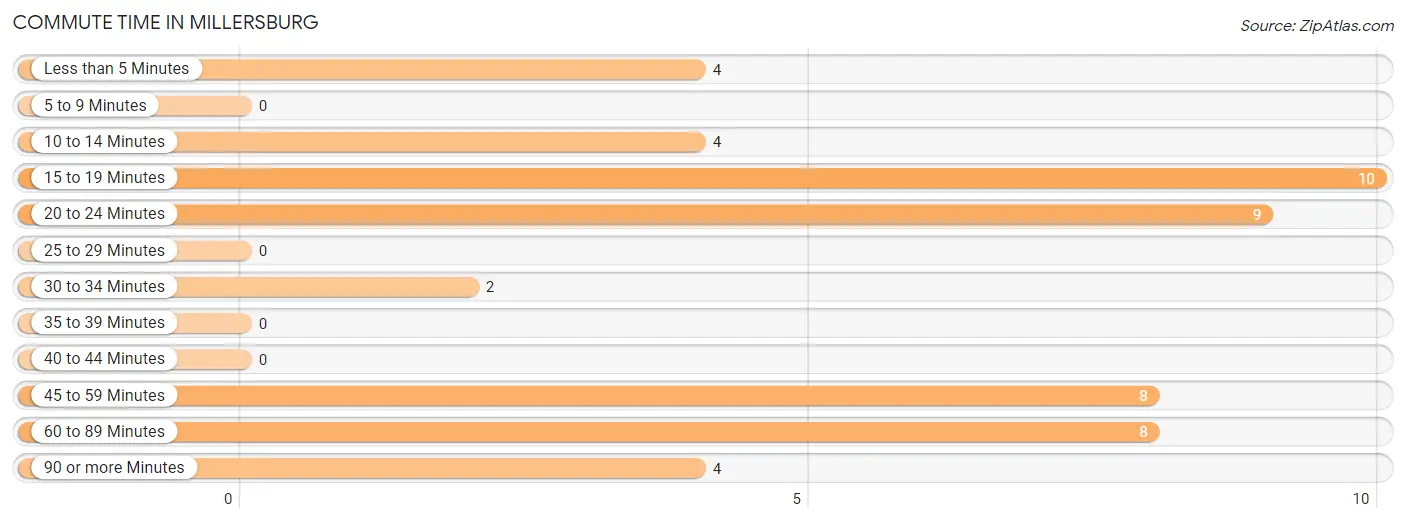
| Commute Time | # Commuters | % Commuters |
| Less than 5 Minutes | 4 | 8.2% |
| 5 to 9 Minutes | 0 | 0.0% |
| 10 to 14 Minutes | 4 | 8.2% |
| 15 to 19 Minutes | 10 | 20.4% |
| 20 to 24 Minutes | 9 | 18.4% |
| 25 to 29 Minutes | 0 | 0.0% |
| 30 to 34 Minutes | 2 | 4.1% |
| 35 to 39 Minutes | 0 | 0.0% |
| 40 to 44 Minutes | 0 | 0.0% |
| 45 to 59 Minutes | 8 | 16.3% |
| 60 to 89 Minutes | 8 | 16.3% |
| 90 or more Minutes | 4 | 8.2% |
Commute Time by Sex in Millersburg
The most common commute times in Millersburg are 15 to 19 minutes (9 commuters, 26.5%) for males and 20 to 24 minutes (6 commuters, 40.0%) for females.
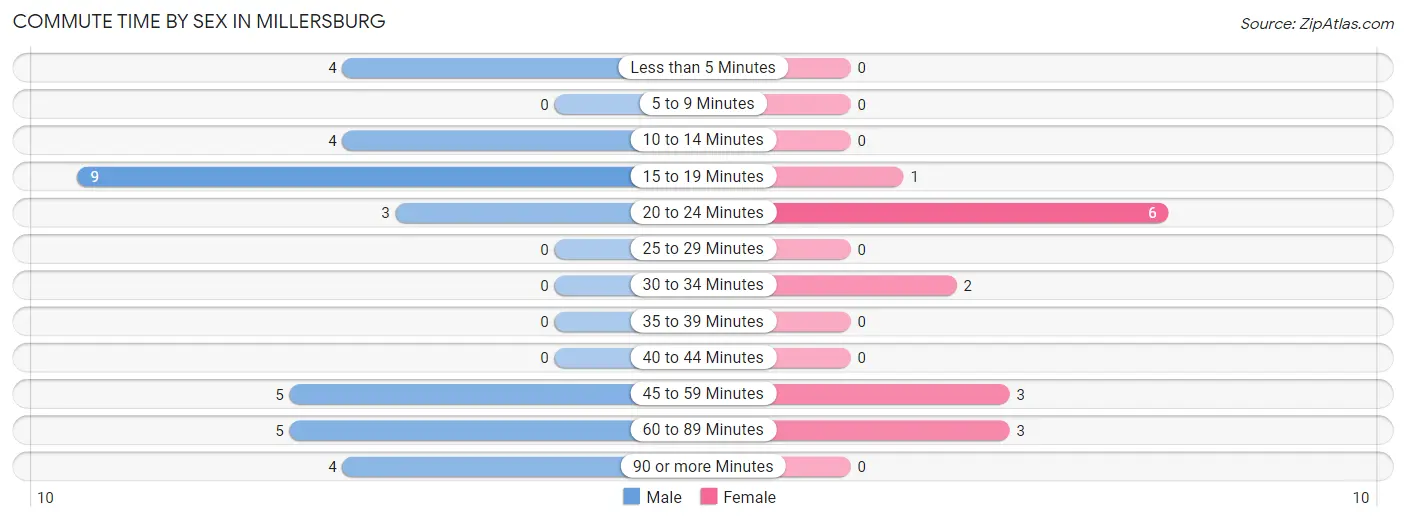
| Commute Time | Male | Female |
| Less than 5 Minutes | 4 (11.8%) | 0 (0.0%) |
| 5 to 9 Minutes | 0 (0.0%) | 0 (0.0%) |
| 10 to 14 Minutes | 4 (11.8%) | 0 (0.0%) |
| 15 to 19 Minutes | 9 (26.5%) | 1 (6.7%) |
| 20 to 24 Minutes | 3 (8.8%) | 6 (40.0%) |
| 25 to 29 Minutes | 0 (0.0%) | 0 (0.0%) |
| 30 to 34 Minutes | 0 (0.0%) | 2 (13.3%) |
| 35 to 39 Minutes | 0 (0.0%) | 0 (0.0%) |
| 40 to 44 Minutes | 0 (0.0%) | 0 (0.0%) |
| 45 to 59 Minutes | 5 (14.7%) | 3 (20.0%) |
| 60 to 89 Minutes | 5 (14.7%) | 3 (20.0%) |
| 90 or more Minutes | 4 (11.8%) | 0 (0.0%) |
Time of Departure to Work by Sex in Millersburg
The most frequent times of departure to work in Millersburg are 6:00 AM to 6:29 AM (9, 26.5%) for males and 7:30 AM to 7:59 AM (8, 53.3%) for females.
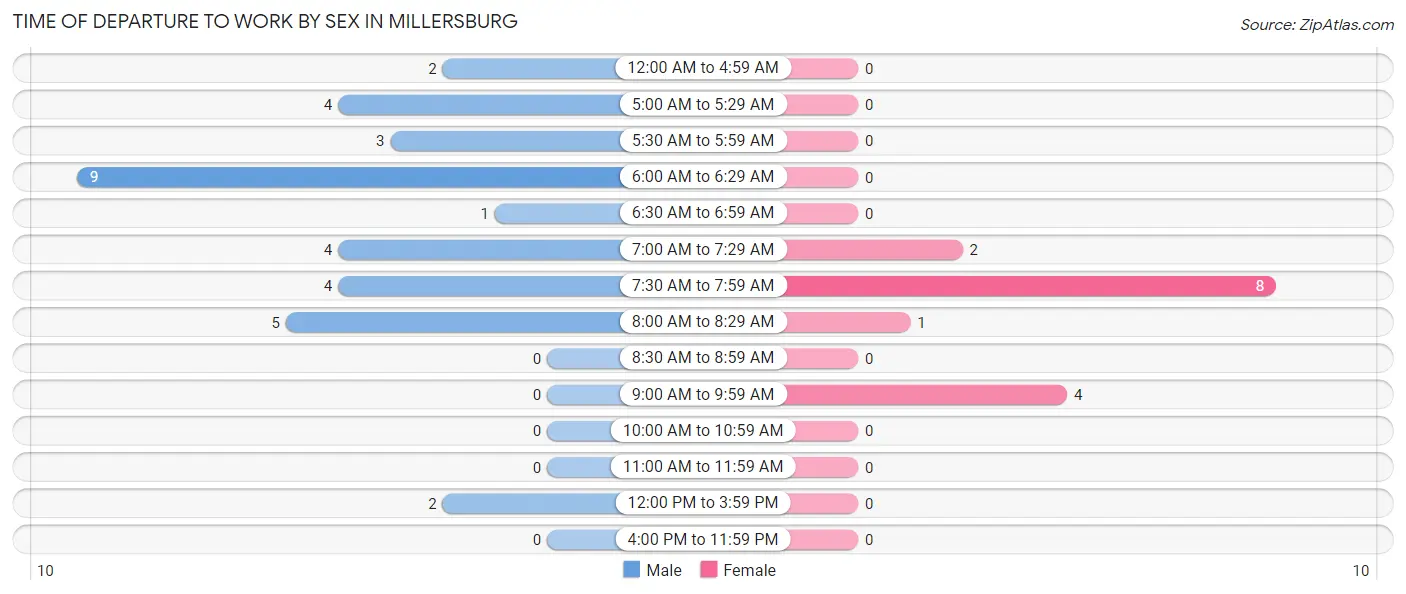
| Time of Departure | Male | Female |
| 12:00 AM to 4:59 AM | 2 (5.9%) | 0 (0.0%) |
| 5:00 AM to 5:29 AM | 4 (11.8%) | 0 (0.0%) |
| 5:30 AM to 5:59 AM | 3 (8.8%) | 0 (0.0%) |
| 6:00 AM to 6:29 AM | 9 (26.5%) | 0 (0.0%) |
| 6:30 AM to 6:59 AM | 1 (2.9%) | 0 (0.0%) |
| 7:00 AM to 7:29 AM | 4 (11.8%) | 2 (13.3%) |
| 7:30 AM to 7:59 AM | 4 (11.8%) | 8 (53.3%) |
| 8:00 AM to 8:29 AM | 5 (14.7%) | 1 (6.7%) |
| 8:30 AM to 8:59 AM | 0 (0.0%) | 0 (0.0%) |
| 9:00 AM to 9:59 AM | 0 (0.0%) | 4 (26.7%) |
| 10:00 AM to 10:59 AM | 0 (0.0%) | 0 (0.0%) |
| 11:00 AM to 11:59 AM | 0 (0.0%) | 0 (0.0%) |
| 12:00 PM to 3:59 PM | 2 (5.9%) | 0 (0.0%) |
| 4:00 PM to 11:59 PM | 0 (0.0%) | 0 (0.0%) |
| Total | 34 (100.0%) | 15 (100.0%) |
Housing Occupancy in Millersburg
Occupancy by Ownership in Millersburg
Of the total 68 dwellings in Millersburg, owner-occupied units account for 57 (83.8%), while renter-occupied units make up 11 (16.2%).
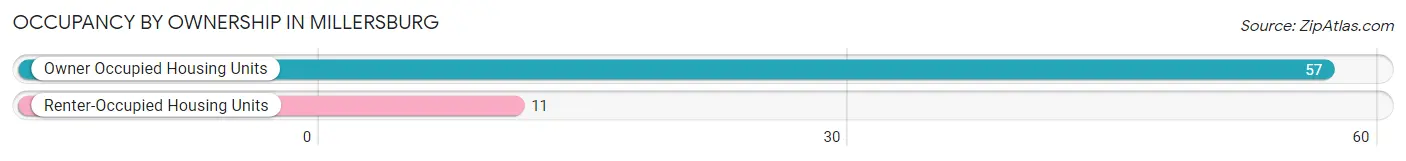
| Occupancy | # Housing Units | % Housing Units |
| Owner Occupied Housing Units | 57 | 83.8% |
| Renter-Occupied Housing Units | 11 | 16.2% |
| Total Occupied Housing Units | 68 | 100.0% |
Occupancy by Household Size in Millersburg
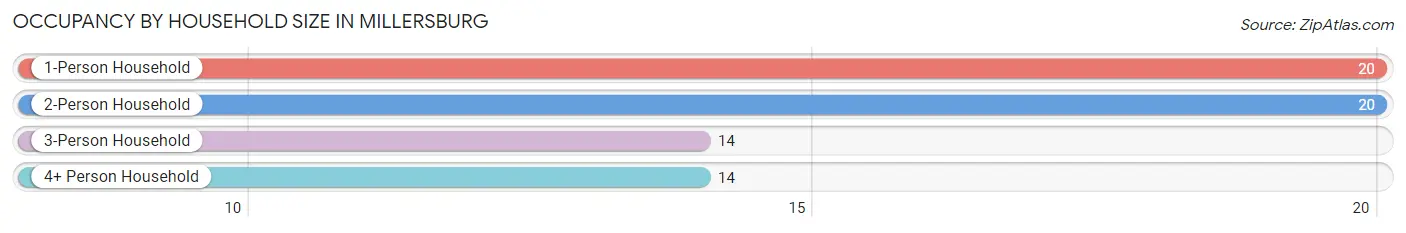
| Household Size | # Housing Units | % Housing Units |
| 1-Person Household | 20 | 29.4% |
| 2-Person Household | 20 | 29.4% |
| 3-Person Household | 14 | 20.6% |
| 4+ Person Household | 14 | 20.6% |
| Total Housing Units | 68 | 100.0% |
Occupancy by Ownership by Household Size in Millersburg
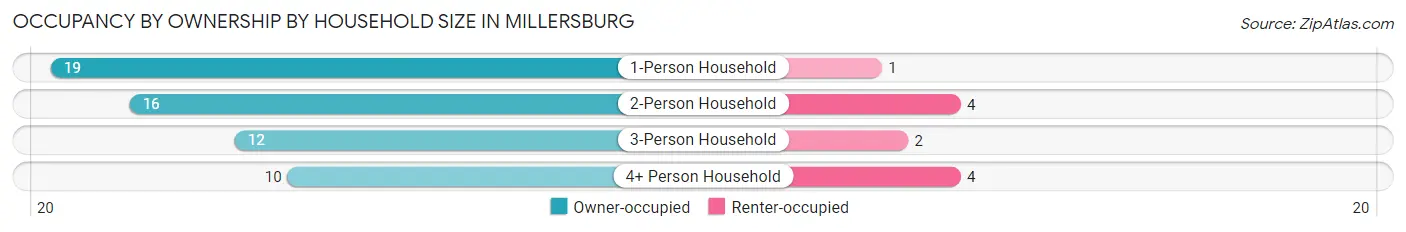
| Household Size | Owner-occupied | Renter-occupied |
| 1-Person Household | 19 (95.0%) | 1 (5.0%) |
| 2-Person Household | 16 (80.0%) | 4 (20.0%) |
| 3-Person Household | 12 (85.7%) | 2 (14.3%) |
| 4+ Person Household | 10 (71.4%) | 4 (28.6%) |
| Total Housing Units | 57 (83.8%) | 11 (16.2%) |
Occupancy by Educational Attainment in Millersburg
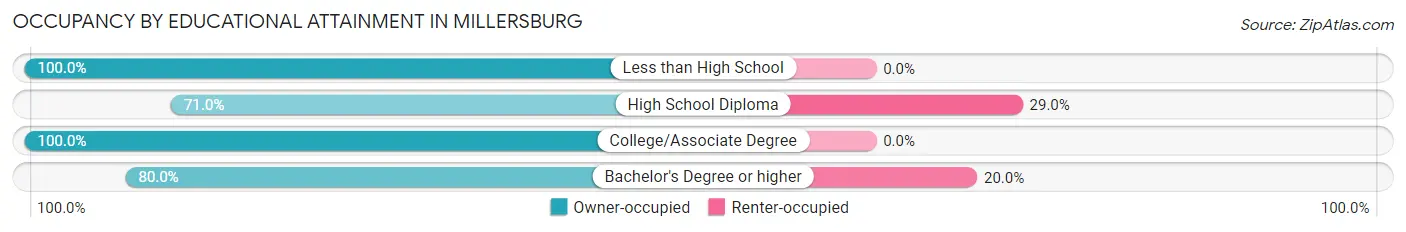
| Household Size | Owner-occupied | Renter-occupied |
| Less than High School | 12 (100.0%) | 0 (0.0%) |
| High School Diploma | 22 (71.0%) | 9 (29.0%) |
| College/Associate Degree | 15 (100.0%) | 0 (0.0%) |
| Bachelor's Degree or higher | 8 (80.0%) | 2 (20.0%) |
Occupancy by Age of Householder in Millersburg
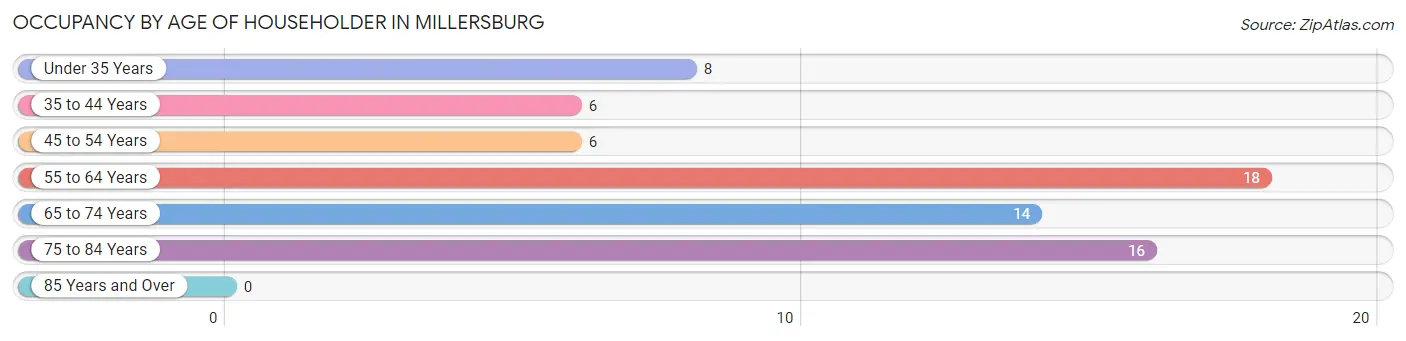
| Age Bracket | # Households | % Households |
| Under 35 Years | 8 | 11.8% |
| 35 to 44 Years | 6 | 8.8% |
| 45 to 54 Years | 6 | 8.8% |
| 55 to 64 Years | 18 | 26.5% |
| 65 to 74 Years | 14 | 20.6% |
| 75 to 84 Years | 16 | 23.5% |
| 85 Years and Over | 0 | 0.0% |
| Total | 68 | 100.0% |
Housing Finances in Millersburg
Median Income by Occupancy in Millersburg
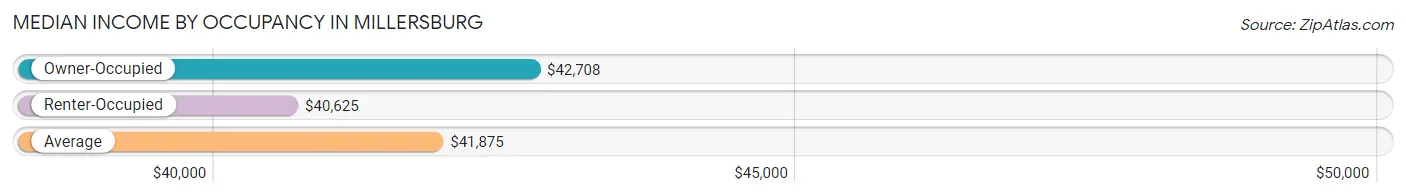
| Occupancy Type | # Households | Median Income |
| Owner-Occupied | 57 (83.8%) | $42,708 |
| Renter-Occupied | 11 (16.2%) | $40,625 |
| Average | 68 (100.0%) | $41,875 |
Occupancy by Householder Income Bracket in Millersburg
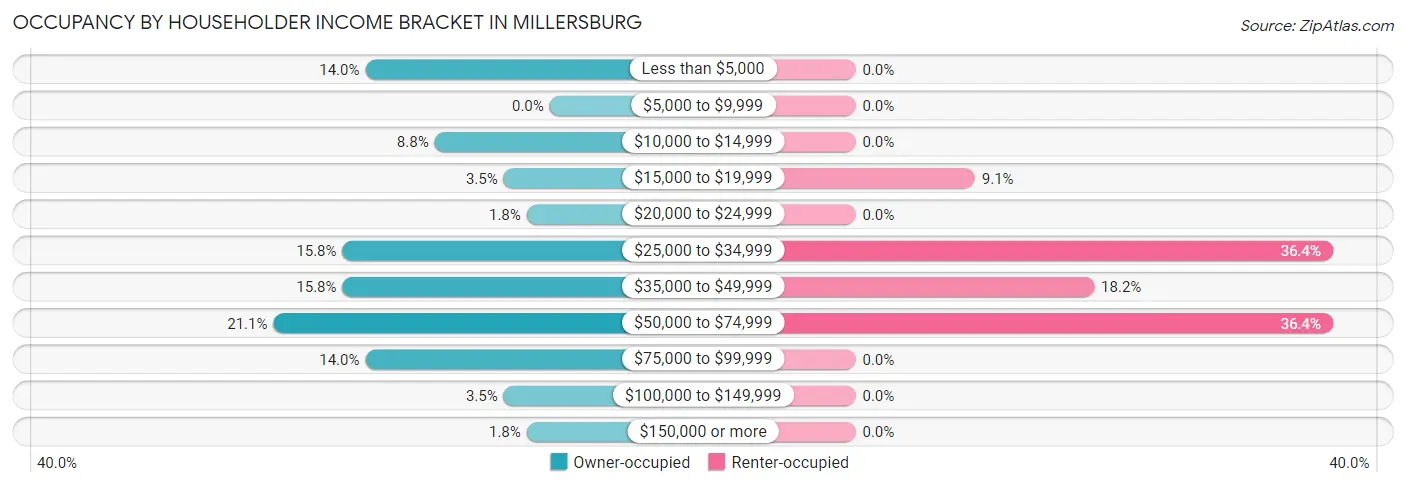
| Income Bracket | Owner-occupied | Renter-occupied |
| Less than $5,000 | 8 (14.0%) | 0 (0.0%) |
| $5,000 to $9,999 | 0 (0.0%) | 0 (0.0%) |
| $10,000 to $14,999 | 5 (8.8%) | 0 (0.0%) |
| $15,000 to $19,999 | 2 (3.5%) | 1 (9.1%) |
| $20,000 to $24,999 | 1 (1.8%) | 0 (0.0%) |
| $25,000 to $34,999 | 9 (15.8%) | 4 (36.4%) |
| $35,000 to $49,999 | 9 (15.8%) | 2 (18.2%) |
| $50,000 to $74,999 | 12 (21.0%) | 4 (36.4%) |
| $75,000 to $99,999 | 8 (14.0%) | 0 (0.0%) |
| $100,000 to $149,999 | 2 (3.5%) | 0 (0.0%) |
| $150,000 or more | 1 (1.8%) | 0 (0.0%) |
| Total | 57 (100.0%) | 11 (100.0%) |
Monthly Housing Cost Tiers in Millersburg
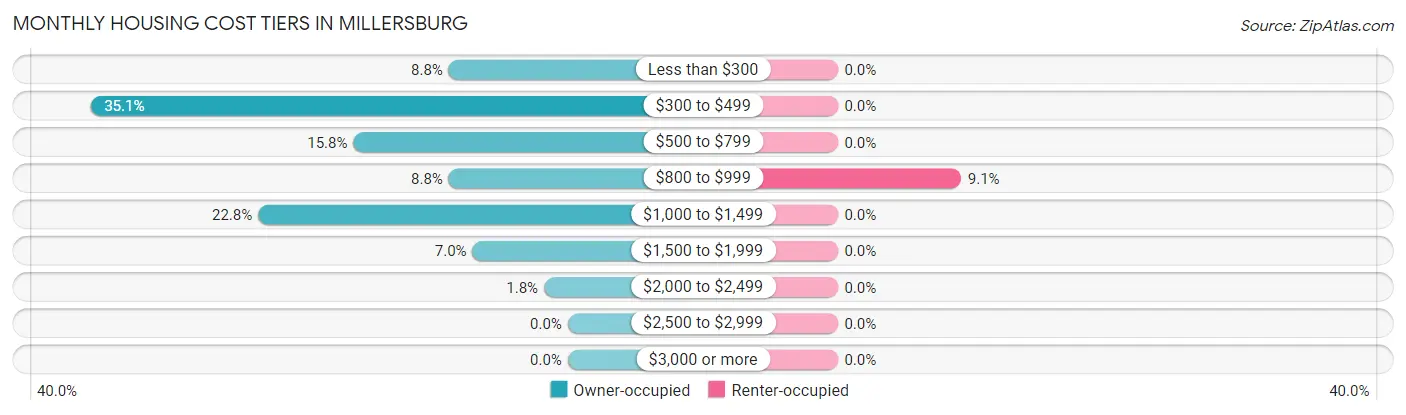
| Monthly Cost | Owner-occupied | Renter-occupied |
| Less than $300 | 5 (8.8%) | 0 (0.0%) |
| $300 to $499 | 20 (35.1%) | 0 (0.0%) |
| $500 to $799 | 9 (15.8%) | 0 (0.0%) |
| $800 to $999 | 5 (8.8%) | 1 (9.1%) |
| $1,000 to $1,499 | 13 (22.8%) | 0 (0.0%) |
| $1,500 to $1,999 | 4 (7.0%) | 0 (0.0%) |
| $2,000 to $2,499 | 1 (1.8%) | 0 (0.0%) |
| $2,500 to $2,999 | 0 (0.0%) | 0 (0.0%) |
| $3,000 or more | 0 (0.0%) | 0 (0.0%) |
| Total | 57 (100.0%) | 11 (100.0%) |
Physical Housing Characteristics in Millersburg
Housing Structures in Millersburg
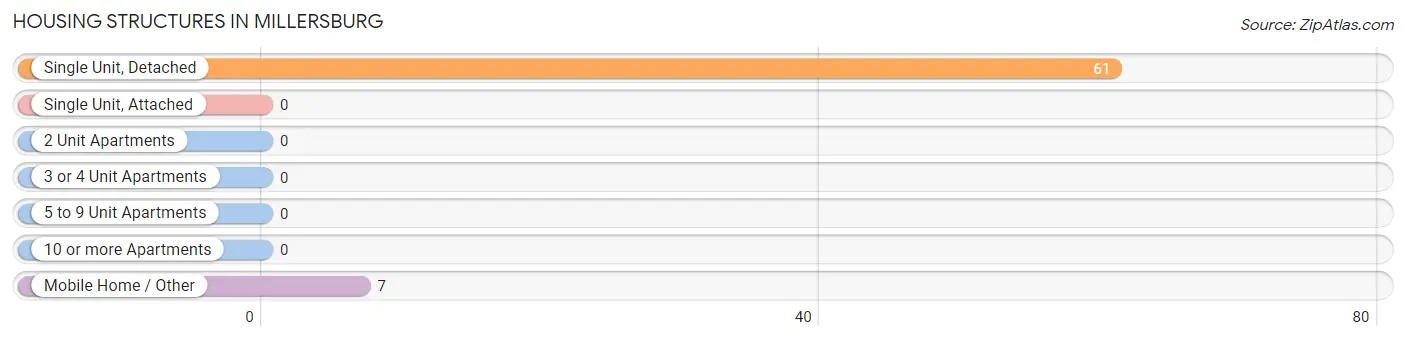
| Structure Type | # Housing Units | % Housing Units |
| Single Unit, Detached | 61 | 89.7% |
| Single Unit, Attached | 0 | 0.0% |
| 2 Unit Apartments | 0 | 0.0% |
| 3 or 4 Unit Apartments | 0 | 0.0% |
| 5 to 9 Unit Apartments | 0 | 0.0% |
| 10 or more Apartments | 0 | 0.0% |
| Mobile Home / Other | 7 | 10.3% |
| Total | 68 | 100.0% |
Housing Structures by Occupancy in Millersburg
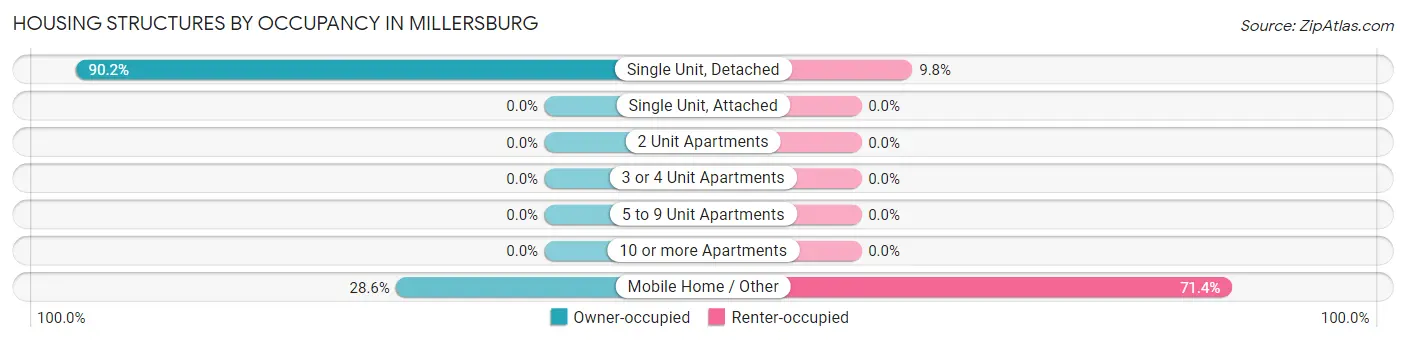
| Structure Type | Owner-occupied | Renter-occupied |
| Single Unit, Detached | 55 (90.2%) | 6 (9.8%) |
| Single Unit, Attached | 0 (0.0%) | 0 (0.0%) |
| 2 Unit Apartments | 0 (0.0%) | 0 (0.0%) |
| 3 or 4 Unit Apartments | 0 (0.0%) | 0 (0.0%) |
| 5 to 9 Unit Apartments | 0 (0.0%) | 0 (0.0%) |
| 10 or more Apartments | 0 (0.0%) | 0 (0.0%) |
| Mobile Home / Other | 2 (28.6%) | 5 (71.4%) |
| Total | 57 (83.8%) | 11 (16.2%) |
Housing Structures by Number of Rooms in Millersburg
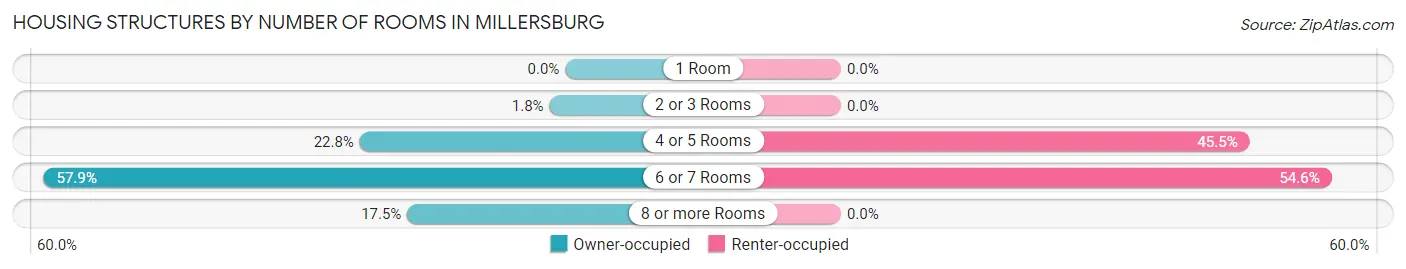
| Number of Rooms | Owner-occupied | Renter-occupied |
| 1 Room | 0 (0.0%) | 0 (0.0%) |
| 2 or 3 Rooms | 1 (1.8%) | 0 (0.0%) |
| 4 or 5 Rooms | 13 (22.8%) | 5 (45.5%) |
| 6 or 7 Rooms | 33 (57.9%) | 6 (54.5%) |
| 8 or more Rooms | 10 (17.5%) | 0 (0.0%) |
| Total | 57 (100.0%) | 11 (100.0%) |
Housing Structure by Heating Type in Millersburg
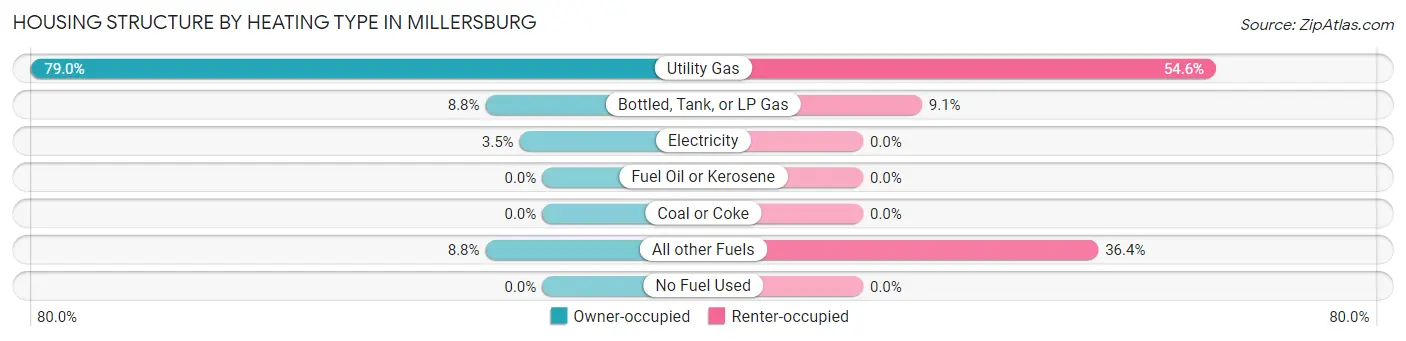
| Heating Type | Owner-occupied | Renter-occupied |
| Utility Gas | 45 (78.9%) | 6 (54.5%) |
| Bottled, Tank, or LP Gas | 5 (8.8%) | 1 (9.1%) |
| Electricity | 2 (3.5%) | 0 (0.0%) |
| Fuel Oil or Kerosene | 0 (0.0%) | 0 (0.0%) |
| Coal or Coke | 0 (0.0%) | 0 (0.0%) |
| All other Fuels | 5 (8.8%) | 4 (36.4%) |
| No Fuel Used | 0 (0.0%) | 0 (0.0%) |
| Total | 57 (100.0%) | 11 (100.0%) |
Household Vehicle Usage in Millersburg
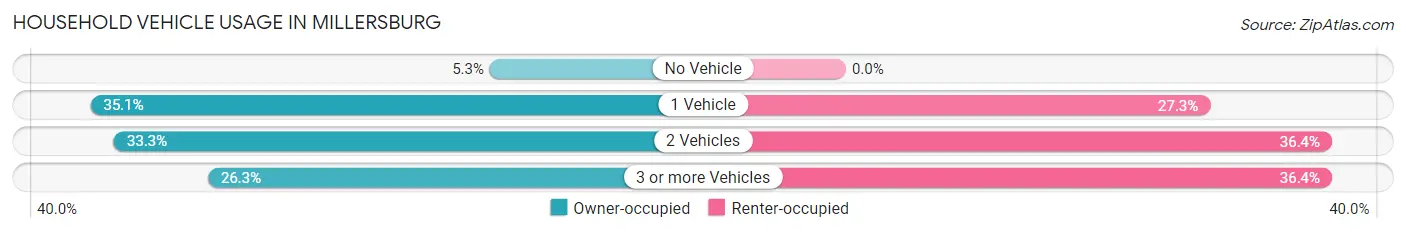
| Vehicles per Household | Owner-occupied | Renter-occupied |
| No Vehicle | 3 (5.3%) | 0 (0.0%) |
| 1 Vehicle | 20 (35.1%) | 3 (27.3%) |
| 2 Vehicles | 19 (33.3%) | 4 (36.4%) |
| 3 or more Vehicles | 15 (26.3%) | 4 (36.4%) |
| Total | 57 (100.0%) | 11 (100.0%) |
Real Estate & Mortgages in Millersburg
Real Estate and Mortgage Overview in Millersburg
| Characteristic | Without Mortgage | With Mortgage |
| Housing Units | 25 | 32 |
| Median Property Value | $67,000 | $82,000 |
| Median Household Income | $43,125 | $1 |
| Monthly Housing Costs | $338 | $0 |
| Real Estate Taxes | $630 | $0 |
Property Value by Mortgage Status in Millersburg
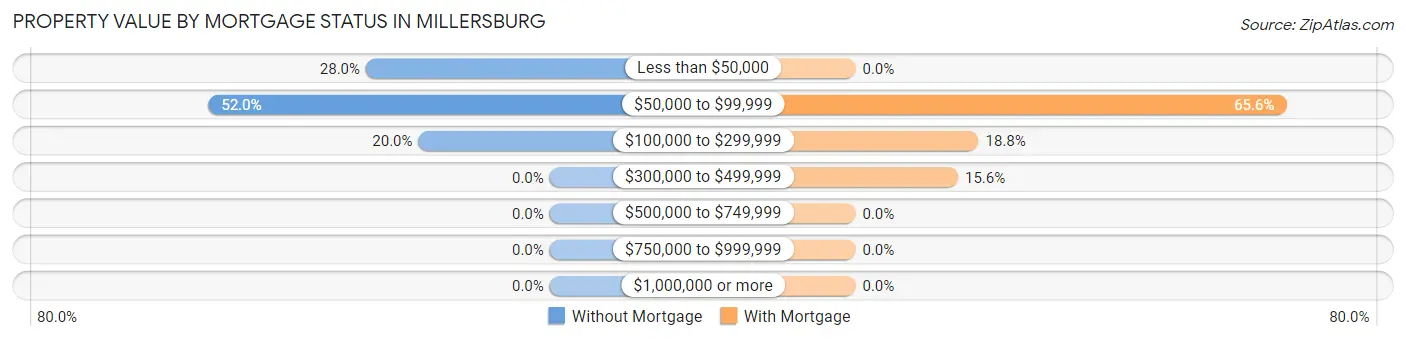
| Property Value | Without Mortgage | With Mortgage |
| Less than $50,000 | 7 (28.0%) | 0 (0.0%) |
| $50,000 to $99,999 | 13 (52.0%) | 21 (65.6%) |
| $100,000 to $299,999 | 5 (20.0%) | 6 (18.8%) |
| $300,000 to $499,999 | 0 (0.0%) | 5 (15.6%) |
| $500,000 to $749,999 | 0 (0.0%) | 0 (0.0%) |
| $750,000 to $999,999 | 0 (0.0%) | 0 (0.0%) |
| $1,000,000 or more | 0 (0.0%) | 0 (0.0%) |
| Total | 25 (100.0%) | 32 (100.0%) |
Household Income by Mortgage Status in Millersburg
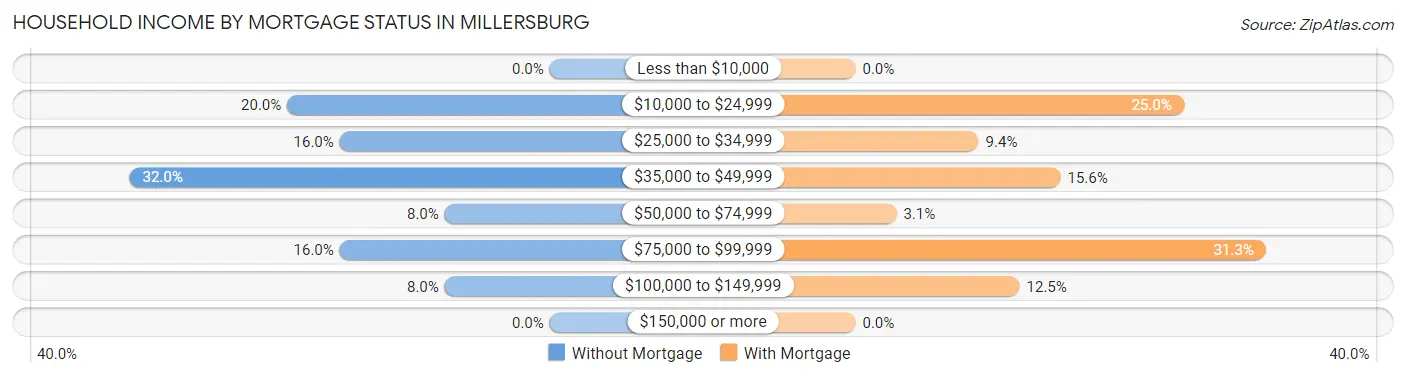
| Household Income | Without Mortgage | With Mortgage |
| Less than $10,000 | 0 (0.0%) | 0 (0.0%) |
| $10,000 to $24,999 | 5 (20.0%) | 8 (25.0%) |
| $25,000 to $34,999 | 4 (16.0%) | 3 (9.4%) |
| $35,000 to $49,999 | 8 (32.0%) | 5 (15.6%) |
| $50,000 to $74,999 | 2 (8.0%) | 1 (3.1%) |
| $75,000 to $99,999 | 4 (16.0%) | 10 (31.2%) |
| $100,000 to $149,999 | 2 (8.0%) | 4 (12.5%) |
| $150,000 or more | 0 (0.0%) | 0 (0.0%) |
| Total | 25 (100.0%) | 32 (100.0%) |
Property Value to Household Income Ratio in Millersburg
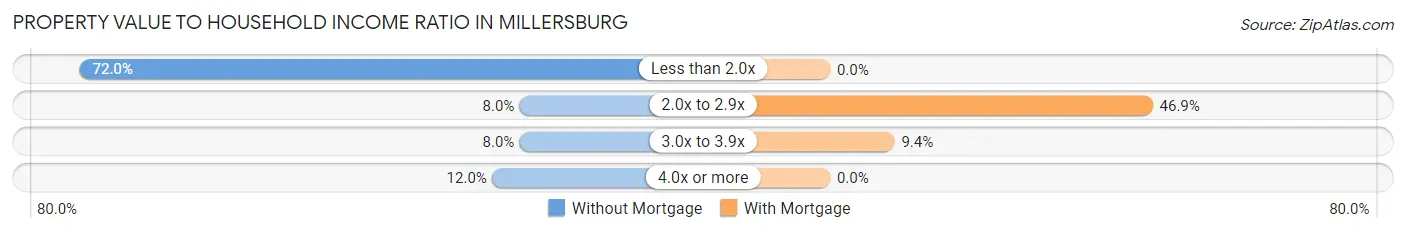
| Value-to-Income Ratio | Without Mortgage | With Mortgage |
| Less than 2.0x | 18 (72.0%) | 0 (0.0%) |
| 2.0x to 2.9x | 2 (8.0%) | 15 (46.9%) |
| 3.0x to 3.9x | 2 (8.0%) | 3 (9.4%) |
| 4.0x or more | 3 (12.0%) | 0 (0.0%) |
| Total | 25 (100.0%) | 32 (100.0%) |
Real Estate Taxes by Mortgage Status in Millersburg
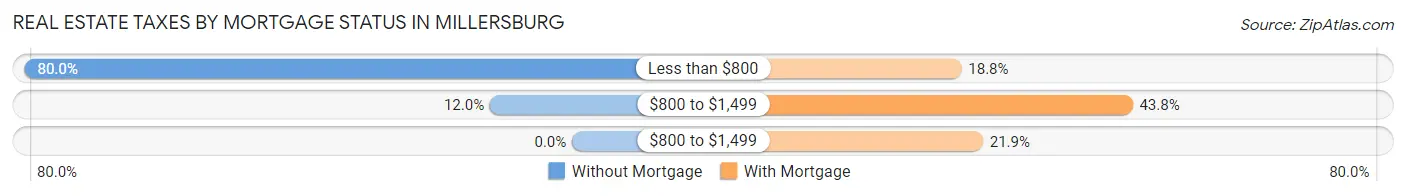
| Property Taxes | Without Mortgage | With Mortgage |
| Less than $800 | 20 (80.0%) | 6 (18.8%) |
| $800 to $1,499 | 3 (12.0%) | 14 (43.8%) |
| $800 to $1,499 | 0 (0.0%) | 7 (21.9%) |
| Total | 25 (100.0%) | 32 (100.0%) |
Health & Disability in Millersburg
Health Insurance Coverage by Age in Millersburg
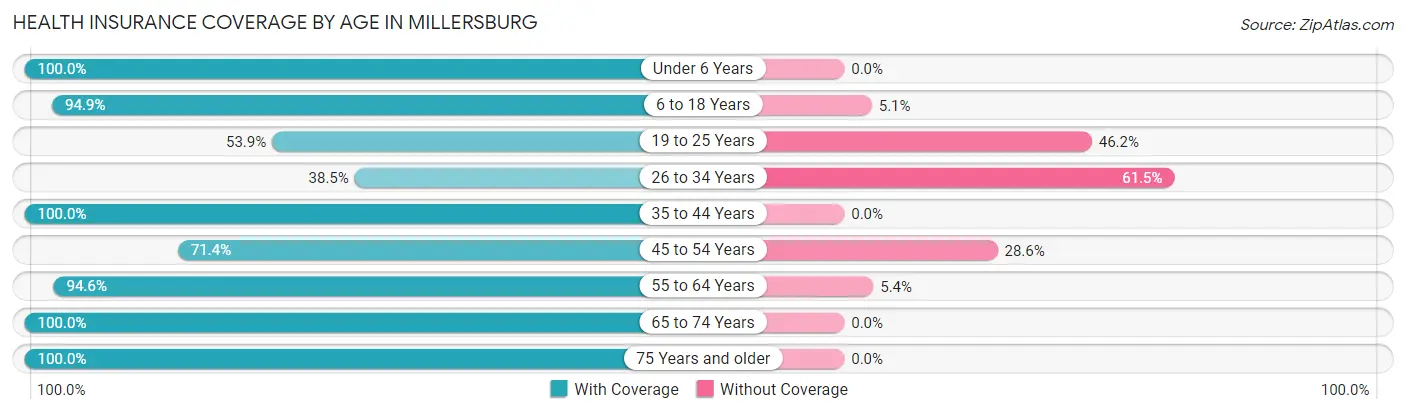
| Age Bracket | With Coverage | Without Coverage |
| Under 6 Years | 1 (100.0%) | 0 (0.0%) |
| 6 to 18 Years | 37 (94.9%) | 2 (5.1%) |
| 19 to 25 Years | 7 (53.8%) | 6 (46.2%) |
| 26 to 34 Years | 5 (38.5%) | 8 (61.5%) |
| 35 to 44 Years | 11 (100.0%) | 0 (0.0%) |
| 45 to 54 Years | 5 (71.4%) | 2 (28.6%) |
| 55 to 64 Years | 35 (94.6%) | 2 (5.4%) |
| 65 to 74 Years | 23 (100.0%) | 0 (0.0%) |
| 75 Years and older | 18 (100.0%) | 0 (0.0%) |
| Total | 142 (87.6%) | 20 (12.3%) |
Health Insurance Coverage by Citizenship Status in Millersburg
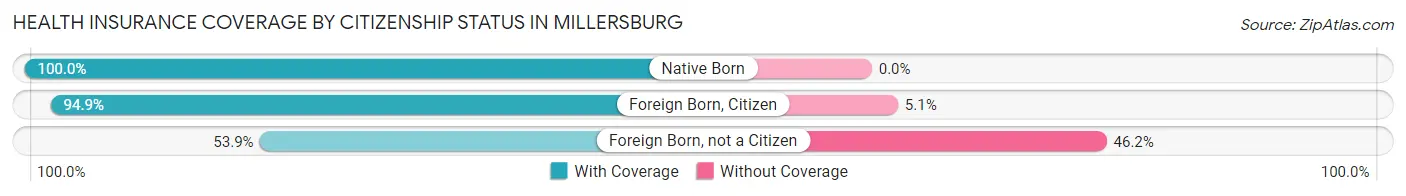
| Citizenship Status | With Coverage | Without Coverage |
| Native Born | 1 (100.0%) | 0 (0.0%) |
| Foreign Born, Citizen | 37 (94.9%) | 2 (5.1%) |
| Foreign Born, not a Citizen | 7 (53.8%) | 6 (46.2%) |
Health Insurance Coverage by Household Income in Millersburg
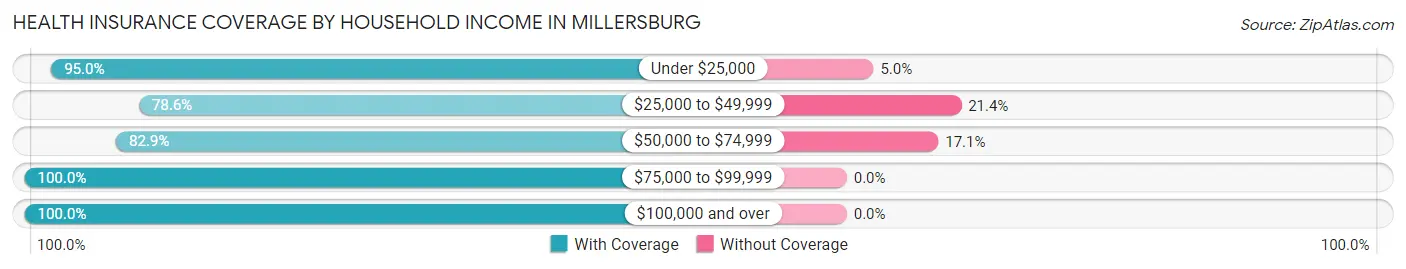
| Household Income | With Coverage | Without Coverage |
| Under $25,000 | 38 (95.0%) | 2 (5.0%) |
| $25,000 to $49,999 | 44 (78.6%) | 12 (21.4%) |
| $50,000 to $74,999 | 29 (82.9%) | 6 (17.1%) |
| $75,000 to $99,999 | 22 (100.0%) | 0 (0.0%) |
| $100,000 and over | 9 (100.0%) | 0 (0.0%) |
Public vs Private Health Insurance Coverage by Age in Millersburg
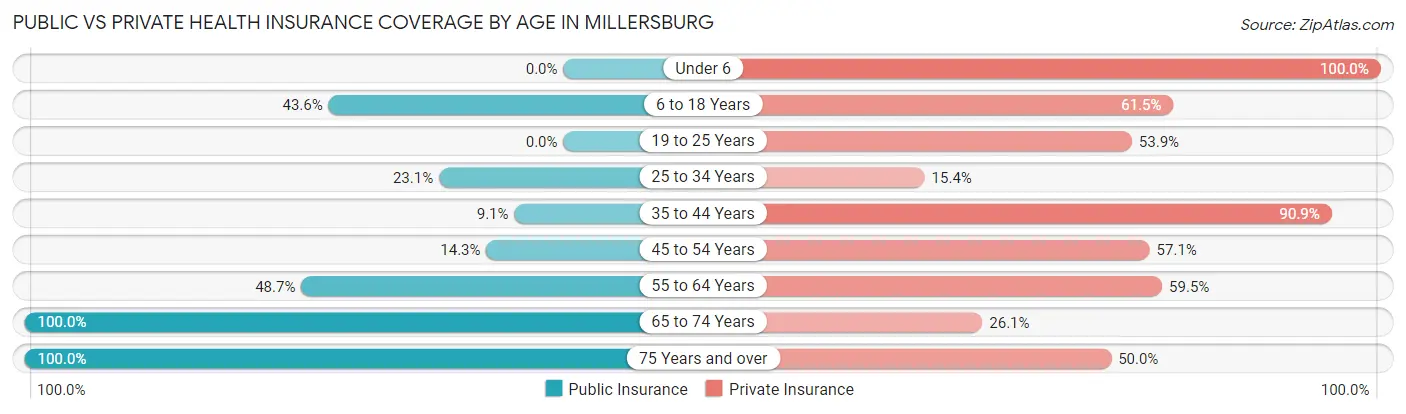
| Age Bracket | Public Insurance | Private Insurance |
| Under 6 | 0 (0.0%) | 1 (100.0%) |
| 6 to 18 Years | 17 (43.6%) | 24 (61.5%) |
| 19 to 25 Years | 0 (0.0%) | 7 (53.8%) |
| 25 to 34 Years | 3 (23.1%) | 2 (15.4%) |
| 35 to 44 Years | 1 (9.1%) | 10 (90.9%) |
| 45 to 54 Years | 1 (14.3%) | 4 (57.1%) |
| 55 to 64 Years | 18 (48.6%) | 22 (59.5%) |
| 65 to 74 Years | 23 (100.0%) | 6 (26.1%) |
| 75 Years and over | 18 (100.0%) | 9 (50.0%) |
| Total | 81 (50.0%) | 85 (52.5%) |
Disability Status by Sex by Age in Millersburg
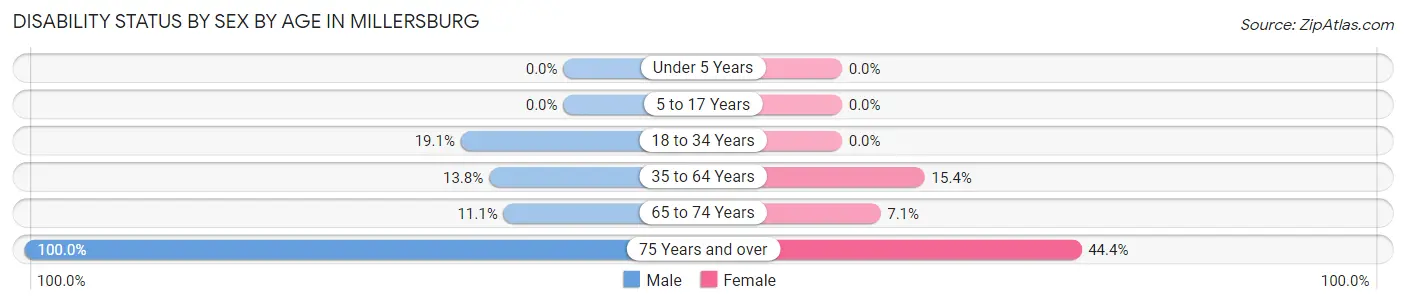
| Age Bracket | Male | Female |
| Under 5 Years | 0 (0.0%) | 0 (0.0%) |
| 5 to 17 Years | 0 (0.0%) | 0 (0.0%) |
| 18 to 34 Years | 4 (19.1%) | 0 (0.0%) |
| 35 to 64 Years | 4 (13.8%) | 4 (15.4%) |
| 65 to 74 Years | 1 (11.1%) | 1 (7.1%) |
| 75 Years and over | 9 (100.0%) | 4 (44.4%) |
Disability Class by Sex by Age in Millersburg
Disability Class: Hearing Difficulty
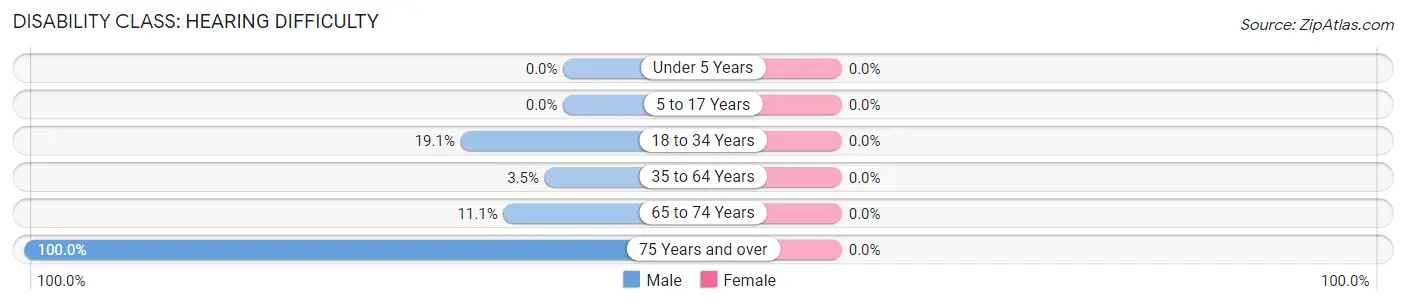
| Age Bracket | Male | Female |
| Under 5 Years | 0 (0.0%) | 0 (0.0%) |
| 5 to 17 Years | 0 (0.0%) | 0 (0.0%) |
| 18 to 34 Years | 4 (19.1%) | 0 (0.0%) |
| 35 to 64 Years | 1 (3.5%) | 0 (0.0%) |
| 65 to 74 Years | 1 (11.1%) | 0 (0.0%) |
| 75 Years and over | 9 (100.0%) | 0 (0.0%) |
Disability Class: Vision Difficulty
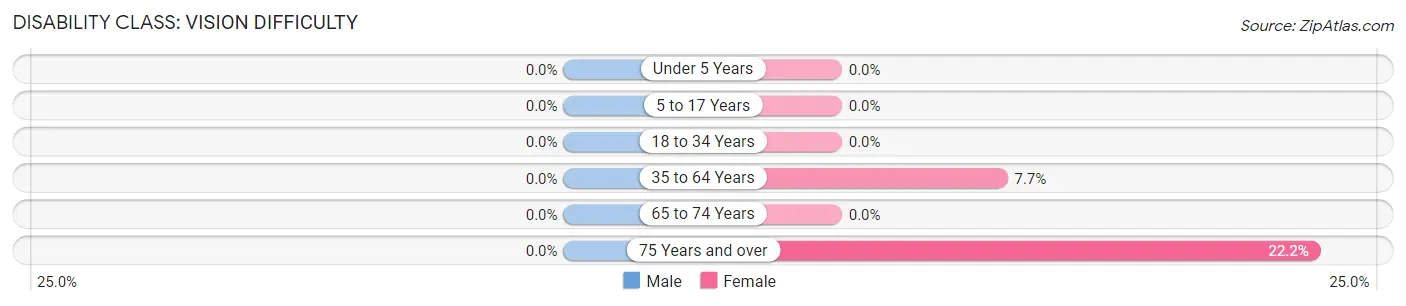
| Age Bracket | Male | Female |
| Under 5 Years | 0 (0.0%) | 0 (0.0%) |
| 5 to 17 Years | 0 (0.0%) | 0 (0.0%) |
| 18 to 34 Years | 0 (0.0%) | 0 (0.0%) |
| 35 to 64 Years | 0 (0.0%) | 2 (7.7%) |
| 65 to 74 Years | 0 (0.0%) | 0 (0.0%) |
| 75 Years and over | 0 (0.0%) | 2 (22.2%) |
Disability Class: Cognitive Difficulty
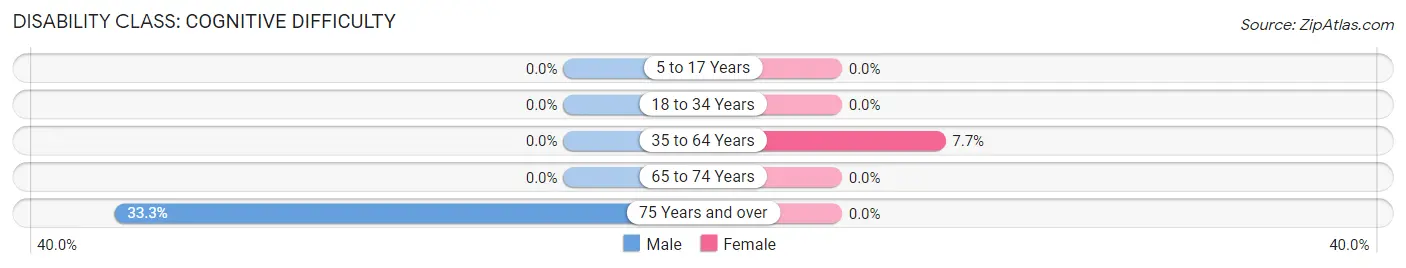
| Age Bracket | Male | Female |
| 5 to 17 Years | 0 (0.0%) | 0 (0.0%) |
| 18 to 34 Years | 0 (0.0%) | 0 (0.0%) |
| 35 to 64 Years | 0 (0.0%) | 2 (7.7%) |
| 65 to 74 Years | 0 (0.0%) | 0 (0.0%) |
| 75 Years and over | 3 (33.3%) | 0 (0.0%) |
Disability Class: Ambulatory Difficulty
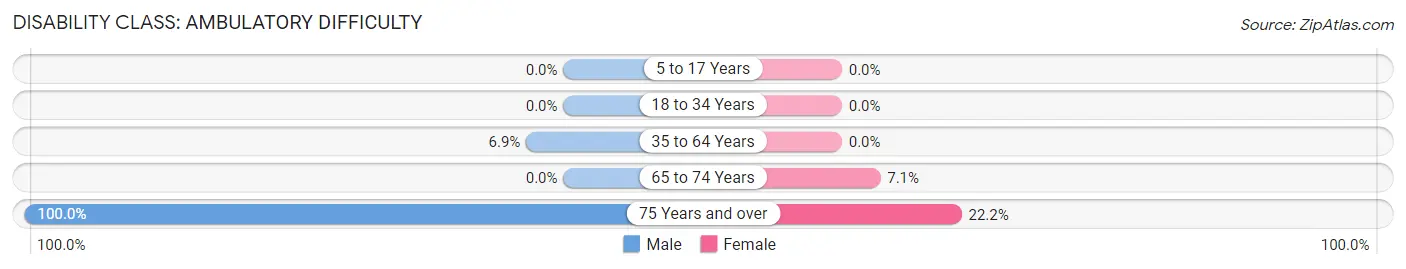
| Age Bracket | Male | Female |
| 5 to 17 Years | 0 (0.0%) | 0 (0.0%) |
| 18 to 34 Years | 0 (0.0%) | 0 (0.0%) |
| 35 to 64 Years | 2 (6.9%) | 0 (0.0%) |
| 65 to 74 Years | 0 (0.0%) | 1 (7.1%) |
| 75 Years and over | 9 (100.0%) | 2 (22.2%) |
Disability Class: Self-Care Difficulty
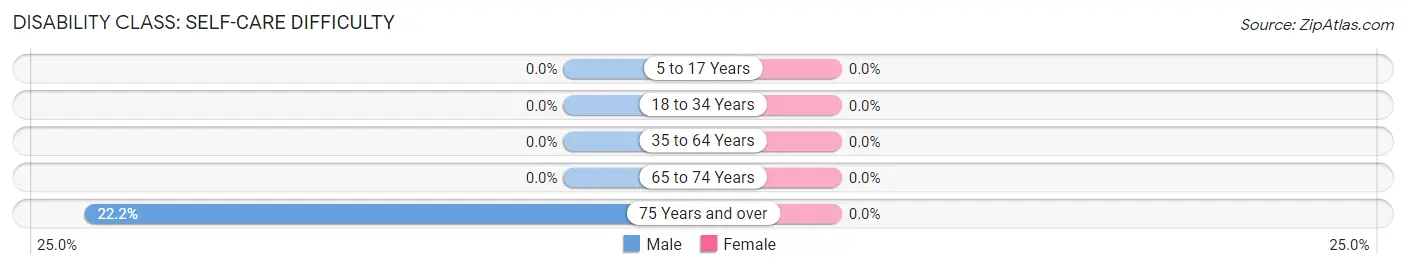
| Age Bracket | Male | Female |
| 5 to 17 Years | 0 (0.0%) | 0 (0.0%) |
| 18 to 34 Years | 0 (0.0%) | 0 (0.0%) |
| 35 to 64 Years | 0 (0.0%) | 0 (0.0%) |
| 65 to 74 Years | 0 (0.0%) | 0 (0.0%) |
| 75 Years and over | 2 (22.2%) | 0 (0.0%) |
Technology Access in Millersburg
Computing Device Access in Millersburg
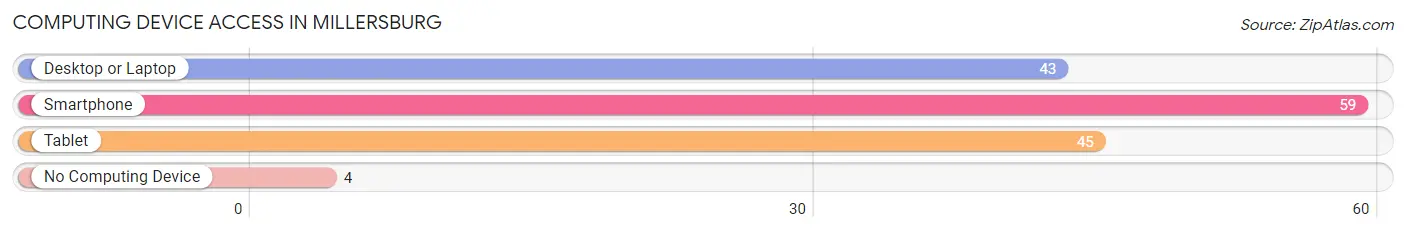
| Device Type | # Households | % Households |
| Desktop or Laptop | 43 | 63.2% |
| Smartphone | 59 | 86.8% |
| Tablet | 45 | 66.2% |
| No Computing Device | 4 | 5.9% |
| Total | 68 | 100.0% |
Internet Access in Millersburg
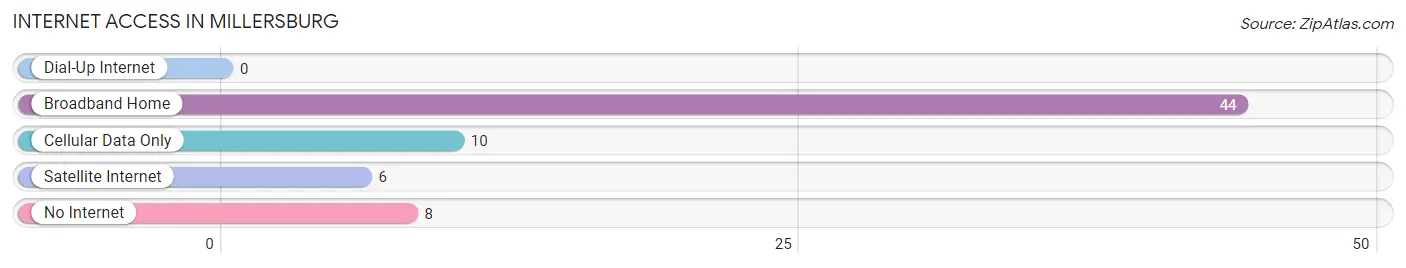
| Internet Type | # Households | % Households |
| Dial-Up Internet | 0 | 0.0% |
| Broadband Home | 44 | 64.7% |
| Cellular Data Only | 10 | 14.7% |
| Satellite Internet | 6 | 8.8% |
| No Internet | 8 | 11.8% |
| Total | 68 | 100.0% |
Millersburg Summary
Millerburg is a small village located in the northern part of Michigan’s Lower Peninsula. It is situated in the center of the state, about 25 miles south of the Mackinac Bridge. The village is surrounded by rolling hills and forests, and is home to a population of just over 500 people.
History
Millerburg was founded in 1867 by a group of settlers from Ohio. The village was named after the Miller family, who were among the first settlers. The village was originally a farming community, and the main crops grown were wheat, corn, and oats. In the late 19th century, the village began to grow and develop, and by the early 20th century, it had become a thriving community.
The village was home to several businesses, including a general store, a blacksmith, a sawmill, and a grist mill. In the early 1900s, the village also had a post office, a school, and a church.
Geography
Millerburg is located in the northern part of Michigan’s Lower Peninsula. It is situated in the center of the state, about 25 miles south of the Mackinac Bridge. The village is surrounded by rolling hills and forests, and is home to a population of just over 500 people.
The village is located in the Huron National Forest, and is close to several lakes, including Lake Huron, Lake Michigan, and Lake Superior. The village is also close to several state parks, including the Porcupine Mountains Wilderness State Park and the Tahquamenon Falls State Park.
Economy
The economy of Millerburg is largely based on tourism. The village is home to several tourist attractions, including the Millerburg Historical Museum, the Millerburg Nature Center, and the Millerburg State Park. The village also hosts several festivals and events throughout the year, including the Millerburg Summer Festival and the Millerburg Fall Festival.
The village is also home to several small businesses, including restaurants, shops, and a grocery store. The village also has a post office, a bank, and a library.
Demographics
As of the 2010 census, the population of Millerburg was 514. The racial makeup of the village was 97.3% White, 0.6% African American, 0.2% Native American, 0.4% Asian, 0.2% from other races, and 1.3% from two or more races. Hispanic or Latino of any race were 1.2% of the population.
The median income for a household in the village was $37,500, and the median income for a family was $45,000. The per capita income for the village was $19,000. About 10.3% of families and 13.2% of the population were below the poverty line, including 16.7% of those under age 18 and 8.3% of those age 65 or over.
Common Questions
What is Per Capita Income in Millersburg?
Per Capita income in Millersburg is $21,107.
What is the Median Family Income in Millersburg?
Median Family Income in Millersburg is $42,188.
What is the Median Household income in Millersburg?
Median Household Income in Millersburg is $41,875.
What is Income or Wage Gap in Millersburg?
Income or Wage Gap in Millersburg is 23.0%.
Women in Millersburg earn 77.0 cents for every dollar earned by a man.
What is Inequality or Gini Index in Millersburg?
Inequality or Gini Index in Millersburg is 0.41.
What is the Total Population of Millersburg?
Total Population of Millersburg is 162.
What is the Total Male Population of Millersburg?
Total Male Population of Millersburg is 86.
What is the Total Female Population of Millersburg?
Total Female Population of Millersburg is 76.
What is the Ratio of Males per 100 Females in Millersburg?
There are 113.16 Males per 100 Females in Millersburg.
What is the Ratio of Females per 100 Males in Millersburg?
There are 88.37 Females per 100 Males in Millersburg.
What is the Median Population Age in Millersburg?
Median Population Age in Millersburg is 54.3 Years.
What is the Average Family Size in Millersburg
Average Family Size in Millersburg is 2.8 People.
What is the Average Household Size in Millersburg
Average Household Size in Millersburg is 2.4 People.
How Large is the Labor Force in Millersburg?
There are 52 People in the Labor Forcein in Millersburg.
What is the Percentage of People in the Labor Force in Millersburg?
37.7% of People are in the Labor Force in Millersburg.
What is the Unemployment Rate in Millersburg?
Unemployment Rate in Millersburg is 5.8%.