Merrill, MI Map & Demographics
Merrill Map
Merrill Overview
$19,792
PER CAPITA INCOME
$52,500
AVG FAMILY INCOME
$43,523
AVG HOUSEHOLD INCOME
45.3%
WAGE / INCOME GAP [ % ]
54.7¢/ $1
WAGE / INCOME GAP [ $ ]
0.46
INEQUALITY / GINI INDEX
898
TOTAL POPULATION
401
MALE POPULATION
497
FEMALE POPULATION
80.68
MALES / 100 FEMALES
123.94
FEMALES / 100 MALES
38.4
MEDIAN AGE
3.8
AVG FAMILY SIZE
3.0
AVG HOUSEHOLD SIZE
371
LABOR FORCE [ PEOPLE ]
54.9%
PERCENT IN LABOR FORCE
26.1%
UNEMPLOYMENT RATE
Merrill Zip Codes
Merrill Area Codes
Income in Merrill
Income Overview in Merrill
Per Capita Income in Merrill is $19,792, while median incomes of families and households are $52,500 and $43,523 respectively.
| Characteristic | Number | Measure |
| Per Capita Income | 898 | $19,792 |
| Median Family Income | 200 | $52,500 |
| Mean Family Income | 200 | $68,198 |
| Median Household Income | 291 | $43,523 |
| Mean Household Income | 291 | $58,035 |
| Income Deficit | 200 | $0 |
| Wage / Income Gap (%) | 898 | 45.34% |
| Wage / Income Gap ($) | 898 | 54.66¢ per $1 |
| Gini / Inequality Index | 898 | 0.46 |
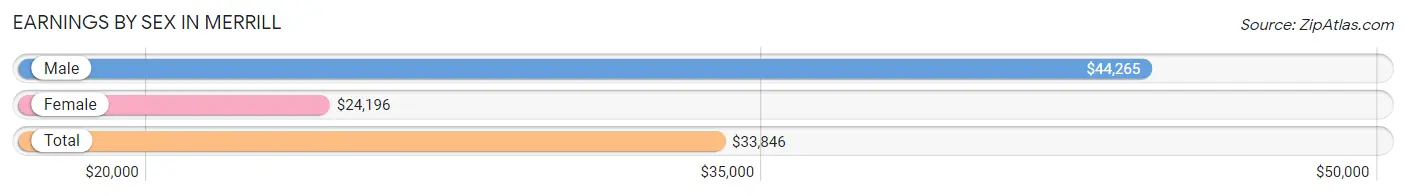
Earnings by Sex in Merrill
Average Earnings in Merrill are $33,846, $44,265 for men and $24,196 for women, a difference of 45.3%.
| Sex | Number | Average Earnings |
| Male | 150 (49.7%) | $44,265 |
| Female | 152 (50.3%) | $24,196 |
| Total | 302 (100.0%) | $33,846 |
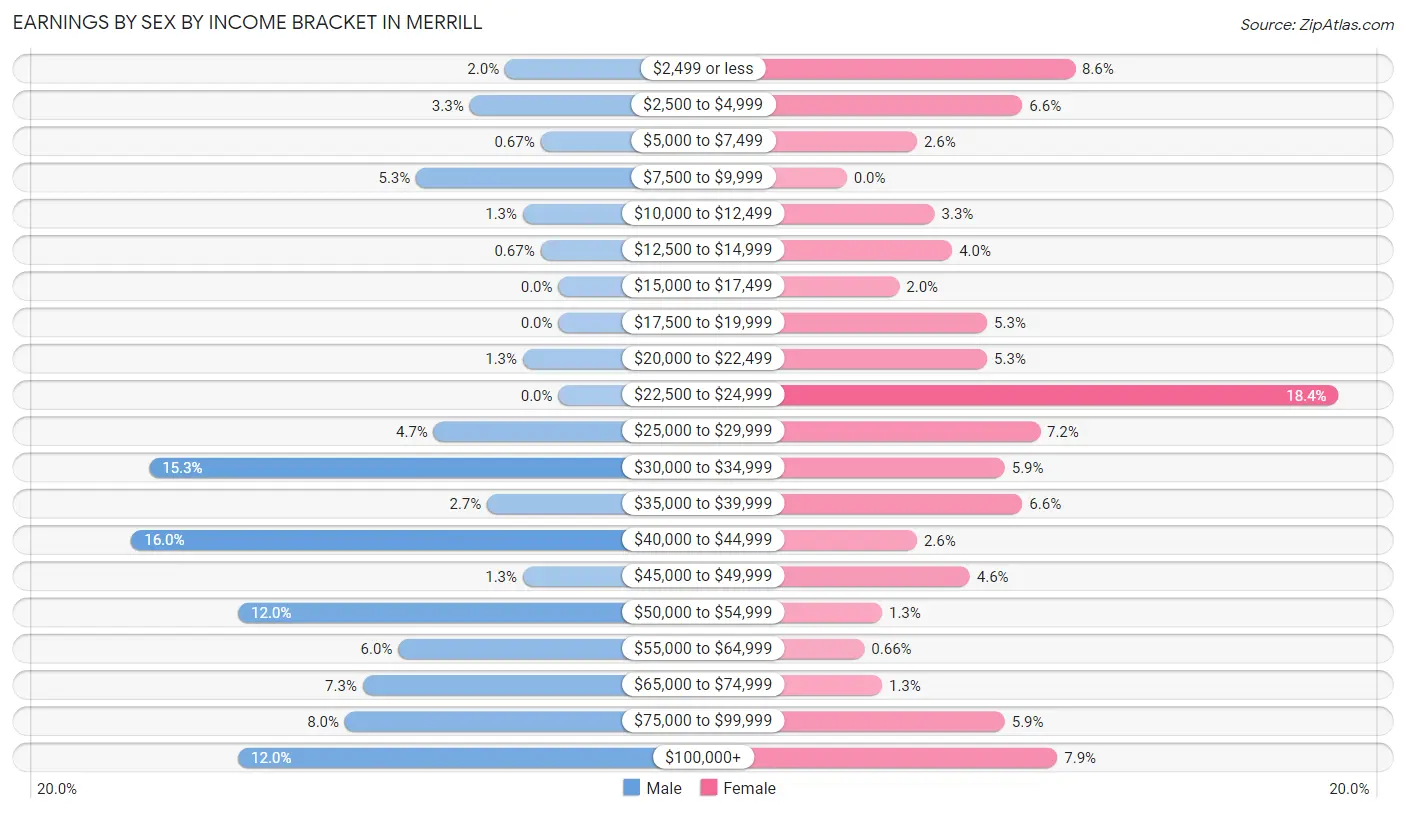
Earnings by Sex by Income Bracket in Merrill
The most common earnings brackets in Merrill are $40,000 to $44,999 for men (24 | 16.0%) and $22,500 to $24,999 for women (28 | 18.4%).
| Income | Male | Female |
| $2,499 or less | 3 (2.0%) | 13 (8.6%) |
| $2,500 to $4,999 | 5 (3.3%) | 10 (6.6%) |
| $5,000 to $7,499 | 1 (0.7%) | 4 (2.6%) |
| $7,500 to $9,999 | 8 (5.3%) | 0 (0.0%) |
| $10,000 to $12,499 | 2 (1.3%) | 5 (3.3%) |
| $12,500 to $14,999 | 1 (0.7%) | 6 (4.0%) |
| $15,000 to $17,499 | 0 (0.0%) | 3 (2.0%) |
| $17,500 to $19,999 | 0 (0.0%) | 8 (5.3%) |
| $20,000 to $22,499 | 2 (1.3%) | 8 (5.3%) |
| $22,500 to $24,999 | 0 (0.0%) | 28 (18.4%) |
| $25,000 to $29,999 | 7 (4.7%) | 11 (7.2%) |
| $30,000 to $34,999 | 23 (15.3%) | 9 (5.9%) |
| $35,000 to $39,999 | 4 (2.7%) | 10 (6.6%) |
| $40,000 to $44,999 | 24 (16.0%) | 4 (2.6%) |
| $45,000 to $49,999 | 2 (1.3%) | 7 (4.6%) |
| $50,000 to $54,999 | 18 (12.0%) | 2 (1.3%) |
| $55,000 to $64,999 | 9 (6.0%) | 1 (0.7%) |
| $65,000 to $74,999 | 11 (7.3%) | 2 (1.3%) |
| $75,000 to $99,999 | 12 (8.0%) | 9 (5.9%) |
| $100,000+ | 18 (12.0%) | 12 (7.9%) |
| Total | 150 (100.0%) | 152 (100.0%) |
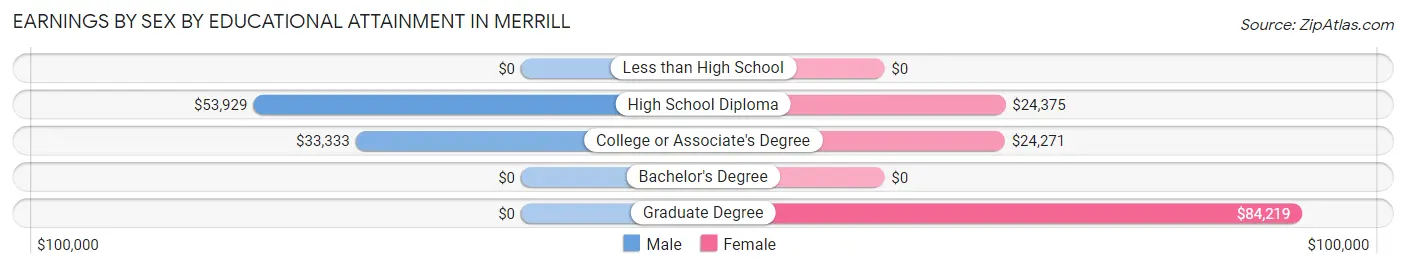
Earnings by Sex by Educational Attainment in Merrill
Average earnings in Merrill are $44,338 for men and $30,625 for women, a difference of 30.9%. Men with an educational attainment of high school diploma enjoy the highest average annual earnings of $53,929, while those with college or associate's degree education earn the least with $33,333. Women with an educational attainment of graduate degree earn the most with the average annual earnings of $84,219, while those with college or associate's degree education have the smallest earnings of $24,271.
| Educational Attainment | Male Income | Female Income |
| Less than High School | - | - |
| High School Diploma | $53,929 | $24,375 |
| College or Associate's Degree | $33,333 | $24,271 |
| Bachelor's Degree | - | - |
| Graduate Degree | - | - |
| Total | $44,338 | $30,625 |
Family Income in Merrill
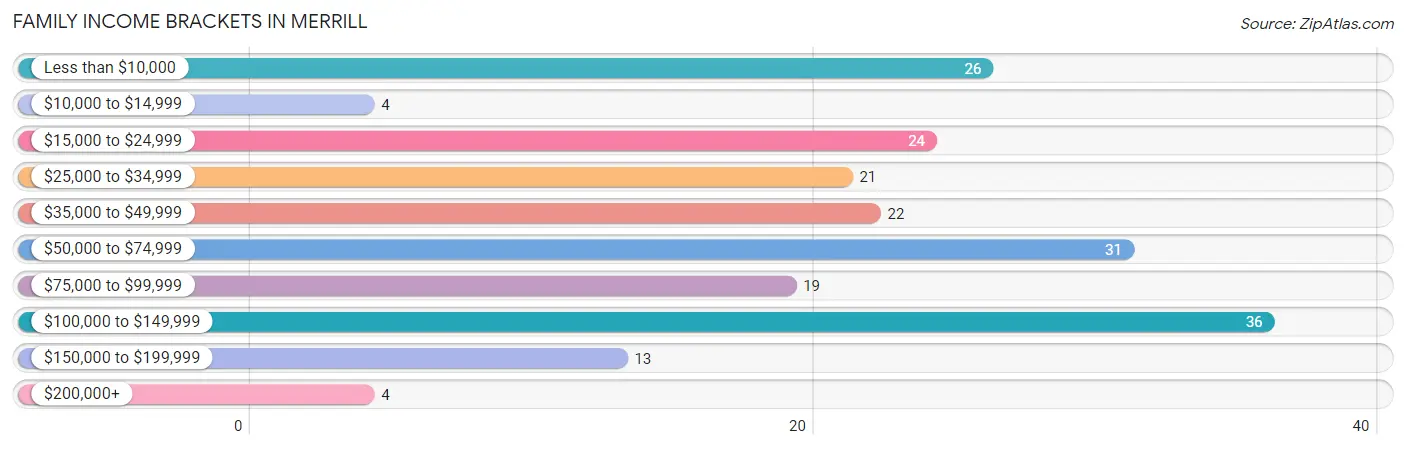
Family Income Brackets in Merrill
According to the Merrill family income data, there are 36 families falling into the $100,000 to $149,999 income range, which is the most common income bracket and makes up 18.0% of all families. Conversely, the $10,000 to $14,999 income bracket is the least frequent group with only 4 families (2.0%) belonging to this category.
| Income Bracket | # Families | % Families |
| Less than $10,000 | 26 | 13.0% |
| $10,000 to $14,999 | 4 | 2.0% |
| $15,000 to $24,999 | 24 | 12.0% |
| $25,000 to $34,999 | 21 | 10.5% |
| $35,000 to $49,999 | 22 | 11.0% |
| $50,000 to $74,999 | 31 | 15.5% |
| $75,000 to $99,999 | 19 | 9.5% |
| $100,000 to $149,999 | 36 | 18.0% |
| $150,000 to $199,999 | 13 | 6.5% |
| $200,000+ | 4 | 2.0% |
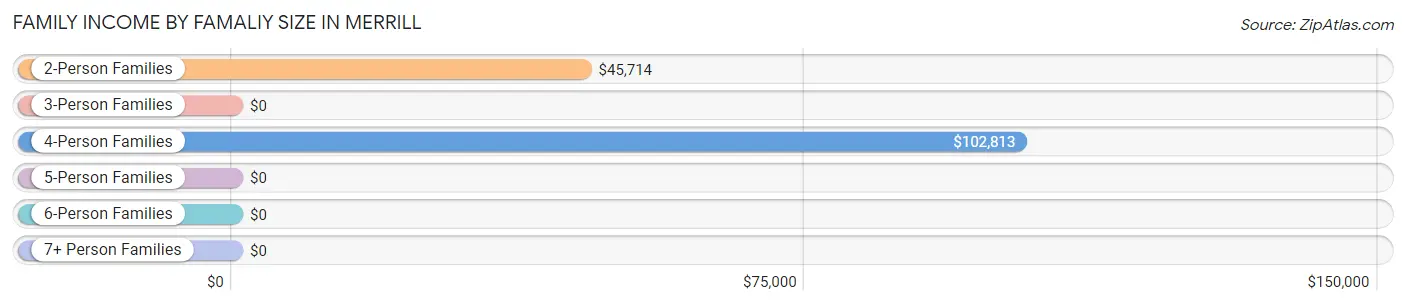
Family Income by Famaliy Size in Merrill
4-person families (19 | 9.5%) account for the highest median family income in Merrill with $102,813 per family, while 4-person families (19 | 9.5%) have the highest median income of $25,703 per family member.
| Income Bracket | # Families | Median Income |
| 2-Person Families | 100 (50.0%) | $45,714 |
| 3-Person Families | 34 (17.0%) | $0 |
| 4-Person Families | 19 (9.5%) | $102,813 |
| 5-Person Families | 39 (19.5%) | $0 |
| 6-Person Families | 2 (1.0%) | $0 |
| 7+ Person Families | 6 (3.0%) | $0 |
| Total | 200 (100.0%) | $52,500 |
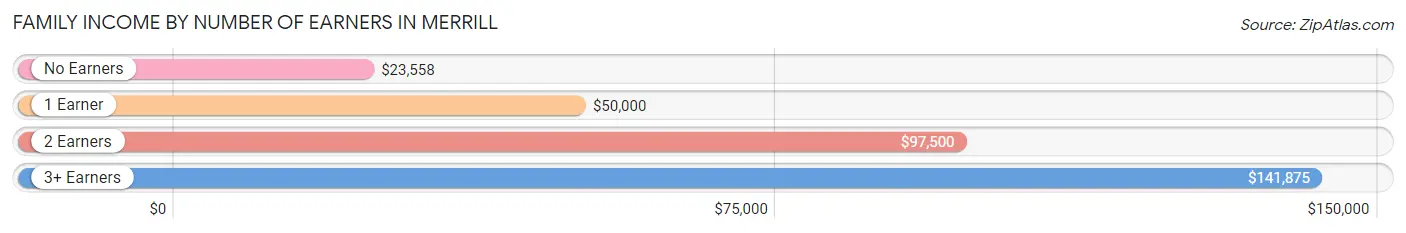
Family Income by Number of Earners in Merrill
The median family income in Merrill is $52,500, with families comprising 3+ earners (23) having the highest median family income of $141,875, while families with no earners (67) have the lowest median family income of $23,558, accounting for 11.5% and 33.5% of families, respectively.
| Number of Earners | # Families | Median Income |
| No Earners | 67 (33.5%) | $23,558 |
| 1 Earner | 62 (31.0%) | $50,000 |
| 2 Earners | 48 (24.0%) | $97,500 |
| 3+ Earners | 23 (11.5%) | $141,875 |
| Total | 200 (100.0%) | $52,500 |
Household Income in Merrill
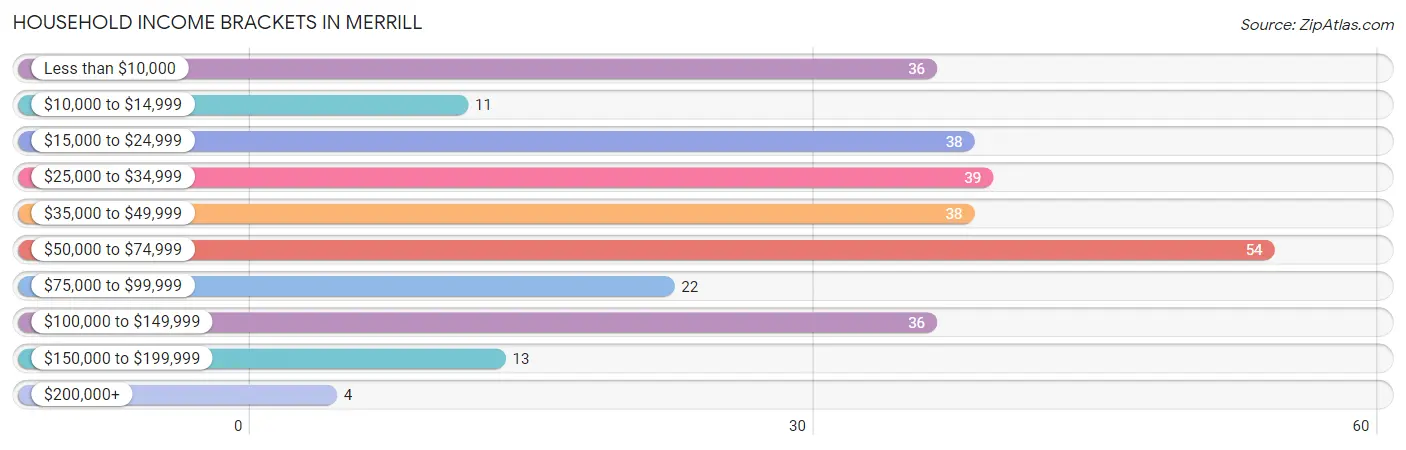
Household Income Brackets in Merrill
With 54 households falling in the category, the $50,000 to $74,999 income range is the most frequent in Merrill, accounting for 18.6% of all households. In contrast, only 4 households (1.4%) fall into the $200,000+ income bracket, making it the least populous group.
| Income Bracket | # Households | % Households |
| Less than $10,000 | 36 | 12.4% |
| $10,000 to $14,999 | 11 | 3.8% |
| $15,000 to $24,999 | 38 | 13.1% |
| $25,000 to $34,999 | 39 | 13.4% |
| $35,000 to $49,999 | 38 | 13.1% |
| $50,000 to $74,999 | 54 | 18.6% |
| $75,000 to $99,999 | 22 | 7.6% |
| $100,000 to $149,999 | 36 | 12.4% |
| $150,000 to $199,999 | 13 | 4.5% |
| $200,000+ | 4 | 1.4% |
Household Income by Householder Age in Merrill
The median household income in Merrill is $43,523, with the highest median household income of $73,125 found in the 25 to 44 years age bracket for the primary householder. A total of 71 households (24.4%) fall into this category. Meanwhile, the 65+ years age bracket for the primary householder has the lowest median household income of $29,000, with 86 households (29.5%) in this group.
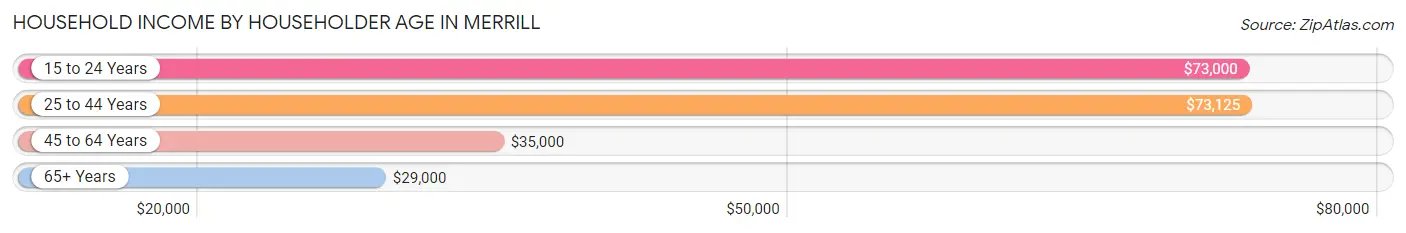
| Income Bracket | # Households | Median Income |
| 15 to 24 Years | 8 (2.8%) | $73,000 |
| 25 to 44 Years | 71 (24.4%) | $73,125 |
| 45 to 64 Years | 126 (43.3%) | $35,000 |
| 65+ Years | 86 (29.5%) | $29,000 |
| Total | 291 (100.0%) | $43,523 |
Poverty in Merrill
Income Below Poverty by Sex and Age in Merrill
With 18.9% poverty level for males and 36.8% for females among the residents of Merrill, 6 to 11 year old males and 12 to 14 year old females are the most vulnerable to poverty, with 34 males (70.8%) and 38 females (73.1%) in their respective age groups living below the poverty level.
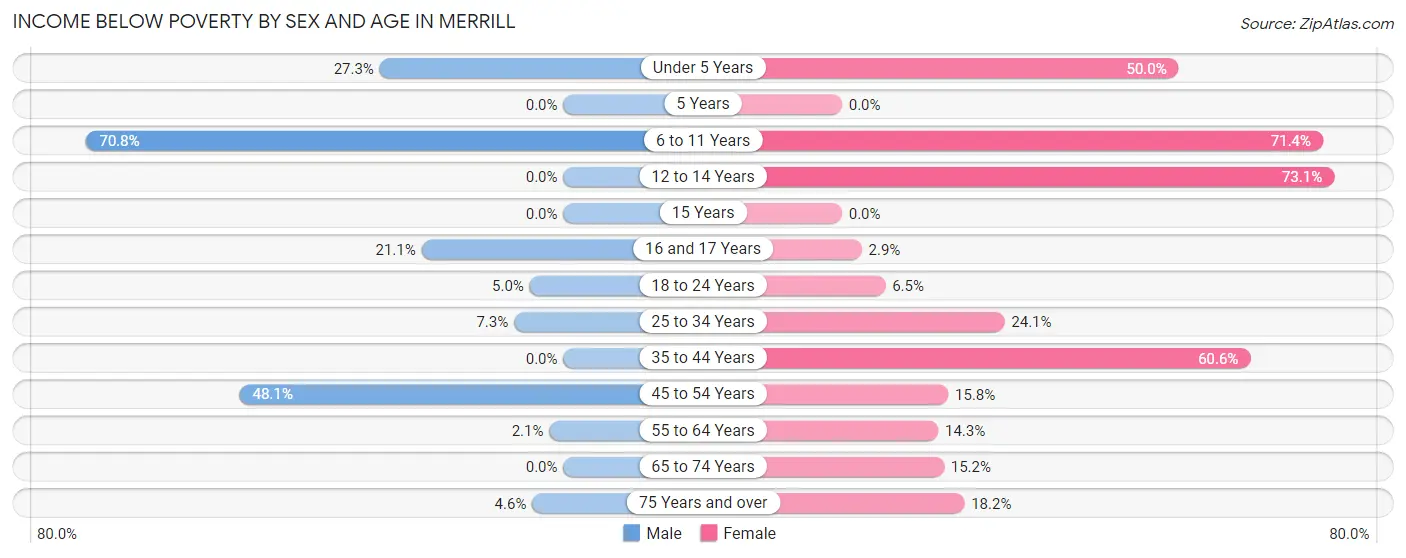
| Age Bracket | Male | Female |
| Under 5 Years | 3 (27.3%) | 3 (50.0%) |
| 5 Years | 0 (0.0%) | 0 (0.0%) |
| 6 to 11 Years | 34 (70.8%) | 45 (71.4%) |
| 12 to 14 Years | 0 (0.0%) | 38 (73.1%) |
| 15 Years | 0 (0.0%) | 0 (0.0%) |
| 16 and 17 Years | 4 (21.0%) | 1 (2.9%) |
| 18 to 24 Years | 1 (5.0%) | 2 (6.5%) |
| 25 to 34 Years | 3 (7.3%) | 7 (24.1%) |
| 35 to 44 Years | 0 (0.0%) | 57 (60.6%) |
| 45 to 54 Years | 25 (48.1%) | 6 (15.8%) |
| 55 to 64 Years | 1 (2.1%) | 7 (14.3%) |
| 65 to 74 Years | 0 (0.0%) | 5 (15.1%) |
| 75 Years and over | 3 (4.6%) | 12 (18.2%) |
| Total | 74 (18.9%) | 183 (36.8%) |
Income Above Poverty by Sex and Age in Merrill
According to the poverty statistics in Merrill, males aged 5 years and females aged 5 years are the age groups that are most secure financially, with 100.0% of males and 100.0% of females in these age groups living above the poverty line.
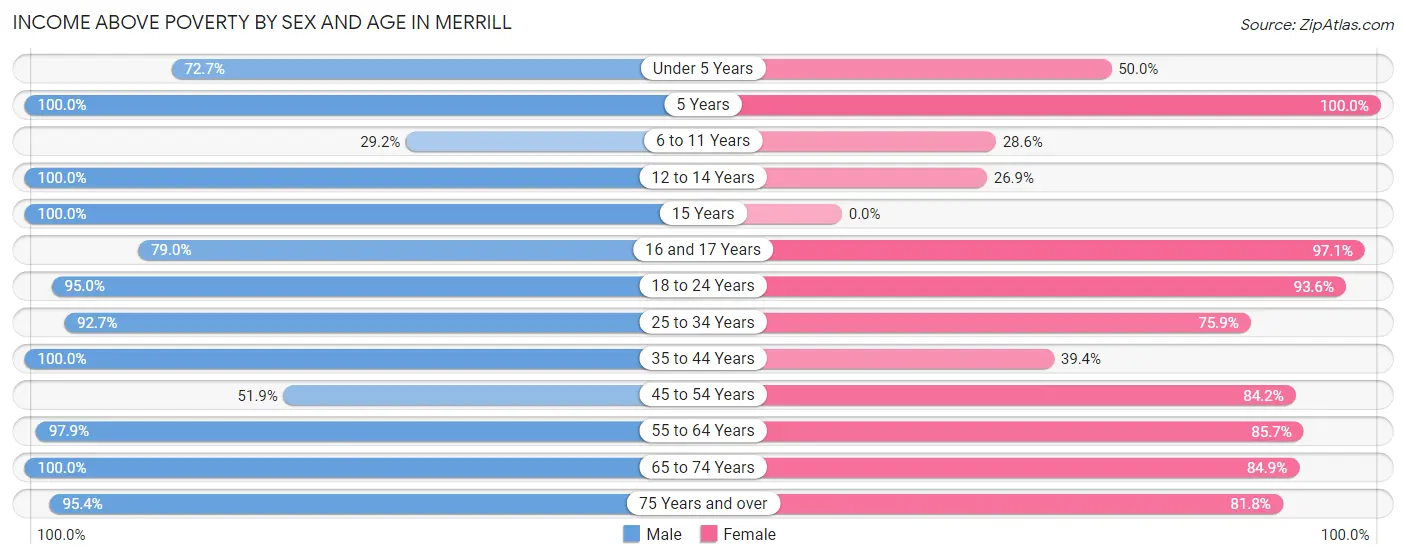
| Age Bracket | Male | Female |
| Under 5 Years | 8 (72.7%) | 3 (50.0%) |
| 5 Years | 5 (100.0%) | 2 (100.0%) |
| 6 to 11 Years | 14 (29.2%) | 18 (28.6%) |
| 12 to 14 Years | 22 (100.0%) | 14 (26.9%) |
| 15 Years | 3 (100.0%) | 0 (0.0%) |
| 16 and 17 Years | 15 (78.9%) | 33 (97.1%) |
| 18 to 24 Years | 19 (95.0%) | 29 (93.5%) |
| 25 to 34 Years | 38 (92.7%) | 22 (75.9%) |
| 35 to 44 Years | 41 (100.0%) | 37 (39.4%) |
| 45 to 54 Years | 27 (51.9%) | 32 (84.2%) |
| 55 to 64 Years | 47 (97.9%) | 42 (85.7%) |
| 65 to 74 Years | 16 (100.0%) | 28 (84.9%) |
| 75 Years and over | 62 (95.4%) | 54 (81.8%) |
| Total | 317 (81.1%) | 314 (63.2%) |
Income Below Poverty Among Married-Couple Families in Merrill
The poverty statistics for married-couple families in Merrill show that 15.3% or 23 of the total 150 families live below the poverty line. Families with 3 or 4 children have the highest poverty rate of 68.8%, comprising of 22 families. On the other hand, families with 1 or 2 children have the lowest poverty rate of 0.0%, which includes 0 families.
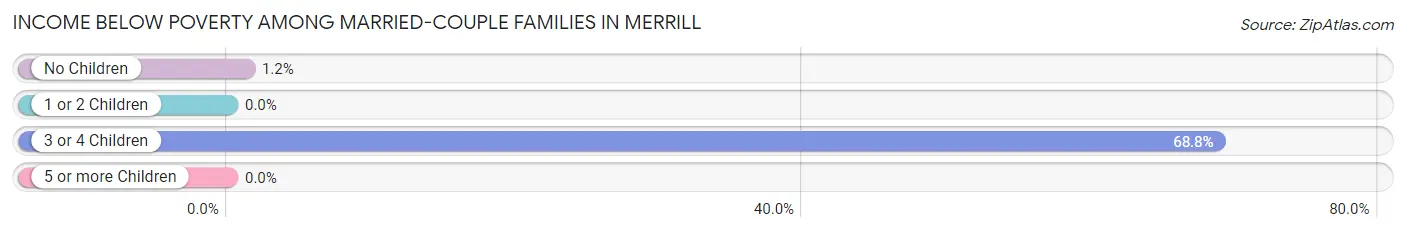
| Children | Above Poverty | Below Poverty |
| No Children | 84 (98.8%) | 1 (1.2%) |
| 1 or 2 Children | 31 (100.0%) | 0 (0.0%) |
| 3 or 4 Children | 10 (31.2%) | 22 (68.8%) |
| 5 or more Children | 2 (100.0%) | 0 (0.0%) |
| Total | 127 (84.7%) | 23 (15.3%) |
Income Below Poverty Among Single-Parent Households in Merrill
According to the poverty data in Merrill, 15.4% or 4 single-father households and 29.2% or 7 single-mother households are living below the poverty line. Among single-father households, those with 1 or 2 children have the highest poverty rate, with 4 households (28.6%) experiencing poverty. Likewise, among single-mother households, those with 1 or 2 children have the highest poverty rate, with 7 households (38.9%) falling below the poverty line.
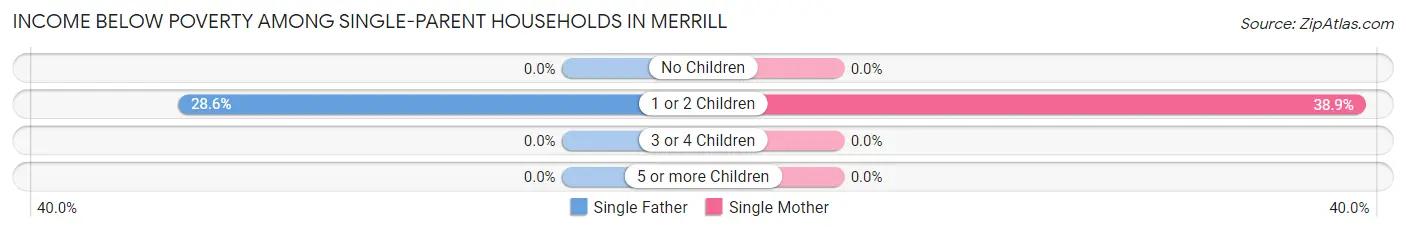
| Children | Single Father | Single Mother |
| No Children | 0 (0.0%) | 0 (0.0%) |
| 1 or 2 Children | 4 (28.6%) | 7 (38.9%) |
| 3 or 4 Children | 0 (0.0%) | 0 (0.0%) |
| 5 or more Children | 0 (0.0%) | 0 (0.0%) |
| Total | 4 (15.4%) | 7 (29.2%) |
Income Below Poverty Among Married-Couple vs Single-Parent Households in Merrill
The poverty data for Merrill shows that 23 of the married-couple family households (15.3%) and 11 of the single-parent households (22.0%) are living below the poverty level. Within the married-couple family households, those with 3 or 4 children have the highest poverty rate, with 22 households (68.8%) falling below the poverty line. Among the single-parent households, those with 1 or 2 children have the highest poverty rate, with 11 household (34.4%) living below poverty.
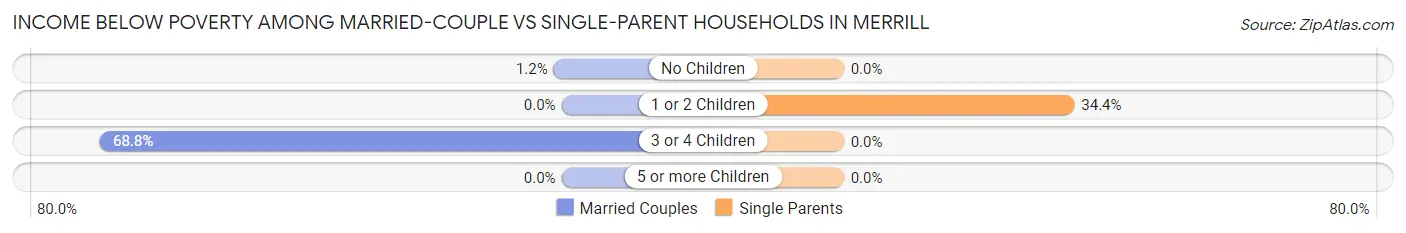
| Children | Married-Couple Families | Single-Parent Households |
| No Children | 1 (1.2%) | 0 (0.0%) |
| 1 or 2 Children | 0 (0.0%) | 11 (34.4%) |
| 3 or 4 Children | 22 (68.8%) | 0 (0.0%) |
| 5 or more Children | 0 (0.0%) | 0 (0.0%) |
| Total | 23 (15.3%) | 11 (22.0%) |
Race in Merrill
The most populous races in Merrill are White / Caucasian (633 | 70.5%), Hispanic or Latino (256 | 28.5%), and Two or more Races (212 | 23.6%).
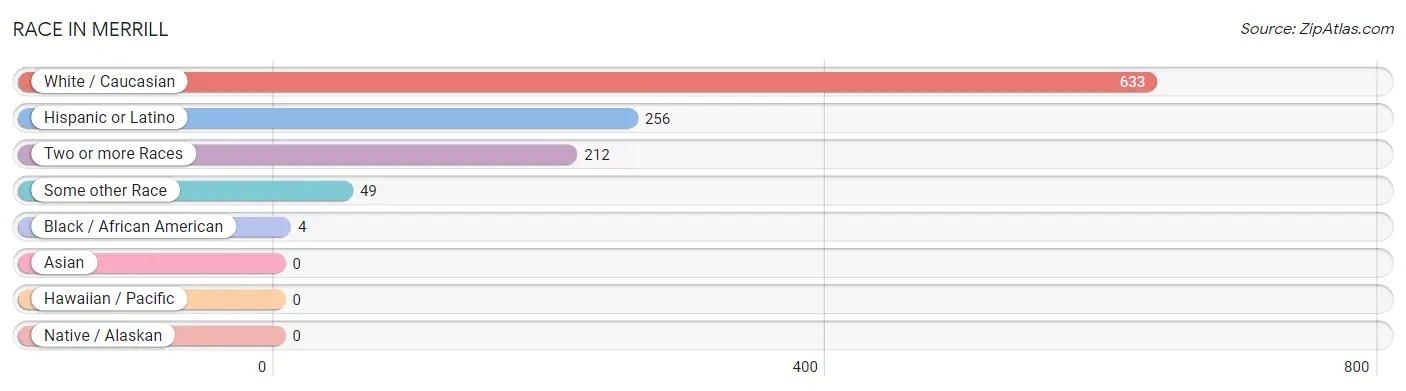
| Race | # Population | % Population |
| Asian | 0 | 0.0% |
| Black / African American | 4 | 0.4% |
| Hawaiian / Pacific | 0 | 0.0% |
| Hispanic or Latino | 256 | 28.5% |
| Native / Alaskan | 0 | 0.0% |
| White / Caucasian | 633 | 70.5% |
| Two or more Races | 212 | 23.6% |
| Some other Race | 49 | 5.5% |
| Total | 898 | 100.0% |
Ancestry in Merrill
The most populous ancestries reported in Merrill are Mexican (256 | 28.5%), German (143 | 15.9%), Irish (96 | 10.7%), English (69 | 7.7%), and Polish (61 | 6.8%), together accounting for 69.6% of all Merrill residents.
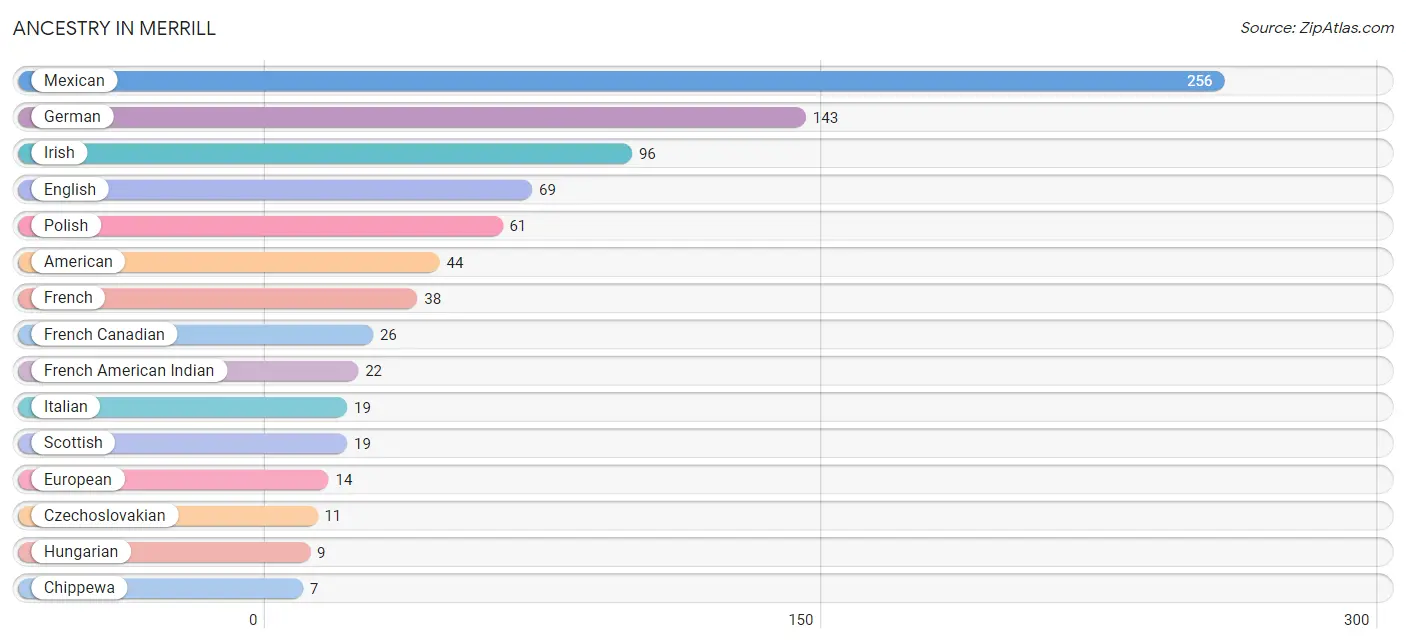
| Ancestry | # Population | % Population |
| American | 44 | 4.9% |
| Belgian | 6 | 0.7% |
| Chippewa | 7 | 0.8% |
| Croatian | 5 | 0.6% |
| Czech | 2 | 0.2% |
| Czechoslovakian | 11 | 1.2% |
| Danish | 2 | 0.2% |
| Dutch | 7 | 0.8% |
| Eastern European | 4 | 0.4% |
| English | 69 | 7.7% |
| European | 14 | 1.6% |
| French | 38 | 4.2% |
| French American Indian | 22 | 2.5% |
| French Canadian | 26 | 2.9% |
| German | 143 | 15.9% |
| Greek | 2 | 0.2% |
| Hungarian | 9 | 1.0% |
| Irish | 96 | 10.7% |
| Italian | 19 | 2.1% |
| Mexican | 256 | 28.5% |
| Polish | 61 | 6.8% |
| Scandinavian | 3 | 0.3% |
| Scotch-Irish | 2 | 0.2% |
| Scottish | 19 | 2.1% |
| Swedish | 2 | 0.2% |
| Welsh | 2 | 0.2% |
| Yugoslavian | 3 | 0.3% | View All 27 Rows |
Immigrants in Merrill
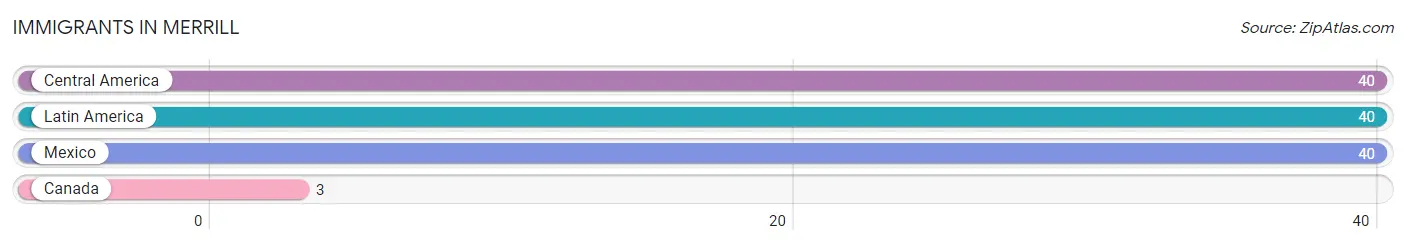
The most numerous immigrant groups reported in Merrill came from Central America (40 | 4.4%), Latin America (40 | 4.4%), Mexico (40 | 4.4%), and Canada (3 | 0.3%), together accounting for 13.7% of all Merrill residents.
| Immigration Origin | # Population | % Population |
| Canada | 3 | 0.3% |
| Central America | 40 | 4.4% |
| Latin America | 40 | 4.4% |
| Mexico | 40 | 4.4% | View All 4 Rows |
Sex and Age in Merrill
Sex and Age in Merrill
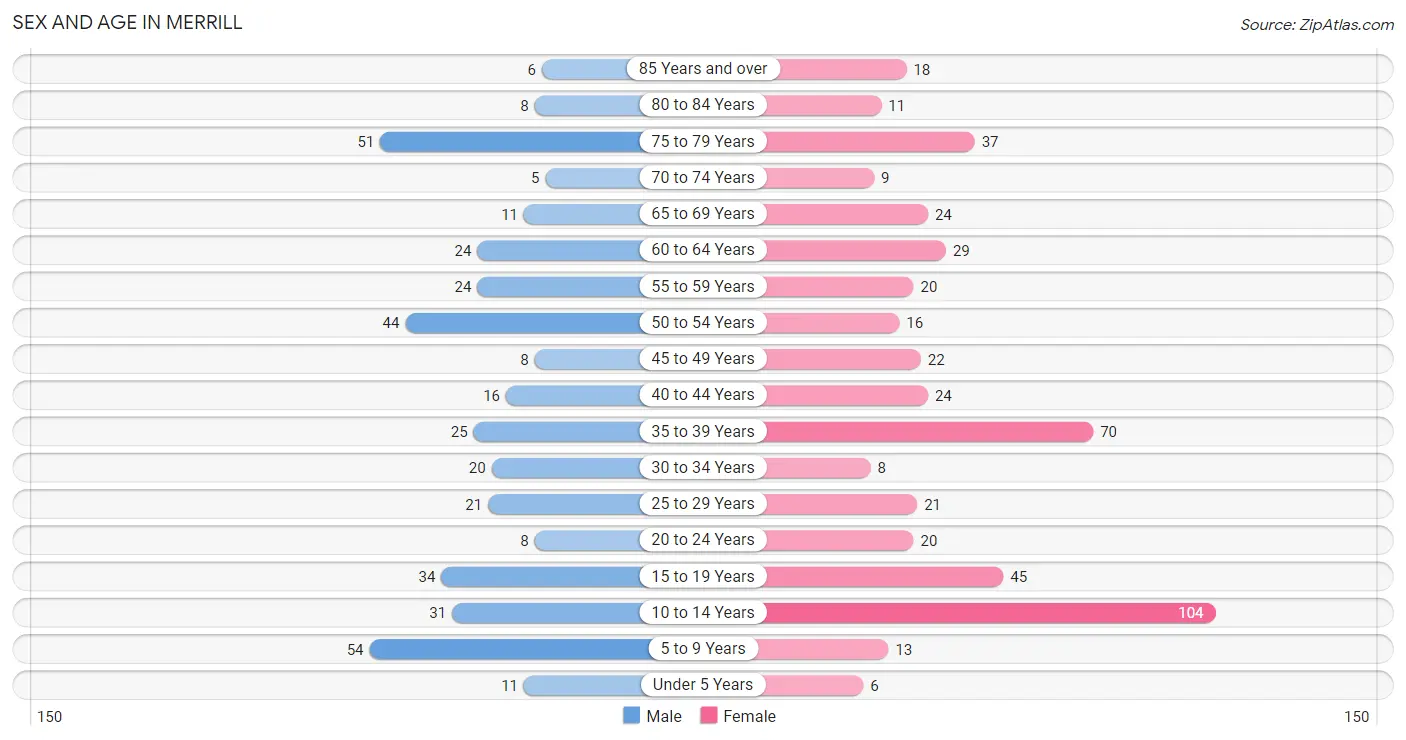
The most populous age groups in Merrill are 5 to 9 Years (54 | 13.5%) for men and 10 to 14 Years (104 | 20.9%) for women.
| Age Bracket | Male | Female |
| Under 5 Years | 11 (2.7%) | 6 (1.2%) |
| 5 to 9 Years | 54 (13.5%) | 13 (2.6%) |
| 10 to 14 Years | 31 (7.7%) | 104 (20.9%) |
| 15 to 19 Years | 34 (8.5%) | 45 (9.0%) |
| 20 to 24 Years | 8 (2.0%) | 20 (4.0%) |
| 25 to 29 Years | 21 (5.2%) | 21 (4.2%) |
| 30 to 34 Years | 20 (5.0%) | 8 (1.6%) |
| 35 to 39 Years | 25 (6.2%) | 70 (14.1%) |
| 40 to 44 Years | 16 (4.0%) | 24 (4.8%) |
| 45 to 49 Years | 8 (2.0%) | 22 (4.4%) |
| 50 to 54 Years | 44 (11.0%) | 16 (3.2%) |
| 55 to 59 Years | 24 (6.0%) | 20 (4.0%) |
| 60 to 64 Years | 24 (6.0%) | 29 (5.8%) |
| 65 to 69 Years | 11 (2.7%) | 24 (4.8%) |
| 70 to 74 Years | 5 (1.3%) | 9 (1.8%) |
| 75 to 79 Years | 51 (12.7%) | 37 (7.4%) |
| 80 to 84 Years | 8 (2.0%) | 11 (2.2%) |
| 85 Years and over | 6 (1.5%) | 18 (3.6%) |
| Total | 401 (100.0%) | 497 (100.0%) |
Families and Households in Merrill
Median Family Size in Merrill
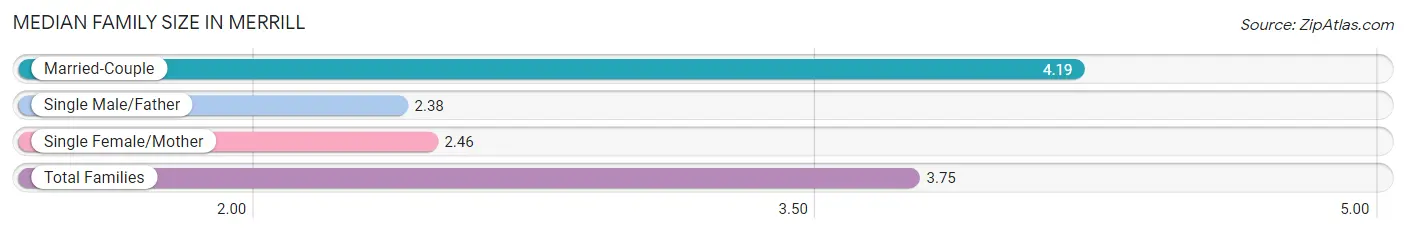
The median family size in Merrill is 3.75 persons per family, with married-couple families (150 | 75.0%) accounting for the largest median family size of 4.19 persons per family. On the other hand, single male/father families (26 | 13.0%) represent the smallest median family size with 2.38 persons per family.
| Family Type | # Families | Family Size |
| Married-Couple | 150 (75.0%) | 4.19 |
| Single Male/Father | 26 (13.0%) | 2.38 |
| Single Female/Mother | 24 (12.0%) | 2.46 |
| Total Families | 200 (100.0%) | 3.75 |
Median Household Size in Merrill
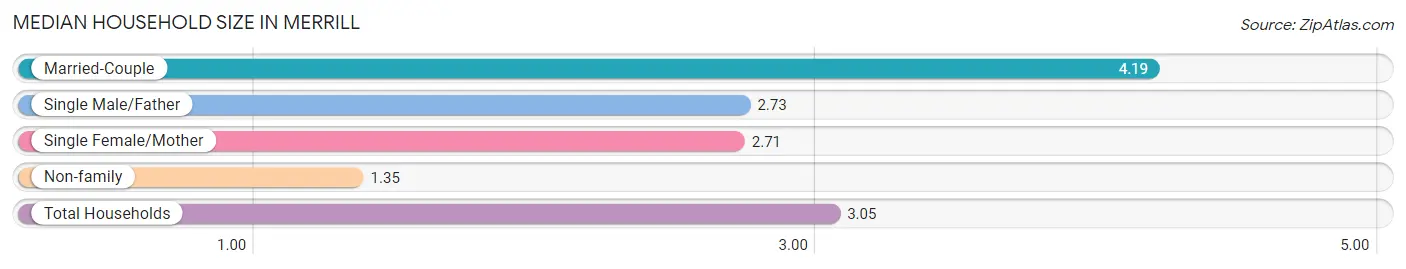
The median household size in Merrill is 3.05 persons per household, with married-couple households (150 | 51.5%) accounting for the largest median household size of 4.19 persons per household. non-family households (91 | 31.3%) represent the smallest median household size with 1.35 persons per household.
| Household Type | # Households | Household Size |
| Married-Couple | 150 (51.5%) | 4.19 |
| Single Male/Father | 26 (8.9%) | 2.73 |
| Single Female/Mother | 24 (8.3%) | 2.71 |
| Non-family | 91 (31.3%) | 1.35 |
| Total Households | 291 (100.0%) | 3.05 |
Household Size by Marriage Status in Merrill
Out of a total of 291 households in Merrill, 200 (68.7%) are family households, while 91 (31.3%) are nonfamily households. The most numerous type of family households are 2-person households, comprising 89, and the most common type of nonfamily households are 1-person households, comprising 69.
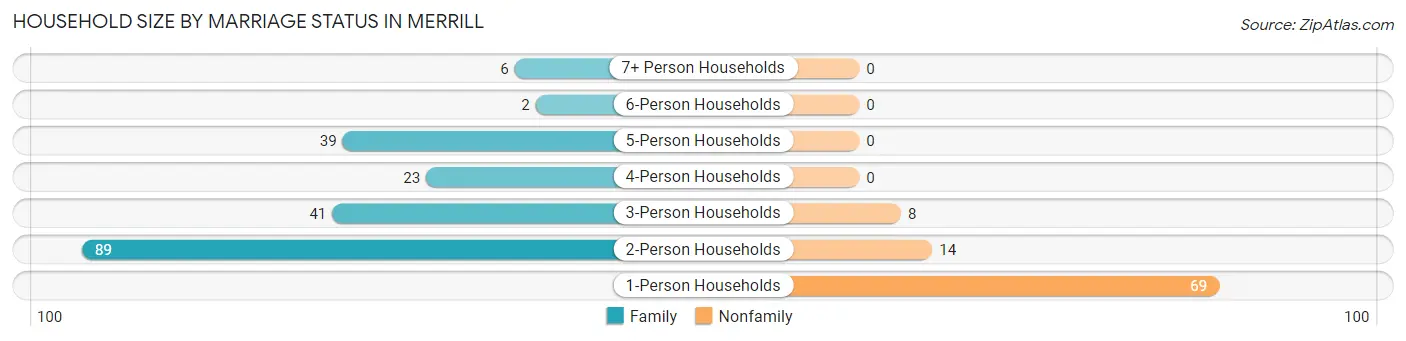
| Household Size | Family Households | Nonfamily Households |
| 1-Person Households | - | 69 (23.7%) |
| 2-Person Households | 89 (30.6%) | 14 (4.8%) |
| 3-Person Households | 41 (14.1%) | 8 (2.8%) |
| 4-Person Households | 23 (7.9%) | 0 (0.0%) |
| 5-Person Households | 39 (13.4%) | 0 (0.0%) |
| 6-Person Households | 2 (0.7%) | 0 (0.0%) |
| 7+ Person Households | 6 (2.1%) | 0 (0.0%) |
| Total | 200 (68.7%) | 91 (31.3%) |
Female Fertility in Merrill
Fertility by Age in Merrill
Average fertility rate in Merrill is 19.0 births per 1,000 women. Women in the age bracket of 20 to 34 years have the highest fertility rate with 82.0 births per 1,000 women. Women in the age bracket of 20 to 34 years acount for 100.0% of all women with births.
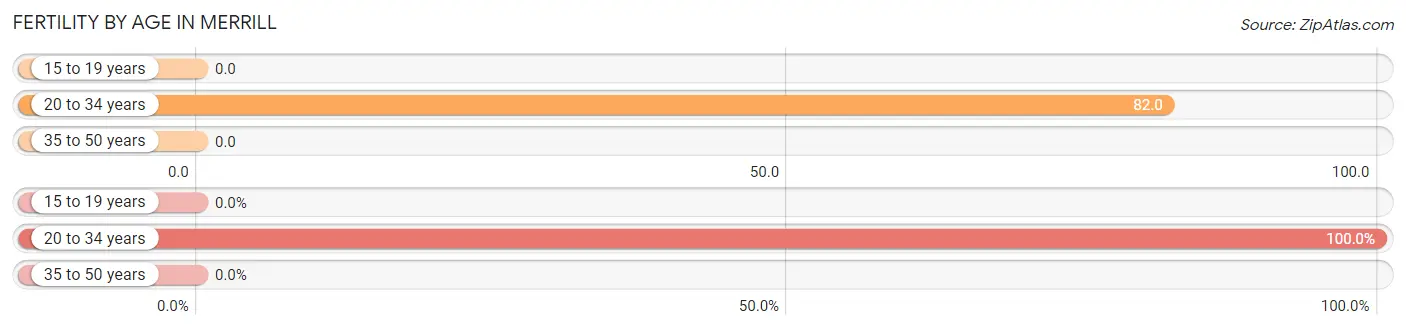
| Age Bracket | Women with Births | Births / 1,000 Women |
| 15 to 19 years | 0 (0.0%) | 0.0 |
| 20 to 34 years | 4 (100.0%) | 82.0 |
| 35 to 50 years | 0 (0.0%) | 0.0 |
| Total | 4 (100.0%) | 19.0 |
Fertility by Age by Marriage Status in Merrill
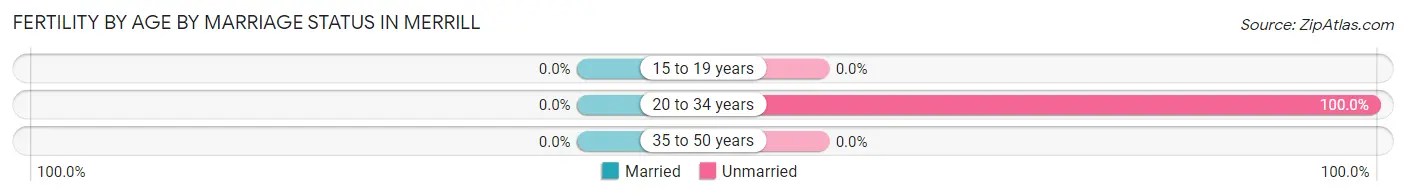
| Age Bracket | Married | Unmarried |
| 15 to 19 years | 0 (0.0%) | 0 (0.0%) |
| 20 to 34 years | 0 (0.0%) | 4 (100.0%) |
| 35 to 50 years | 0 (0.0%) | 0 (0.0%) |
| Total | 0 (0.0%) | 4 (100.0%) |
Fertility by Education in Merrill
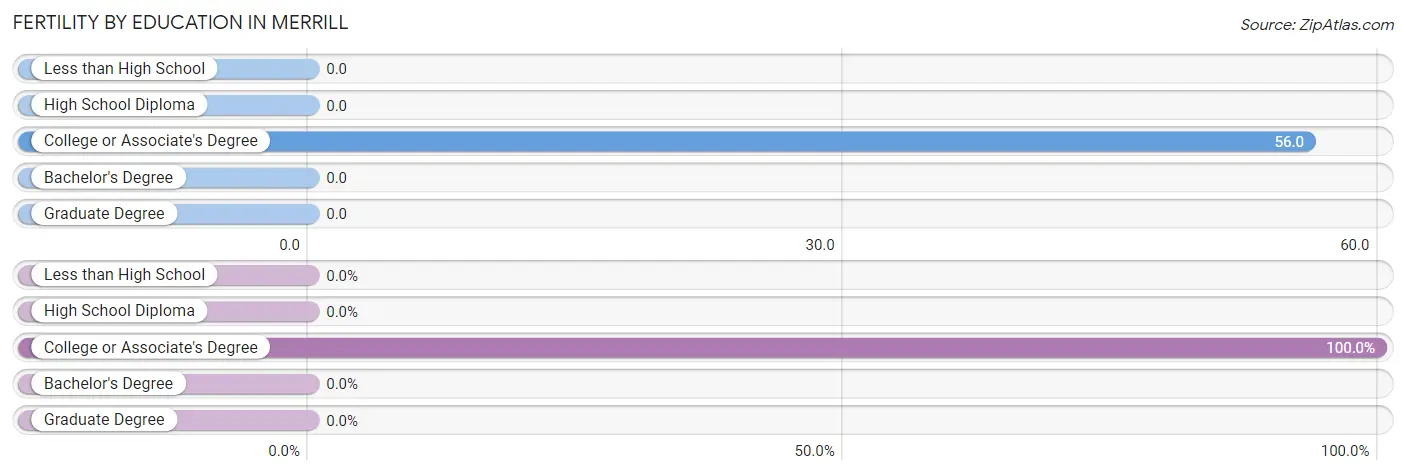
| Educational Attainment | Women with Births | Births / 1,000 Women |
| Less than High School | 0 (0.0%) | 0.0 |
| High School Diploma | 0 (0.0%) | 0.0 |
| College or Associate's Degree | 4 (100.0%) | 56.0 |
| Bachelor's Degree | 0 (0.0%) | 0.0 |
| Graduate Degree | 0 (0.0%) | 0.0 |
| Total | 4 (100.0%) | 19.0 |
Fertility by Education by Marriage Status in Merrill
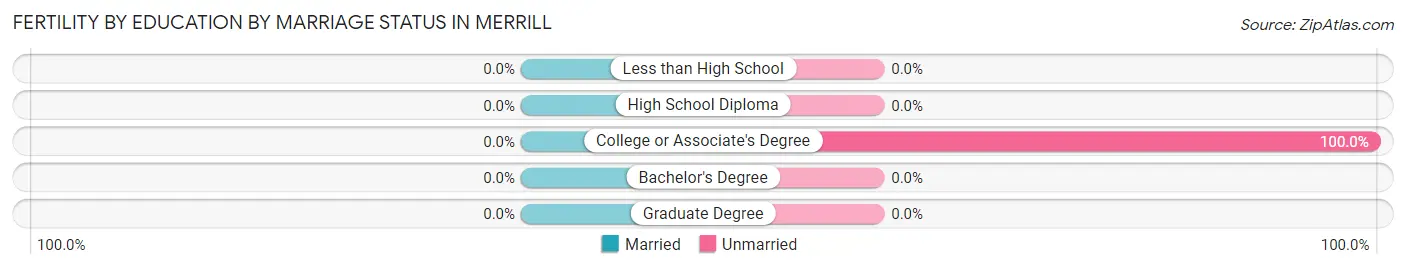
| Educational Attainment | Married | Unmarried |
| Less than High School | 0 (0.0%) | 0 (0.0%) |
| High School Diploma | 0 (0.0%) | 0 (0.0%) |
| College or Associate's Degree | 0 (0.0%) | 4 (100.0%) |
| Bachelor's Degree | 0 (0.0%) | 0 (0.0%) |
| Graduate Degree | 0 (0.0%) | 0 (0.0%) |
| Total | 0 (0.0%) | 4 (100.0%) |
Employment Characteristics in Merrill
Employment by Class of Employer in Merrill
Among the 271 employed individuals in Merrill, private company employees (186 | 68.6%), local government employees (31 | 11.4%), and not-for-profit organizations (28 | 10.3%) make up the most common classes of employment.
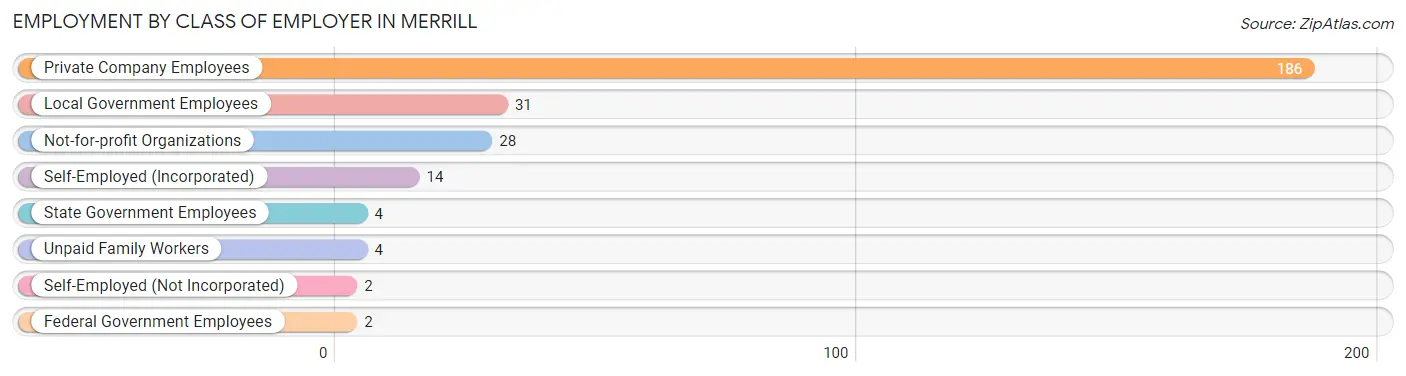
| Employer Class | # Employees | % Employees |
| Private Company Employees | 186 | 68.6% |
| Self-Employed (Incorporated) | 14 | 5.2% |
| Self-Employed (Not Incorporated) | 2 | 0.7% |
| Not-for-profit Organizations | 28 | 10.3% |
| Local Government Employees | 31 | 11.4% |
| State Government Employees | 4 | 1.5% |
| Federal Government Employees | 2 | 0.7% |
| Unpaid Family Workers | 4 | 1.5% |
| Total | 271 | 100.0% |
Employment Status by Age in Merrill
According to the labor force statistics for Merrill, out of the total population over 16 years of age (676), 54.9% or 371 individuals are in the labor force, with 26.1% or 97 of them unemployed. The age group with the highest labor force participation rate is 20 to 24 years, with 100.0% or 28 individuals in the labor force. Within the labor force, the 35 to 44 years age range has the highest percentage of unemployed individuals, with 56.2% or 68 of them being unemployed.
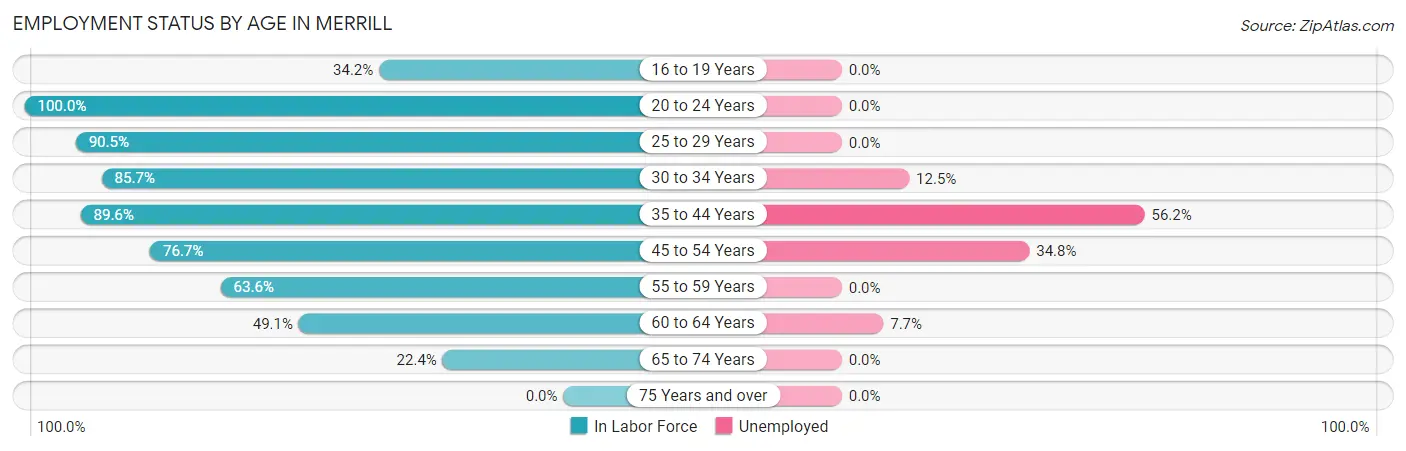
| Age Bracket | In Labor Force | Unemployed |
| 16 to 19 Years | 26 (34.2%) | 0 (0.0%) |
| 20 to 24 Years | 28 (100.0%) | 0 (0.0%) |
| 25 to 29 Years | 38 (90.5%) | 0 (0.0%) |
| 30 to 34 Years | 24 (85.7%) | 3 (12.5%) |
| 35 to 44 Years | 121 (89.6%) | 68 (56.2%) |
| 45 to 54 Years | 69 (76.7%) | 24 (34.8%) |
| 55 to 59 Years | 28 (63.6%) | 0 (0.0%) |
| 60 to 64 Years | 26 (49.1%) | 2 (7.7%) |
| 65 to 74 Years | 11 (22.4%) | 0 (0.0%) |
| 75 Years and over | 0 (0.0%) | 0 (0.0%) |
| Total | 371 (54.9%) | 97 (26.1%) |
Employment Status by Educational Attainment in Merrill
According to labor force statistics for Merrill, 78.1% of individuals (306) out of the total population between 25 and 64 years of age (392) are in the labor force, with 31.7% or 97 of them being unemployed. The group with the highest labor force participation rate are those with the educational attainment of bachelor's degree or higher, with 86.7% or 52 individuals in the labor force. Within the labor force, individuals with less than high school education have the highest percentage of unemployment, with 78.6% or 11 of them being unemployed.
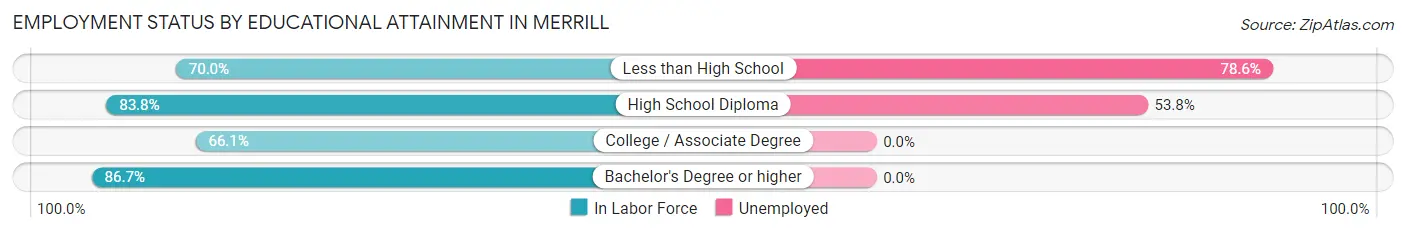
| Educational Attainment | In Labor Force | Unemployed |
| Less than High School | 14 (70.0%) | 16 (78.6%) |
| High School Diploma | 160 (83.8%) | 103 (53.8%) |
| College / Associate Degree | 80 (66.1%) | 0 (0.0%) |
| Bachelor's Degree or higher | 52 (86.7%) | 0 (0.0%) |
| Total | 306 (78.1%) | 124 (31.7%) |
Employment Occupations by Sex in Merrill
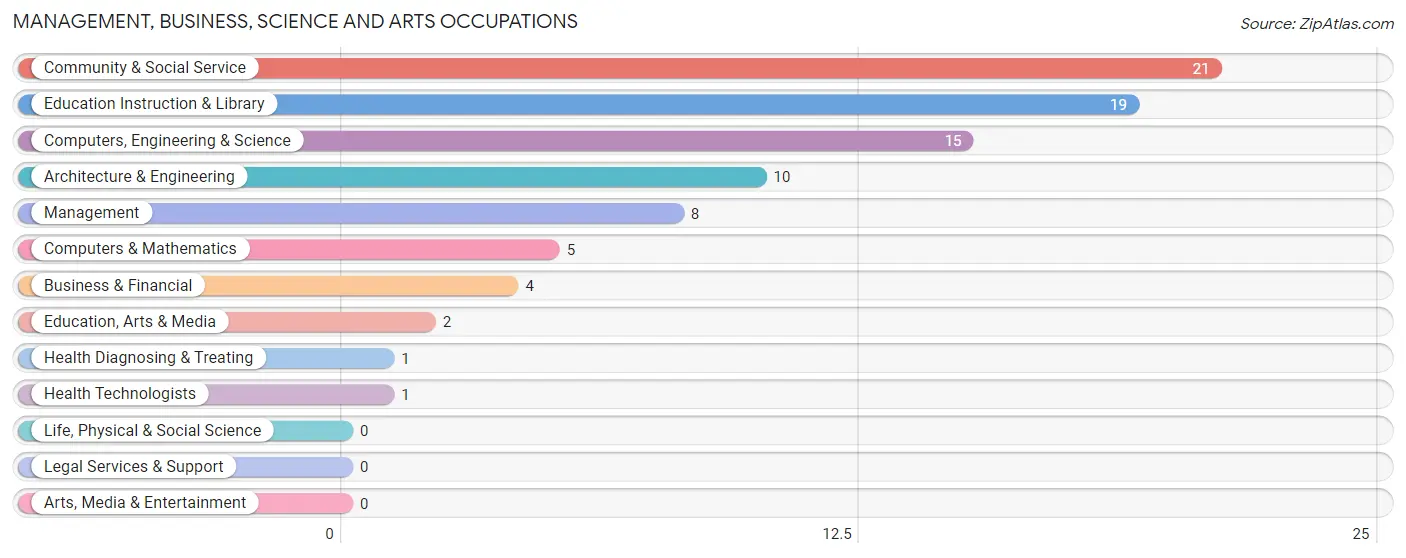
Management, Business, Science and Arts Occupations
The most common Management, Business, Science and Arts occupations in Merrill are Community & Social Service (21 | 7.7%), Education Instruction & Library (19 | 6.9%), Computers, Engineering & Science (15 | 5.5%), Architecture & Engineering (10 | 3.6%), and Management (8 | 2.9%).
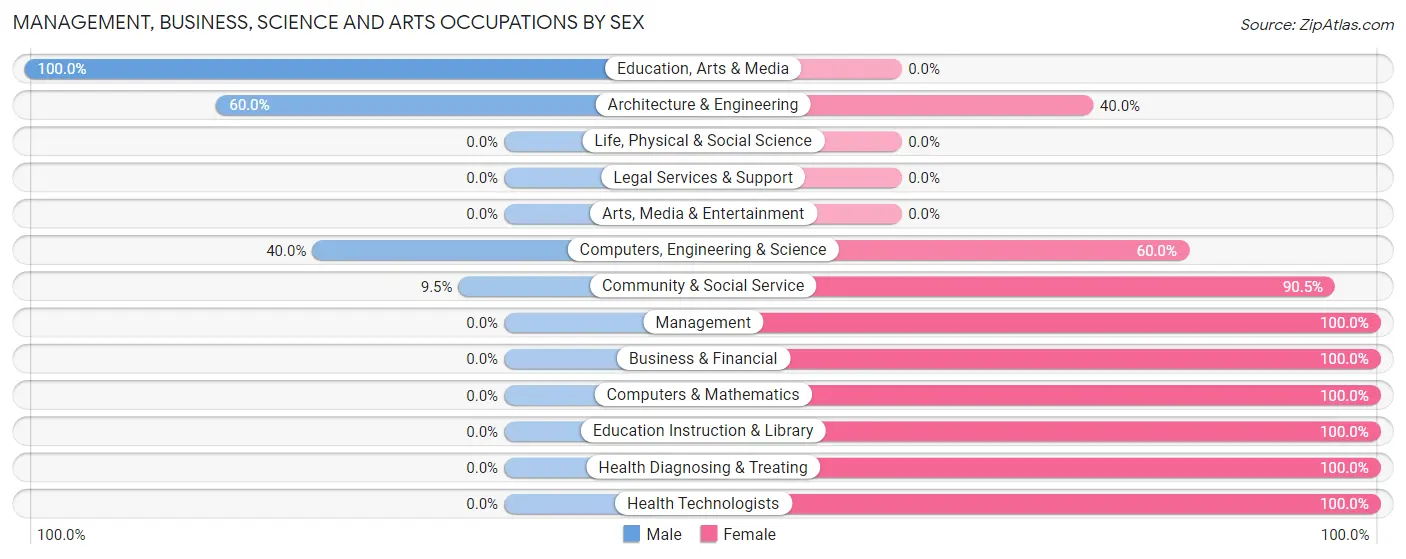
Management, Business, Science and Arts Occupations by Sex
Within the Management, Business, Science and Arts occupations in Merrill, the most male-oriented occupations are Education, Arts & Media (100.0%), Architecture & Engineering (60.0%), and Computers, Engineering & Science (40.0%), while the most female-oriented occupations are Management (100.0%), Business & Financial (100.0%), and Computers & Mathematics (100.0%).
| Occupation | Male | Female |
| Management | 0 (0.0%) | 8 (100.0%) |
| Business & Financial | 0 (0.0%) | 4 (100.0%) |
| Computers, Engineering & Science | 6 (40.0%) | 9 (60.0%) |
| Computers & Mathematics | 0 (0.0%) | 5 (100.0%) |
| Architecture & Engineering | 6 (60.0%) | 4 (40.0%) |
| Life, Physical & Social Science | 0 (0.0%) | 0 (0.0%) |
| Community & Social Service | 2 (9.5%) | 19 (90.5%) |
| Education, Arts & Media | 2 (100.0%) | 0 (0.0%) |
| Legal Services & Support | 0 (0.0%) | 0 (0.0%) |
| Education Instruction & Library | 0 (0.0%) | 19 (100.0%) |
| Arts, Media & Entertainment | 0 (0.0%) | 0 (0.0%) |
| Health Diagnosing & Treating | 0 (0.0%) | 1 (100.0%) |
| Health Technologists | 0 (0.0%) | 1 (100.0%) |
| Total (Category) | 8 (16.3%) | 41 (83.7%) |
| Total (Overall) | 127 (46.4%) | 147 (53.6%) |
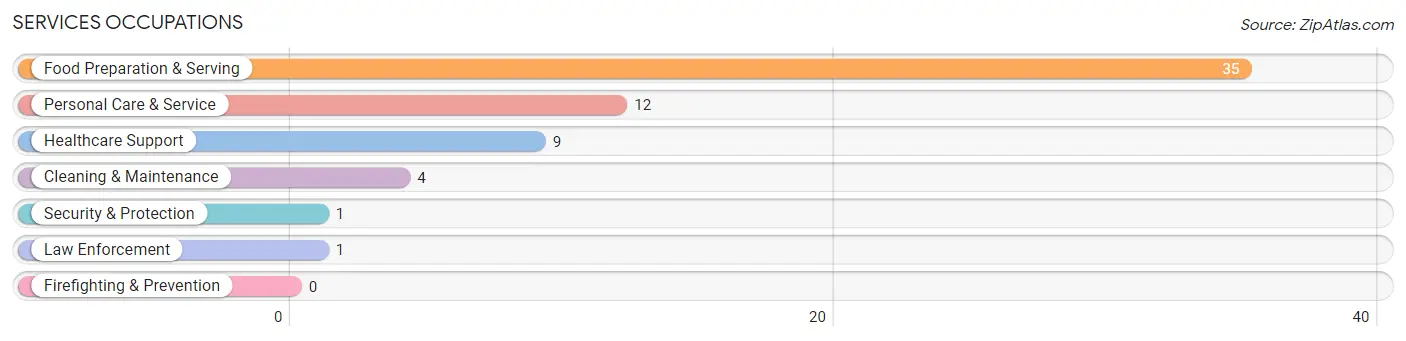
Services Occupations
The most common Services occupations in Merrill are Food Preparation & Serving (35 | 12.8%), Personal Care & Service (12 | 4.4%), Healthcare Support (9 | 3.3%), Cleaning & Maintenance (4 | 1.5%), and Security & Protection (1 | 0.4%).
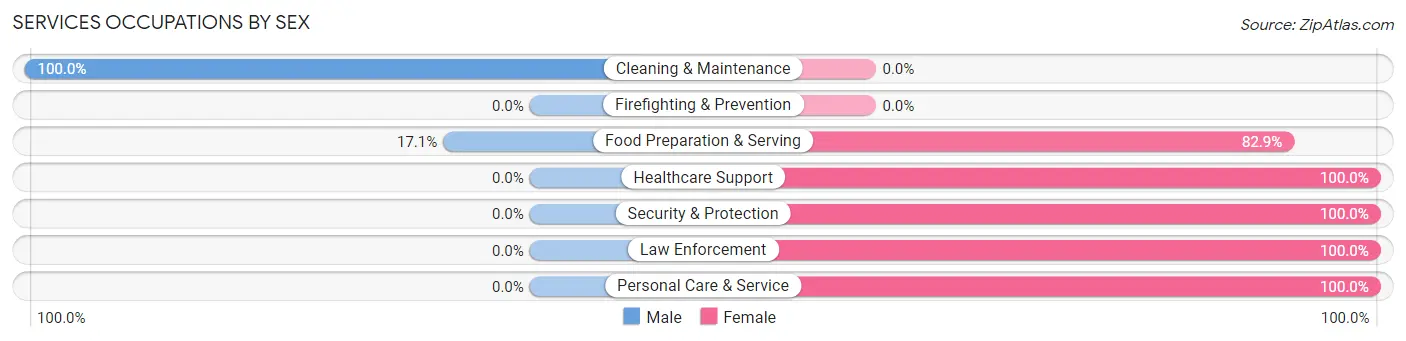
Services Occupations by Sex
Within the Services occupations in Merrill, the most male-oriented occupations are Cleaning & Maintenance (100.0%), and Food Preparation & Serving (17.1%), while the most female-oriented occupations are Healthcare Support (100.0%), Security & Protection (100.0%), and Law Enforcement (100.0%).
| Occupation | Male | Female |
| Healthcare Support | 0 (0.0%) | 9 (100.0%) |
| Security & Protection | 0 (0.0%) | 1 (100.0%) |
| Firefighting & Prevention | 0 (0.0%) | 0 (0.0%) |
| Law Enforcement | 0 (0.0%) | 1 (100.0%) |
| Food Preparation & Serving | 6 (17.1%) | 29 (82.9%) |
| Cleaning & Maintenance | 4 (100.0%) | 0 (0.0%) |
| Personal Care & Service | 0 (0.0%) | 12 (100.0%) |
| Total (Category) | 10 (16.4%) | 51 (83.6%) |
| Total (Overall) | 127 (46.4%) | 147 (53.6%) |
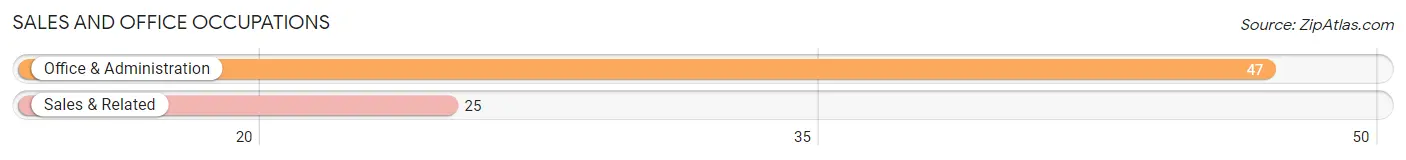
Sales and Office Occupations
The most common Sales and Office occupations in Merrill are Office & Administration (47 | 17.2%), and Sales & Related (25 | 9.1%).
Sales and Office Occupations by Sex
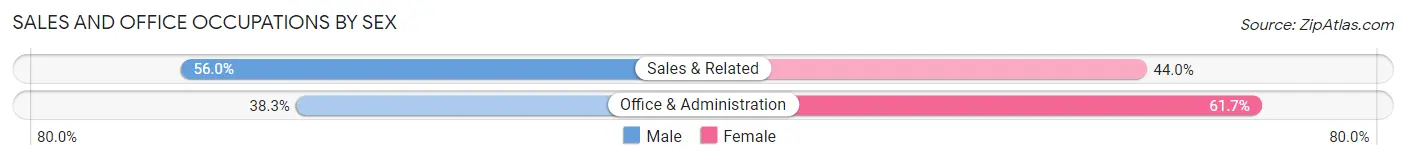
| Occupation | Male | Female |
| Sales & Related | 14 (56.0%) | 11 (44.0%) |
| Office & Administration | 18 (38.3%) | 29 (61.7%) |
| Total (Category) | 32 (44.4%) | 40 (55.6%) |
| Total (Overall) | 127 (46.4%) | 147 (53.6%) |
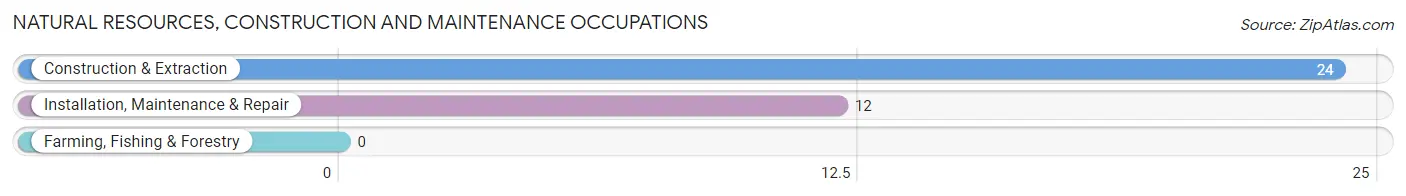
Natural Resources, Construction and Maintenance Occupations
The most common Natural Resources, Construction and Maintenance occupations in Merrill are Construction & Extraction (24 | 8.8%), and Installation, Maintenance & Repair (12 | 4.4%).
Natural Resources, Construction and Maintenance Occupations by Sex
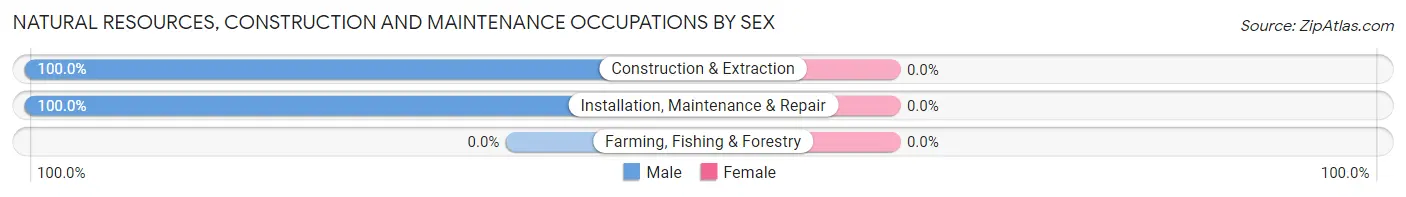
| Occupation | Male | Female |
| Farming, Fishing & Forestry | 0 (0.0%) | 0 (0.0%) |
| Construction & Extraction | 24 (100.0%) | 0 (0.0%) |
| Installation, Maintenance & Repair | 12 (100.0%) | 0 (0.0%) |
| Total (Category) | 36 (100.0%) | 0 (0.0%) |
| Total (Overall) | 127 (46.4%) | 147 (53.6%) |
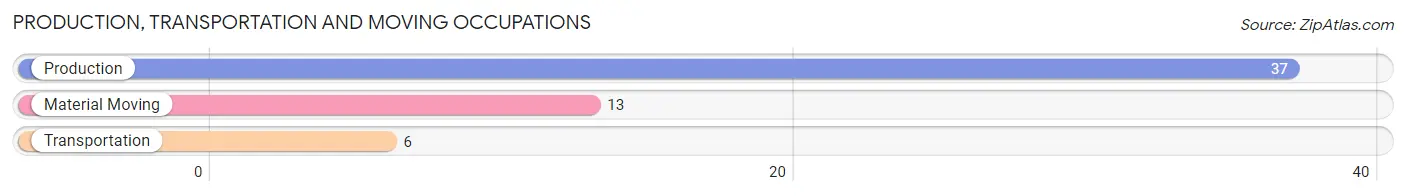
Production, Transportation and Moving Occupations
The most common Production, Transportation and Moving occupations in Merrill are Production (37 | 13.5%), Material Moving (13 | 4.7%), and Transportation (6 | 2.2%).
Production, Transportation and Moving Occupations by Sex
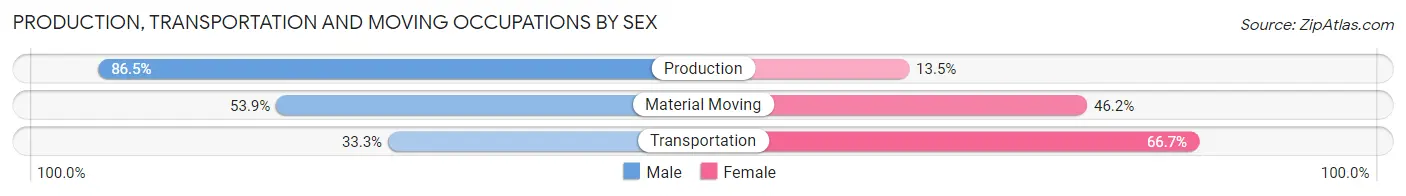
| Occupation | Male | Female |
| Production | 32 (86.5%) | 5 (13.5%) |
| Transportation | 2 (33.3%) | 4 (66.7%) |
| Material Moving | 7 (53.8%) | 6 (46.2%) |
| Total (Category) | 41 (73.2%) | 15 (26.8%) |
| Total (Overall) | 127 (46.4%) | 147 (53.6%) |
Employment Industries by Sex in Merrill
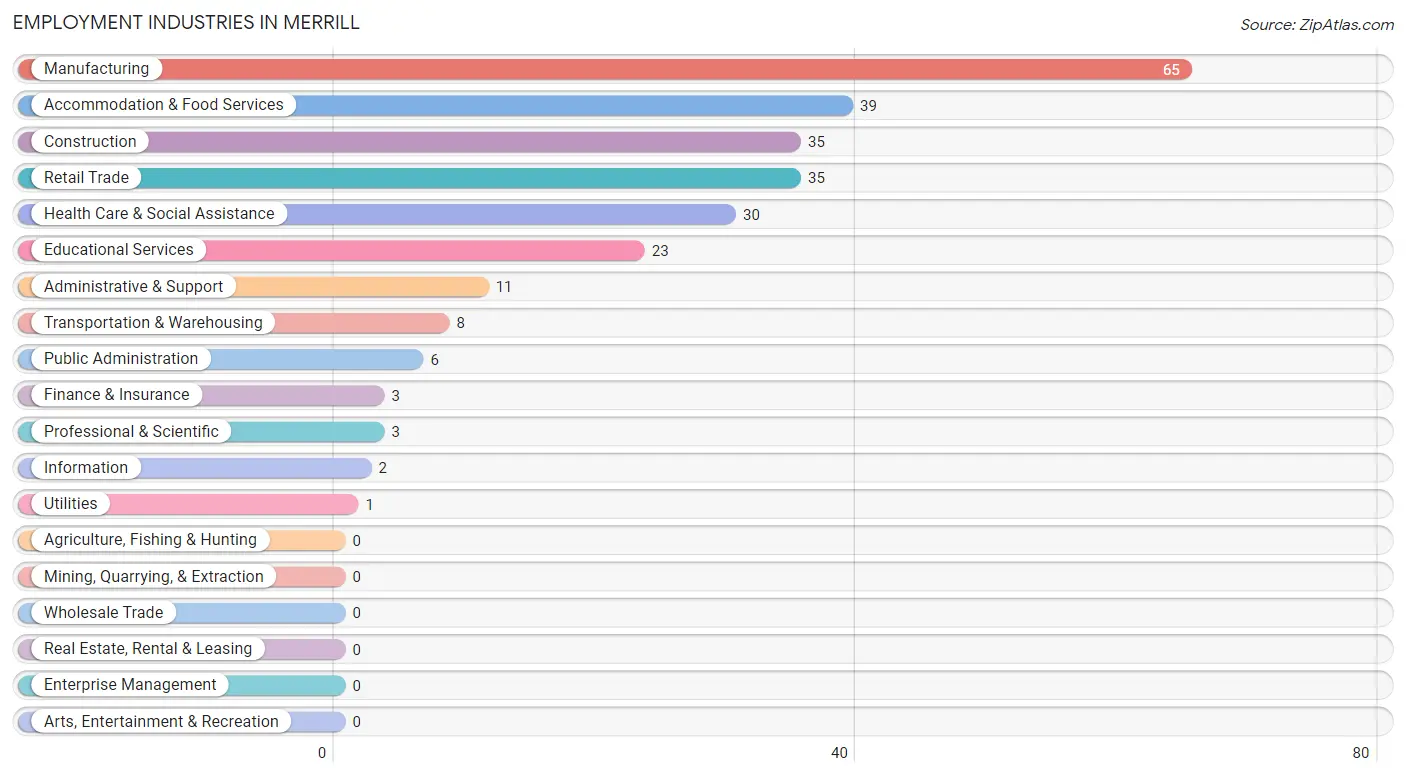
Employment Industries in Merrill
The major employment industries in Merrill include Manufacturing (65 | 23.7%), Accommodation & Food Services (39 | 14.2%), Construction (35 | 12.8%), Retail Trade (35 | 12.8%), and Health Care & Social Assistance (30 | 11.0%).
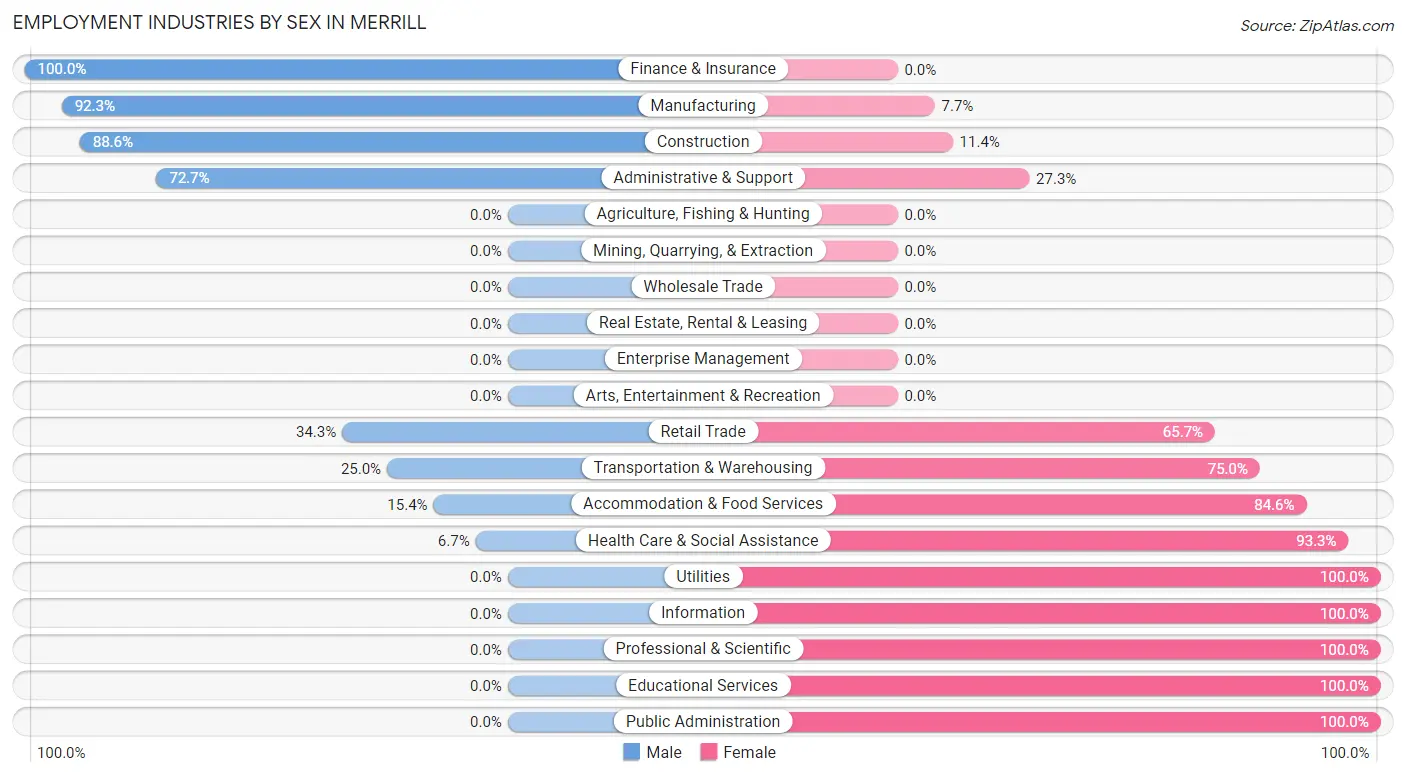
Employment Industries by Sex in Merrill
The Merrill industries that see more men than women are Finance & Insurance (100.0%), Manufacturing (92.3%), and Construction (88.6%), whereas the industries that tend to have a higher number of women are Utilities (100.0%), Information (100.0%), and Professional & Scientific (100.0%).
| Industry | Male | Female |
| Agriculture, Fishing & Hunting | 0 (0.0%) | 0 (0.0%) |
| Mining, Quarrying, & Extraction | 0 (0.0%) | 0 (0.0%) |
| Construction | 31 (88.6%) | 4 (11.4%) |
| Manufacturing | 60 (92.3%) | 5 (7.7%) |
| Wholesale Trade | 0 (0.0%) | 0 (0.0%) |
| Retail Trade | 12 (34.3%) | 23 (65.7%) |
| Transportation & Warehousing | 2 (25.0%) | 6 (75.0%) |
| Utilities | 0 (0.0%) | 1 (100.0%) |
| Information | 0 (0.0%) | 2 (100.0%) |
| Finance & Insurance | 3 (100.0%) | 0 (0.0%) |
| Real Estate, Rental & Leasing | 0 (0.0%) | 0 (0.0%) |
| Professional & Scientific | 0 (0.0%) | 3 (100.0%) |
| Enterprise Management | 0 (0.0%) | 0 (0.0%) |
| Administrative & Support | 8 (72.7%) | 3 (27.3%) |
| Educational Services | 0 (0.0%) | 23 (100.0%) |
| Health Care & Social Assistance | 2 (6.7%) | 28 (93.3%) |
| Arts, Entertainment & Recreation | 0 (0.0%) | 0 (0.0%) |
| Accommodation & Food Services | 6 (15.4%) | 33 (84.6%) |
| Public Administration | 0 (0.0%) | 6 (100.0%) |
| Total | 127 (46.4%) | 147 (53.6%) |
Education in Merrill
School Enrollment in Merrill
The most common levels of schooling among the 304 students in Merrill are middle school (119 | 39.1%), high school (75 | 24.7%), and elementary school (59 | 19.4%).
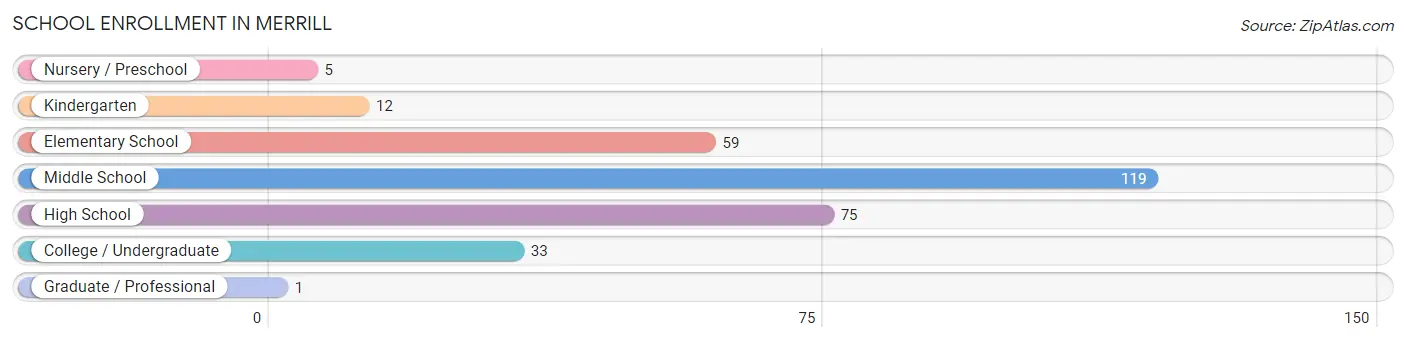
| School Level | # Students | % Students |
| Nursery / Preschool | 5 | 1.6% |
| Kindergarten | 12 | 4.0% |
| Elementary School | 59 | 19.4% |
| Middle School | 119 | 39.1% |
| High School | 75 | 24.7% |
| College / Undergraduate | 33 | 10.9% |
| Graduate / Professional | 1 | 0.3% |
| Total | 304 | 100.0% |
School Enrollment by Age by Funding Source in Merrill
Out of a total of 304 students who are enrolled in schools in Merrill, 9 (3.0%) attend a private institution, while the remaining 295 (97.0%) are enrolled in public schools. The age group of 3 to 4 year olds has the highest likelihood of being enrolled in private schools, with 5 (100.0% in the age bracket) enrolled. Conversely, the age group of 5 to 9 year old has the lowest likelihood of being enrolled in a private school, with 65 (100.0% in the age bracket) attending a public institution.
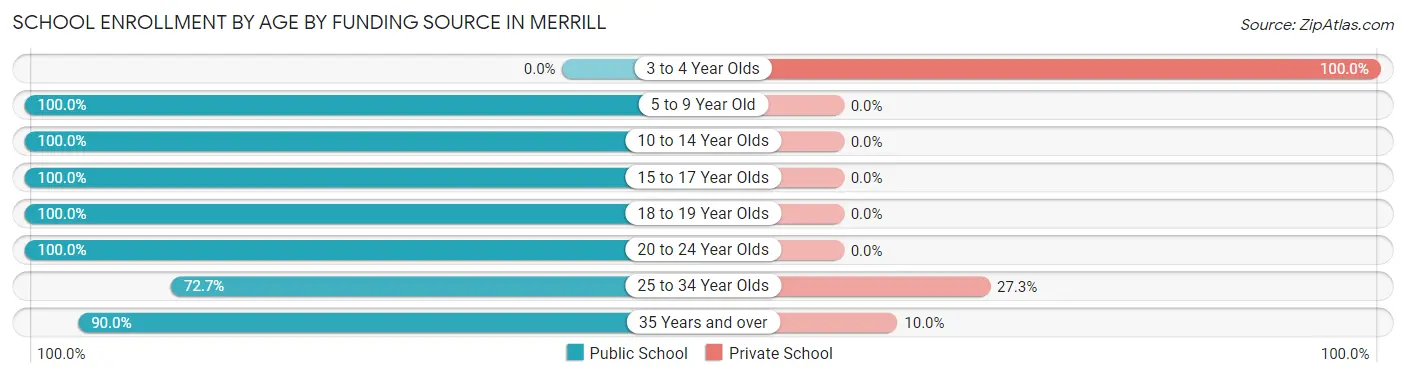
| Age Bracket | Public School | Private School |
| 3 to 4 Year Olds | 0 (0.0%) | 5 (100.0%) |
| 5 to 9 Year Old | 65 (100.0%) | 0 (0.0%) |
| 10 to 14 Year Olds | 132 (100.0%) | 0 (0.0%) |
| 15 to 17 Year Olds | 54 (100.0%) | 0 (0.0%) |
| 18 to 19 Year Olds | 19 (100.0%) | 0 (0.0%) |
| 20 to 24 Year Olds | 8 (100.0%) | 0 (0.0%) |
| 25 to 34 Year Olds | 8 (72.7%) | 3 (27.3%) |
| 35 Years and over | 9 (90.0%) | 1 (10.0%) |
| Total | 295 (97.0%) | 9 (3.0%) |
Educational Attainment by Field of Study in Merrill
Business (21 | 26.6%), education (20 | 25.3%), engineering (8 | 10.1%), psychology (7 | 8.9%), and literature & languages (5 | 6.3%) are the most common fields of study among 79 individuals in Merrill who have obtained a bachelor's degree or higher.
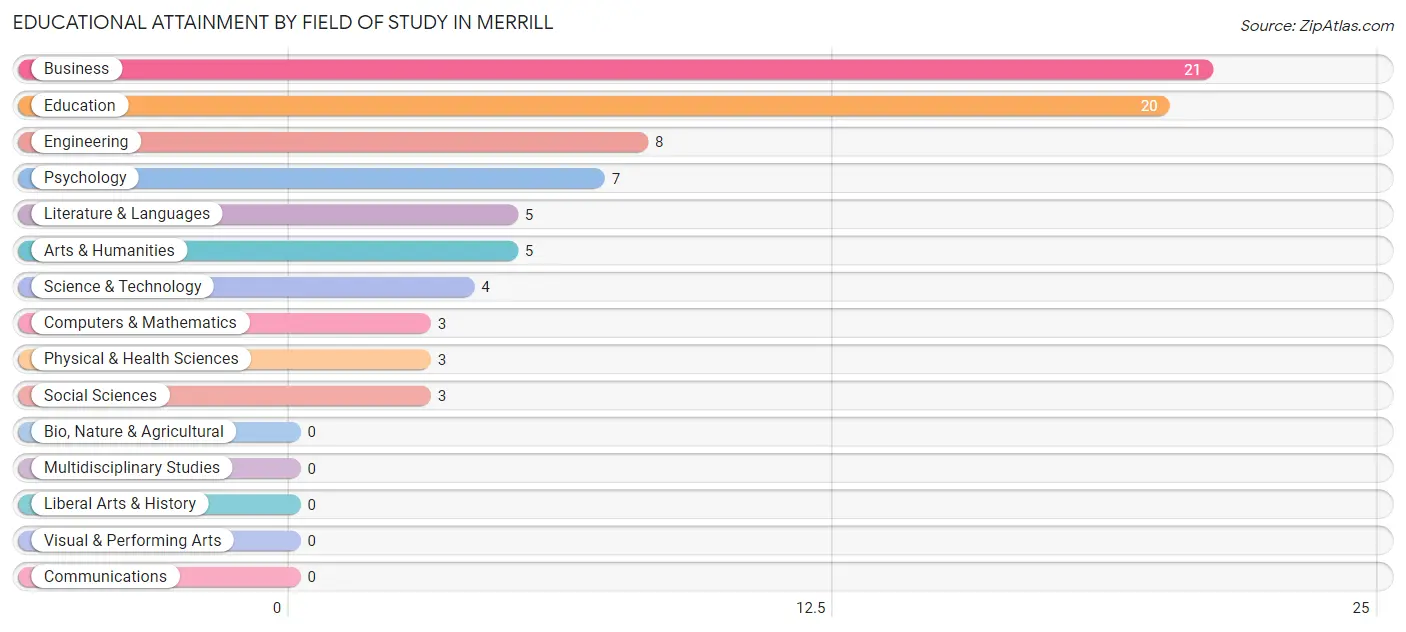
| Field of Study | # Graduates | % Graduates |
| Computers & Mathematics | 3 | 3.8% |
| Bio, Nature & Agricultural | 0 | 0.0% |
| Physical & Health Sciences | 3 | 3.8% |
| Psychology | 7 | 8.9% |
| Social Sciences | 3 | 3.8% |
| Engineering | 8 | 10.1% |
| Multidisciplinary Studies | 0 | 0.0% |
| Science & Technology | 4 | 5.1% |
| Business | 21 | 26.6% |
| Education | 20 | 25.3% |
| Literature & Languages | 5 | 6.3% |
| Liberal Arts & History | 0 | 0.0% |
| Visual & Performing Arts | 0 | 0.0% |
| Communications | 0 | 0.0% |
| Arts & Humanities | 5 | 6.3% |
| Total | 79 | 100.0% |
Transportation & Commute in Merrill
Vehicle Availability by Sex in Merrill
The most prevalent vehicle ownership categories in Merrill are males with 2 vehicles (60, accounting for 48.0%) and females with 2 vehicles (60, making up 41.7%).
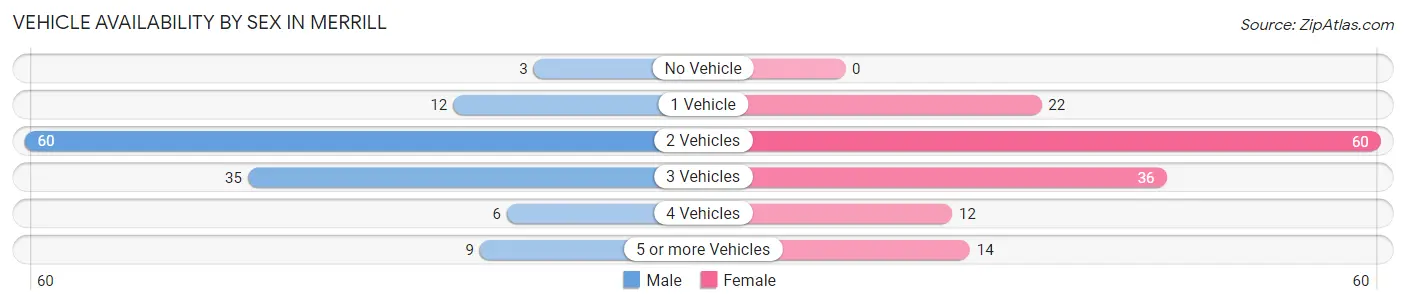
| Vehicles Available | Male | Female |
| No Vehicle | 3 (2.4%) | 0 (0.0%) |
| 1 Vehicle | 12 (9.6%) | 22 (15.3%) |
| 2 Vehicles | 60 (48.0%) | 60 (41.7%) |
| 3 Vehicles | 35 (28.0%) | 36 (25.0%) |
| 4 Vehicles | 6 (4.8%) | 12 (8.3%) |
| 5 or more Vehicles | 9 (7.2%) | 14 (9.7%) |
| Total | 125 (100.0%) | 144 (100.0%) |
Commute Time in Merrill
The most frequently occuring commute durations in Merrill are 25 to 29 minutes (44 commuters, 16.7%), 30 to 34 minutes (44 commuters, 16.7%), and 15 to 19 minutes (37 commuters, 14.0%).
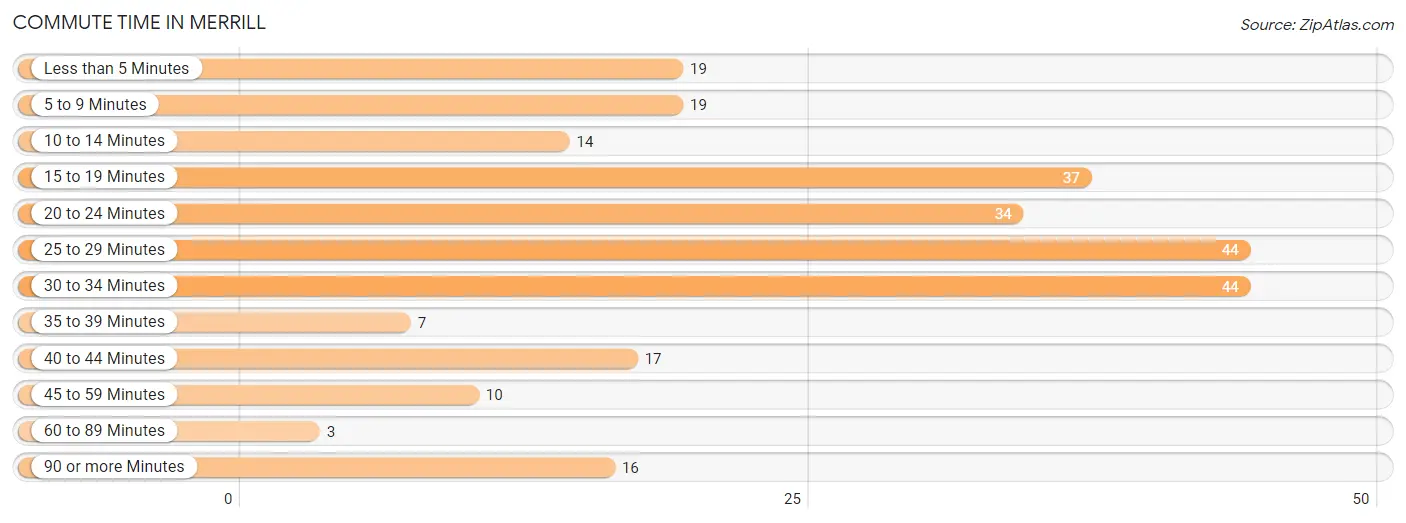
| Commute Time | # Commuters | % Commuters |
| Less than 5 Minutes | 19 | 7.2% |
| 5 to 9 Minutes | 19 | 7.2% |
| 10 to 14 Minutes | 14 | 5.3% |
| 15 to 19 Minutes | 37 | 14.0% |
| 20 to 24 Minutes | 34 | 12.9% |
| 25 to 29 Minutes | 44 | 16.7% |
| 30 to 34 Minutes | 44 | 16.7% |
| 35 to 39 Minutes | 7 | 2.6% |
| 40 to 44 Minutes | 17 | 6.4% |
| 45 to 59 Minutes | 10 | 3.8% |
| 60 to 89 Minutes | 3 | 1.1% |
| 90 or more Minutes | 16 | 6.1% |
Commute Time by Sex in Merrill
The most common commute times in Merrill are 15 to 19 minutes (29 commuters, 23.2%) for males and 25 to 29 minutes (30 commuters, 21.6%) for females.
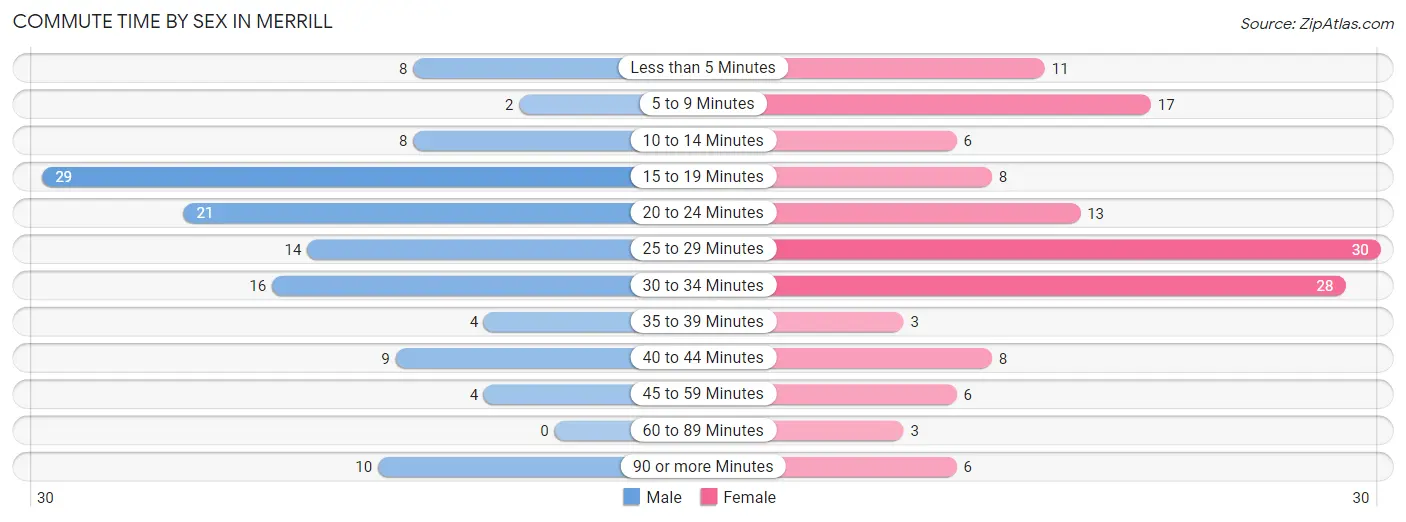
| Commute Time | Male | Female |
| Less than 5 Minutes | 8 (6.4%) | 11 (7.9%) |
| 5 to 9 Minutes | 2 (1.6%) | 17 (12.2%) |
| 10 to 14 Minutes | 8 (6.4%) | 6 (4.3%) |
| 15 to 19 Minutes | 29 (23.2%) | 8 (5.8%) |
| 20 to 24 Minutes | 21 (16.8%) | 13 (9.3%) |
| 25 to 29 Minutes | 14 (11.2%) | 30 (21.6%) |
| 30 to 34 Minutes | 16 (12.8%) | 28 (20.1%) |
| 35 to 39 Minutes | 4 (3.2%) | 3 (2.2%) |
| 40 to 44 Minutes | 9 (7.2%) | 8 (5.8%) |
| 45 to 59 Minutes | 4 (3.2%) | 6 (4.3%) |
| 60 to 89 Minutes | 0 (0.0%) | 3 (2.2%) |
| 90 or more Minutes | 10 (8.0%) | 6 (4.3%) |
Time of Departure to Work by Sex in Merrill
The most frequent times of departure to work in Merrill are 12:00 AM to 4:59 AM (20, 16.0%) for males and 7:30 AM to 7:59 AM (32, 23.0%) for females.
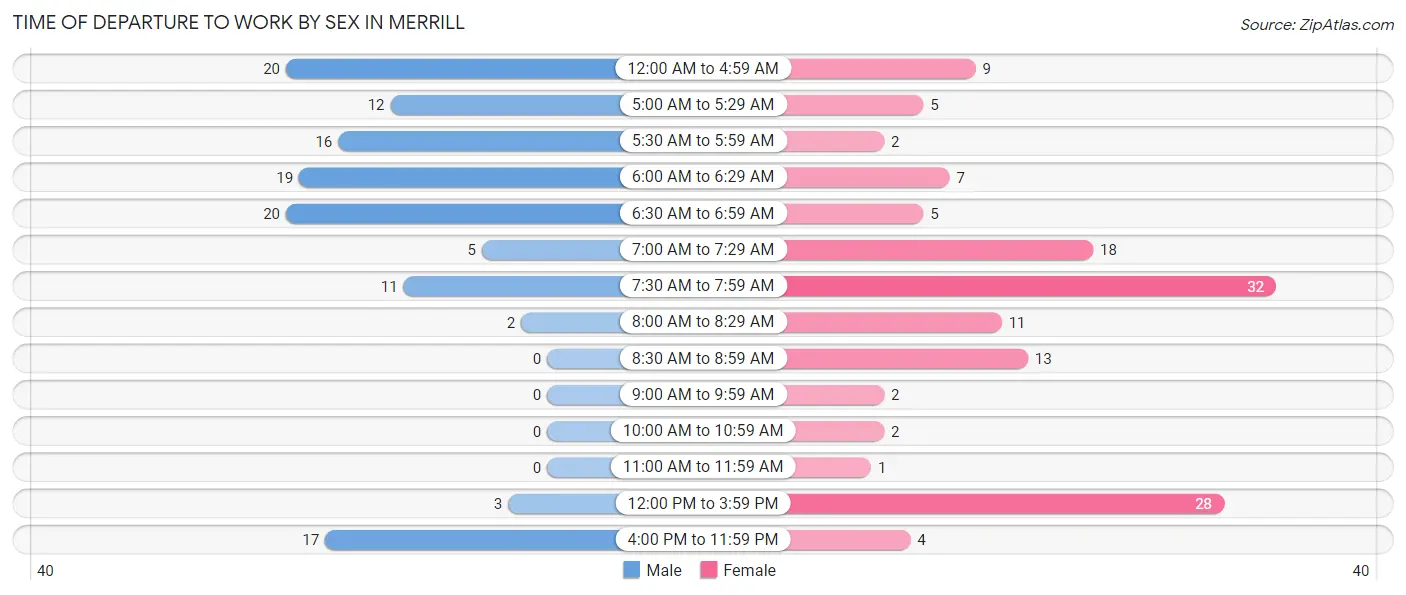
| Time of Departure | Male | Female |
| 12:00 AM to 4:59 AM | 20 (16.0%) | 9 (6.5%) |
| 5:00 AM to 5:29 AM | 12 (9.6%) | 5 (3.6%) |
| 5:30 AM to 5:59 AM | 16 (12.8%) | 2 (1.4%) |
| 6:00 AM to 6:29 AM | 19 (15.2%) | 7 (5.0%) |
| 6:30 AM to 6:59 AM | 20 (16.0%) | 5 (3.6%) |
| 7:00 AM to 7:29 AM | 5 (4.0%) | 18 (13.0%) |
| 7:30 AM to 7:59 AM | 11 (8.8%) | 32 (23.0%) |
| 8:00 AM to 8:29 AM | 2 (1.6%) | 11 (7.9%) |
| 8:30 AM to 8:59 AM | 0 (0.0%) | 13 (9.3%) |
| 9:00 AM to 9:59 AM | 0 (0.0%) | 2 (1.4%) |
| 10:00 AM to 10:59 AM | 0 (0.0%) | 2 (1.4%) |
| 11:00 AM to 11:59 AM | 0 (0.0%) | 1 (0.7%) |
| 12:00 PM to 3:59 PM | 3 (2.4%) | 28 (20.1%) |
| 4:00 PM to 11:59 PM | 17 (13.6%) | 4 (2.9%) |
| Total | 125 (100.0%) | 139 (100.0%) |
Housing Occupancy in Merrill
Occupancy by Ownership in Merrill
Of the total 291 dwellings in Merrill, owner-occupied units account for 228 (78.3%), while renter-occupied units make up 63 (21.6%).
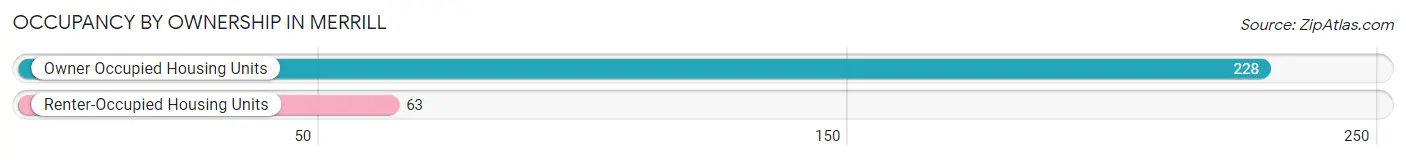
| Occupancy | # Housing Units | % Housing Units |
| Owner Occupied Housing Units | 228 | 78.3% |
| Renter-Occupied Housing Units | 63 | 21.6% |
| Total Occupied Housing Units | 291 | 100.0% |
Occupancy by Household Size in Merrill
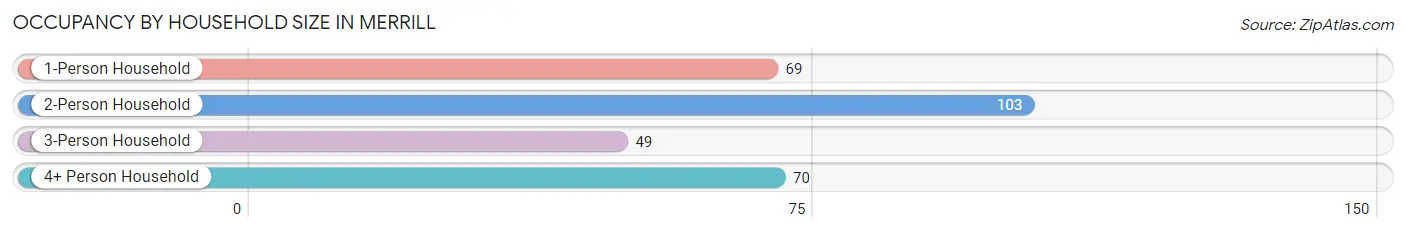
| Household Size | # Housing Units | % Housing Units |
| 1-Person Household | 69 | 23.7% |
| 2-Person Household | 103 | 35.4% |
| 3-Person Household | 49 | 16.8% |
| 4+ Person Household | 70 | 24.0% |
| Total Housing Units | 291 | 100.0% |
Occupancy by Ownership by Household Size in Merrill
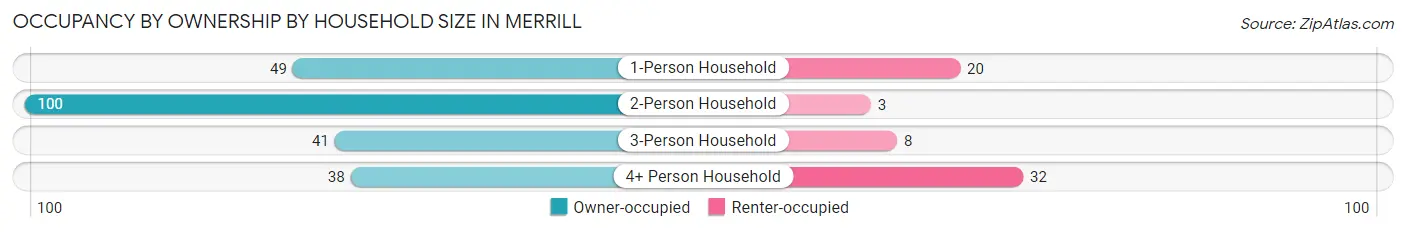
| Household Size | Owner-occupied | Renter-occupied |
| 1-Person Household | 49 (71.0%) | 20 (29.0%) |
| 2-Person Household | 100 (97.1%) | 3 (2.9%) |
| 3-Person Household | 41 (83.7%) | 8 (16.3%) |
| 4+ Person Household | 38 (54.3%) | 32 (45.7%) |
| Total Housing Units | 228 (78.3%) | 63 (21.6%) |
Occupancy by Educational Attainment in Merrill
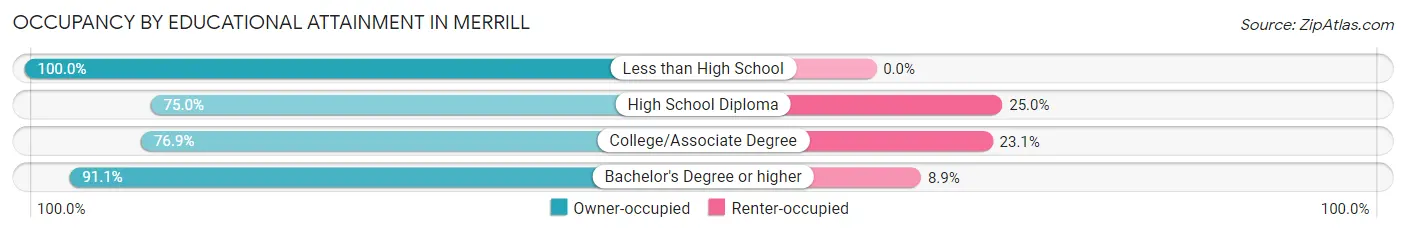
| Household Size | Owner-occupied | Renter-occupied |
| Less than High School | 3 (100.0%) | 0 (0.0%) |
| High School Diploma | 114 (75.0%) | 38 (25.0%) |
| College/Associate Degree | 70 (76.9%) | 21 (23.1%) |
| Bachelor's Degree or higher | 41 (91.1%) | 4 (8.9%) |
Occupancy by Age of Householder in Merrill
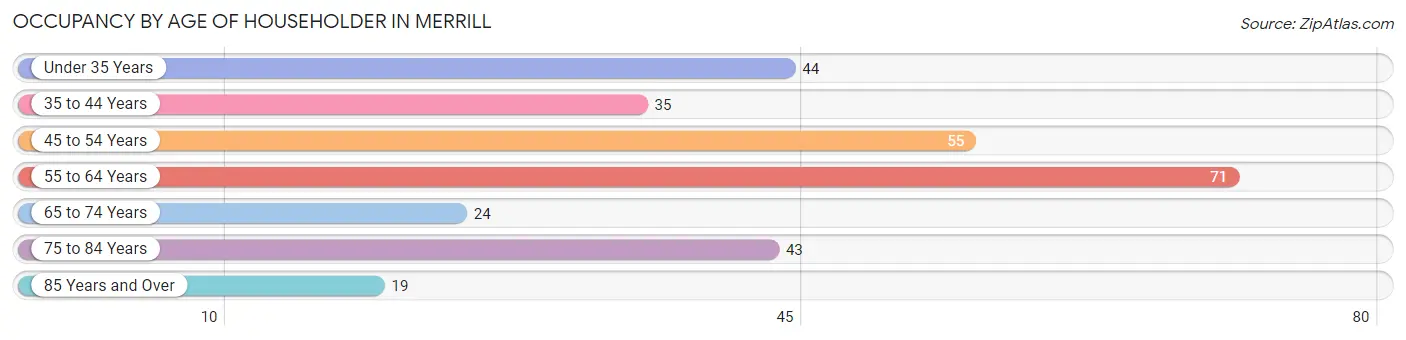
| Age Bracket | # Households | % Households |
| Under 35 Years | 44 | 15.1% |
| 35 to 44 Years | 35 | 12.0% |
| 45 to 54 Years | 55 | 18.9% |
| 55 to 64 Years | 71 | 24.4% |
| 65 to 74 Years | 24 | 8.3% |
| 75 to 84 Years | 43 | 14.8% |
| 85 Years and Over | 19 | 6.5% |
| Total | 291 | 100.0% |
Housing Finances in Merrill
Median Income by Occupancy in Merrill
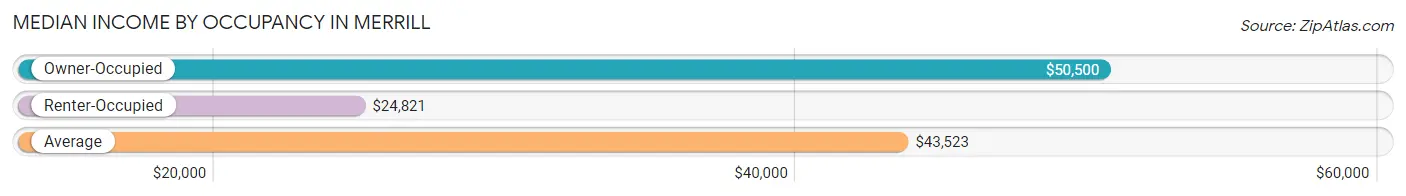
| Occupancy Type | # Households | Median Income |
| Owner-Occupied | 228 (78.3%) | $50,500 |
| Renter-Occupied | 63 (21.6%) | $24,821 |
| Average | 291 (100.0%) | $43,523 |
Occupancy by Householder Income Bracket in Merrill
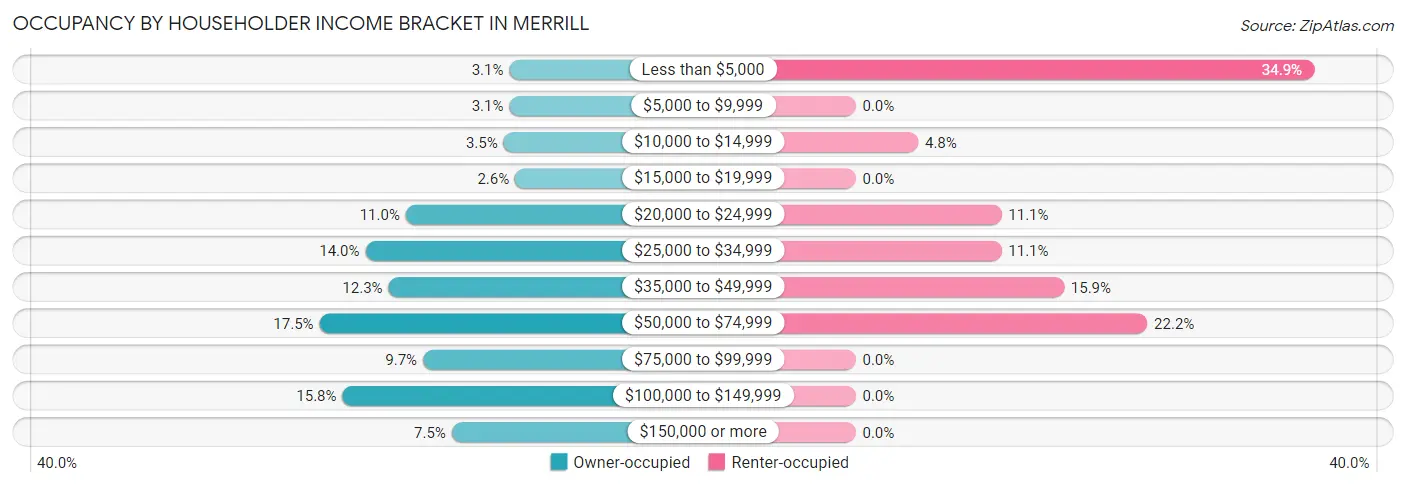
| Income Bracket | Owner-occupied | Renter-occupied |
| Less than $5,000 | 7 (3.1%) | 22 (34.9%) |
| $5,000 to $9,999 | 7 (3.1%) | 0 (0.0%) |
| $10,000 to $14,999 | 8 (3.5%) | 3 (4.8%) |
| $15,000 to $19,999 | 6 (2.6%) | 0 (0.0%) |
| $20,000 to $24,999 | 25 (11.0%) | 7 (11.1%) |
| $25,000 to $34,999 | 32 (14.0%) | 7 (11.1%) |
| $35,000 to $49,999 | 28 (12.3%) | 10 (15.9%) |
| $50,000 to $74,999 | 40 (17.5%) | 14 (22.2%) |
| $75,000 to $99,999 | 22 (9.7%) | 0 (0.0%) |
| $100,000 to $149,999 | 36 (15.8%) | 0 (0.0%) |
| $150,000 or more | 17 (7.5%) | 0 (0.0%) |
| Total | 228 (100.0%) | 63 (100.0%) |
Monthly Housing Cost Tiers in Merrill
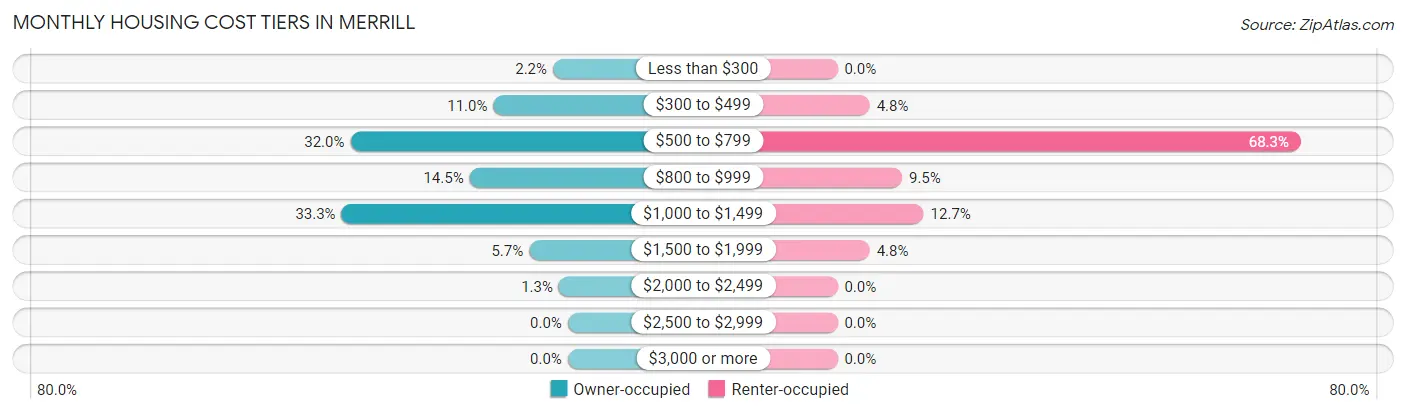
| Monthly Cost | Owner-occupied | Renter-occupied |
| Less than $300 | 5 (2.2%) | 0 (0.0%) |
| $300 to $499 | 25 (11.0%) | 3 (4.8%) |
| $500 to $799 | 73 (32.0%) | 43 (68.2%) |
| $800 to $999 | 33 (14.5%) | 6 (9.5%) |
| $1,000 to $1,499 | 76 (33.3%) | 8 (12.7%) |
| $1,500 to $1,999 | 13 (5.7%) | 3 (4.8%) |
| $2,000 to $2,499 | 3 (1.3%) | 0 (0.0%) |
| $2,500 to $2,999 | 0 (0.0%) | 0 (0.0%) |
| $3,000 or more | 0 (0.0%) | 0 (0.0%) |
| Total | 228 (100.0%) | 63 (100.0%) |
Physical Housing Characteristics in Merrill
Housing Structures in Merrill
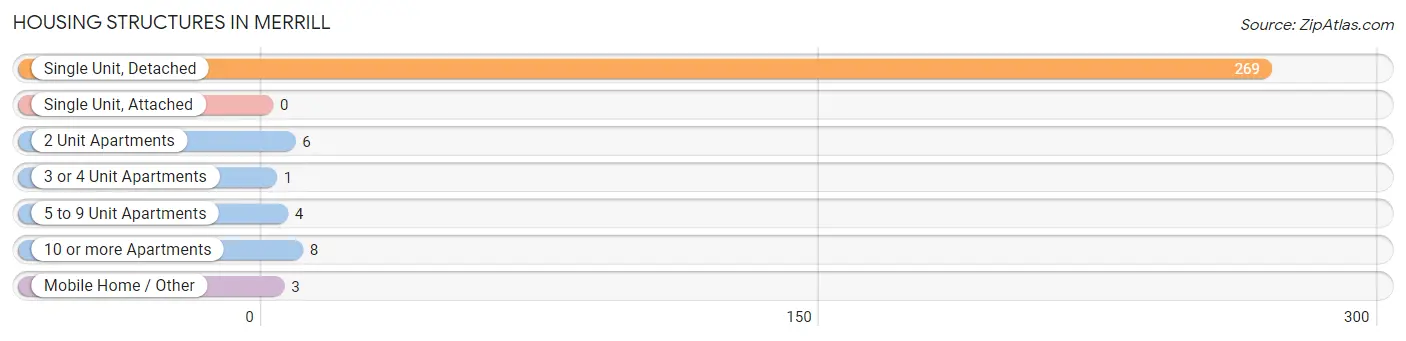
| Structure Type | # Housing Units | % Housing Units |
| Single Unit, Detached | 269 | 92.4% |
| Single Unit, Attached | 0 | 0.0% |
| 2 Unit Apartments | 6 | 2.1% |
| 3 or 4 Unit Apartments | 1 | 0.3% |
| 5 to 9 Unit Apartments | 4 | 1.4% |
| 10 or more Apartments | 8 | 2.8% |
| Mobile Home / Other | 3 | 1.0% |
| Total | 291 | 100.0% |
Housing Structures by Occupancy in Merrill
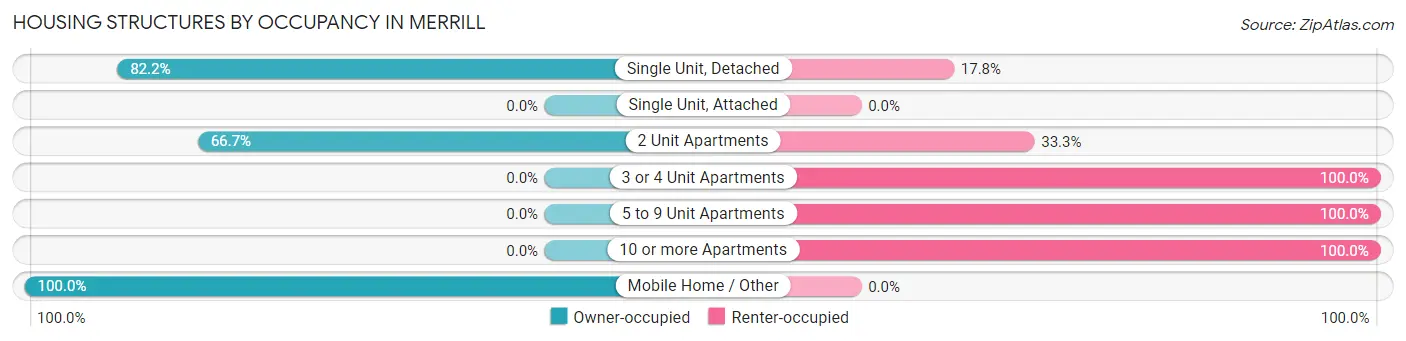
| Structure Type | Owner-occupied | Renter-occupied |
| Single Unit, Detached | 221 (82.2%) | 48 (17.8%) |
| Single Unit, Attached | 0 (0.0%) | 0 (0.0%) |
| 2 Unit Apartments | 4 (66.7%) | 2 (33.3%) |
| 3 or 4 Unit Apartments | 0 (0.0%) | 1 (100.0%) |
| 5 to 9 Unit Apartments | 0 (0.0%) | 4 (100.0%) |
| 10 or more Apartments | 0 (0.0%) | 8 (100.0%) |
| Mobile Home / Other | 3 (100.0%) | 0 (0.0%) |
| Total | 228 (78.3%) | 63 (21.6%) |
Housing Structures by Number of Rooms in Merrill
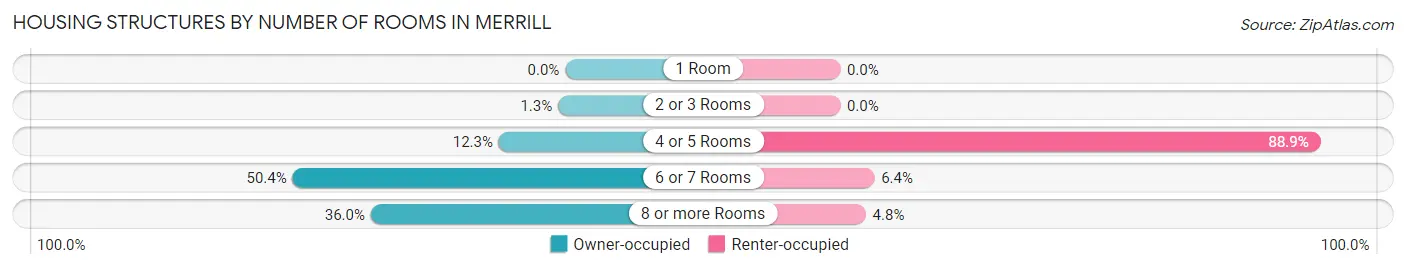
| Number of Rooms | Owner-occupied | Renter-occupied |
| 1 Room | 0 (0.0%) | 0 (0.0%) |
| 2 or 3 Rooms | 3 (1.3%) | 0 (0.0%) |
| 4 or 5 Rooms | 28 (12.3%) | 56 (88.9%) |
| 6 or 7 Rooms | 115 (50.4%) | 4 (6.4%) |
| 8 or more Rooms | 82 (36.0%) | 3 (4.8%) |
| Total | 228 (100.0%) | 63 (100.0%) |
Housing Structure by Heating Type in Merrill
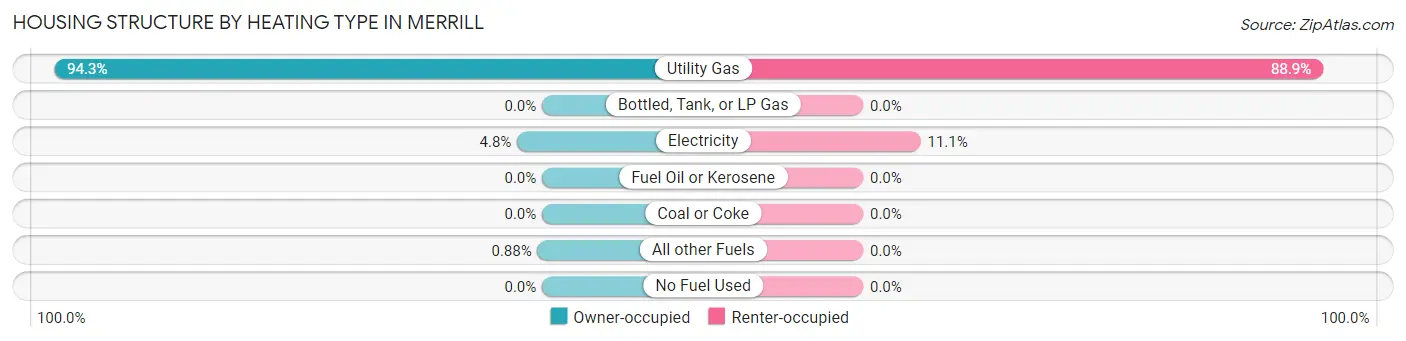
| Heating Type | Owner-occupied | Renter-occupied |
| Utility Gas | 215 (94.3%) | 56 (88.9%) |
| Bottled, Tank, or LP Gas | 0 (0.0%) | 0 (0.0%) |
| Electricity | 11 (4.8%) | 7 (11.1%) |
| Fuel Oil or Kerosene | 0 (0.0%) | 0 (0.0%) |
| Coal or Coke | 0 (0.0%) | 0 (0.0%) |
| All other Fuels | 2 (0.9%) | 0 (0.0%) |
| No Fuel Used | 0 (0.0%) | 0 (0.0%) |
| Total | 228 (100.0%) | 63 (100.0%) |
Household Vehicle Usage in Merrill
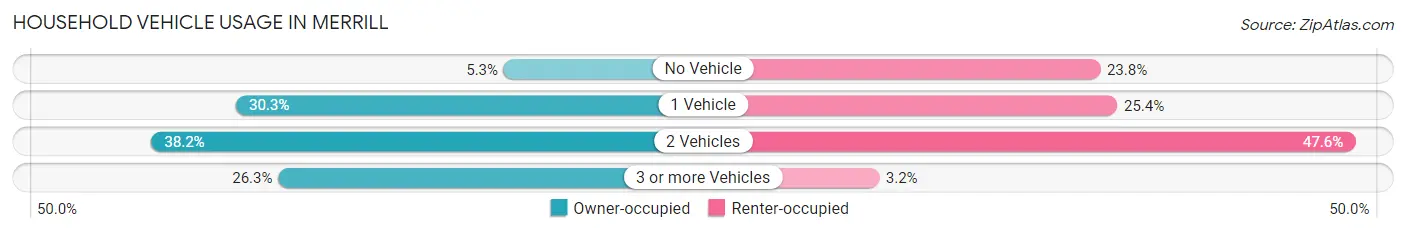
| Vehicles per Household | Owner-occupied | Renter-occupied |
| No Vehicle | 12 (5.3%) | 15 (23.8%) |
| 1 Vehicle | 69 (30.3%) | 16 (25.4%) |
| 2 Vehicles | 87 (38.2%) | 30 (47.6%) |
| 3 or more Vehicles | 60 (26.3%) | 2 (3.2%) |
| Total | 228 (100.0%) | 63 (100.0%) |
Real Estate & Mortgages in Merrill
Real Estate and Mortgage Overview in Merrill
| Characteristic | Without Mortgage | With Mortgage |
| Housing Units | 81 | 147 |
| Median Property Value | $107,500 | $85,500 |
| Median Household Income | $44,375 | $10 |
| Monthly Housing Costs | $558 | $0 |
| Real Estate Taxes | $2,638 | $0 |
Property Value by Mortgage Status in Merrill
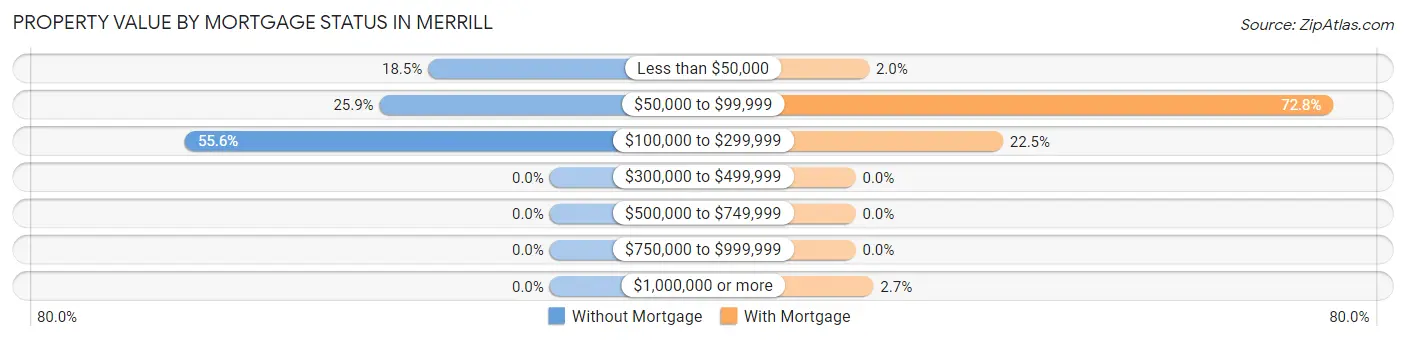
| Property Value | Without Mortgage | With Mortgage |
| Less than $50,000 | 15 (18.5%) | 3 (2.0%) |
| $50,000 to $99,999 | 21 (25.9%) | 107 (72.8%) |
| $100,000 to $299,999 | 45 (55.6%) | 33 (22.5%) |
| $300,000 to $499,999 | 0 (0.0%) | 0 (0.0%) |
| $500,000 to $749,999 | 0 (0.0%) | 0 (0.0%) |
| $750,000 to $999,999 | 0 (0.0%) | 0 (0.0%) |
| $1,000,000 or more | 0 (0.0%) | 4 (2.7%) |
| Total | 81 (100.0%) | 147 (100.0%) |
Household Income by Mortgage Status in Merrill
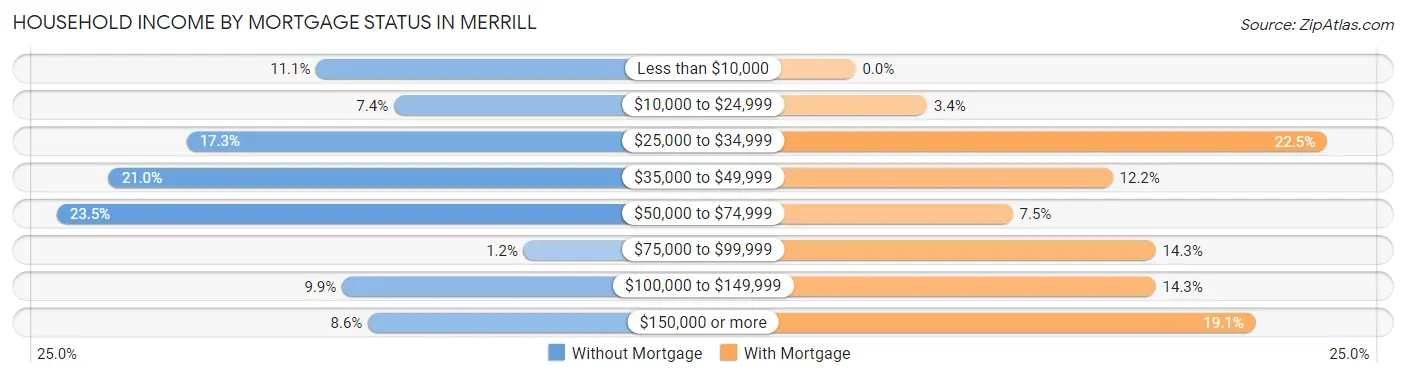
| Household Income | Without Mortgage | With Mortgage |
| Less than $10,000 | 9 (11.1%) | 0 (0.0%) |
| $10,000 to $24,999 | 6 (7.4%) | 5 (3.4%) |
| $25,000 to $34,999 | 14 (17.3%) | 33 (22.5%) |
| $35,000 to $49,999 | 17 (21.0%) | 18 (12.2%) |
| $50,000 to $74,999 | 19 (23.5%) | 11 (7.5%) |
| $75,000 to $99,999 | 1 (1.2%) | 21 (14.3%) |
| $100,000 to $149,999 | 8 (9.9%) | 21 (14.3%) |
| $150,000 or more | 7 (8.6%) | 28 (19.1%) |
| Total | 81 (100.0%) | 147 (100.0%) |
Property Value to Household Income Ratio in Merrill
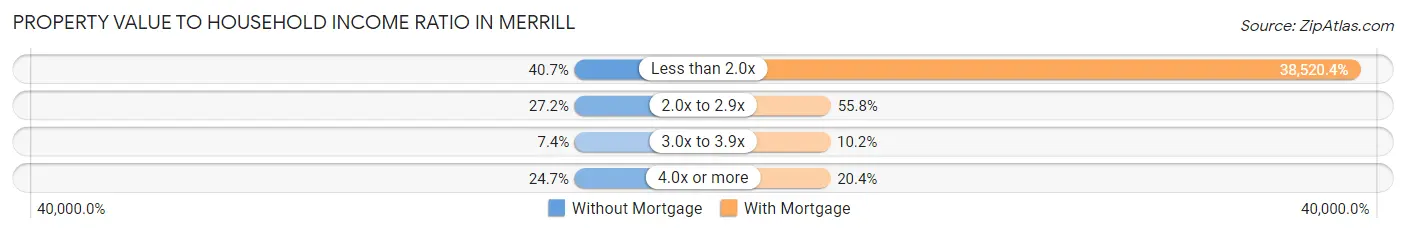
| Value-to-Income Ratio | Without Mortgage | With Mortgage |
| Less than 2.0x | 33 (40.7%) | 56,625 (38,520.4%) |
| 2.0x to 2.9x | 22 (27.2%) | 82 (55.8%) |
| 3.0x to 3.9x | 6 (7.4%) | 15 (10.2%) |
| 4.0x or more | 20 (24.7%) | 30 (20.4%) |
| Total | 81 (100.0%) | 147 (100.0%) |
Real Estate Taxes by Mortgage Status in Merrill
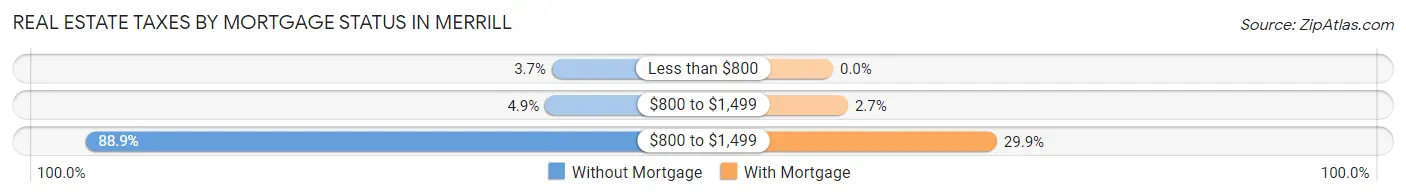
| Property Taxes | Without Mortgage | With Mortgage |
| Less than $800 | 3 (3.7%) | 0 (0.0%) |
| $800 to $1,499 | 4 (4.9%) | 4 (2.7%) |
| $800 to $1,499 | 72 (88.9%) | 44 (29.9%) |
| Total | 81 (100.0%) | 147 (100.0%) |
Health & Disability in Merrill
Health Insurance Coverage by Age in Merrill
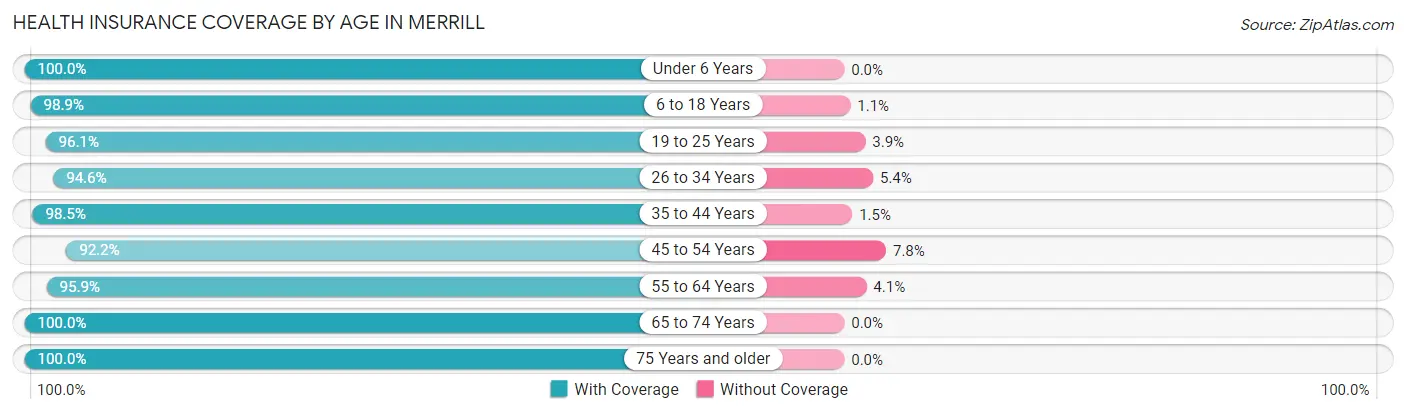
| Age Bracket | With Coverage | Without Coverage |
| Under 6 Years | 24 (100.0%) | 0 (0.0%) |
| 6 to 18 Years | 262 (98.9%) | 3 (1.1%) |
| 19 to 25 Years | 49 (96.1%) | 2 (3.9%) |
| 26 to 34 Years | 53 (94.6%) | 3 (5.4%) |
| 35 to 44 Years | 133 (98.5%) | 2 (1.5%) |
| 45 to 54 Years | 83 (92.2%) | 7 (7.8%) |
| 55 to 64 Years | 93 (95.9%) | 4 (4.1%) |
| 65 to 74 Years | 49 (100.0%) | 0 (0.0%) |
| 75 Years and older | 131 (100.0%) | 0 (0.0%) |
| Total | 877 (97.7%) | 21 (2.3%) |
Health Insurance Coverage by Citizenship Status in Merrill
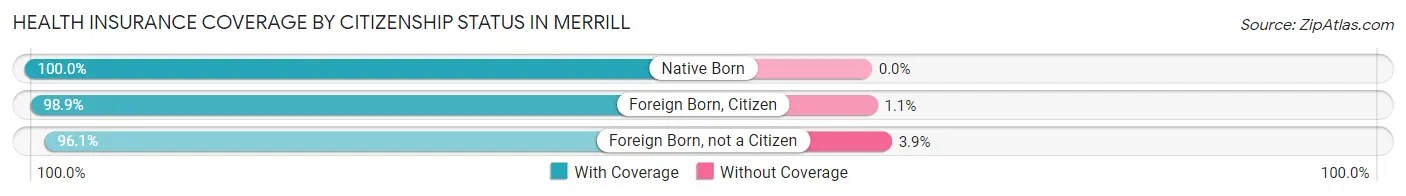
| Citizenship Status | With Coverage | Without Coverage |
| Native Born | 24 (100.0%) | 0 (0.0%) |
| Foreign Born, Citizen | 262 (98.9%) | 3 (1.1%) |
| Foreign Born, not a Citizen | 49 (96.1%) | 2 (3.9%) |
Health Insurance Coverage by Household Income in Merrill
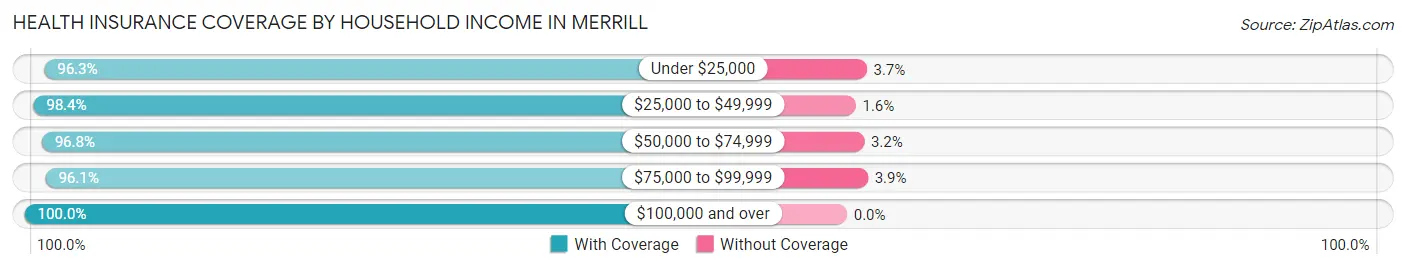
| Household Income | With Coverage | Without Coverage |
| Under $25,000 | 286 (96.3%) | 11 (3.7%) |
| $25,000 to $49,999 | 180 (98.4%) | 3 (1.6%) |
| $50,000 to $74,999 | 151 (96.8%) | 5 (3.2%) |
| $75,000 to $99,999 | 49 (96.1%) | 2 (3.9%) |
| $100,000 and over | 201 (100.0%) | 0 (0.0%) |
Public vs Private Health Insurance Coverage by Age in Merrill
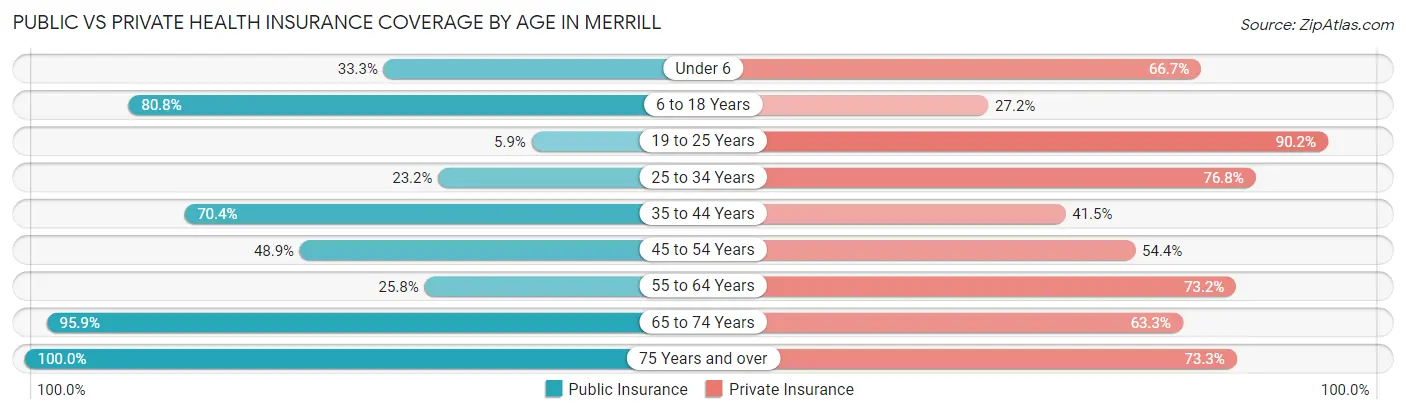
| Age Bracket | Public Insurance | Private Insurance |
| Under 6 | 8 (33.3%) | 16 (66.7%) |
| 6 to 18 Years | 214 (80.7%) | 72 (27.2%) |
| 19 to 25 Years | 3 (5.9%) | 46 (90.2%) |
| 25 to 34 Years | 13 (23.2%) | 43 (76.8%) |
| 35 to 44 Years | 95 (70.4%) | 56 (41.5%) |
| 45 to 54 Years | 44 (48.9%) | 49 (54.4%) |
| 55 to 64 Years | 25 (25.8%) | 71 (73.2%) |
| 65 to 74 Years | 47 (95.9%) | 31 (63.3%) |
| 75 Years and over | 131 (100.0%) | 96 (73.3%) |
| Total | 580 (64.6%) | 480 (53.4%) |
Disability Status by Sex by Age in Merrill
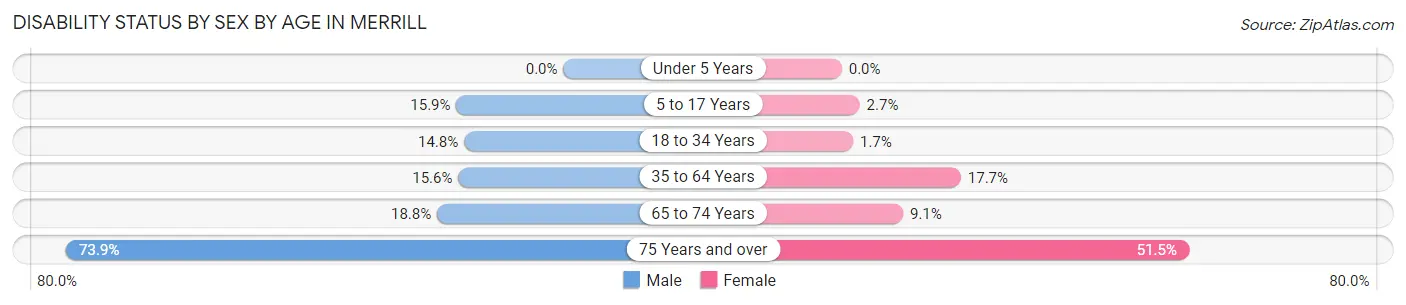
| Age Bracket | Male | Female |
| Under 5 Years | 0 (0.0%) | 0 (0.0%) |
| 5 to 17 Years | 17 (15.9%) | 4 (2.6%) |
| 18 to 34 Years | 9 (14.7%) | 1 (1.7%) |
| 35 to 64 Years | 22 (15.6%) | 32 (17.7%) |
| 65 to 74 Years | 3 (18.8%) | 3 (9.1%) |
| 75 Years and over | 48 (73.9%) | 34 (51.5%) |
Disability Class by Sex by Age in Merrill
Disability Class: Hearing Difficulty
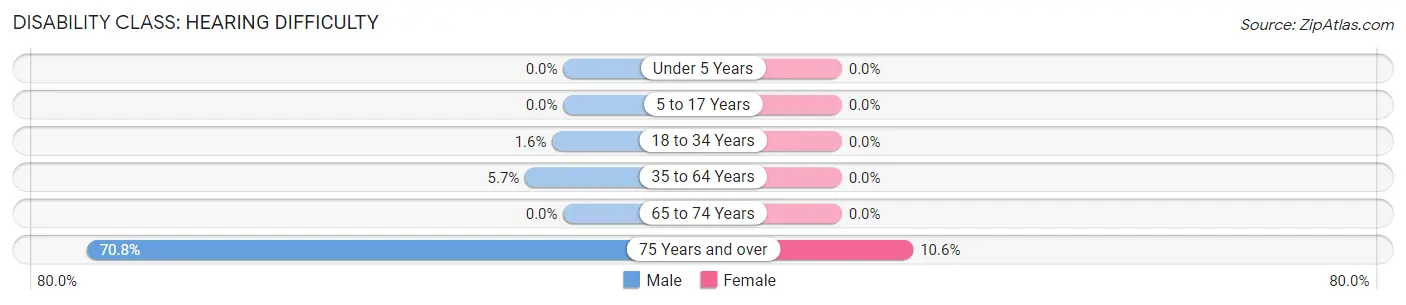
| Age Bracket | Male | Female |
| Under 5 Years | 0 (0.0%) | 0 (0.0%) |
| 5 to 17 Years | 0 (0.0%) | 0 (0.0%) |
| 18 to 34 Years | 1 (1.6%) | 0 (0.0%) |
| 35 to 64 Years | 8 (5.7%) | 0 (0.0%) |
| 65 to 74 Years | 0 (0.0%) | 0 (0.0%) |
| 75 Years and over | 46 (70.8%) | 7 (10.6%) |
Disability Class: Vision Difficulty
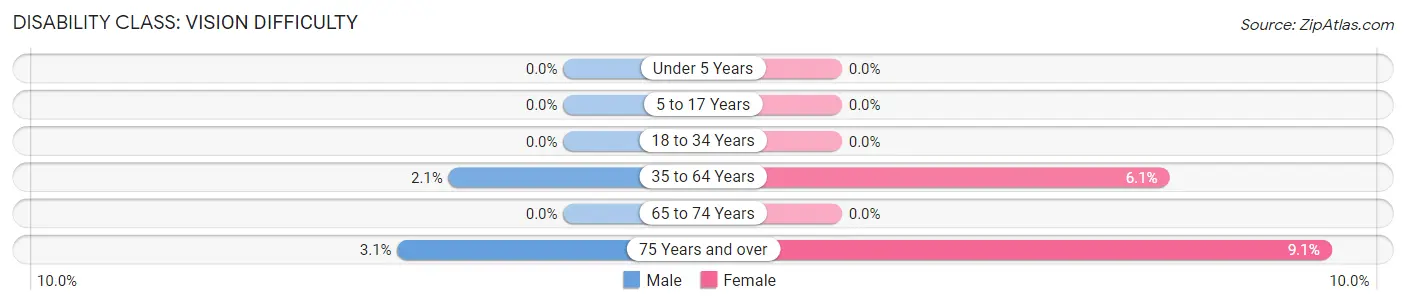
| Age Bracket | Male | Female |
| Under 5 Years | 0 (0.0%) | 0 (0.0%) |
| 5 to 17 Years | 0 (0.0%) | 0 (0.0%) |
| 18 to 34 Years | 0 (0.0%) | 0 (0.0%) |
| 35 to 64 Years | 3 (2.1%) | 11 (6.1%) |
| 65 to 74 Years | 0 (0.0%) | 0 (0.0%) |
| 75 Years and over | 2 (3.1%) | 6 (9.1%) |
Disability Class: Cognitive Difficulty
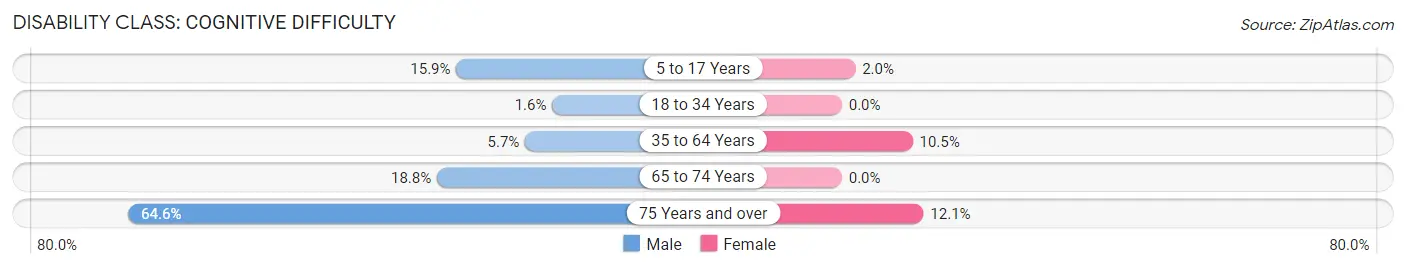
| Age Bracket | Male | Female |
| 5 to 17 Years | 17 (15.9%) | 3 (2.0%) |
| 18 to 34 Years | 1 (1.6%) | 0 (0.0%) |
| 35 to 64 Years | 8 (5.7%) | 19 (10.5%) |
| 65 to 74 Years | 3 (18.8%) | 0 (0.0%) |
| 75 Years and over | 42 (64.6%) | 8 (12.1%) |
Disability Class: Ambulatory Difficulty
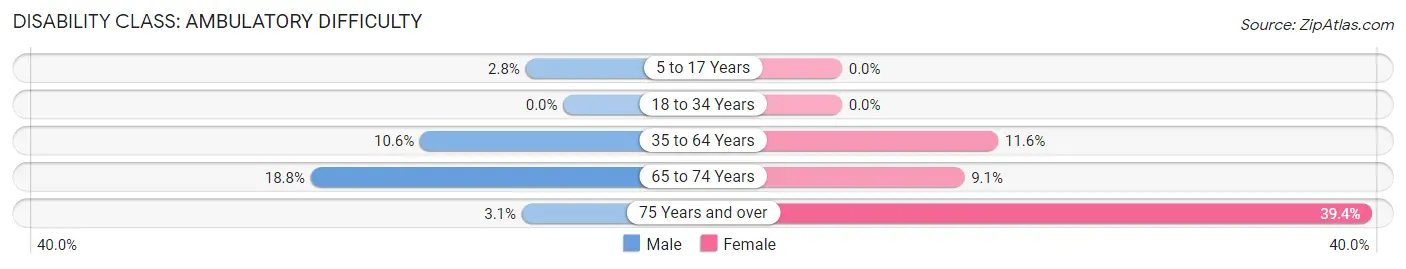
| Age Bracket | Male | Female |
| 5 to 17 Years | 3 (2.8%) | 0 (0.0%) |
| 18 to 34 Years | 0 (0.0%) | 0 (0.0%) |
| 35 to 64 Years | 15 (10.6%) | 21 (11.6%) |
| 65 to 74 Years | 3 (18.8%) | 3 (9.1%) |
| 75 Years and over | 2 (3.1%) | 26 (39.4%) |
Disability Class: Self-Care Difficulty
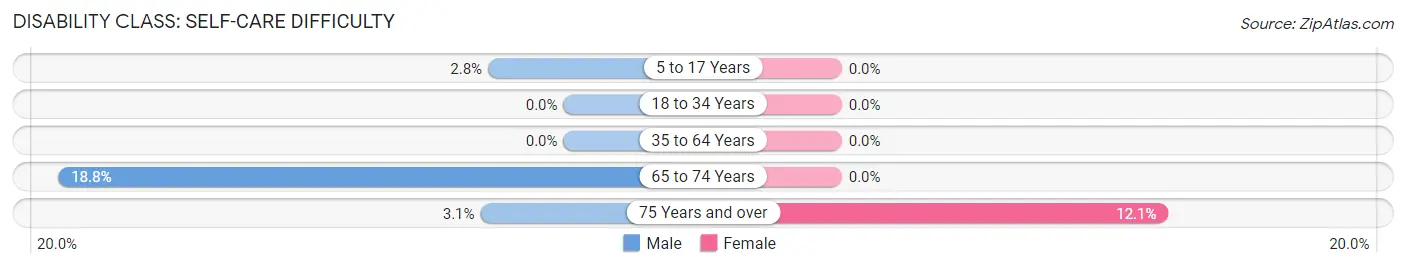
| Age Bracket | Male | Female |
| 5 to 17 Years | 3 (2.8%) | 0 (0.0%) |
| 18 to 34 Years | 0 (0.0%) | 0 (0.0%) |
| 35 to 64 Years | 0 (0.0%) | 0 (0.0%) |
| 65 to 74 Years | 3 (18.8%) | 0 (0.0%) |
| 75 Years and over | 2 (3.1%) | 8 (12.1%) |
Technology Access in Merrill
Computing Device Access in Merrill
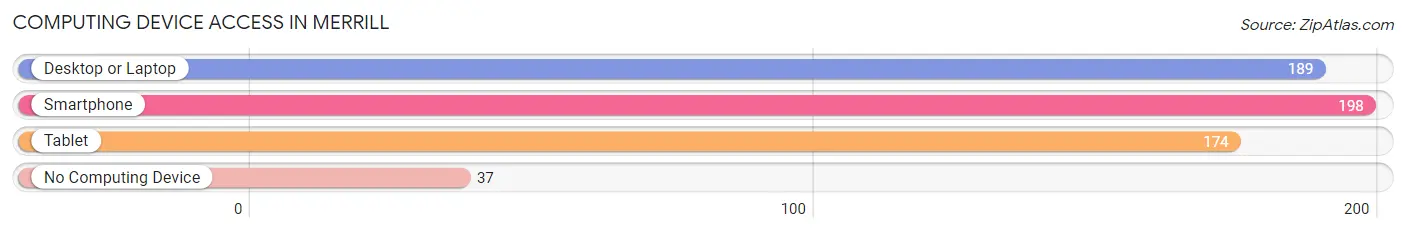
| Device Type | # Households | % Households |
| Desktop or Laptop | 189 | 64.9% |
| Smartphone | 198 | 68.0% |
| Tablet | 174 | 59.8% |
| No Computing Device | 37 | 12.7% |
| Total | 291 | 100.0% |
Internet Access in Merrill
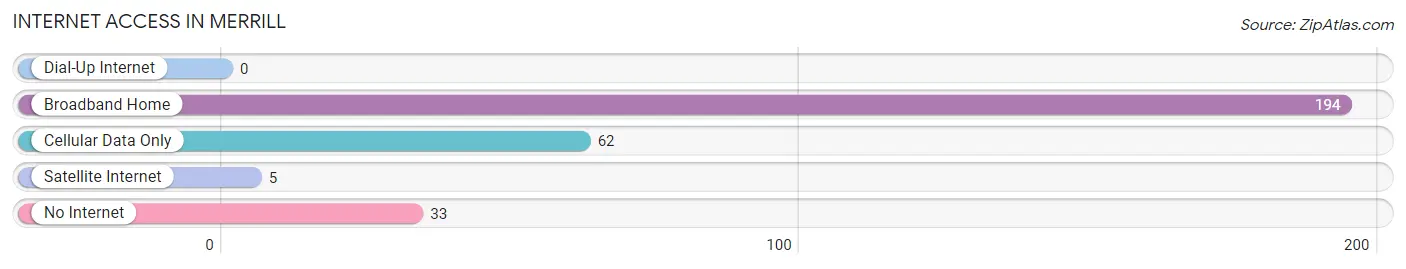
| Internet Type | # Households | % Households |
| Dial-Up Internet | 0 | 0.0% |
| Broadband Home | 194 | 66.7% |
| Cellular Data Only | 62 | 21.3% |
| Satellite Internet | 5 | 1.7% |
| No Internet | 33 | 11.3% |
| Total | 291 | 100.0% |
Merrill Summary
Merrill is a small city located in Saginaw County, Michigan. It is situated on the banks of the Tittabawassee River, about 10 miles north of Saginaw. The city has a population of approximately 2,500 people and is part of the Saginaw Metropolitan Statistical Area.
History
Merrill was first settled in 1836 by a group of settlers from New York. The settlement was originally known as “Merrill’s Corners” and was named after the first settler, William Merrill. The settlement was incorporated as a village in 1871 and as a city in 1891.
In the late 19th century, Merrill was a thriving lumber town. The city was home to several sawmills and lumber companies, which provided employment for many of the residents. The lumber industry declined in the early 20th century, but Merrill remained an important agricultural center.
Geography
Merrill is located in central Michigan, about 10 miles north of Saginaw. The city is situated on the banks of the Tittabawassee River, which flows through the city. The city is surrounded by farmland and is located in a rural area.
The climate in Merrill is typical of the Midwest, with cold winters and hot summers. The average temperature in the winter is around 25 degrees Fahrenheit, and the average temperature in the summer is around 75 degrees Fahrenheit.
Economy
Merrill’s economy is largely based on agriculture. The city is home to several farms, which produce a variety of crops, including corn, soybeans, and wheat. The city is also home to several manufacturing companies, which produce a variety of products, including automotive parts, furniture, and medical supplies.
The city is also home to several retail stores, restaurants, and other businesses. The city is served by the Saginaw-Bay City-Midland International Airport, which provides air service to the region.
Demographics
As of the 2010 census, the population of Merrill was 2,521. The racial makeup of the city was 94.3% White, 1.2% African American, 0.3% Native American, 0.3% Asian, 0.1% Pacific Islander, 1.2% from other races, and 2.6% from two or more races. Hispanic or Latino of any race were 3.2% of the population.
The median household income in Merrill was $37,917, and the median family income was $45,938. The per capita income in Merrill was $19,845. About 11.2% of families and 14.2% of the population were below the poverty line, including 19.2% of those under age 18 and 8.2% of those age 65 or over.
Merrill is a small city with a rich history and a diverse economy. The city is home to several farms, manufacturing companies, and other businesses, which provide employment for many of the residents. The city is also home to several retail stores, restaurants, and other businesses, which provide services to the community. The city is served by the Saginaw-Bay City-Midland International Airport, which provides air service to the region.
Common Questions
What is Per Capita Income in Merrill?
Per Capita income in Merrill is $19,792.
What is the Median Family Income in Merrill?
Median Family Income in Merrill is $52,500.
What is the Median Household income in Merrill?
Median Household Income in Merrill is $43,523.
What is Income or Wage Gap in Merrill?
Income or Wage Gap in Merrill is 45.3%.
Women in Merrill earn 54.7 cents for every dollar earned by a man.
What is Inequality or Gini Index in Merrill?
Inequality or Gini Index in Merrill is 0.46.
What is the Total Population of Merrill?
Total Population of Merrill is 898.
What is the Total Male Population of Merrill?
Total Male Population of Merrill is 401.
What is the Total Female Population of Merrill?
Total Female Population of Merrill is 497.
What is the Ratio of Males per 100 Females in Merrill?
There are 80.68 Males per 100 Females in Merrill.
What is the Ratio of Females per 100 Males in Merrill?
There are 123.94 Females per 100 Males in Merrill.
What is the Median Population Age in Merrill?
Median Population Age in Merrill is 38.4 Years.
What is the Average Family Size in Merrill
Average Family Size in Merrill is 3.8 People.
What is the Average Household Size in Merrill
Average Household Size in Merrill is 3.0 People.
How Large is the Labor Force in Merrill?
There are 371 People in the Labor Forcein in Merrill.
What is the Percentage of People in the Labor Force in Merrill?
54.9% of People are in the Labor Force in Merrill.
What is the Unemployment Rate in Merrill?
Unemployment Rate in Merrill is 26.1%.