Marshall, MI Map & Demographics
Marshall Map
Marshall Overview
$46,004
PER CAPITA INCOME
$90,741
AVG FAMILY INCOME
$72,813
AVG HOUSEHOLD INCOME
10.9%
WAGE / INCOME GAP [ % ]
89.1¢/ $1
WAGE / INCOME GAP [ $ ]
0.45
INEQUALITY / GINI INDEX
6,806
TOTAL POPULATION
3,253
MALE POPULATION
3,553
FEMALE POPULATION
91.56
MALES / 100 FEMALES
109.22
FEMALES / 100 MALES
45.4
MEDIAN AGE
2.8
AVG FAMILY SIZE
2.1
AVG HOUSEHOLD SIZE
3,646
LABOR FORCE [ PEOPLE ]
64.3%
PERCENT IN LABOR FORCE
7.2%
UNEMPLOYMENT RATE
Marshall Zip Codes
Marshall Area Codes
Income in Marshall
Income Overview in Marshall
Per Capita Income in Marshall is $46,004, while median incomes of families and households are $90,741 and $72,813 respectively.
| Characteristic | Number | Measure |
| Per Capita Income | 6,806 | $46,004 |
| Median Family Income | 1,824 | $90,741 |
| Mean Family Income | 1,824 | $117,709 |
| Median Household Income | 3,119 | $72,813 |
| Mean Household Income | 3,119 | $98,276 |
| Income Deficit | 1,824 | $0 |
| Wage / Income Gap (%) | 6,806 | 10.93% |
| Wage / Income Gap ($) | 6,806 | 89.07¢ per $1 |
| Gini / Inequality Index | 6,806 | 0.45 |
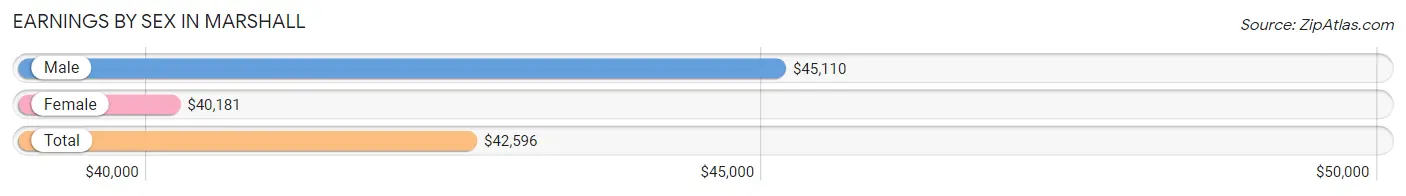
Earnings by Sex in Marshall
Average Earnings in Marshall are $42,596, $45,110 for men and $40,181 for women, a difference of 10.9%.
| Sex | Number | Average Earnings |
| Male | 1,893 (50.2%) | $45,110 |
| Female | 1,878 (49.8%) | $40,181 |
| Total | 3,771 (100.0%) | $42,596 |
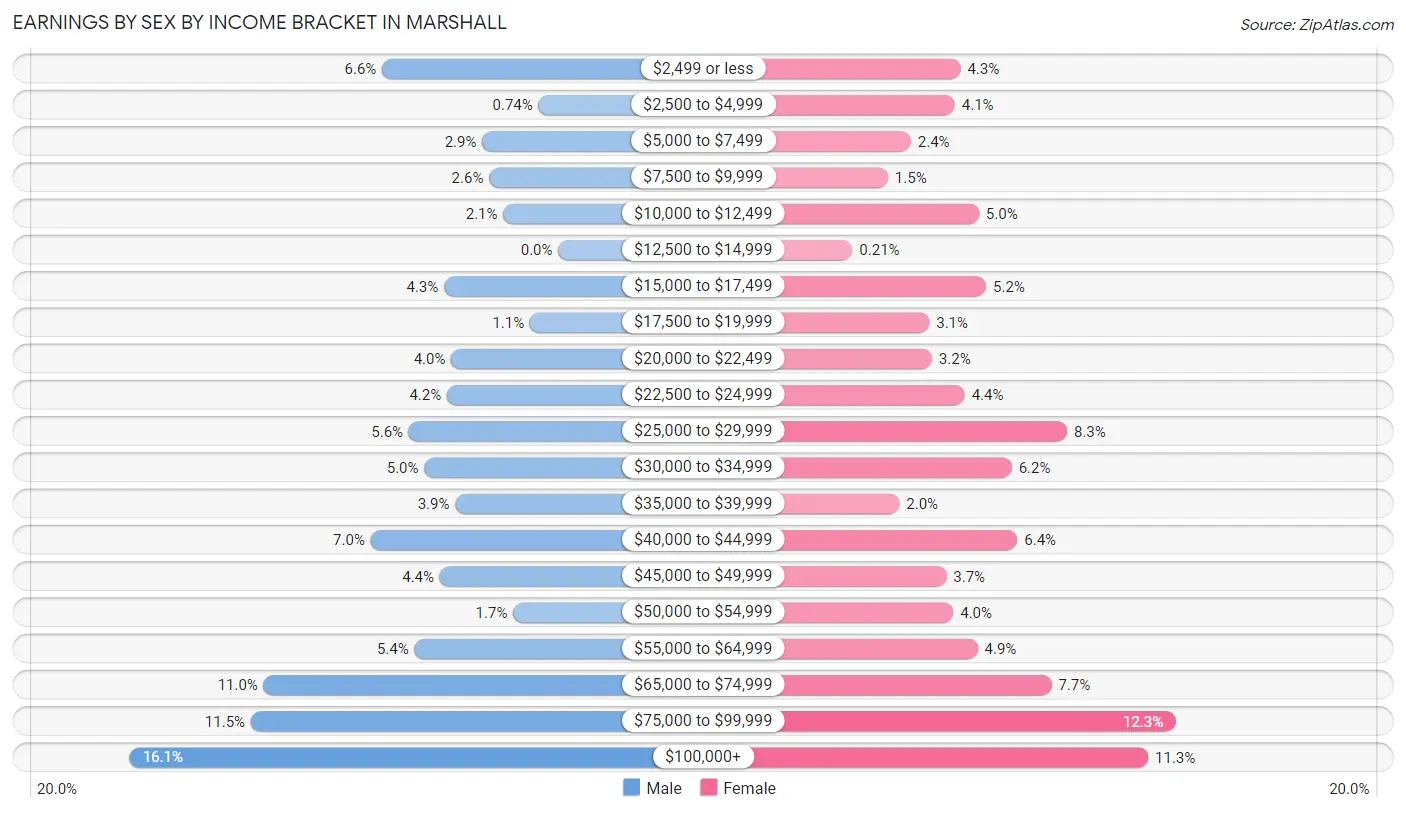
Earnings by Sex by Income Bracket in Marshall
The most common earnings brackets in Marshall are $100,000+ for men (304 | 16.1%) and $75,000 to $99,999 for women (231 | 12.3%).
| Income | Male | Female |
| $2,499 or less | 125 (6.6%) | 80 (4.3%) |
| $2,500 to $4,999 | 14 (0.7%) | 76 (4.1%) |
| $5,000 to $7,499 | 54 (2.9%) | 45 (2.4%) |
| $7,500 to $9,999 | 49 (2.6%) | 29 (1.5%) |
| $10,000 to $12,499 | 39 (2.1%) | 93 (5.0%) |
| $12,500 to $14,999 | 0 (0.0%) | 4 (0.2%) |
| $15,000 to $17,499 | 81 (4.3%) | 98 (5.2%) |
| $17,500 to $19,999 | 20 (1.1%) | 58 (3.1%) |
| $20,000 to $22,499 | 76 (4.0%) | 60 (3.2%) |
| $22,500 to $24,999 | 79 (4.2%) | 83 (4.4%) |
| $25,000 to $29,999 | 106 (5.6%) | 155 (8.3%) |
| $30,000 to $34,999 | 95 (5.0%) | 116 (6.2%) |
| $35,000 to $39,999 | 73 (3.9%) | 37 (2.0%) |
| $40,000 to $44,999 | 133 (7.0%) | 120 (6.4%) |
| $45,000 to $49,999 | 84 (4.4%) | 70 (3.7%) |
| $50,000 to $54,999 | 32 (1.7%) | 75 (4.0%) |
| $55,000 to $64,999 | 102 (5.4%) | 92 (4.9%) |
| $65,000 to $74,999 | 209 (11.0%) | 144 (7.7%) |
| $75,000 to $99,999 | 218 (11.5%) | 231 (12.3%) |
| $100,000+ | 304 (16.1%) | 212 (11.3%) |
| Total | 1,893 (100.0%) | 1,878 (100.0%) |
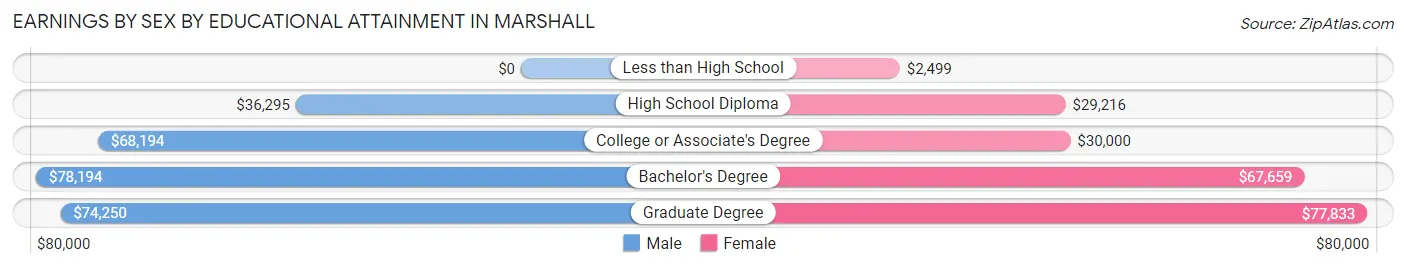
Earnings by Sex by Educational Attainment in Marshall
Average earnings in Marshall are $50,938 for men and $43,627 for women, a difference of 14.3%. Men with an educational attainment of bachelor's degree enjoy the highest average annual earnings of $78,194, while those with high school diploma education earn the least with $36,295. Women with an educational attainment of graduate degree earn the most with the average annual earnings of $77,833, while those with less than high school education have the smallest earnings of $2,499.
| Educational Attainment | Male Income | Female Income |
| Less than High School | - | - |
| High School Diploma | $36,295 | $29,216 |
| College or Associate's Degree | $68,194 | $30,000 |
| Bachelor's Degree | $78,194 | $67,659 |
| Graduate Degree | $74,250 | $77,833 |
| Total | $50,938 | $43,627 |
Family Income in Marshall
Family Income Brackets in Marshall
According to the Marshall family income data, there are 370 families falling into the $100,000 to $149,999 income range, which is the most common income bracket and makes up 20.3% of all families. Conversely, the less than $10,000 income bracket is the least frequent group with only 9 families (0.5%) belonging to this category.
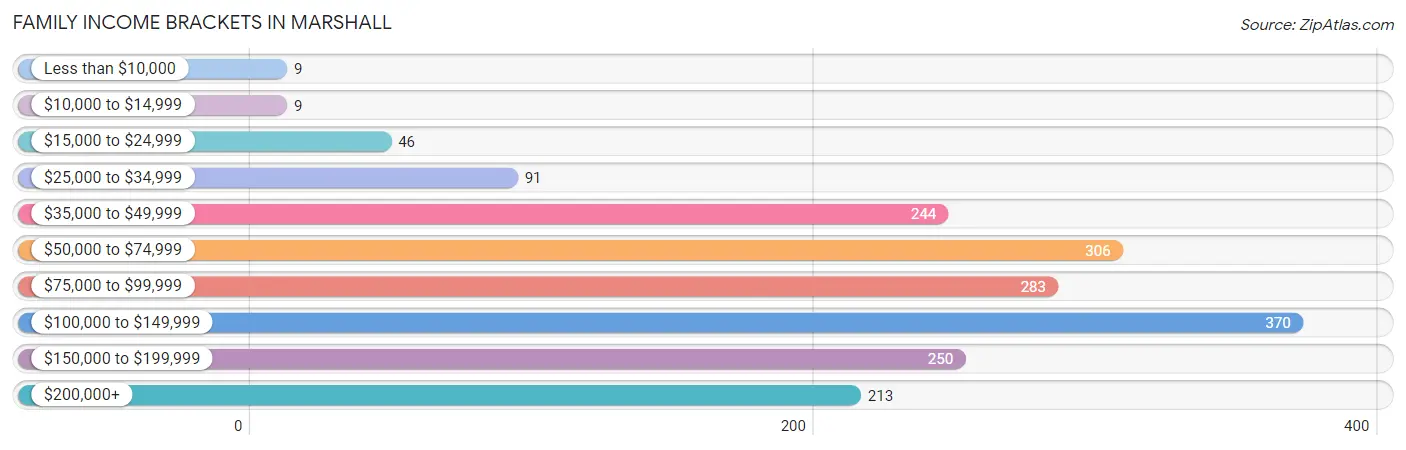
| Income Bracket | # Families | % Families |
| Less than $10,000 | 9 | 0.5% |
| $10,000 to $14,999 | 9 | 0.5% |
| $15,000 to $24,999 | 46 | 2.5% |
| $25,000 to $34,999 | 91 | 5.0% |
| $35,000 to $49,999 | 244 | 13.4% |
| $50,000 to $74,999 | 306 | 16.8% |
| $75,000 to $99,999 | 283 | 15.5% |
| $100,000 to $149,999 | 370 | 20.3% |
| $150,000 to $199,999 | 250 | 13.7% |
| $200,000+ | 213 | 11.7% |
Family Income by Famaliy Size in Marshall
3-person families (330 | 18.1%) account for the highest median family income in Marshall with $145,500 per family, while 3-person families (330 | 18.1%) have the highest median income of $48,500 per family member.
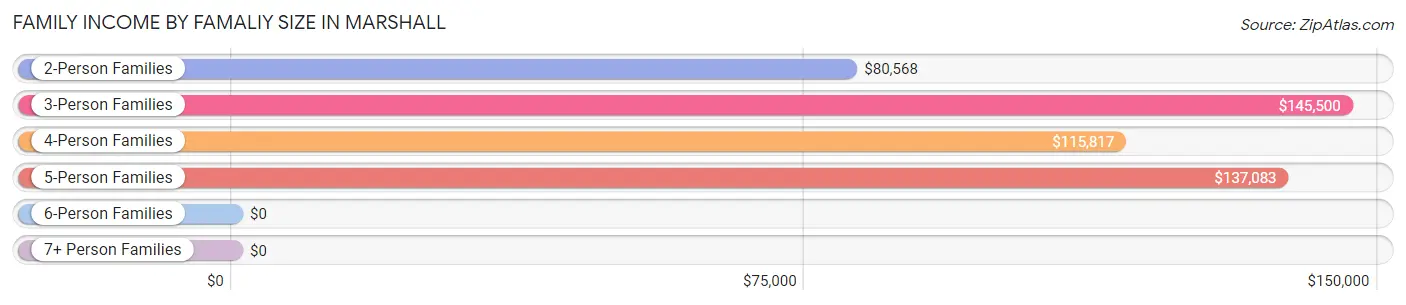
| Income Bracket | # Families | Median Income |
| 2-Person Families | 1,140 (62.5%) | $80,568 |
| 3-Person Families | 330 (18.1%) | $145,500 |
| 4-Person Families | 239 (13.1%) | $115,817 |
| 5-Person Families | 95 (5.2%) | $137,083 |
| 6-Person Families | 11 (0.6%) | $0 |
| 7+ Person Families | 9 (0.5%) | $0 |
| Total | 1,824 (100.0%) | $90,741 |
Family Income by Number of Earners in Marshall
The median family income in Marshall is $90,741, with families comprising 3+ earners (60) having the highest median family income of $167,188, while families with 1 earner (549) have the lowest median family income of $68,219, accounting for 3.3% and 30.1% of families, respectively.
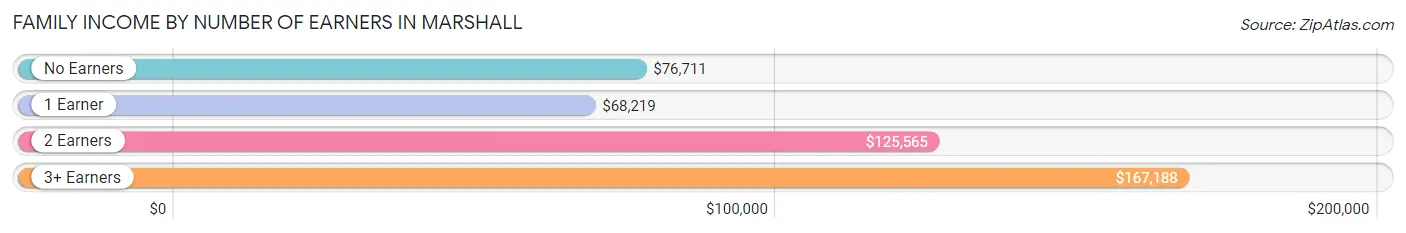
| Number of Earners | # Families | Median Income |
| No Earners | 328 (18.0%) | $76,711 |
| 1 Earner | 549 (30.1%) | $68,219 |
| 2 Earners | 887 (48.6%) | $125,565 |
| 3+ Earners | 60 (3.3%) | $167,188 |
| Total | 1,824 (100.0%) | $90,741 |
Household Income in Marshall
Household Income Brackets in Marshall
With 692 households falling in the category, the $50,000 to $74,999 income range is the most frequent in Marshall, accounting for 22.2% of all households. In contrast, only 50 households (1.6%) fall into the less than $10,000 income bracket, making it the least populous group.
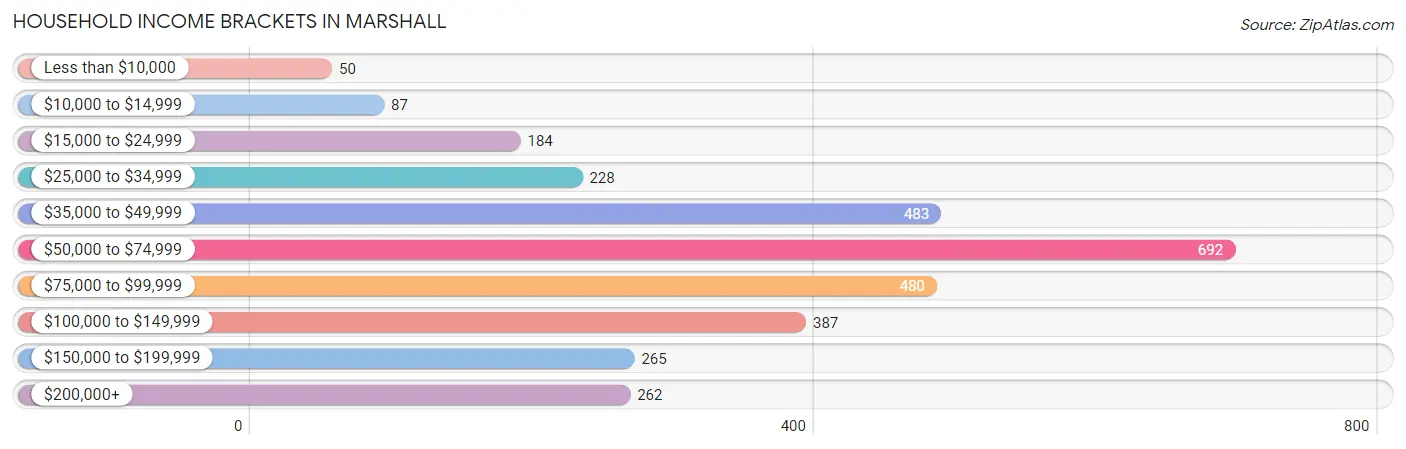
| Income Bracket | # Households | % Households |
| Less than $10,000 | 50 | 1.6% |
| $10,000 to $14,999 | 87 | 2.8% |
| $15,000 to $24,999 | 184 | 5.9% |
| $25,000 to $34,999 | 228 | 7.3% |
| $35,000 to $49,999 | 483 | 15.5% |
| $50,000 to $74,999 | 692 | 22.2% |
| $75,000 to $99,999 | 480 | 15.4% |
| $100,000 to $149,999 | 387 | 12.4% |
| $150,000 to $199,999 | 265 | 8.5% |
| $200,000+ | 262 | 8.4% |
Household Income by Householder Age in Marshall
The median household income in Marshall is $72,813, with the highest median household income of $78,194 found in the 45 to 64 years age bracket for the primary householder. A total of 1,204 households (38.6%) fall into this category. Meanwhile, the 15 to 24 years age bracket for the primary householder has the lowest median household income of $29,659, with 97 households (3.1%) in this group.
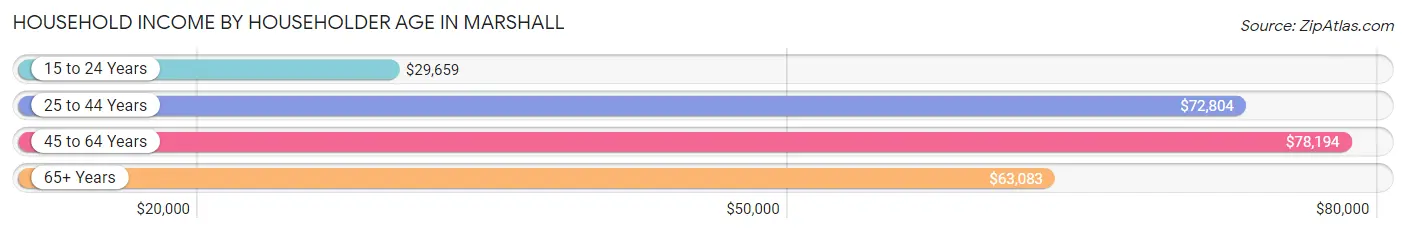
| Income Bracket | # Households | Median Income |
| 15 to 24 Years | 97 (3.1%) | $29,659 |
| 25 to 44 Years | 843 (27.0%) | $72,804 |
| 45 to 64 Years | 1,204 (38.6%) | $78,194 |
| 65+ Years | 975 (31.3%) | $63,083 |
| Total | 3,119 (100.0%) | $72,813 |
Poverty in Marshall
Income Below Poverty by Sex and Age in Marshall
With 5.6% poverty level for males and 8.9% for females among the residents of Marshall, 35 to 44 year old males and 18 to 24 year old females are the most vulnerable to poverty, with 54 males (16.0%) and 67 females (41.6%) in their respective age groups living below the poverty level.
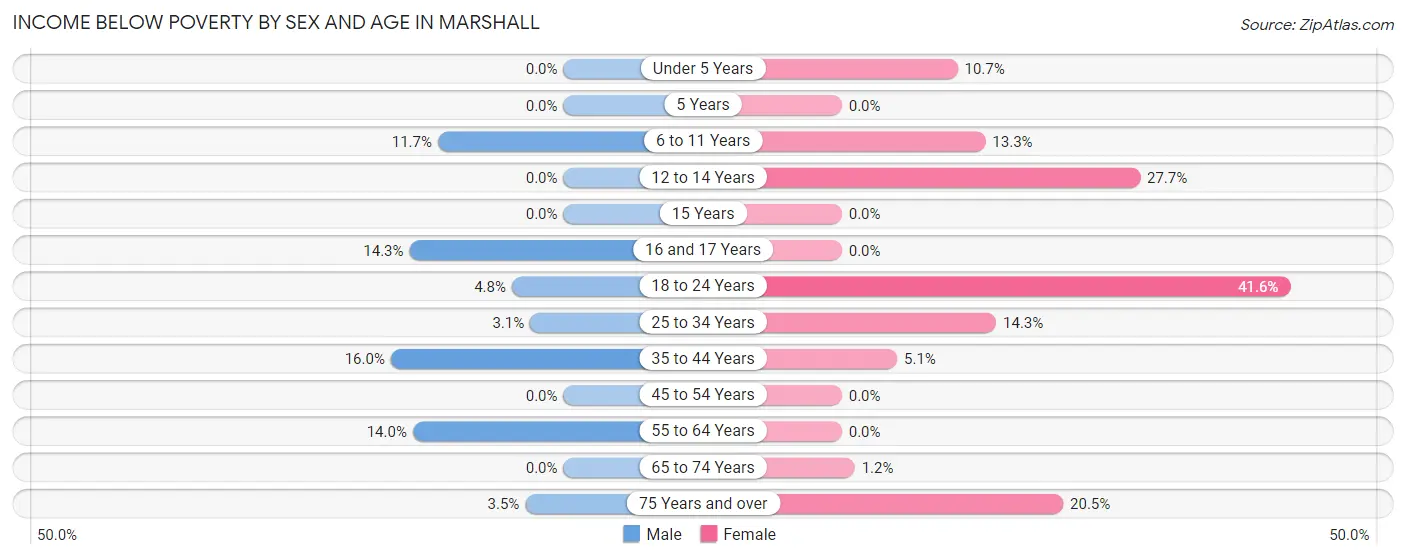
| Age Bracket | Male | Female |
| Under 5 Years | 0 (0.0%) | 16 (10.7%) |
| 5 Years | 0 (0.0%) | 0 (0.0%) |
| 6 to 11 Years | 24 (11.7%) | 34 (13.3%) |
| 12 to 14 Years | 0 (0.0%) | 31 (27.7%) |
| 15 Years | 0 (0.0%) | 0 (0.0%) |
| 16 and 17 Years | 9 (14.3%) | 0 (0.0%) |
| 18 to 24 Years | 10 (4.8%) | 67 (41.6%) |
| 25 to 34 Years | 15 (3.1%) | 62 (14.3%) |
| 35 to 44 Years | 54 (16.0%) | 24 (5.1%) |
| 45 to 54 Years | 0 (0.0%) | 0 (0.0%) |
| 55 to 64 Years | 58 (14.0%) | 0 (0.0%) |
| 65 to 74 Years | 0 (0.0%) | 6 (1.2%) |
| 75 Years and over | 8 (3.5%) | 69 (20.5%) |
| Total | 178 (5.6%) | 309 (8.9%) |
Income Above Poverty by Sex and Age in Marshall
According to the poverty statistics in Marshall, males aged under 5 years and females aged 5 years are the age groups that are most secure financially, with 100.0% of males and 100.0% of females in these age groups living above the poverty line.
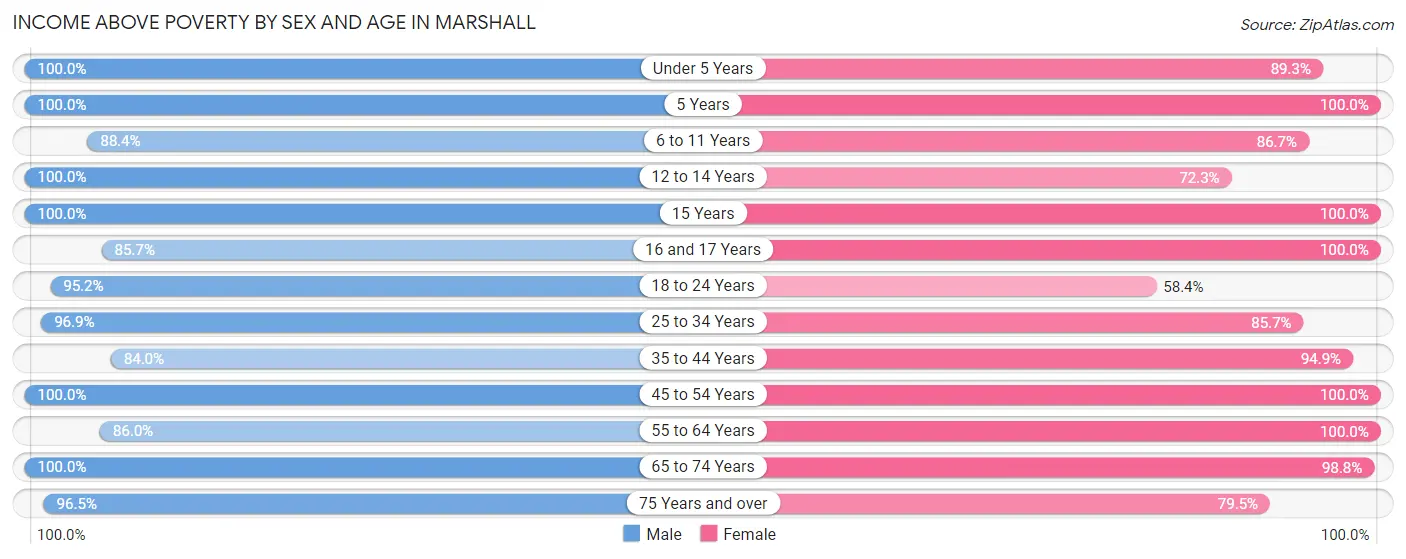
| Age Bracket | Male | Female |
| Under 5 Years | 145 (100.0%) | 133 (89.3%) |
| 5 Years | 53 (100.0%) | 10 (100.0%) |
| 6 to 11 Years | 182 (88.3%) | 221 (86.7%) |
| 12 to 14 Years | 80 (100.0%) | 81 (72.3%) |
| 15 Years | 69 (100.0%) | 24 (100.0%) |
| 16 and 17 Years | 54 (85.7%) | 62 (100.0%) |
| 18 to 24 Years | 199 (95.2%) | 94 (58.4%) |
| 25 to 34 Years | 470 (96.9%) | 371 (85.7%) |
| 35 to 44 Years | 283 (84.0%) | 444 (94.9%) |
| 45 to 54 Years | 525 (100.0%) | 445 (100.0%) |
| 55 to 64 Years | 357 (86.0%) | 528 (100.0%) |
| 65 to 74 Years | 380 (100.0%) | 494 (98.8%) |
| 75 Years and over | 218 (96.5%) | 267 (79.5%) |
| Total | 3,015 (94.4%) | 3,174 (91.1%) |
Income Below Poverty Among Married-Couple Families in Marshall
The poverty statistics for married-couple families in Marshall show that 1.5% or 21 of the total 1,419 families live below the poverty line. Families with 3 or 4 children have the highest poverty rate of 14.1%, comprising of 11 families. On the other hand, families with no children have the lowest poverty rate of 0.0%, which includes 0 families.
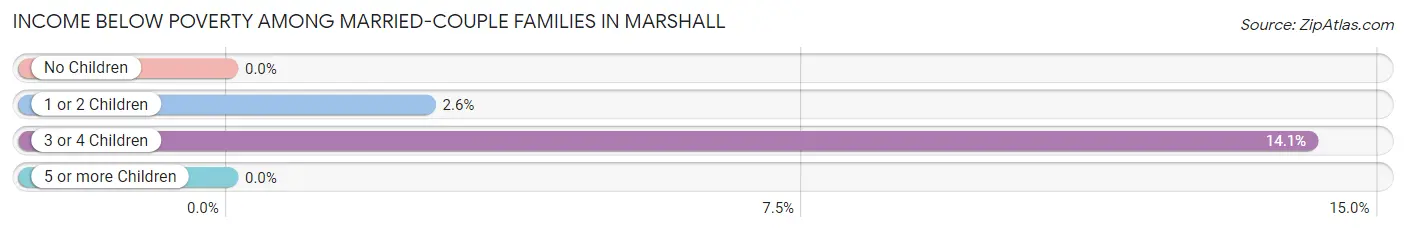
| Children | Above Poverty | Below Poverty |
| No Children | 953 (100.0%) | 0 (0.0%) |
| 1 or 2 Children | 378 (97.4%) | 10 (2.6%) |
| 3 or 4 Children | 67 (85.9%) | 11 (14.1%) |
| 5 or more Children | 0 (0.0%) | 0 (0.0%) |
| Total | 1,398 (98.5%) | 21 (1.5%) |
Income Below Poverty Among Single-Parent Households in Marshall
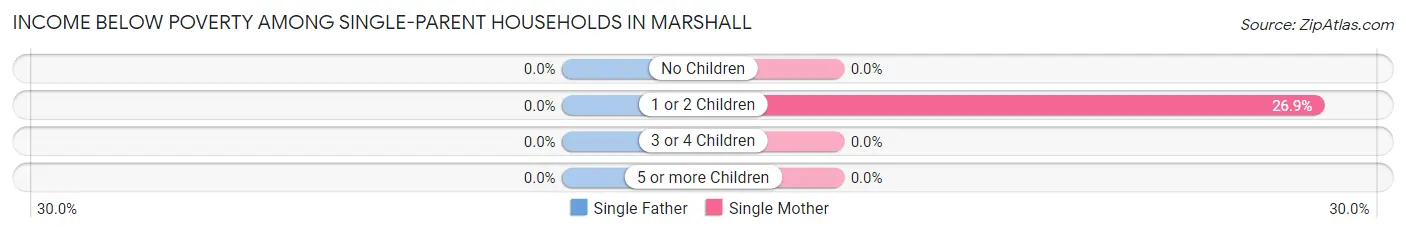
| Children | Single Father | Single Mother |
| No Children | 0 (0.0%) | 0 (0.0%) |
| 1 or 2 Children | 0 (0.0%) | 40 (26.9%) |
| 3 or 4 Children | 0 (0.0%) | 0 (0.0%) |
| 5 or more Children | 0 (0.0%) | 0 (0.0%) |
| Total | 0 (0.0%) | 40 (14.1%) |
Income Below Poverty Among Married-Couple vs Single-Parent Households in Marshall
The poverty data for Marshall shows that 21 of the married-couple family households (1.5%) and 40 of the single-parent households (9.9%) are living below the poverty level. Within the married-couple family households, those with 3 or 4 children have the highest poverty rate, with 11 households (14.1%) falling below the poverty line. Among the single-parent households, those with 1 or 2 children have the highest poverty rate, with 40 household (19.0%) living below poverty.
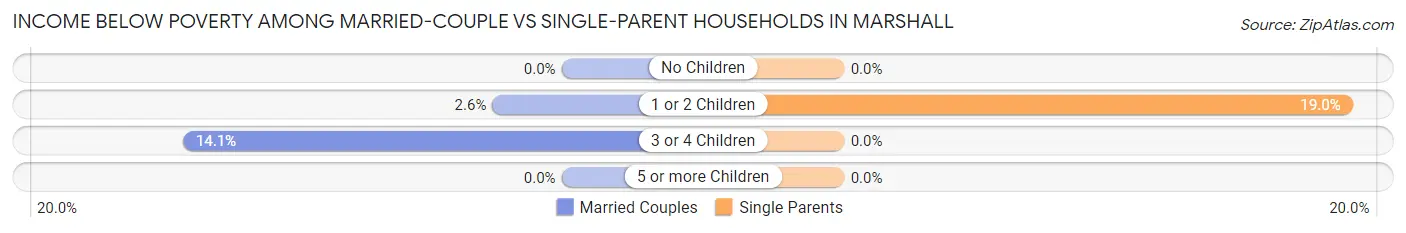
| Children | Married-Couple Families | Single-Parent Households |
| No Children | 0 (0.0%) | 0 (0.0%) |
| 1 or 2 Children | 10 (2.6%) | 40 (19.0%) |
| 3 or 4 Children | 11 (14.1%) | 0 (0.0%) |
| 5 or more Children | 0 (0.0%) | 0 (0.0%) |
| Total | 21 (1.5%) | 40 (9.9%) |
Race in Marshall
The most populous races in Marshall are White / Caucasian (6,591 | 96.8%), Hispanic or Latino (246 | 3.6%), and Two or more Races (157 | 2.3%).
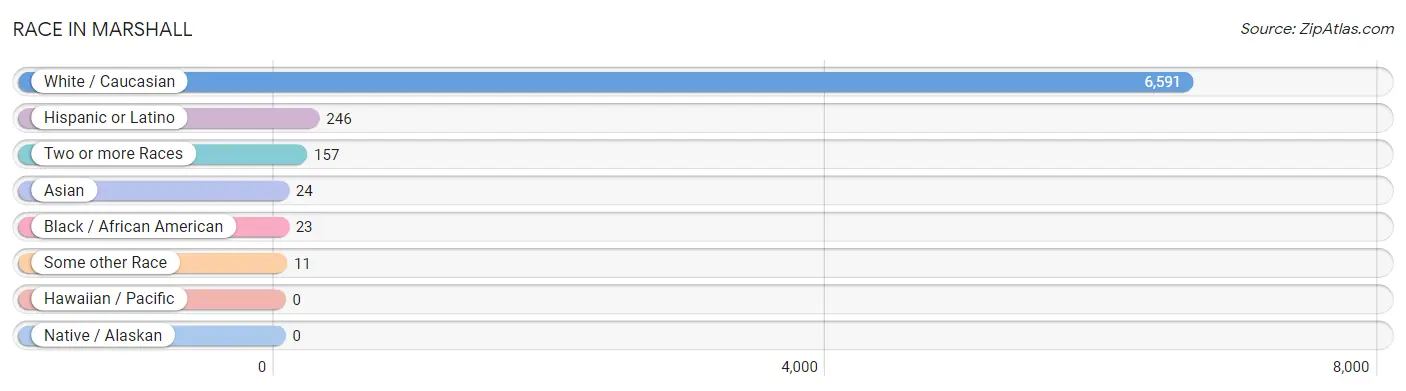
| Race | # Population | % Population |
| Asian | 24 | 0.4% |
| Black / African American | 23 | 0.3% |
| Hawaiian / Pacific | 0 | 0.0% |
| Hispanic or Latino | 246 | 3.6% |
| Native / Alaskan | 0 | 0.0% |
| White / Caucasian | 6,591 | 96.8% |
| Two or more Races | 157 | 2.3% |
| Some other Race | 11 | 0.2% |
| Total | 6,806 | 100.0% |
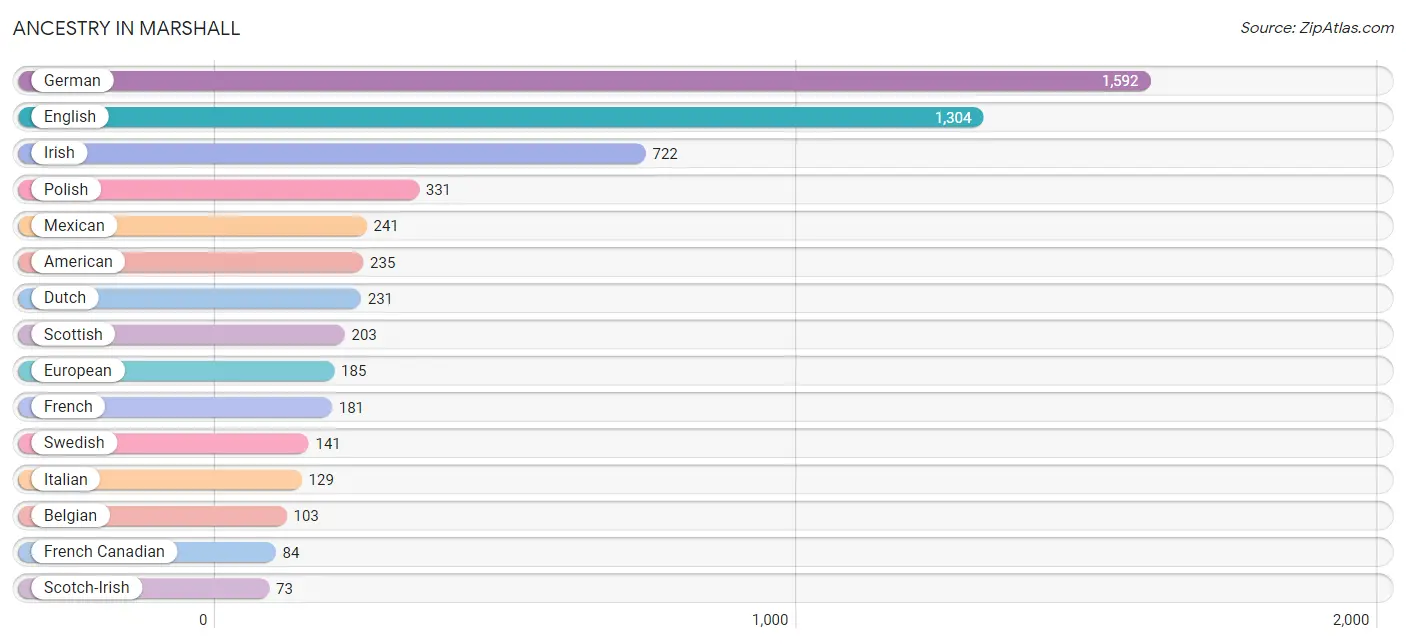
Ancestry in Marshall
The most populous ancestries reported in Marshall are German (1,592 | 23.4%), English (1,304 | 19.2%), Irish (722 | 10.6%), Polish (331 | 4.9%), and Mexican (241 | 3.5%), together accounting for 61.6% of all Marshall residents.
| Ancestry | # Population | % Population |
| American | 235 | 3.5% |
| Austrian | 3 | 0.0% |
| Belgian | 103 | 1.5% |
| Bhutanese | 19 | 0.3% |
| British | 21 | 0.3% |
| Burmese | 24 | 0.4% |
| Canadian | 42 | 0.6% |
| Cherokee | 6 | 0.1% |
| Chippewa | 23 | 0.3% |
| Croatian | 16 | 0.2% |
| Czech | 56 | 0.8% |
| Danish | 6 | 0.1% |
| Dutch | 231 | 3.4% |
| Eastern European | 20 | 0.3% |
| English | 1,304 | 19.2% |
| European | 185 | 2.7% |
| French | 181 | 2.7% |
| French Canadian | 84 | 1.2% |
| German | 1,592 | 23.4% |
| Haitian | 7 | 0.1% |
| Hungarian | 8 | 0.1% |
| Irish | 722 | 10.6% |
| Italian | 129 | 1.9% |
| Lithuanian | 8 | 0.1% |
| Mexican | 241 | 3.5% |
| Norwegian | 13 | 0.2% |
| Pennsylvania German | 10 | 0.2% |
| Polish | 331 | 4.9% |
| Potawatomi | 2 | 0.0% |
| Russian | 28 | 0.4% |
| Scandinavian | 20 | 0.3% |
| Scotch-Irish | 73 | 1.1% |
| Scottish | 203 | 3.0% |
| Serbian | 17 | 0.3% |
| Slovene | 6 | 0.1% |
| South American | 5 | 0.1% |
| Sri Lankan | 8 | 0.1% |
| Swedish | 141 | 2.1% |
| Swiss | 8 | 0.1% |
| Uruguayan | 5 | 0.1% |
| Welsh | 22 | 0.3% | View All 41 Rows |
Immigrants in Marshall
The most numerous immigrant groups reported in Marshall came from Europe (29 | 0.4%), Asia (24 | 0.4%), England (20 | 0.3%), Northern Europe (20 | 0.3%), and Philippines (14 | 0.2%), together accounting for 1.6% of all Marshall residents.
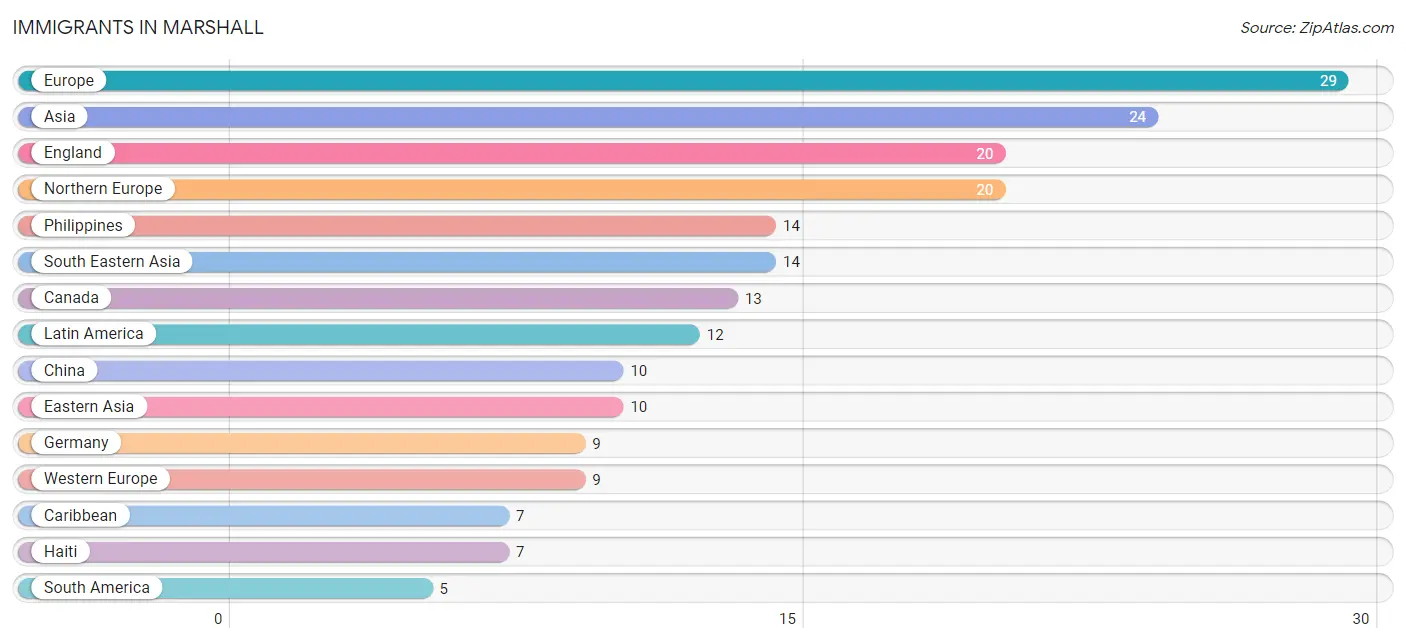
| Immigration Origin | # Population | % Population |
| Asia | 24 | 0.4% |
| Canada | 13 | 0.2% |
| Caribbean | 7 | 0.1% |
| China | 10 | 0.2% |
| Eastern Asia | 10 | 0.2% |
| England | 20 | 0.3% |
| Europe | 29 | 0.4% |
| Germany | 9 | 0.1% |
| Haiti | 7 | 0.1% |
| Latin America | 12 | 0.2% |
| Northern Europe | 20 | 0.3% |
| Philippines | 14 | 0.2% |
| South America | 5 | 0.1% |
| South Eastern Asia | 14 | 0.2% |
| Uruguay | 5 | 0.1% |
| Western Europe | 9 | 0.1% | View All 16 Rows |
Sex and Age in Marshall
Sex and Age in Marshall
The most populous age groups in Marshall are 45 to 49 Years (431 | 13.3%) for men and 55 to 59 Years (338 | 9.5%) for women.
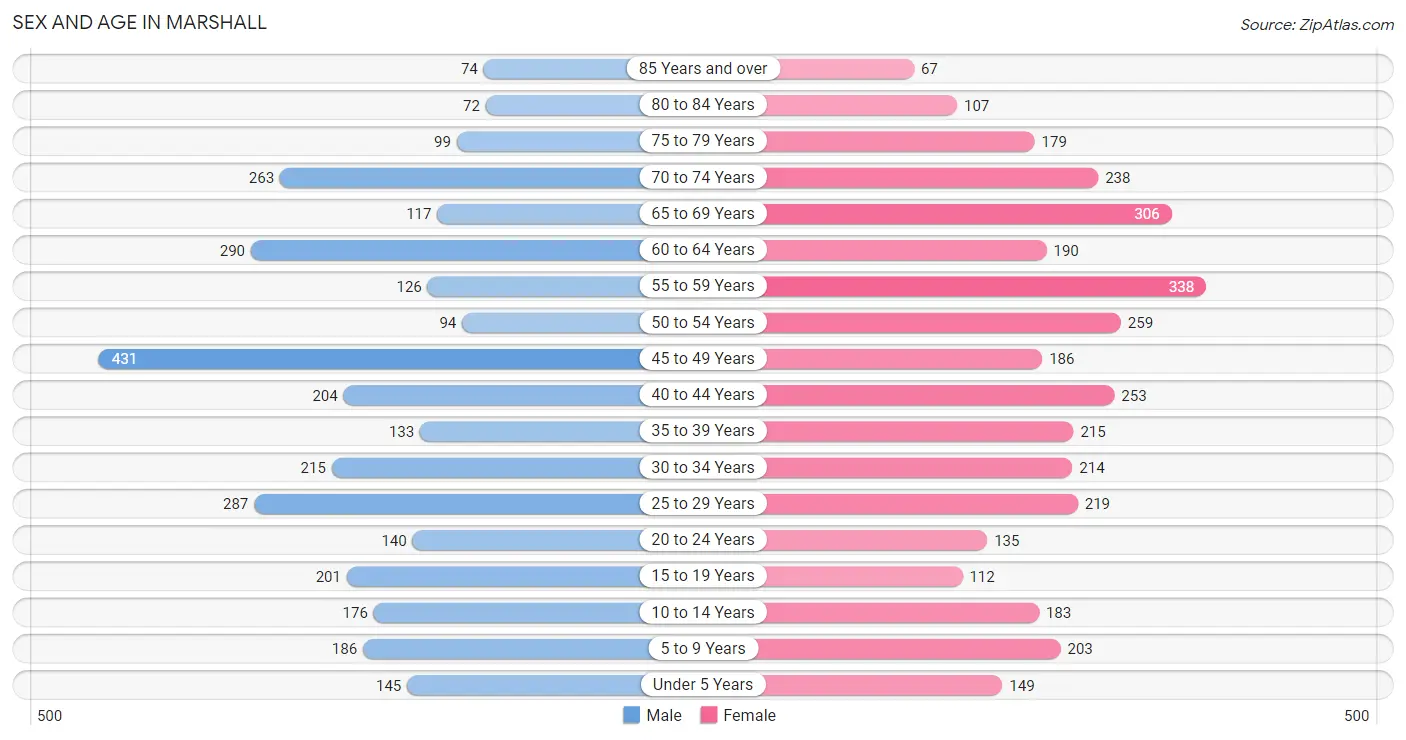
| Age Bracket | Male | Female |
| Under 5 Years | 145 (4.5%) | 149 (4.2%) |
| 5 to 9 Years | 186 (5.7%) | 203 (5.7%) |
| 10 to 14 Years | 176 (5.4%) | 183 (5.1%) |
| 15 to 19 Years | 201 (6.2%) | 112 (3.2%) |
| 20 to 24 Years | 140 (4.3%) | 135 (3.8%) |
| 25 to 29 Years | 287 (8.8%) | 219 (6.2%) |
| 30 to 34 Years | 215 (6.6%) | 214 (6.0%) |
| 35 to 39 Years | 133 (4.1%) | 215 (6.0%) |
| 40 to 44 Years | 204 (6.3%) | 253 (7.1%) |
| 45 to 49 Years | 431 (13.3%) | 186 (5.2%) |
| 50 to 54 Years | 94 (2.9%) | 259 (7.3%) |
| 55 to 59 Years | 126 (3.9%) | 338 (9.5%) |
| 60 to 64 Years | 290 (8.9%) | 190 (5.3%) |
| 65 to 69 Years | 117 (3.6%) | 306 (8.6%) |
| 70 to 74 Years | 263 (8.1%) | 238 (6.7%) |
| 75 to 79 Years | 99 (3.0%) | 179 (5.0%) |
| 80 to 84 Years | 72 (2.2%) | 107 (3.0%) |
| 85 Years and over | 74 (2.3%) | 67 (1.9%) |
| Total | 3,253 (100.0%) | 3,553 (100.0%) |
Families and Households in Marshall
Median Family Size in Marshall
The median family size in Marshall is 2.78 persons per family, with married-couple families (1,419 | 77.8%) accounting for the largest median family size of 2.83 persons per family. On the other hand, single female/mother families (284 | 15.6%) represent the smallest median family size with 2.56 persons per family.
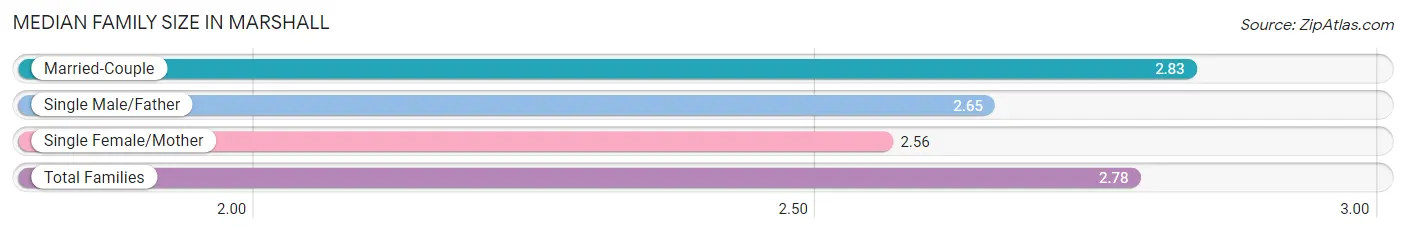
| Family Type | # Families | Family Size |
| Married-Couple | 1,419 (77.8%) | 2.83 |
| Single Male/Father | 121 (6.6%) | 2.65 |
| Single Female/Mother | 284 (15.6%) | 2.56 |
| Total Families | 1,824 (100.0%) | 2.78 |
Median Household Size in Marshall
The median household size in Marshall is 2.14 persons per household, with single female/mother households (284 | 9.1%) accounting for the largest median household size of 2.89 persons per household. non-family households (1,295 | 41.5%) represent the smallest median household size with 1.15 persons per household.
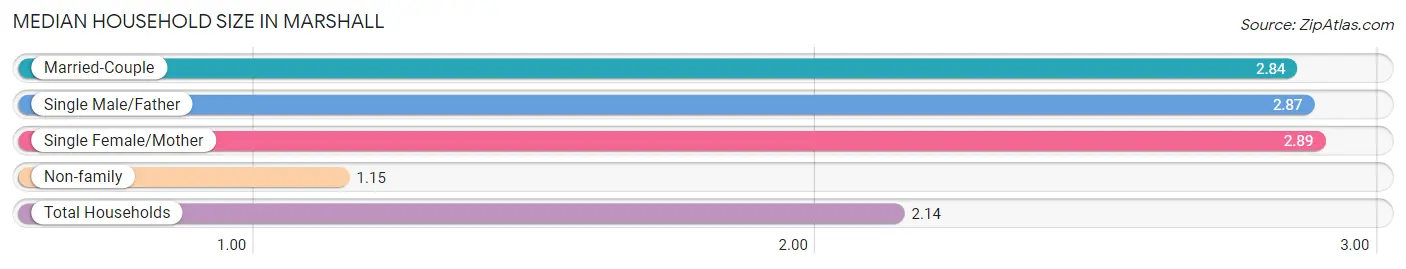
| Household Type | # Households | Household Size |
| Married-Couple | 1,419 (45.5%) | 2.84 |
| Single Male/Father | 121 (3.9%) | 2.87 |
| Single Female/Mother | 284 (9.1%) | 2.89 |
| Non-family | 1,295 (41.5%) | 1.15 |
| Total Households | 3,119 (100.0%) | 2.14 |
Household Size by Marriage Status in Marshall
Out of a total of 3,119 households in Marshall, 1,824 (58.5%) are family households, while 1,295 (41.5%) are nonfamily households. The most numerous type of family households are 2-person households, comprising 1,085, and the most common type of nonfamily households are 1-person households, comprising 1,128.
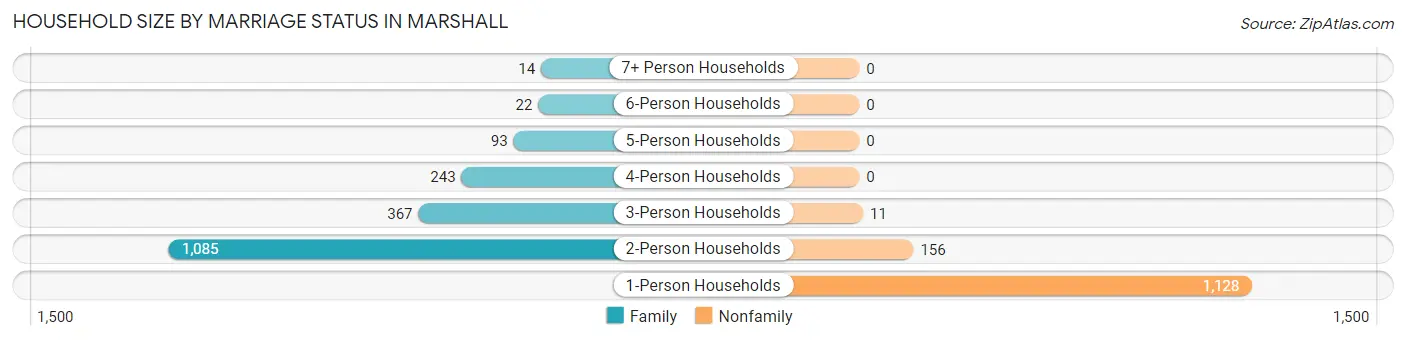
| Household Size | Family Households | Nonfamily Households |
| 1-Person Households | - | 1,128 (36.2%) |
| 2-Person Households | 1,085 (34.8%) | 156 (5.0%) |
| 3-Person Households | 367 (11.8%) | 11 (0.4%) |
| 4-Person Households | 243 (7.8%) | 0 (0.0%) |
| 5-Person Households | 93 (3.0%) | 0 (0.0%) |
| 6-Person Households | 22 (0.7%) | 0 (0.0%) |
| 7+ Person Households | 14 (0.4%) | 0 (0.0%) |
| Total | 1,824 (58.5%) | 1,295 (41.5%) |
Female Fertility in Marshall
Fertility by Age in Marshall
Average fertility rate in Marshall is 54.0 births per 1,000 women. Women in the age bracket of 20 to 34 years have the highest fertility rate with 92.0 births per 1,000 women. Women in the age bracket of 20 to 34 years acount for 71.2% of all women with births.
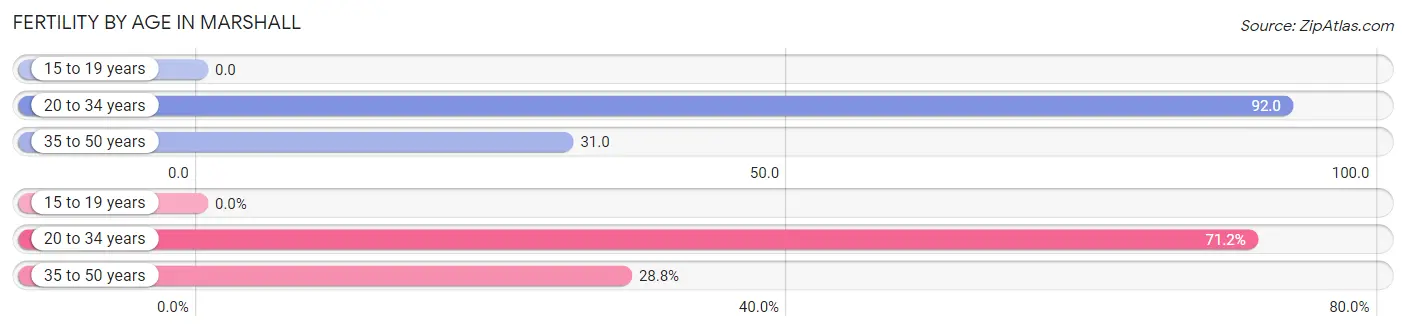
| Age Bracket | Women with Births | Births / 1,000 Women |
| 15 to 19 years | 0 (0.0%) | 0.0 |
| 20 to 34 years | 52 (71.2%) | 92.0 |
| 35 to 50 years | 21 (28.8%) | 31.0 |
| Total | 73 (100.0%) | 54.0 |
Fertility by Age by Marriage Status in Marshall
67.1% of women with births (73) in Marshall are married. The highest percentage of unmarried women with births falls into 20 to 34 years age bracket with 46.2% of them unmarried at the time of birth, while the lowest percentage of unmarried women with births belong to 35 to 50 years age bracket with 0.0% of them unmarried.
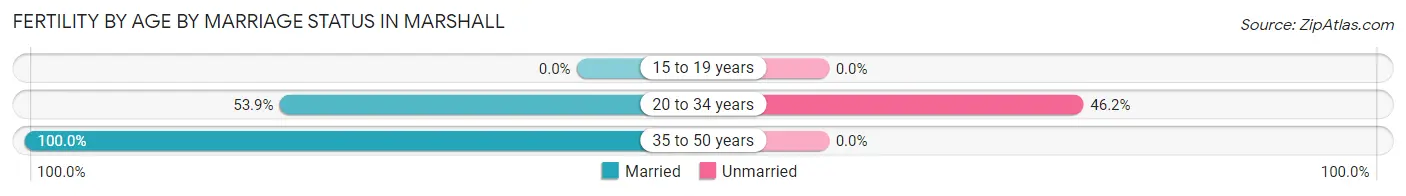
| Age Bracket | Married | Unmarried |
| 15 to 19 years | 0 (0.0%) | 0 (0.0%) |
| 20 to 34 years | 28 (53.8%) | 24 (46.2%) |
| 35 to 50 years | 21 (100.0%) | 0 (0.0%) |
| Total | 49 (67.1%) | 24 (32.9%) |
Fertility by Education in Marshall
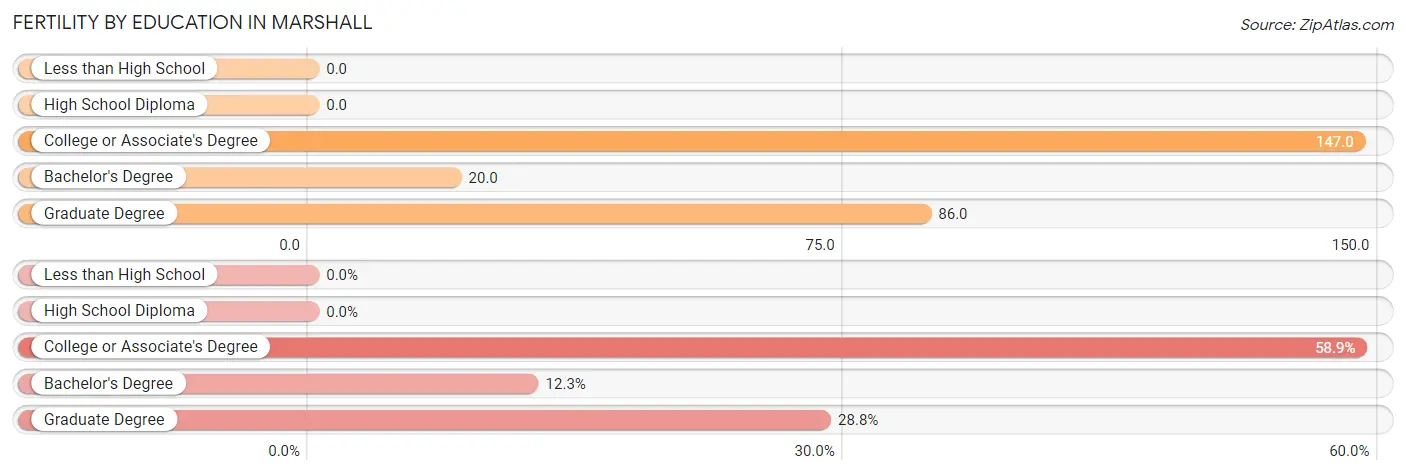
| Educational Attainment | Women with Births | Births / 1,000 Women |
| Less than High School | 0 (0.0%) | 0.0 |
| High School Diploma | 0 (0.0%) | 0.0 |
| College or Associate's Degree | 43 (58.9%) | 147.0 |
| Bachelor's Degree | 9 (12.3%) | 20.0 |
| Graduate Degree | 21 (28.8%) | 86.0 |
| Total | 73 (100.0%) | 54.0 |
Fertility by Education by Marriage Status in Marshall
32.9% of women with births in Marshall are unmarried. Women with the educational attainment of bachelor's degree are most likely to be married with 100.0% of them married at childbirth, while women with the educational attainment of college or associate's degree are least likely to be married with 55.8% of them unmarried at childbirth.
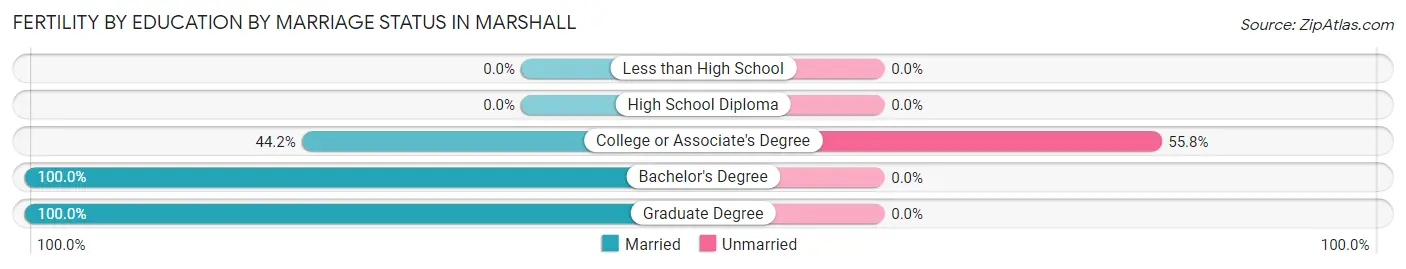
| Educational Attainment | Married | Unmarried |
| Less than High School | 0 (0.0%) | 0 (0.0%) |
| High School Diploma | 0 (0.0%) | 0 (0.0%) |
| College or Associate's Degree | 19 (44.2%) | 24 (55.8%) |
| Bachelor's Degree | 9 (100.0%) | 0 (0.0%) |
| Graduate Degree | 21 (100.0%) | 0 (0.0%) |
| Total | 49 (67.1%) | 24 (32.9%) |
Employment Characteristics in Marshall
Employment by Class of Employer in Marshall
Among the 3,325 employed individuals in Marshall, private company employees (1,952 | 58.7%), not-for-profit organizations (577 | 17.3%), and local government employees (414 | 12.4%) make up the most common classes of employment.
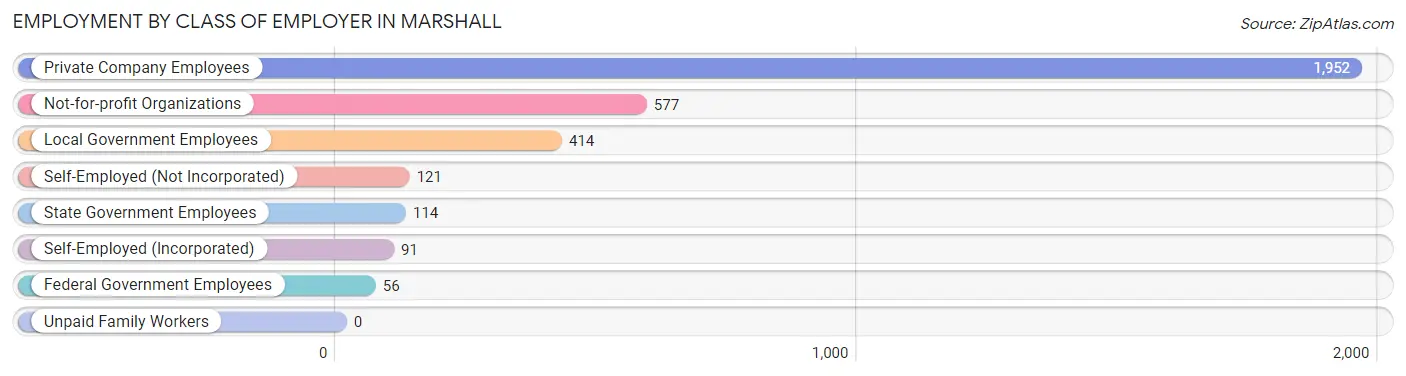
| Employer Class | # Employees | % Employees |
| Private Company Employees | 1,952 | 58.7% |
| Self-Employed (Incorporated) | 91 | 2.7% |
| Self-Employed (Not Incorporated) | 121 | 3.6% |
| Not-for-profit Organizations | 577 | 17.3% |
| Local Government Employees | 414 | 12.4% |
| State Government Employees | 114 | 3.4% |
| Federal Government Employees | 56 | 1.7% |
| Unpaid Family Workers | 0 | 0.0% |
| Total | 3,325 | 100.0% |
Employment Status by Age in Marshall
According to the labor force statistics for Marshall, out of the total population over 16 years of age (5,671), 64.3% or 3,646 individuals are in the labor force, with 7.2% or 263 of them unemployed. The age group with the highest labor force participation rate is 45 to 54 years, with 93.6% or 908 individuals in the labor force. Within the labor force, the 25 to 29 years age range has the highest percentage of unemployed individuals, with 18.5% or 84 of them being unemployed.
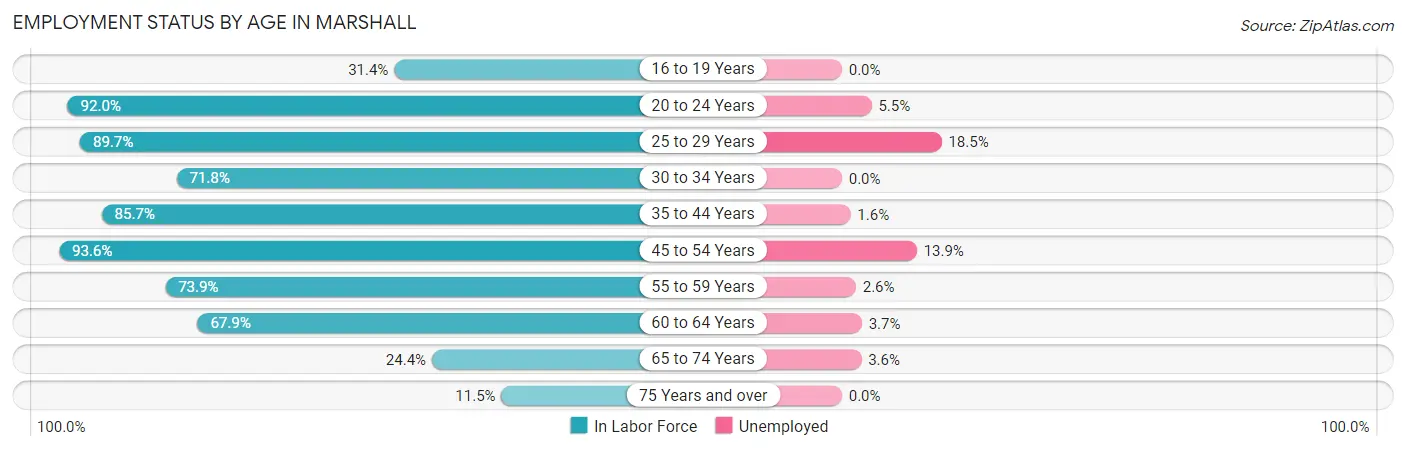
| Age Bracket | In Labor Force | Unemployed |
| 16 to 19 Years | 69 (31.4%) | 0 (0.0%) |
| 20 to 24 Years | 253 (92.0%) | 14 (5.5%) |
| 25 to 29 Years | 454 (89.7%) | 84 (18.5%) |
| 30 to 34 Years | 308 (71.8%) | 0 (0.0%) |
| 35 to 44 Years | 690 (85.7%) | 11 (1.6%) |
| 45 to 54 Years | 908 (93.6%) | 126 (13.9%) |
| 55 to 59 Years | 343 (73.9%) | 9 (2.6%) |
| 60 to 64 Years | 326 (67.9%) | 12 (3.7%) |
| 65 to 74 Years | 225 (24.4%) | 8 (3.6%) |
| 75 Years and over | 69 (11.5%) | 0 (0.0%) |
| Total | 3,646 (64.3%) | 263 (7.2%) |
Employment Status by Educational Attainment in Marshall
According to labor force statistics for Marshall, 82.9% of individuals (3,029) out of the total population between 25 and 64 years of age (3,654) are in the labor force, with 8.0% or 242 of them being unemployed. The group with the highest labor force participation rate are those with the educational attainment of college / associate degree, with 87.7% or 951 individuals in the labor force. Within the labor force, individuals with less than high school education have the highest percentage of unemployment, with 34.7% or 43 of them being unemployed.
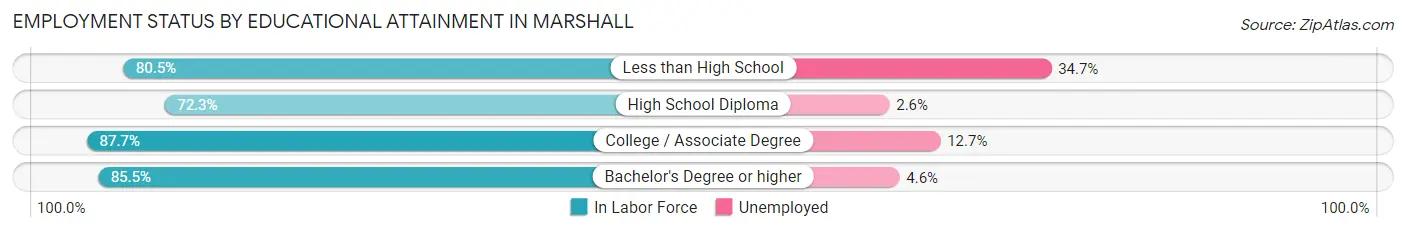
| Educational Attainment | In Labor Force | Unemployed |
| Less than High School | 124 (80.5%) | 53 (34.7%) |
| High School Diploma | 612 (72.3%) | 22 (2.6%) |
| College / Associate Degree | 951 (87.7%) | 138 (12.7%) |
| Bachelor's Degree or higher | 1,342 (85.5%) | 72 (4.6%) |
| Total | 3,029 (82.9%) | 292 (8.0%) |
Employment Occupations by Sex in Marshall
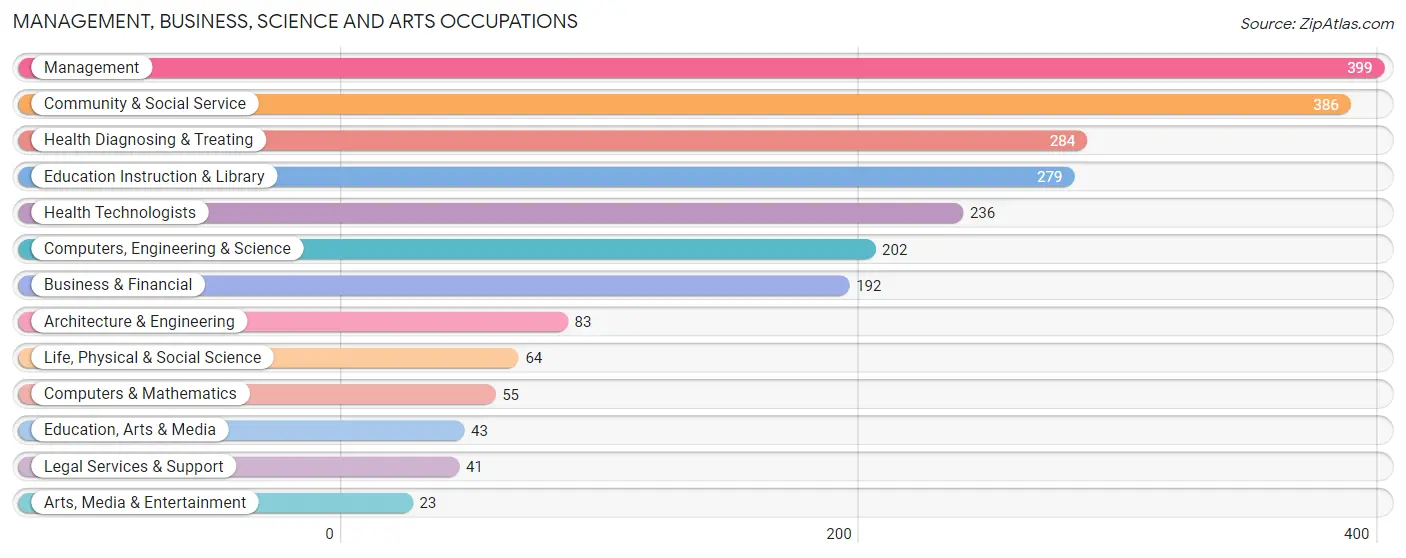
Management, Business, Science and Arts Occupations
The most common Management, Business, Science and Arts occupations in Marshall are Management (399 | 11.8%), Community & Social Service (386 | 11.4%), Health Diagnosing & Treating (284 | 8.4%), Education Instruction & Library (279 | 8.3%), and Health Technologists (236 | 7.0%).
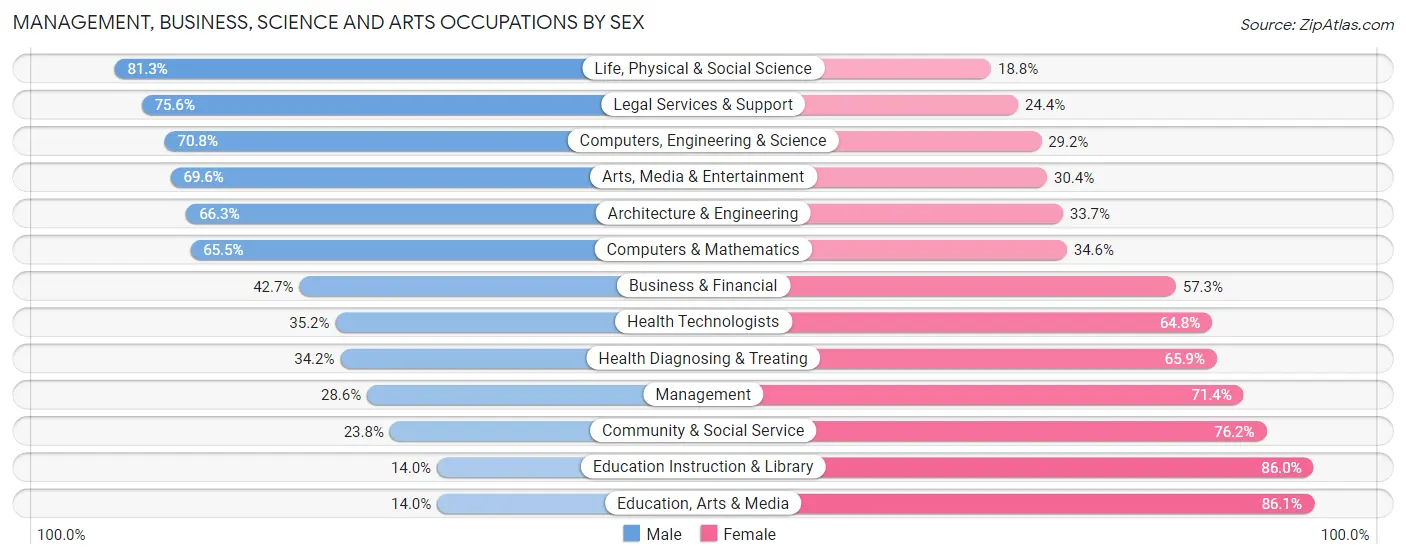
Management, Business, Science and Arts Occupations by Sex
Within the Management, Business, Science and Arts occupations in Marshall, the most male-oriented occupations are Life, Physical & Social Science (81.2%), Legal Services & Support (75.6%), and Computers, Engineering & Science (70.8%), while the most female-oriented occupations are Education, Arts & Media (86.1%), Education Instruction & Library (86.0%), and Community & Social Service (76.2%).
| Occupation | Male | Female |
| Management | 114 (28.6%) | 285 (71.4%) |
| Business & Financial | 82 (42.7%) | 110 (57.3%) |
| Computers, Engineering & Science | 143 (70.8%) | 59 (29.2%) |
| Computers & Mathematics | 36 (65.4%) | 19 (34.5%) |
| Architecture & Engineering | 55 (66.3%) | 28 (33.7%) |
| Life, Physical & Social Science | 52 (81.2%) | 12 (18.8%) |
| Community & Social Service | 92 (23.8%) | 294 (76.2%) |
| Education, Arts & Media | 6 (14.0%) | 37 (86.1%) |
| Legal Services & Support | 31 (75.6%) | 10 (24.4%) |
| Education Instruction & Library | 39 (14.0%) | 240 (86.0%) |
| Arts, Media & Entertainment | 16 (69.6%) | 7 (30.4%) |
| Health Diagnosing & Treating | 97 (34.2%) | 187 (65.8%) |
| Health Technologists | 83 (35.2%) | 153 (64.8%) |
| Total (Category) | 528 (36.1%) | 935 (63.9%) |
| Total (Overall) | 1,581 (46.8%) | 1,800 (53.2%) |
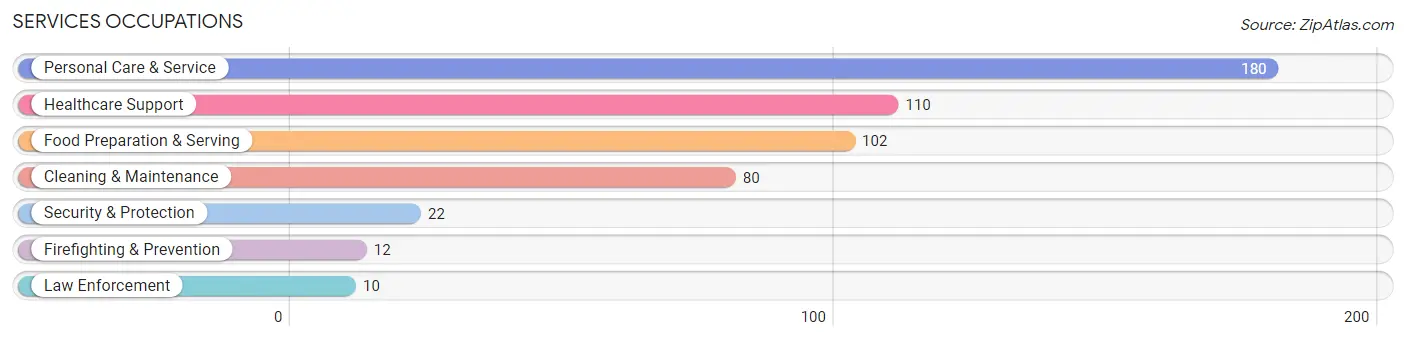
Services Occupations
The most common Services occupations in Marshall are Personal Care & Service (180 | 5.3%), Healthcare Support (110 | 3.3%), Food Preparation & Serving (102 | 3.0%), Cleaning & Maintenance (80 | 2.4%), and Security & Protection (22 | 0.6%).
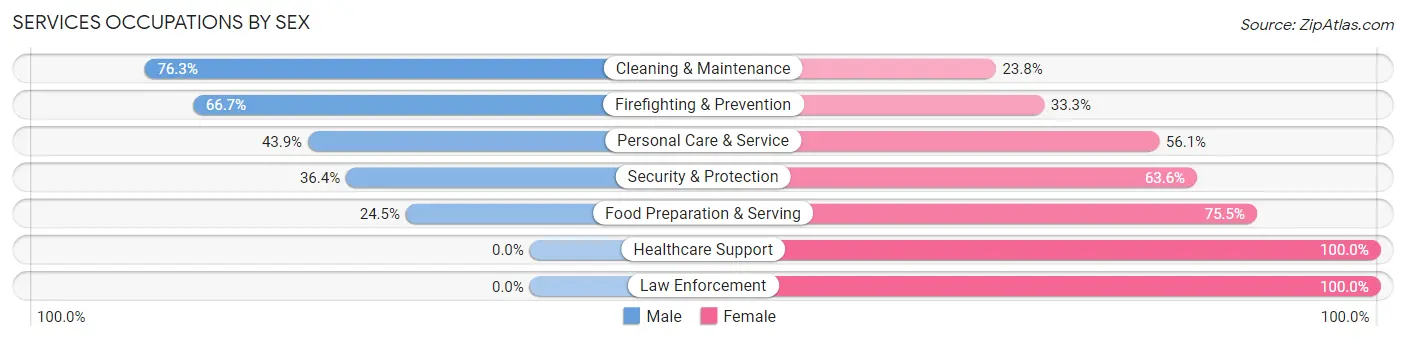
Services Occupations by Sex
Within the Services occupations in Marshall, the most male-oriented occupations are Cleaning & Maintenance (76.2%), Firefighting & Prevention (66.7%), and Personal Care & Service (43.9%), while the most female-oriented occupations are Healthcare Support (100.0%), Law Enforcement (100.0%), and Food Preparation & Serving (75.5%).
| Occupation | Male | Female |
| Healthcare Support | 0 (0.0%) | 110 (100.0%) |
| Security & Protection | 8 (36.4%) | 14 (63.6%) |
| Firefighting & Prevention | 8 (66.7%) | 4 (33.3%) |
| Law Enforcement | 0 (0.0%) | 10 (100.0%) |
| Food Preparation & Serving | 25 (24.5%) | 77 (75.5%) |
| Cleaning & Maintenance | 61 (76.2%) | 19 (23.7%) |
| Personal Care & Service | 79 (43.9%) | 101 (56.1%) |
| Total (Category) | 173 (35.0%) | 321 (65.0%) |
| Total (Overall) | 1,581 (46.8%) | 1,800 (53.2%) |
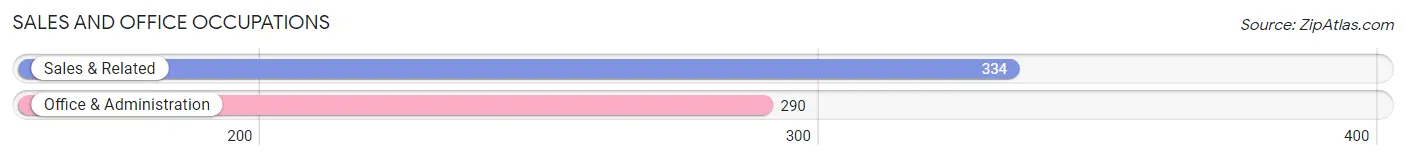
Sales and Office Occupations
The most common Sales and Office occupations in Marshall are Sales & Related (334 | 9.9%), and Office & Administration (290 | 8.6%).
Sales and Office Occupations by Sex
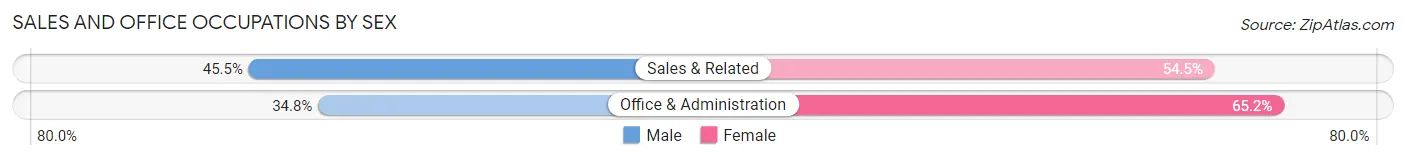
| Occupation | Male | Female |
| Sales & Related | 152 (45.5%) | 182 (54.5%) |
| Office & Administration | 101 (34.8%) | 189 (65.2%) |
| Total (Category) | 253 (40.5%) | 371 (59.5%) |
| Total (Overall) | 1,581 (46.8%) | 1,800 (53.2%) |
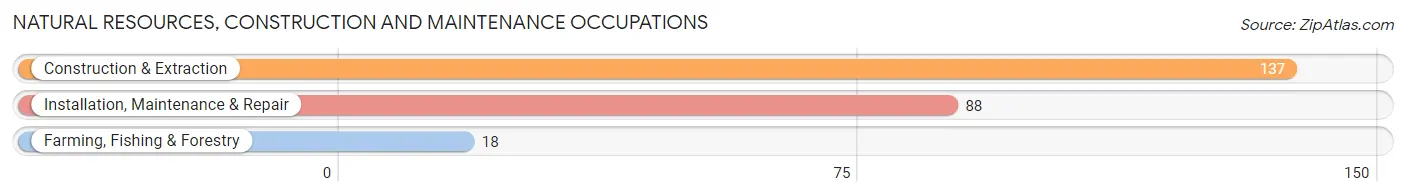
Natural Resources, Construction and Maintenance Occupations
The most common Natural Resources, Construction and Maintenance occupations in Marshall are Construction & Extraction (137 | 4.1%), Installation, Maintenance & Repair (88 | 2.6%), and Farming, Fishing & Forestry (18 | 0.5%).
Natural Resources, Construction and Maintenance Occupations by Sex
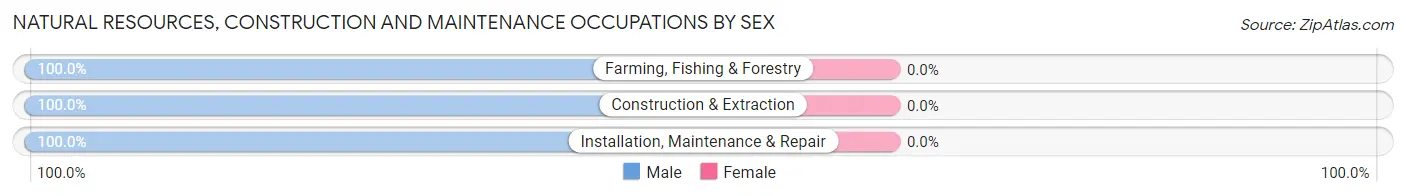
| Occupation | Male | Female |
| Farming, Fishing & Forestry | 18 (100.0%) | 0 (0.0%) |
| Construction & Extraction | 137 (100.0%) | 0 (0.0%) |
| Installation, Maintenance & Repair | 88 (100.0%) | 0 (0.0%) |
| Total (Category) | 243 (100.0%) | 0 (0.0%) |
| Total (Overall) | 1,581 (46.8%) | 1,800 (53.2%) |
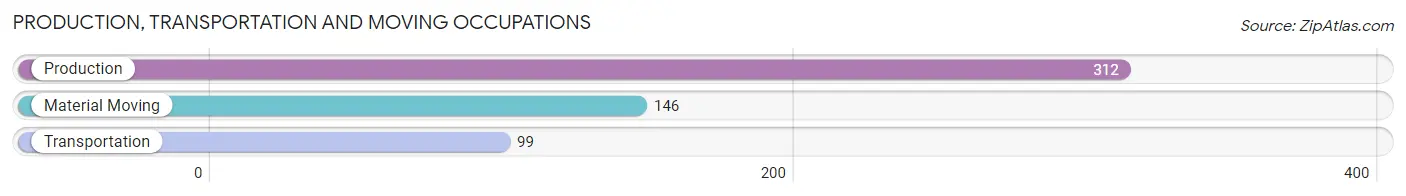
Production, Transportation and Moving Occupations
The most common Production, Transportation and Moving occupations in Marshall are Production (312 | 9.2%), Material Moving (146 | 4.3%), and Transportation (99 | 2.9%).
Production, Transportation and Moving Occupations by Sex
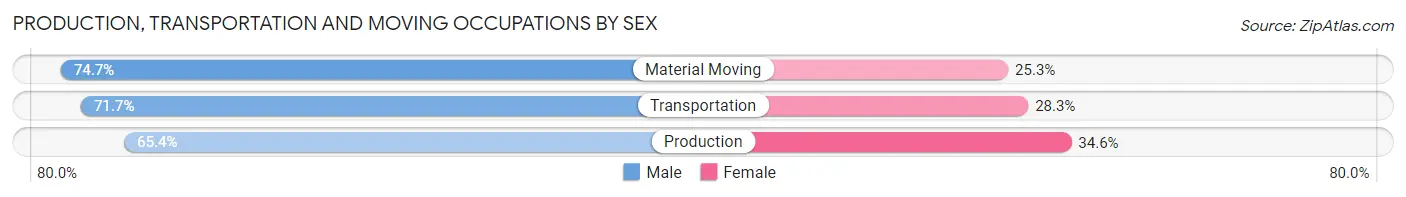
| Occupation | Male | Female |
| Production | 204 (65.4%) | 108 (34.6%) |
| Transportation | 71 (71.7%) | 28 (28.3%) |
| Material Moving | 109 (74.7%) | 37 (25.3%) |
| Total (Category) | 384 (68.9%) | 173 (31.1%) |
| Total (Overall) | 1,581 (46.8%) | 1,800 (53.2%) |
Employment Industries by Sex in Marshall
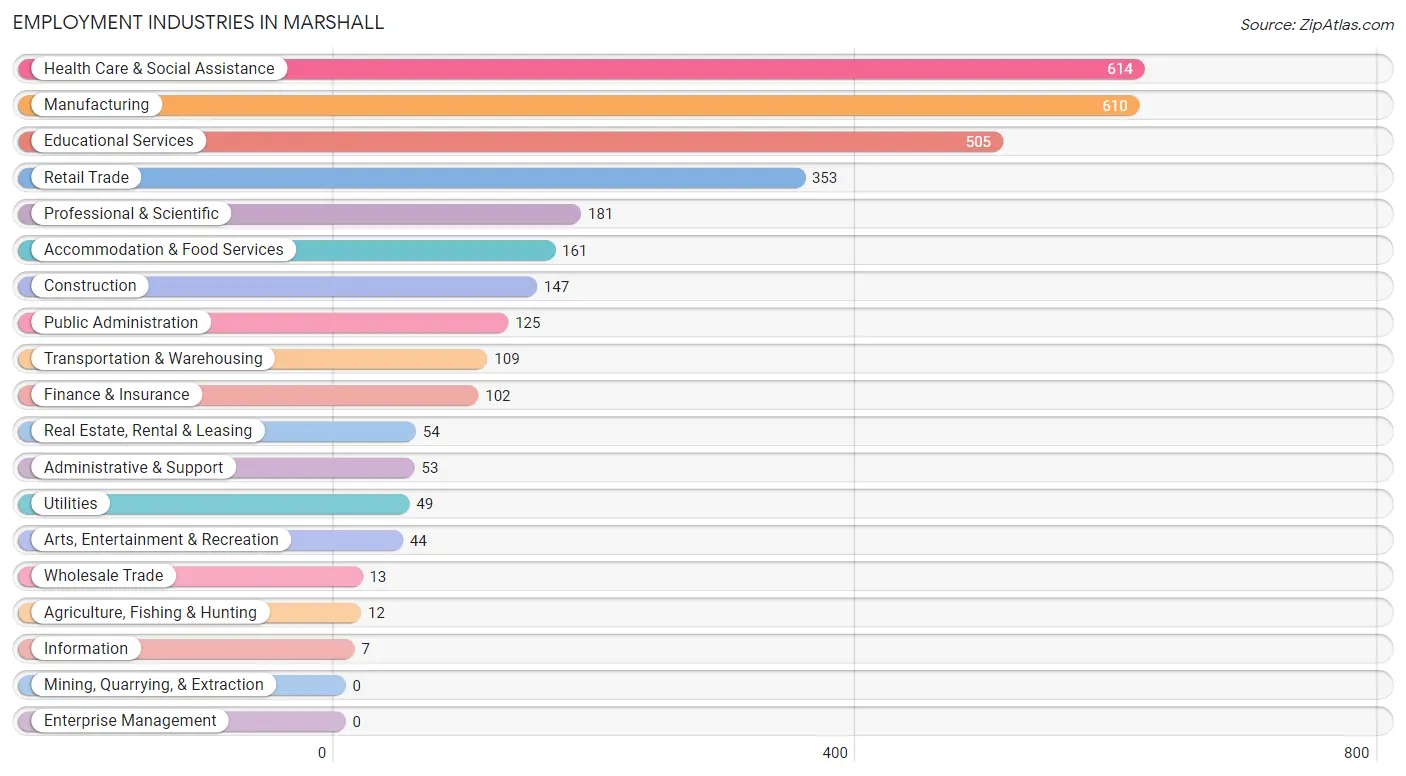
Employment Industries in Marshall
The major employment industries in Marshall include Health Care & Social Assistance (614 | 18.2%), Manufacturing (610 | 18.0%), Educational Services (505 | 14.9%), Retail Trade (353 | 10.4%), and Professional & Scientific (181 | 5.3%).
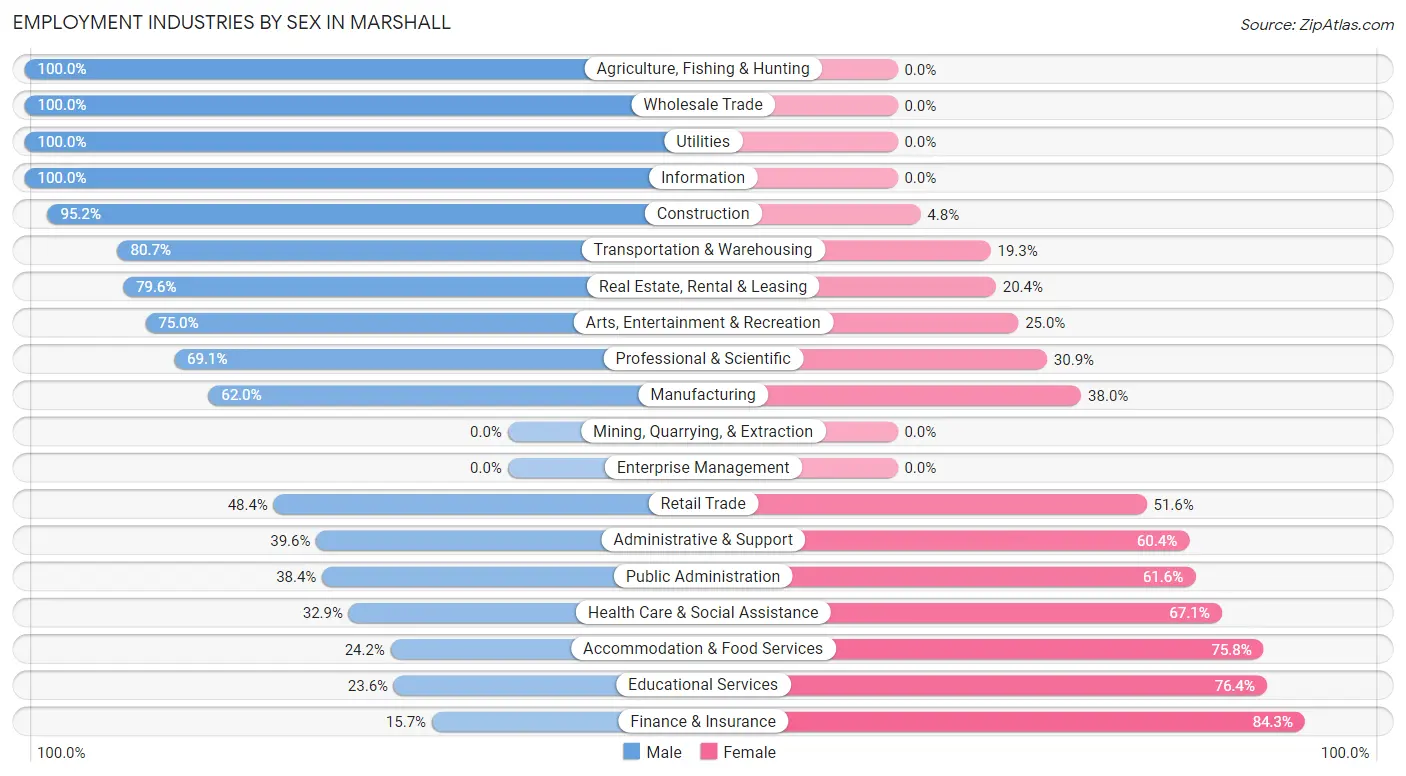
Employment Industries by Sex in Marshall
The Marshall industries that see more men than women are Agriculture, Fishing & Hunting (100.0%), Wholesale Trade (100.0%), and Utilities (100.0%), whereas the industries that tend to have a higher number of women are Finance & Insurance (84.3%), Educational Services (76.4%), and Accommodation & Food Services (75.8%).
| Industry | Male | Female |
| Agriculture, Fishing & Hunting | 12 (100.0%) | 0 (0.0%) |
| Mining, Quarrying, & Extraction | 0 (0.0%) | 0 (0.0%) |
| Construction | 140 (95.2%) | 7 (4.8%) |
| Manufacturing | 378 (62.0%) | 232 (38.0%) |
| Wholesale Trade | 13 (100.0%) | 0 (0.0%) |
| Retail Trade | 171 (48.4%) | 182 (51.6%) |
| Transportation & Warehousing | 88 (80.7%) | 21 (19.3%) |
| Utilities | 49 (100.0%) | 0 (0.0%) |
| Information | 7 (100.0%) | 0 (0.0%) |
| Finance & Insurance | 16 (15.7%) | 86 (84.3%) |
| Real Estate, Rental & Leasing | 43 (79.6%) | 11 (20.4%) |
| Professional & Scientific | 125 (69.1%) | 56 (30.9%) |
| Enterprise Management | 0 (0.0%) | 0 (0.0%) |
| Administrative & Support | 21 (39.6%) | 32 (60.4%) |
| Educational Services | 119 (23.6%) | 386 (76.4%) |
| Health Care & Social Assistance | 202 (32.9%) | 412 (67.1%) |
| Arts, Entertainment & Recreation | 33 (75.0%) | 11 (25.0%) |
| Accommodation & Food Services | 39 (24.2%) | 122 (75.8%) |
| Public Administration | 48 (38.4%) | 77 (61.6%) |
| Total | 1,581 (46.8%) | 1,800 (53.2%) |
Education in Marshall
School Enrollment in Marshall
The most common levels of schooling among the 1,258 students in Marshall are high school (357 | 28.4%), elementary school (289 | 23.0%), and middle school (259 | 20.6%).
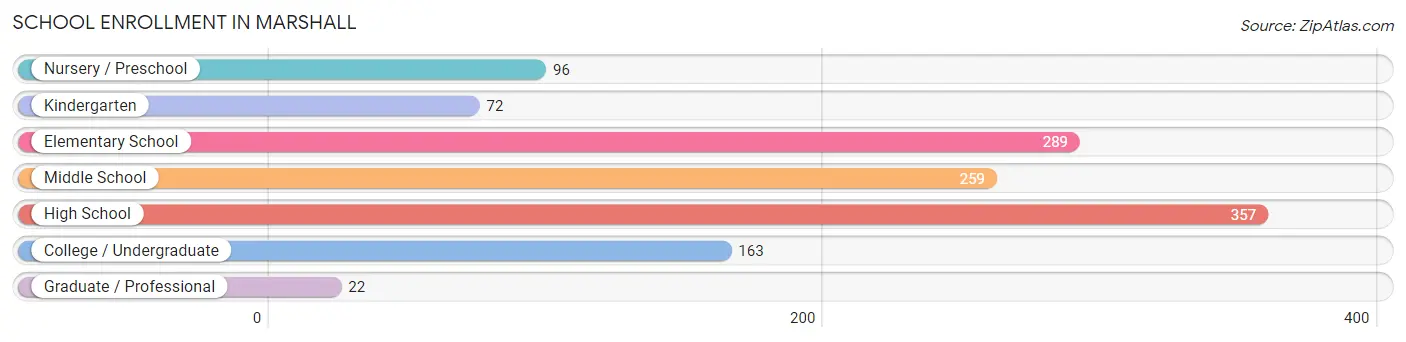
| School Level | # Students | % Students |
| Nursery / Preschool | 96 | 7.6% |
| Kindergarten | 72 | 5.7% |
| Elementary School | 289 | 23.0% |
| Middle School | 259 | 20.6% |
| High School | 357 | 28.4% |
| College / Undergraduate | 163 | 13.0% |
| Graduate / Professional | 22 | 1.8% |
| Total | 1,258 | 100.0% |
School Enrollment by Age by Funding Source in Marshall
Out of a total of 1,258 students who are enrolled in schools in Marshall, 175 (13.9%) attend a private institution, while the remaining 1,083 (86.1%) are enrolled in public schools. The age group of 3 to 4 year olds has the highest likelihood of being enrolled in private schools, with 44 (67.7% in the age bracket) enrolled. Conversely, the age group of 18 to 19 year olds has the lowest likelihood of being enrolled in a private school, with 95 (100.0% in the age bracket) attending a public institution.
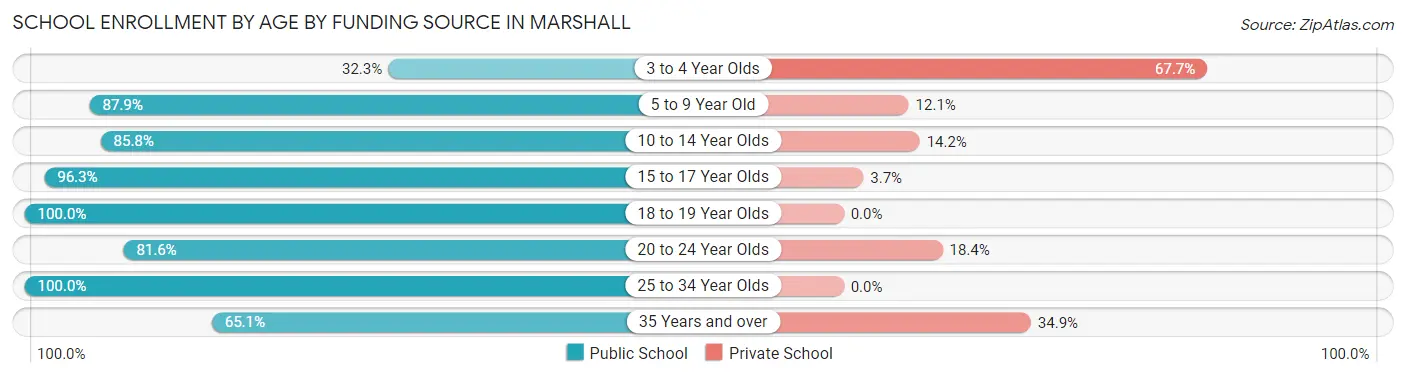
| Age Bracket | Public School | Private School |
| 3 to 4 Year Olds | 21 (32.3%) | 44 (67.7%) |
| 5 to 9 Year Old | 327 (87.9%) | 45 (12.1%) |
| 10 to 14 Year Olds | 297 (85.8%) | 49 (14.2%) |
| 15 to 17 Year Olds | 210 (96.3%) | 8 (3.7%) |
| 18 to 19 Year Olds | 95 (100.0%) | 0 (0.0%) |
| 20 to 24 Year Olds | 62 (81.6%) | 14 (18.4%) |
| 25 to 34 Year Olds | 43 (100.0%) | 0 (0.0%) |
| 35 Years and over | 28 (65.1%) | 15 (34.9%) |
| Total | 1,083 (86.1%) | 175 (13.9%) |
Educational Attainment by Field of Study in Marshall
Business (502 | 20.2%), education (476 | 19.1%), science & technology (248 | 10.0%), bio, nature & agricultural (237 | 9.5%), and arts & humanities (184 | 7.4%) are the most common fields of study among 2,489 individuals in Marshall who have obtained a bachelor's degree or higher.
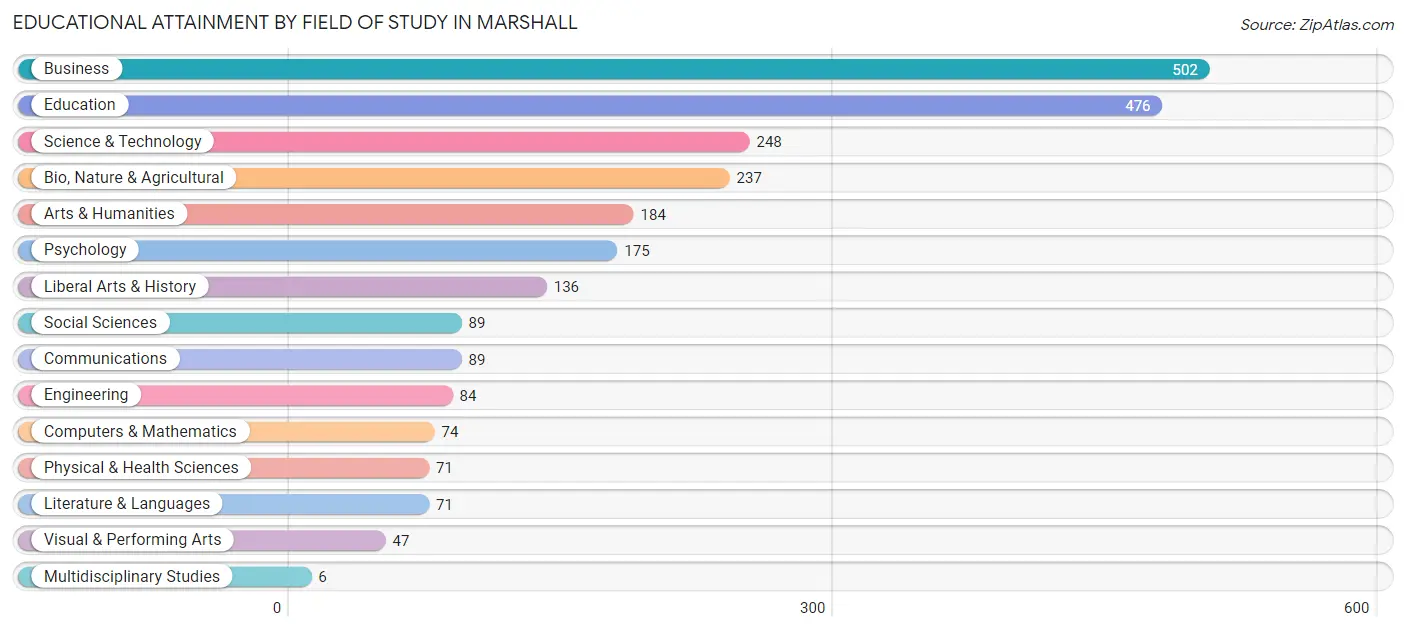
| Field of Study | # Graduates | % Graduates |
| Computers & Mathematics | 74 | 3.0% |
| Bio, Nature & Agricultural | 237 | 9.5% |
| Physical & Health Sciences | 71 | 2.9% |
| Psychology | 175 | 7.0% |
| Social Sciences | 89 | 3.6% |
| Engineering | 84 | 3.4% |
| Multidisciplinary Studies | 6 | 0.2% |
| Science & Technology | 248 | 10.0% |
| Business | 502 | 20.2% |
| Education | 476 | 19.1% |
| Literature & Languages | 71 | 2.9% |
| Liberal Arts & History | 136 | 5.5% |
| Visual & Performing Arts | 47 | 1.9% |
| Communications | 89 | 3.6% |
| Arts & Humanities | 184 | 7.4% |
| Total | 2,489 | 100.0% |
Transportation & Commute in Marshall
Vehicle Availability by Sex in Marshall
The most prevalent vehicle ownership categories in Marshall are males with 2 vehicles (751, accounting for 48.3%) and females with 2 vehicles (731, making up 42.4%).
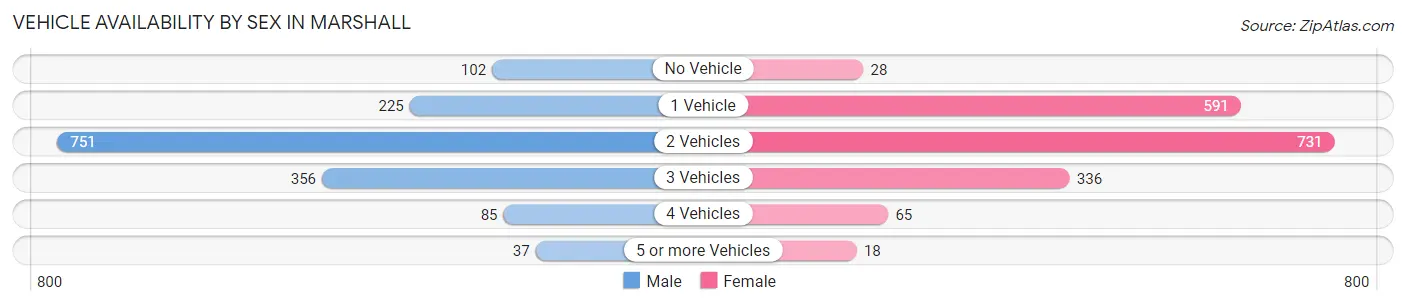
| Vehicles Available | Male | Female |
| No Vehicle | 102 (6.6%) | 28 (1.6%) |
| 1 Vehicle | 225 (14.5%) | 591 (33.4%) |
| 2 Vehicles | 751 (48.3%) | 731 (41.3%) |
| 3 Vehicles | 356 (22.9%) | 336 (19.0%) |
| 4 Vehicles | 85 (5.5%) | 65 (3.7%) |
| 5 or more Vehicles | 37 (2.4%) | 18 (1.0%) |
| Total | 1,556 (100.0%) | 1,769 (100.0%) |
Commute Time in Marshall
The most frequently occuring commute durations in Marshall are 5 to 9 minutes (811 commuters, 26.4%), 10 to 14 minutes (345 commuters, 11.2%), and less than 5 minutes (335 commuters, 10.9%).
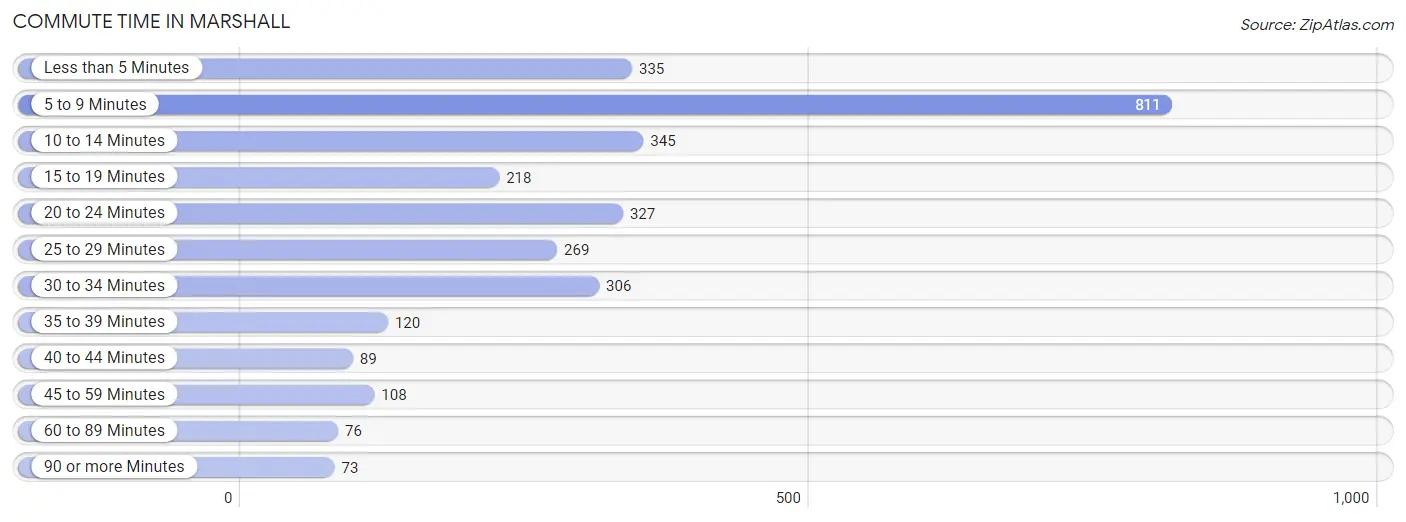
| Commute Time | # Commuters | % Commuters |
| Less than 5 Minutes | 335 | 10.9% |
| 5 to 9 Minutes | 811 | 26.4% |
| 10 to 14 Minutes | 345 | 11.2% |
| 15 to 19 Minutes | 218 | 7.1% |
| 20 to 24 Minutes | 327 | 10.6% |
| 25 to 29 Minutes | 269 | 8.7% |
| 30 to 34 Minutes | 306 | 9.9% |
| 35 to 39 Minutes | 120 | 3.9% |
| 40 to 44 Minutes | 89 | 2.9% |
| 45 to 59 Minutes | 108 | 3.5% |
| 60 to 89 Minutes | 76 | 2.5% |
| 90 or more Minutes | 73 | 2.4% |
Commute Time by Sex in Marshall
The most common commute times in Marshall are 5 to 9 minutes (238 commuters, 16.7%) for males and 5 to 9 minutes (573 commuters, 34.7%) for females.
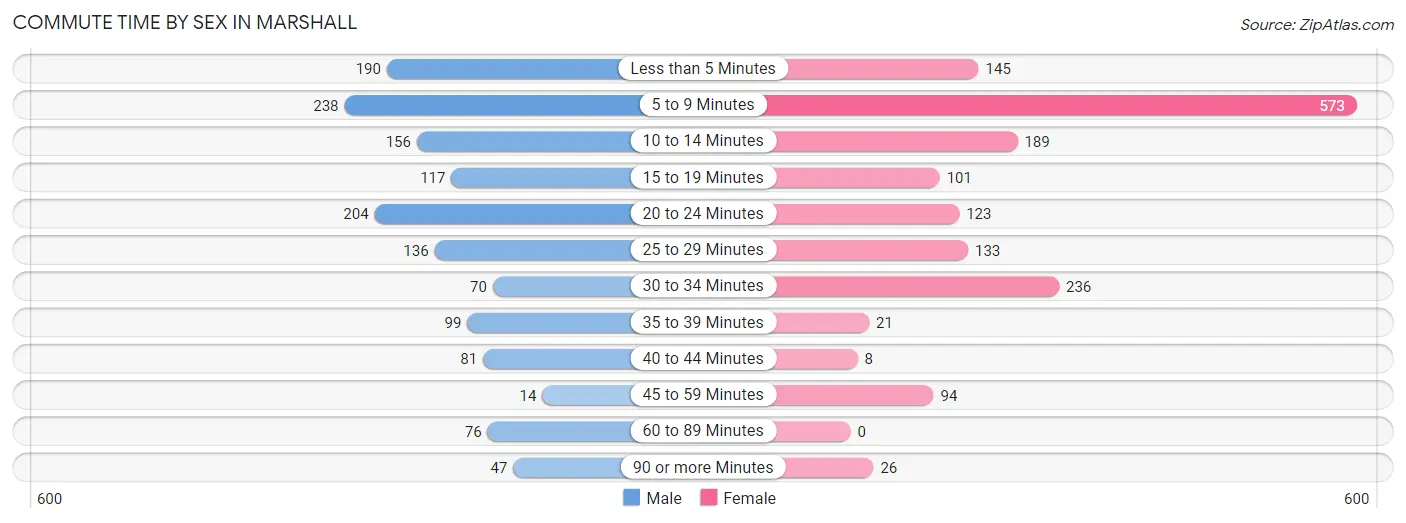
| Commute Time | Male | Female |
| Less than 5 Minutes | 190 (13.3%) | 145 (8.8%) |
| 5 to 9 Minutes | 238 (16.7%) | 573 (34.7%) |
| 10 to 14 Minutes | 156 (10.9%) | 189 (11.5%) |
| 15 to 19 Minutes | 117 (8.2%) | 101 (6.1%) |
| 20 to 24 Minutes | 204 (14.3%) | 123 (7.5%) |
| 25 to 29 Minutes | 136 (9.5%) | 133 (8.1%) |
| 30 to 34 Minutes | 70 (4.9%) | 236 (14.3%) |
| 35 to 39 Minutes | 99 (6.9%) | 21 (1.3%) |
| 40 to 44 Minutes | 81 (5.7%) | 8 (0.5%) |
| 45 to 59 Minutes | 14 (1.0%) | 94 (5.7%) |
| 60 to 89 Minutes | 76 (5.3%) | 0 (0.0%) |
| 90 or more Minutes | 47 (3.3%) | 26 (1.6%) |
Time of Departure to Work by Sex in Marshall
The most frequent times of departure to work in Marshall are 6:00 AM to 6:29 AM (244, 17.1%) for males and 6:30 AM to 6:59 AM (368, 22.3%) for females.
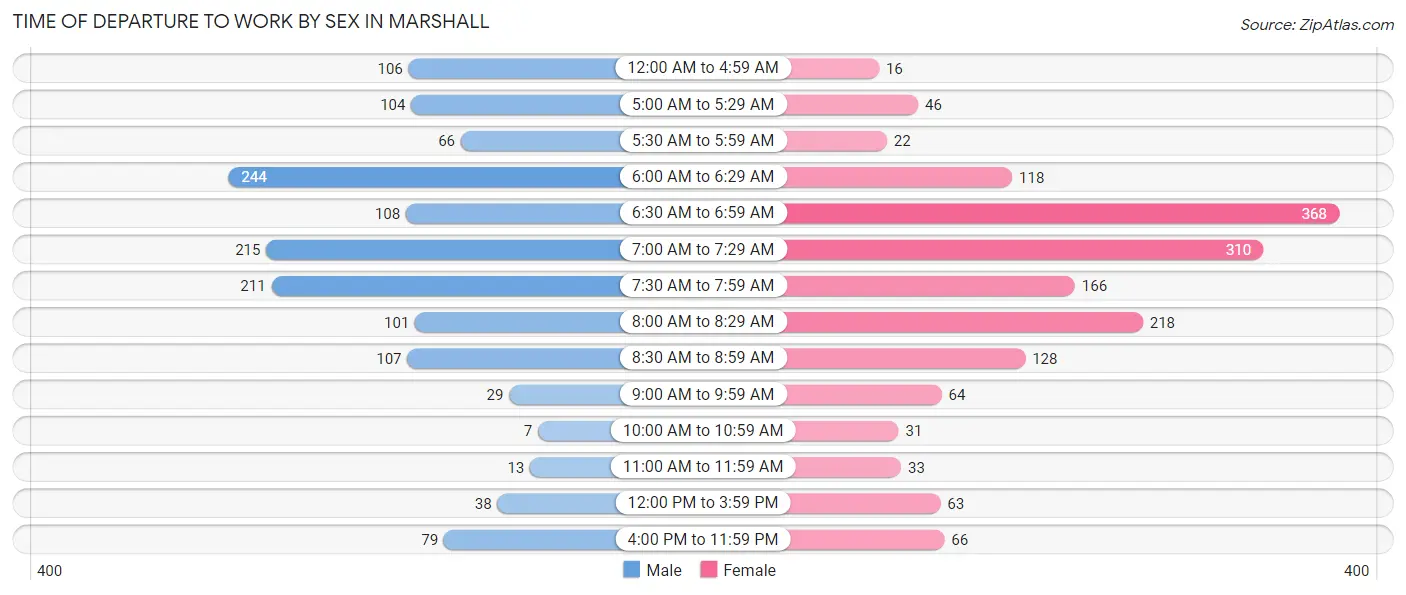
| Time of Departure | Male | Female |
| 12:00 AM to 4:59 AM | 106 (7.4%) | 16 (1.0%) |
| 5:00 AM to 5:29 AM | 104 (7.3%) | 46 (2.8%) |
| 5:30 AM to 5:59 AM | 66 (4.6%) | 22 (1.3%) |
| 6:00 AM to 6:29 AM | 244 (17.1%) | 118 (7.2%) |
| 6:30 AM to 6:59 AM | 108 (7.6%) | 368 (22.3%) |
| 7:00 AM to 7:29 AM | 215 (15.1%) | 310 (18.8%) |
| 7:30 AM to 7:59 AM | 211 (14.8%) | 166 (10.1%) |
| 8:00 AM to 8:29 AM | 101 (7.1%) | 218 (13.2%) |
| 8:30 AM to 8:59 AM | 107 (7.5%) | 128 (7.8%) |
| 9:00 AM to 9:59 AM | 29 (2.0%) | 64 (3.9%) |
| 10:00 AM to 10:59 AM | 7 (0.5%) | 31 (1.9%) |
| 11:00 AM to 11:59 AM | 13 (0.9%) | 33 (2.0%) |
| 12:00 PM to 3:59 PM | 38 (2.7%) | 63 (3.8%) |
| 4:00 PM to 11:59 PM | 79 (5.5%) | 66 (4.0%) |
| Total | 1,428 (100.0%) | 1,649 (100.0%) |
Housing Occupancy in Marshall
Occupancy by Ownership in Marshall
Of the total 3,119 dwellings in Marshall, owner-occupied units account for 2,162 (69.3%), while renter-occupied units make up 957 (30.7%).
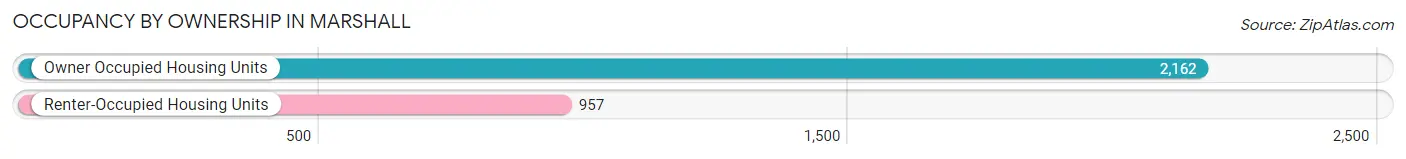
| Occupancy | # Housing Units | % Housing Units |
| Owner Occupied Housing Units | 2,162 | 69.3% |
| Renter-Occupied Housing Units | 957 | 30.7% |
| Total Occupied Housing Units | 3,119 | 100.0% |
Occupancy by Household Size in Marshall
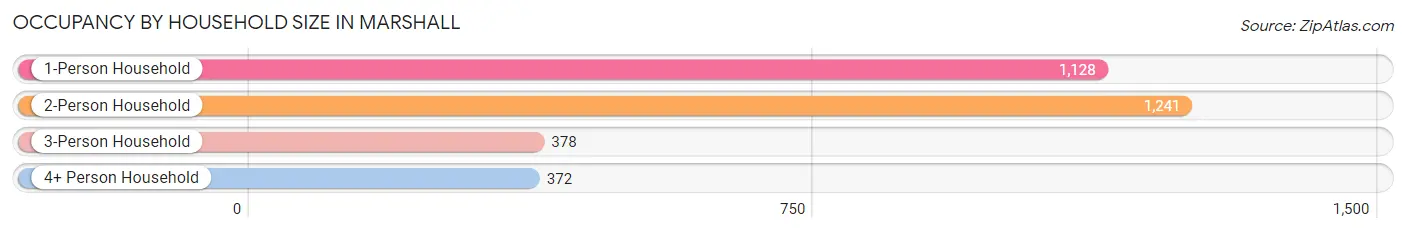
| Household Size | # Housing Units | % Housing Units |
| 1-Person Household | 1,128 | 36.2% |
| 2-Person Household | 1,241 | 39.8% |
| 3-Person Household | 378 | 12.1% |
| 4+ Person Household | 372 | 11.9% |
| Total Housing Units | 3,119 | 100.0% |
Occupancy by Ownership by Household Size in Marshall
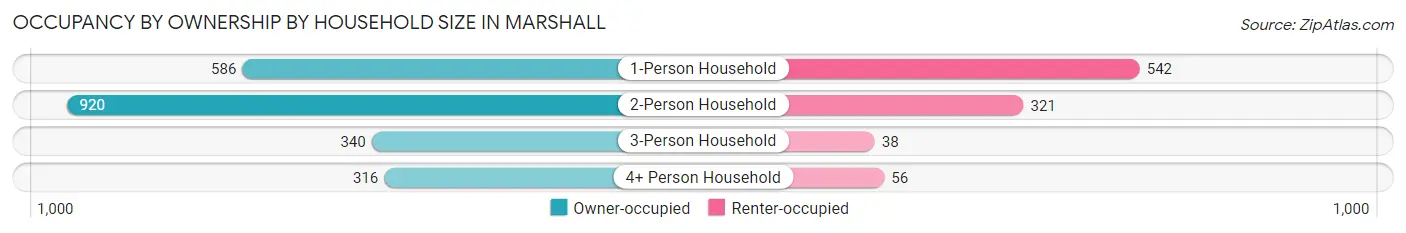
| Household Size | Owner-occupied | Renter-occupied |
| 1-Person Household | 586 (51.9%) | 542 (48.0%) |
| 2-Person Household | 920 (74.1%) | 321 (25.9%) |
| 3-Person Household | 340 (89.9%) | 38 (10.1%) |
| 4+ Person Household | 316 (85.0%) | 56 (15.0%) |
| Total Housing Units | 2,162 (69.3%) | 957 (30.7%) |
Occupancy by Educational Attainment in Marshall
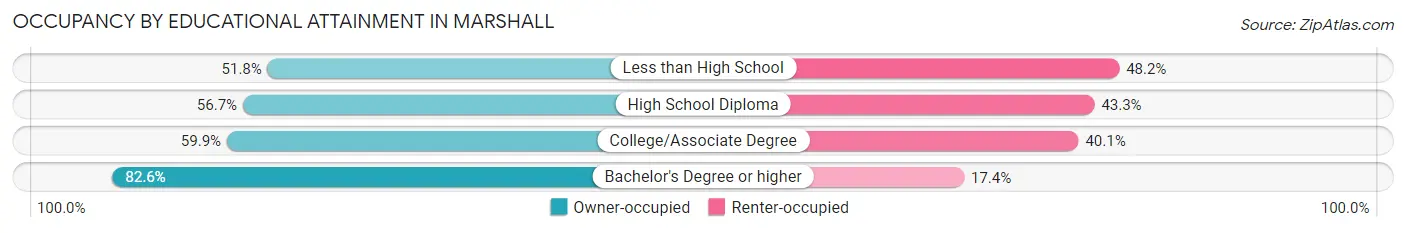
| Household Size | Owner-occupied | Renter-occupied |
| Less than High School | 71 (51.8%) | 66 (48.2%) |
| High School Diploma | 367 (56.7%) | 280 (43.3%) |
| College/Associate Degree | 539 (59.9%) | 361 (40.1%) |
| Bachelor's Degree or higher | 1,185 (82.6%) | 250 (17.4%) |
Occupancy by Age of Householder in Marshall
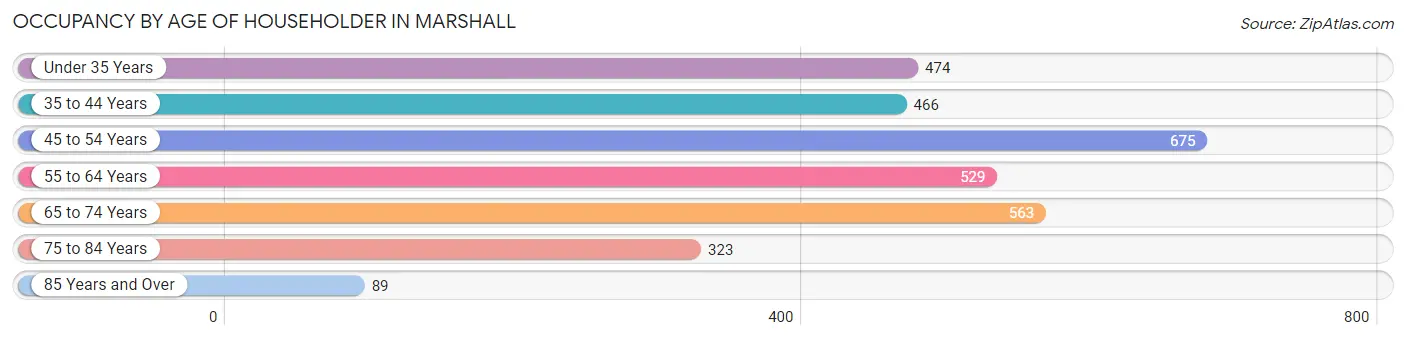
| Age Bracket | # Households | % Households |
| Under 35 Years | 474 | 15.2% |
| 35 to 44 Years | 466 | 14.9% |
| 45 to 54 Years | 675 | 21.6% |
| 55 to 64 Years | 529 | 17.0% |
| 65 to 74 Years | 563 | 18.0% |
| 75 to 84 Years | 323 | 10.4% |
| 85 Years and Over | 89 | 2.9% |
| Total | 3,119 | 100.0% |
Housing Finances in Marshall
Median Income by Occupancy in Marshall
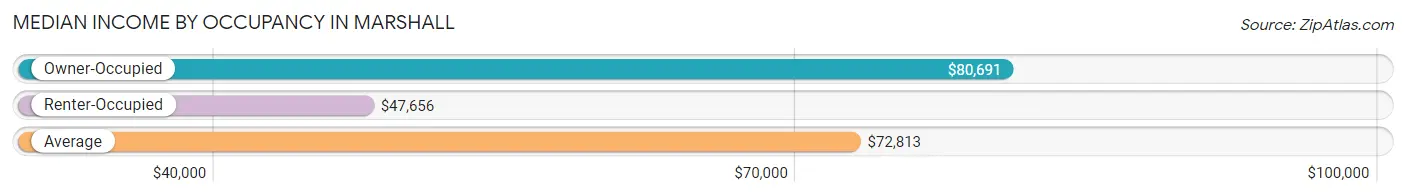
| Occupancy Type | # Households | Median Income |
| Owner-Occupied | 2,162 (69.3%) | $80,691 |
| Renter-Occupied | 957 (30.7%) | $47,656 |
| Average | 3,119 (100.0%) | $72,813 |
Occupancy by Householder Income Bracket in Marshall
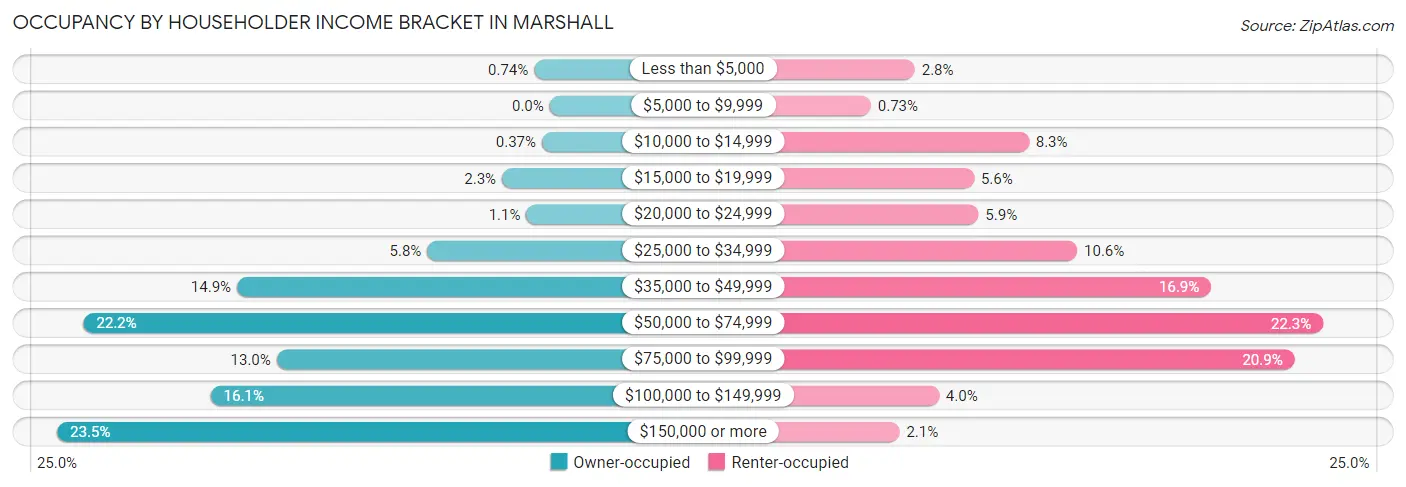
| Income Bracket | Owner-occupied | Renter-occupied |
| Less than $5,000 | 16 (0.7%) | 27 (2.8%) |
| $5,000 to $9,999 | 0 (0.0%) | 7 (0.7%) |
| $10,000 to $14,999 | 8 (0.4%) | 79 (8.3%) |
| $15,000 to $19,999 | 49 (2.3%) | 54 (5.6%) |
| $20,000 to $24,999 | 24 (1.1%) | 56 (5.9%) |
| $25,000 to $34,999 | 126 (5.8%) | 101 (10.5%) |
| $35,000 to $49,999 | 322 (14.9%) | 162 (16.9%) |
| $50,000 to $74,999 | 480 (22.2%) | 213 (22.3%) |
| $75,000 to $99,999 | 281 (13.0%) | 200 (20.9%) |
| $100,000 to $149,999 | 349 (16.1%) | 38 (4.0%) |
| $150,000 or more | 507 (23.4%) | 20 (2.1%) |
| Total | 2,162 (100.0%) | 957 (100.0%) |
Monthly Housing Cost Tiers in Marshall
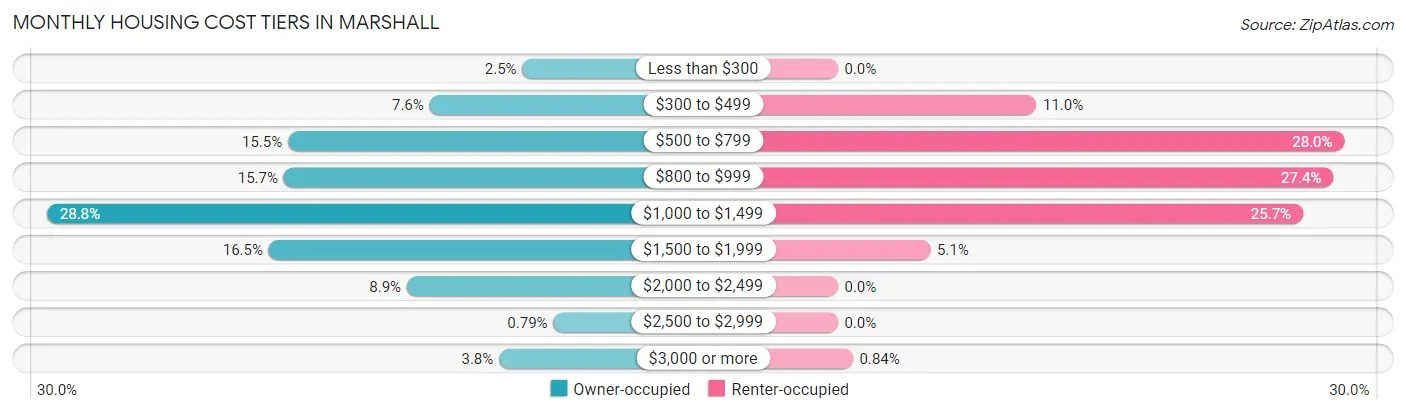
| Monthly Cost | Owner-occupied | Renter-occupied |
| Less than $300 | 54 (2.5%) | 0 (0.0%) |
| $300 to $499 | 165 (7.6%) | 105 (11.0%) |
| $500 to $799 | 334 (15.4%) | 268 (28.0%) |
| $800 to $999 | 339 (15.7%) | 262 (27.4%) |
| $1,000 to $1,499 | 622 (28.8%) | 246 (25.7%) |
| $1,500 to $1,999 | 357 (16.5%) | 49 (5.1%) |
| $2,000 to $2,499 | 192 (8.9%) | 0 (0.0%) |
| $2,500 to $2,999 | 17 (0.8%) | 0 (0.0%) |
| $3,000 or more | 82 (3.8%) | 8 (0.8%) |
| Total | 2,162 (100.0%) | 957 (100.0%) |
Physical Housing Characteristics in Marshall
Housing Structures in Marshall
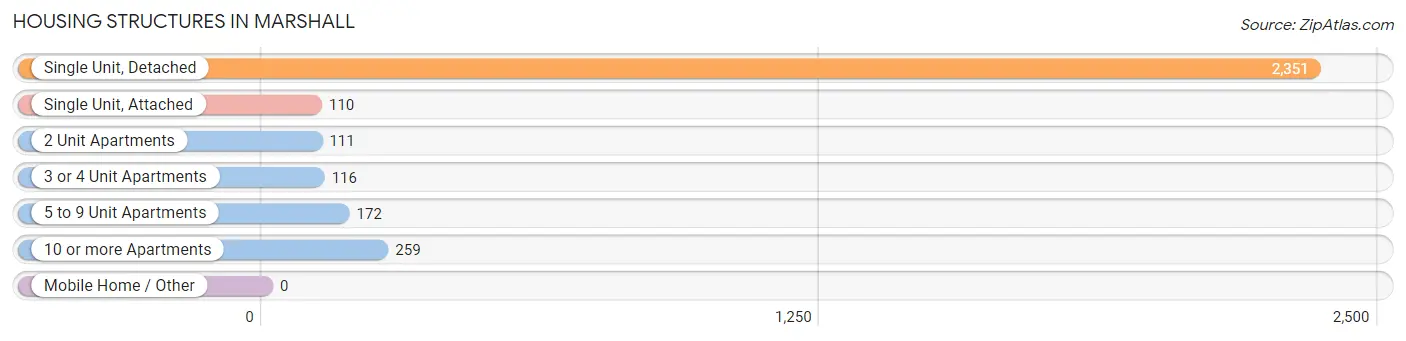
| Structure Type | # Housing Units | % Housing Units |
| Single Unit, Detached | 2,351 | 75.4% |
| Single Unit, Attached | 110 | 3.5% |
| 2 Unit Apartments | 111 | 3.6% |
| 3 or 4 Unit Apartments | 116 | 3.7% |
| 5 to 9 Unit Apartments | 172 | 5.5% |
| 10 or more Apartments | 259 | 8.3% |
| Mobile Home / Other | 0 | 0.0% |
| Total | 3,119 | 100.0% |
Housing Structures by Occupancy in Marshall
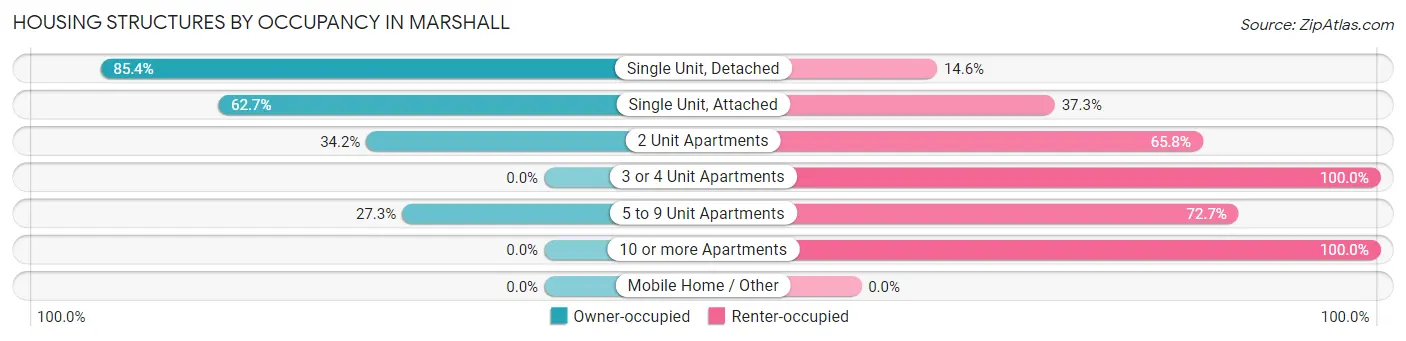
| Structure Type | Owner-occupied | Renter-occupied |
| Single Unit, Detached | 2,008 (85.4%) | 343 (14.6%) |
| Single Unit, Attached | 69 (62.7%) | 41 (37.3%) |
| 2 Unit Apartments | 38 (34.2%) | 73 (65.8%) |
| 3 or 4 Unit Apartments | 0 (0.0%) | 116 (100.0%) |
| 5 to 9 Unit Apartments | 47 (27.3%) | 125 (72.7%) |
| 10 or more Apartments | 0 (0.0%) | 259 (100.0%) |
| Mobile Home / Other | 0 (0.0%) | 0 (0.0%) |
| Total | 2,162 (69.3%) | 957 (30.7%) |
Housing Structures by Number of Rooms in Marshall
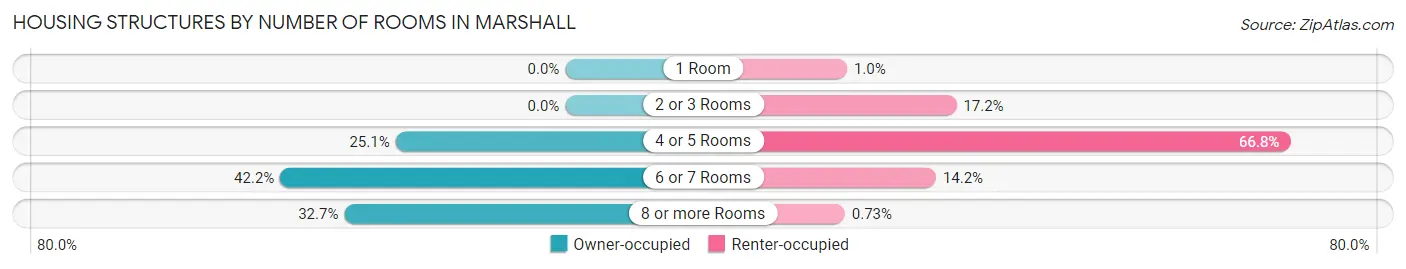
| Number of Rooms | Owner-occupied | Renter-occupied |
| 1 Room | 0 (0.0%) | 10 (1.0%) |
| 2 or 3 Rooms | 0 (0.0%) | 165 (17.2%) |
| 4 or 5 Rooms | 543 (25.1%) | 639 (66.8%) |
| 6 or 7 Rooms | 912 (42.2%) | 136 (14.2%) |
| 8 or more Rooms | 707 (32.7%) | 7 (0.7%) |
| Total | 2,162 (100.0%) | 957 (100.0%) |
Housing Structure by Heating Type in Marshall
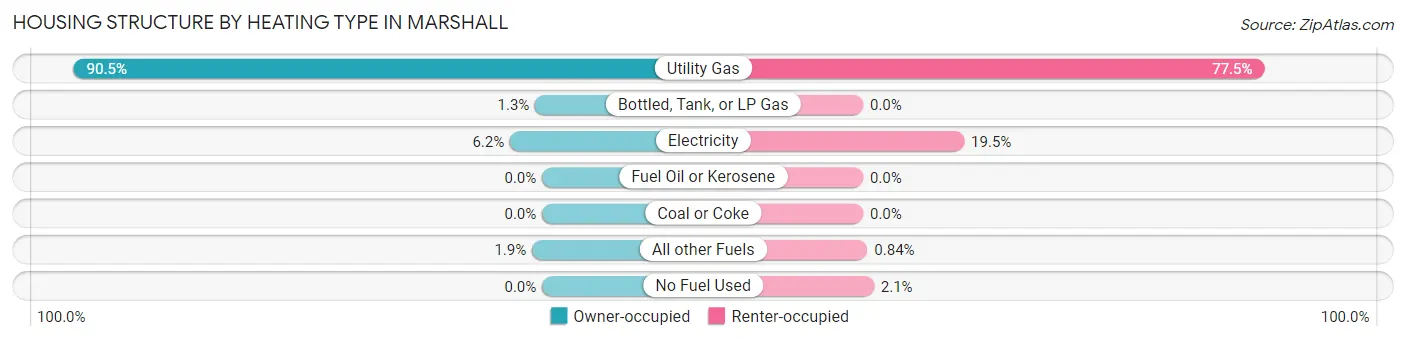
| Heating Type | Owner-occupied | Renter-occupied |
| Utility Gas | 1,957 (90.5%) | 742 (77.5%) |
| Bottled, Tank, or LP Gas | 29 (1.3%) | 0 (0.0%) |
| Electricity | 134 (6.2%) | 187 (19.5%) |
| Fuel Oil or Kerosene | 0 (0.0%) | 0 (0.0%) |
| Coal or Coke | 0 (0.0%) | 0 (0.0%) |
| All other Fuels | 42 (1.9%) | 8 (0.8%) |
| No Fuel Used | 0 (0.0%) | 20 (2.1%) |
| Total | 2,162 (100.0%) | 957 (100.0%) |
Household Vehicle Usage in Marshall
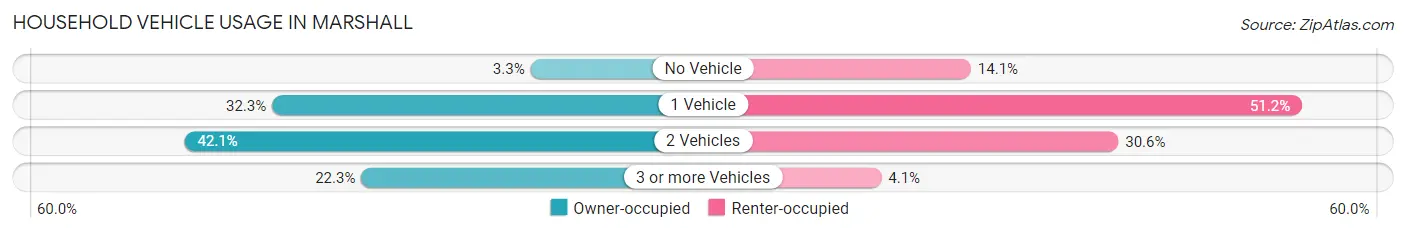
| Vehicles per Household | Owner-occupied | Renter-occupied |
| No Vehicle | 72 (3.3%) | 135 (14.1%) |
| 1 Vehicle | 698 (32.3%) | 490 (51.2%) |
| 2 Vehicles | 910 (42.1%) | 293 (30.6%) |
| 3 or more Vehicles | 482 (22.3%) | 39 (4.1%) |
| Total | 2,162 (100.0%) | 957 (100.0%) |
Real Estate & Mortgages in Marshall
Real Estate and Mortgage Overview in Marshall
| Characteristic | Without Mortgage | With Mortgage |
| Housing Units | 634 | 1,528 |
| Median Property Value | $157,100 | $159,100 |
| Median Household Income | $68,839 | $406 |
| Monthly Housing Costs | $638 | $76 |
| Real Estate Taxes | $3,367 | $11 |
Property Value by Mortgage Status in Marshall
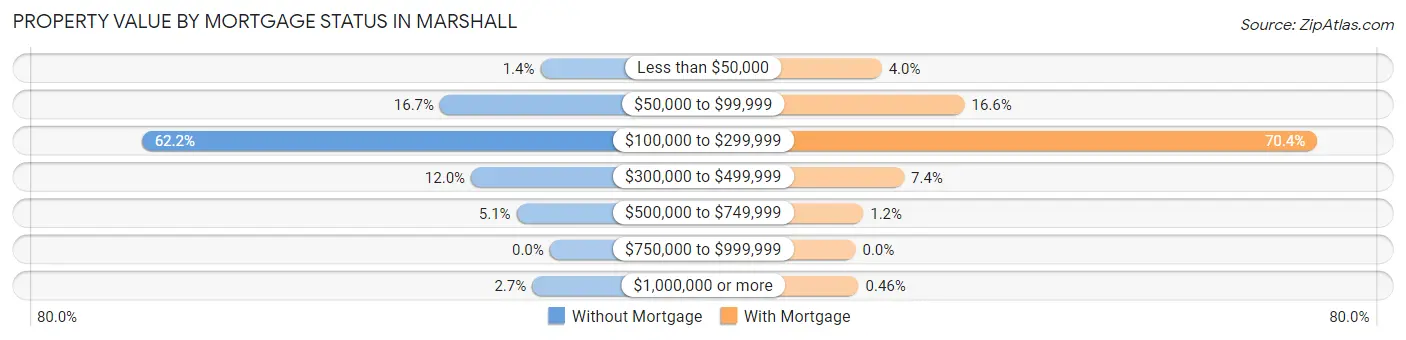
| Property Value | Without Mortgage | With Mortgage |
| Less than $50,000 | 9 (1.4%) | 61 (4.0%) |
| $50,000 to $99,999 | 106 (16.7%) | 254 (16.6%) |
| $100,000 to $299,999 | 394 (62.2%) | 1,075 (70.4%) |
| $300,000 to $499,999 | 76 (12.0%) | 113 (7.4%) |
| $500,000 to $749,999 | 32 (5.1%) | 18 (1.2%) |
| $750,000 to $999,999 | 0 (0.0%) | 0 (0.0%) |
| $1,000,000 or more | 17 (2.7%) | 7 (0.5%) |
| Total | 634 (100.0%) | 1,528 (100.0%) |
Household Income by Mortgage Status in Marshall
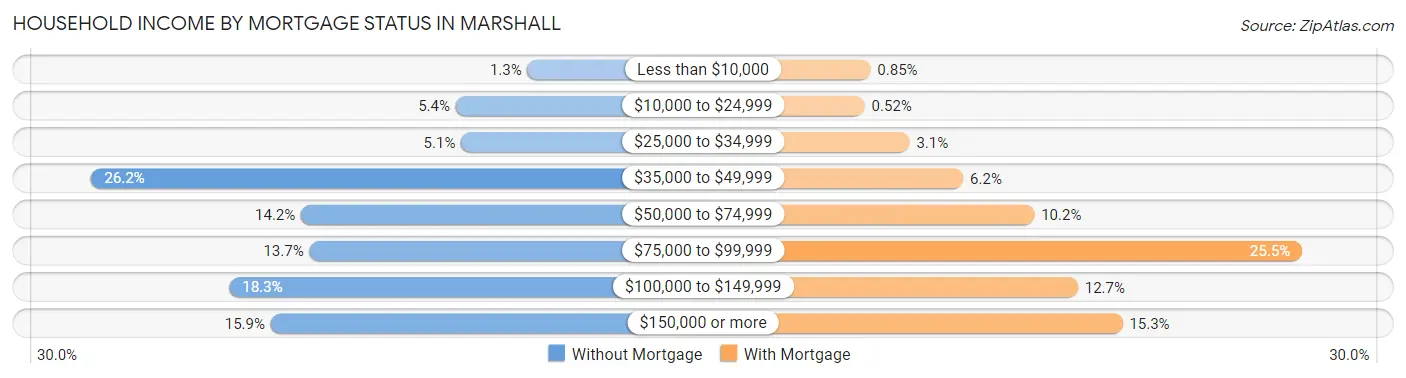
| Household Income | Without Mortgage | With Mortgage |
| Less than $10,000 | 8 (1.3%) | 13 (0.9%) |
| $10,000 to $24,999 | 34 (5.4%) | 8 (0.5%) |
| $25,000 to $34,999 | 32 (5.1%) | 47 (3.1%) |
| $35,000 to $49,999 | 166 (26.2%) | 94 (6.1%) |
| $50,000 to $74,999 | 90 (14.2%) | 156 (10.2%) |
| $75,000 to $99,999 | 87 (13.7%) | 390 (25.5%) |
| $100,000 to $149,999 | 116 (18.3%) | 194 (12.7%) |
| $150,000 or more | 101 (15.9%) | 233 (15.2%) |
| Total | 634 (100.0%) | 1,528 (100.0%) |
Property Value to Household Income Ratio in Marshall
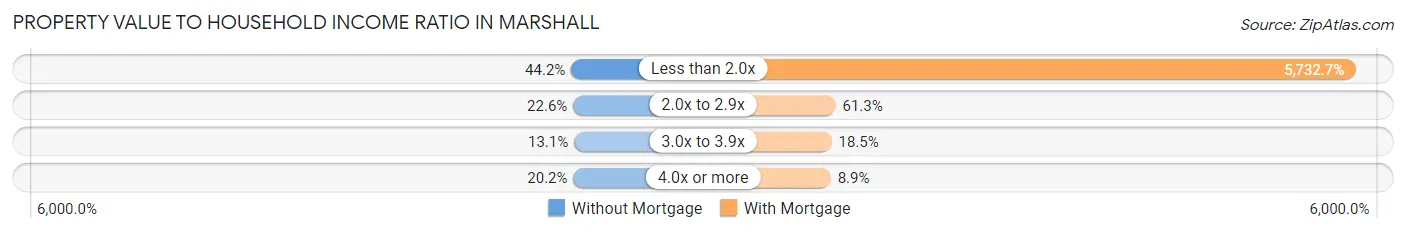
| Value-to-Income Ratio | Without Mortgage | With Mortgage |
| Less than 2.0x | 280 (44.2%) | 87,596 (5,732.7%) |
| 2.0x to 2.9x | 143 (22.6%) | 936 (61.3%) |
| 3.0x to 3.9x | 83 (13.1%) | 283 (18.5%) |
| 4.0x or more | 128 (20.2%) | 136 (8.9%) |
| Total | 634 (100.0%) | 1,528 (100.0%) |
Real Estate Taxes by Mortgage Status in Marshall
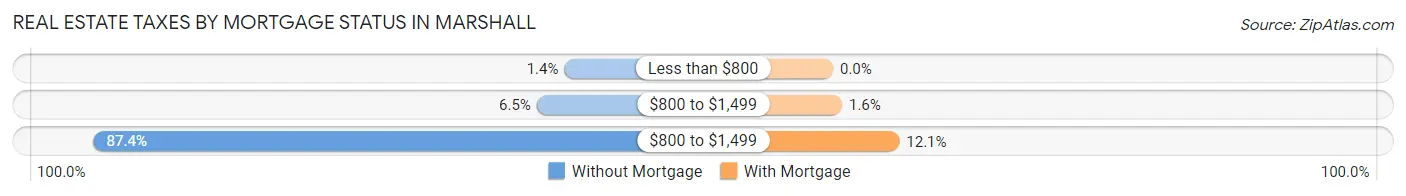
| Property Taxes | Without Mortgage | With Mortgage |
| Less than $800 | 9 (1.4%) | 0 (0.0%) |
| $800 to $1,499 | 41 (6.5%) | 25 (1.6%) |
| $800 to $1,499 | 554 (87.4%) | 185 (12.1%) |
| Total | 634 (100.0%) | 1,528 (100.0%) |
Health & Disability in Marshall
Health Insurance Coverage by Age in Marshall
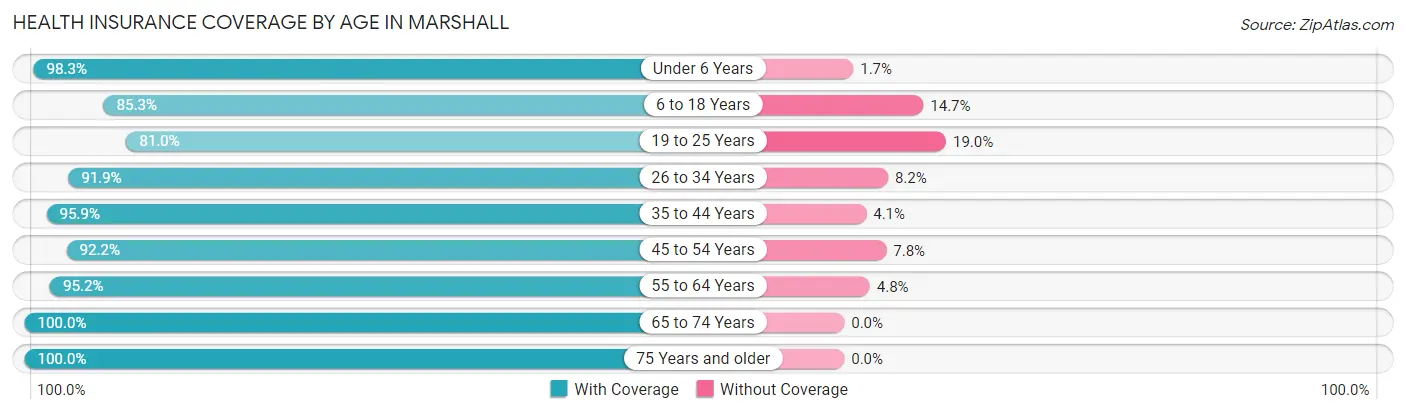
| Age Bracket | With Coverage | Without Coverage |
| Under 6 Years | 351 (98.3%) | 6 (1.7%) |
| 6 to 18 Years | 833 (85.3%) | 144 (14.7%) |
| 19 to 25 Years | 367 (81.0%) | 86 (19.0%) |
| 26 to 34 Years | 699 (91.8%) | 62 (8.2%) |
| 35 to 44 Years | 772 (95.9%) | 33 (4.1%) |
| 45 to 54 Years | 894 (92.2%) | 76 (7.8%) |
| 55 to 64 Years | 898 (95.2%) | 45 (4.8%) |
| 65 to 74 Years | 880 (100.0%) | 0 (0.0%) |
| 75 Years and older | 562 (100.0%) | 0 (0.0%) |
| Total | 6,256 (93.3%) | 452 (6.7%) |
Health Insurance Coverage by Citizenship Status in Marshall
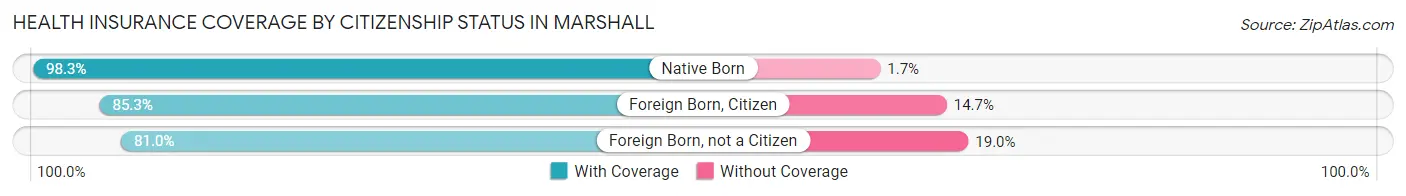
| Citizenship Status | With Coverage | Without Coverage |
| Native Born | 351 (98.3%) | 6 (1.7%) |
| Foreign Born, Citizen | 833 (85.3%) | 144 (14.7%) |
| Foreign Born, not a Citizen | 367 (81.0%) | 86 (19.0%) |
Health Insurance Coverage by Household Income in Marshall
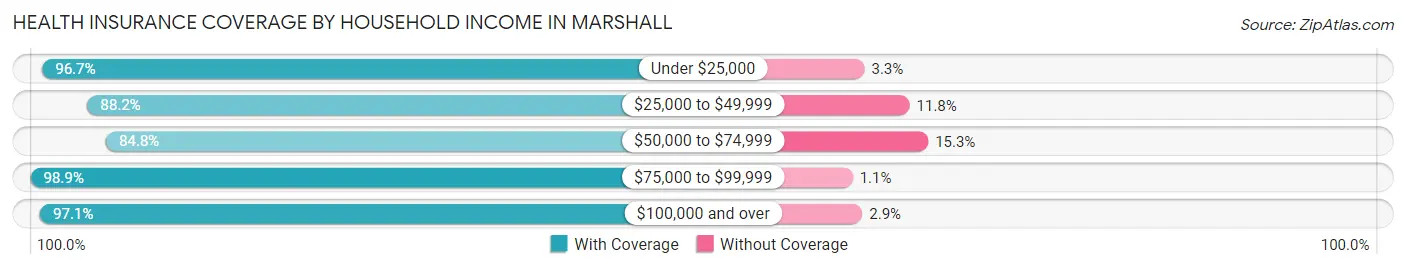
| Household Income | With Coverage | Without Coverage |
| Under $25,000 | 495 (96.7%) | 17 (3.3%) |
| $25,000 to $49,999 | 1,117 (88.2%) | 149 (11.8%) |
| $50,000 to $74,999 | 1,095 (84.8%) | 197 (15.2%) |
| $75,000 to $99,999 | 893 (98.9%) | 10 (1.1%) |
| $100,000 and over | 2,637 (97.1%) | 79 (2.9%) |
Public vs Private Health Insurance Coverage by Age in Marshall
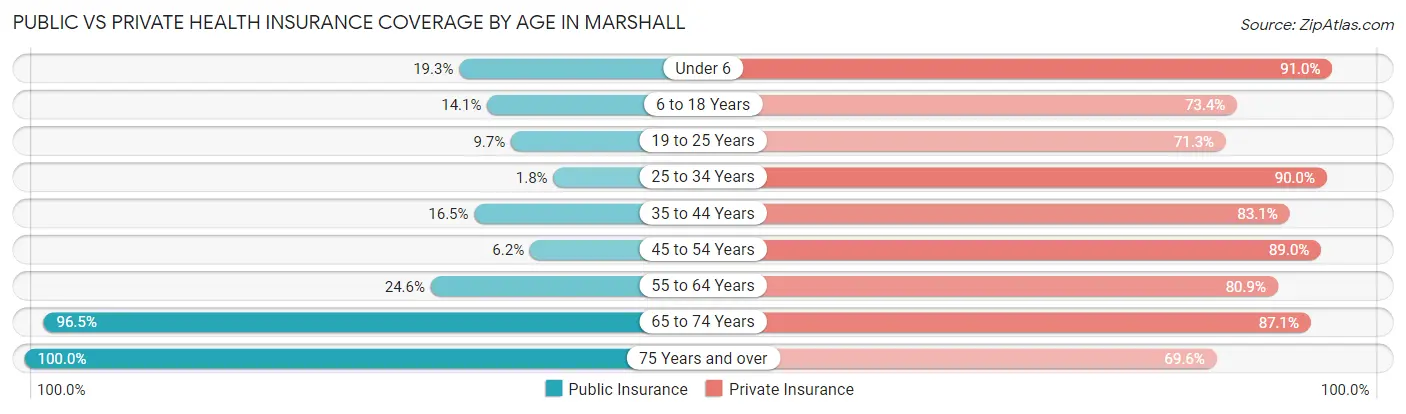
| Age Bracket | Public Insurance | Private Insurance |
| Under 6 | 69 (19.3%) | 325 (91.0%) |
| 6 to 18 Years | 138 (14.1%) | 717 (73.4%) |
| 19 to 25 Years | 44 (9.7%) | 323 (71.3%) |
| 25 to 34 Years | 14 (1.8%) | 685 (90.0%) |
| 35 to 44 Years | 133 (16.5%) | 669 (83.1%) |
| 45 to 54 Years | 60 (6.2%) | 863 (89.0%) |
| 55 to 64 Years | 232 (24.6%) | 763 (80.9%) |
| 65 to 74 Years | 849 (96.5%) | 766 (87.1%) |
| 75 Years and over | 562 (100.0%) | 391 (69.6%) |
| Total | 2,101 (31.3%) | 5,502 (82.0%) |
Disability Status by Sex by Age in Marshall
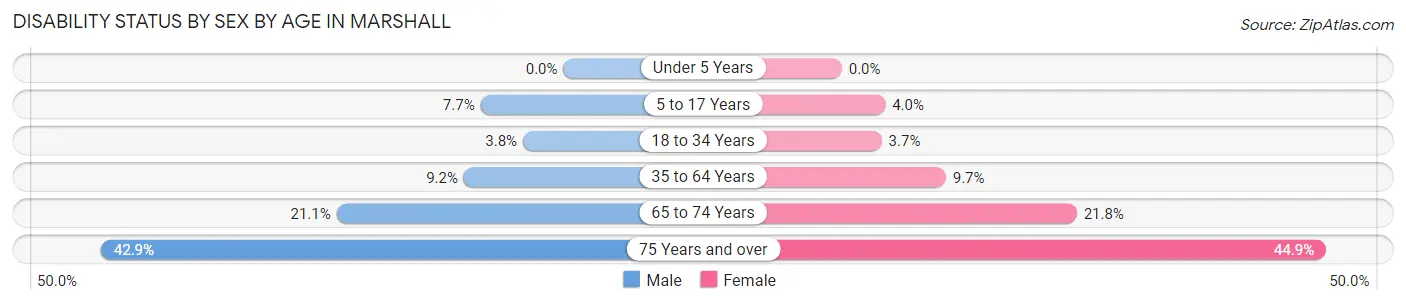
| Age Bracket | Male | Female |
| Under 5 Years | 0 (0.0%) | 0 (0.0%) |
| 5 to 17 Years | 38 (7.7%) | 19 (4.0%) |
| 18 to 34 Years | 26 (3.7%) | 22 (3.7%) |
| 35 to 64 Years | 118 (9.2%) | 139 (9.7%) |
| 65 to 74 Years | 80 (21.0%) | 109 (21.8%) |
| 75 Years and over | 97 (42.9%) | 151 (44.9%) |
Disability Class by Sex by Age in Marshall
Disability Class: Hearing Difficulty
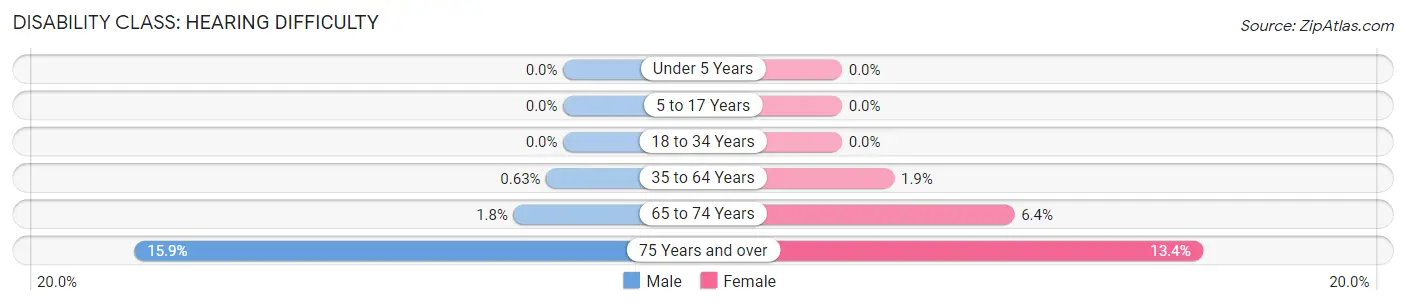
| Age Bracket | Male | Female |
| Under 5 Years | 0 (0.0%) | 0 (0.0%) |
| 5 to 17 Years | 0 (0.0%) | 0 (0.0%) |
| 18 to 34 Years | 0 (0.0%) | 0 (0.0%) |
| 35 to 64 Years | 8 (0.6%) | 28 (1.9%) |
| 65 to 74 Years | 7 (1.8%) | 32 (6.4%) |
| 75 Years and over | 36 (15.9%) | 45 (13.4%) |
Disability Class: Vision Difficulty
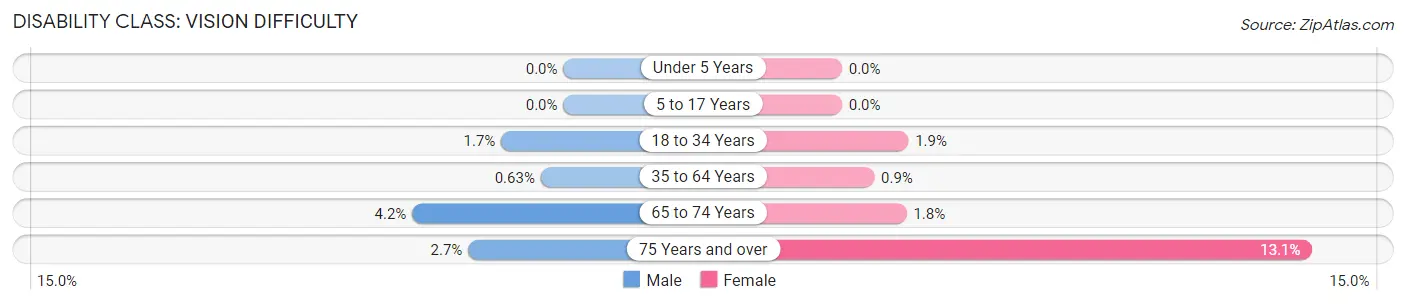
| Age Bracket | Male | Female |
| Under 5 Years | 0 (0.0%) | 0 (0.0%) |
| 5 to 17 Years | 0 (0.0%) | 0 (0.0%) |
| 18 to 34 Years | 12 (1.7%) | 11 (1.8%) |
| 35 to 64 Years | 8 (0.6%) | 13 (0.9%) |
| 65 to 74 Years | 16 (4.2%) | 9 (1.8%) |
| 75 Years and over | 6 (2.6%) | 44 (13.1%) |
Disability Class: Cognitive Difficulty
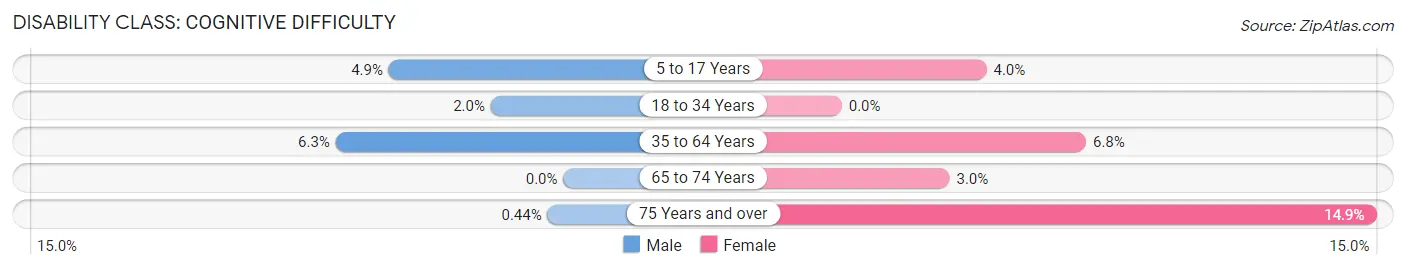
| Age Bracket | Male | Female |
| 5 to 17 Years | 24 (4.9%) | 19 (4.0%) |
| 18 to 34 Years | 14 (2.0%) | 0 (0.0%) |
| 35 to 64 Years | 81 (6.3%) | 98 (6.8%) |
| 65 to 74 Years | 0 (0.0%) | 15 (3.0%) |
| 75 Years and over | 1 (0.4%) | 50 (14.9%) |
Disability Class: Ambulatory Difficulty
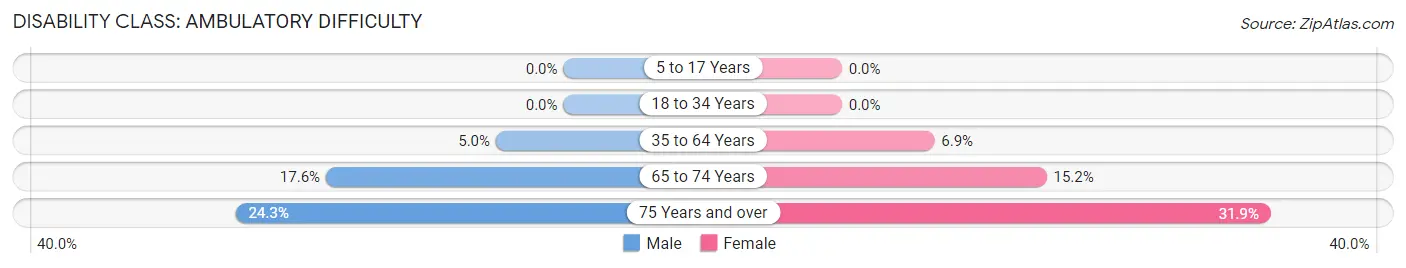
| Age Bracket | Male | Female |
| 5 to 17 Years | 0 (0.0%) | 0 (0.0%) |
| 18 to 34 Years | 0 (0.0%) | 0 (0.0%) |
| 35 to 64 Years | 64 (5.0%) | 99 (6.9%) |
| 65 to 74 Years | 67 (17.6%) | 76 (15.2%) |
| 75 Years and over | 55 (24.3%) | 107 (31.9%) |
Disability Class: Self-Care Difficulty
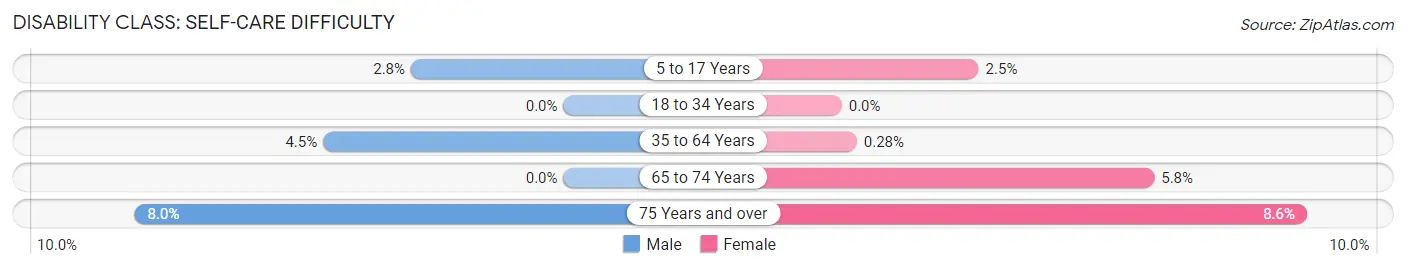
| Age Bracket | Male | Female |
| 5 to 17 Years | 14 (2.8%) | 12 (2.5%) |
| 18 to 34 Years | 0 (0.0%) | 0 (0.0%) |
| 35 to 64 Years | 57 (4.5%) | 4 (0.3%) |
| 65 to 74 Years | 0 (0.0%) | 29 (5.8%) |
| 75 Years and over | 18 (8.0%) | 29 (8.6%) |
Technology Access in Marshall
Computing Device Access in Marshall
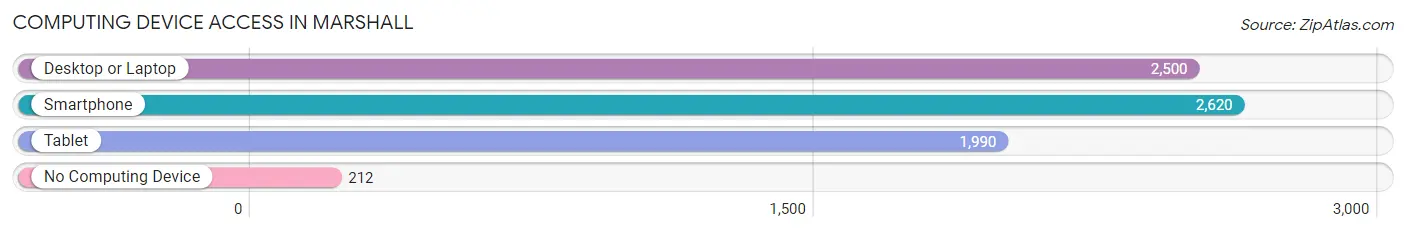
| Device Type | # Households | % Households |
| Desktop or Laptop | 2,500 | 80.1% |
| Smartphone | 2,620 | 84.0% |
| Tablet | 1,990 | 63.8% |
| No Computing Device | 212 | 6.8% |
| Total | 3,119 | 100.0% |
Internet Access in Marshall
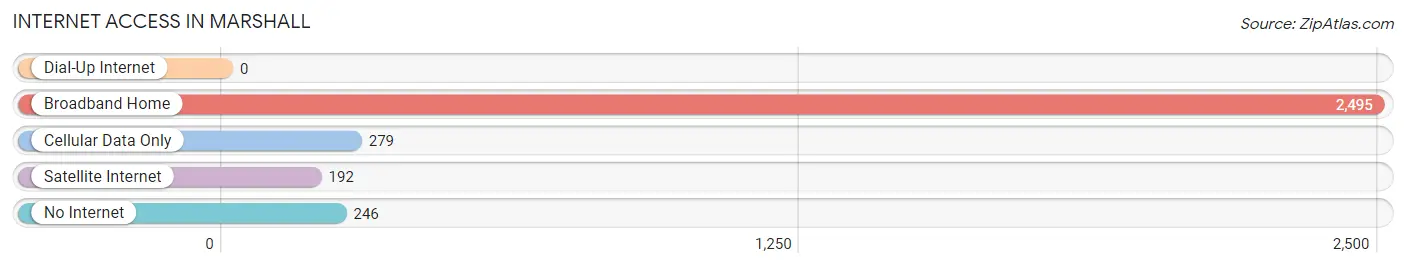
| Internet Type | # Households | % Households |
| Dial-Up Internet | 0 | 0.0% |
| Broadband Home | 2,495 | 80.0% |
| Cellular Data Only | 279 | 8.9% |
| Satellite Internet | 192 | 6.2% |
| No Internet | 246 | 7.9% |
| Total | 3,119 | 100.0% |
Marshall Summary
Marshall, Michigan is a city located in the south-central region of the state, in Calhoun County. It is situated along the Kalamazoo River, approximately 25 miles east of Kalamazoo and 40 miles west of Battle Creek. The city is home to a population of approximately 7,000 people, and is the county seat of Calhoun County.
History
Marshall was founded in 1835 by a group of settlers from New York, led by Chief Justice Augustus B. Woodward. The city was named after Chief Justice John Marshall, who served on the Supreme Court from 1801 to 1835. The city was incorporated in 1838, and was designated as the county seat of Calhoun County in 1839.
In the mid-19th century, Marshall was a major stop on the Underground Railroad, with many of the city's residents providing shelter and assistance to escaped slaves. The city was also home to a number of prominent abolitionists, including the Reverend John Rankin and the Reverend Lewis Tappan.
In the late 19th century, Marshall became a major industrial center, with a number of factories and mills located in the city. The city was also home to a number of prominent businesses, including the Marshall Carriage Company, the Marshall Foundry, and the Marshall Brewing Company.
Geography
Marshall is located in south-central Michigan, in Calhoun County. The city is situated along the Kalamazoo River, approximately 25 miles east of Kalamazoo and 40 miles west of Battle Creek. The city is located in a predominantly rural area, with a number of small towns and villages located in the surrounding area.
The city has a total area of 4.2 square miles, of which 4.1 square miles is land and 0.1 square miles is water. The city is located at an elevation of 845 feet above sea level.
Economy
Marshall's economy is largely based on manufacturing and agriculture. The city is home to a number of factories and mills, including the Marshall Foundry, the Marshall Carriage Company, and the Marshall Brewing Company. The city is also home to a number of agricultural businesses, including dairy farms, fruit orchards, and vegetable farms.
The city is also home to a number of retail businesses, including a number of antique stores, specialty shops, and restaurants. The city is also home to a number of professional services, including law firms, accounting firms, and medical offices.
Demographics
As of the 2010 census, the city of Marshall had a population of 7,088 people. The racial makeup of the city was 94.3% White, 2.2% African American, 0.7% Native American, 0.5% Asian, 0.1% Pacific Islander, 0.7% from other races, and 1.5% from two or more races. Hispanic or Latino of any race were 2.3% of the population.
The median household income in Marshall was $41,944, and the median family income was $50,919. The per capita income in the city was $20,945. Approximately 16.3% of the population was below the poverty line.
Common Questions
What is Per Capita Income in Marshall?
Per Capita income in Marshall is $46,004.
What is the Median Family Income in Marshall?
Median Family Income in Marshall is $90,741.
What is the Median Household income in Marshall?
Median Household Income in Marshall is $72,813.
What is Income or Wage Gap in Marshall?
Income or Wage Gap in Marshall is 10.9%.
Women in Marshall earn 89.1 cents for every dollar earned by a man.
What is Inequality or Gini Index in Marshall?
Inequality or Gini Index in Marshall is 0.45.
What is the Total Population of Marshall?
Total Population of Marshall is 6,806.
What is the Total Male Population of Marshall?
Total Male Population of Marshall is 3,253.
What is the Total Female Population of Marshall?
Total Female Population of Marshall is 3,553.
What is the Ratio of Males per 100 Females in Marshall?
There are 91.56 Males per 100 Females in Marshall.
What is the Ratio of Females per 100 Males in Marshall?
There are 109.22 Females per 100 Males in Marshall.
What is the Median Population Age in Marshall?
Median Population Age in Marshall is 45.4 Years.
What is the Average Family Size in Marshall
Average Family Size in Marshall is 2.8 People.
What is the Average Household Size in Marshall
Average Household Size in Marshall is 2.1 People.
How Large is the Labor Force in Marshall?
There are 3,646 People in the Labor Forcein in Marshall.
What is the Percentage of People in the Labor Force in Marshall?
64.3% of People are in the Labor Force in Marshall.
What is the Unemployment Rate in Marshall?
Unemployment Rate in Marshall is 7.2%.