Lowell, MI Map & Demographics
Lowell Map
Lowell Overview
$29,394
PER CAPITA INCOME
$76,698
AVG FAMILY INCOME
$59,712
AVG HOUSEHOLD INCOME
33.0%
WAGE / INCOME GAP [ % ]
67.0¢/ $1
WAGE / INCOME GAP [ $ ]
0.41
INEQUALITY / GINI INDEX
4,127
TOTAL POPULATION
2,067
MALE POPULATION
2,060
FEMALE POPULATION
100.34
MALES / 100 FEMALES
99.66
FEMALES / 100 MALES
38.3
MEDIAN AGE
2.9
AVG FAMILY SIZE
2.4
AVG HOUSEHOLD SIZE
1,886
LABOR FORCE [ PEOPLE ]
59.4%
PERCENT IN LABOR FORCE
2.0%
UNEMPLOYMENT RATE
Lowell Zip Codes
Lowell Area Codes
Income in Lowell
Income Overview in Lowell
Per Capita Income in Lowell is $29,394, while median incomes of families and households are $76,698 and $59,712 respectively.
| Characteristic | Number | Measure |
| Per Capita Income | 4,127 | $29,394 |
| Median Family Income | 1,082 | $76,698 |
| Mean Family Income | 1,082 | $88,847 |
| Median Household Income | 1,683 | $59,712 |
| Mean Household Income | 1,683 | $71,593 |
| Income Deficit | 1,082 | $0 |
| Wage / Income Gap (%) | 4,127 | 32.97% |
| Wage / Income Gap ($) | 4,127 | 67.03¢ per $1 |
| Gini / Inequality Index | 4,127 | 0.41 |
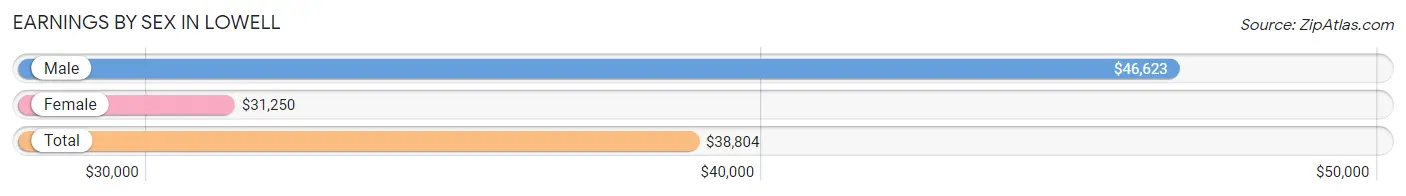
Earnings by Sex in Lowell
Average Earnings in Lowell are $38,804, $46,623 for men and $31,250 for women, a difference of 33.0%.
| Sex | Number | Average Earnings |
| Male | 1,014 (51.4%) | $46,623 |
| Female | 959 (48.6%) | $31,250 |
| Total | 1,973 (100.0%) | $38,804 |
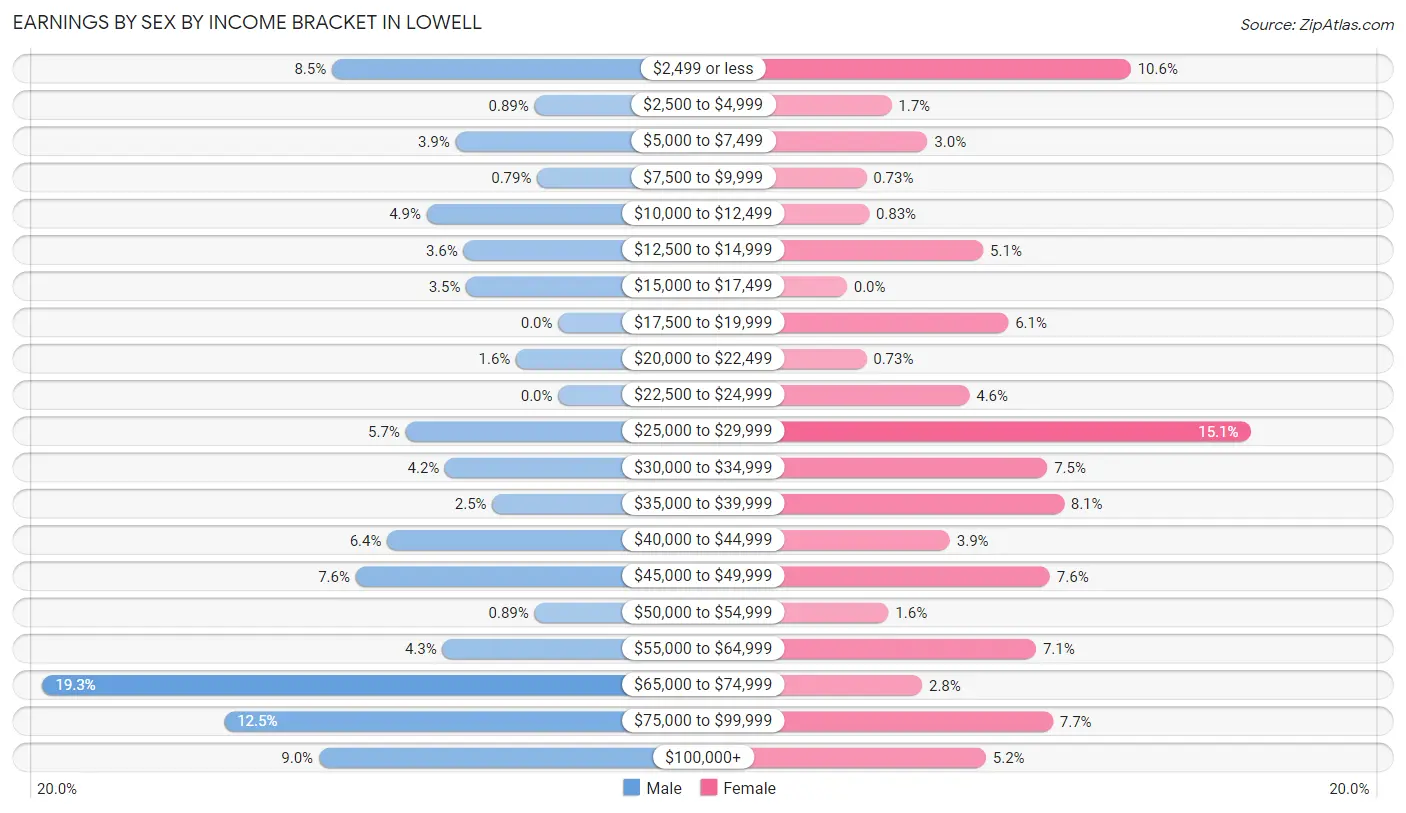
Earnings by Sex by Income Bracket in Lowell
The most common earnings brackets in Lowell are $65,000 to $74,999 for men (196 | 19.3%) and $25,000 to $29,999 for women (145 | 15.1%).
| Income | Male | Female |
| $2,499 or less | 86 (8.5%) | 102 (10.6%) |
| $2,500 to $4,999 | 9 (0.9%) | 16 (1.7%) |
| $5,000 to $7,499 | 39 (3.8%) | 29 (3.0%) |
| $7,500 to $9,999 | 8 (0.8%) | 7 (0.7%) |
| $10,000 to $12,499 | 50 (4.9%) | 8 (0.8%) |
| $12,500 to $14,999 | 36 (3.5%) | 49 (5.1%) |
| $15,000 to $17,499 | 35 (3.5%) | 0 (0.0%) |
| $17,500 to $19,999 | 0 (0.0%) | 58 (6.0%) |
| $20,000 to $22,499 | 16 (1.6%) | 7 (0.7%) |
| $22,500 to $24,999 | 0 (0.0%) | 44 (4.6%) |
| $25,000 to $29,999 | 58 (5.7%) | 145 (15.1%) |
| $30,000 to $34,999 | 43 (4.2%) | 72 (7.5%) |
| $35,000 to $39,999 | 25 (2.5%) | 78 (8.1%) |
| $40,000 to $44,999 | 65 (6.4%) | 37 (3.9%) |
| $45,000 to $49,999 | 77 (7.6%) | 73 (7.6%) |
| $50,000 to $54,999 | 9 (0.9%) | 15 (1.6%) |
| $55,000 to $64,999 | 44 (4.3%) | 68 (7.1%) |
| $65,000 to $74,999 | 196 (19.3%) | 27 (2.8%) |
| $75,000 to $99,999 | 127 (12.5%) | 74 (7.7%) |
| $100,000+ | 91 (9.0%) | 50 (5.2%) |
| Total | 1,014 (100.0%) | 959 (100.0%) |
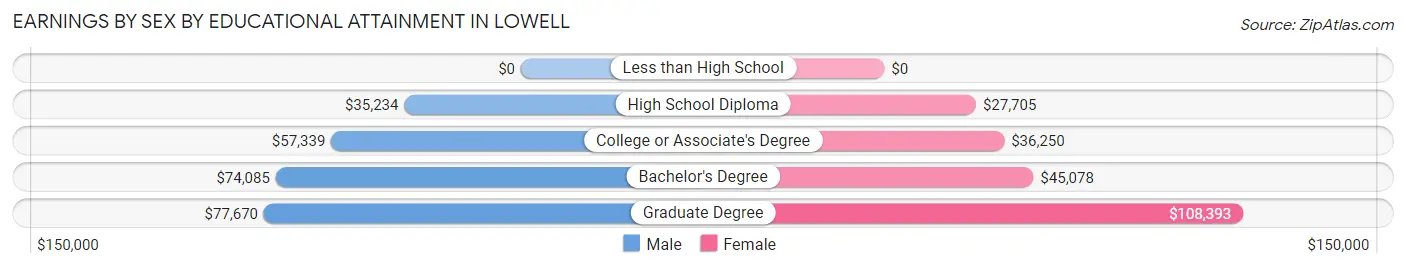
Earnings by Sex by Educational Attainment in Lowell
Average earnings in Lowell are $58,906 for men and $34,884 for women, a difference of 40.8%. Men with an educational attainment of graduate degree enjoy the highest average annual earnings of $77,670, while those with high school diploma education earn the least with $35,234. Women with an educational attainment of graduate degree earn the most with the average annual earnings of $108,393, while those with high school diploma education have the smallest earnings of $27,705.
| Educational Attainment | Male Income | Female Income |
| Less than High School | - | - |
| High School Diploma | $35,234 | $27,705 |
| College or Associate's Degree | $57,339 | $36,250 |
| Bachelor's Degree | $74,085 | $45,078 |
| Graduate Degree | $77,670 | $108,393 |
| Total | $58,906 | $34,884 |
Family Income in Lowell
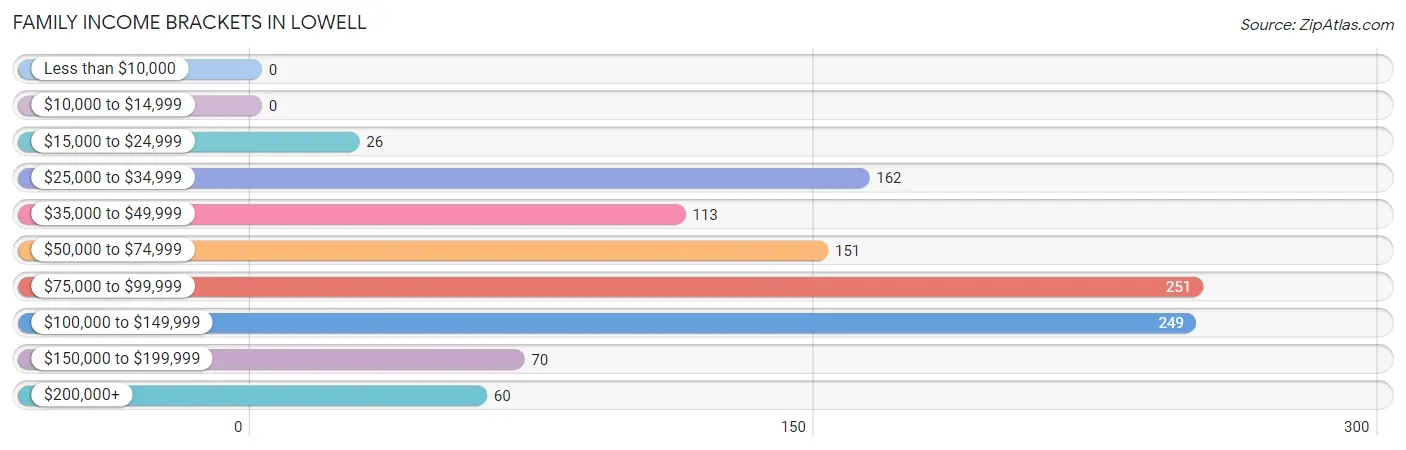
Family Income Brackets in Lowell
According to the Lowell family income data, there are 251 families falling into the $75,000 to $99,999 income range, which is the most common income bracket and makes up 23.2% of all families.
| Income Bracket | # Families | % Families |
| Less than $10,000 | 0 | 0.0% |
| $10,000 to $14,999 | 0 | 0.0% |
| $15,000 to $24,999 | 26 | 2.4% |
| $25,000 to $34,999 | 162 | 15.0% |
| $35,000 to $49,999 | 113 | 10.4% |
| $50,000 to $74,999 | 151 | 14.0% |
| $75,000 to $99,999 | 251 | 23.2% |
| $100,000 to $149,999 | 249 | 23.0% |
| $150,000 to $199,999 | 70 | 6.5% |
| $200,000+ | 60 | 5.5% |
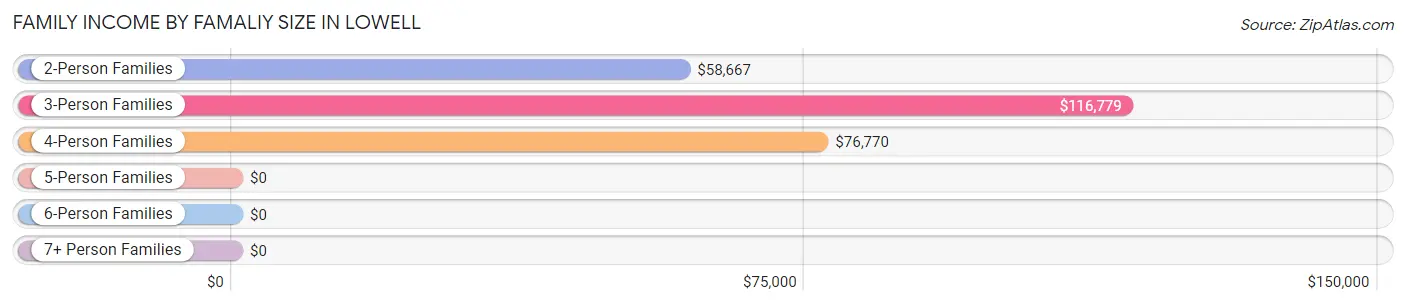
Family Income by Famaliy Size in Lowell
3-person families (191 | 17.6%) account for the highest median family income in Lowell with $116,779 per family, while 3-person families (191 | 17.6%) have the highest median income of $38,926 per family member.
| Income Bracket | # Families | Median Income |
| 2-Person Families | 574 (53.0%) | $58,667 |
| 3-Person Families | 191 (17.6%) | $116,779 |
| 4-Person Families | 203 (18.8%) | $76,770 |
| 5-Person Families | 71 (6.6%) | $0 |
| 6-Person Families | 26 (2.4%) | $0 |
| 7+ Person Families | 17 (1.6%) | $0 |
| Total | 1,082 (100.0%) | $76,698 |
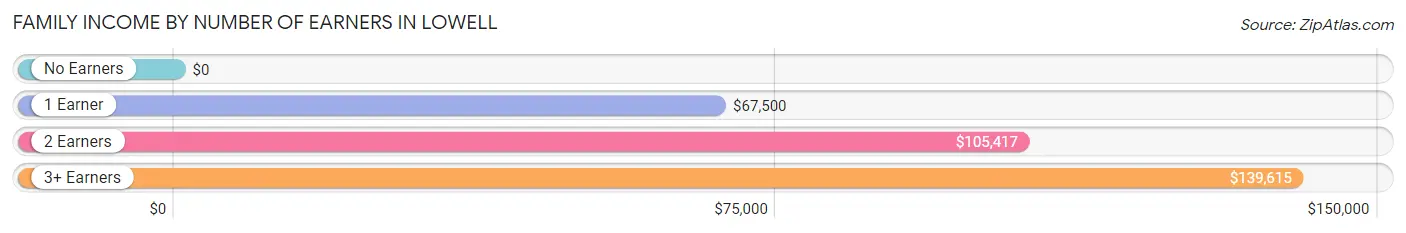
Family Income by Number of Earners in Lowell
| Number of Earners | # Families | Median Income |
| No Earners | 137 (12.7%) | $0 |
| 1 Earner | 454 (42.0%) | $67,500 |
| 2 Earners | 399 (36.9%) | $105,417 |
| 3+ Earners | 92 (8.5%) | $139,615 |
| Total | 1,082 (100.0%) | $76,698 |
Household Income in Lowell
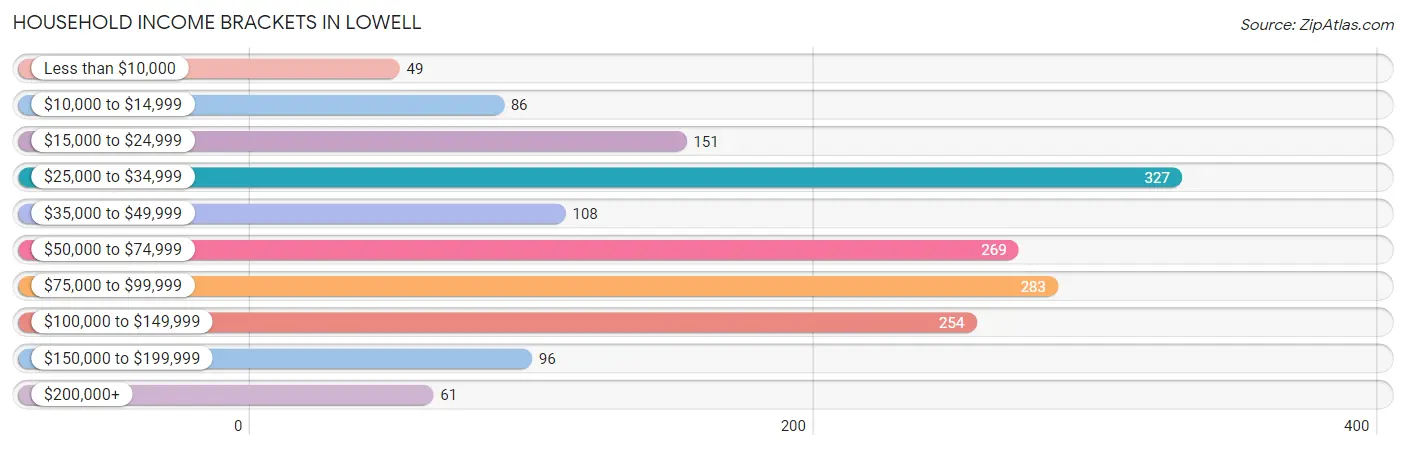
Household Income Brackets in Lowell
With 327 households falling in the category, the $25,000 to $34,999 income range is the most frequent in Lowell, accounting for 19.4% of all households. In contrast, only 49 households (2.9%) fall into the less than $10,000 income bracket, making it the least populous group.
| Income Bracket | # Households | % Households |
| Less than $10,000 | 49 | 2.9% |
| $10,000 to $14,999 | 86 | 5.1% |
| $15,000 to $24,999 | 151 | 9.0% |
| $25,000 to $34,999 | 327 | 19.4% |
| $35,000 to $49,999 | 108 | 6.4% |
| $50,000 to $74,999 | 269 | 16.0% |
| $75,000 to $99,999 | 283 | 16.8% |
| $100,000 to $149,999 | 254 | 15.1% |
| $150,000 to $199,999 | 96 | 5.7% |
| $200,000+ | 61 | 3.6% |
Household Income by Householder Age in Lowell
The median household income in Lowell is $59,712, with the highest median household income of $75,930 found in the 25 to 44 years age bracket for the primary householder. A total of 561 households (33.3%) fall into this category. Meanwhile, the 65+ years age bracket for the primary householder has the lowest median household income of $33,611, with 378 households (22.5%) in this group.

| Income Bracket | # Households | Median Income |
| 15 to 24 Years | 44 (2.6%) | $34,000 |
| 25 to 44 Years | 561 (33.3%) | $75,930 |
| 45 to 64 Years | 700 (41.6%) | $49,667 |
| 65+ Years | 378 (22.5%) | $33,611 |
| Total | 1,683 (100.0%) | $59,712 |
Poverty in Lowell
Income Below Poverty by Sex and Age in Lowell
With 12.4% poverty level for males and 12.3% for females among the residents of Lowell, 12 to 14 year old males and 5 year old females are the most vulnerable to poverty, with 30 males (65.2%) and 16 females (64.0%) in their respective age groups living below the poverty level.
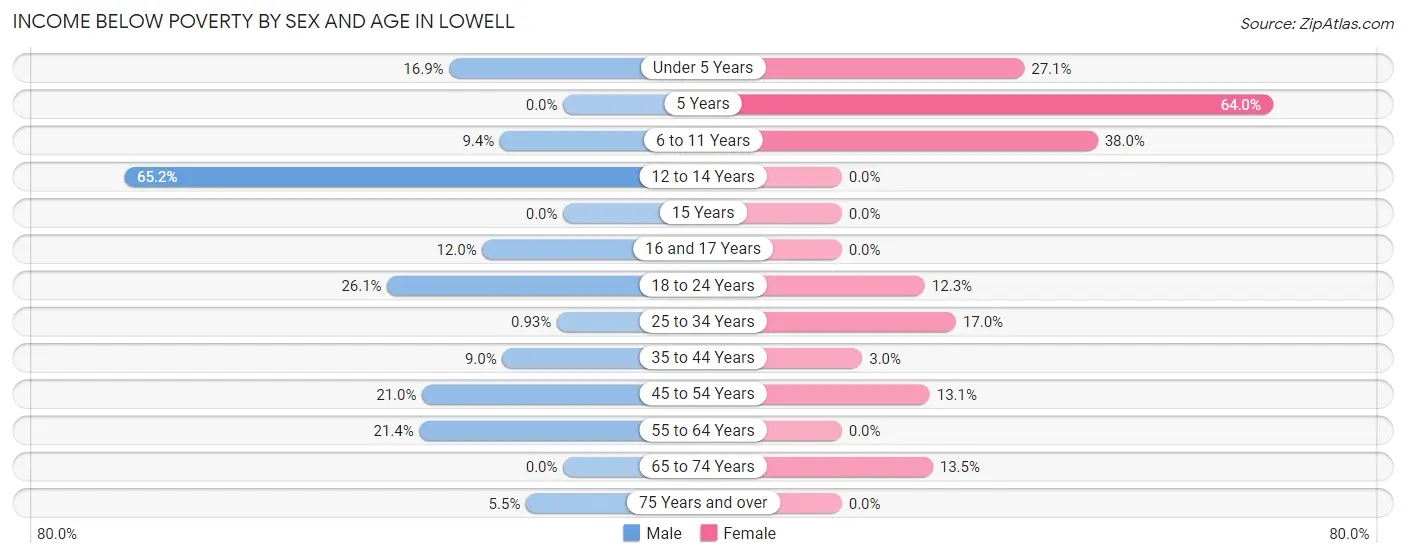
| Age Bracket | Male | Female |
| Under 5 Years | 22 (16.9%) | 29 (27.1%) |
| 5 Years | 0 (0.0%) | 16 (64.0%) |
| 6 to 11 Years | 25 (9.4%) | 57 (38.0%) |
| 12 to 14 Years | 30 (65.2%) | 0 (0.0%) |
| 15 Years | 0 (0.0%) | 0 (0.0%) |
| 16 and 17 Years | 9 (12.0%) | 0 (0.0%) |
| 18 to 24 Years | 35 (26.1%) | 19 (12.3%) |
| 25 to 34 Years | 2 (0.9%) | 40 (17.0%) |
| 35 to 44 Years | 27 (9.0%) | 10 (3.0%) |
| 45 to 54 Years | 44 (20.9%) | 46 (13.1%) |
| 55 to 64 Years | 47 (21.4%) | 0 (0.0%) |
| 65 to 74 Years | 0 (0.0%) | 30 (13.5%) |
| 75 Years and over | 7 (5.5%) | 0 (0.0%) |
| Total | 248 (12.4%) | 247 (12.3%) |
Income Above Poverty by Sex and Age in Lowell
According to the poverty statistics in Lowell, males aged 5 years and females aged 12 to 14 years are the age groups that are most secure financially, with 100.0% of males and 100.0% of females in these age groups living above the poverty line.
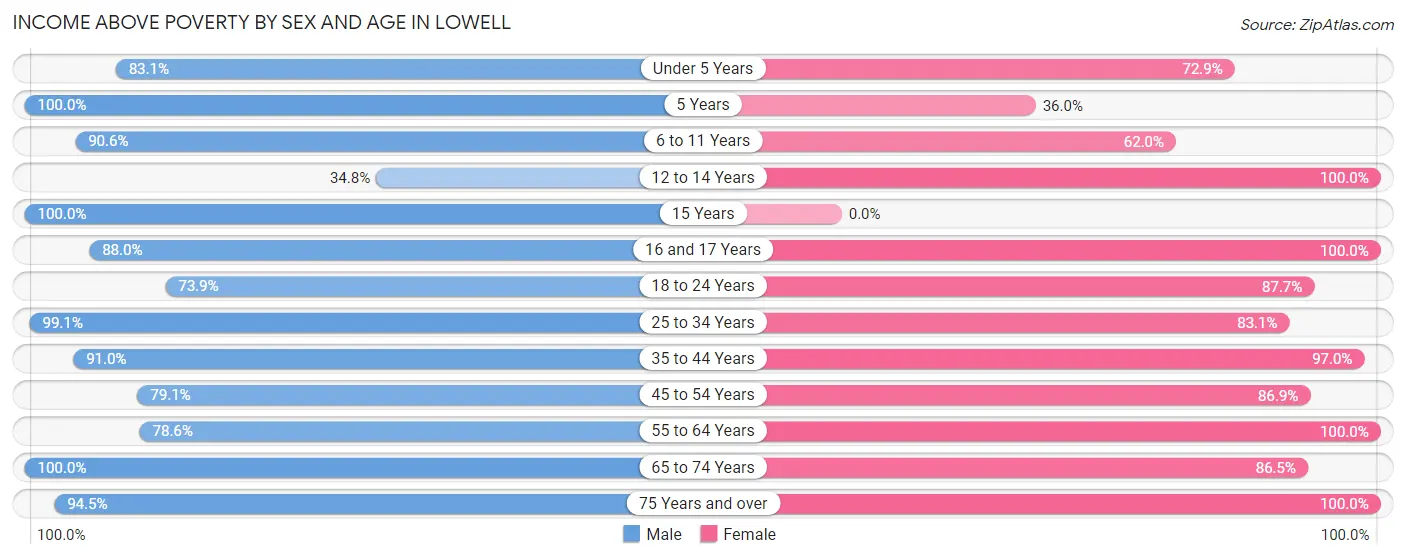
| Age Bracket | Male | Female |
| Under 5 Years | 108 (83.1%) | 78 (72.9%) |
| 5 Years | 157 (100.0%) | 9 (36.0%) |
| 6 to 11 Years | 241 (90.6%) | 93 (62.0%) |
| 12 to 14 Years | 16 (34.8%) | 60 (100.0%) |
| 15 Years | 11 (100.0%) | 0 (0.0%) |
| 16 and 17 Years | 66 (88.0%) | 26 (100.0%) |
| 18 to 24 Years | 99 (73.9%) | 135 (87.7%) |
| 25 to 34 Years | 214 (99.1%) | 196 (83.1%) |
| 35 to 44 Years | 272 (91.0%) | 319 (97.0%) |
| 45 to 54 Years | 166 (79.0%) | 306 (86.9%) |
| 55 to 64 Years | 173 (78.6%) | 214 (100.0%) |
| 65 to 74 Years | 109 (100.0%) | 192 (86.5%) |
| 75 Years and over | 120 (94.5%) | 125 (100.0%) |
| Total | 1,752 (87.6%) | 1,753 (87.6%) |
Income Below Poverty Among Married-Couple Families in Lowell
The poverty statistics for married-couple families in Lowell show that 1.6% or 13 of the total 806 families live below the poverty line. Families with 5 or more children have the highest poverty rate of 100.0%, comprising of 13 families. On the other hand, families with no children have the lowest poverty rate of 0.0%, which includes 0 families.
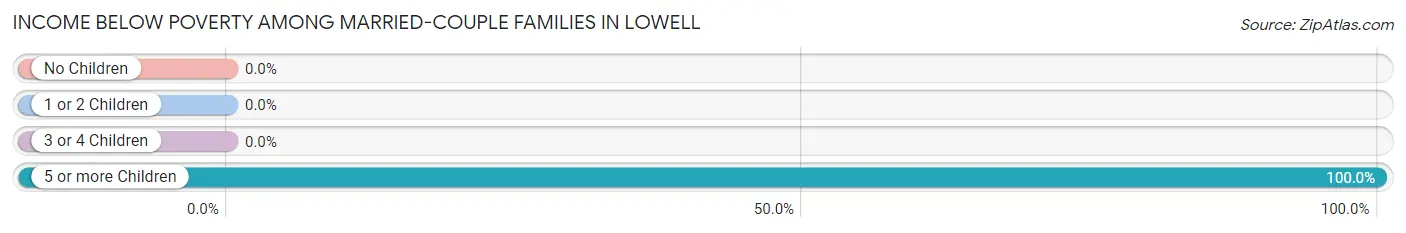
| Children | Above Poverty | Below Poverty |
| No Children | 454 (100.0%) | 0 (0.0%) |
| 1 or 2 Children | 263 (100.0%) | 0 (0.0%) |
| 3 or 4 Children | 76 (100.0%) | 0 (0.0%) |
| 5 or more Children | 0 (0.0%) | 13 (100.0%) |
| Total | 793 (98.4%) | 13 (1.6%) |
Income Below Poverty Among Single-Parent Households in Lowell
According to the poverty data in Lowell, 47.6% or 10 single-father households and 7.4% or 19 single-mother households are living below the poverty line. Among single-father households, those with 1 or 2 children have the highest poverty rate, with 10 households (47.6%) experiencing poverty. Likewise, among single-mother households, those with 3 or 4 children have the highest poverty rate, with 19 households (100.0%) falling below the poverty line.
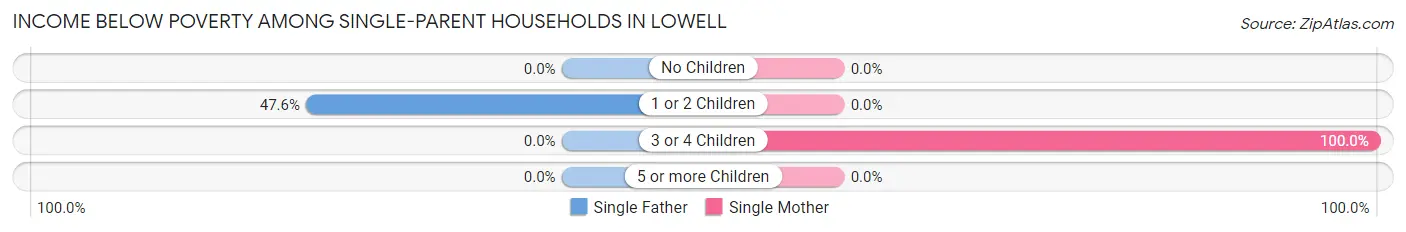
| Children | Single Father | Single Mother |
| No Children | 0 (0.0%) | 0 (0.0%) |
| 1 or 2 Children | 10 (47.6%) | 0 (0.0%) |
| 3 or 4 Children | 0 (0.0%) | 19 (100.0%) |
| 5 or more Children | 0 (0.0%) | 0 (0.0%) |
| Total | 10 (47.6%) | 19 (7.4%) |
Income Below Poverty Among Married-Couple vs Single-Parent Households in Lowell
The poverty data for Lowell shows that 13 of the married-couple family households (1.6%) and 29 of the single-parent households (10.5%) are living below the poverty level. Within the married-couple family households, those with 5 or more children have the highest poverty rate, with 13 households (100.0%) falling below the poverty line. Among the single-parent households, those with 3 or 4 children have the highest poverty rate, with 19 household (100.0%) living below poverty.
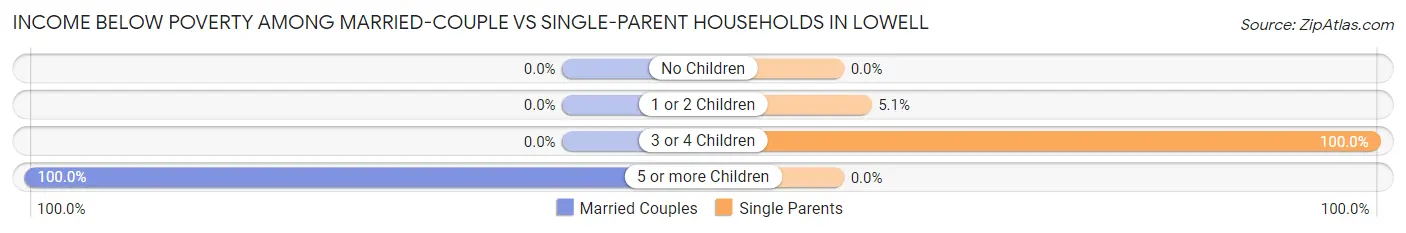
| Children | Married-Couple Families | Single-Parent Households |
| No Children | 0 (0.0%) | 0 (0.0%) |
| 1 or 2 Children | 0 (0.0%) | 10 (5.1%) |
| 3 or 4 Children | 0 (0.0%) | 19 (100.0%) |
| 5 or more Children | 13 (100.0%) | 0 (0.0%) |
| Total | 13 (1.6%) | 29 (10.5%) |
Race in Lowell
The most populous races in Lowell are White / Caucasian (4,072 | 98.7%), Hispanic or Latino (217 | 5.3%), and Black / African American (26 | 0.6%).
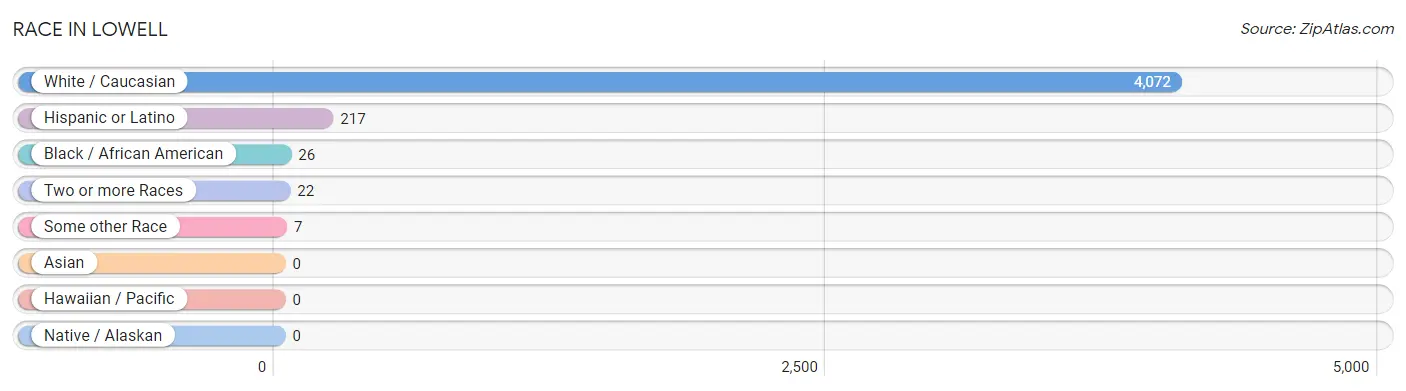
| Race | # Population | % Population |
| Asian | 0 | 0.0% |
| Black / African American | 26 | 0.6% |
| Hawaiian / Pacific | 0 | 0.0% |
| Hispanic or Latino | 217 | 5.3% |
| Native / Alaskan | 0 | 0.0% |
| White / Caucasian | 4,072 | 98.7% |
| Two or more Races | 22 | 0.5% |
| Some other Race | 7 | 0.2% |
| Total | 4,127 | 100.0% |
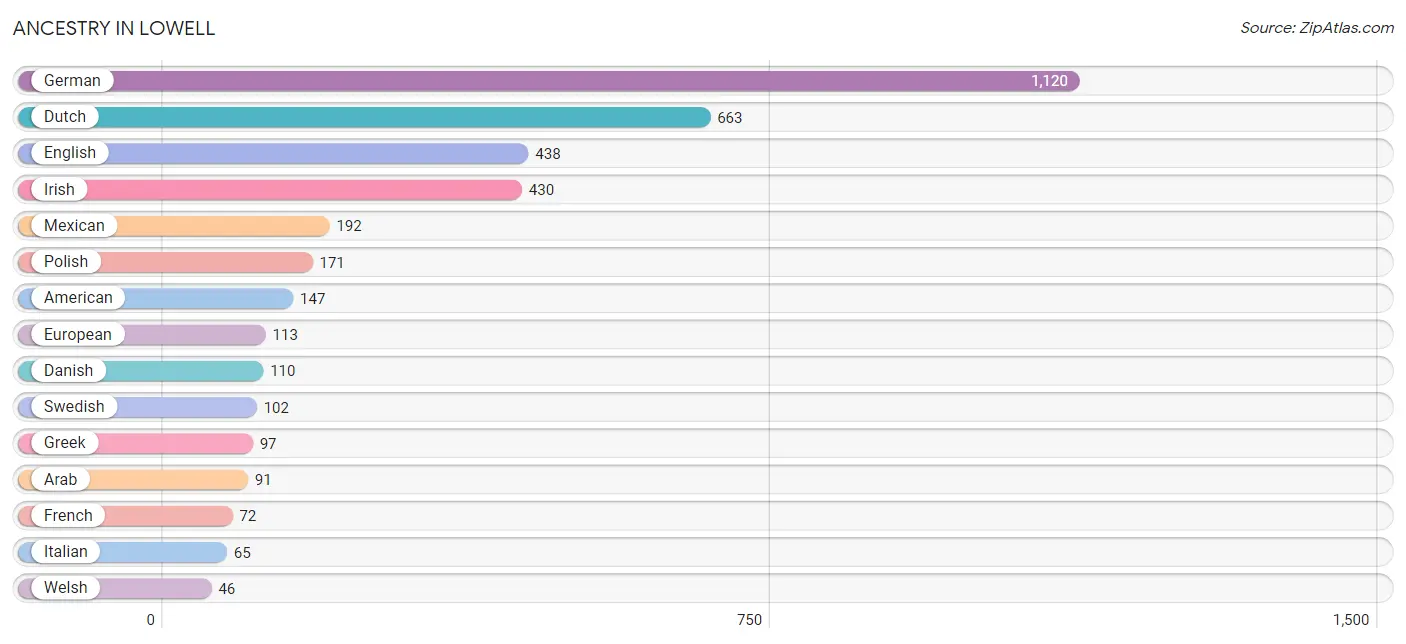
Ancestry in Lowell
The most populous ancestries reported in Lowell are German (1,120 | 27.1%), Dutch (663 | 16.1%), English (438 | 10.6%), Irish (430 | 10.4%), and Mexican (192 | 4.6%), together accounting for 68.9% of all Lowell residents.
| Ancestry | # Population | % Population |
| American | 147 | 3.6% |
| Arab | 91 | 2.2% |
| Austrian | 26 | 0.6% |
| Belgian | 15 | 0.4% |
| British | 19 | 0.5% |
| Canadian | 7 | 0.2% |
| Celtic | 8 | 0.2% |
| Czech | 38 | 0.9% |
| Danish | 110 | 2.7% |
| Dutch | 663 | 16.1% |
| English | 438 | 10.6% |
| European | 113 | 2.7% |
| Finnish | 11 | 0.3% |
| French | 72 | 1.7% |
| French Canadian | 19 | 0.5% |
| German | 1,120 | 27.1% |
| Greek | 97 | 2.4% |
| Hungarian | 8 | 0.2% |
| Indian (Asian) | 1 | 0.0% |
| Irish | 430 | 10.4% |
| Italian | 65 | 1.6% |
| Mexican | 192 | 4.6% |
| Native Hawaiian | 1 | 0.0% |
| Northern European | 14 | 0.3% |
| Norwegian | 36 | 0.9% |
| Pennsylvania German | 9 | 0.2% |
| Polish | 171 | 4.1% |
| Puerto Rican | 25 | 0.6% |
| Scandinavian | 8 | 0.2% |
| Scotch-Irish | 12 | 0.3% |
| Scottish | 39 | 0.9% |
| Serbian | 9 | 0.2% |
| Swedish | 102 | 2.5% |
| Swiss | 29 | 0.7% |
| Syrian | 26 | 0.6% |
| Ukrainian | 27 | 0.6% |
| Welsh | 46 | 1.1% | View All 37 Rows |
Immigrants in Lowell
The most numerous immigrant groups reported in Lowell came from Europe (23 | 0.6%), Western Europe (23 | 0.6%), Austria (16 | 0.4%), Central America (11 | 0.3%), and Latin America (11 | 0.3%), together accounting for 2.1% of all Lowell residents.
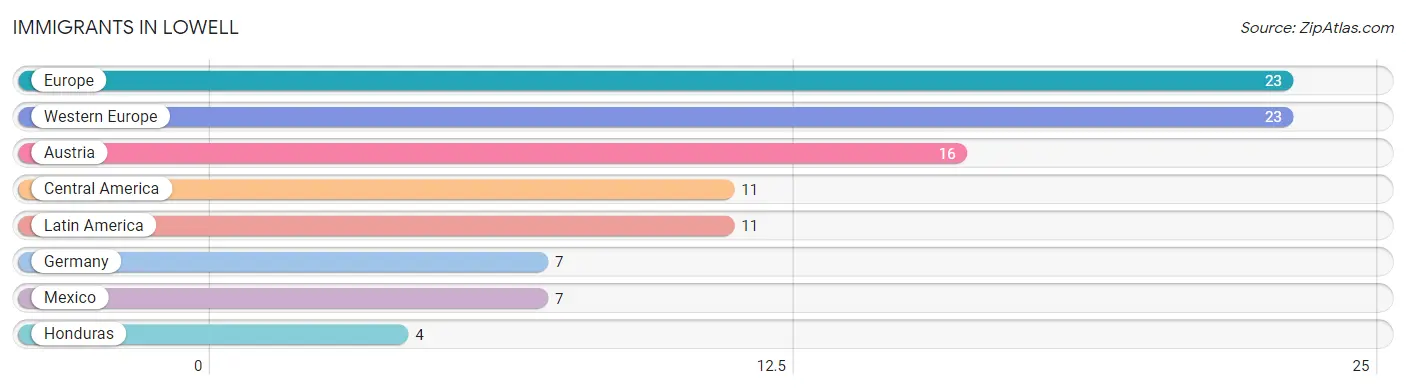
| Immigration Origin | # Population | % Population |
| Austria | 16 | 0.4% |
| Central America | 11 | 0.3% |
| Europe | 23 | 0.6% |
| Germany | 7 | 0.2% |
| Honduras | 4 | 0.1% |
| Latin America | 11 | 0.3% |
| Mexico | 7 | 0.2% |
| Western Europe | 23 | 0.6% | View All 8 Rows |
Sex and Age in Lowell
Sex and Age in Lowell
The most populous age groups in Lowell are 5 to 9 Years (347 | 16.8%) for men and 35 to 39 Years (215 | 10.4%) for women.
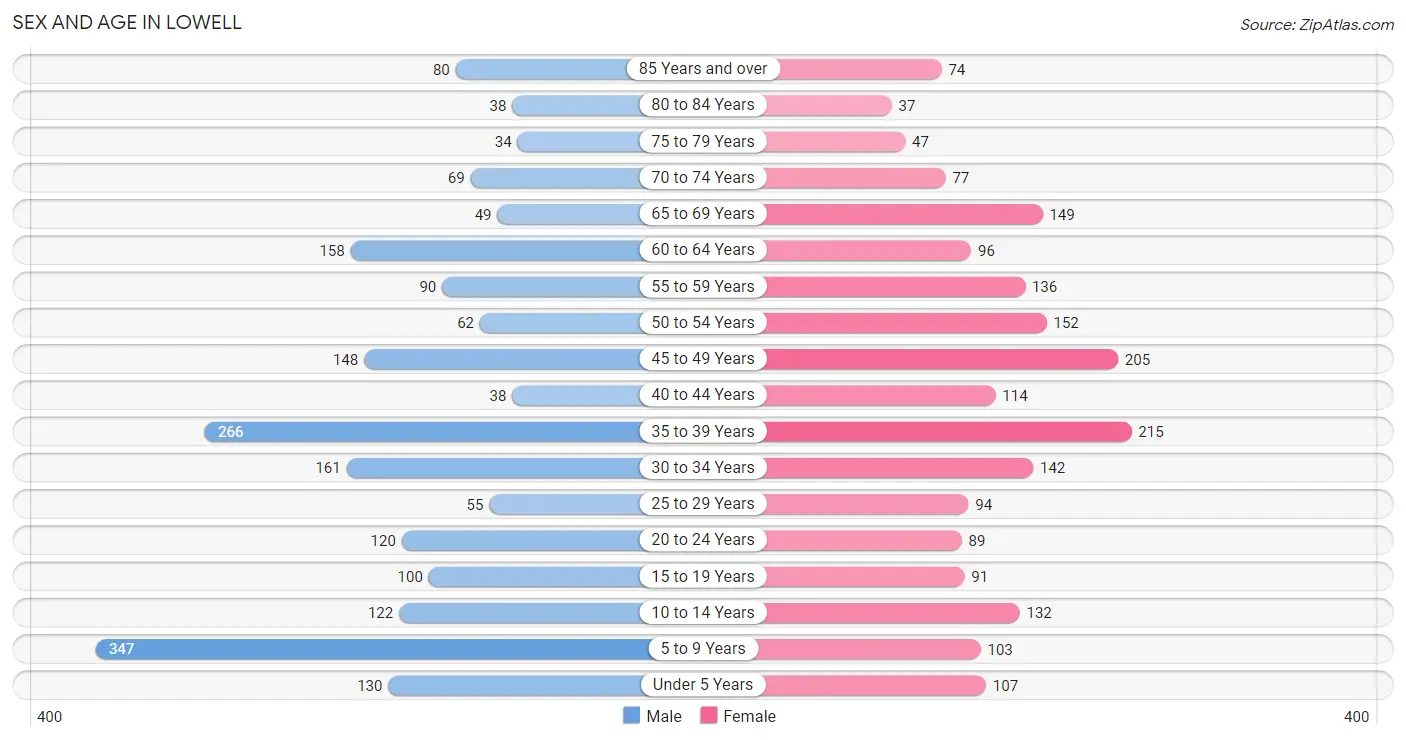
| Age Bracket | Male | Female |
| Under 5 Years | 130 (6.3%) | 107 (5.2%) |
| 5 to 9 Years | 347 (16.8%) | 103 (5.0%) |
| 10 to 14 Years | 122 (5.9%) | 132 (6.4%) |
| 15 to 19 Years | 100 (4.8%) | 91 (4.4%) |
| 20 to 24 Years | 120 (5.8%) | 89 (4.3%) |
| 25 to 29 Years | 55 (2.7%) | 94 (4.6%) |
| 30 to 34 Years | 161 (7.8%) | 142 (6.9%) |
| 35 to 39 Years | 266 (12.9%) | 215 (10.4%) |
| 40 to 44 Years | 38 (1.8%) | 114 (5.5%) |
| 45 to 49 Years | 148 (7.2%) | 205 (10.0%) |
| 50 to 54 Years | 62 (3.0%) | 152 (7.4%) |
| 55 to 59 Years | 90 (4.3%) | 136 (6.6%) |
| 60 to 64 Years | 158 (7.6%) | 96 (4.7%) |
| 65 to 69 Years | 49 (2.4%) | 149 (7.2%) |
| 70 to 74 Years | 69 (3.3%) | 77 (3.7%) |
| 75 to 79 Years | 34 (1.6%) | 47 (2.3%) |
| 80 to 84 Years | 38 (1.8%) | 37 (1.8%) |
| 85 Years and over | 80 (3.9%) | 74 (3.6%) |
| Total | 2,067 (100.0%) | 2,060 (100.0%) |
Families and Households in Lowell
Median Family Size in Lowell
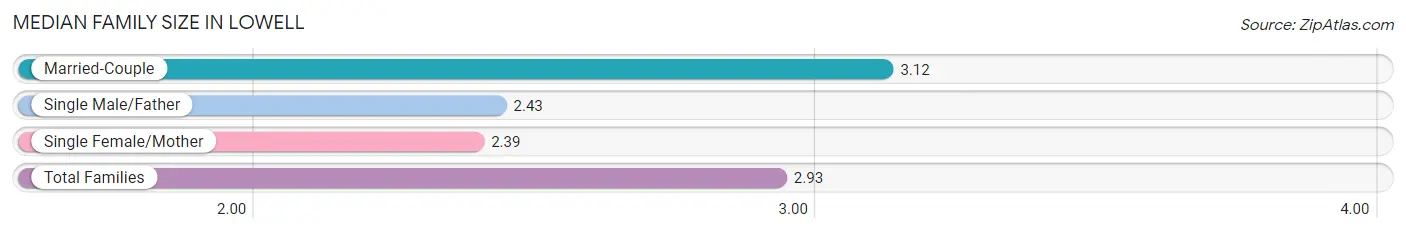
The median family size in Lowell is 2.93 persons per family, with married-couple families (806 | 74.5%) accounting for the largest median family size of 3.12 persons per family. On the other hand, single female/mother families (255 | 23.6%) represent the smallest median family size with 2.39 persons per family.
| Family Type | # Families | Family Size |
| Married-Couple | 806 (74.5%) | 3.12 |
| Single Male/Father | 21 (1.9%) | 2.43 |
| Single Female/Mother | 255 (23.6%) | 2.39 |
| Total Families | 1,082 (100.0%) | 2.93 |
Median Household Size in Lowell
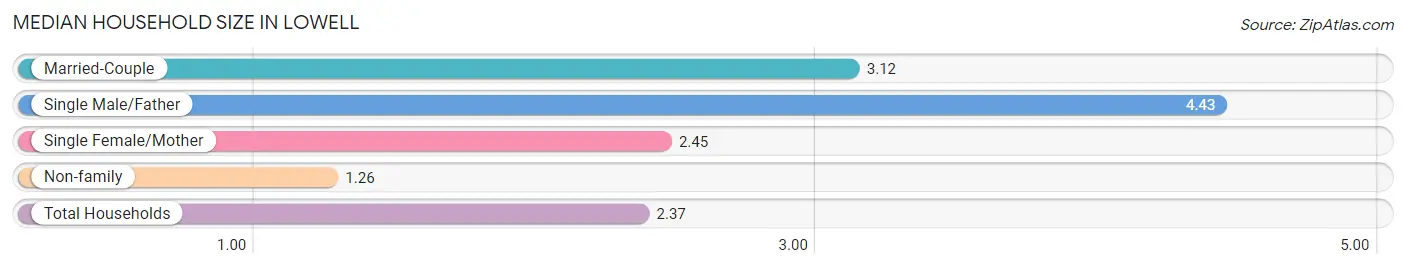
The median household size in Lowell is 2.37 persons per household, with single male/father households (21 | 1.3%) accounting for the largest median household size of 4.43 persons per household. non-family households (601 | 35.7%) represent the smallest median household size with 1.26 persons per household.
| Household Type | # Households | Household Size |
| Married-Couple | 806 (47.9%) | 3.12 |
| Single Male/Father | 21 (1.3%) | 4.43 |
| Single Female/Mother | 255 (15.1%) | 2.45 |
| Non-family | 601 (35.7%) | 1.26 |
| Total Households | 1,683 (100.0%) | 2.37 |
Household Size by Marriage Status in Lowell
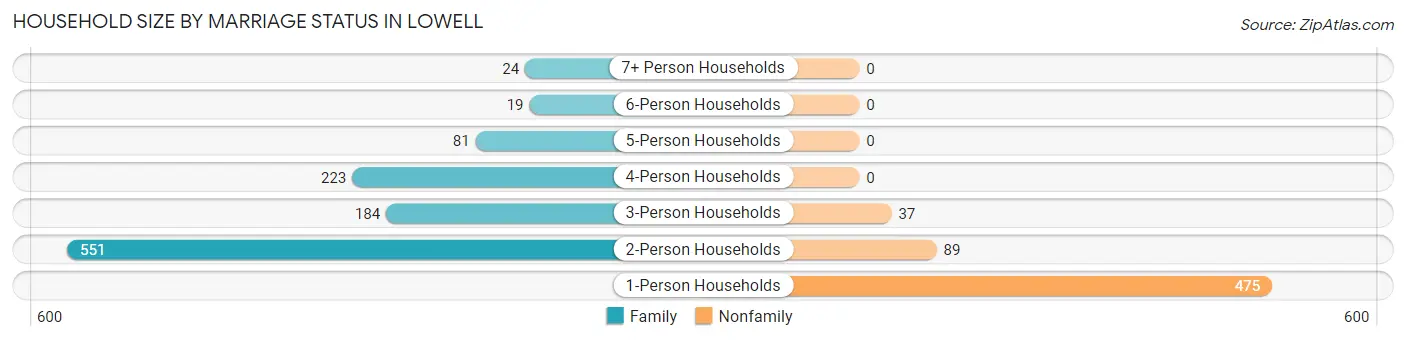
Out of a total of 1,683 households in Lowell, 1,082 (64.3%) are family households, while 601 (35.7%) are nonfamily households. The most numerous type of family households are 2-person households, comprising 551, and the most common type of nonfamily households are 1-person households, comprising 475.
| Household Size | Family Households | Nonfamily Households |
| 1-Person Households | - | 475 (28.2%) |
| 2-Person Households | 551 (32.7%) | 89 (5.3%) |
| 3-Person Households | 184 (10.9%) | 37 (2.2%) |
| 4-Person Households | 223 (13.3%) | 0 (0.0%) |
| 5-Person Households | 81 (4.8%) | 0 (0.0%) |
| 6-Person Households | 19 (1.1%) | 0 (0.0%) |
| 7+ Person Households | 24 (1.4%) | 0 (0.0%) |
| Total | 1,082 (64.3%) | 601 (35.7%) |
Female Fertility in Lowell
Fertility by Age in Lowell
Average fertility rate in Lowell is 48.0 births per 1,000 women. Women in the age bracket of 20 to 34 years have the highest fertility rate with 111.0 births per 1,000 women. Women in the age bracket of 20 to 34 years acount for 78.3% of all women with births.
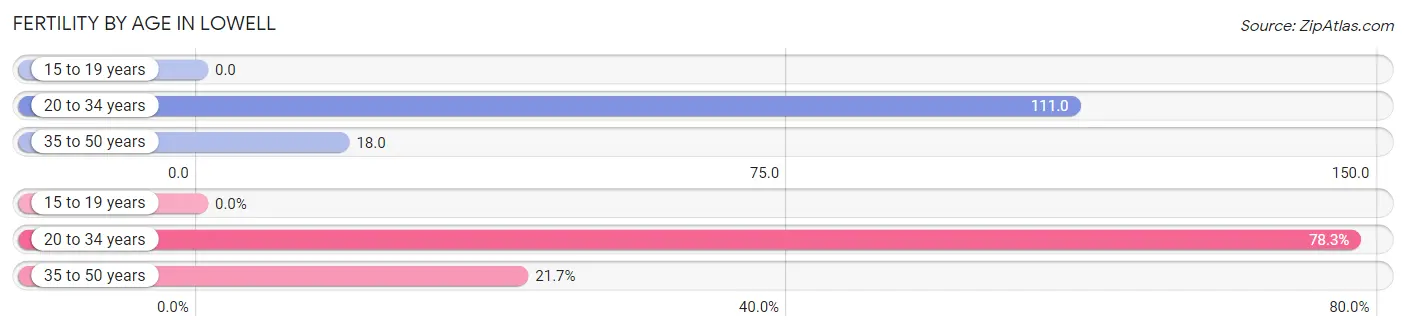
| Age Bracket | Women with Births | Births / 1,000 Women |
| 15 to 19 years | 0 (0.0%) | 0.0 |
| 20 to 34 years | 36 (78.3%) | 111.0 |
| 35 to 50 years | 10 (21.7%) | 18.0 |
| Total | 46 (100.0%) | 48.0 |
Fertility by Age by Marriage Status in Lowell
52.2% of women with births (46) in Lowell are married. The highest percentage of unmarried women with births falls into 35 to 50 years age bracket with 100.0% of them unmarried at the time of birth, while the lowest percentage of unmarried women with births belong to 20 to 34 years age bracket with 33.3% of them unmarried.
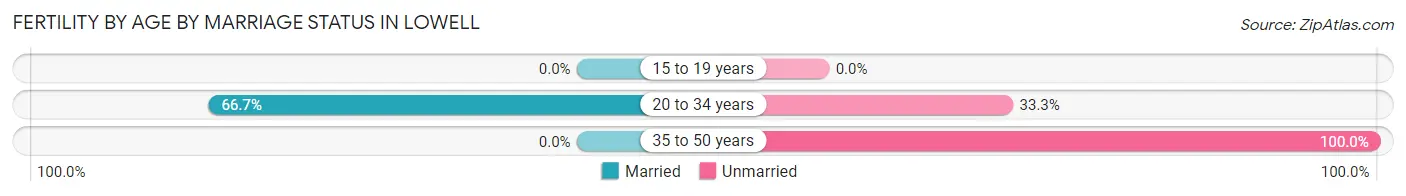
| Age Bracket | Married | Unmarried |
| 15 to 19 years | 0 (0.0%) | 0 (0.0%) |
| 20 to 34 years | 24 (66.7%) | 12 (33.3%) |
| 35 to 50 years | 0 (0.0%) | 10 (100.0%) |
| Total | 24 (52.2%) | 22 (47.8%) |
Fertility by Education in Lowell
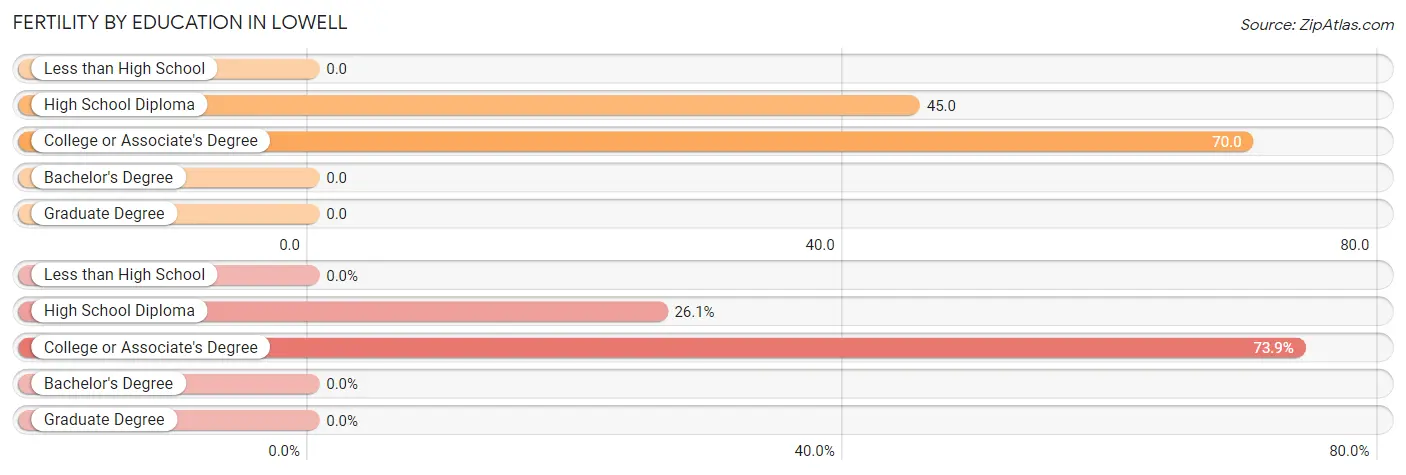
| Educational Attainment | Women with Births | Births / 1,000 Women |
| Less than High School | 0 (0.0%) | 0.0 |
| High School Diploma | 12 (26.1%) | 45.0 |
| College or Associate's Degree | 34 (73.9%) | 70.0 |
| Bachelor's Degree | 0 (0.0%) | 0.0 |
| Graduate Degree | 0 (0.0%) | 0.0 |
| Total | 46 (100.0%) | 48.0 |
Fertility by Education by Marriage Status in Lowell
47.8% of women with births in Lowell are unmarried. Women with the educational attainment of college or associate's degree are most likely to be married with 70.6% of them married at childbirth, while women with the educational attainment of high school diploma are least likely to be married with 100.0% of them unmarried at childbirth.
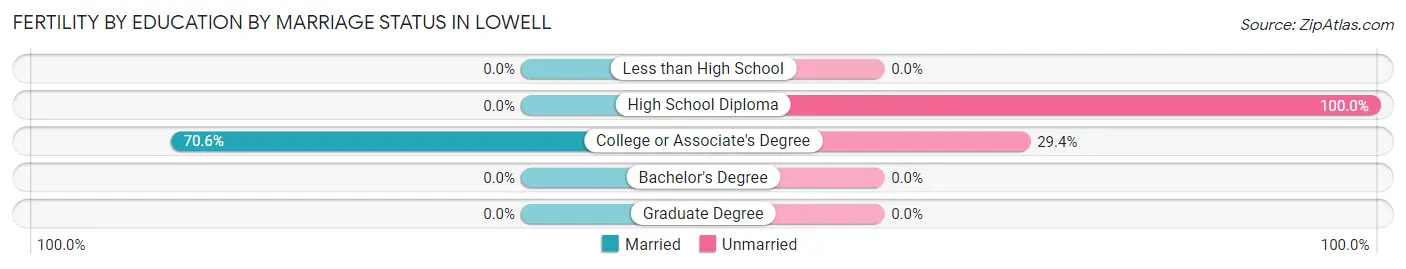
| Educational Attainment | Married | Unmarried |
| Less than High School | 0 (0.0%) | 0 (0.0%) |
| High School Diploma | 0 (0.0%) | 12 (100.0%) |
| College or Associate's Degree | 24 (70.6%) | 10 (29.4%) |
| Bachelor's Degree | 0 (0.0%) | 0 (0.0%) |
| Graduate Degree | 0 (0.0%) | 0 (0.0%) |
| Total | 24 (52.2%) | 22 (47.8%) |
Employment Characteristics in Lowell
Employment by Class of Employer in Lowell
Among the 1,837 employed individuals in Lowell, private company employees (1,447 | 78.8%), not-for-profit organizations (167 | 9.1%), and self-employed (not incorporated) (81 | 4.4%) make up the most common classes of employment.
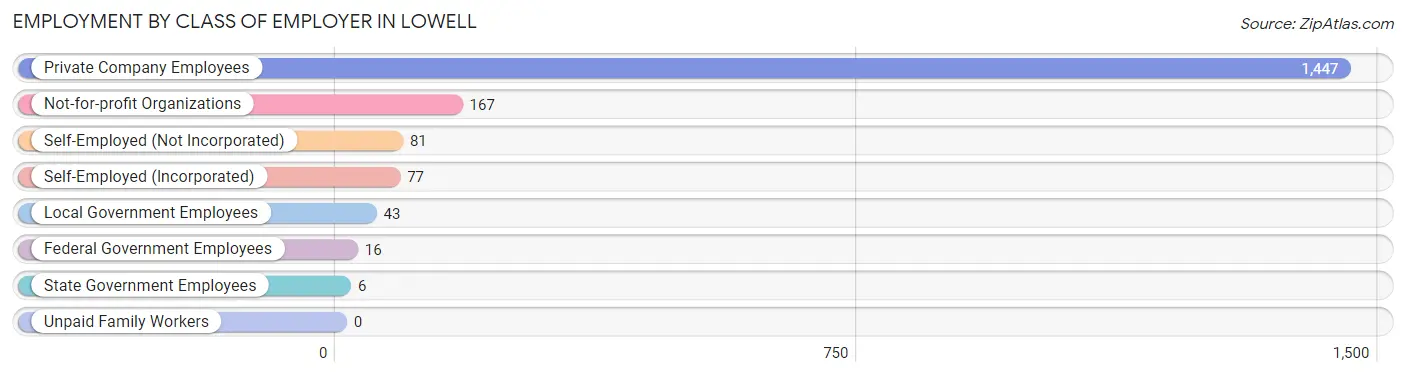
| Employer Class | # Employees | % Employees |
| Private Company Employees | 1,447 | 78.8% |
| Self-Employed (Incorporated) | 77 | 4.2% |
| Self-Employed (Not Incorporated) | 81 | 4.4% |
| Not-for-profit Organizations | 167 | 9.1% |
| Local Government Employees | 43 | 2.3% |
| State Government Employees | 6 | 0.3% |
| Federal Government Employees | 16 | 0.9% |
| Unpaid Family Workers | 0 | 0.0% |
| Total | 1,837 | 100.0% |
Employment Status by Age in Lowell
According to the labor force statistics for Lowell, out of the total population over 16 years of age (3,175), 59.4% or 1,886 individuals are in the labor force, with 2.0% or 38 of them unemployed. The age group with the highest labor force participation rate is 20 to 24 years, with 100.0% or 209 individuals in the labor force. Within the labor force, the 16 to 19 years age range has the highest percentage of unemployed individuals, with 17.1% or 21 of them being unemployed.
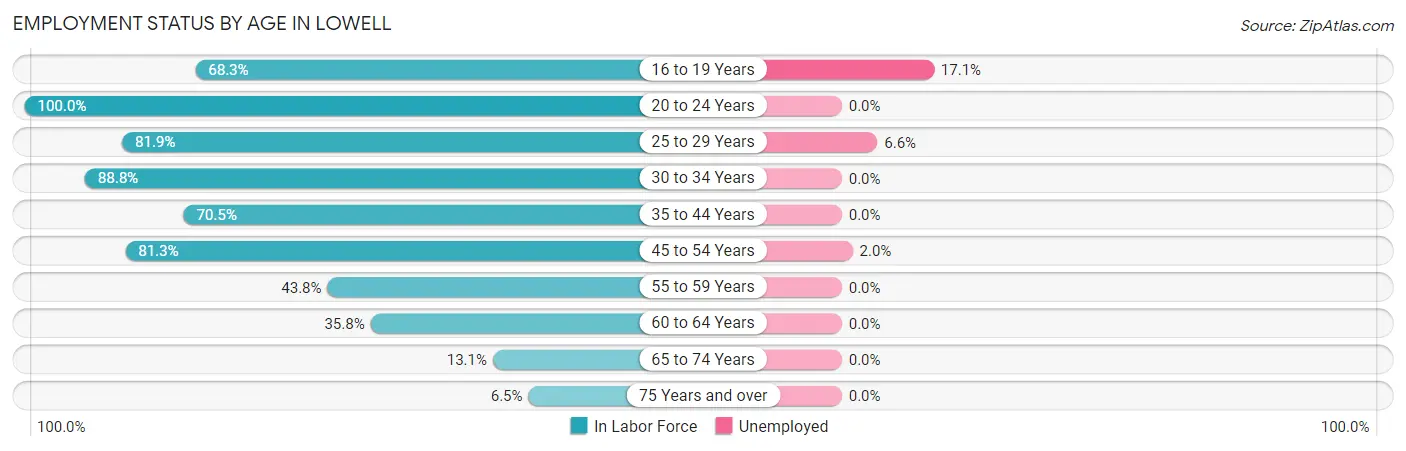
| Age Bracket | In Labor Force | Unemployed |
| 16 to 19 Years | 123 (68.3%) | 21 (17.1%) |
| 20 to 24 Years | 209 (100.0%) | 0 (0.0%) |
| 25 to 29 Years | 122 (81.9%) | 8 (6.6%) |
| 30 to 34 Years | 269 (88.8%) | 0 (0.0%) |
| 35 to 44 Years | 446 (70.5%) | 0 (0.0%) |
| 45 to 54 Years | 461 (81.3%) | 9 (2.0%) |
| 55 to 59 Years | 99 (43.8%) | 0 (0.0%) |
| 60 to 64 Years | 91 (35.8%) | 0 (0.0%) |
| 65 to 74 Years | 45 (13.1%) | 0 (0.0%) |
| 75 Years and over | 20 (6.5%) | 0 (0.0%) |
| Total | 1,886 (59.4%) | 38 (2.0%) |
Employment Status by Educational Attainment in Lowell
According to labor force statistics for Lowell, 69.8% of individuals (1,488) out of the total population between 25 and 64 years of age (2,132) are in the labor force, with 1.1% or 16 of them being unemployed. The group with the highest labor force participation rate are those with the educational attainment of bachelor's degree or higher, with 86.7% or 501 individuals in the labor force. Within the labor force, individuals with college / associate degree education have the highest percentage of unemployment, with 1.7% or 9 of them being unemployed.
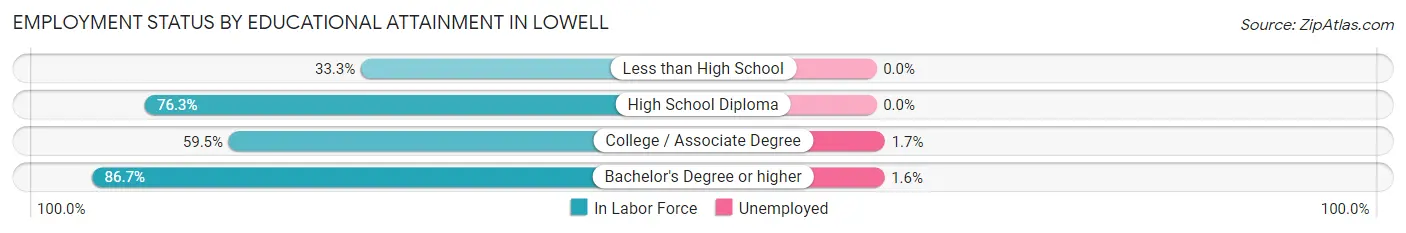
| Educational Attainment | In Labor Force | Unemployed |
| Less than High School | 40 (33.3%) | 0 (0.0%) |
| High School Diploma | 426 (76.3%) | 0 (0.0%) |
| College / Associate Degree | 521 (59.5%) | 15 (1.7%) |
| Bachelor's Degree or higher | 501 (86.7%) | 9 (1.6%) |
| Total | 1,488 (69.8%) | 23 (1.1%) |
Employment Occupations by Sex in Lowell
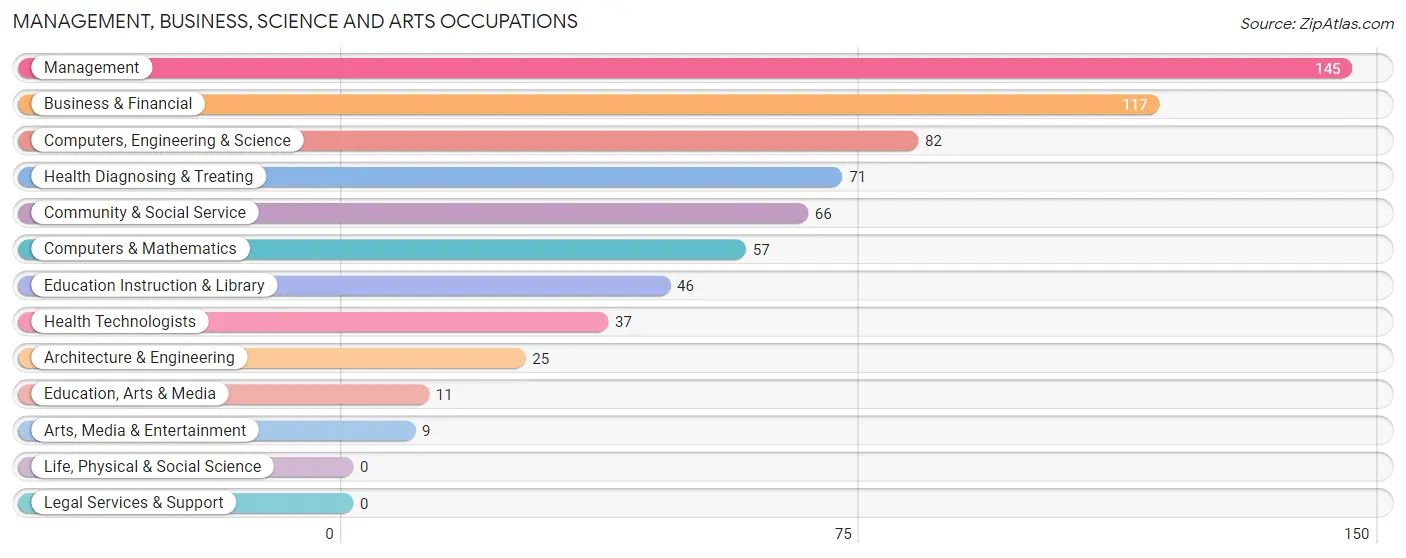
Management, Business, Science and Arts Occupations
The most common Management, Business, Science and Arts occupations in Lowell are Management (145 | 7.9%), Business & Financial (117 | 6.3%), Computers, Engineering & Science (82 | 4.4%), Health Diagnosing & Treating (71 | 3.8%), and Community & Social Service (66 | 3.6%).
Management, Business, Science and Arts Occupations by Sex
Within the Management, Business, Science and Arts occupations in Lowell, the most male-oriented occupations are Computers, Engineering & Science (100.0%), Computers & Mathematics (100.0%), and Architecture & Engineering (100.0%), while the most female-oriented occupations are Education, Arts & Media (100.0%), Arts, Media & Entertainment (100.0%), and Health Diagnosing & Treating (81.7%).
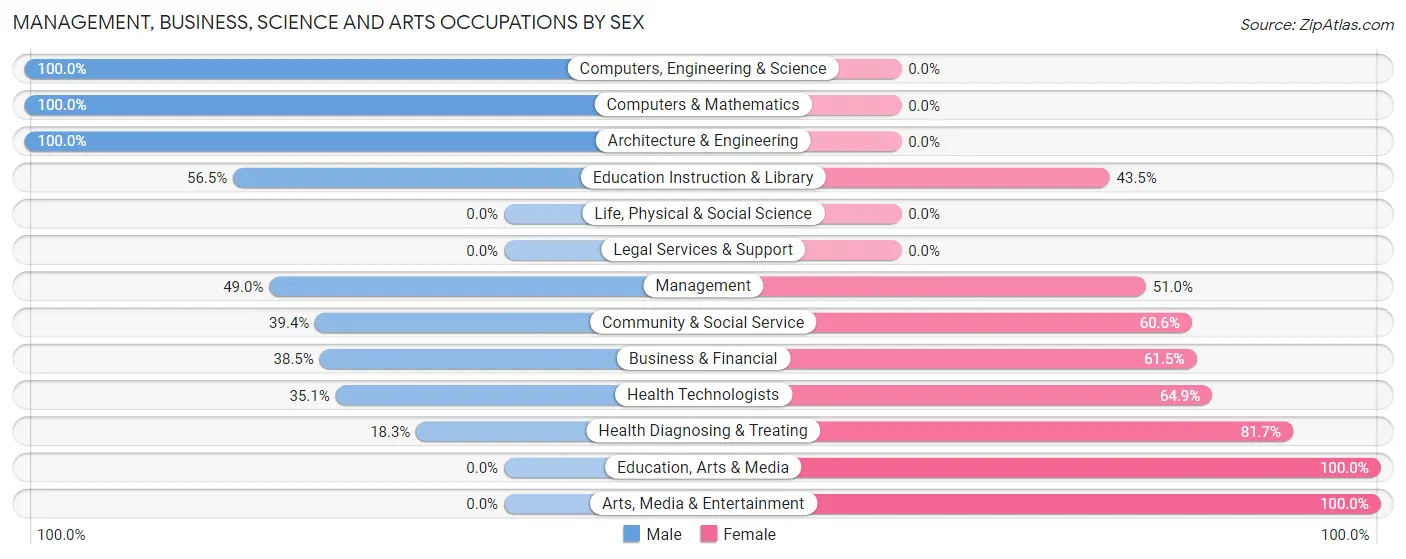
| Occupation | Male | Female |
| Management | 71 (49.0%) | 74 (51.0%) |
| Business & Financial | 45 (38.5%) | 72 (61.5%) |
| Computers, Engineering & Science | 82 (100.0%) | 0 (0.0%) |
| Computers & Mathematics | 57 (100.0%) | 0 (0.0%) |
| Architecture & Engineering | 25 (100.0%) | 0 (0.0%) |
| Life, Physical & Social Science | 0 (0.0%) | 0 (0.0%) |
| Community & Social Service | 26 (39.4%) | 40 (60.6%) |
| Education, Arts & Media | 0 (0.0%) | 11 (100.0%) |
| Legal Services & Support | 0 (0.0%) | 0 (0.0%) |
| Education Instruction & Library | 26 (56.5%) | 20 (43.5%) |
| Arts, Media & Entertainment | 0 (0.0%) | 9 (100.0%) |
| Health Diagnosing & Treating | 13 (18.3%) | 58 (81.7%) |
| Health Technologists | 13 (35.1%) | 24 (64.9%) |
| Total (Category) | 237 (49.3%) | 244 (50.7%) |
| Total (Overall) | 978 (52.9%) | 869 (47.0%) |
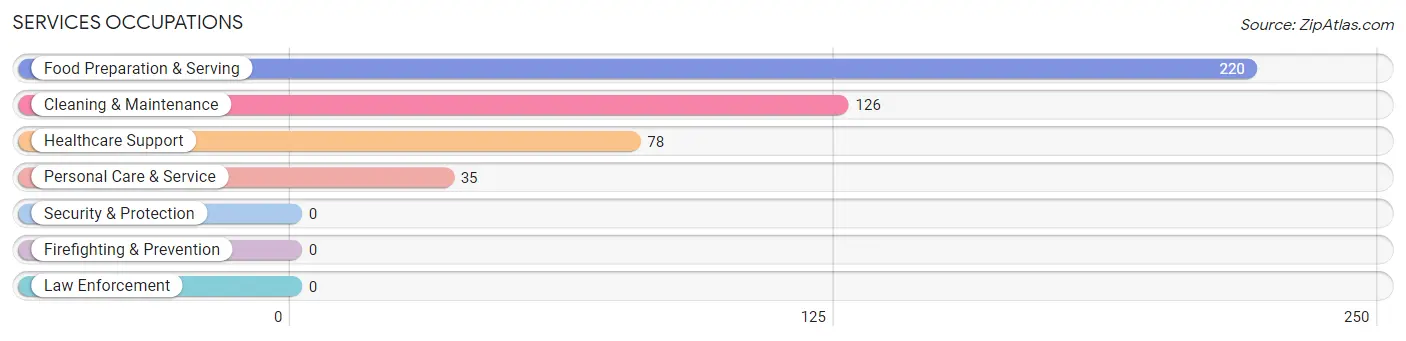
Services Occupations
The most common Services occupations in Lowell are Food Preparation & Serving (220 | 11.9%), Cleaning & Maintenance (126 | 6.8%), Healthcare Support (78 | 4.2%), and Personal Care & Service (35 | 1.9%).
Services Occupations by Sex
Within the Services occupations in Lowell, the most male-oriented occupations are Cleaning & Maintenance (81.8%), Food Preparation & Serving (69.1%), and Personal Care & Service (22.9%), while the most female-oriented occupations are Healthcare Support (100.0%), Personal Care & Service (77.1%), and Food Preparation & Serving (30.9%).
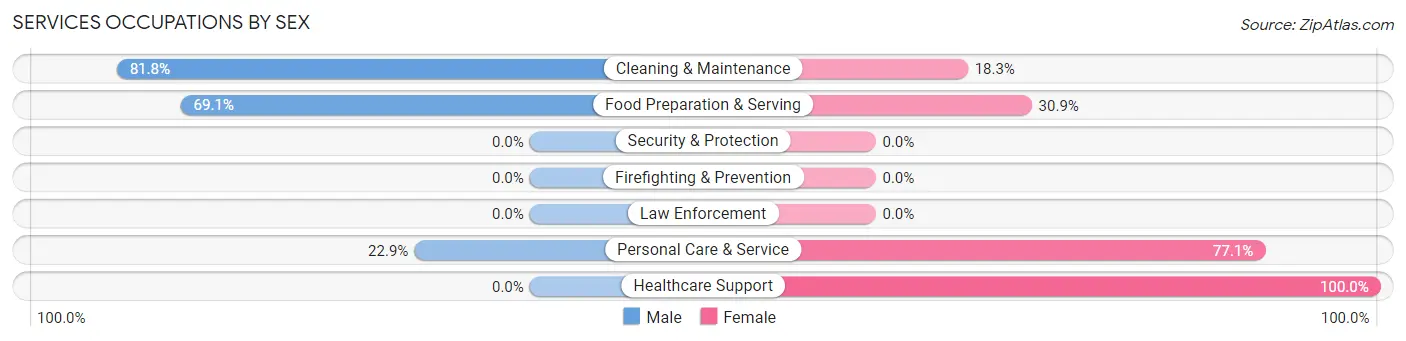
| Occupation | Male | Female |
| Healthcare Support | 0 (0.0%) | 78 (100.0%) |
| Security & Protection | 0 (0.0%) | 0 (0.0%) |
| Firefighting & Prevention | 0 (0.0%) | 0 (0.0%) |
| Law Enforcement | 0 (0.0%) | 0 (0.0%) |
| Food Preparation & Serving | 152 (69.1%) | 68 (30.9%) |
| Cleaning & Maintenance | 103 (81.8%) | 23 (18.2%) |
| Personal Care & Service | 8 (22.9%) | 27 (77.1%) |
| Total (Category) | 263 (57.3%) | 196 (42.7%) |
| Total (Overall) | 978 (52.9%) | 869 (47.0%) |
Sales and Office Occupations
The most common Sales and Office occupations in Lowell are Office & Administration (310 | 16.8%), and Sales & Related (141 | 7.6%).

Sales and Office Occupations by Sex

| Occupation | Male | Female |
| Sales & Related | 79 (56.0%) | 62 (44.0%) |
| Office & Administration | 28 (9.0%) | 282 (91.0%) |
| Total (Category) | 107 (23.7%) | 344 (76.3%) |
| Total (Overall) | 978 (52.9%) | 869 (47.0%) |
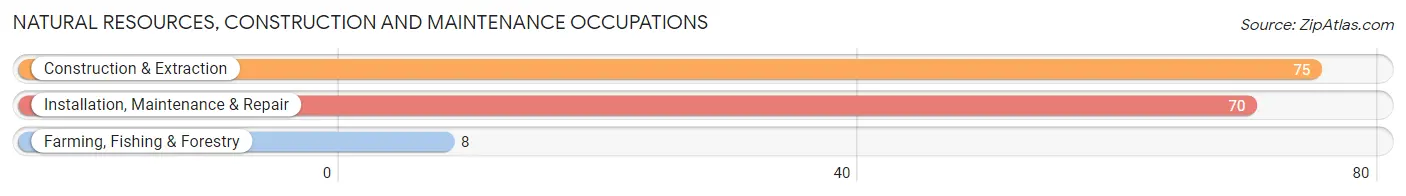
Natural Resources, Construction and Maintenance Occupations
The most common Natural Resources, Construction and Maintenance occupations in Lowell are Construction & Extraction (75 | 4.1%), Installation, Maintenance & Repair (70 | 3.8%), and Farming, Fishing & Forestry (8 | 0.4%).
Natural Resources, Construction and Maintenance Occupations by Sex
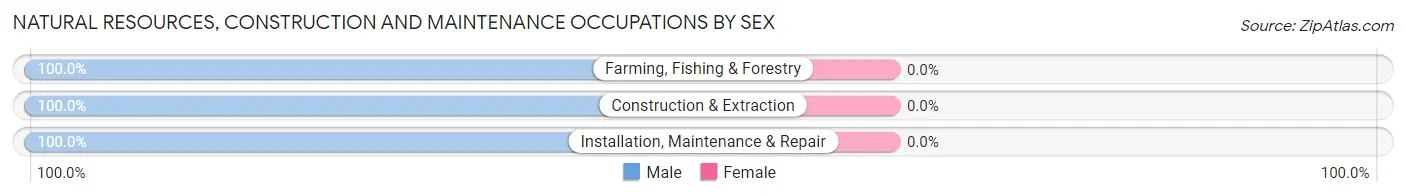
| Occupation | Male | Female |
| Farming, Fishing & Forestry | 8 (100.0%) | 0 (0.0%) |
| Construction & Extraction | 75 (100.0%) | 0 (0.0%) |
| Installation, Maintenance & Repair | 70 (100.0%) | 0 (0.0%) |
| Total (Category) | 153 (100.0%) | 0 (0.0%) |
| Total (Overall) | 978 (52.9%) | 869 (47.0%) |
Production, Transportation and Moving Occupations
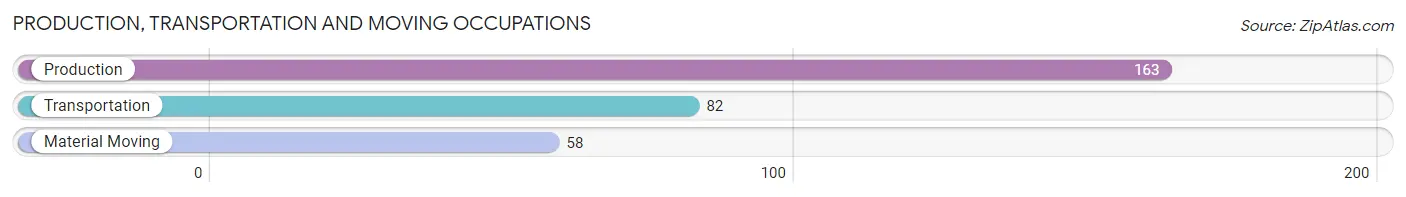
The most common Production, Transportation and Moving occupations in Lowell are Production (163 | 8.8%), Transportation (82 | 4.4%), and Material Moving (58 | 3.1%).
Production, Transportation and Moving Occupations by Sex
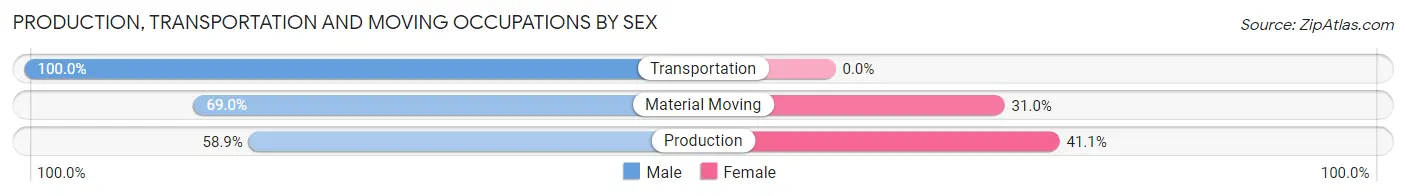
| Occupation | Male | Female |
| Production | 96 (58.9%) | 67 (41.1%) |
| Transportation | 82 (100.0%) | 0 (0.0%) |
| Material Moving | 40 (69.0%) | 18 (31.0%) |
| Total (Category) | 218 (72.0%) | 85 (28.1%) |
| Total (Overall) | 978 (52.9%) | 869 (47.0%) |
Employment Industries by Sex in Lowell
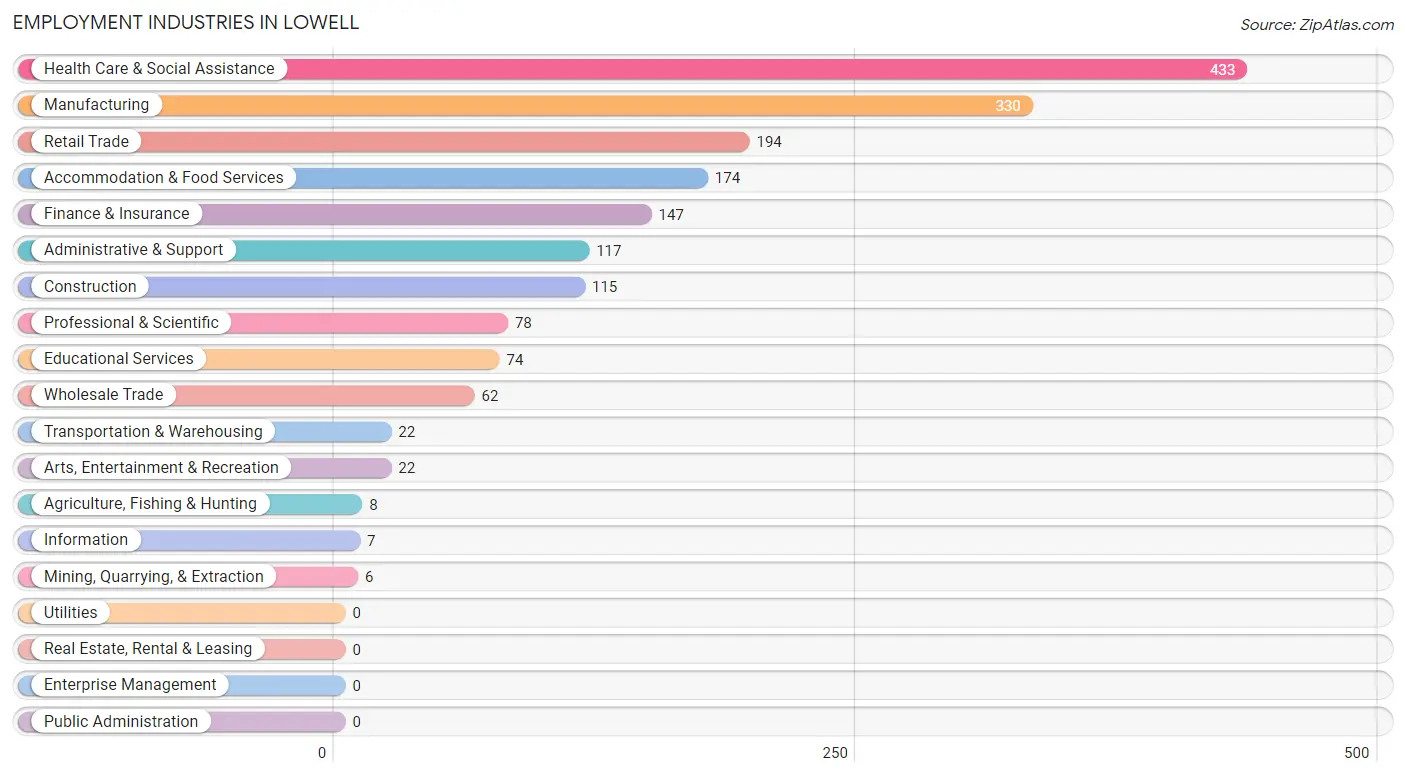
Employment Industries in Lowell
The major employment industries in Lowell include Health Care & Social Assistance (433 | 23.4%), Manufacturing (330 | 17.9%), Retail Trade (194 | 10.5%), Accommodation & Food Services (174 | 9.4%), and Finance & Insurance (147 | 8.0%).
Employment Industries by Sex in Lowell
The Lowell industries that see more men than women are Agriculture, Fishing & Hunting (100.0%), Mining, Quarrying, & Extraction (100.0%), and Construction (100.0%), whereas the industries that tend to have a higher number of women are Information (100.0%), Finance & Insurance (79.6%), and Wholesale Trade (74.2%).
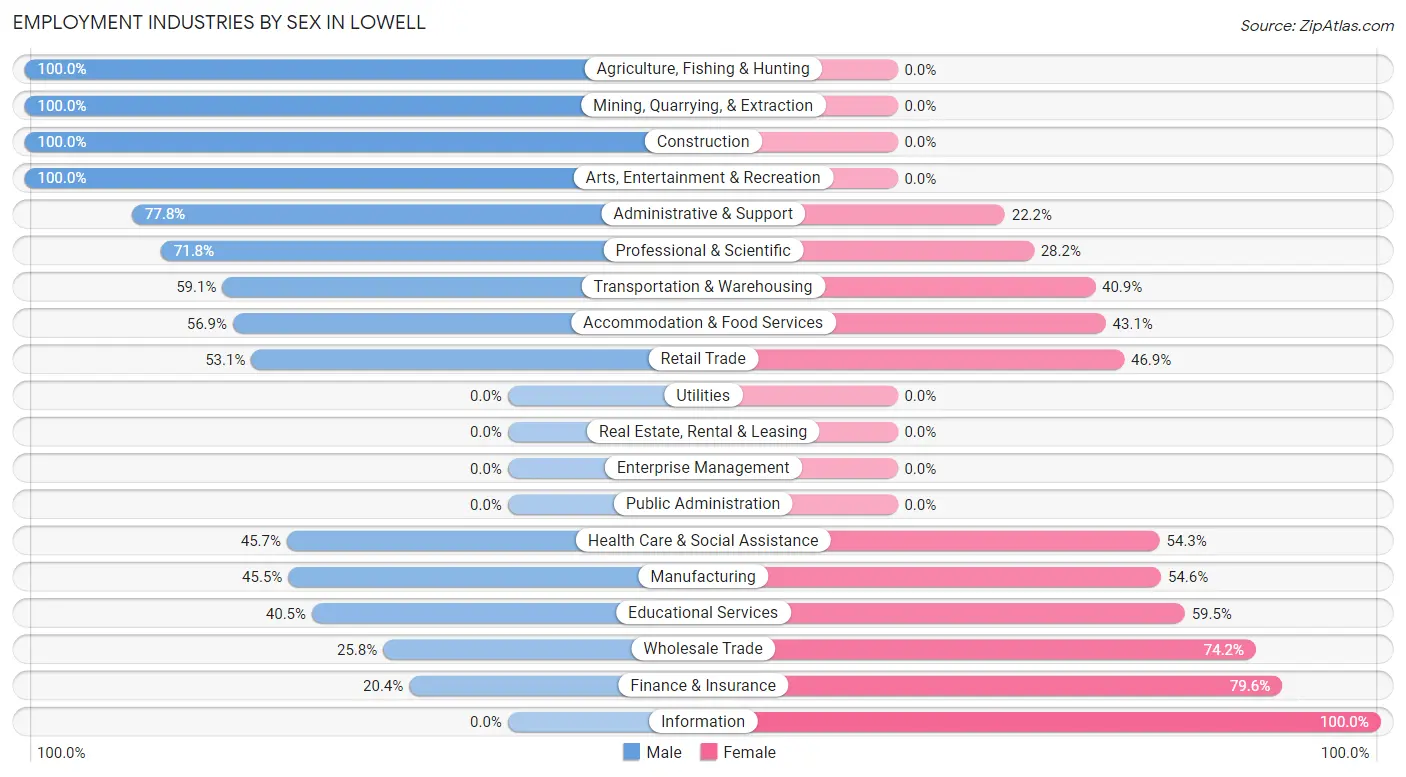
| Industry | Male | Female |
| Agriculture, Fishing & Hunting | 8 (100.0%) | 0 (0.0%) |
| Mining, Quarrying, & Extraction | 6 (100.0%) | 0 (0.0%) |
| Construction | 115 (100.0%) | 0 (0.0%) |
| Manufacturing | 150 (45.5%) | 180 (54.5%) |
| Wholesale Trade | 16 (25.8%) | 46 (74.2%) |
| Retail Trade | 103 (53.1%) | 91 (46.9%) |
| Transportation & Warehousing | 13 (59.1%) | 9 (40.9%) |
| Utilities | 0 (0.0%) | 0 (0.0%) |
| Information | 0 (0.0%) | 7 (100.0%) |
| Finance & Insurance | 30 (20.4%) | 117 (79.6%) |
| Real Estate, Rental & Leasing | 0 (0.0%) | 0 (0.0%) |
| Professional & Scientific | 56 (71.8%) | 22 (28.2%) |
| Enterprise Management | 0 (0.0%) | 0 (0.0%) |
| Administrative & Support | 91 (77.8%) | 26 (22.2%) |
| Educational Services | 30 (40.5%) | 44 (59.5%) |
| Health Care & Social Assistance | 198 (45.7%) | 235 (54.3%) |
| Arts, Entertainment & Recreation | 22 (100.0%) | 0 (0.0%) |
| Accommodation & Food Services | 99 (56.9%) | 75 (43.1%) |
| Public Administration | 0 (0.0%) | 0 (0.0%) |
| Total | 978 (52.9%) | 869 (47.0%) |
Education in Lowell
School Enrollment in Lowell
The most common levels of schooling among the 938 students in Lowell are elementary school (276 | 29.4%), middle school (197 | 21.0%), and nursery / preschool (181 | 19.3%).
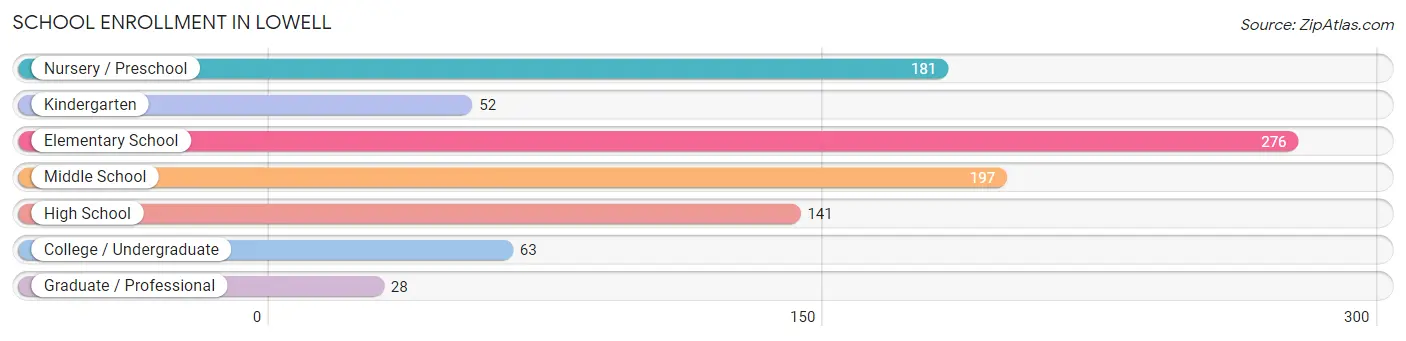
| School Level | # Students | % Students |
| Nursery / Preschool | 181 | 19.3% |
| Kindergarten | 52 | 5.5% |
| Elementary School | 276 | 29.4% |
| Middle School | 197 | 21.0% |
| High School | 141 | 15.0% |
| College / Undergraduate | 63 | 6.7% |
| Graduate / Professional | 28 | 3.0% |
| Total | 938 | 100.0% |
School Enrollment by Age by Funding Source in Lowell
Out of a total of 938 students who are enrolled in schools in Lowell, 27 (2.9%) attend a private institution, while the remaining 911 (97.1%) are enrolled in public schools. The age group of 35 years and over has the highest likelihood of being enrolled in private schools, with 16 (48.5% in the age bracket) enrolled. Conversely, the age group of 3 to 4 year olds has the lowest likelihood of being enrolled in a private school, with 34 (100.0% in the age bracket) attending a public institution.
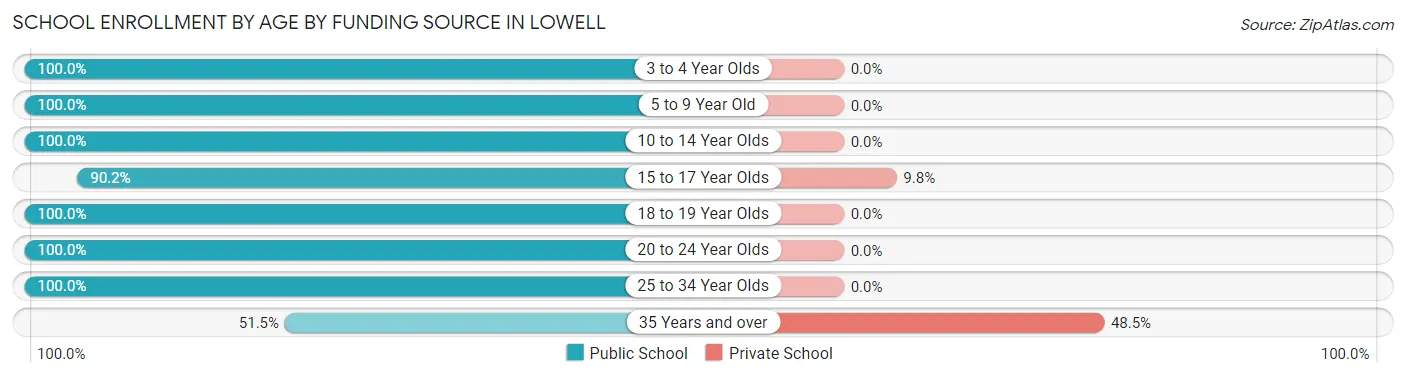
| Age Bracket | Public School | Private School |
| 3 to 4 Year Olds | 34 (100.0%) | 0 (0.0%) |
| 5 to 9 Year Old | 434 (100.0%) | 0 (0.0%) |
| 10 to 14 Year Olds | 254 (100.0%) | 0 (0.0%) |
| 15 to 17 Year Olds | 101 (90.2%) | 11 (9.8%) |
| 18 to 19 Year Olds | 58 (100.0%) | 0 (0.0%) |
| 20 to 24 Year Olds | 6 (100.0%) | 0 (0.0%) |
| 25 to 34 Year Olds | 7 (100.0%) | 0 (0.0%) |
| 35 Years and over | 17 (51.5%) | 16 (48.5%) |
| Total | 911 (97.1%) | 27 (2.9%) |
Educational Attainment by Field of Study in Lowell
Business (294 | 37.7%), education (140 | 17.9%), science & technology (84 | 10.8%), arts & humanities (69 | 8.8%), and communications (32 | 4.1%) are the most common fields of study among 780 individuals in Lowell who have obtained a bachelor's degree or higher.
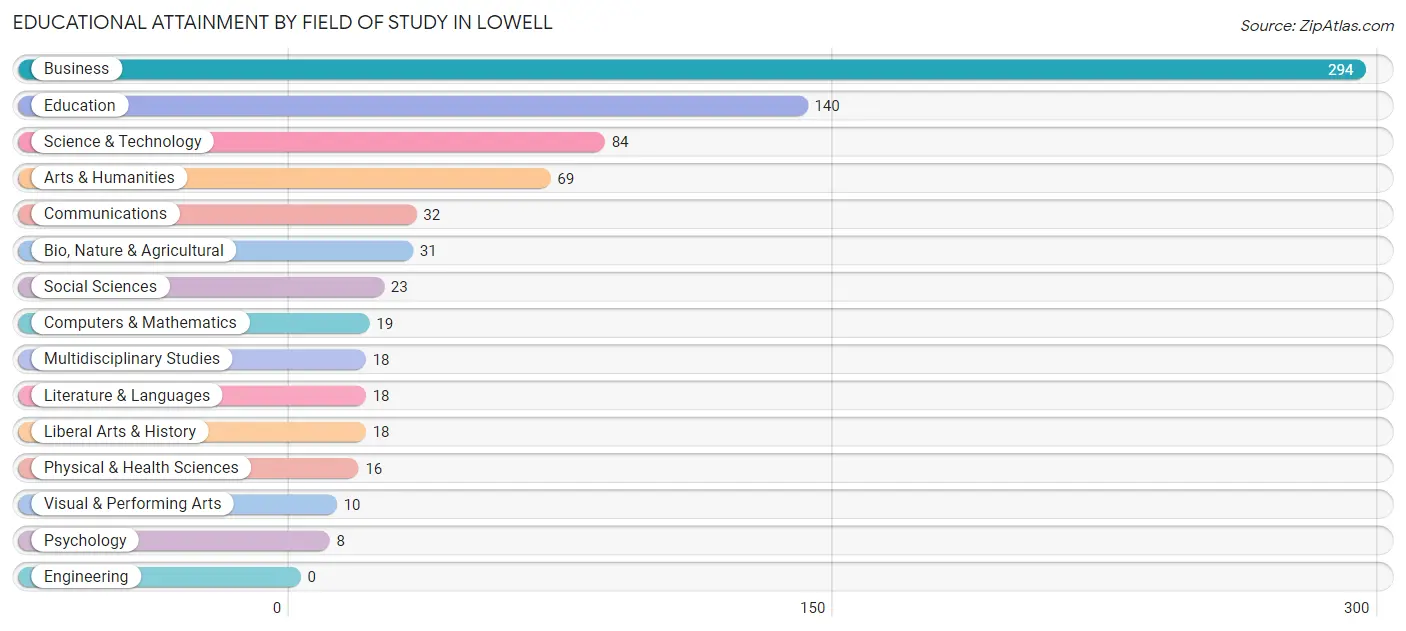
| Field of Study | # Graduates | % Graduates |
| Computers & Mathematics | 19 | 2.4% |
| Bio, Nature & Agricultural | 31 | 4.0% |
| Physical & Health Sciences | 16 | 2.1% |
| Psychology | 8 | 1.0% |
| Social Sciences | 23 | 2.9% |
| Engineering | 0 | 0.0% |
| Multidisciplinary Studies | 18 | 2.3% |
| Science & Technology | 84 | 10.8% |
| Business | 294 | 37.7% |
| Education | 140 | 17.9% |
| Literature & Languages | 18 | 2.3% |
| Liberal Arts & History | 18 | 2.3% |
| Visual & Performing Arts | 10 | 1.3% |
| Communications | 32 | 4.1% |
| Arts & Humanities | 69 | 8.8% |
| Total | 780 | 100.0% |
Transportation & Commute in Lowell
Vehicle Availability by Sex in Lowell
The most prevalent vehicle ownership categories in Lowell are males with 2 vehicles (538, accounting for 55.1%) and females with 2 vehicles (429, making up 62.6%).
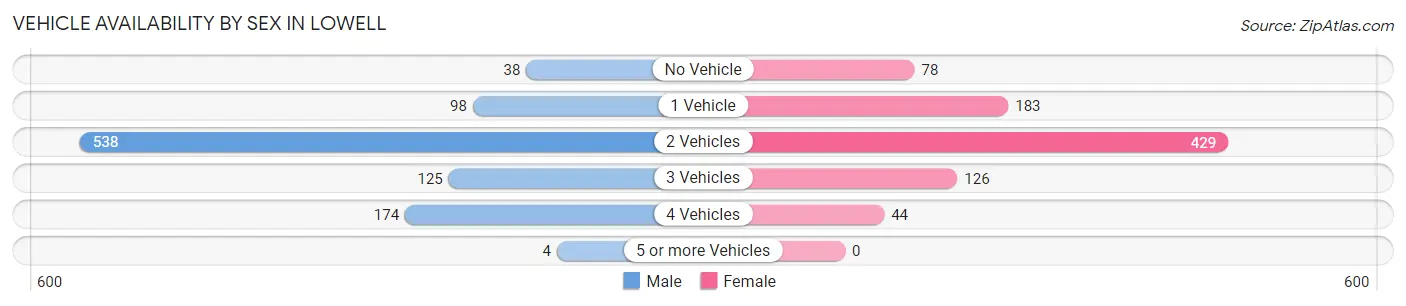
| Vehicles Available | Male | Female |
| No Vehicle | 38 (3.9%) | 78 (9.1%) |
| 1 Vehicle | 98 (10.0%) | 183 (21.3%) |
| 2 Vehicles | 538 (55.1%) | 429 (49.9%) |
| 3 Vehicles | 125 (12.8%) | 126 (14.6%) |
| 4 Vehicles | 174 (17.8%) | 44 (5.1%) |
| 5 or more Vehicles | 4 (0.4%) | 0 (0.0%) |
| Total | 977 (100.0%) | 860 (100.0%) |
Commute Time in Lowell
The most frequently occuring commute durations in Lowell are 25 to 29 minutes (334 commuters, 19.0%), 5 to 9 minutes (277 commuters, 15.8%), and 30 to 34 minutes (211 commuters, 12.0%).
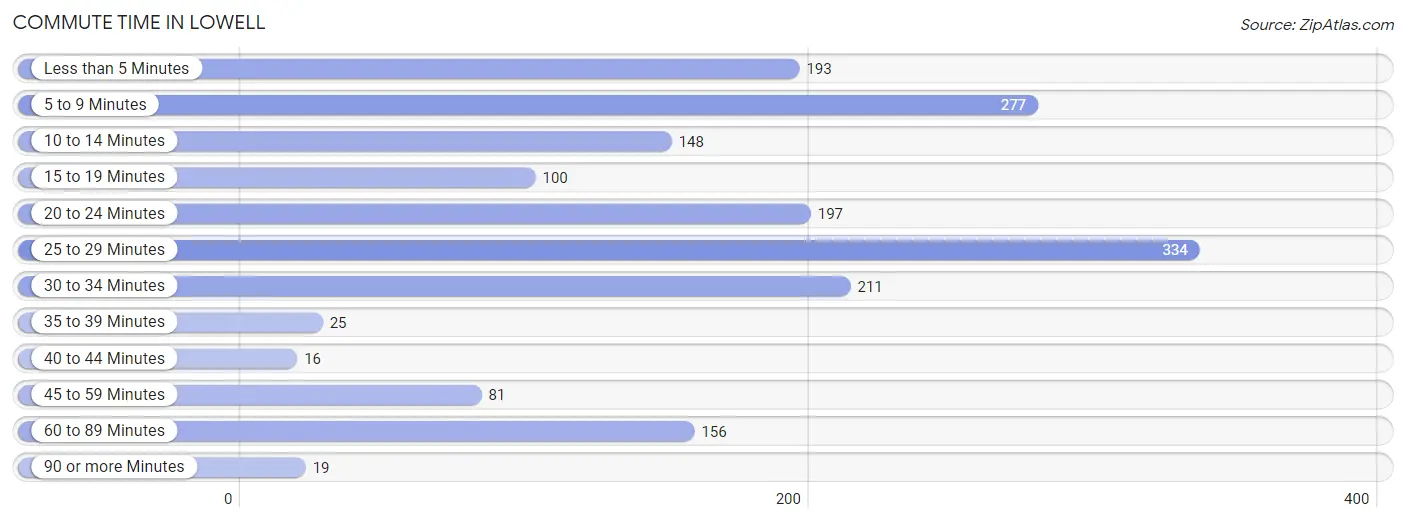
| Commute Time | # Commuters | % Commuters |
| Less than 5 Minutes | 193 | 11.0% |
| 5 to 9 Minutes | 277 | 15.8% |
| 10 to 14 Minutes | 148 | 8.4% |
| 15 to 19 Minutes | 100 | 5.7% |
| 20 to 24 Minutes | 197 | 11.2% |
| 25 to 29 Minutes | 334 | 19.0% |
| 30 to 34 Minutes | 211 | 12.0% |
| 35 to 39 Minutes | 25 | 1.4% |
| 40 to 44 Minutes | 16 | 0.9% |
| 45 to 59 Minutes | 81 | 4.6% |
| 60 to 89 Minutes | 156 | 8.9% |
| 90 or more Minutes | 19 | 1.1% |
Commute Time by Sex in Lowell
The most common commute times in Lowell are 20 to 24 minutes (167 commuters, 17.5%) for males and 25 to 29 minutes (196 commuters, 24.4%) for females.
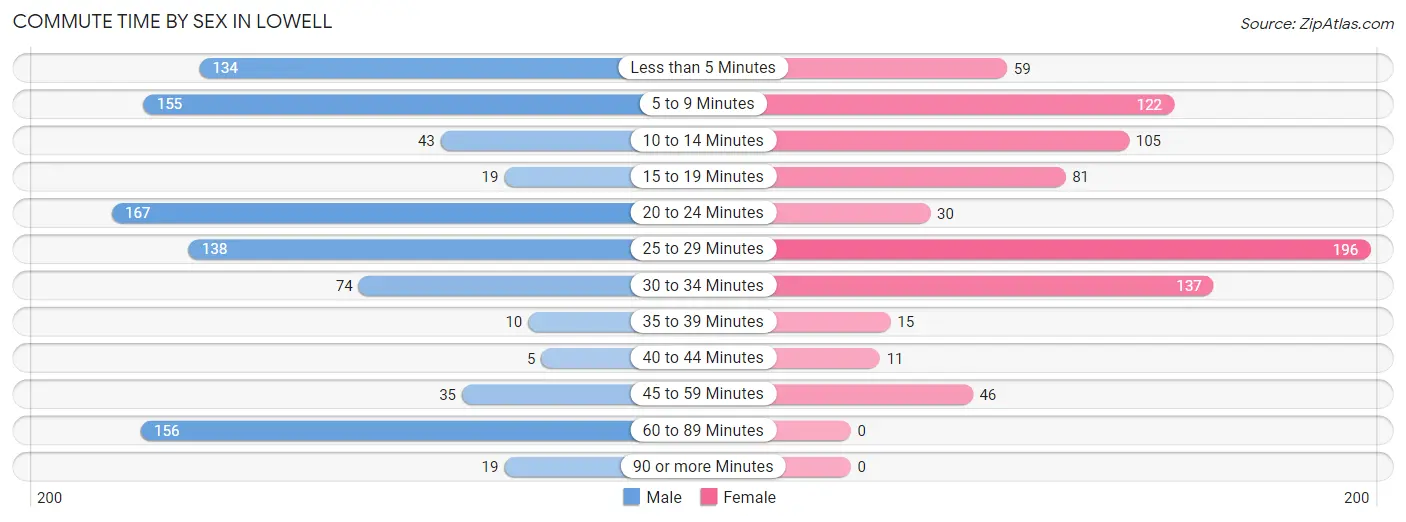
| Commute Time | Male | Female |
| Less than 5 Minutes | 134 (14.0%) | 59 (7.4%) |
| 5 to 9 Minutes | 155 (16.2%) | 122 (15.2%) |
| 10 to 14 Minutes | 43 (4.5%) | 105 (13.1%) |
| 15 to 19 Minutes | 19 (2.0%) | 81 (10.1%) |
| 20 to 24 Minutes | 167 (17.5%) | 30 (3.7%) |
| 25 to 29 Minutes | 138 (14.4%) | 196 (24.4%) |
| 30 to 34 Minutes | 74 (7.7%) | 137 (17.1%) |
| 35 to 39 Minutes | 10 (1.1%) | 15 (1.9%) |
| 40 to 44 Minutes | 5 (0.5%) | 11 (1.4%) |
| 45 to 59 Minutes | 35 (3.7%) | 46 (5.7%) |
| 60 to 89 Minutes | 156 (16.3%) | 0 (0.0%) |
| 90 or more Minutes | 19 (2.0%) | 0 (0.0%) |
Time of Departure to Work by Sex in Lowell
The most frequent times of departure to work in Lowell are 12:00 AM to 4:59 AM (156, 16.3%) for males and 7:00 AM to 7:29 AM (151, 18.8%) for females.
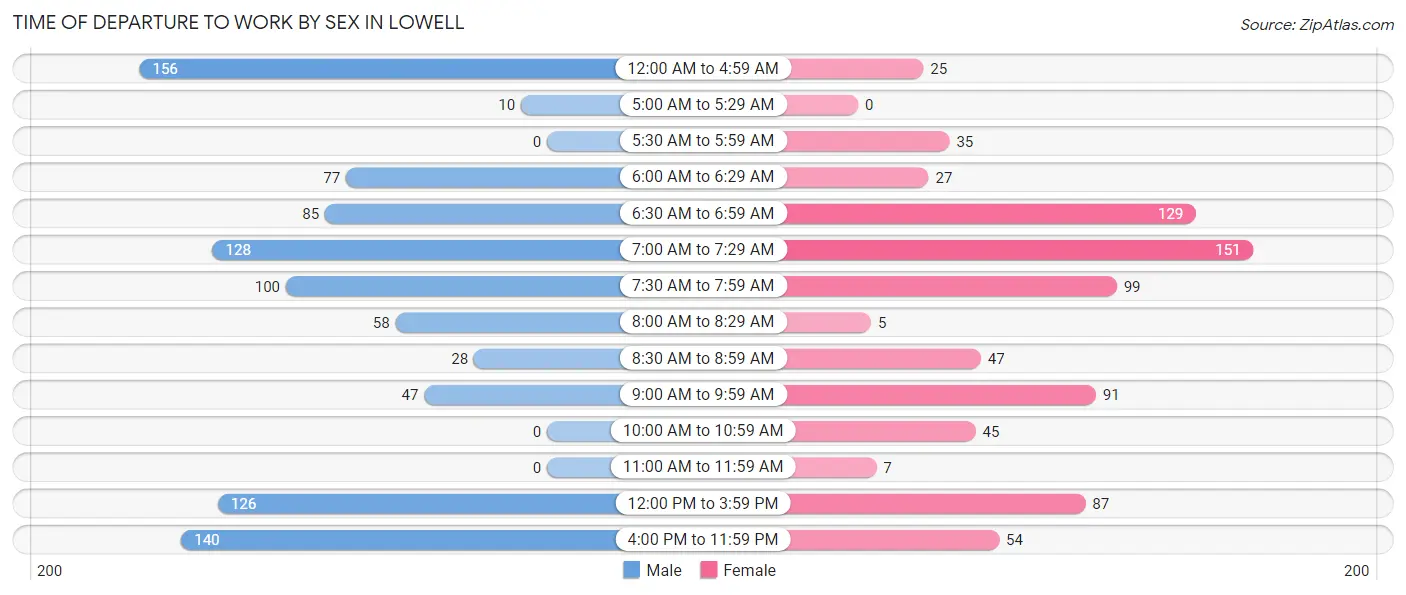
| Time of Departure | Male | Female |
| 12:00 AM to 4:59 AM | 156 (16.3%) | 25 (3.1%) |
| 5:00 AM to 5:29 AM | 10 (1.1%) | 0 (0.0%) |
| 5:30 AM to 5:59 AM | 0 (0.0%) | 35 (4.4%) |
| 6:00 AM to 6:29 AM | 77 (8.1%) | 27 (3.4%) |
| 6:30 AM to 6:59 AM | 85 (8.9%) | 129 (16.1%) |
| 7:00 AM to 7:29 AM | 128 (13.4%) | 151 (18.8%) |
| 7:30 AM to 7:59 AM | 100 (10.5%) | 99 (12.3%) |
| 8:00 AM to 8:29 AM | 58 (6.1%) | 5 (0.6%) |
| 8:30 AM to 8:59 AM | 28 (2.9%) | 47 (5.9%) |
| 9:00 AM to 9:59 AM | 47 (4.9%) | 91 (11.4%) |
| 10:00 AM to 10:59 AM | 0 (0.0%) | 45 (5.6%) |
| 11:00 AM to 11:59 AM | 0 (0.0%) | 7 (0.9%) |
| 12:00 PM to 3:59 PM | 126 (13.2%) | 87 (10.8%) |
| 4:00 PM to 11:59 PM | 140 (14.7%) | 54 (6.7%) |
| Total | 955 (100.0%) | 802 (100.0%) |
Housing Occupancy in Lowell
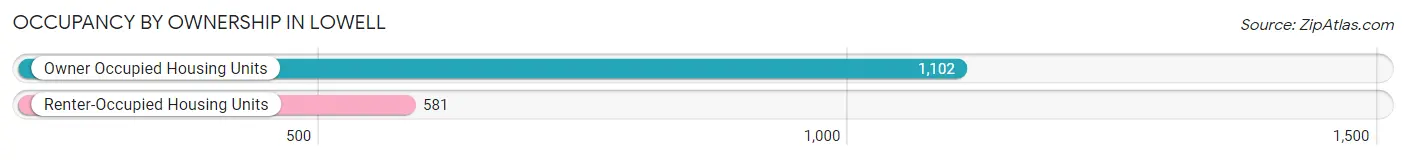
Occupancy by Ownership in Lowell
Of the total 1,683 dwellings in Lowell, owner-occupied units account for 1,102 (65.5%), while renter-occupied units make up 581 (34.5%).
| Occupancy | # Housing Units | % Housing Units |
| Owner Occupied Housing Units | 1,102 | 65.5% |
| Renter-Occupied Housing Units | 581 | 34.5% |
| Total Occupied Housing Units | 1,683 | 100.0% |
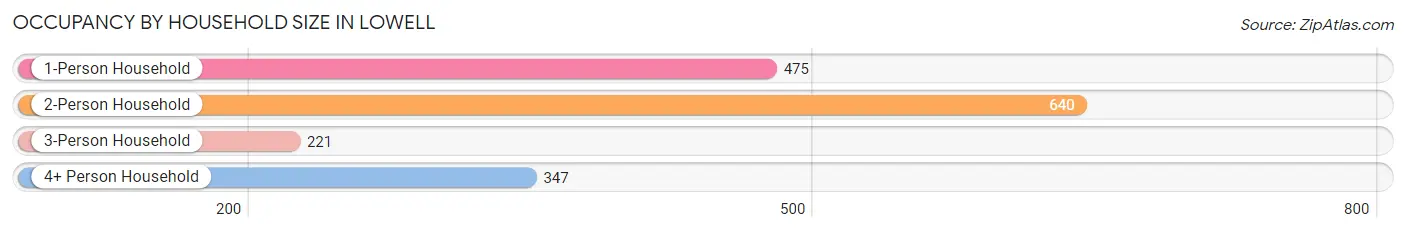
Occupancy by Household Size in Lowell
| Household Size | # Housing Units | % Housing Units |
| 1-Person Household | 475 | 28.2% |
| 2-Person Household | 640 | 38.0% |
| 3-Person Household | 221 | 13.1% |
| 4+ Person Household | 347 | 20.6% |
| Total Housing Units | 1,683 | 100.0% |
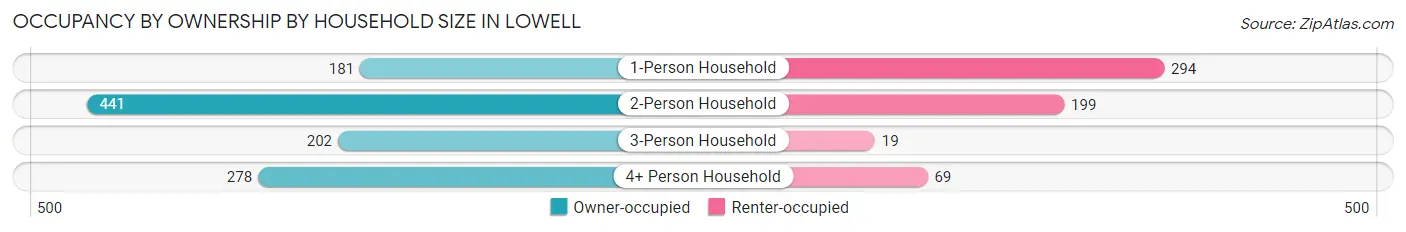
Occupancy by Ownership by Household Size in Lowell
| Household Size | Owner-occupied | Renter-occupied |
| 1-Person Household | 181 (38.1%) | 294 (61.9%) |
| 2-Person Household | 441 (68.9%) | 199 (31.1%) |
| 3-Person Household | 202 (91.4%) | 19 (8.6%) |
| 4+ Person Household | 278 (80.1%) | 69 (19.9%) |
| Total Housing Units | 1,102 (65.5%) | 581 (34.5%) |
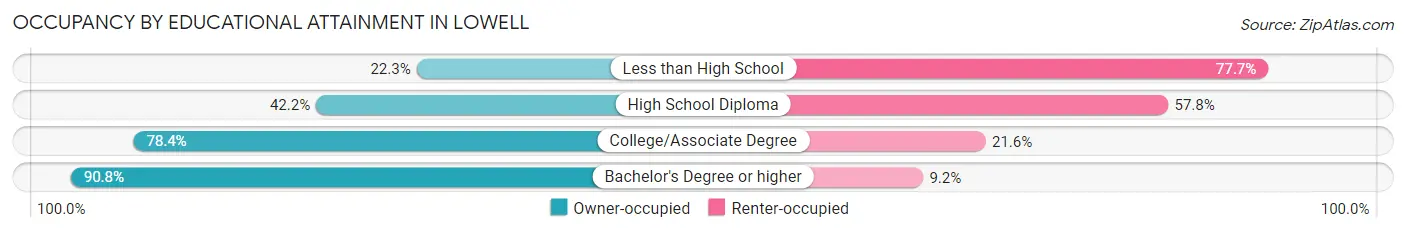
Occupancy by Educational Attainment in Lowell
| Household Size | Owner-occupied | Renter-occupied |
| Less than High School | 31 (22.3%) | 108 (77.7%) |
| High School Diploma | 231 (42.2%) | 316 (57.8%) |
| College/Associate Degree | 414 (78.4%) | 114 (21.6%) |
| Bachelor's Degree or higher | 426 (90.8%) | 43 (9.2%) |
Occupancy by Age of Householder in Lowell
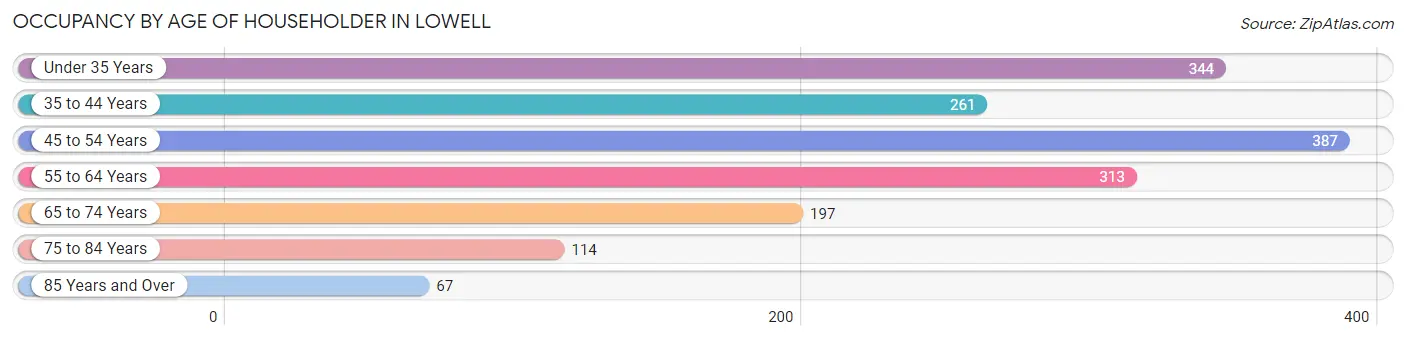
| Age Bracket | # Households | % Households |
| Under 35 Years | 344 | 20.4% |
| 35 to 44 Years | 261 | 15.5% |
| 45 to 54 Years | 387 | 23.0% |
| 55 to 64 Years | 313 | 18.6% |
| 65 to 74 Years | 197 | 11.7% |
| 75 to 84 Years | 114 | 6.8% |
| 85 Years and Over | 67 | 4.0% |
| Total | 1,683 | 100.0% |
Housing Finances in Lowell
Median Income by Occupancy in Lowell
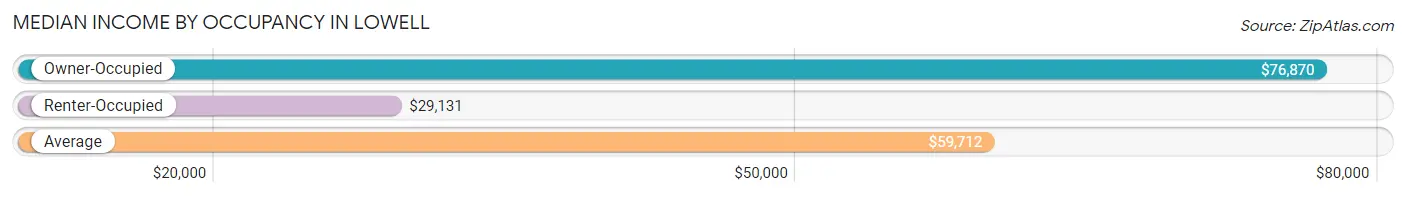
| Occupancy Type | # Households | Median Income |
| Owner-Occupied | 1,102 (65.5%) | $76,870 |
| Renter-Occupied | 581 (34.5%) | $29,131 |
| Average | 1,683 (100.0%) | $59,712 |
Occupancy by Householder Income Bracket in Lowell
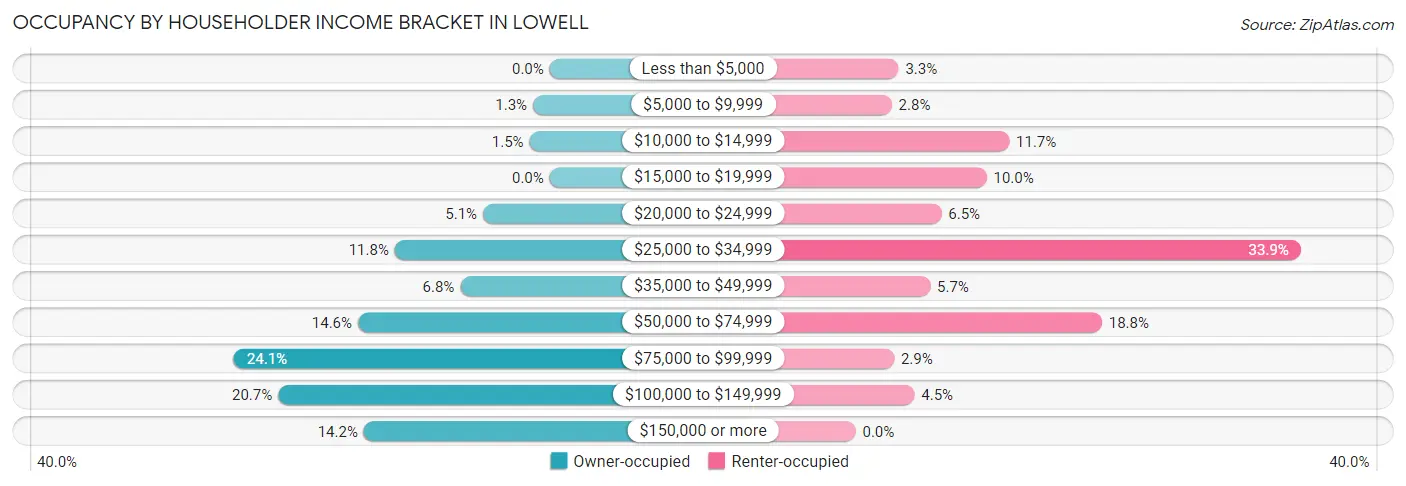
| Income Bracket | Owner-occupied | Renter-occupied |
| Less than $5,000 | 0 (0.0%) | 19 (3.3%) |
| $5,000 to $9,999 | 14 (1.3%) | 16 (2.8%) |
| $10,000 to $14,999 | 17 (1.5%) | 68 (11.7%) |
| $15,000 to $19,999 | 0 (0.0%) | 58 (10.0%) |
| $20,000 to $24,999 | 56 (5.1%) | 38 (6.5%) |
| $25,000 to $34,999 | 130 (11.8%) | 197 (33.9%) |
| $35,000 to $49,999 | 75 (6.8%) | 33 (5.7%) |
| $50,000 to $74,999 | 161 (14.6%) | 109 (18.8%) |
| $75,000 to $99,999 | 265 (24.0%) | 17 (2.9%) |
| $100,000 to $149,999 | 228 (20.7%) | 26 (4.5%) |
| $150,000 or more | 156 (14.2%) | 0 (0.0%) |
| Total | 1,102 (100.0%) | 581 (100.0%) |
Monthly Housing Cost Tiers in Lowell
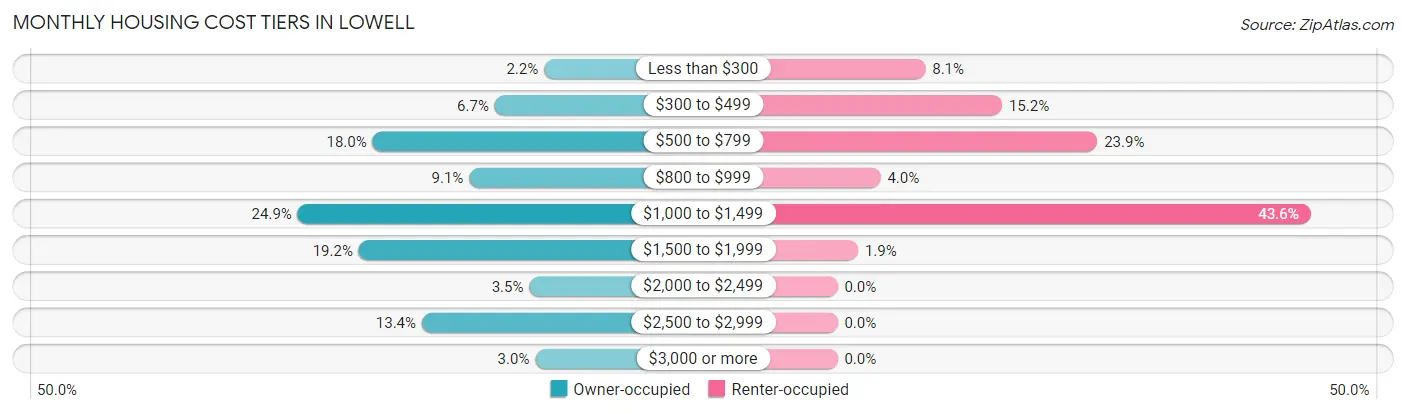
| Monthly Cost | Owner-occupied | Renter-occupied |
| Less than $300 | 24 (2.2%) | 47 (8.1%) |
| $300 to $499 | 74 (6.7%) | 88 (15.1%) |
| $500 to $799 | 198 (18.0%) | 139 (23.9%) |
| $800 to $999 | 100 (9.1%) | 23 (4.0%) |
| $1,000 to $1,499 | 274 (24.9%) | 253 (43.5%) |
| $1,500 to $1,999 | 212 (19.2%) | 11 (1.9%) |
| $2,000 to $2,499 | 39 (3.5%) | 0 (0.0%) |
| $2,500 to $2,999 | 148 (13.4%) | 0 (0.0%) |
| $3,000 or more | 33 (3.0%) | 0 (0.0%) |
| Total | 1,102 (100.0%) | 581 (100.0%) |
Physical Housing Characteristics in Lowell
Housing Structures in Lowell
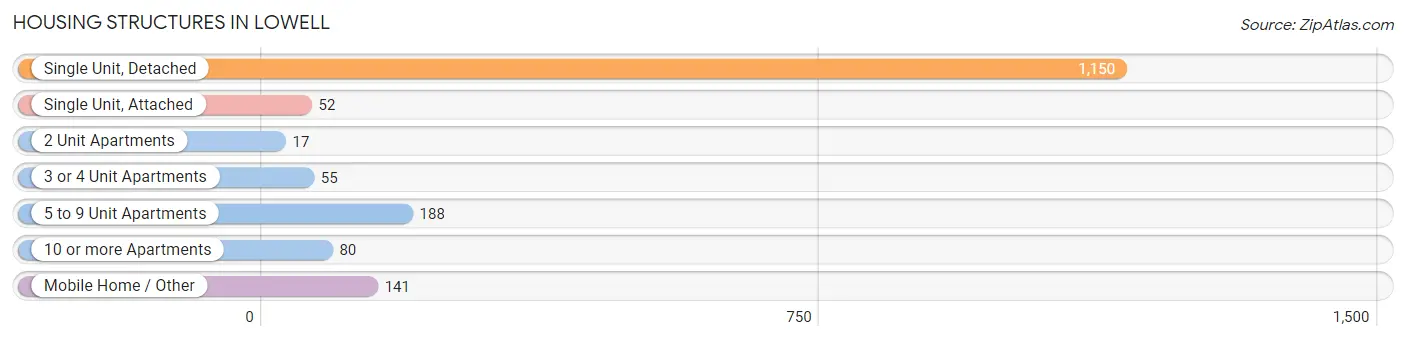
| Structure Type | # Housing Units | % Housing Units |
| Single Unit, Detached | 1,150 | 68.3% |
| Single Unit, Attached | 52 | 3.1% |
| 2 Unit Apartments | 17 | 1.0% |
| 3 or 4 Unit Apartments | 55 | 3.3% |
| 5 to 9 Unit Apartments | 188 | 11.2% |
| 10 or more Apartments | 80 | 4.8% |
| Mobile Home / Other | 141 | 8.4% |
| Total | 1,683 | 100.0% |
Housing Structures by Occupancy in Lowell
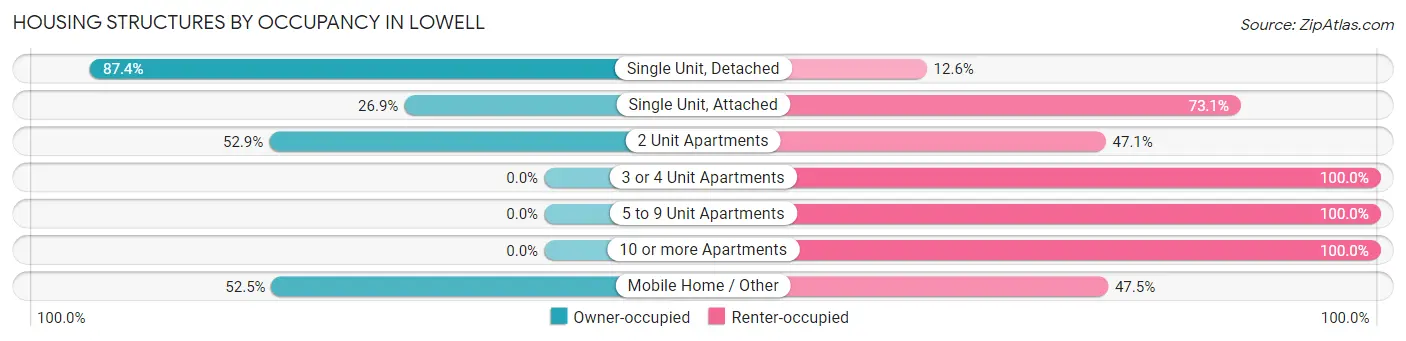
| Structure Type | Owner-occupied | Renter-occupied |
| Single Unit, Detached | 1,005 (87.4%) | 145 (12.6%) |
| Single Unit, Attached | 14 (26.9%) | 38 (73.1%) |
| 2 Unit Apartments | 9 (52.9%) | 8 (47.1%) |
| 3 or 4 Unit Apartments | 0 (0.0%) | 55 (100.0%) |
| 5 to 9 Unit Apartments | 0 (0.0%) | 188 (100.0%) |
| 10 or more Apartments | 0 (0.0%) | 80 (100.0%) |
| Mobile Home / Other | 74 (52.5%) | 67 (47.5%) |
| Total | 1,102 (65.5%) | 581 (34.5%) |
Housing Structures by Number of Rooms in Lowell
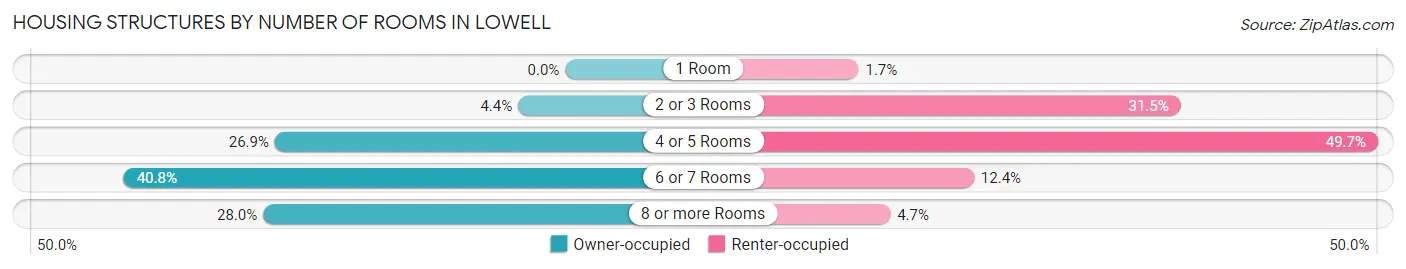
| Number of Rooms | Owner-occupied | Renter-occupied |
| 1 Room | 0 (0.0%) | 10 (1.7%) |
| 2 or 3 Rooms | 48 (4.4%) | 183 (31.5%) |
| 4 or 5 Rooms | 296 (26.9%) | 289 (49.7%) |
| 6 or 7 Rooms | 450 (40.8%) | 72 (12.4%) |
| 8 or more Rooms | 308 (28.0%) | 27 (4.6%) |
| Total | 1,102 (100.0%) | 581 (100.0%) |
Housing Structure by Heating Type in Lowell
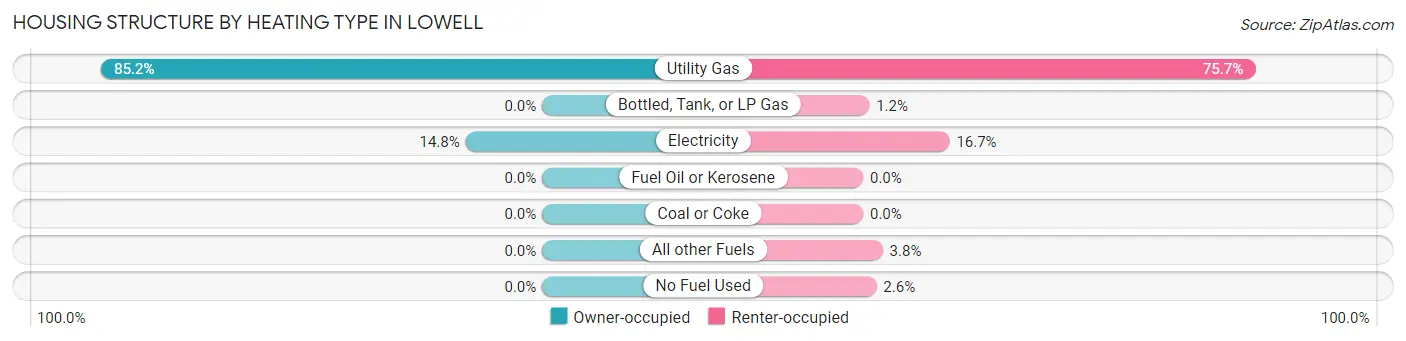
| Heating Type | Owner-occupied | Renter-occupied |
| Utility Gas | 939 (85.2%) | 440 (75.7%) |
| Bottled, Tank, or LP Gas | 0 (0.0%) | 7 (1.2%) |
| Electricity | 163 (14.8%) | 97 (16.7%) |
| Fuel Oil or Kerosene | 0 (0.0%) | 0 (0.0%) |
| Coal or Coke | 0 (0.0%) | 0 (0.0%) |
| All other Fuels | 0 (0.0%) | 22 (3.8%) |
| No Fuel Used | 0 (0.0%) | 15 (2.6%) |
| Total | 1,102 (100.0%) | 581 (100.0%) |
Household Vehicle Usage in Lowell
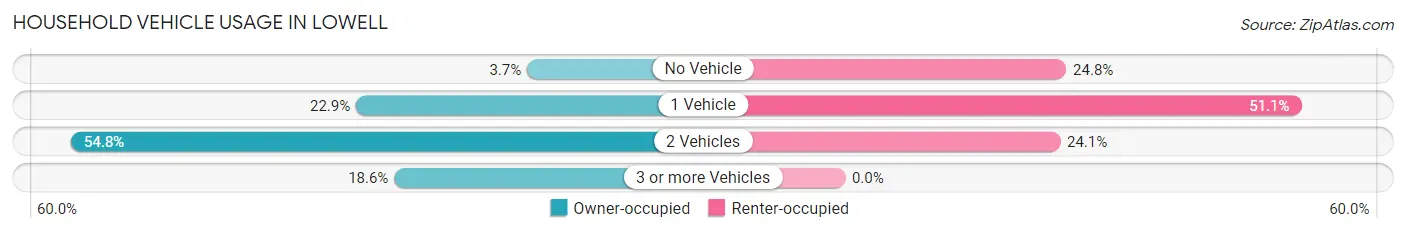
| Vehicles per Household | Owner-occupied | Renter-occupied |
| No Vehicle | 41 (3.7%) | 144 (24.8%) |
| 1 Vehicle | 252 (22.9%) | 297 (51.1%) |
| 2 Vehicles | 604 (54.8%) | 140 (24.1%) |
| 3 or more Vehicles | 205 (18.6%) | 0 (0.0%) |
| Total | 1,102 (100.0%) | 581 (100.0%) |
Real Estate & Mortgages in Lowell
Real Estate and Mortgage Overview in Lowell
| Characteristic | Without Mortgage | With Mortgage |
| Housing Units | 271 | 831 |
| Median Property Value | $142,200 | $226,300 |
| Median Household Income | $30,583 | $142 |
| Monthly Housing Costs | $538 | $33 |
| Real Estate Taxes | $2,541 | $5 |
Property Value by Mortgage Status in Lowell
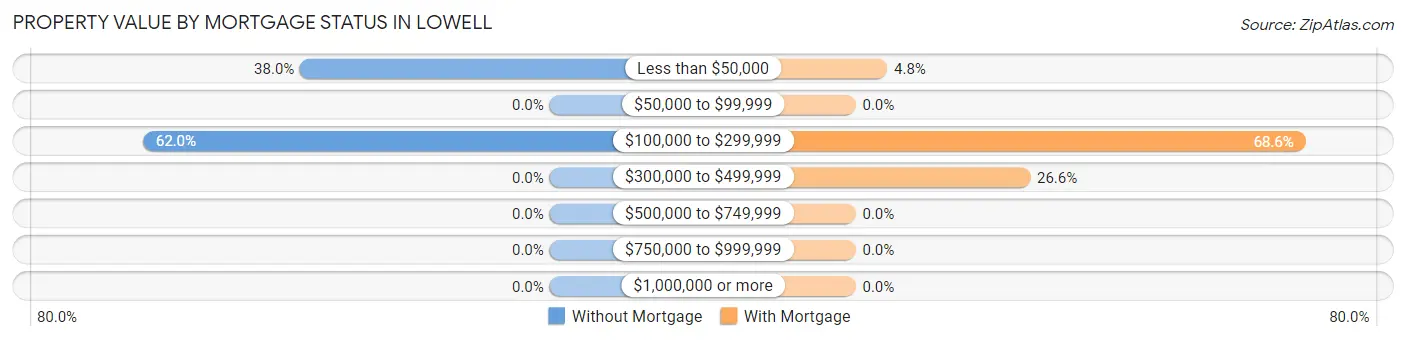
| Property Value | Without Mortgage | With Mortgage |
| Less than $50,000 | 103 (38.0%) | 40 (4.8%) |
| $50,000 to $99,999 | 0 (0.0%) | 0 (0.0%) |
| $100,000 to $299,999 | 168 (62.0%) | 570 (68.6%) |
| $300,000 to $499,999 | 0 (0.0%) | 221 (26.6%) |
| $500,000 to $749,999 | 0 (0.0%) | 0 (0.0%) |
| $750,000 to $999,999 | 0 (0.0%) | 0 (0.0%) |
| $1,000,000 or more | 0 (0.0%) | 0 (0.0%) |
| Total | 271 (100.0%) | 831 (100.0%) |
Household Income by Mortgage Status in Lowell
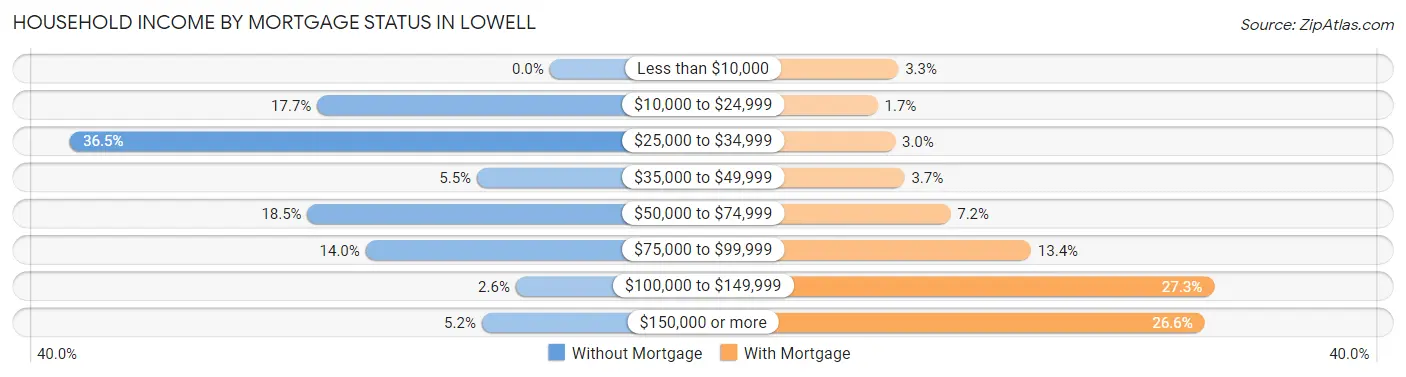
| Household Income | Without Mortgage | With Mortgage |
| Less than $10,000 | 0 (0.0%) | 27 (3.3%) |
| $10,000 to $24,999 | 48 (17.7%) | 14 (1.7%) |
| $25,000 to $34,999 | 99 (36.5%) | 25 (3.0%) |
| $35,000 to $49,999 | 15 (5.5%) | 31 (3.7%) |
| $50,000 to $74,999 | 50 (18.4%) | 60 (7.2%) |
| $75,000 to $99,999 | 38 (14.0%) | 111 (13.4%) |
| $100,000 to $149,999 | 7 (2.6%) | 227 (27.3%) |
| $150,000 or more | 14 (5.2%) | 221 (26.6%) |
| Total | 271 (100.0%) | 831 (100.0%) |
Property Value to Household Income Ratio in Lowell
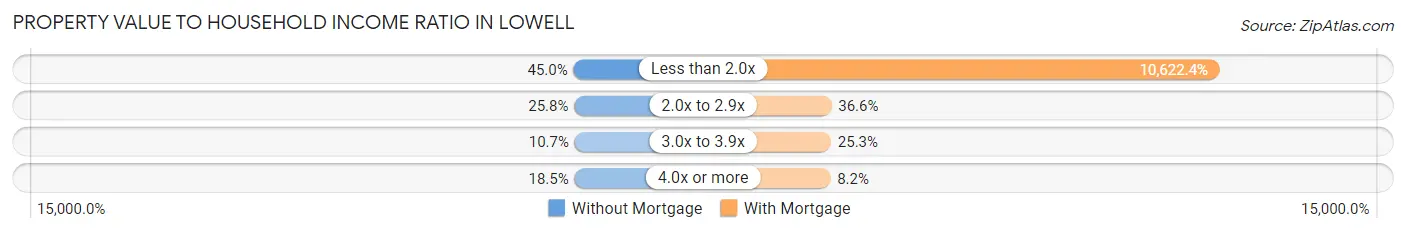
| Value-to-Income Ratio | Without Mortgage | With Mortgage |
| Less than 2.0x | 122 (45.0%) | 88,272 (10,622.4%) |
| 2.0x to 2.9x | 70 (25.8%) | 304 (36.6%) |
| 3.0x to 3.9x | 29 (10.7%) | 210 (25.3%) |
| 4.0x or more | 50 (18.4%) | 68 (8.2%) |
| Total | 271 (100.0%) | 831 (100.0%) |
Real Estate Taxes by Mortgage Status in Lowell
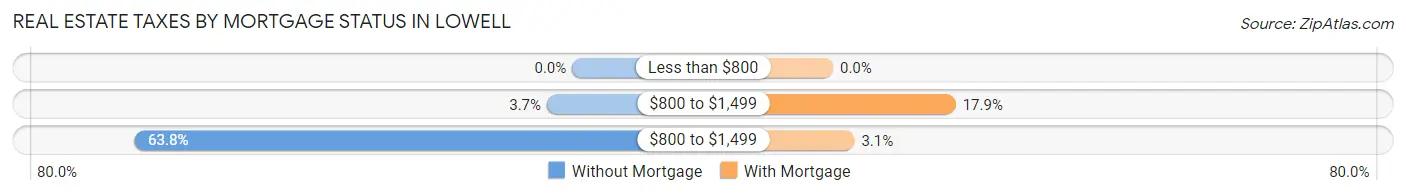
| Property Taxes | Without Mortgage | With Mortgage |
| Less than $800 | 0 (0.0%) | 0 (0.0%) |
| $800 to $1,499 | 10 (3.7%) | 149 (17.9%) |
| $800 to $1,499 | 173 (63.8%) | 26 (3.1%) |
| Total | 271 (100.0%) | 831 (100.0%) |
Health & Disability in Lowell
Health Insurance Coverage by Age in Lowell
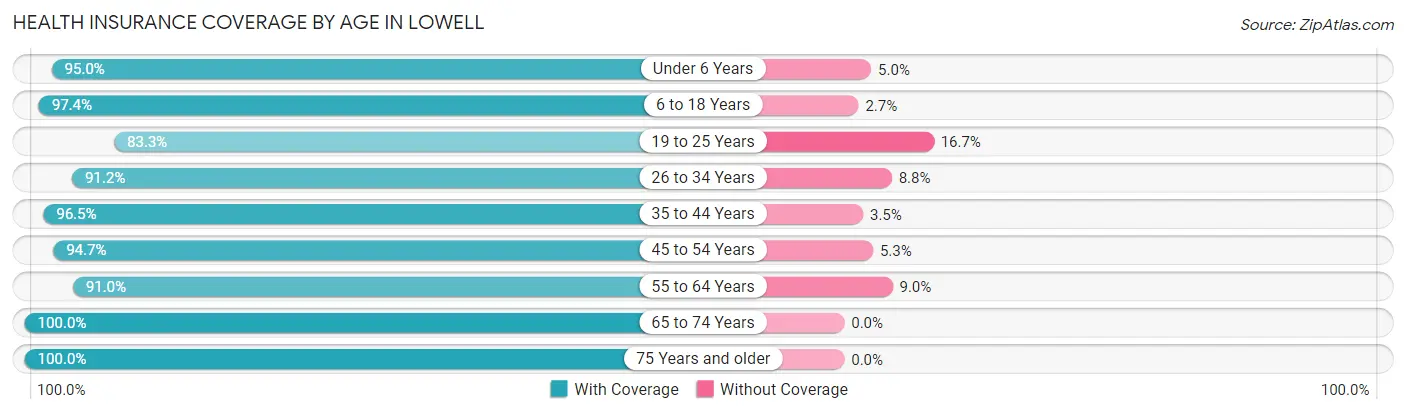
| Age Bracket | With Coverage | Without Coverage |
| Under 6 Years | 398 (95.0%) | 21 (5.0%) |
| 6 to 18 Years | 662 (97.4%) | 18 (2.6%) |
| 19 to 25 Years | 220 (83.3%) | 44 (16.7%) |
| 26 to 34 Years | 392 (91.2%) | 38 (8.8%) |
| 35 to 44 Years | 606 (96.5%) | 22 (3.5%) |
| 45 to 54 Years | 532 (94.7%) | 30 (5.3%) |
| 55 to 64 Years | 395 (91.0%) | 39 (9.0%) |
| 65 to 74 Years | 331 (100.0%) | 0 (0.0%) |
| 75 Years and older | 252 (100.0%) | 0 (0.0%) |
| Total | 3,788 (94.7%) | 212 (5.3%) |
Health Insurance Coverage by Citizenship Status in Lowell
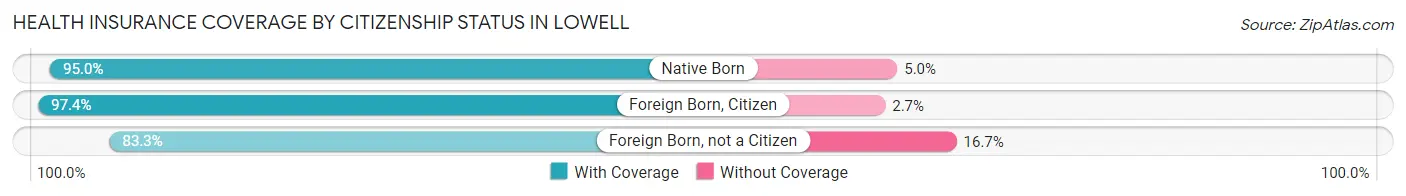
| Citizenship Status | With Coverage | Without Coverage |
| Native Born | 398 (95.0%) | 21 (5.0%) |
| Foreign Born, Citizen | 662 (97.4%) | 18 (2.6%) |
| Foreign Born, not a Citizen | 220 (83.3%) | 44 (16.7%) |
Health Insurance Coverage by Household Income in Lowell
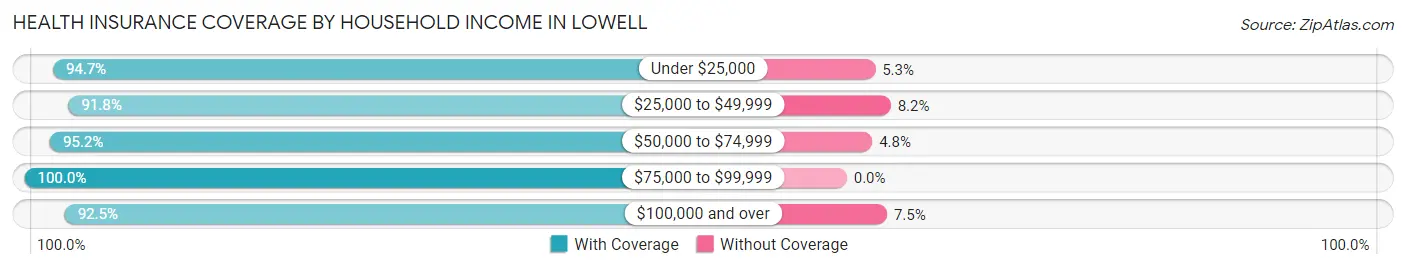
| Household Income | With Coverage | Without Coverage |
| Under $25,000 | 338 (94.7%) | 19 (5.3%) |
| $25,000 to $49,999 | 803 (91.8%) | 72 (8.2%) |
| $50,000 to $74,999 | 560 (95.2%) | 28 (4.8%) |
| $75,000 to $99,999 | 939 (100.0%) | 0 (0.0%) |
| $100,000 and over | 1,143 (92.5%) | 93 (7.5%) |
Public vs Private Health Insurance Coverage by Age in Lowell
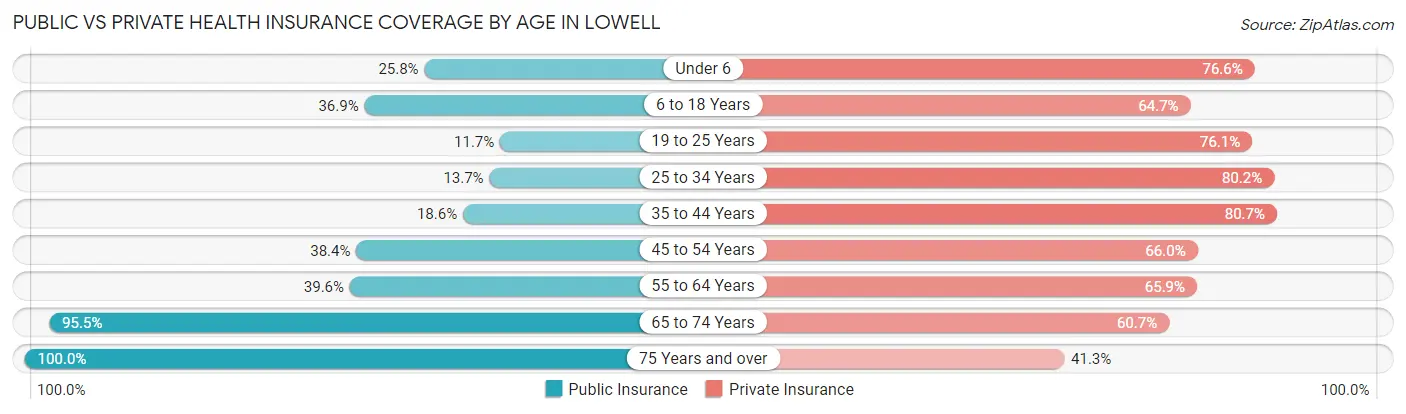
| Age Bracket | Public Insurance | Private Insurance |
| Under 6 | 108 (25.8%) | 321 (76.6%) |
| 6 to 18 Years | 251 (36.9%) | 440 (64.7%) |
| 19 to 25 Years | 31 (11.7%) | 201 (76.1%) |
| 25 to 34 Years | 59 (13.7%) | 345 (80.2%) |
| 35 to 44 Years | 117 (18.6%) | 507 (80.7%) |
| 45 to 54 Years | 216 (38.4%) | 371 (66.0%) |
| 55 to 64 Years | 172 (39.6%) | 286 (65.9%) |
| 65 to 74 Years | 316 (95.5%) | 201 (60.7%) |
| 75 Years and over | 252 (100.0%) | 104 (41.3%) |
| Total | 1,522 (38.1%) | 2,776 (69.4%) |
Disability Status by Sex by Age in Lowell
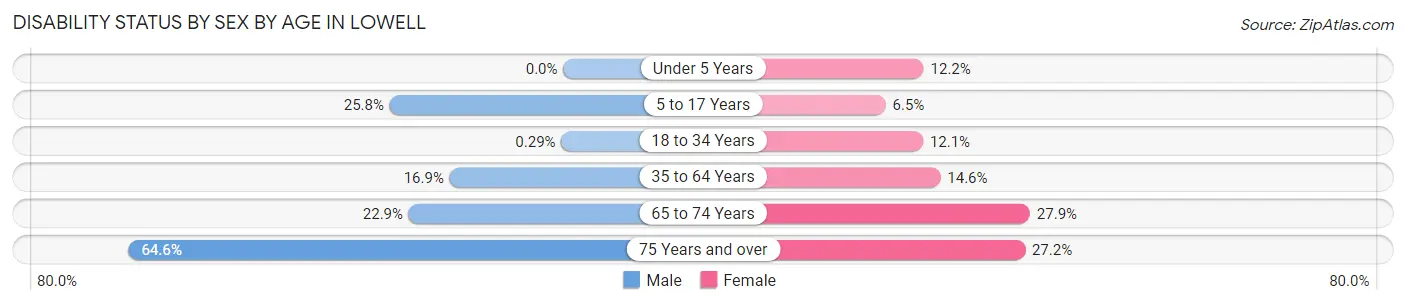
| Age Bracket | Male | Female |
| Under 5 Years | 0 (0.0%) | 13 (12.1%) |
| 5 to 17 Years | 143 (25.8%) | 17 (6.5%) |
| 18 to 34 Years | 1 (0.3%) | 47 (12.0%) |
| 35 to 64 Years | 123 (16.9%) | 131 (14.6%) |
| 65 to 74 Years | 25 (22.9%) | 62 (27.9%) |
| 75 Years and over | 82 (64.6%) | 34 (27.2%) |
Disability Class by Sex by Age in Lowell
Disability Class: Hearing Difficulty
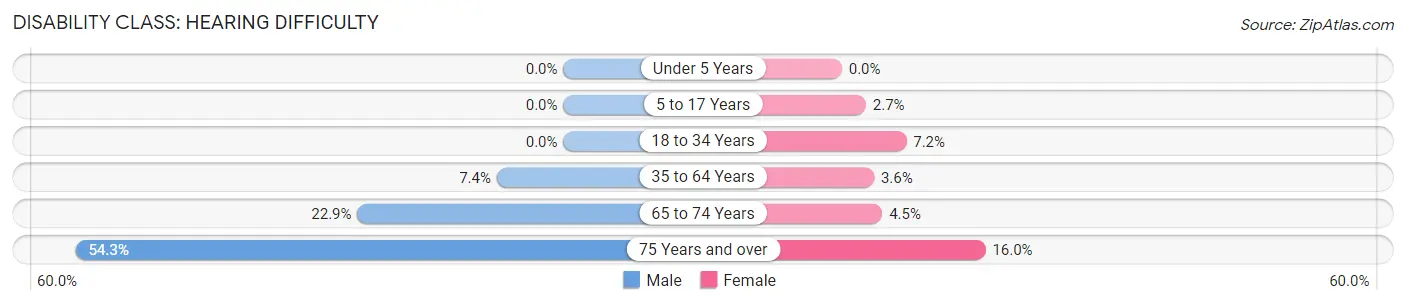
| Age Bracket | Male | Female |
| Under 5 Years | 0 (0.0%) | 0 (0.0%) |
| 5 to 17 Years | 0 (0.0%) | 7 (2.7%) |
| 18 to 34 Years | 0 (0.0%) | 28 (7.2%) |
| 35 to 64 Years | 54 (7.4%) | 32 (3.6%) |
| 65 to 74 Years | 25 (22.9%) | 10 (4.5%) |
| 75 Years and over | 69 (54.3%) | 20 (16.0%) |
Disability Class: Vision Difficulty
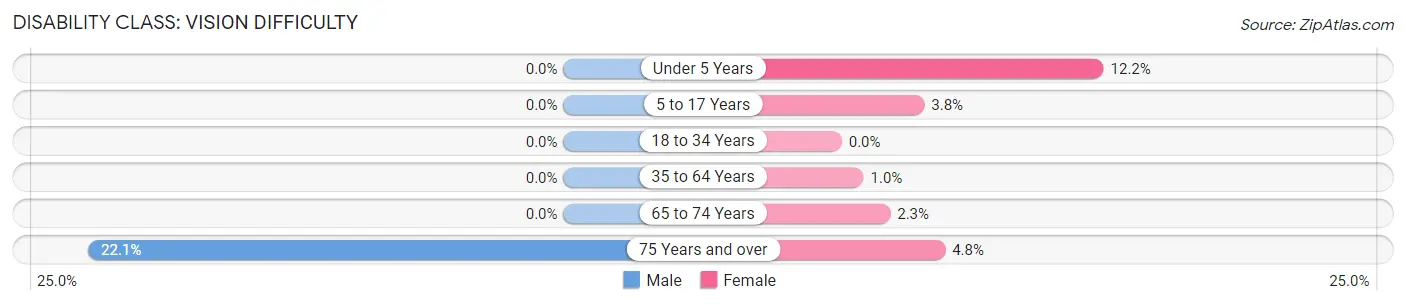
| Age Bracket | Male | Female |
| Under 5 Years | 0 (0.0%) | 13 (12.1%) |
| 5 to 17 Years | 0 (0.0%) | 10 (3.8%) |
| 18 to 34 Years | 0 (0.0%) | 0 (0.0%) |
| 35 to 64 Years | 0 (0.0%) | 9 (1.0%) |
| 65 to 74 Years | 0 (0.0%) | 5 (2.2%) |
| 75 Years and over | 28 (22.1%) | 6 (4.8%) |
Disability Class: Cognitive Difficulty
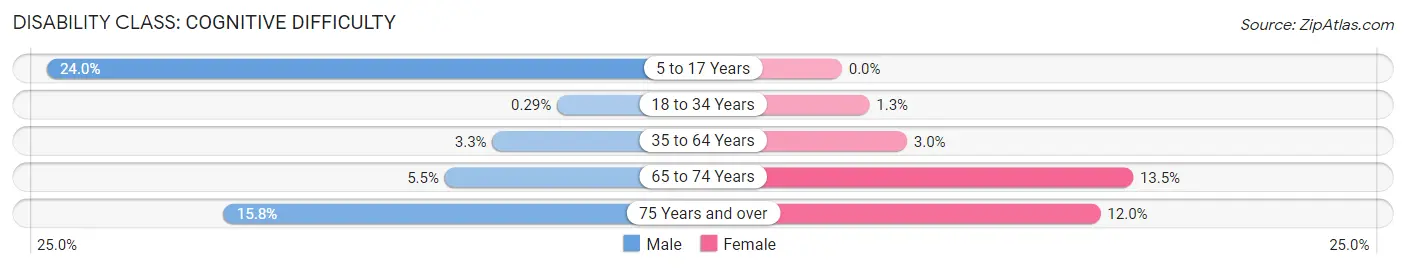
| Age Bracket | Male | Female |
| 5 to 17 Years | 133 (24.0%) | 0 (0.0%) |
| 18 to 34 Years | 1 (0.3%) | 5 (1.3%) |
| 35 to 64 Years | 24 (3.3%) | 27 (3.0%) |
| 65 to 74 Years | 6 (5.5%) | 30 (13.5%) |
| 75 Years and over | 20 (15.8%) | 15 (12.0%) |
Disability Class: Ambulatory Difficulty
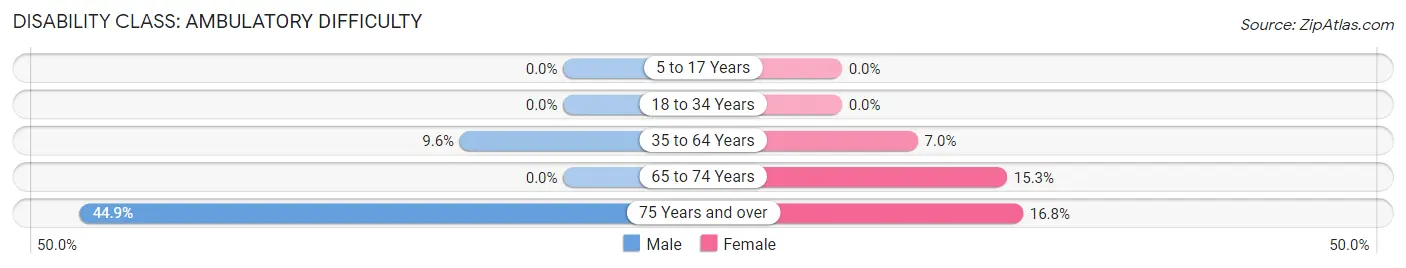
| Age Bracket | Male | Female |
| 5 to 17 Years | 0 (0.0%) | 0 (0.0%) |
| 18 to 34 Years | 0 (0.0%) | 0 (0.0%) |
| 35 to 64 Years | 70 (9.6%) | 63 (7.0%) |
| 65 to 74 Years | 0 (0.0%) | 34 (15.3%) |
| 75 Years and over | 57 (44.9%) | 21 (16.8%) |
Disability Class: Self-Care Difficulty
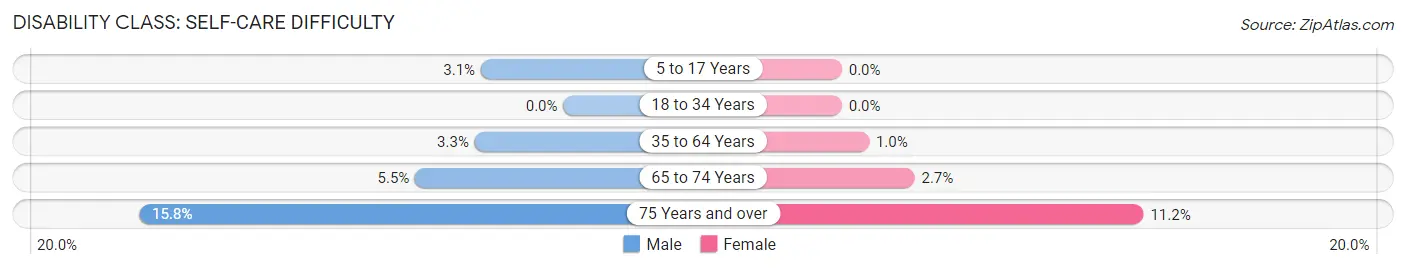
| Age Bracket | Male | Female |
| 5 to 17 Years | 17 (3.1%) | 0 (0.0%) |
| 18 to 34 Years | 0 (0.0%) | 0 (0.0%) |
| 35 to 64 Years | 24 (3.3%) | 9 (1.0%) |
| 65 to 74 Years | 6 (5.5%) | 6 (2.7%) |
| 75 Years and over | 20 (15.8%) | 14 (11.2%) |
Technology Access in Lowell
Computing Device Access in Lowell
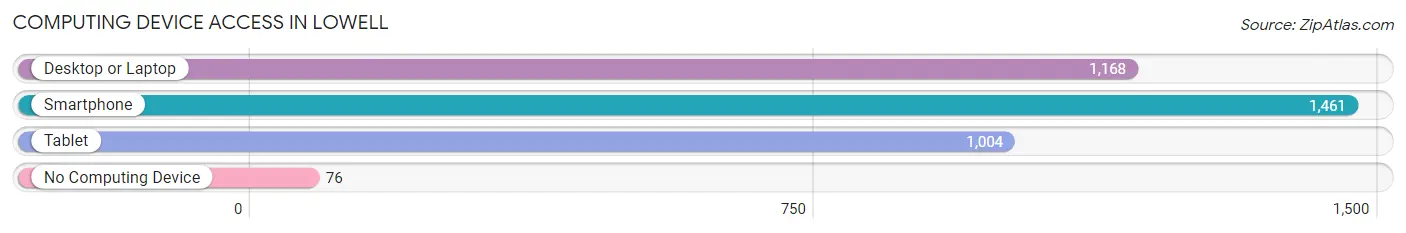
| Device Type | # Households | % Households |
| Desktop or Laptop | 1,168 | 69.4% |
| Smartphone | 1,461 | 86.8% |
| Tablet | 1,004 | 59.7% |
| No Computing Device | 76 | 4.5% |
| Total | 1,683 | 100.0% |
Internet Access in Lowell
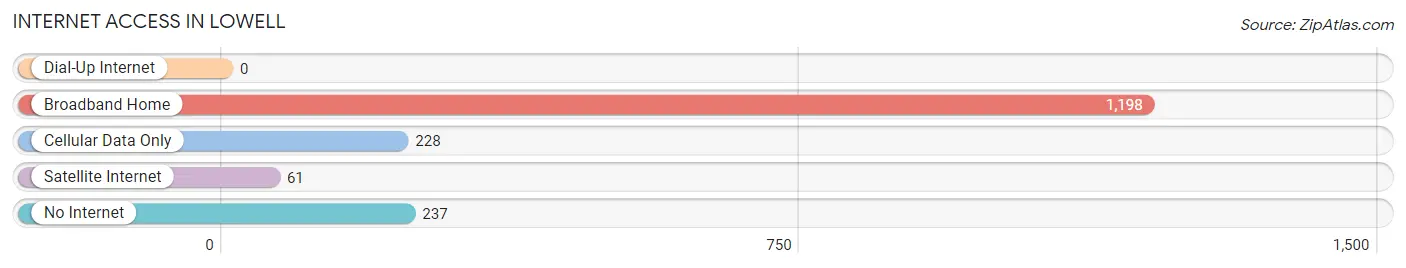
| Internet Type | # Households | % Households |
| Dial-Up Internet | 0 | 0.0% |
| Broadband Home | 1,198 | 71.2% |
| Cellular Data Only | 228 | 13.6% |
| Satellite Internet | 61 | 3.6% |
| No Internet | 237 | 14.1% |
| Total | 1,683 | 100.0% |
Lowell Summary
Lowell, Michigan is a small city located in Kent County, Michigan. It is situated on the Grand River, about 25 miles east of Grand Rapids. The city has a population of about 4,000 people and is part of the Grand Rapids metropolitan area.
History
Lowell was founded in 1831 by a group of settlers from New York. The city was named after the city of Lowell, Massachusetts. The settlers were attracted to the area by the abundance of timber and the potential for farming. The first settlers built a sawmill and a gristmill, and the city quickly grew. By 1836, the population had grown to over 500 people.
In 1837, Lowell was incorporated as a village. The city continued to grow and by 1845, the population had grown to over 1,000 people. In 1867, Lowell was incorporated as a city.
In the late 19th century, Lowell was a major center for the lumber industry. The city was home to several sawmills and lumber yards. The city also had a thriving agricultural industry, with several farms located in the area.
In the early 20th century, Lowell began to diversify its economy. The city became a major center for manufacturing, with several factories located in the area. The city also became a major center for the automotive industry, with several auto parts suppliers located in the area.
Geography
Lowell is located in Kent County, Michigan. The city is situated on the Grand River, about 25 miles east of Grand Rapids. The city has a total area of 4.2 square miles, all of which is land.
The city is located in a flat, low-lying area. The terrain is mostly flat, with some rolling hills in the northern part of the city. The city is located in a humid continental climate zone, with hot summers and cold winters.
Economy
Lowell’s economy is largely based on manufacturing and services. The city is home to several factories and auto parts suppliers. The city also has a thriving retail sector, with several stores and restaurants located in the area.
The city is also home to several small businesses, including a number of professional services firms. The city is also home to several medical facilities, including a hospital and several clinics.
Demographics
As of the 2010 census, Lowell had a population of 4,037 people. The racial makeup of the city was 94.3% White, 1.2% African American, 0.3% Native American, 0.7% Asian, 0.1% Pacific Islander, 1.2% from other races, and 2.3% from two or more races. Hispanic or Latino of any race were 3.3% of the population.
The median household income in Lowell was $45,945, and the median family income was $54,945. The per capita income in Lowell was $21,945. About 8.3% of families and 10.3% of the population were below the poverty line, including 14.3% of those under age 18 and 6.3% of those age 65 or over.
Common Questions
What is Per Capita Income in Lowell?
Per Capita income in Lowell is $29,394.
What is the Median Family Income in Lowell?
Median Family Income in Lowell is $76,698.
What is the Median Household income in Lowell?
Median Household Income in Lowell is $59,712.
What is Income or Wage Gap in Lowell?
Income or Wage Gap in Lowell is 33.0%.
Women in Lowell earn 67.0 cents for every dollar earned by a man.
What is Inequality or Gini Index in Lowell?
Inequality or Gini Index in Lowell is 0.41.
What is the Total Population of Lowell?
Total Population of Lowell is 4,127.
What is the Total Male Population of Lowell?
Total Male Population of Lowell is 2,067.
What is the Total Female Population of Lowell?
Total Female Population of Lowell is 2,060.
What is the Ratio of Males per 100 Females in Lowell?
There are 100.34 Males per 100 Females in Lowell.
What is the Ratio of Females per 100 Males in Lowell?
There are 99.66 Females per 100 Males in Lowell.
What is the Median Population Age in Lowell?
Median Population Age in Lowell is 38.3 Years.
What is the Average Family Size in Lowell
Average Family Size in Lowell is 2.9 People.
What is the Average Household Size in Lowell
Average Household Size in Lowell is 2.4 People.
How Large is the Labor Force in Lowell?
There are 1,886 People in the Labor Forcein in Lowell.
What is the Percentage of People in the Labor Force in Lowell?
59.4% of People are in the Labor Force in Lowell.
What is the Unemployment Rate in Lowell?
Unemployment Rate in Lowell is 2.0%.