Lexington, MI Map & Demographics
Lexington Map
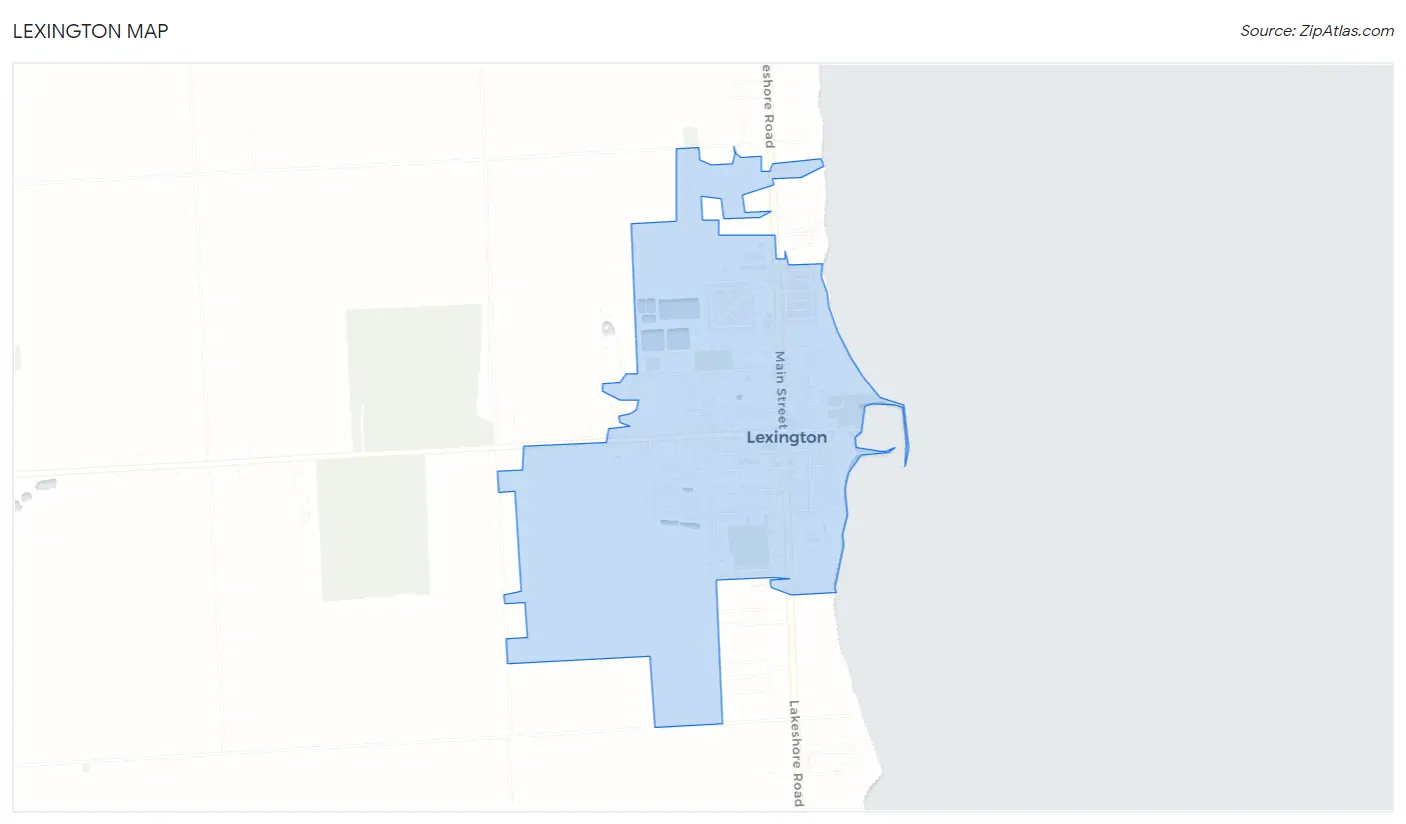
Lexington Overview
$34,142
PER CAPITA INCOME
$69,531
AVG FAMILY INCOME
$41,989
AVG HOUSEHOLD INCOME
19.3%
WAGE / INCOME GAP [ % ]
80.7¢/ $1
WAGE / INCOME GAP [ $ ]
0.43
INEQUALITY / GINI INDEX
1,329
TOTAL POPULATION
656
MALE POPULATION
673
FEMALE POPULATION
97.47
MALES / 100 FEMALES
102.59
FEMALES / 100 MALES
59.8
MEDIAN AGE
2.3
AVG FAMILY SIZE
1.6
AVG HOUSEHOLD SIZE
594
LABOR FORCE [ PEOPLE ]
48.8%
PERCENT IN LABOR FORCE
1.9%
UNEMPLOYMENT RATE
Lexington Zip Codes
Lexington Area Codes
Income in Lexington
Income Overview in Lexington
Per Capita Income in Lexington is $34,142, while median incomes of families and households are $69,531 and $41,989 respectively.
| Characteristic | Number | Measure |
| Per Capita Income | 1,329 | $34,142 |
| Median Family Income | 357 | $69,531 |
| Mean Family Income | 357 | $81,698 |
| Median Household Income | 807 | $41,989 |
| Mean Household Income | 807 | $55,287 |
| Income Deficit | 357 | $0 |
| Wage / Income Gap (%) | 1,329 | 19.30% |
| Wage / Income Gap ($) | 1,329 | 80.70¢ per $1 |
| Gini / Inequality Index | 1,329 | 0.43 |
Earnings by Sex in Lexington
Average Earnings in Lexington are $31,469, $35,521 for men and $28,667 for women, a difference of 19.3%.

| Sex | Number | Average Earnings |
| Male | 343 (51.9%) | $35,521 |
| Female | 318 (48.1%) | $28,667 |
| Total | 661 (100.0%) | $31,469 |
Earnings by Sex by Income Bracket in Lexington
The most common earnings brackets in Lexington are $30,000 to $34,999 for men (45 | 13.1%) and $2,499 or less for women (48 | 15.1%).
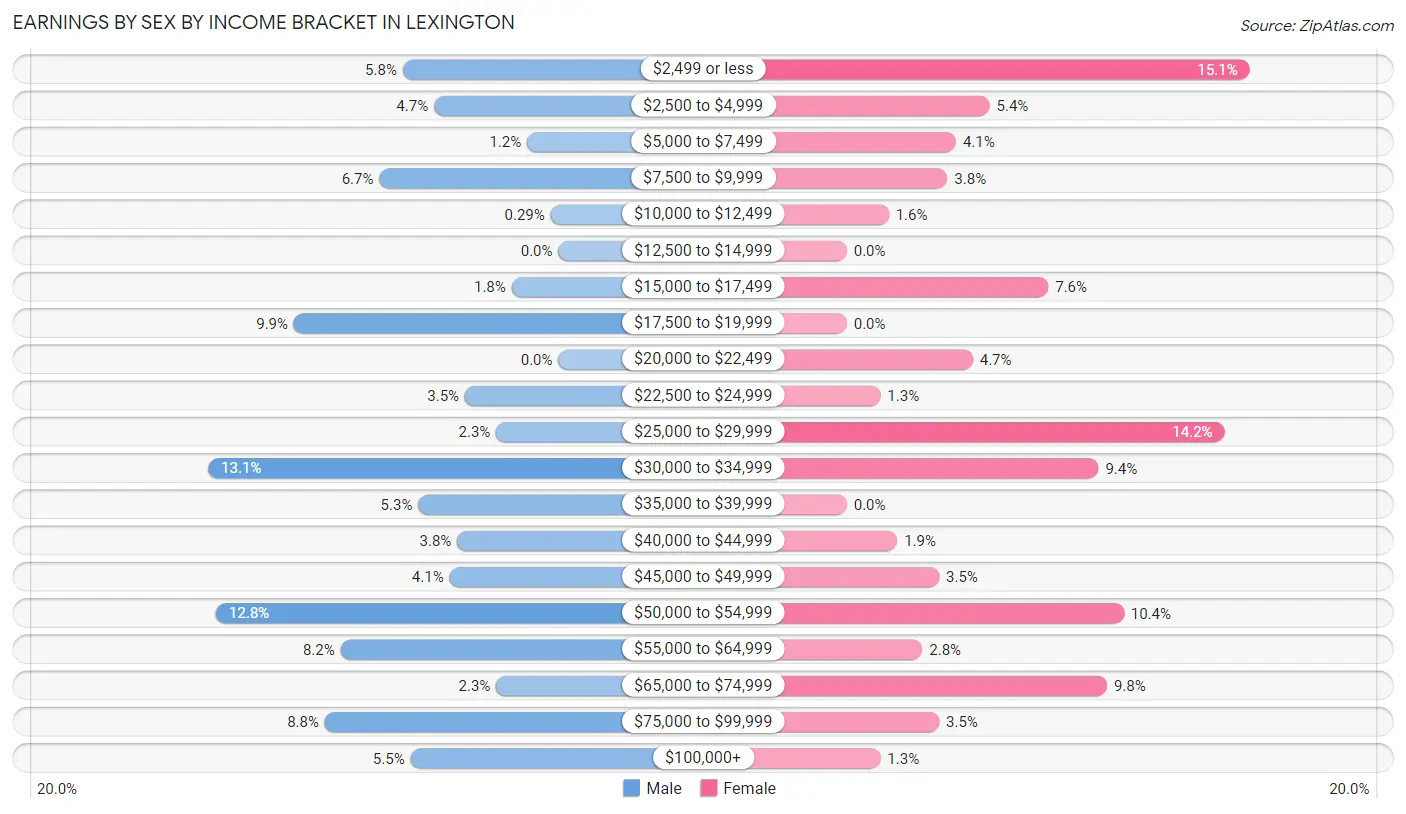
| Income | Male | Female |
| $2,499 or less | 20 (5.8%) | 48 (15.1%) |
| $2,500 to $4,999 | 16 (4.7%) | 17 (5.3%) |
| $5,000 to $7,499 | 4 (1.2%) | 13 (4.1%) |
| $7,500 to $9,999 | 23 (6.7%) | 12 (3.8%) |
| $10,000 to $12,499 | 1 (0.3%) | 5 (1.6%) |
| $12,500 to $14,999 | 0 (0.0%) | 0 (0.0%) |
| $15,000 to $17,499 | 6 (1.8%) | 24 (7.5%) |
| $17,500 to $19,999 | 34 (9.9%) | 0 (0.0%) |
| $20,000 to $22,499 | 0 (0.0%) | 15 (4.7%) |
| $22,500 to $24,999 | 12 (3.5%) | 4 (1.3%) |
| $25,000 to $29,999 | 8 (2.3%) | 45 (14.1%) |
| $30,000 to $34,999 | 45 (13.1%) | 30 (9.4%) |
| $35,000 to $39,999 | 18 (5.2%) | 0 (0.0%) |
| $40,000 to $44,999 | 13 (3.8%) | 6 (1.9%) |
| $45,000 to $49,999 | 14 (4.1%) | 11 (3.5%) |
| $50,000 to $54,999 | 44 (12.8%) | 33 (10.4%) |
| $55,000 to $64,999 | 28 (8.2%) | 9 (2.8%) |
| $65,000 to $74,999 | 8 (2.3%) | 31 (9.8%) |
| $75,000 to $99,999 | 30 (8.7%) | 11 (3.5%) |
| $100,000+ | 19 (5.5%) | 4 (1.3%) |
| Total | 343 (100.0%) | 318 (100.0%) |
Earnings by Sex by Educational Attainment in Lexington
Average earnings in Lexington are $45,804 for men and $28,969 for women, a difference of 36.7%. Men with an educational attainment of bachelor's degree enjoy the highest average annual earnings of $56,458, while those with high school diploma education earn the least with $33,850. Women with an educational attainment of bachelor's degree earn the most with the average annual earnings of $29,583, while those with less than high school education have the smallest earnings of $2,499.
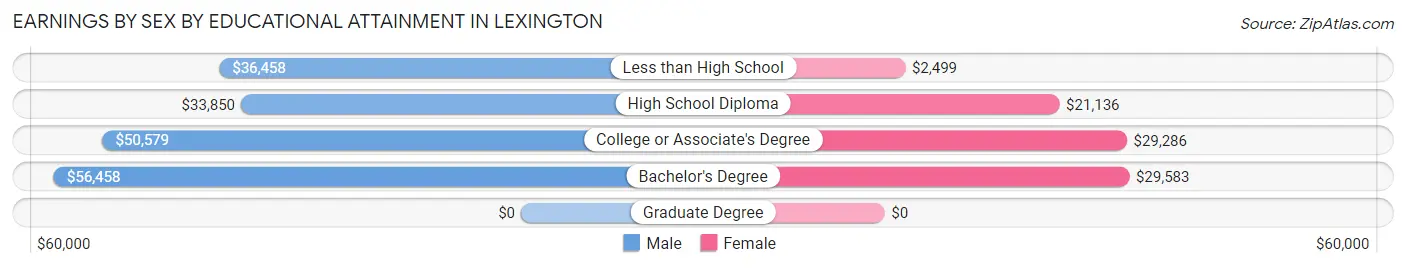
| Educational Attainment | Male Income | Female Income |
| Less than High School | $36,458 | $2,499 |
| High School Diploma | $33,850 | $21,136 |
| College or Associate's Degree | $50,579 | $29,286 |
| Bachelor's Degree | $56,458 | $29,583 |
| Graduate Degree | - | - |
| Total | $45,804 | $28,969 |
Family Income in Lexington
Family Income Brackets in Lexington
According to the Lexington family income data, there are 110 families falling into the $100,000 to $149,999 income range, which is the most common income bracket and makes up 30.8% of all families. Conversely, the $10,000 to $14,999 income bracket is the least frequent group with only 8 families (2.2%) belonging to this category.
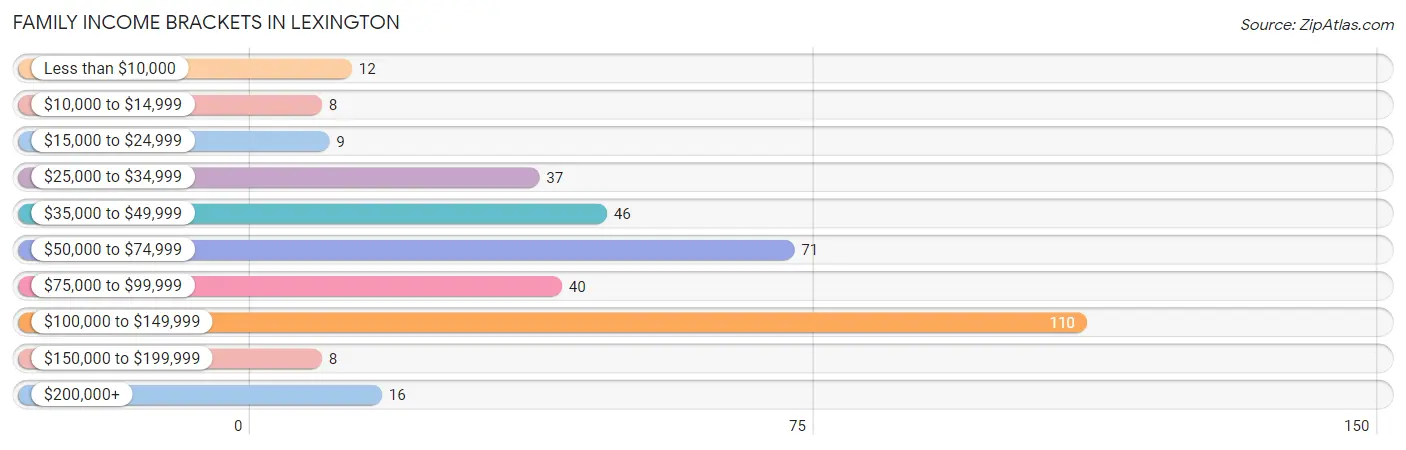
| Income Bracket | # Families | % Families |
| Less than $10,000 | 12 | 3.4% |
| $10,000 to $14,999 | 8 | 2.2% |
| $15,000 to $24,999 | 9 | 2.5% |
| $25,000 to $34,999 | 37 | 10.4% |
| $35,000 to $49,999 | 46 | 12.9% |
| $50,000 to $74,999 | 71 | 19.9% |
| $75,000 to $99,999 | 40 | 11.2% |
| $100,000 to $149,999 | 110 | 30.8% |
| $150,000 to $199,999 | 8 | 2.2% |
| $200,000+ | 16 | 4.5% |
Family Income by Famaliy Size in Lexington
3-person families (42 | 11.8%) account for the highest median family income in Lexington with $106,591 per family, while 3-person families (42 | 11.8%) have the highest median income of $35,530 per family member.
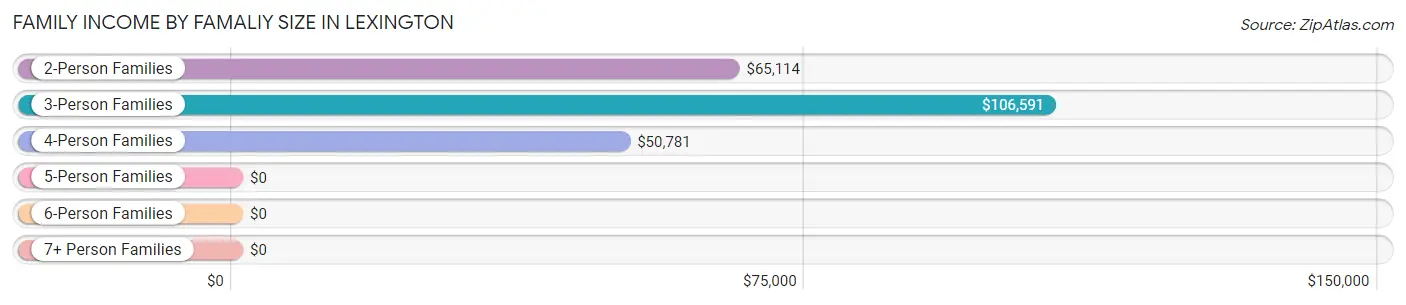
| Income Bracket | # Families | Median Income |
| 2-Person Families | 287 (80.4%) | $65,114 |
| 3-Person Families | 42 (11.8%) | $106,591 |
| 4-Person Families | 25 (7.0%) | $50,781 |
| 5-Person Families | 3 (0.8%) | $0 |
| 6-Person Families | 0 (0.0%) | $0 |
| 7+ Person Families | 0 (0.0%) | $0 |
| Total | 357 (100.0%) | $69,531 |
Family Income by Number of Earners in Lexington
The median family income in Lexington is $69,531, with families comprising 3+ earners (9) having the highest median family income of $108,125, while families with 1 earner (106) have the lowest median family income of $52,500, accounting for 2.5% and 29.7% of families, respectively.
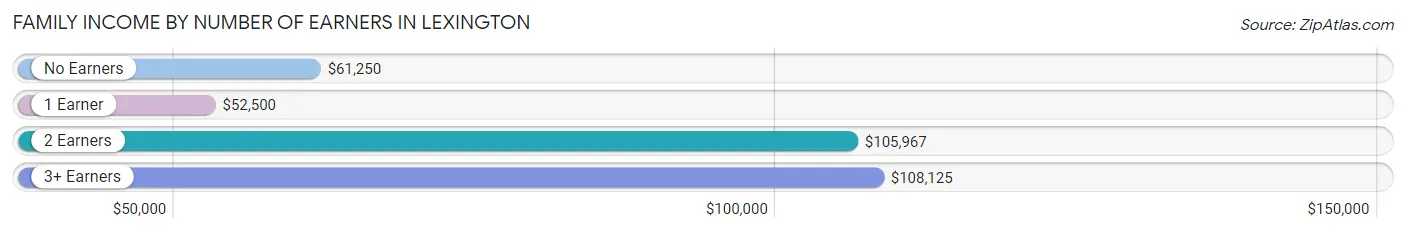
| Number of Earners | # Families | Median Income |
| No Earners | 113 (31.7%) | $61,250 |
| 1 Earner | 106 (29.7%) | $52,500 |
| 2 Earners | 129 (36.1%) | $105,967 |
| 3+ Earners | 9 (2.5%) | $108,125 |
| Total | 357 (100.0%) | $69,531 |
Household Income in Lexington
Household Income Brackets in Lexington
With 130 households falling in the category, the $15,000 to $24,999 income range is the most frequent in Lexington, accounting for 16.1% of all households. In contrast, only 8 households (1.0%) fall into the $150,000 to $199,999 income bracket, making it the least populous group.
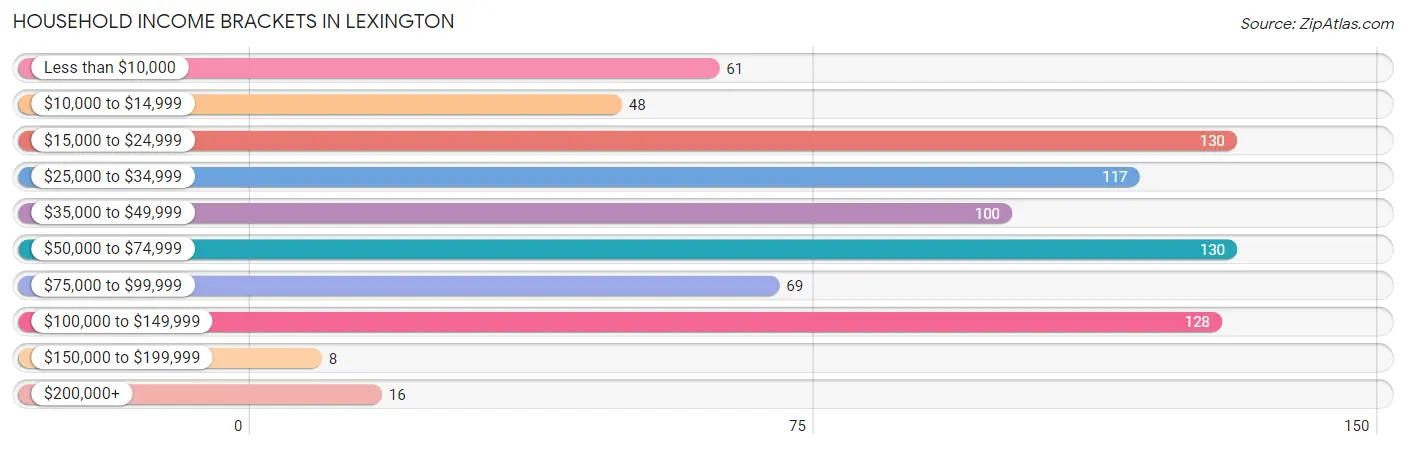
| Income Bracket | # Households | % Households |
| Less than $10,000 | 61 | 7.6% |
| $10,000 to $14,999 | 48 | 5.9% |
| $15,000 to $24,999 | 130 | 16.1% |
| $25,000 to $34,999 | 117 | 14.5% |
| $35,000 to $49,999 | 100 | 12.4% |
| $50,000 to $74,999 | 130 | 16.1% |
| $75,000 to $99,999 | 69 | 8.6% |
| $100,000 to $149,999 | 128 | 15.9% |
| $150,000 to $199,999 | 8 | 1.0% |
| $200,000+ | 16 | 2.0% |
Household Income by Householder Age in Lexington
The median household income in Lexington is $41,989, with the highest median household income of $66,333 found in the 45 to 64 years age bracket for the primary householder. A total of 208 households (25.8%) fall into this category. Meanwhile, the 15 to 24 years age bracket for the primary householder has the lowest median household income of $0, with 44 households (5.4%) in this group.
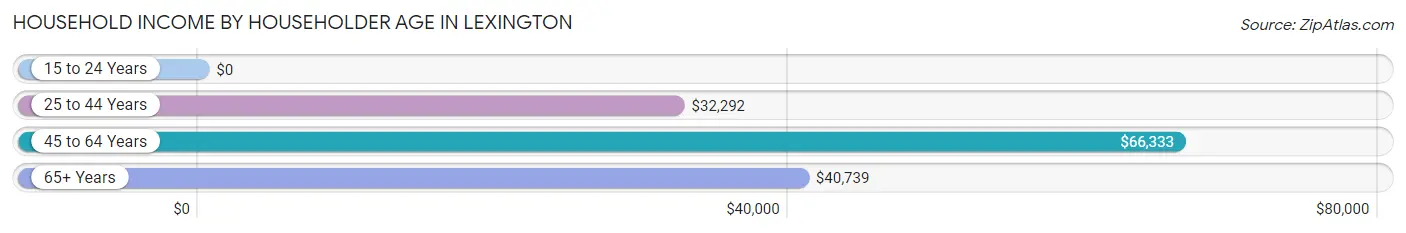
| Income Bracket | # Households | Median Income |
| 15 to 24 Years | 44 (5.4%) | $0 |
| 25 to 44 Years | 192 (23.8%) | $32,292 |
| 45 to 64 Years | 208 (25.8%) | $66,333 |
| 65+ Years | 363 (45.0%) | $40,739 |
| Total | 807 (100.0%) | $41,989 |
Poverty in Lexington
Income Below Poverty by Sex and Age in Lexington
With 8.8% poverty level for males and 18.4% for females among the residents of Lexington, under 5 year old males and 18 to 24 year old females are the most vulnerable to poverty, with 5 males (83.3%) and 9 females (64.3%) in their respective age groups living below the poverty level.
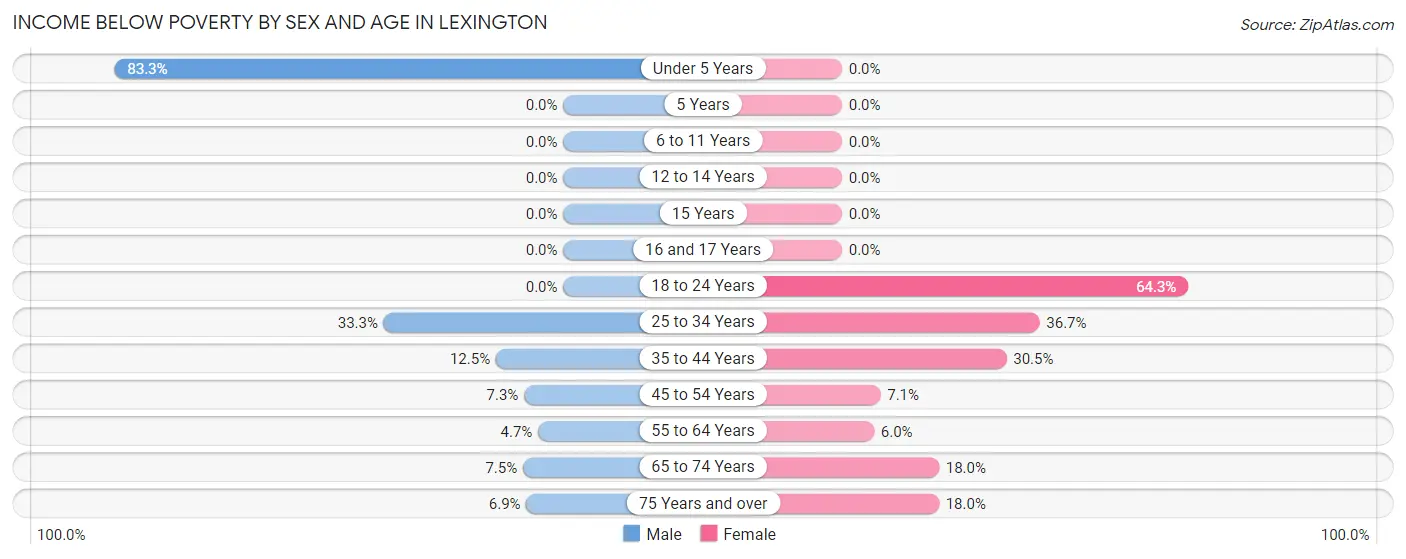
| Age Bracket | Male | Female |
| Under 5 Years | 5 (83.3%) | 0 (0.0%) |
| 5 Years | 0 (0.0%) | 0 (0.0%) |
| 6 to 11 Years | 0 (0.0%) | 0 (0.0%) |
| 12 to 14 Years | 0 (0.0%) | 0 (0.0%) |
| 15 Years | 0 (0.0%) | 0 (0.0%) |
| 16 and 17 Years | 0 (0.0%) | 0 (0.0%) |
| 18 to 24 Years | 0 (0.0%) | 9 (64.3%) |
| 25 to 34 Years | 19 (33.3%) | 22 (36.7%) |
| 35 to 44 Years | 9 (12.5%) | 29 (30.5%) |
| 45 to 54 Years | 4 (7.3%) | 5 (7.1%) |
| 55 to 64 Years | 5 (4.7%) | 5 (5.9%) |
| 65 to 74 Years | 11 (7.5%) | 29 (18.0%) |
| 75 Years and over | 5 (6.9%) | 25 (18.0%) |
| Total | 58 (8.8%) | 124 (18.4%) |
Income Above Poverty by Sex and Age in Lexington
According to the poverty statistics in Lexington, males aged 5 years and females aged 6 to 11 years are the age groups that are most secure financially, with 100.0% of males and 100.0% of females in these age groups living above the poverty line.
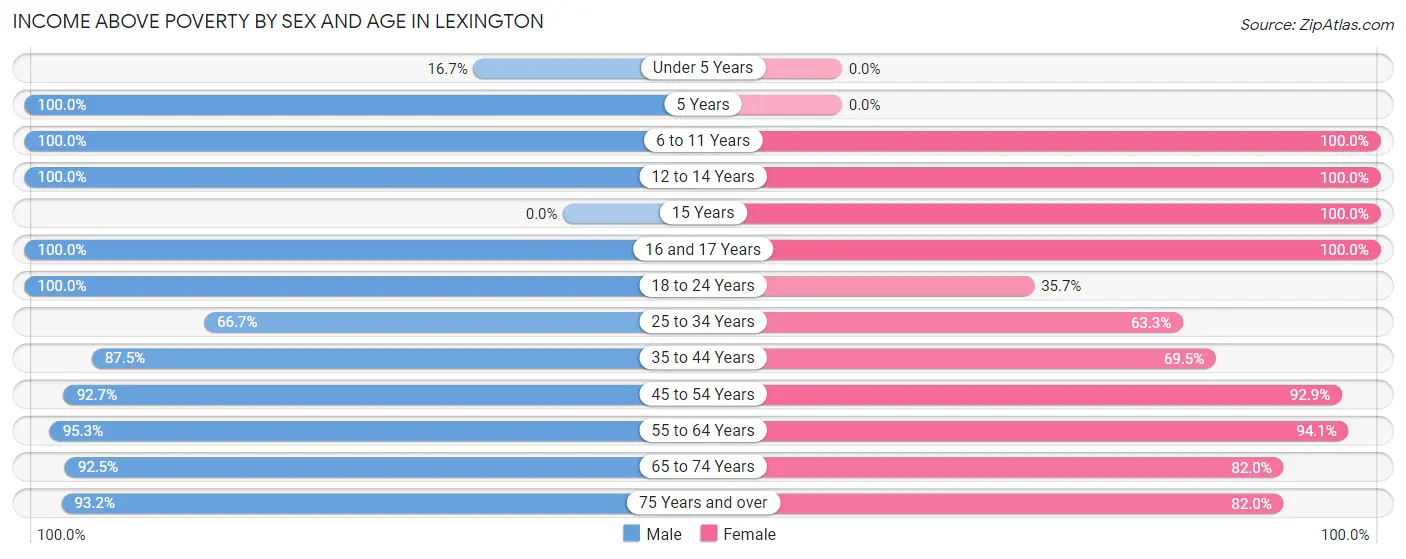
| Age Bracket | Male | Female |
| Under 5 Years | 1 (16.7%) | 0 (0.0%) |
| 5 Years | 4 (100.0%) | 0 (0.0%) |
| 6 to 11 Years | 12 (100.0%) | 17 (100.0%) |
| 12 to 14 Years | 57 (100.0%) | 12 (100.0%) |
| 15 Years | 0 (0.0%) | 4 (100.0%) |
| 16 and 17 Years | 6 (100.0%) | 17 (100.0%) |
| 18 to 24 Years | 60 (100.0%) | 5 (35.7%) |
| 25 to 34 Years | 38 (66.7%) | 38 (63.3%) |
| 35 to 44 Years | 63 (87.5%) | 66 (69.5%) |
| 45 to 54 Years | 51 (92.7%) | 65 (92.9%) |
| 55 to 64 Years | 102 (95.3%) | 79 (94.1%) |
| 65 to 74 Years | 136 (92.5%) | 132 (82.0%) |
| 75 Years and over | 68 (93.1%) | 114 (82.0%) |
| Total | 598 (91.2%) | 549 (81.6%) |
Income Below Poverty Among Married-Couple Families in Lexington
The poverty statistics for married-couple families in Lexington show that 5.4% or 16 of the total 297 families live below the poverty line. Families with no children have the highest poverty rate of 6.9%, comprising of 16 families. On the other hand, families with 1 or 2 children have the lowest poverty rate of 0.0%, which includes 0 families.
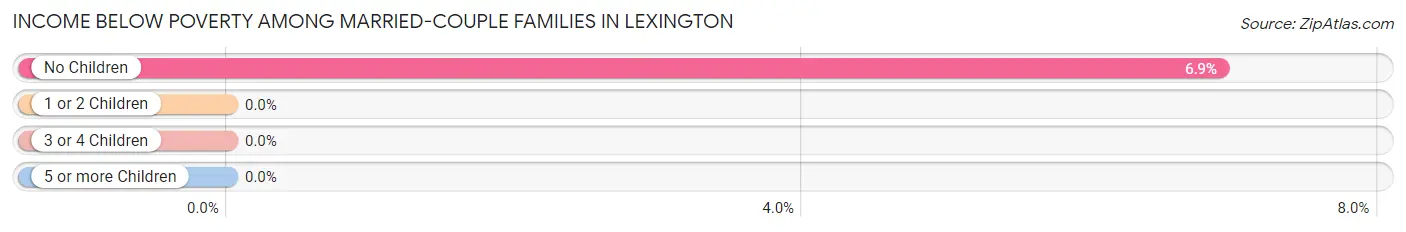
| Children | Above Poverty | Below Poverty |
| No Children | 216 (93.1%) | 16 (6.9%) |
| 1 or 2 Children | 62 (100.0%) | 0 (0.0%) |
| 3 or 4 Children | 3 (100.0%) | 0 (0.0%) |
| 5 or more Children | 0 (0.0%) | 0 (0.0%) |
| Total | 281 (94.6%) | 16 (5.4%) |
Income Below Poverty Among Single-Parent Households in Lexington
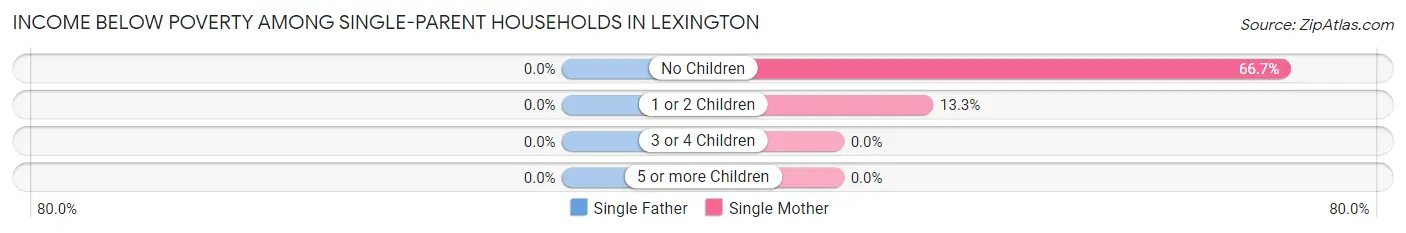
| Children | Single Father | Single Mother |
| No Children | 0 (0.0%) | 6 (66.7%) |
| 1 or 2 Children | 0 (0.0%) | 6 (13.3%) |
| 3 or 4 Children | 0 (0.0%) | 0 (0.0%) |
| 5 or more Children | 0 (0.0%) | 0 (0.0%) |
| Total | 0 (0.0%) | 12 (22.2%) |
Income Below Poverty Among Married-Couple vs Single-Parent Households in Lexington
The poverty data for Lexington shows that 16 of the married-couple family households (5.4%) and 12 of the single-parent households (20.0%) are living below the poverty level. Within the married-couple family households, those with no children have the highest poverty rate, with 16 households (6.9%) falling below the poverty line. Among the single-parent households, those with no children have the highest poverty rate, with 6 household (66.7%) living below poverty.
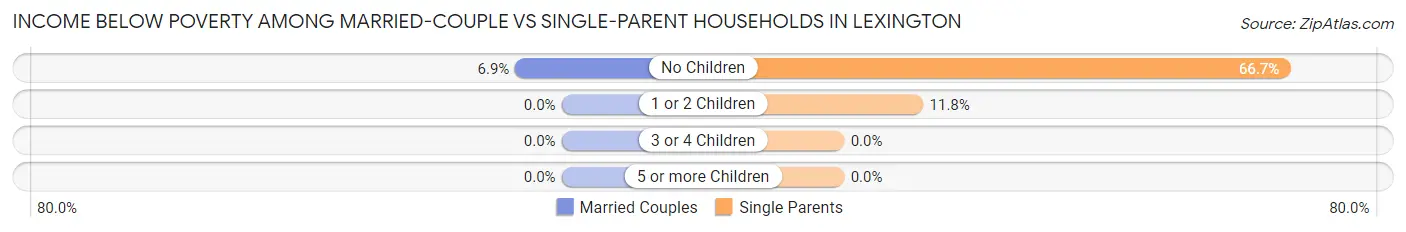
| Children | Married-Couple Families | Single-Parent Households |
| No Children | 16 (6.9%) | 6 (66.7%) |
| 1 or 2 Children | 0 (0.0%) | 6 (11.8%) |
| 3 or 4 Children | 0 (0.0%) | 0 (0.0%) |
| 5 or more Children | 0 (0.0%) | 0 (0.0%) |
| Total | 16 (5.4%) | 12 (20.0%) |
Race in Lexington
The most populous races in Lexington are White / Caucasian (1,260 | 94.8%), Hispanic or Latino (61 | 4.6%), and Two or more Races (58 | 4.4%).
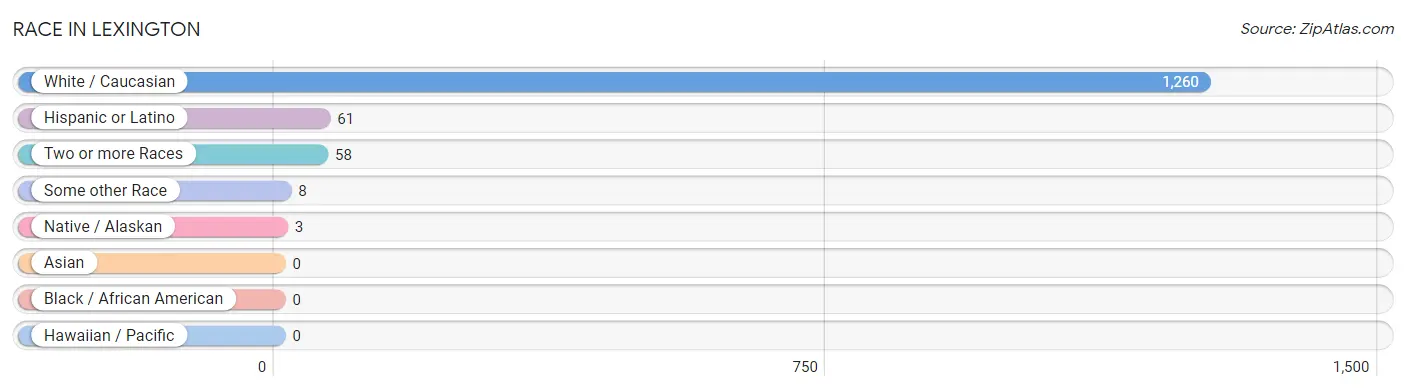
| Race | # Population | % Population |
| Asian | 0 | 0.0% |
| Black / African American | 0 | 0.0% |
| Hawaiian / Pacific | 0 | 0.0% |
| Hispanic or Latino | 61 | 4.6% |
| Native / Alaskan | 3 | 0.2% |
| White / Caucasian | 1,260 | 94.8% |
| Two or more Races | 58 | 4.4% |
| Some other Race | 8 | 0.6% |
| Total | 1,329 | 100.0% |
Ancestry in Lexington
The most populous ancestries reported in Lexington are Irish (296 | 22.3%), German (261 | 19.6%), English (162 | 12.2%), Polish (161 | 12.1%), and French (59 | 4.4%), together accounting for 70.7% of all Lexington residents.
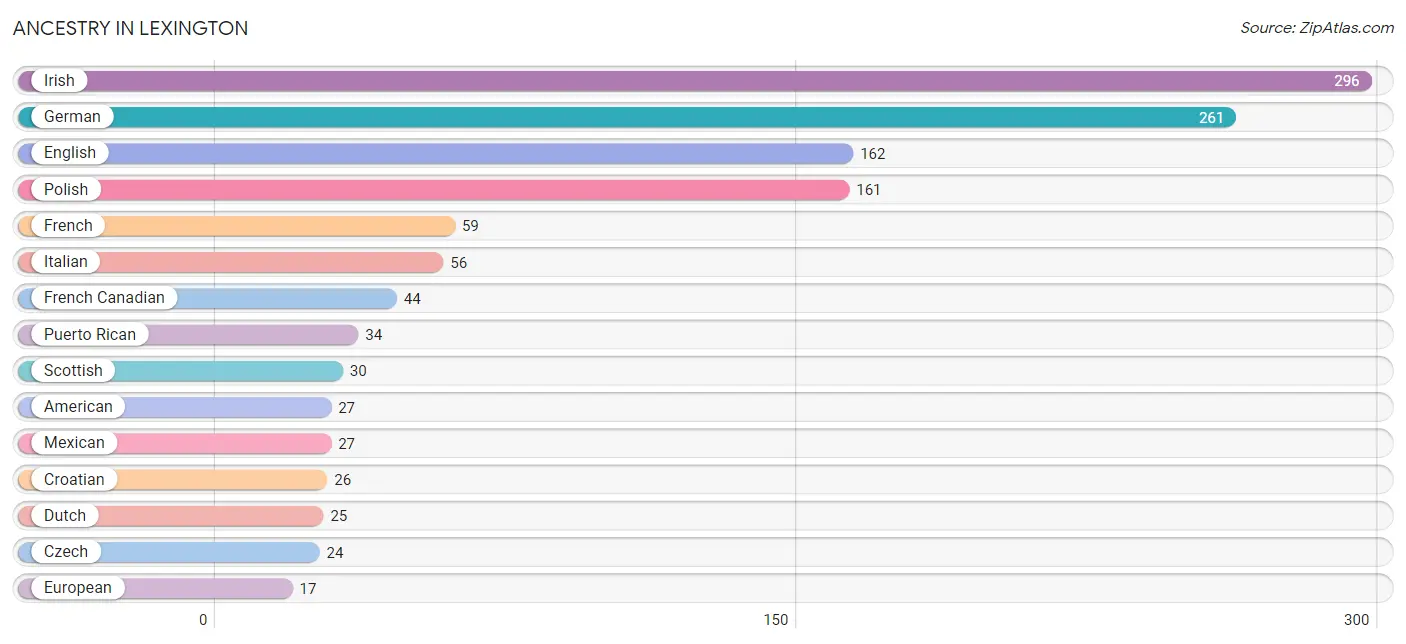
| Ancestry | # Population | % Population |
| American | 27 | 2.0% |
| Arab | 16 | 1.2% |
| Armenian | 3 | 0.2% |
| Austrian | 7 | 0.5% |
| Belgian | 13 | 1.0% |
| Blackfeet | 2 | 0.2% |
| Canadian | 15 | 1.1% |
| Celtic | 11 | 0.8% |
| Cherokee | 16 | 1.2% |
| Croatian | 26 | 2.0% |
| Czech | 24 | 1.8% |
| Czechoslovakian | 11 | 0.8% |
| Dutch | 25 | 1.9% |
| Eastern European | 3 | 0.2% |
| English | 162 | 12.2% |
| European | 17 | 1.3% |
| Finnish | 3 | 0.2% |
| French | 59 | 4.4% |
| French Canadian | 44 | 3.3% |
| German | 261 | 19.6% |
| German Russian | 4 | 0.3% |
| Greek | 7 | 0.5% |
| Hungarian | 12 | 0.9% |
| Irish | 296 | 22.3% |
| Iroquois | 1 | 0.1% |
| Italian | 56 | 4.2% |
| Lebanese | 8 | 0.6% |
| Lithuanian | 1 | 0.1% |
| Maltese | 10 | 0.7% |
| Mexican | 27 | 2.0% |
| Norwegian | 9 | 0.7% |
| Pennsylvania German | 3 | 0.2% |
| Polish | 161 | 12.1% |
| Puerto Rican | 34 | 2.6% |
| Russian | 5 | 0.4% |
| Scandinavian | 4 | 0.3% |
| Scotch-Irish | 9 | 0.7% |
| Scottish | 30 | 2.3% |
| Slovak | 6 | 0.4% |
| Swedish | 9 | 0.7% |
| Syrian | 4 | 0.3% |
| Ukrainian | 2 | 0.2% | View All 42 Rows |
Immigrants in Lexington
The most numerous immigrant groups reported in Lexington came from Europe (7 | 0.5%), Canada (6 | 0.4%), Czechoslovakia (4 | 0.3%), Eastern Europe (4 | 0.3%), and Germany (3 | 0.2%), together accounting for 1.8% of all Lexington residents.
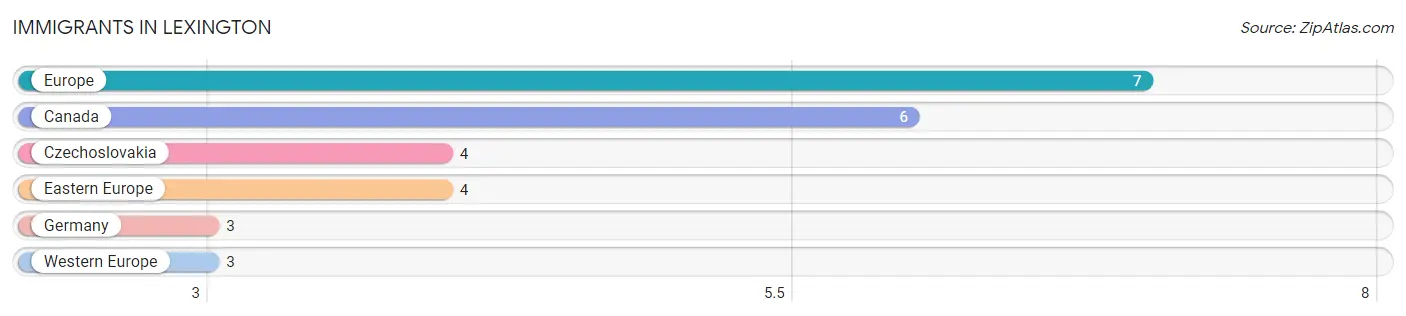
| Immigration Origin | # Population | % Population |
| Canada | 6 | 0.4% |
| Czechoslovakia | 4 | 0.3% |
| Eastern Europe | 4 | 0.3% |
| Europe | 7 | 0.5% |
| Germany | 3 | 0.2% |
| Western Europe | 3 | 0.2% | View All 6 Rows |
Sex and Age in Lexington
Sex and Age in Lexington
The most populous age groups in Lexington are 70 to 74 Years (80 | 12.2%) for men and 70 to 74 Years (83 | 12.3%) for women.
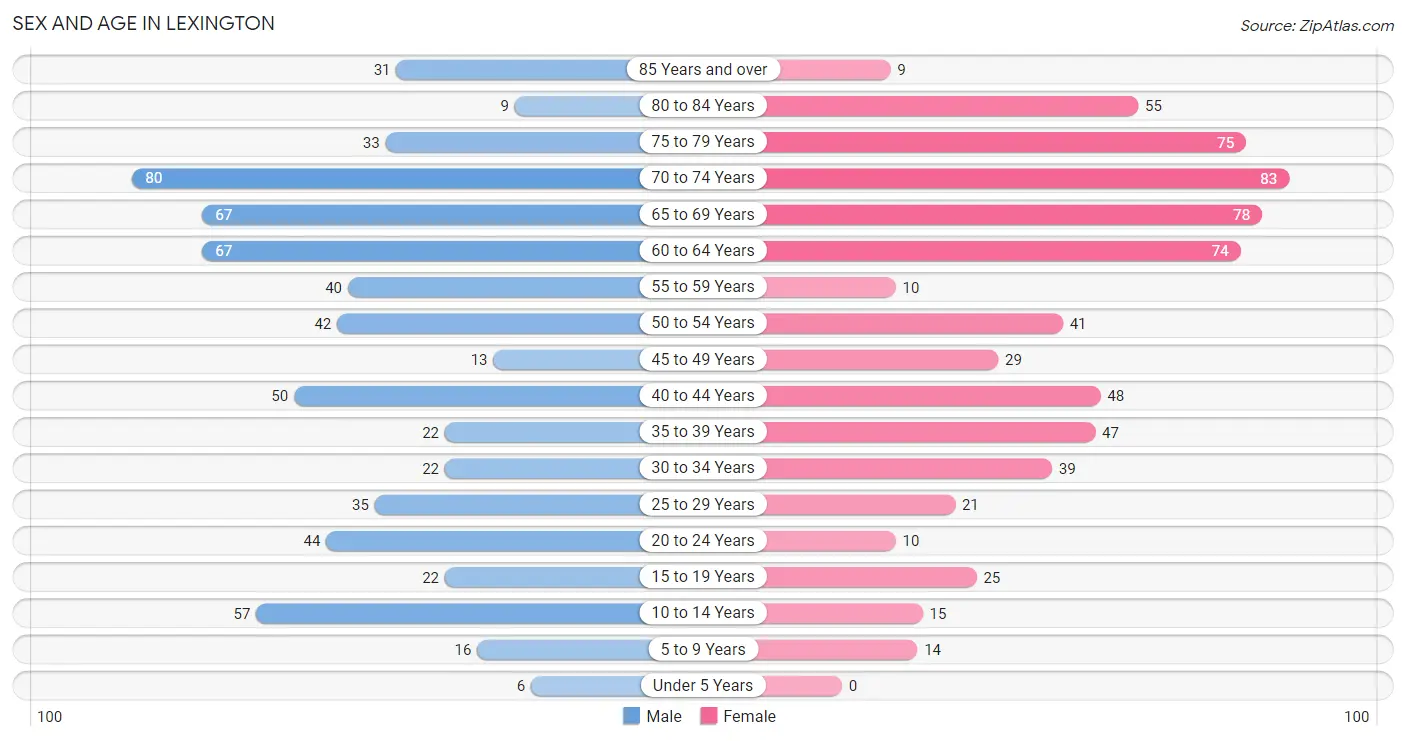
| Age Bracket | Male | Female |
| Under 5 Years | 6 (0.9%) | 0 (0.0%) |
| 5 to 9 Years | 16 (2.4%) | 14 (2.1%) |
| 10 to 14 Years | 57 (8.7%) | 15 (2.2%) |
| 15 to 19 Years | 22 (3.4%) | 25 (3.7%) |
| 20 to 24 Years | 44 (6.7%) | 10 (1.5%) |
| 25 to 29 Years | 35 (5.3%) | 21 (3.1%) |
| 30 to 34 Years | 22 (3.4%) | 39 (5.8%) |
| 35 to 39 Years | 22 (3.4%) | 47 (7.0%) |
| 40 to 44 Years | 50 (7.6%) | 48 (7.1%) |
| 45 to 49 Years | 13 (2.0%) | 29 (4.3%) |
| 50 to 54 Years | 42 (6.4%) | 41 (6.1%) |
| 55 to 59 Years | 40 (6.1%) | 10 (1.5%) |
| 60 to 64 Years | 67 (10.2%) | 74 (11.0%) |
| 65 to 69 Years | 67 (10.2%) | 78 (11.6%) |
| 70 to 74 Years | 80 (12.2%) | 83 (12.3%) |
| 75 to 79 Years | 33 (5.0%) | 75 (11.1%) |
| 80 to 84 Years | 9 (1.4%) | 55 (8.2%) |
| 85 Years and over | 31 (4.7%) | 9 (1.3%) |
| Total | 656 (100.0%) | 673 (100.0%) |
Families and Households in Lexington
Median Family Size in Lexington
The median family size in Lexington is 2.29 persons per family, with married-couple families (297 | 83.2%) accounting for the largest median family size of 2.34 persons per family. On the other hand, single male/father families (6 | 1.7%) represent the smallest median family size with 2.00 persons per family.
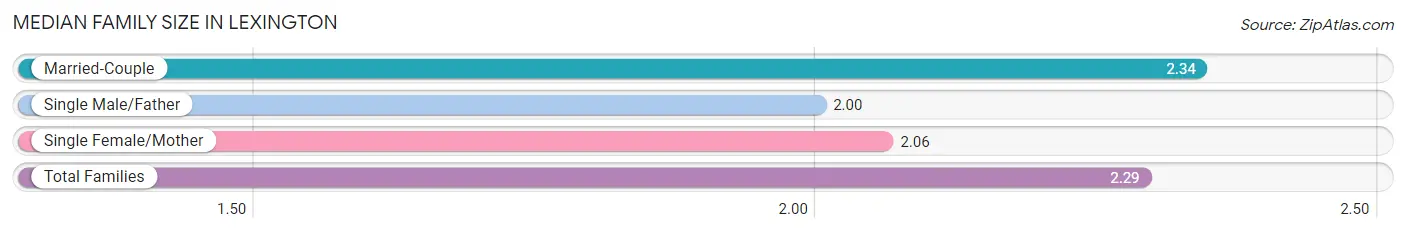
| Family Type | # Families | Family Size |
| Married-Couple | 297 (83.2%) | 2.34 |
| Single Male/Father | 6 (1.7%) | 2.00 |
| Single Female/Mother | 54 (15.1%) | 2.06 |
| Total Families | 357 (100.0%) | 2.29 |
Median Household Size in Lexington
The median household size in Lexington is 1.64 persons per household, with married-couple households (297 | 36.8%) accounting for the largest median household size of 2.34 persons per household. non-family households (450 | 55.8%) represent the smallest median household size with 1.10 persons per household.
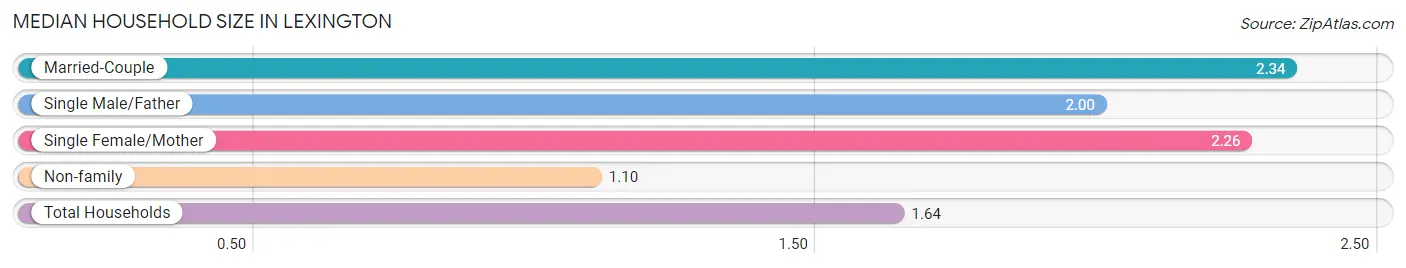
| Household Type | # Households | Household Size |
| Married-Couple | 297 (36.8%) | 2.34 |
| Single Male/Father | 6 (0.7%) | 2.00 |
| Single Female/Mother | 54 (6.7%) | 2.26 |
| Non-family | 450 (55.8%) | 1.10 |
| Total Households | 807 (100.0%) | 1.64 |
Household Size by Marriage Status in Lexington
Out of a total of 807 households in Lexington, 357 (44.2%) are family households, while 450 (55.8%) are nonfamily households. The most numerous type of family households are 2-person households, comprising 281, and the most common type of nonfamily households are 1-person households, comprising 400.
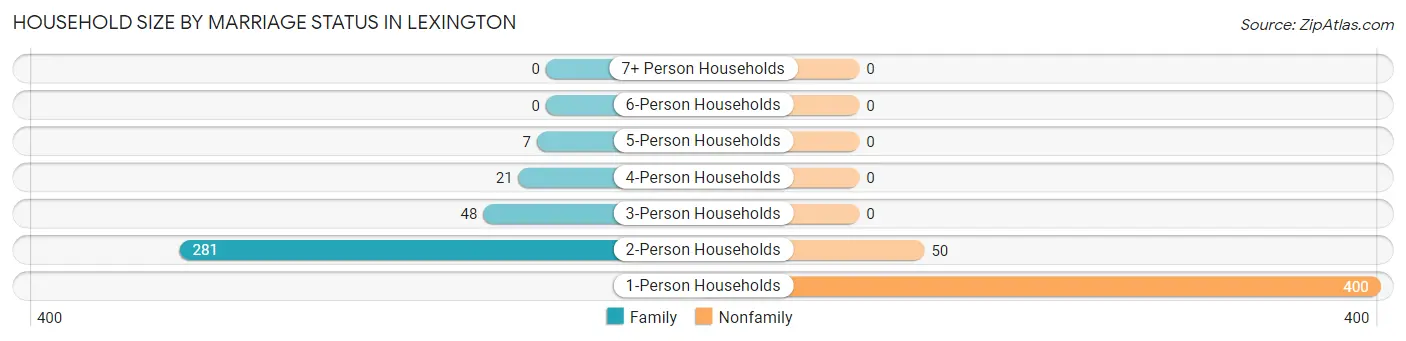
| Household Size | Family Households | Nonfamily Households |
| 1-Person Households | - | 400 (49.6%) |
| 2-Person Households | 281 (34.8%) | 50 (6.2%) |
| 3-Person Households | 48 (5.9%) | 0 (0.0%) |
| 4-Person Households | 21 (2.6%) | 0 (0.0%) |
| 5-Person Households | 7 (0.9%) | 0 (0.0%) |
| 6-Person Households | 0 (0.0%) | 0 (0.0%) |
| 7+ Person Households | 0 (0.0%) | 0 (0.0%) |
| Total | 357 (44.2%) | 450 (55.8%) |
Female Fertility in Lexington
Fertility by Age in Lexington
Average fertility rate in Lexington is 13.0 births per 1,000 women. Women in the age bracket of 20 to 34 years have the highest fertility rate with 43.0 births per 1,000 women. Women in the age bracket of 20 to 34 years acount for 100.0% of all women with births.
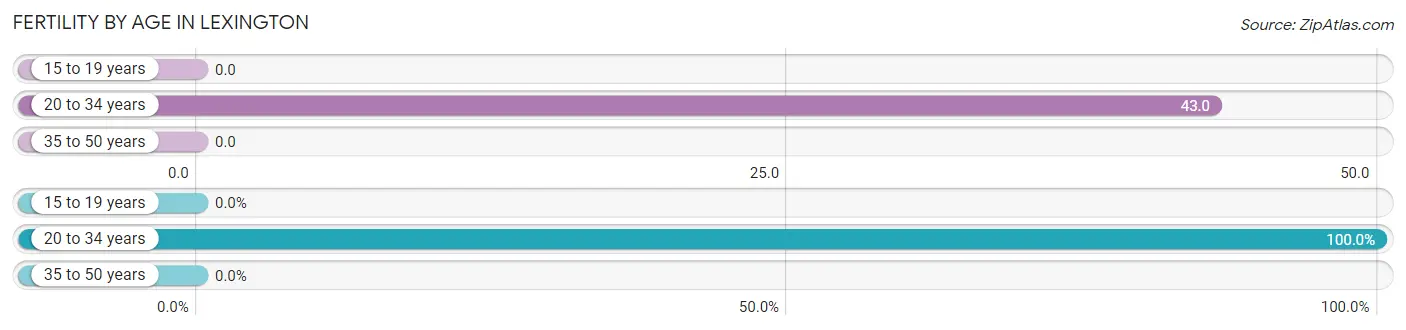
| Age Bracket | Women with Births | Births / 1,000 Women |
| 15 to 19 years | 0 (0.0%) | 0.0 |
| 20 to 34 years | 3 (100.0%) | 43.0 |
| 35 to 50 years | 0 (0.0%) | 0.0 |
| Total | 3 (100.0%) | 13.0 |
Fertility by Age by Marriage Status in Lexington
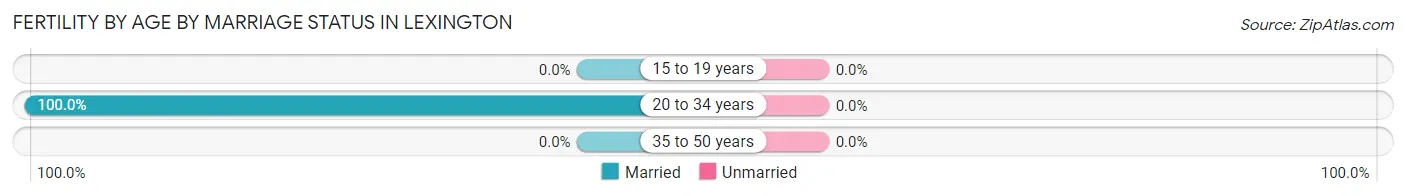
| Age Bracket | Married | Unmarried |
| 15 to 19 years | 0 (0.0%) | 0 (0.0%) |
| 20 to 34 years | 3 (100.0%) | 0 (0.0%) |
| 35 to 50 years | 0 (0.0%) | 0 (0.0%) |
| Total | 3 (100.0%) | 0 (0.0%) |
Fertility by Education in Lexington
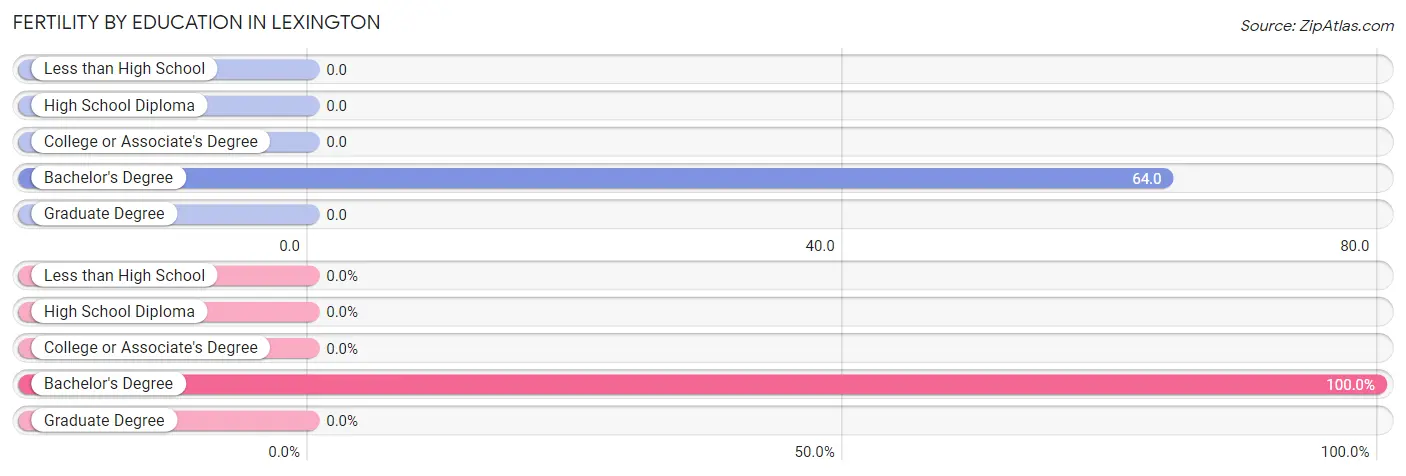
| Educational Attainment | Women with Births | Births / 1,000 Women |
| Less than High School | 0 (0.0%) | 0.0 |
| High School Diploma | 0 (0.0%) | 0.0 |
| College or Associate's Degree | 0 (0.0%) | 0.0 |
| Bachelor's Degree | 3 (100.0%) | 64.0 |
| Graduate Degree | 0 (0.0%) | 0.0 |
| Total | 3 (100.0%) | 13.0 |
Fertility by Education by Marriage Status in Lexington
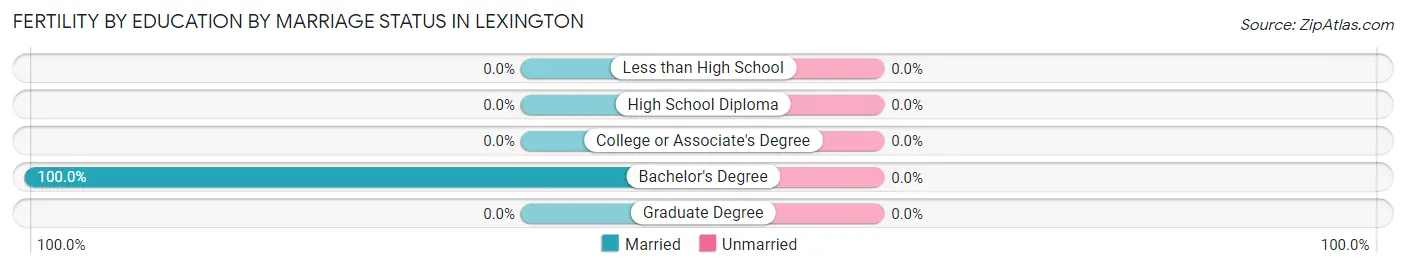
| Educational Attainment | Married | Unmarried |
| Less than High School | 0 (0.0%) | 0 (0.0%) |
| High School Diploma | 0 (0.0%) | 0 (0.0%) |
| College or Associate's Degree | 0 (0.0%) | 0 (0.0%) |
| Bachelor's Degree | 3 (100.0%) | 0 (0.0%) |
| Graduate Degree | 0 (0.0%) | 0 (0.0%) |
| Total | 3 (100.0%) | 0 (0.0%) |
Employment Characteristics in Lexington
Employment by Class of Employer in Lexington
Among the 572 employed individuals in Lexington, private company employees (411 | 71.9%), not-for-profit organizations (66 | 11.5%), and federal government employees (34 | 5.9%) make up the most common classes of employment.
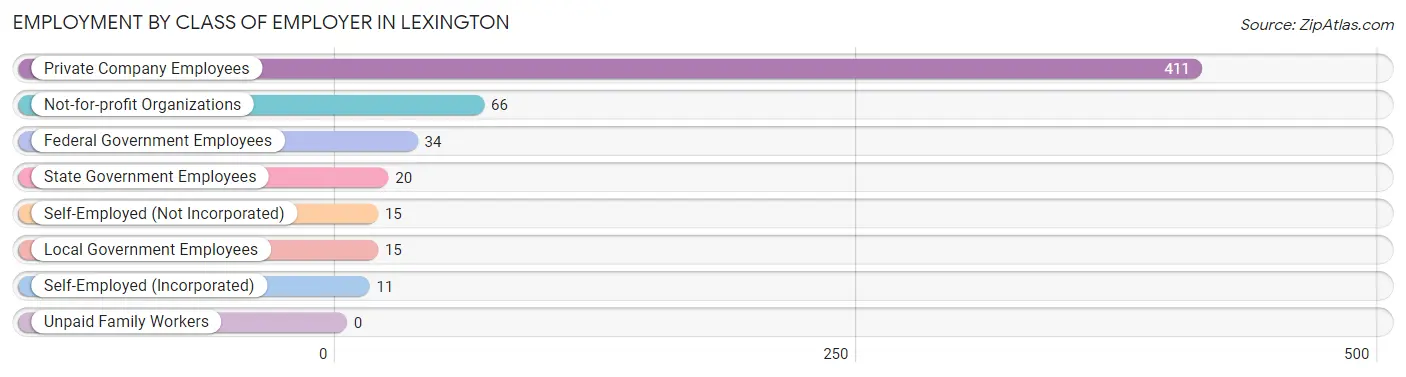
| Employer Class | # Employees | % Employees |
| Private Company Employees | 411 | 71.9% |
| Self-Employed (Incorporated) | 11 | 1.9% |
| Self-Employed (Not Incorporated) | 15 | 2.6% |
| Not-for-profit Organizations | 66 | 11.5% |
| Local Government Employees | 15 | 2.6% |
| State Government Employees | 20 | 3.5% |
| Federal Government Employees | 34 | 5.9% |
| Unpaid Family Workers | 0 | 0.0% |
| Total | 572 | 100.0% |
Employment Status by Age in Lexington
According to the labor force statistics for Lexington, out of the total population over 16 years of age (1,217), 48.8% or 594 individuals are in the labor force, with 1.9% or 11 of them unemployed. The age group with the highest labor force participation rate is 20 to 24 years, with 100.0% or 54 individuals in the labor force. Within the labor force, the 30 to 34 years age range has the highest percentage of unemployed individuals, with 15.5% or 9 of them being unemployed.
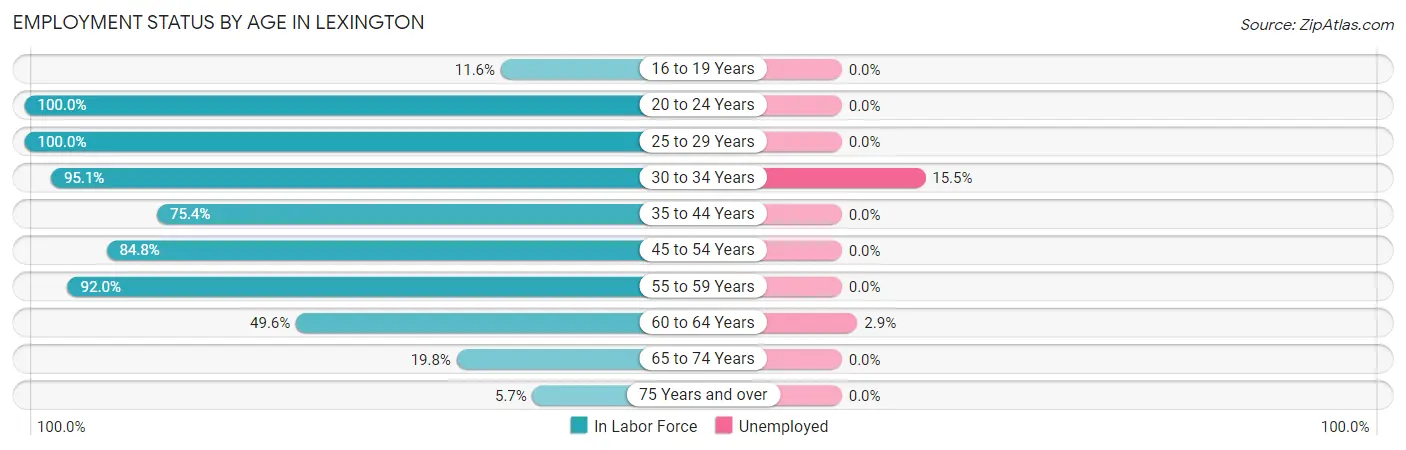
| Age Bracket | In Labor Force | Unemployed |
| 16 to 19 Years | 5 (11.6%) | 0 (0.0%) |
| 20 to 24 Years | 54 (100.0%) | 0 (0.0%) |
| 25 to 29 Years | 56 (100.0%) | 0 (0.0%) |
| 30 to 34 Years | 58 (95.1%) | 9 (15.5%) |
| 35 to 44 Years | 126 (75.4%) | 0 (0.0%) |
| 45 to 54 Years | 106 (84.8%) | 0 (0.0%) |
| 55 to 59 Years | 46 (92.0%) | 0 (0.0%) |
| 60 to 64 Years | 70 (49.6%) | 2 (2.9%) |
| 65 to 74 Years | 61 (19.8%) | 0 (0.0%) |
| 75 Years and over | 12 (5.7%) | 0 (0.0%) |
| Total | 594 (48.8%) | 11 (1.9%) |
Employment Status by Educational Attainment in Lexington
According to labor force statistics for Lexington, 77.0% of individuals (462) out of the total population between 25 and 64 years of age (600) are in the labor force, with 2.4% or 11 of them being unemployed. The group with the highest labor force participation rate are those with the educational attainment of less than high school, with 88.0% or 22 individuals in the labor force. Within the labor force, individuals with college / associate degree education have the highest percentage of unemployment, with 4.7% or 9 of them being unemployed.
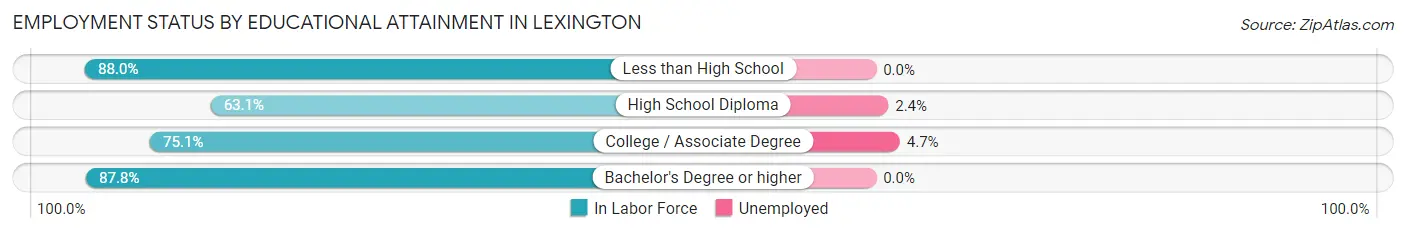
| Educational Attainment | In Labor Force | Unemployed |
| Less than High School | 22 (88.0%) | 0 (0.0%) |
| High School Diploma | 82 (63.1%) | 3 (2.4%) |
| College / Associate Degree | 193 (75.1%) | 12 (4.7%) |
| Bachelor's Degree or higher | 165 (87.8%) | 0 (0.0%) |
| Total | 462 (77.0%) | 14 (2.4%) |
Employment Occupations by Sex in Lexington
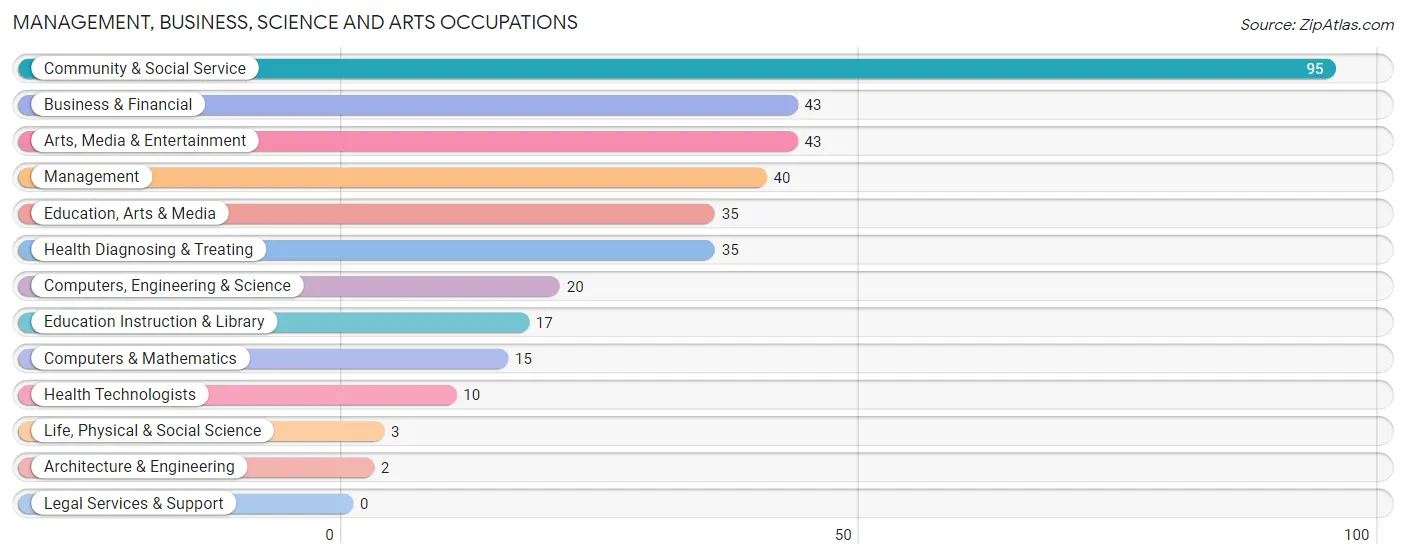
Management, Business, Science and Arts Occupations
The most common Management, Business, Science and Arts occupations in Lexington are Community & Social Service (95 | 16.3%), Business & Financial (43 | 7.4%), Arts, Media & Entertainment (43 | 7.4%), Management (40 | 6.9%), and Education, Arts & Media (35 | 6.0%).
Management, Business, Science and Arts Occupations by Sex
Within the Management, Business, Science and Arts occupations in Lexington, the most male-oriented occupations are Computers, Engineering & Science (100.0%), Computers & Mathematics (100.0%), and Architecture & Engineering (100.0%), while the most female-oriented occupations are Education Instruction & Library (100.0%), Health Technologists (100.0%), and Health Diagnosing & Treating (68.6%).
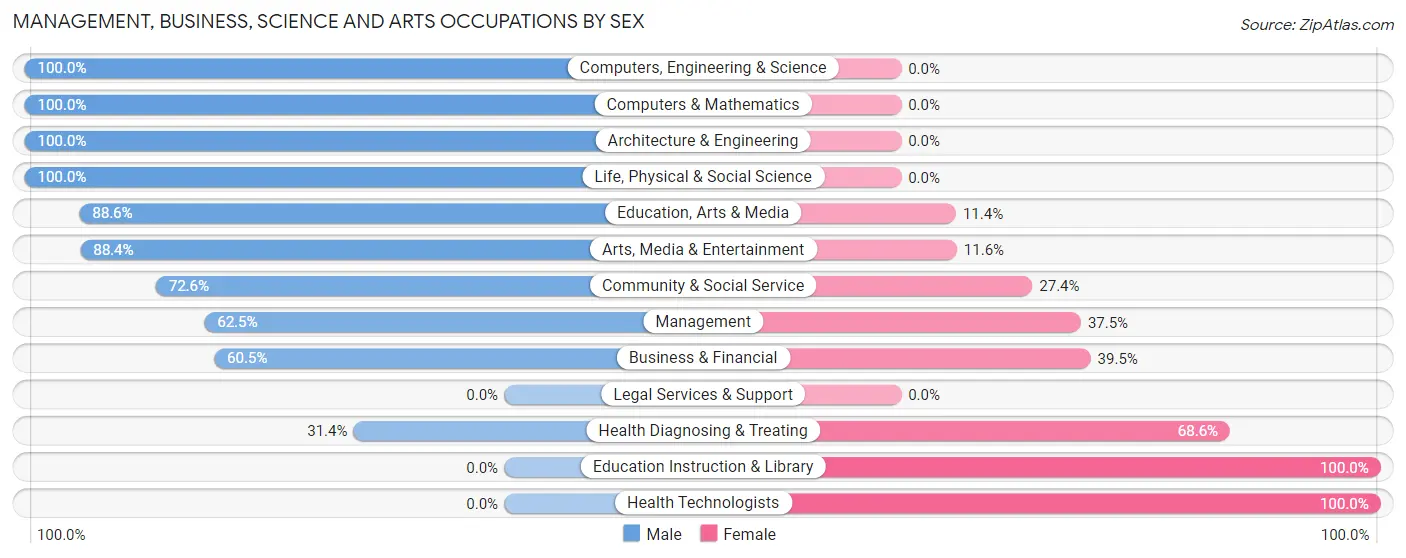
| Occupation | Male | Female |
| Management | 25 (62.5%) | 15 (37.5%) |
| Business & Financial | 26 (60.5%) | 17 (39.5%) |
| Computers, Engineering & Science | 20 (100.0%) | 0 (0.0%) |
| Computers & Mathematics | 15 (100.0%) | 0 (0.0%) |
| Architecture & Engineering | 2 (100.0%) | 0 (0.0%) |
| Life, Physical & Social Science | 3 (100.0%) | 0 (0.0%) |
| Community & Social Service | 69 (72.6%) | 26 (27.4%) |
| Education, Arts & Media | 31 (88.6%) | 4 (11.4%) |
| Legal Services & Support | 0 (0.0%) | 0 (0.0%) |
| Education Instruction & Library | 0 (0.0%) | 17 (100.0%) |
| Arts, Media & Entertainment | 38 (88.4%) | 5 (11.6%) |
| Health Diagnosing & Treating | 11 (31.4%) | 24 (68.6%) |
| Health Technologists | 0 (0.0%) | 10 (100.0%) |
| Total (Category) | 151 (64.8%) | 82 (35.2%) |
| Total (Overall) | 312 (53.5%) | 271 (46.5%) |
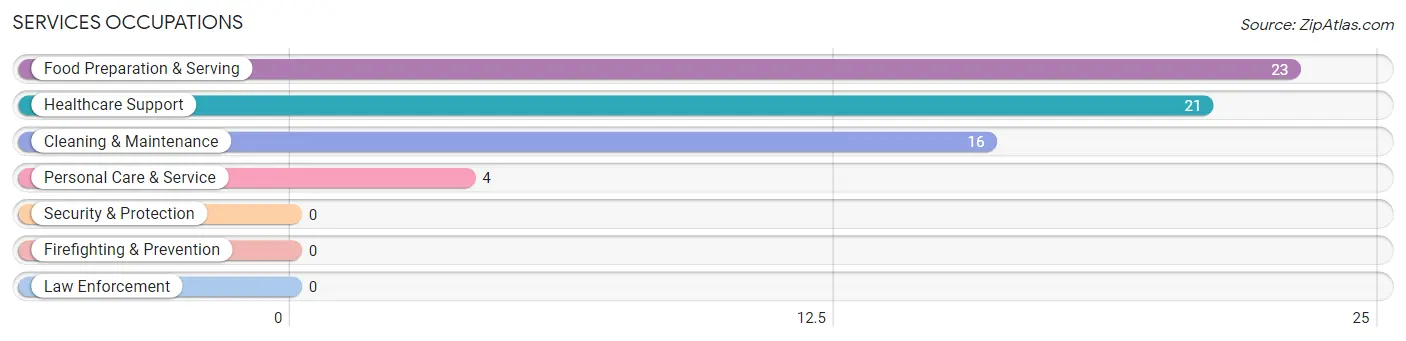
Services Occupations
The most common Services occupations in Lexington are Food Preparation & Serving (23 | 4.0%), Healthcare Support (21 | 3.6%), Cleaning & Maintenance (16 | 2.7%), and Personal Care & Service (4 | 0.7%).
Services Occupations by Sex
Within the Services occupations in Lexington, the most male-oriented occupations are Cleaning & Maintenance (93.8%), Food Preparation & Serving (21.7%), and Healthcare Support (14.3%), while the most female-oriented occupations are Personal Care & Service (100.0%), Healthcare Support (85.7%), and Food Preparation & Serving (78.3%).
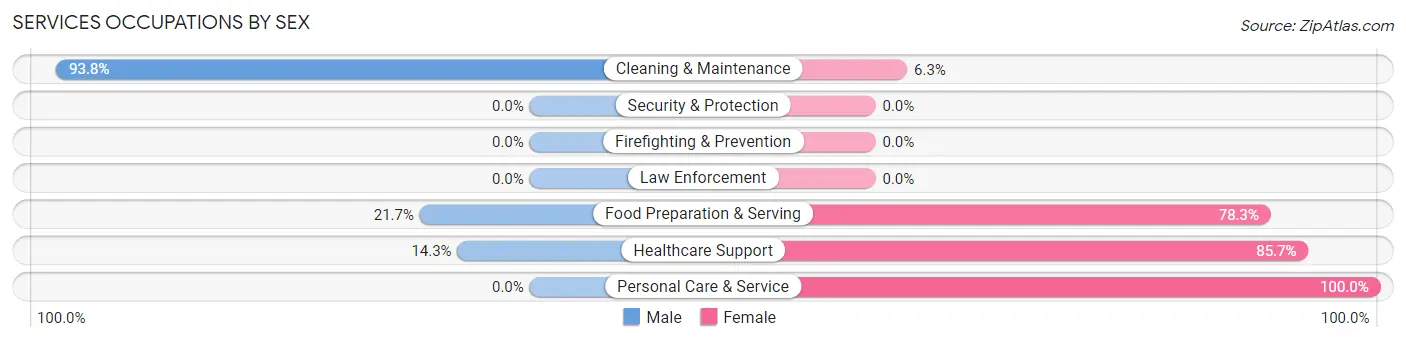
| Occupation | Male | Female |
| Healthcare Support | 3 (14.3%) | 18 (85.7%) |
| Security & Protection | 0 (0.0%) | 0 (0.0%) |
| Firefighting & Prevention | 0 (0.0%) | 0 (0.0%) |
| Law Enforcement | 0 (0.0%) | 0 (0.0%) |
| Food Preparation & Serving | 5 (21.7%) | 18 (78.3%) |
| Cleaning & Maintenance | 15 (93.8%) | 1 (6.2%) |
| Personal Care & Service | 0 (0.0%) | 4 (100.0%) |
| Total (Category) | 23 (35.9%) | 41 (64.1%) |
| Total (Overall) | 312 (53.5%) | 271 (46.5%) |
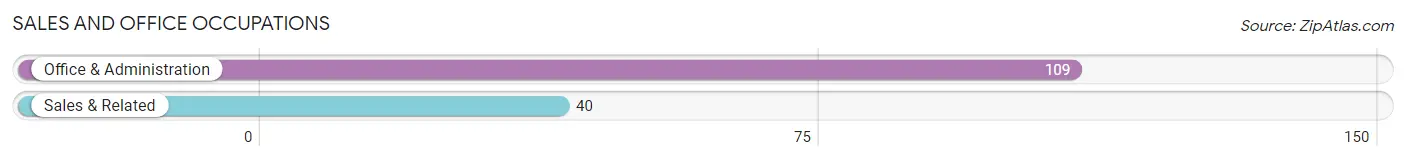
Sales and Office Occupations
The most common Sales and Office occupations in Lexington are Office & Administration (109 | 18.7%), and Sales & Related (40 | 6.9%).
Sales and Office Occupations by Sex
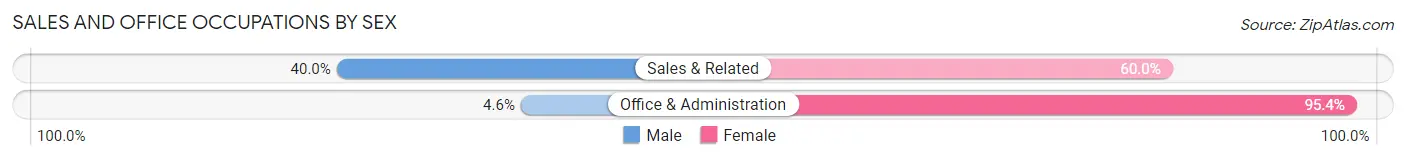
| Occupation | Male | Female |
| Sales & Related | 16 (40.0%) | 24 (60.0%) |
| Office & Administration | 5 (4.6%) | 104 (95.4%) |
| Total (Category) | 21 (14.1%) | 128 (85.9%) |
| Total (Overall) | 312 (53.5%) | 271 (46.5%) |
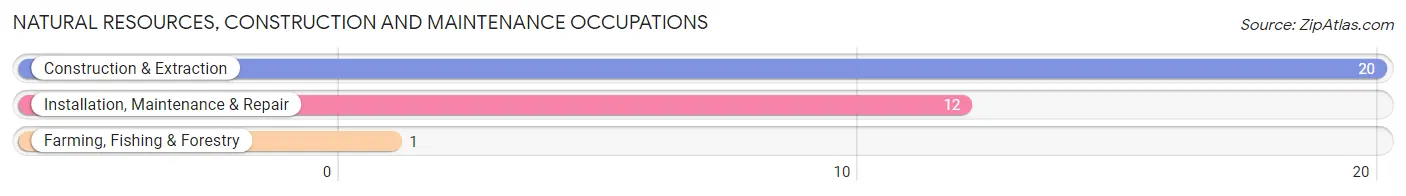
Natural Resources, Construction and Maintenance Occupations
The most common Natural Resources, Construction and Maintenance occupations in Lexington are Construction & Extraction (20 | 3.4%), Installation, Maintenance & Repair (12 | 2.1%), and Farming, Fishing & Forestry (1 | 0.2%).
Natural Resources, Construction and Maintenance Occupations by Sex
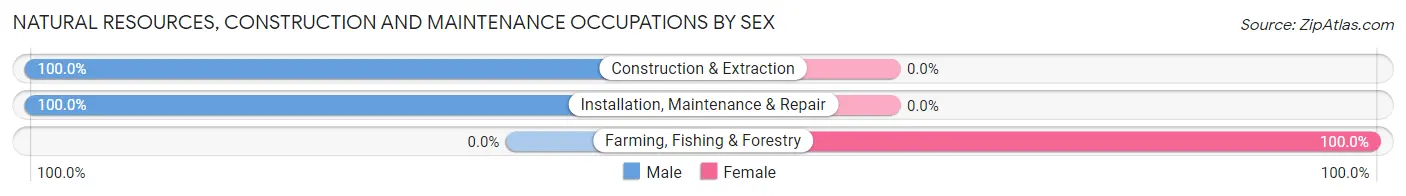
| Occupation | Male | Female |
| Farming, Fishing & Forestry | 0 (0.0%) | 1 (100.0%) |
| Construction & Extraction | 20 (100.0%) | 0 (0.0%) |
| Installation, Maintenance & Repair | 12 (100.0%) | 0 (0.0%) |
| Total (Category) | 32 (97.0%) | 1 (3.0%) |
| Total (Overall) | 312 (53.5%) | 271 (46.5%) |
Production, Transportation and Moving Occupations
The most common Production, Transportation and Moving occupations in Lexington are Material Moving (47 | 8.1%), Production (44 | 7.5%), and Transportation (13 | 2.2%).
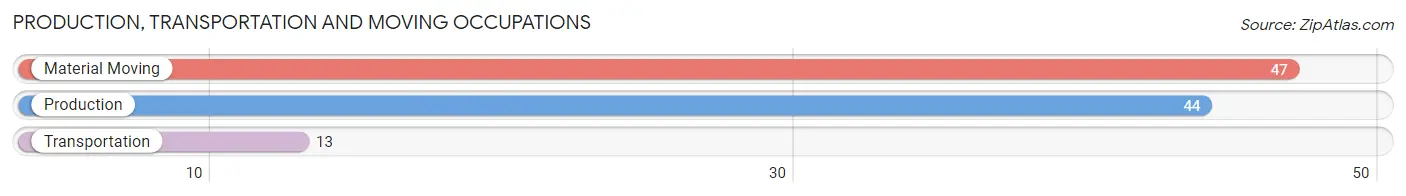
Production, Transportation and Moving Occupations by Sex
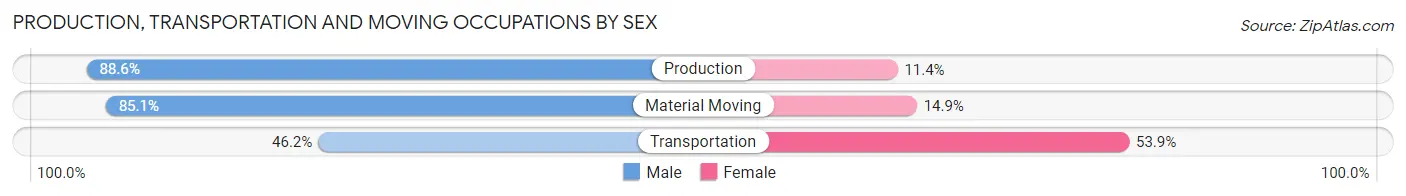
| Occupation | Male | Female |
| Production | 39 (88.6%) | 5 (11.4%) |
| Transportation | 6 (46.2%) | 7 (53.8%) |
| Material Moving | 40 (85.1%) | 7 (14.9%) |
| Total (Category) | 85 (81.7%) | 19 (18.3%) |
| Total (Overall) | 312 (53.5%) | 271 (46.5%) |
Employment Industries by Sex in Lexington
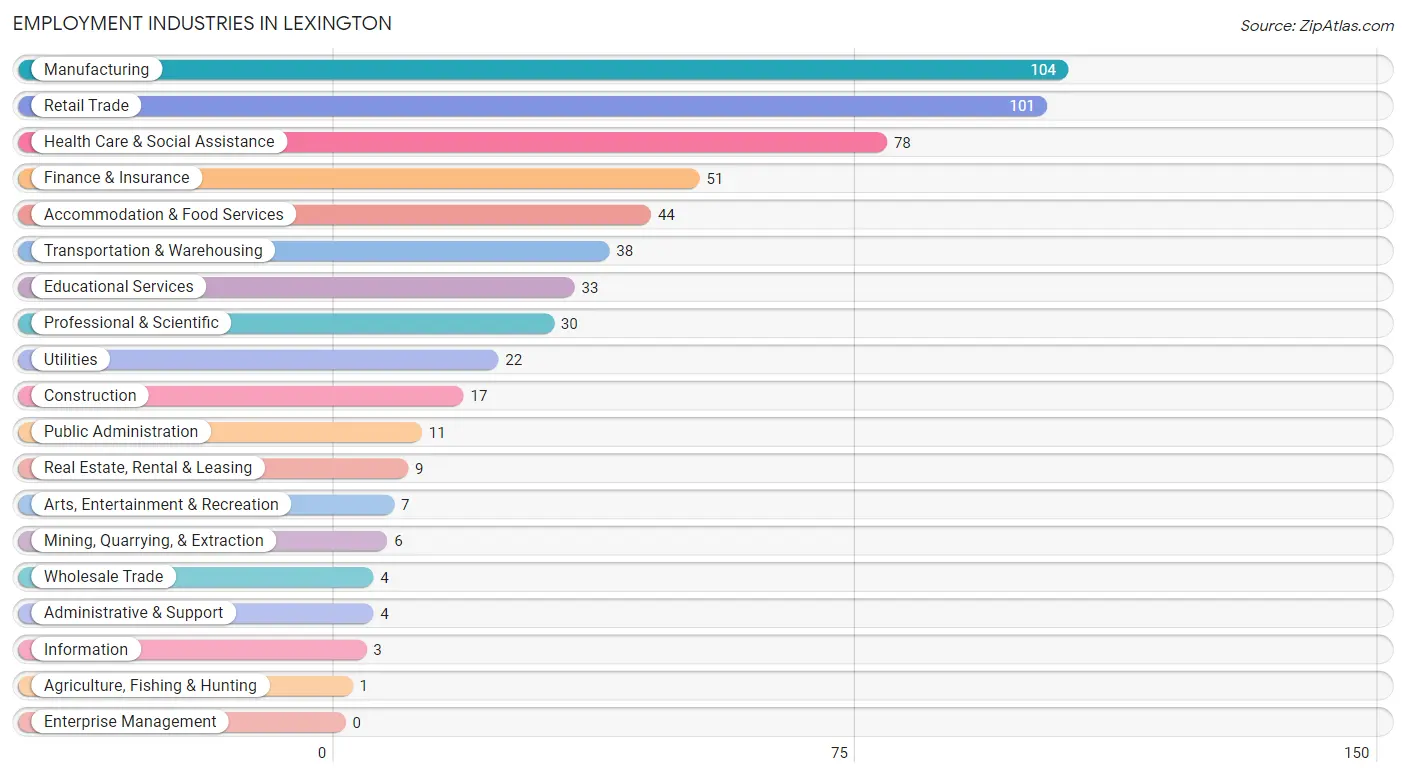
Employment Industries in Lexington
The major employment industries in Lexington include Manufacturing (104 | 17.8%), Retail Trade (101 | 17.3%), Health Care & Social Assistance (78 | 13.4%), Finance & Insurance (51 | 8.7%), and Accommodation & Food Services (44 | 7.5%).
Employment Industries by Sex in Lexington
The Lexington industries that see more men than women are Mining, Quarrying, & Extraction (100.0%), Construction (100.0%), and Wholesale Trade (100.0%), whereas the industries that tend to have a higher number of women are Agriculture, Fishing & Hunting (100.0%), Information (100.0%), and Real Estate, Rental & Leasing (100.0%).
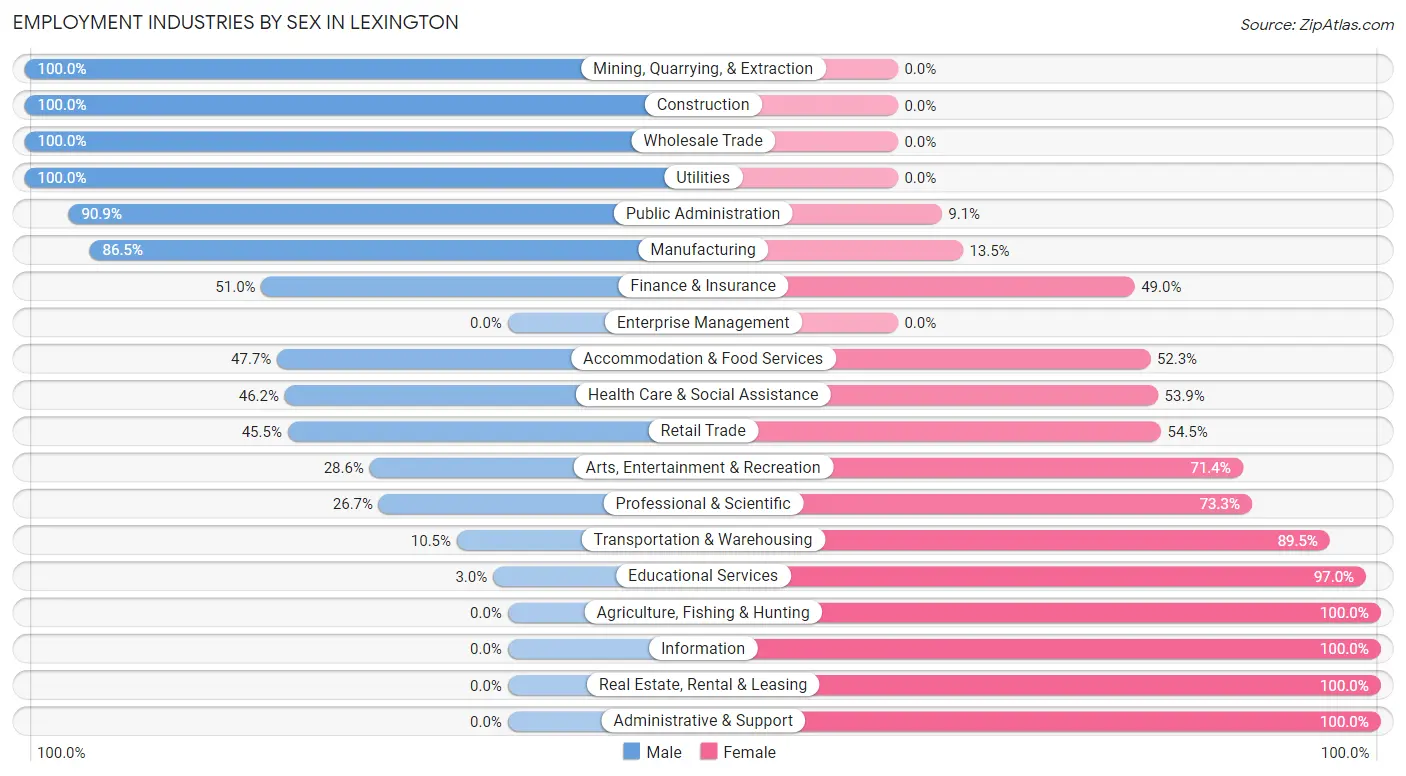
| Industry | Male | Female |
| Agriculture, Fishing & Hunting | 0 (0.0%) | 1 (100.0%) |
| Mining, Quarrying, & Extraction | 6 (100.0%) | 0 (0.0%) |
| Construction | 17 (100.0%) | 0 (0.0%) |
| Manufacturing | 90 (86.5%) | 14 (13.5%) |
| Wholesale Trade | 4 (100.0%) | 0 (0.0%) |
| Retail Trade | 46 (45.5%) | 55 (54.5%) |
| Transportation & Warehousing | 4 (10.5%) | 34 (89.5%) |
| Utilities | 22 (100.0%) | 0 (0.0%) |
| Information | 0 (0.0%) | 3 (100.0%) |
| Finance & Insurance | 26 (51.0%) | 25 (49.0%) |
| Real Estate, Rental & Leasing | 0 (0.0%) | 9 (100.0%) |
| Professional & Scientific | 8 (26.7%) | 22 (73.3%) |
| Enterprise Management | 0 (0.0%) | 0 (0.0%) |
| Administrative & Support | 0 (0.0%) | 4 (100.0%) |
| Educational Services | 1 (3.0%) | 32 (97.0%) |
| Health Care & Social Assistance | 36 (46.2%) | 42 (53.8%) |
| Arts, Entertainment & Recreation | 2 (28.6%) | 5 (71.4%) |
| Accommodation & Food Services | 21 (47.7%) | 23 (52.3%) |
| Public Administration | 10 (90.9%) | 1 (9.1%) |
| Total | 312 (53.5%) | 271 (46.5%) |
Education in Lexington
School Enrollment in Lexington
The most common levels of schooling among the 170 students in Lexington are high school (82 | 48.2%), middle school (33 | 19.4%), and elementary school (20 | 11.8%).
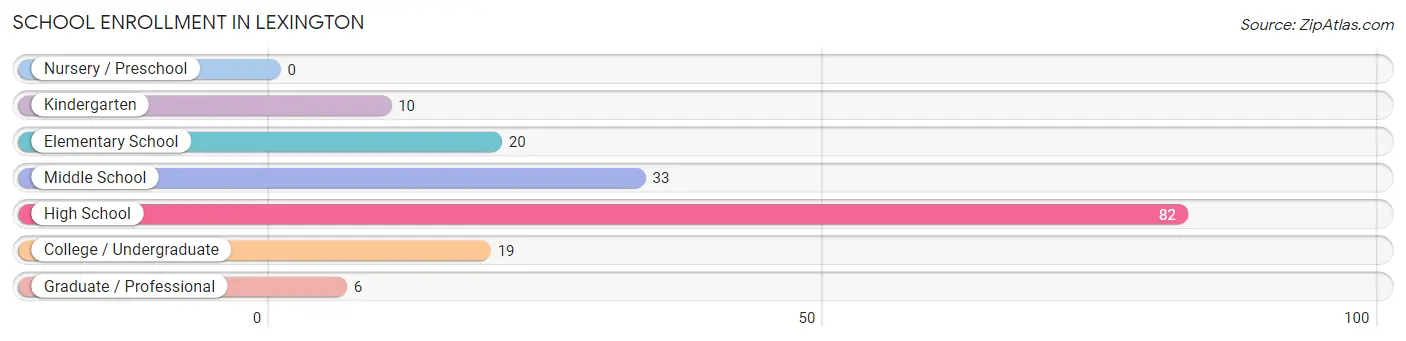
| School Level | # Students | % Students |
| Nursery / Preschool | 0 | 0.0% |
| Kindergarten | 10 | 5.9% |
| Elementary School | 20 | 11.8% |
| Middle School | 33 | 19.4% |
| High School | 82 | 48.2% |
| College / Undergraduate | 19 | 11.2% |
| Graduate / Professional | 6 | 3.5% |
| Total | 170 | 100.0% |
School Enrollment by Age by Funding Source in Lexington
Out of a total of 170 students who are enrolled in schools in Lexington, 12 (7.1%) attend a private institution, while the remaining 158 (92.9%) are enrolled in public schools. The age group of 5 to 9 year old has the highest likelihood of being enrolled in private schools, with 12 (40.0% in the age bracket) enrolled. Conversely, the age group of 10 to 14 year olds has the lowest likelihood of being enrolled in a private school, with 72 (100.0% in the age bracket) attending a public institution.
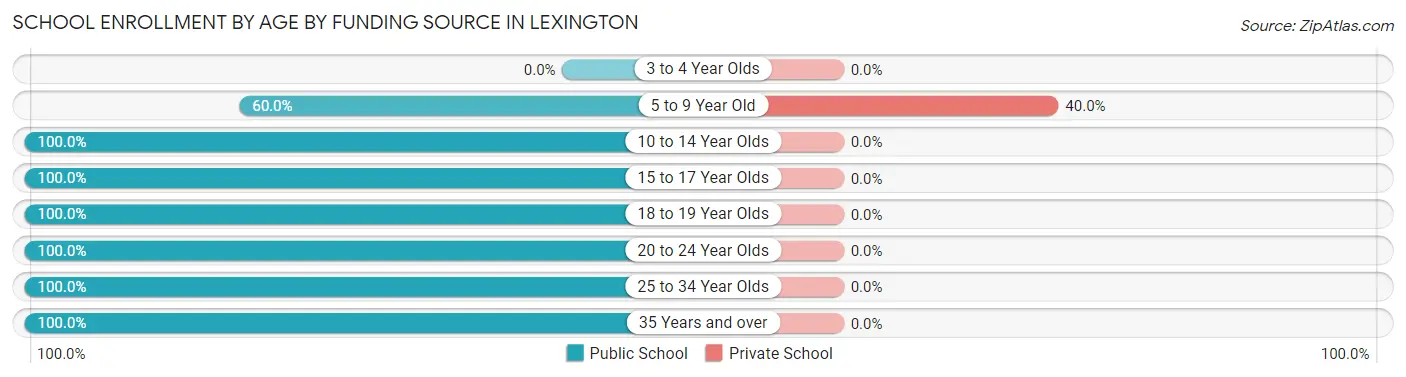
| Age Bracket | Public School | Private School |
| 3 to 4 Year Olds | 0 (0.0%) | 0 (0.0%) |
| 5 to 9 Year Old | 18 (60.0%) | 12 (40.0%) |
| 10 to 14 Year Olds | 72 (100.0%) | 0 (0.0%) |
| 15 to 17 Year Olds | 27 (100.0%) | 0 (0.0%) |
| 18 to 19 Year Olds | 20 (100.0%) | 0 (0.0%) |
| 20 to 24 Year Olds | 5 (100.0%) | 0 (0.0%) |
| 25 to 34 Year Olds | 12 (100.0%) | 0 (0.0%) |
| 35 Years and over | 4 (100.0%) | 0 (0.0%) |
| Total | 158 (92.9%) | 12 (7.1%) |
Educational Attainment by Field of Study in Lexington
Business (93 | 30.4%), education (35 | 11.4%), science & technology (34 | 11.1%), literature & languages (31 | 10.1%), and arts & humanities (26 | 8.5%) are the most common fields of study among 306 individuals in Lexington who have obtained a bachelor's degree or higher.
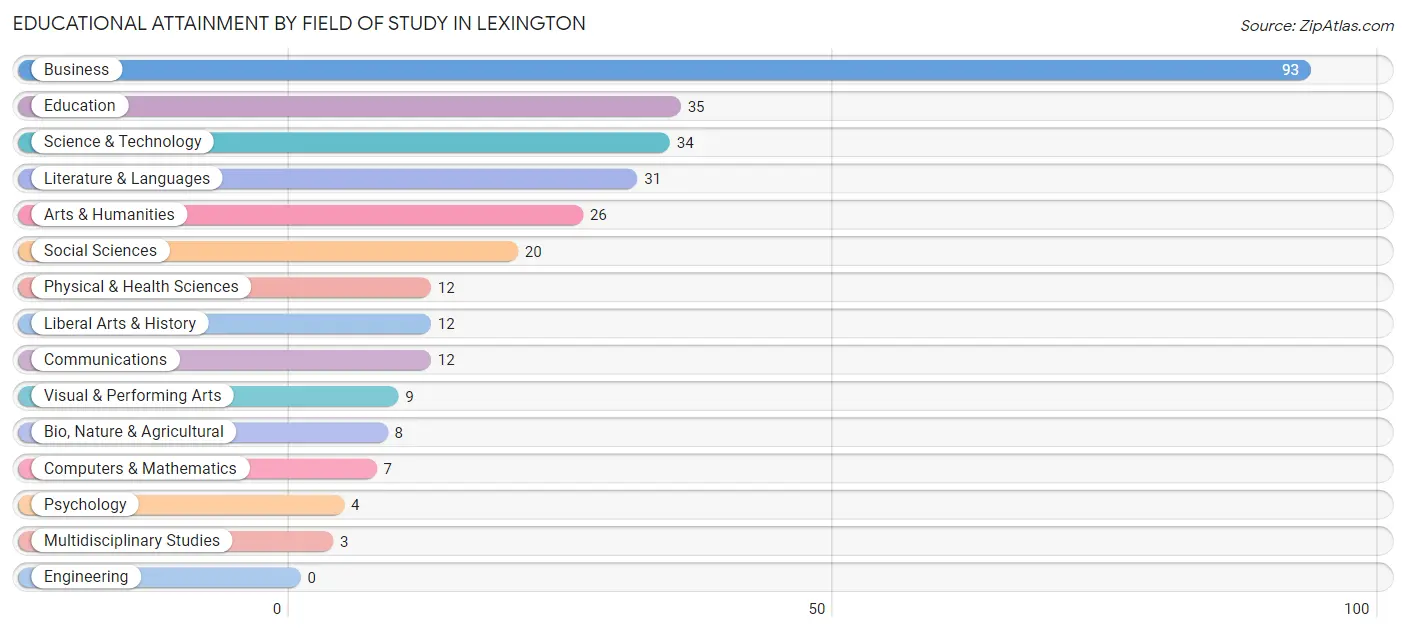
| Field of Study | # Graduates | % Graduates |
| Computers & Mathematics | 7 | 2.3% |
| Bio, Nature & Agricultural | 8 | 2.6% |
| Physical & Health Sciences | 12 | 3.9% |
| Psychology | 4 | 1.3% |
| Social Sciences | 20 | 6.5% |
| Engineering | 0 | 0.0% |
| Multidisciplinary Studies | 3 | 1.0% |
| Science & Technology | 34 | 11.1% |
| Business | 93 | 30.4% |
| Education | 35 | 11.4% |
| Literature & Languages | 31 | 10.1% |
| Liberal Arts & History | 12 | 3.9% |
| Visual & Performing Arts | 9 | 2.9% |
| Communications | 12 | 3.9% |
| Arts & Humanities | 26 | 8.5% |
| Total | 306 | 100.0% |
Transportation & Commute in Lexington
Vehicle Availability by Sex in Lexington
The most prevalent vehicle ownership categories in Lexington are males with 2 vehicles (160, accounting for 51.9%) and females with 2 vehicles (134, making up 60.6%).
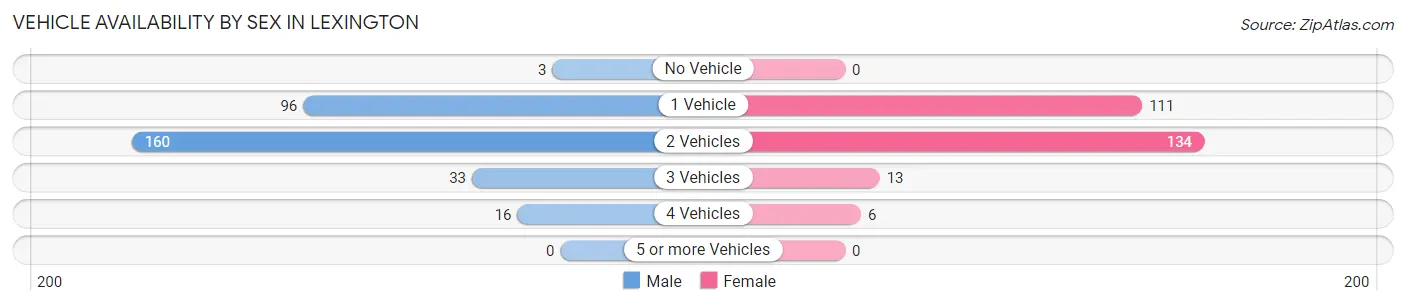
| Vehicles Available | Male | Female |
| No Vehicle | 3 (1.0%) | 0 (0.0%) |
| 1 Vehicle | 96 (31.2%) | 111 (42.0%) |
| 2 Vehicles | 160 (51.9%) | 134 (50.8%) |
| 3 Vehicles | 33 (10.7%) | 13 (4.9%) |
| 4 Vehicles | 16 (5.2%) | 6 (2.3%) |
| 5 or more Vehicles | 0 (0.0%) | 0 (0.0%) |
| Total | 308 (100.0%) | 264 (100.0%) |
Commute Time in Lexington
The most frequently occuring commute durations in Lexington are 30 to 34 minutes (77 commuters, 15.3%), 10 to 14 minutes (72 commuters, 14.3%), and 60 to 89 minutes (62 commuters, 12.3%).
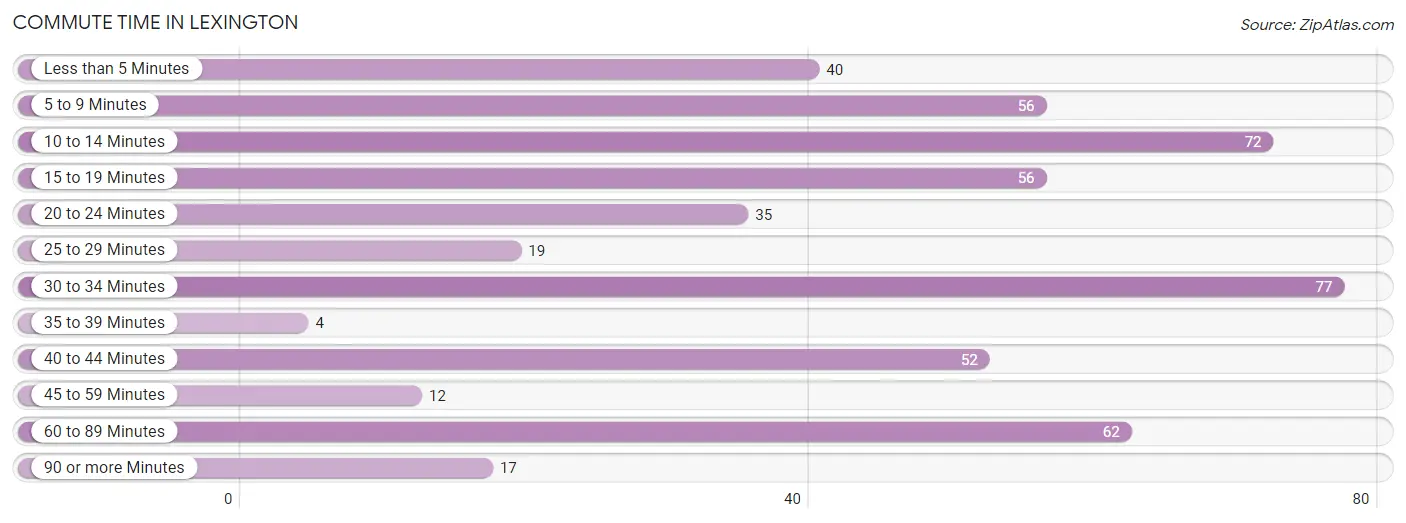
| Commute Time | # Commuters | % Commuters |
| Less than 5 Minutes | 40 | 8.0% |
| 5 to 9 Minutes | 56 | 11.2% |
| 10 to 14 Minutes | 72 | 14.3% |
| 15 to 19 Minutes | 56 | 11.2% |
| 20 to 24 Minutes | 35 | 7.0% |
| 25 to 29 Minutes | 19 | 3.8% |
| 30 to 34 Minutes | 77 | 15.3% |
| 35 to 39 Minutes | 4 | 0.8% |
| 40 to 44 Minutes | 52 | 10.4% |
| 45 to 59 Minutes | 12 | 2.4% |
| 60 to 89 Minutes | 62 | 12.3% |
| 90 or more Minutes | 17 | 3.4% |
Commute Time by Sex in Lexington
The most common commute times in Lexington are 10 to 14 minutes (54 commuters, 20.2%) for males and 30 to 34 minutes (45 commuters, 19.2%) for females.
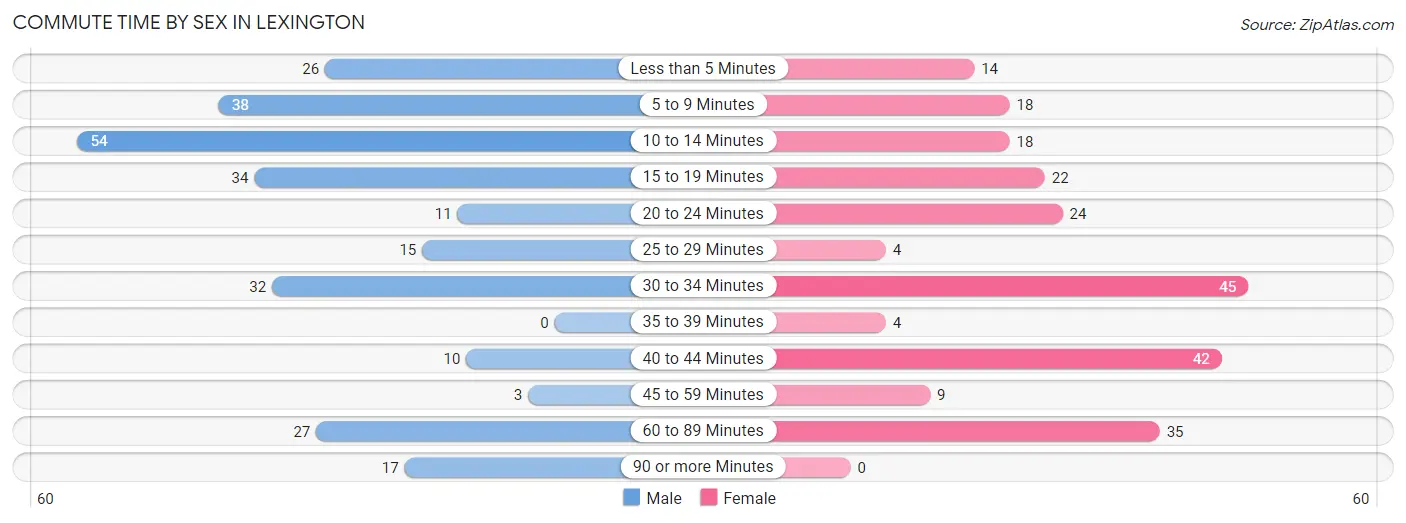
| Commute Time | Male | Female |
| Less than 5 Minutes | 26 (9.7%) | 14 (6.0%) |
| 5 to 9 Minutes | 38 (14.2%) | 18 (7.7%) |
| 10 to 14 Minutes | 54 (20.2%) | 18 (7.7%) |
| 15 to 19 Minutes | 34 (12.7%) | 22 (9.4%) |
| 20 to 24 Minutes | 11 (4.1%) | 24 (10.2%) |
| 25 to 29 Minutes | 15 (5.6%) | 4 (1.7%) |
| 30 to 34 Minutes | 32 (12.0%) | 45 (19.2%) |
| 35 to 39 Minutes | 0 (0.0%) | 4 (1.7%) |
| 40 to 44 Minutes | 10 (3.7%) | 42 (17.9%) |
| 45 to 59 Minutes | 3 (1.1%) | 9 (3.8%) |
| 60 to 89 Minutes | 27 (10.1%) | 35 (14.9%) |
| 90 or more Minutes | 17 (6.4%) | 0 (0.0%) |
Time of Departure to Work by Sex in Lexington
The most frequent times of departure to work in Lexington are 7:30 AM to 7:59 AM (55, 20.6%) for males and 7:30 AM to 7:59 AM (63, 26.8%) for females.
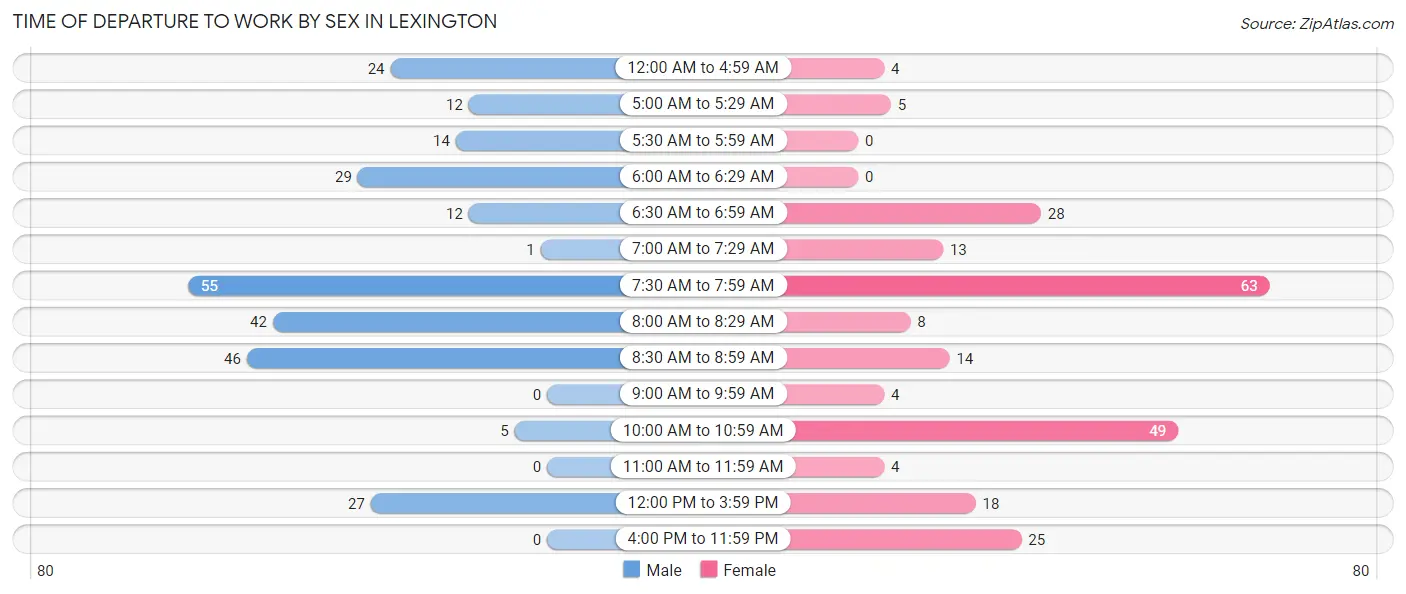
| Time of Departure | Male | Female |
| 12:00 AM to 4:59 AM | 24 (9.0%) | 4 (1.7%) |
| 5:00 AM to 5:29 AM | 12 (4.5%) | 5 (2.1%) |
| 5:30 AM to 5:59 AM | 14 (5.2%) | 0 (0.0%) |
| 6:00 AM to 6:29 AM | 29 (10.9%) | 0 (0.0%) |
| 6:30 AM to 6:59 AM | 12 (4.5%) | 28 (11.9%) |
| 7:00 AM to 7:29 AM | 1 (0.4%) | 13 (5.5%) |
| 7:30 AM to 7:59 AM | 55 (20.6%) | 63 (26.8%) |
| 8:00 AM to 8:29 AM | 42 (15.7%) | 8 (3.4%) |
| 8:30 AM to 8:59 AM | 46 (17.2%) | 14 (6.0%) |
| 9:00 AM to 9:59 AM | 0 (0.0%) | 4 (1.7%) |
| 10:00 AM to 10:59 AM | 5 (1.9%) | 49 (20.8%) |
| 11:00 AM to 11:59 AM | 0 (0.0%) | 4 (1.7%) |
| 12:00 PM to 3:59 PM | 27 (10.1%) | 18 (7.7%) |
| 4:00 PM to 11:59 PM | 0 (0.0%) | 25 (10.6%) |
| Total | 267 (100.0%) | 235 (100.0%) |
Housing Occupancy in Lexington
Occupancy by Ownership in Lexington
Of the total 807 dwellings in Lexington, owner-occupied units account for 503 (62.3%), while renter-occupied units make up 304 (37.7%).
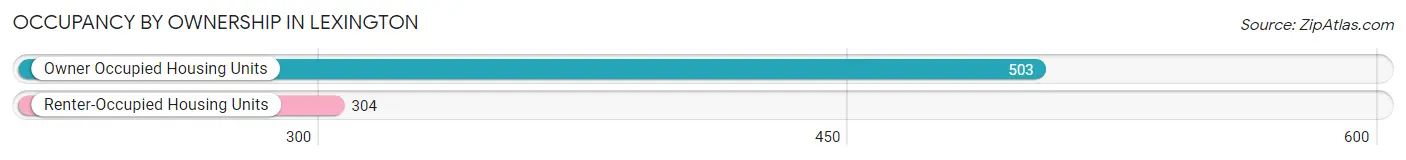
| Occupancy | # Housing Units | % Housing Units |
| Owner Occupied Housing Units | 503 | 62.3% |
| Renter-Occupied Housing Units | 304 | 37.7% |
| Total Occupied Housing Units | 807 | 100.0% |
Occupancy by Household Size in Lexington
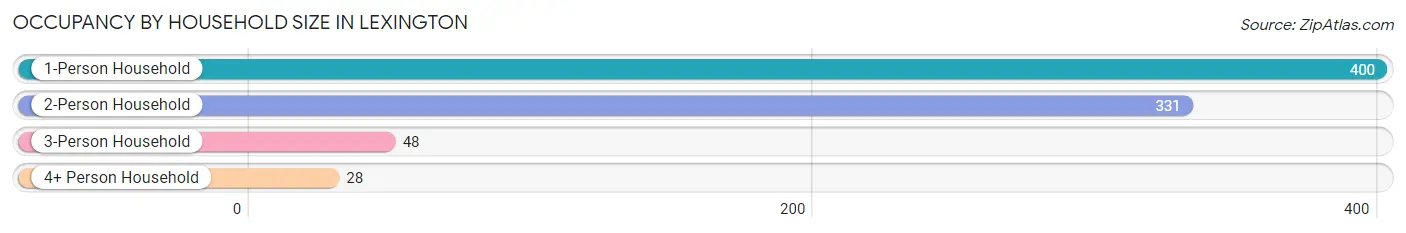
| Household Size | # Housing Units | % Housing Units |
| 1-Person Household | 400 | 49.6% |
| 2-Person Household | 331 | 41.0% |
| 3-Person Household | 48 | 5.9% |
| 4+ Person Household | 28 | 3.5% |
| Total Housing Units | 807 | 100.0% |
Occupancy by Ownership by Household Size in Lexington
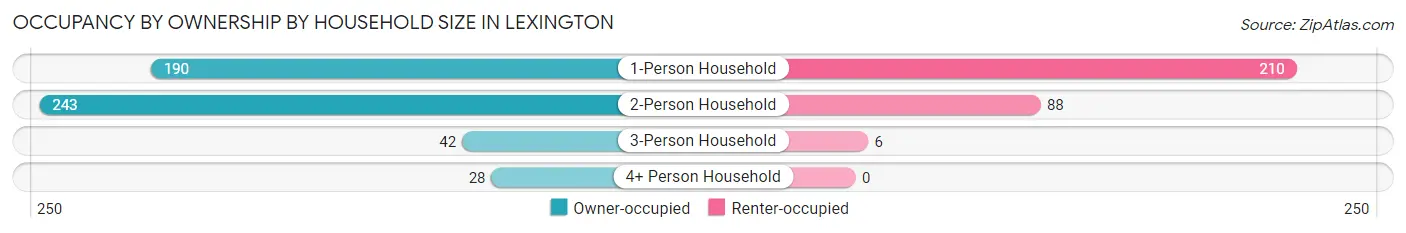
| Household Size | Owner-occupied | Renter-occupied |
| 1-Person Household | 190 (47.5%) | 210 (52.5%) |
| 2-Person Household | 243 (73.4%) | 88 (26.6%) |
| 3-Person Household | 42 (87.5%) | 6 (12.5%) |
| 4+ Person Household | 28 (100.0%) | 0 (0.0%) |
| Total Housing Units | 503 (62.3%) | 304 (37.7%) |
Occupancy by Educational Attainment in Lexington
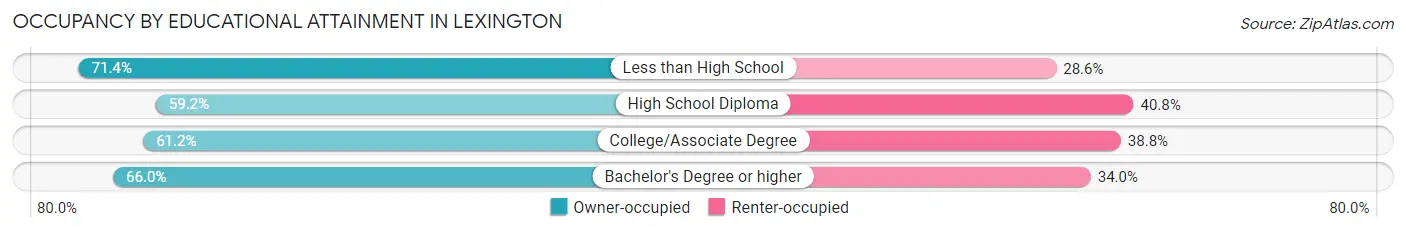
| Household Size | Owner-occupied | Renter-occupied |
| Less than High School | 20 (71.4%) | 8 (28.6%) |
| High School Diploma | 142 (59.2%) | 98 (40.8%) |
| College/Associate Degree | 186 (61.2%) | 118 (38.8%) |
| Bachelor's Degree or higher | 155 (66.0%) | 80 (34.0%) |
Occupancy by Age of Householder in Lexington
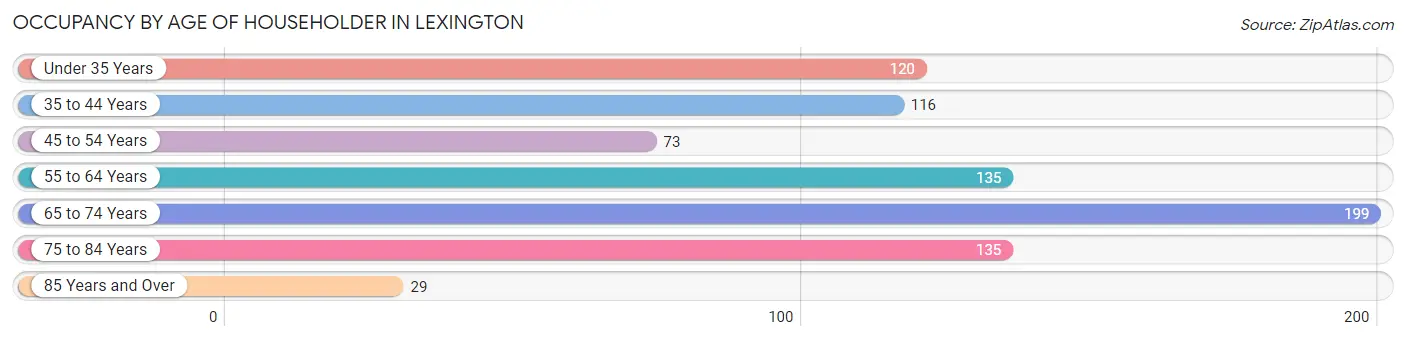
| Age Bracket | # Households | % Households |
| Under 35 Years | 120 | 14.9% |
| 35 to 44 Years | 116 | 14.4% |
| 45 to 54 Years | 73 | 9.0% |
| 55 to 64 Years | 135 | 16.7% |
| 65 to 74 Years | 199 | 24.7% |
| 75 to 84 Years | 135 | 16.7% |
| 85 Years and Over | 29 | 3.6% |
| Total | 807 | 100.0% |
Housing Finances in Lexington
Median Income by Occupancy in Lexington
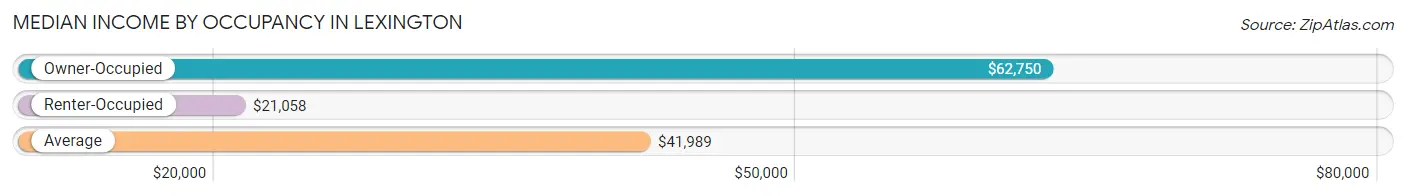
| Occupancy Type | # Households | Median Income |
| Owner-Occupied | 503 (62.3%) | $62,750 |
| Renter-Occupied | 304 (37.7%) | $21,058 |
| Average | 807 (100.0%) | $41,989 |
Occupancy by Householder Income Bracket in Lexington
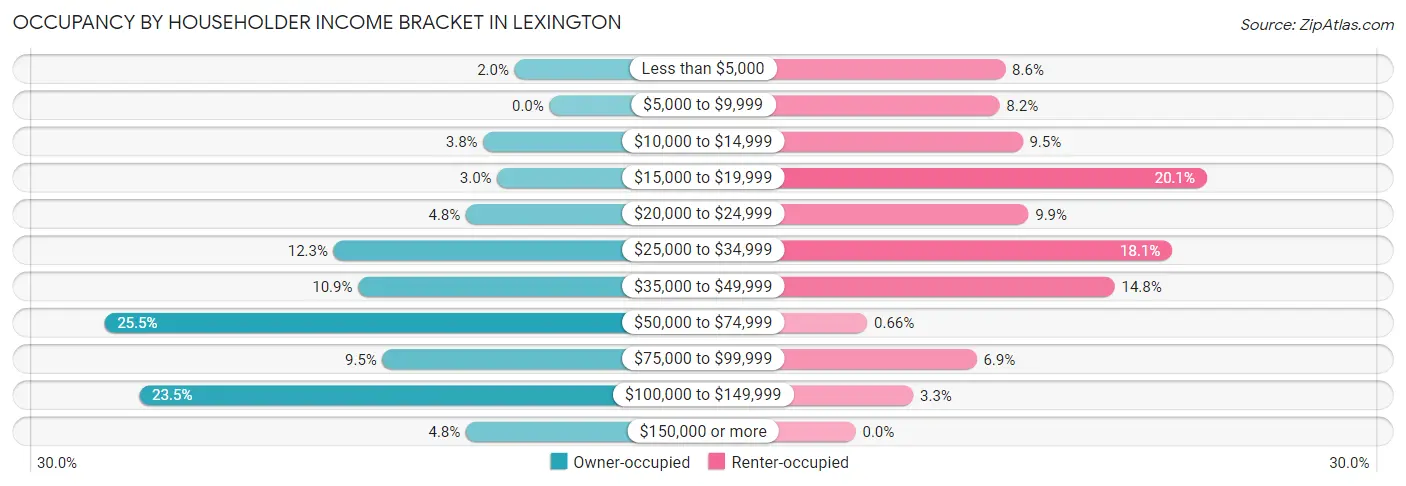
| Income Bracket | Owner-occupied | Renter-occupied |
| Less than $5,000 | 10 (2.0%) | 26 (8.6%) |
| $5,000 to $9,999 | 0 (0.0%) | 25 (8.2%) |
| $10,000 to $14,999 | 19 (3.8%) | 29 (9.5%) |
| $15,000 to $19,999 | 15 (3.0%) | 61 (20.1%) |
| $20,000 to $24,999 | 24 (4.8%) | 30 (9.9%) |
| $25,000 to $34,999 | 62 (12.3%) | 55 (18.1%) |
| $35,000 to $49,999 | 55 (10.9%) | 45 (14.8%) |
| $50,000 to $74,999 | 128 (25.5%) | 2 (0.7%) |
| $75,000 to $99,999 | 48 (9.5%) | 21 (6.9%) |
| $100,000 to $149,999 | 118 (23.5%) | 10 (3.3%) |
| $150,000 or more | 24 (4.8%) | 0 (0.0%) |
| Total | 503 (100.0%) | 304 (100.0%) |
Monthly Housing Cost Tiers in Lexington
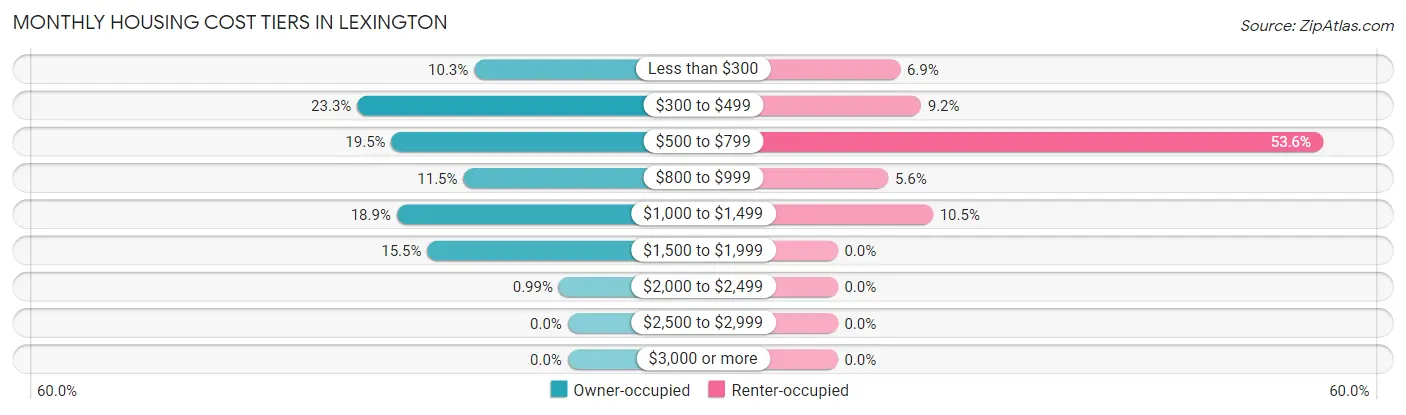
| Monthly Cost | Owner-occupied | Renter-occupied |
| Less than $300 | 52 (10.3%) | 21 (6.9%) |
| $300 to $499 | 117 (23.3%) | 28 (9.2%) |
| $500 to $799 | 98 (19.5%) | 163 (53.6%) |
| $800 to $999 | 58 (11.5%) | 17 (5.6%) |
| $1,000 to $1,499 | 95 (18.9%) | 32 (10.5%) |
| $1,500 to $1,999 | 78 (15.5%) | 0 (0.0%) |
| $2,000 to $2,499 | 5 (1.0%) | 0 (0.0%) |
| $2,500 to $2,999 | 0 (0.0%) | 0 (0.0%) |
| $3,000 or more | 0 (0.0%) | 0 (0.0%) |
| Total | 503 (100.0%) | 304 (100.0%) |
Physical Housing Characteristics in Lexington
Housing Structures in Lexington
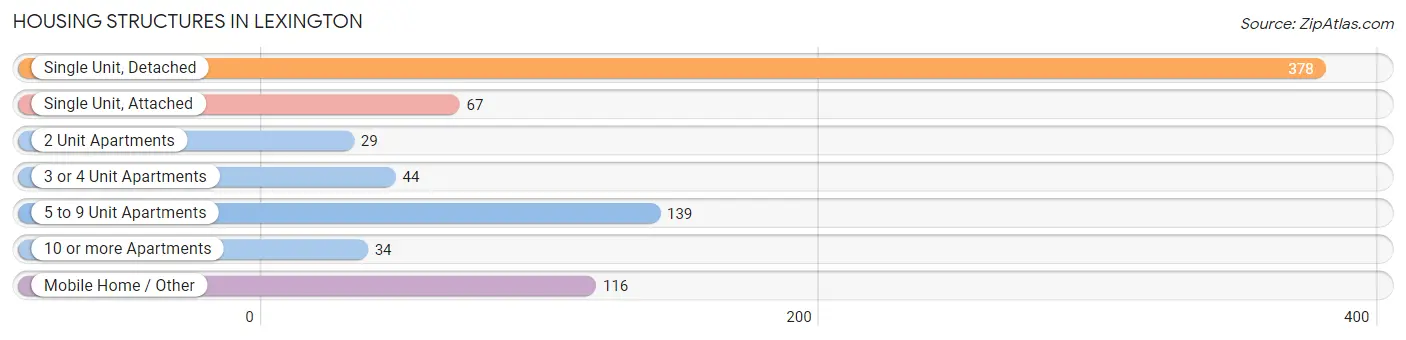
| Structure Type | # Housing Units | % Housing Units |
| Single Unit, Detached | 378 | 46.8% |
| Single Unit, Attached | 67 | 8.3% |
| 2 Unit Apartments | 29 | 3.6% |
| 3 or 4 Unit Apartments | 44 | 5.4% |
| 5 to 9 Unit Apartments | 139 | 17.2% |
| 10 or more Apartments | 34 | 4.2% |
| Mobile Home / Other | 116 | 14.4% |
| Total | 807 | 100.0% |
Housing Structures by Occupancy in Lexington
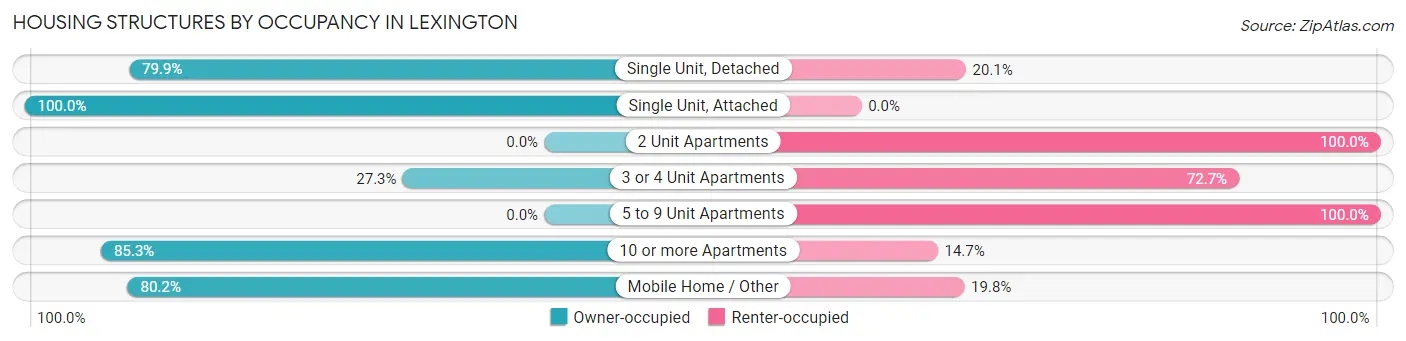
| Structure Type | Owner-occupied | Renter-occupied |
| Single Unit, Detached | 302 (79.9%) | 76 (20.1%) |
| Single Unit, Attached | 67 (100.0%) | 0 (0.0%) |
| 2 Unit Apartments | 0 (0.0%) | 29 (100.0%) |
| 3 or 4 Unit Apartments | 12 (27.3%) | 32 (72.7%) |
| 5 to 9 Unit Apartments | 0 (0.0%) | 139 (100.0%) |
| 10 or more Apartments | 29 (85.3%) | 5 (14.7%) |
| Mobile Home / Other | 93 (80.2%) | 23 (19.8%) |
| Total | 503 (62.3%) | 304 (37.7%) |
Housing Structures by Number of Rooms in Lexington
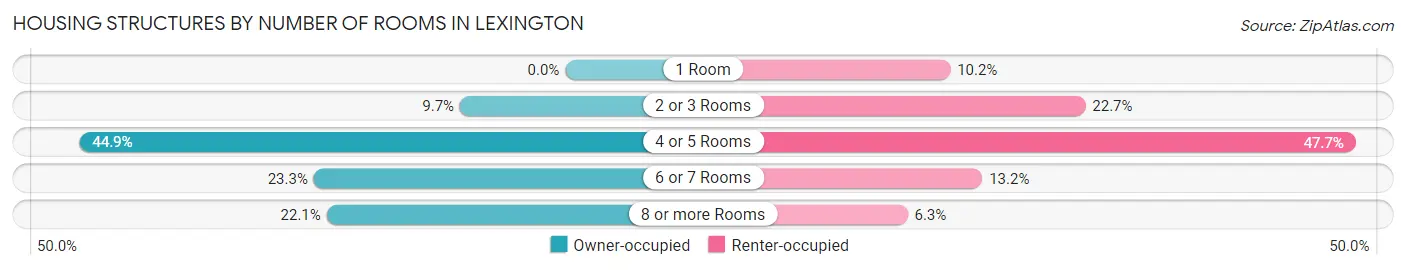
| Number of Rooms | Owner-occupied | Renter-occupied |
| 1 Room | 0 (0.0%) | 31 (10.2%) |
| 2 or 3 Rooms | 49 (9.7%) | 69 (22.7%) |
| 4 or 5 Rooms | 226 (44.9%) | 145 (47.7%) |
| 6 or 7 Rooms | 117 (23.3%) | 40 (13.2%) |
| 8 or more Rooms | 111 (22.1%) | 19 (6.2%) |
| Total | 503 (100.0%) | 304 (100.0%) |
Housing Structure by Heating Type in Lexington
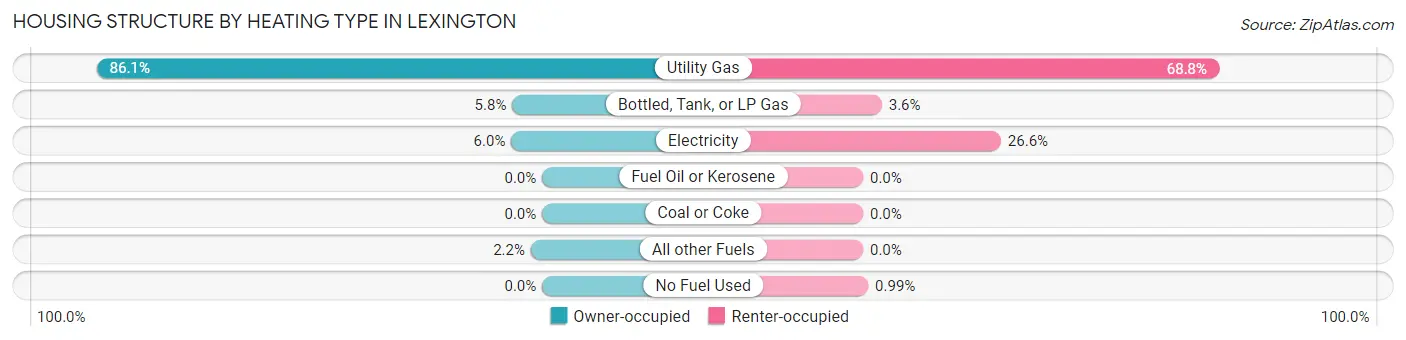
| Heating Type | Owner-occupied | Renter-occupied |
| Utility Gas | 433 (86.1%) | 209 (68.8%) |
| Bottled, Tank, or LP Gas | 29 (5.8%) | 11 (3.6%) |
| Electricity | 30 (6.0%) | 81 (26.6%) |
| Fuel Oil or Kerosene | 0 (0.0%) | 0 (0.0%) |
| Coal or Coke | 0 (0.0%) | 0 (0.0%) |
| All other Fuels | 11 (2.2%) | 0 (0.0%) |
| No Fuel Used | 0 (0.0%) | 3 (1.0%) |
| Total | 503 (100.0%) | 304 (100.0%) |
Household Vehicle Usage in Lexington
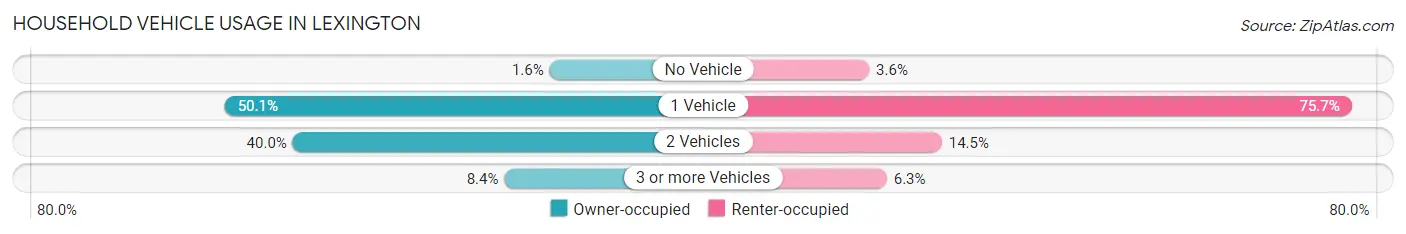
| Vehicles per Household | Owner-occupied | Renter-occupied |
| No Vehicle | 8 (1.6%) | 11 (3.6%) |
| 1 Vehicle | 252 (50.1%) | 230 (75.7%) |
| 2 Vehicles | 201 (40.0%) | 44 (14.5%) |
| 3 or more Vehicles | 42 (8.4%) | 19 (6.2%) |
| Total | 503 (100.0%) | 304 (100.0%) |
Real Estate & Mortgages in Lexington
Real Estate and Mortgage Overview in Lexington
| Characteristic | Without Mortgage | With Mortgage |
| Housing Units | 298 | 205 |
| Median Property Value | $160,200 | $212,900 |
| Median Household Income | $48,929 | $22 |
| Monthly Housing Costs | $491 | $0 |
| Real Estate Taxes | $1,953 | $8 |
Property Value by Mortgage Status in Lexington
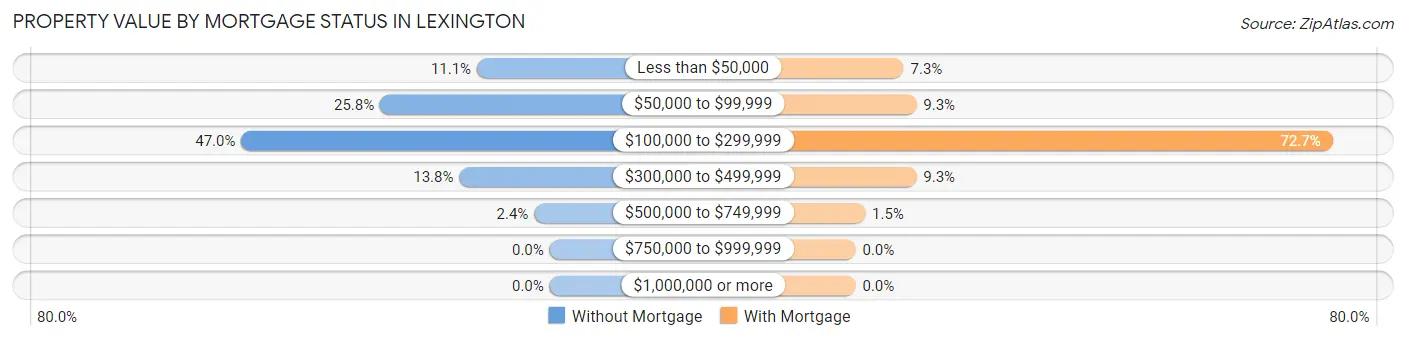
| Property Value | Without Mortgage | With Mortgage |
| Less than $50,000 | 33 (11.1%) | 15 (7.3%) |
| $50,000 to $99,999 | 77 (25.8%) | 19 (9.3%) |
| $100,000 to $299,999 | 140 (47.0%) | 149 (72.7%) |
| $300,000 to $499,999 | 41 (13.8%) | 19 (9.3%) |
| $500,000 to $749,999 | 7 (2.4%) | 3 (1.5%) |
| $750,000 to $999,999 | 0 (0.0%) | 0 (0.0%) |
| $1,000,000 or more | 0 (0.0%) | 0 (0.0%) |
| Total | 298 (100.0%) | 205 (100.0%) |
Household Income by Mortgage Status in Lexington
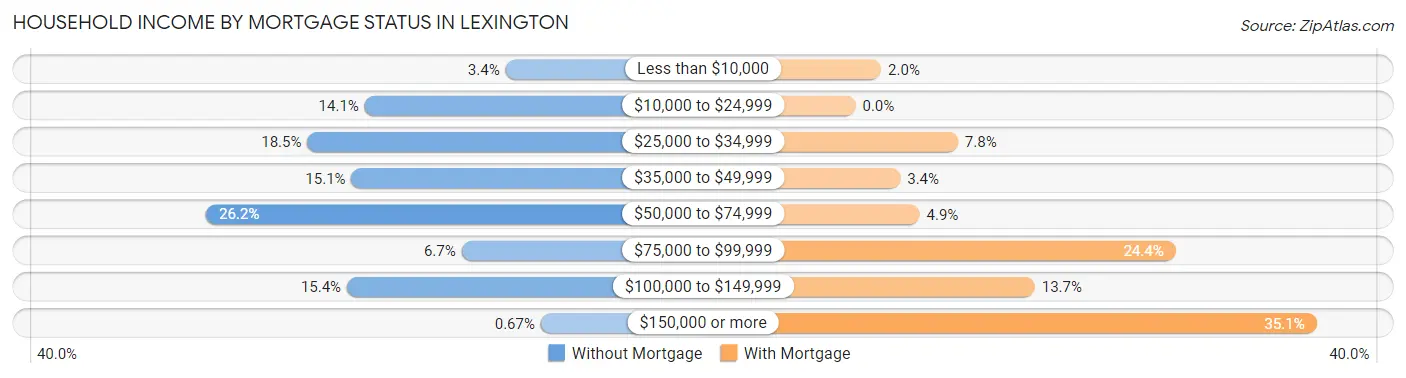
| Household Income | Without Mortgage | With Mortgage |
| Less than $10,000 | 10 (3.4%) | 4 (1.9%) |
| $10,000 to $24,999 | 42 (14.1%) | 0 (0.0%) |
| $25,000 to $34,999 | 55 (18.5%) | 16 (7.8%) |
| $35,000 to $49,999 | 45 (15.1%) | 7 (3.4%) |
| $50,000 to $74,999 | 78 (26.2%) | 10 (4.9%) |
| $75,000 to $99,999 | 20 (6.7%) | 50 (24.4%) |
| $100,000 to $149,999 | 46 (15.4%) | 28 (13.7%) |
| $150,000 or more | 2 (0.7%) | 72 (35.1%) |
| Total | 298 (100.0%) | 205 (100.0%) |
Property Value to Household Income Ratio in Lexington
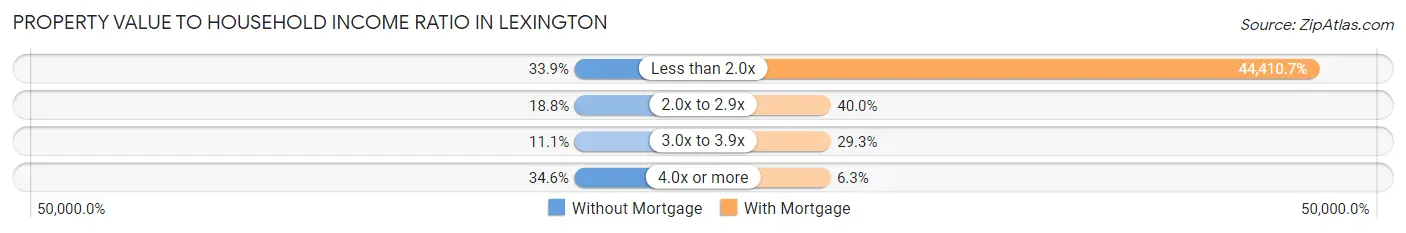
| Value-to-Income Ratio | Without Mortgage | With Mortgage |
| Less than 2.0x | 101 (33.9%) | 91,042 (44,410.7%) |
| 2.0x to 2.9x | 56 (18.8%) | 82 (40.0%) |
| 3.0x to 3.9x | 33 (11.1%) | 60 (29.3%) |
| 4.0x or more | 103 (34.6%) | 13 (6.3%) |
| Total | 298 (100.0%) | 205 (100.0%) |
Real Estate Taxes by Mortgage Status in Lexington
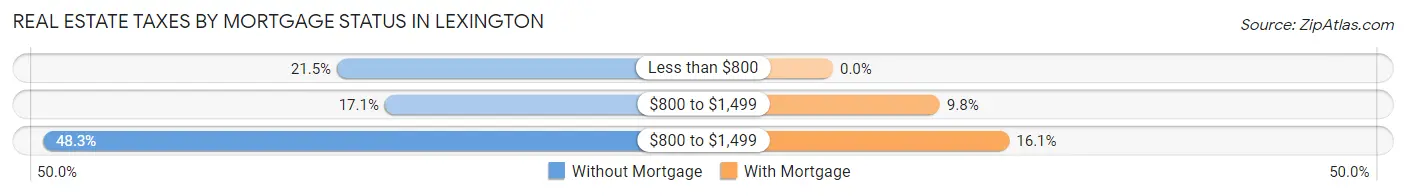
| Property Taxes | Without Mortgage | With Mortgage |
| Less than $800 | 64 (21.5%) | 0 (0.0%) |
| $800 to $1,499 | 51 (17.1%) | 20 (9.8%) |
| $800 to $1,499 | 144 (48.3%) | 33 (16.1%) |
| Total | 298 (100.0%) | 205 (100.0%) |
Health & Disability in Lexington
Health Insurance Coverage by Age in Lexington
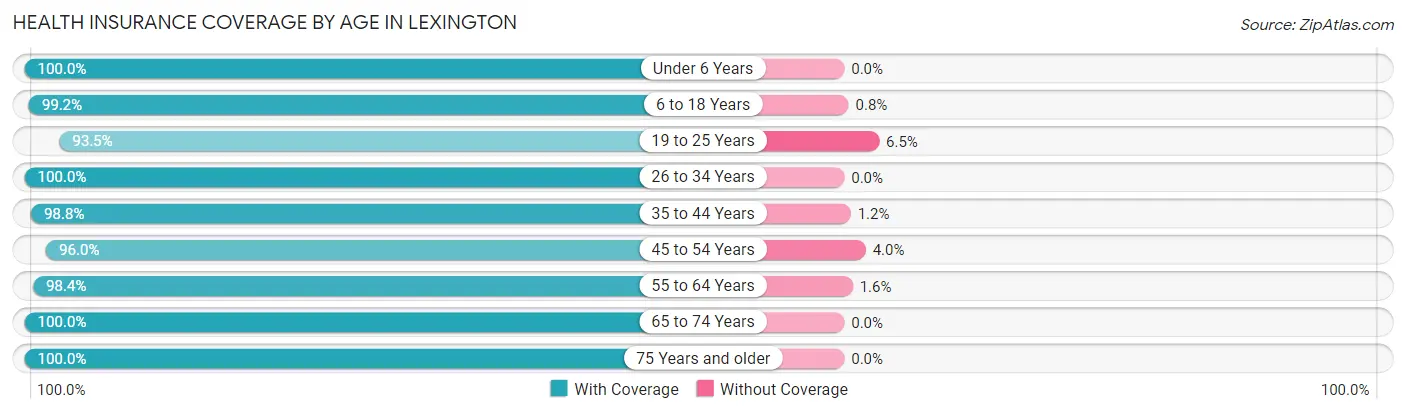
| Age Bracket | With Coverage | Without Coverage |
| Under 6 Years | 10 (100.0%) | 0 (0.0%) |
| 6 to 18 Years | 124 (99.2%) | 1 (0.8%) |
| 19 to 25 Years | 72 (93.5%) | 5 (6.5%) |
| 26 to 34 Years | 114 (100.0%) | 0 (0.0%) |
| 35 to 44 Years | 165 (98.8%) | 2 (1.2%) |
| 45 to 54 Years | 120 (96.0%) | 5 (4.0%) |
| 55 to 64 Years | 188 (98.4%) | 3 (1.6%) |
| 65 to 74 Years | 308 (100.0%) | 0 (0.0%) |
| 75 Years and older | 212 (100.0%) | 0 (0.0%) |
| Total | 1,313 (98.8%) | 16 (1.2%) |
Health Insurance Coverage by Citizenship Status in Lexington
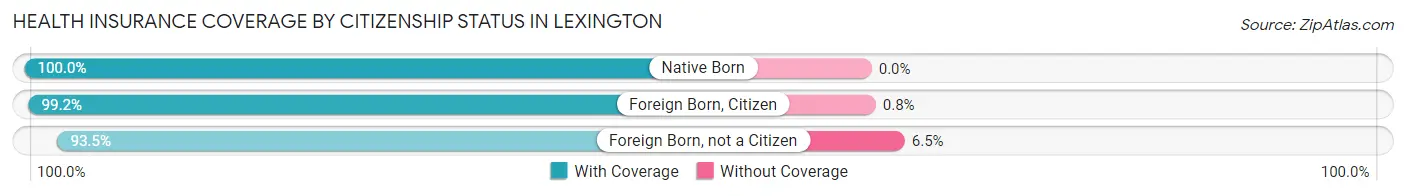
| Citizenship Status | With Coverage | Without Coverage |
| Native Born | 10 (100.0%) | 0 (0.0%) |
| Foreign Born, Citizen | 124 (99.2%) | 1 (0.8%) |
| Foreign Born, not a Citizen | 72 (93.5%) | 5 (6.5%) |
Health Insurance Coverage by Household Income in Lexington
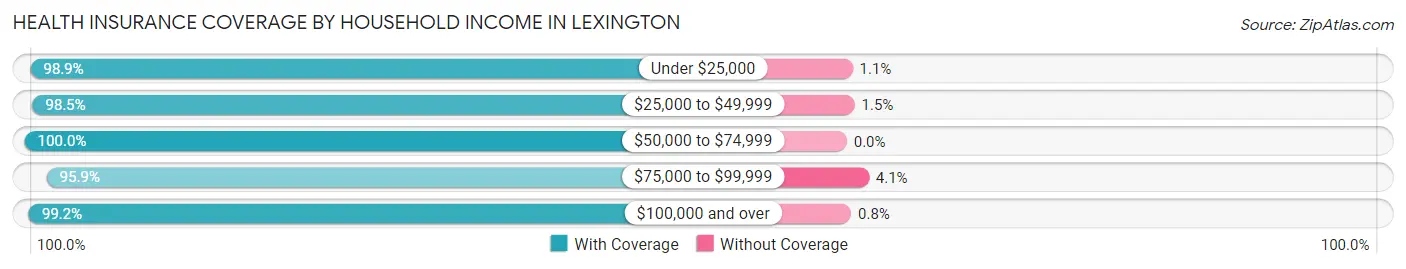
| Household Income | With Coverage | Without Coverage |
| Under $25,000 | 271 (98.9%) | 3 (1.1%) |
| $25,000 to $49,999 | 338 (98.5%) | 5 (1.5%) |
| $50,000 to $74,999 | 212 (100.0%) | 0 (0.0%) |
| $75,000 to $99,999 | 116 (95.9%) | 5 (4.1%) |
| $100,000 and over | 370 (99.2%) | 3 (0.8%) |
Public vs Private Health Insurance Coverage by Age in Lexington
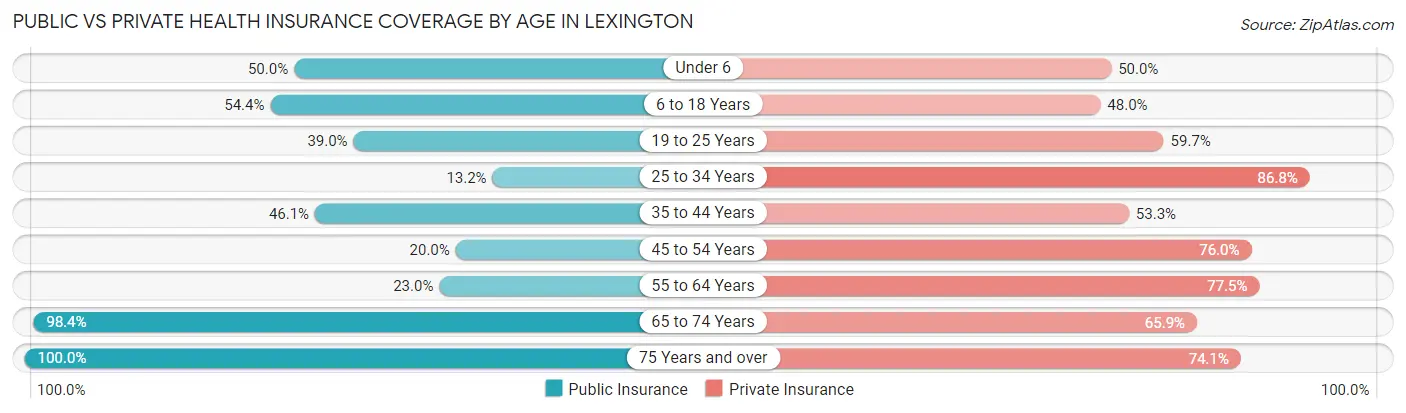
| Age Bracket | Public Insurance | Private Insurance |
| Under 6 | 5 (50.0%) | 5 (50.0%) |
| 6 to 18 Years | 68 (54.4%) | 60 (48.0%) |
| 19 to 25 Years | 30 (39.0%) | 46 (59.7%) |
| 25 to 34 Years | 15 (13.2%) | 99 (86.8%) |
| 35 to 44 Years | 77 (46.1%) | 89 (53.3%) |
| 45 to 54 Years | 25 (20.0%) | 95 (76.0%) |
| 55 to 64 Years | 44 (23.0%) | 148 (77.5%) |
| 65 to 74 Years | 303 (98.4%) | 203 (65.9%) |
| 75 Years and over | 212 (100.0%) | 157 (74.1%) |
| Total | 779 (58.6%) | 902 (67.9%) |
Disability Status by Sex by Age in Lexington
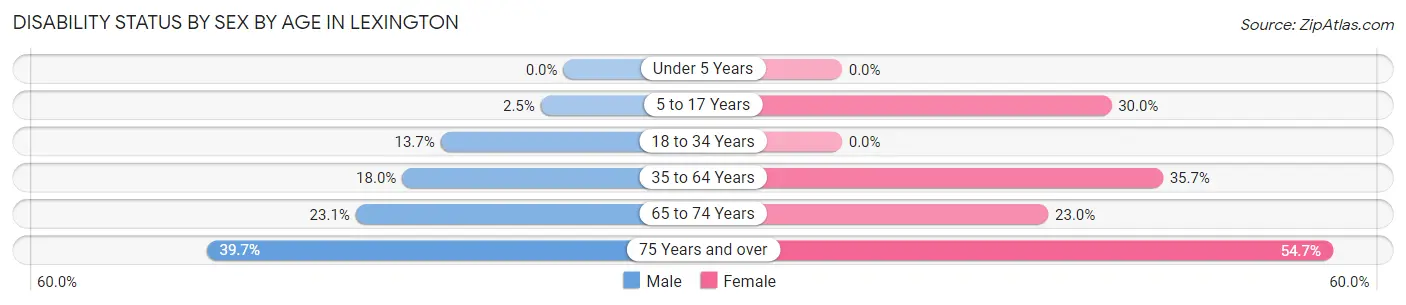
| Age Bracket | Male | Female |
| Under 5 Years | 0 (0.0%) | 0 (0.0%) |
| 5 to 17 Years | 2 (2.5%) | 15 (30.0%) |
| 18 to 34 Years | 16 (13.7%) | 0 (0.0%) |
| 35 to 64 Years | 42 (17.9%) | 89 (35.7%) |
| 65 to 74 Years | 34 (23.1%) | 37 (23.0%) |
| 75 Years and over | 29 (39.7%) | 76 (54.7%) |
Disability Class by Sex by Age in Lexington
Disability Class: Hearing Difficulty
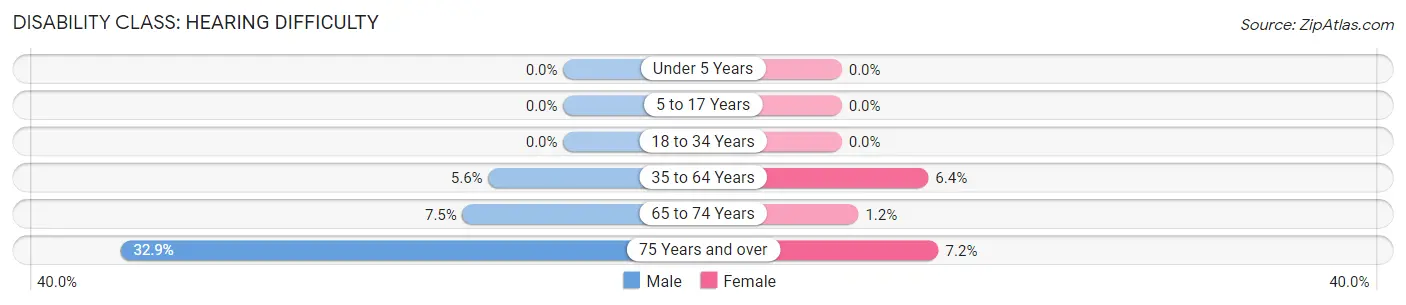
| Age Bracket | Male | Female |
| Under 5 Years | 0 (0.0%) | 0 (0.0%) |
| 5 to 17 Years | 0 (0.0%) | 0 (0.0%) |
| 18 to 34 Years | 0 (0.0%) | 0 (0.0%) |
| 35 to 64 Years | 13 (5.6%) | 16 (6.4%) |
| 65 to 74 Years | 11 (7.5%) | 2 (1.2%) |
| 75 Years and over | 24 (32.9%) | 10 (7.2%) |
Disability Class: Vision Difficulty
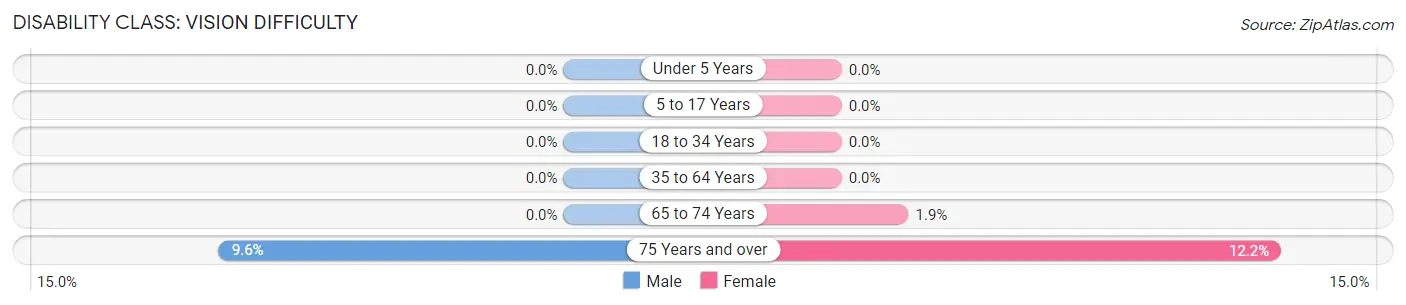
| Age Bracket | Male | Female |
| Under 5 Years | 0 (0.0%) | 0 (0.0%) |
| 5 to 17 Years | 0 (0.0%) | 0 (0.0%) |
| 18 to 34 Years | 0 (0.0%) | 0 (0.0%) |
| 35 to 64 Years | 0 (0.0%) | 0 (0.0%) |
| 65 to 74 Years | 0 (0.0%) | 3 (1.9%) |
| 75 Years and over | 7 (9.6%) | 17 (12.2%) |
Disability Class: Cognitive Difficulty
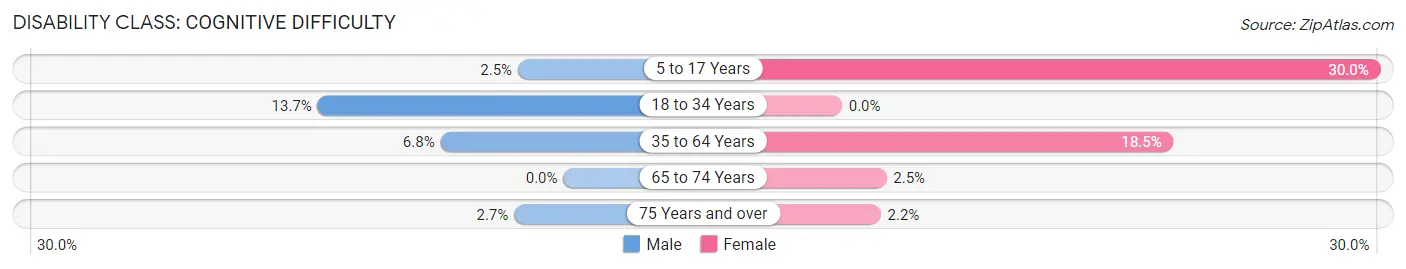
| Age Bracket | Male | Female |
| 5 to 17 Years | 2 (2.5%) | 15 (30.0%) |
| 18 to 34 Years | 16 (13.7%) | 0 (0.0%) |
| 35 to 64 Years | 16 (6.8%) | 46 (18.5%) |
| 65 to 74 Years | 0 (0.0%) | 4 (2.5%) |
| 75 Years and over | 2 (2.7%) | 3 (2.2%) |
Disability Class: Ambulatory Difficulty
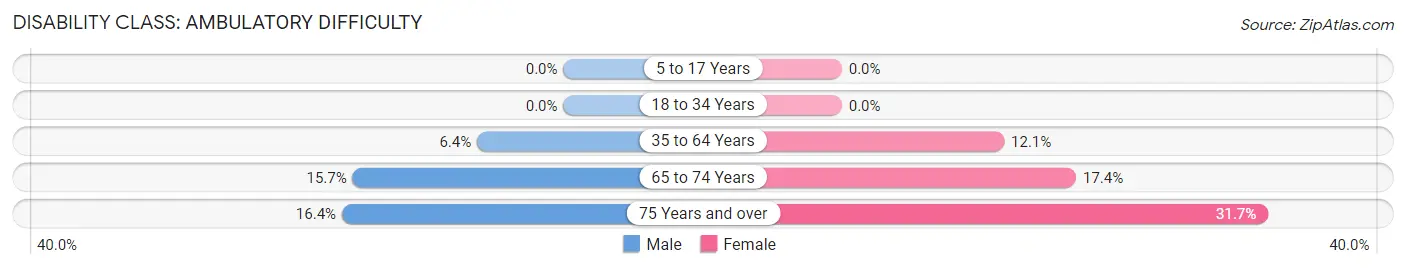
| Age Bracket | Male | Female |
| 5 to 17 Years | 0 (0.0%) | 0 (0.0%) |
| 18 to 34 Years | 0 (0.0%) | 0 (0.0%) |
| 35 to 64 Years | 15 (6.4%) | 30 (12.0%) |
| 65 to 74 Years | 23 (15.7%) | 28 (17.4%) |
| 75 Years and over | 12 (16.4%) | 44 (31.7%) |
Disability Class: Self-Care Difficulty
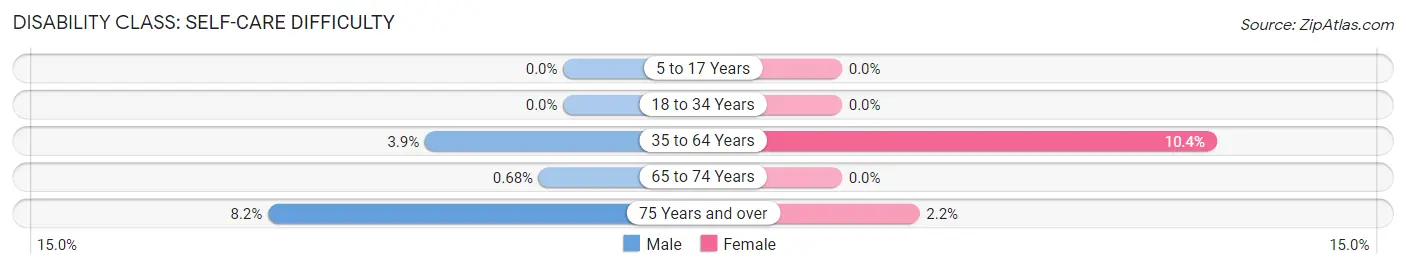
| Age Bracket | Male | Female |
| 5 to 17 Years | 0 (0.0%) | 0 (0.0%) |
| 18 to 34 Years | 0 (0.0%) | 0 (0.0%) |
| 35 to 64 Years | 9 (3.8%) | 26 (10.4%) |
| 65 to 74 Years | 1 (0.7%) | 0 (0.0%) |
| 75 Years and over | 6 (8.2%) | 3 (2.2%) |
Technology Access in Lexington
Computing Device Access in Lexington
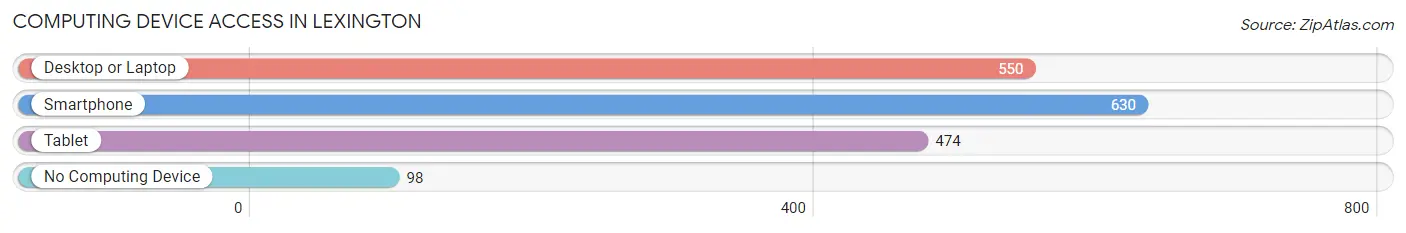
| Device Type | # Households | % Households |
| Desktop or Laptop | 550 | 68.1% |
| Smartphone | 630 | 78.1% |
| Tablet | 474 | 58.7% |
| No Computing Device | 98 | 12.1% |
| Total | 807 | 100.0% |
Internet Access in Lexington
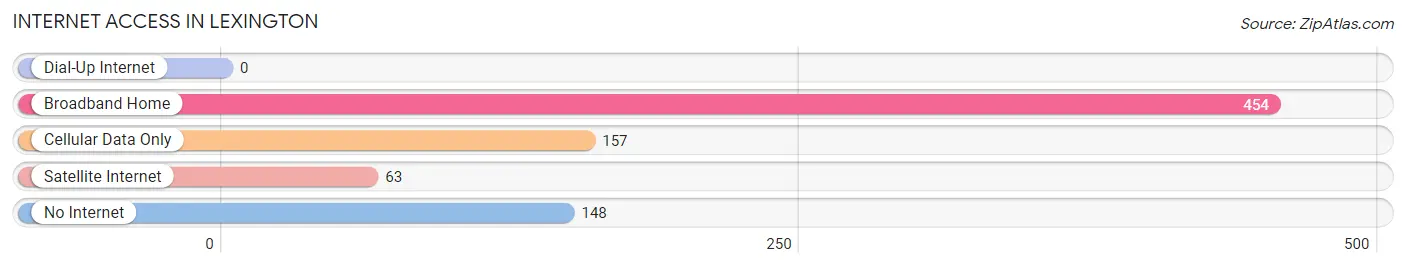
| Internet Type | # Households | % Households |
| Dial-Up Internet | 0 | 0.0% |
| Broadband Home | 454 | 56.3% |
| Cellular Data Only | 157 | 19.5% |
| Satellite Internet | 63 | 7.8% |
| No Internet | 148 | 18.3% |
| Total | 807 | 100.0% |
Lexington Summary
Lexington, Michigan is a small village located in Sanilac County in the state of Michigan. It is situated on the shores of Lake Huron, and is part of the Thumb region of Michigan. The village has a population of approximately 1,000 people, and is a popular tourist destination due to its proximity to the lake.
History
The area that is now Lexington was first settled in 1854 by a group of settlers from New York. The village was originally known as “New York Settlement”, but was later renamed Lexington in 1856. The name was chosen in honor of the Battle of Lexington, which had taken place in Massachusetts during the American Revolutionary War.
The village was incorporated in 1871, and the first mayor was elected in 1872. The village grew steadily throughout the late 19th and early 20th centuries, and by the 1950s, it had become a popular tourist destination.
Geography
Lexington is located in Sanilac County, Michigan, on the shores of Lake Huron. The village is situated on the eastern side of the lake, and is part of the Thumb region of Michigan. The village is surrounded by farmland, and is located approximately 30 miles north of Port Huron.
The village has a total area of 1.2 square miles, and is located at an elevation of 590 feet above sea level. The climate in Lexington is classified as humid continental, with warm summers and cold winters.
Economy
The economy of Lexington is largely based on tourism and agriculture. The village is a popular tourist destination due to its proximity to Lake Huron, and many visitors come to the area to enjoy the lake and the surrounding countryside.
Agriculture is also an important part of the local economy, and the village is home to several farms that produce a variety of crops, including corn, soybeans, and wheat. The village also has several small businesses, including restaurants, shops, and other services.
Demographics
As of the 2010 census, the population of Lexington was 1,000 people. The racial makeup of the village was 97.2% White, 0.7% African American, 0.3% Native American, 0.2% Asian, 0.1% Pacific Islander, and 1.5% from other races. The median household income in the village was $37,500, and the median family income was $45,000.
The village is served by the Lexington Community School District, which includes an elementary school, a middle school, and a high school. The village also has a public library, and several churches.
Conclusion
Lexington, Michigan is a small village located in Sanilac County in the state of Michigan. It is situated on the shores of Lake Huron, and is part of the Thumb region of Michigan. The village has a population of approximately 1,000 people, and is a popular tourist destination due to its proximity to the lake. The economy of Lexington is largely based on tourism and agriculture, and the village is served by the Lexington Community School District. The racial makeup of the village is predominantly White, and the median household income is $37,500.
Common Questions
What is Per Capita Income in Lexington?
Per Capita income in Lexington is $34,142.
What is the Median Family Income in Lexington?
Median Family Income in Lexington is $69,531.
What is the Median Household income in Lexington?
Median Household Income in Lexington is $41,989.
What is Income or Wage Gap in Lexington?
Income or Wage Gap in Lexington is 19.3%.
Women in Lexington earn 80.7 cents for every dollar earned by a man.
What is Inequality or Gini Index in Lexington?
Inequality or Gini Index in Lexington is 0.43.
What is the Total Population of Lexington?
Total Population of Lexington is 1,329.
What is the Total Male Population of Lexington?
Total Male Population of Lexington is 656.
What is the Total Female Population of Lexington?
Total Female Population of Lexington is 673.
What is the Ratio of Males per 100 Females in Lexington?
There are 97.47 Males per 100 Females in Lexington.
What is the Ratio of Females per 100 Males in Lexington?
There are 102.59 Females per 100 Males in Lexington.
What is the Median Population Age in Lexington?
Median Population Age in Lexington is 59.8 Years.
What is the Average Family Size in Lexington
Average Family Size in Lexington is 2.3 People.
What is the Average Household Size in Lexington
Average Household Size in Lexington is 1.6 People.
How Large is the Labor Force in Lexington?
There are 594 People in the Labor Forcein in Lexington.
What is the Percentage of People in the Labor Force in Lexington?
48.8% of People are in the Labor Force in Lexington.
What is the Unemployment Rate in Lexington?
Unemployment Rate in Lexington is 1.9%.