Ithaca, MI Map & Demographics
Ithaca Map
Ithaca Overview
$30,666
PER CAPITA INCOME
$74,861
AVG FAMILY INCOME
$60,389
AVG HOUSEHOLD INCOME
20.4%
WAGE / INCOME GAP [ % ]
79.6¢/ $1
WAGE / INCOME GAP [ $ ]
0.41
INEQUALITY / GINI INDEX
2,840
TOTAL POPULATION
1,500
MALE POPULATION
1,340
FEMALE POPULATION
111.94
MALES / 100 FEMALES
89.33
FEMALES / 100 MALES
42.2
MEDIAN AGE
2.8
AVG FAMILY SIZE
2.3
AVG HOUSEHOLD SIZE
1,597
LABOR FORCE [ PEOPLE ]
66.4%
PERCENT IN LABOR FORCE
0.8%
UNEMPLOYMENT RATE
Ithaca Zip Codes
Ithaca Area Codes
Income in Ithaca
Income Overview in Ithaca
Per Capita Income in Ithaca is $30,666, while median incomes of families and households are $74,861 and $60,389 respectively.
| Characteristic | Number | Measure |
| Per Capita Income | 2,840 | $30,666 |
| Median Family Income | 723 | $74,861 |
| Mean Family Income | 723 | $87,637 |
| Median Household Income | 1,183 | $60,389 |
| Mean Household Income | 1,183 | $70,588 |
| Income Deficit | 723 | $0 |
| Wage / Income Gap (%) | 2,840 | 20.40% |
| Wage / Income Gap ($) | 2,840 | 79.60¢ per $1 |
| Gini / Inequality Index | 2,840 | 0.41 |
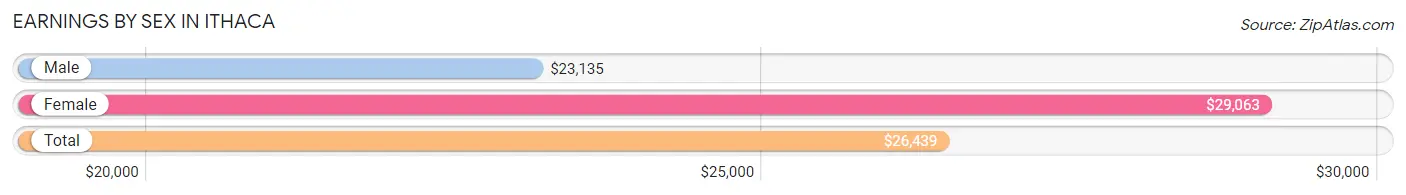
Earnings by Sex in Ithaca
Average Earnings in Ithaca are $26,439, $23,135 for men and $29,063 for women, a difference of 20.4%.
| Sex | Number | Average Earnings |
| Male | 902 (53.1%) | $23,135 |
| Female | 796 (46.9%) | $29,063 |
| Total | 1,698 (100.0%) | $26,439 |
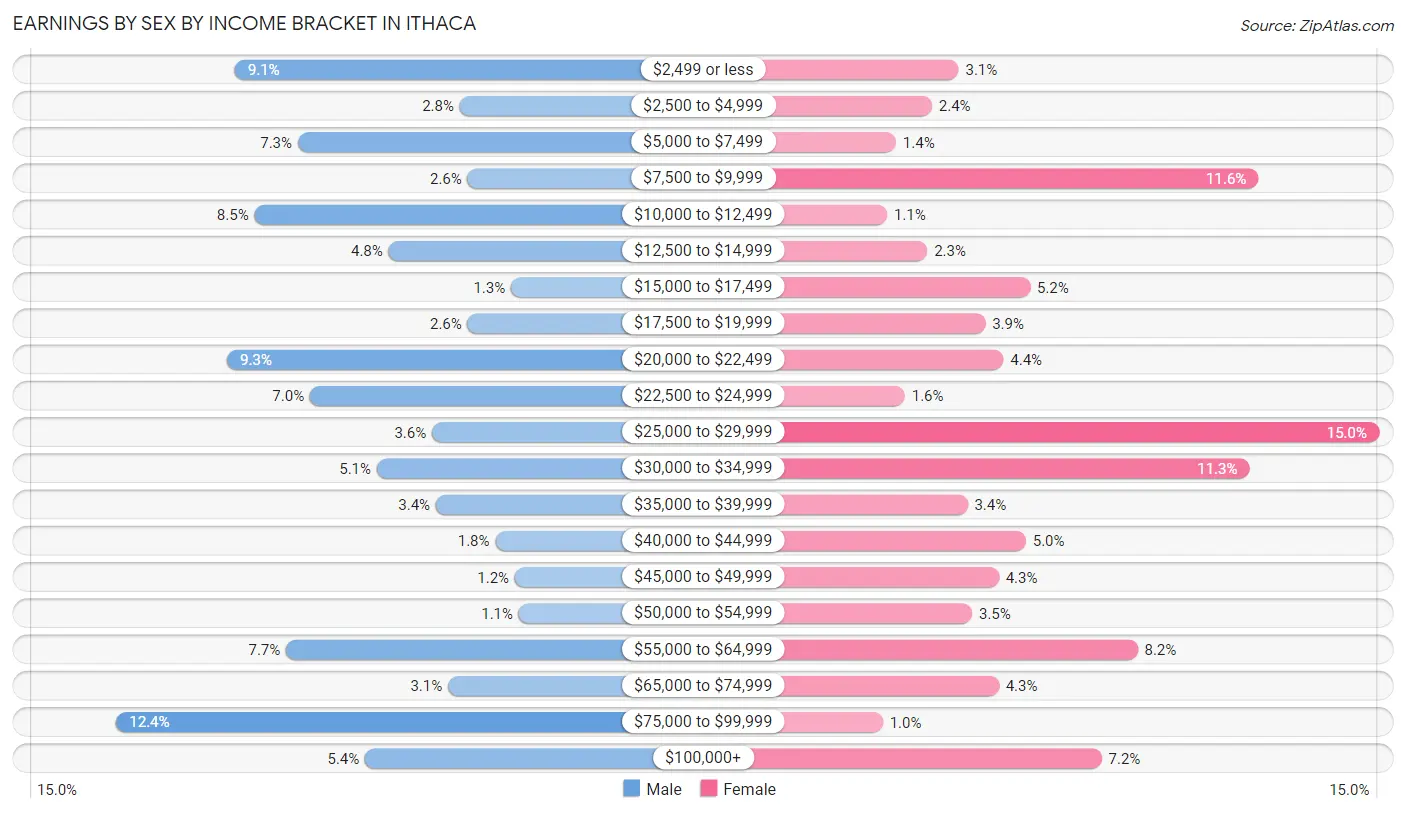
Earnings by Sex by Income Bracket in Ithaca
The most common earnings brackets in Ithaca are $75,000 to $99,999 for men (112 | 12.4%) and $25,000 to $29,999 for women (119 | 14.9%).
| Income | Male | Female |
| $2,499 or less | 82 (9.1%) | 25 (3.1%) |
| $2,500 to $4,999 | 25 (2.8%) | 19 (2.4%) |
| $5,000 to $7,499 | 66 (7.3%) | 11 (1.4%) |
| $7,500 to $9,999 | 23 (2.5%) | 92 (11.6%) |
| $10,000 to $12,499 | 77 (8.5%) | 9 (1.1%) |
| $12,500 to $14,999 | 43 (4.8%) | 18 (2.3%) |
| $15,000 to $17,499 | 12 (1.3%) | 41 (5.1%) |
| $17,500 to $19,999 | 23 (2.5%) | 31 (3.9%) |
| $20,000 to $22,499 | 84 (9.3%) | 35 (4.4%) |
| $22,500 to $24,999 | 63 (7.0%) | 13 (1.6%) |
| $25,000 to $29,999 | 32 (3.5%) | 119 (14.9%) |
| $30,000 to $34,999 | 46 (5.1%) | 90 (11.3%) |
| $35,000 to $39,999 | 31 (3.4%) | 27 (3.4%) |
| $40,000 to $44,999 | 16 (1.8%) | 40 (5.0%) |
| $45,000 to $49,999 | 11 (1.2%) | 34 (4.3%) |
| $50,000 to $54,999 | 10 (1.1%) | 28 (3.5%) |
| $55,000 to $64,999 | 69 (7.6%) | 65 (8.2%) |
| $65,000 to $74,999 | 28 (3.1%) | 34 (4.3%) |
| $75,000 to $99,999 | 112 (12.4%) | 8 (1.0%) |
| $100,000+ | 49 (5.4%) | 57 (7.2%) |
| Total | 902 (100.0%) | 796 (100.0%) |
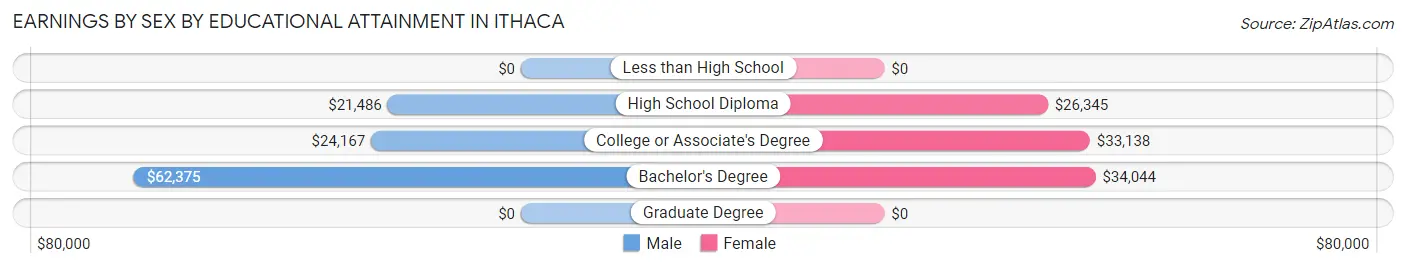
Earnings by Sex by Educational Attainment in Ithaca
Average earnings in Ithaca are $25,250 for men and $33,425 for women, a difference of 24.5%. Men with an educational attainment of bachelor's degree enjoy the highest average annual earnings of $62,375, while those with high school diploma education earn the least with $21,486. Women with an educational attainment of bachelor's degree earn the most with the average annual earnings of $34,044, while those with high school diploma education have the smallest earnings of $26,345.
| Educational Attainment | Male Income | Female Income |
| Less than High School | - | - |
| High School Diploma | $21,486 | $26,345 |
| College or Associate's Degree | $24,167 | $33,138 |
| Bachelor's Degree | $62,375 | $34,044 |
| Graduate Degree | - | - |
| Total | $25,250 | $33,425 |
Family Income in Ithaca
Family Income Brackets in Ithaca
According to the Ithaca family income data, there are 194 families falling into the $50,000 to $74,999 income range, which is the most common income bracket and makes up 26.8% of all families.
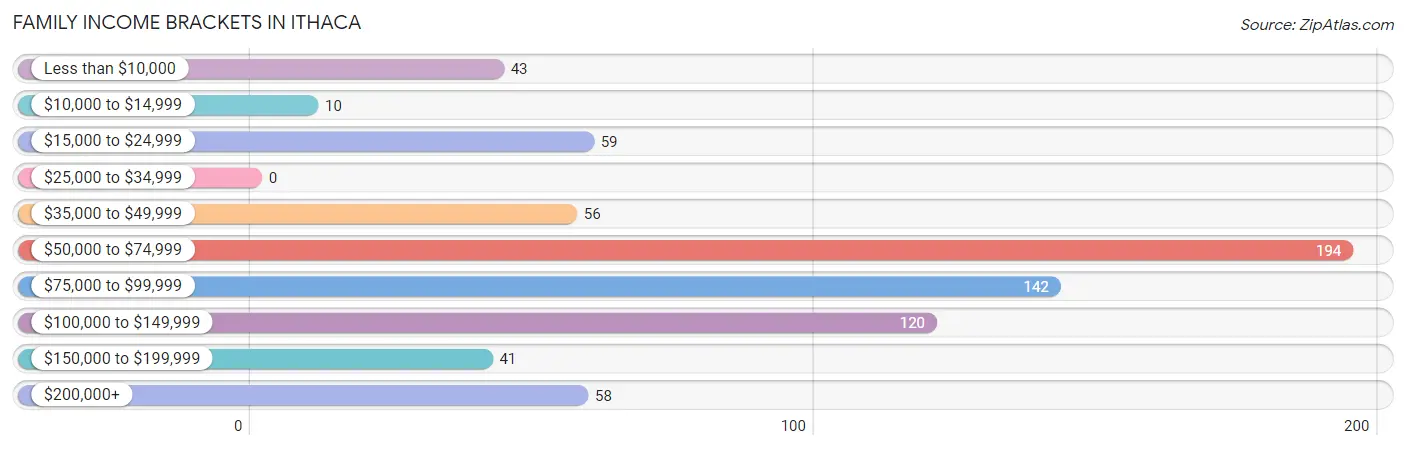
| Income Bracket | # Families | % Families |
| Less than $10,000 | 43 | 5.9% |
| $10,000 to $14,999 | 10 | 1.4% |
| $15,000 to $24,999 | 59 | 8.2% |
| $25,000 to $34,999 | 0 | 0.0% |
| $35,000 to $49,999 | 56 | 7.7% |
| $50,000 to $74,999 | 194 | 26.8% |
| $75,000 to $99,999 | 142 | 19.6% |
| $100,000 to $149,999 | 120 | 16.6% |
| $150,000 to $199,999 | 41 | 5.7% |
| $200,000+ | 58 | 8.0% |
Family Income by Famaliy Size in Ithaca
3-person families (202 | 27.9%) account for the highest median family income in Ithaca with $113,304 per family, while 3-person families (202 | 27.9%) have the highest median income of $37,768 per family member.
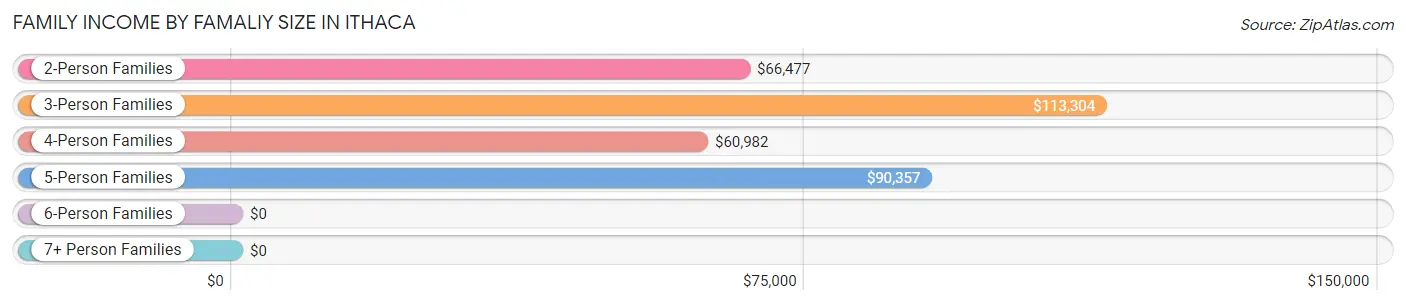
| Income Bracket | # Families | Median Income |
| 2-Person Families | 332 (45.9%) | $66,477 |
| 3-Person Families | 202 (27.9%) | $113,304 |
| 4-Person Families | 131 (18.1%) | $60,982 |
| 5-Person Families | 44 (6.1%) | $90,357 |
| 6-Person Families | 14 (1.9%) | $0 |
| 7+ Person Families | 0 (0.0%) | $0 |
| Total | 723 (100.0%) | $74,861 |
Family Income by Number of Earners in Ithaca
The median family income in Ithaca is $74,861, with families comprising 3+ earners (102) having the highest median family income of $184,583, while families with no earners (95) have the lowest median family income of $52,566, accounting for 14.1% and 13.1% of families, respectively.
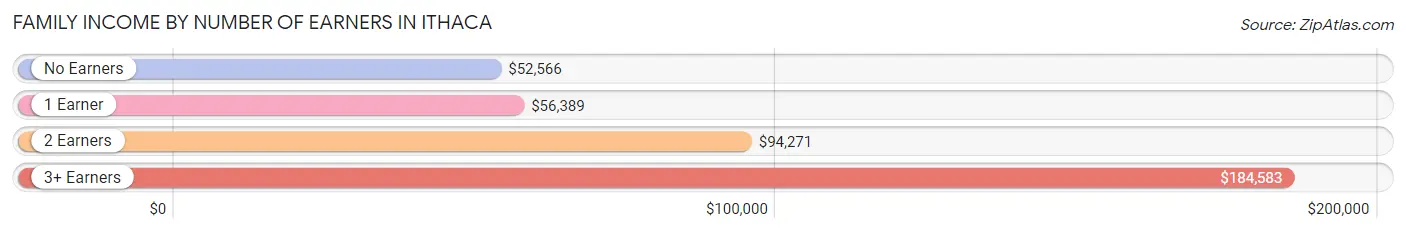
| Number of Earners | # Families | Median Income |
| No Earners | 95 (13.1%) | $52,566 |
| 1 Earner | 234 (32.4%) | $56,389 |
| 2 Earners | 292 (40.4%) | $94,271 |
| 3+ Earners | 102 (14.1%) | $184,583 |
| Total | 723 (100.0%) | $74,861 |
Household Income in Ithaca
Household Income Brackets in Ithaca
With 282 households falling in the category, the $50,000 to $74,999 income range is the most frequent in Ithaca, accounting for 23.8% of all households. In contrast, only 49 households (4.1%) fall into the $10,000 to $14,999 income bracket, making it the least populous group.
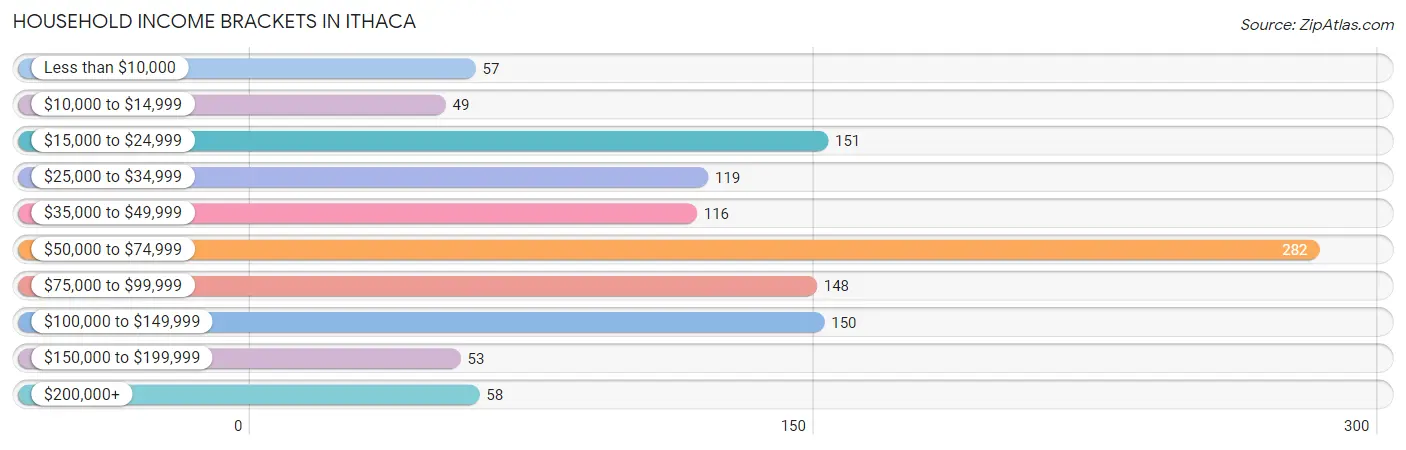
| Income Bracket | # Households | % Households |
| Less than $10,000 | 57 | 4.8% |
| $10,000 to $14,999 | 49 | 4.1% |
| $15,000 to $24,999 | 151 | 12.8% |
| $25,000 to $34,999 | 119 | 10.1% |
| $35,000 to $49,999 | 116 | 9.8% |
| $50,000 to $74,999 | 282 | 23.8% |
| $75,000 to $99,999 | 148 | 12.5% |
| $100,000 to $149,999 | 150 | 12.7% |
| $150,000 to $199,999 | 53 | 4.5% |
| $200,000+ | 58 | 4.9% |
Household Income by Householder Age in Ithaca
The median household income in Ithaca is $60,389, with the highest median household income of $64,904 found in the 25 to 44 years age bracket for the primary householder. A total of 325 households (27.5%) fall into this category. Meanwhile, the 15 to 24 years age bracket for the primary householder has the lowest median household income of $0, with 56 households (4.7%) in this group.

| Income Bracket | # Households | Median Income |
| 15 to 24 Years | 56 (4.7%) | $0 |
| 25 to 44 Years | 325 (27.5%) | $64,904 |
| 45 to 64 Years | 483 (40.8%) | $64,861 |
| 65+ Years | 319 (27.0%) | $31,932 |
| Total | 1,183 (100.0%) | $60,389 |
Poverty in Ithaca
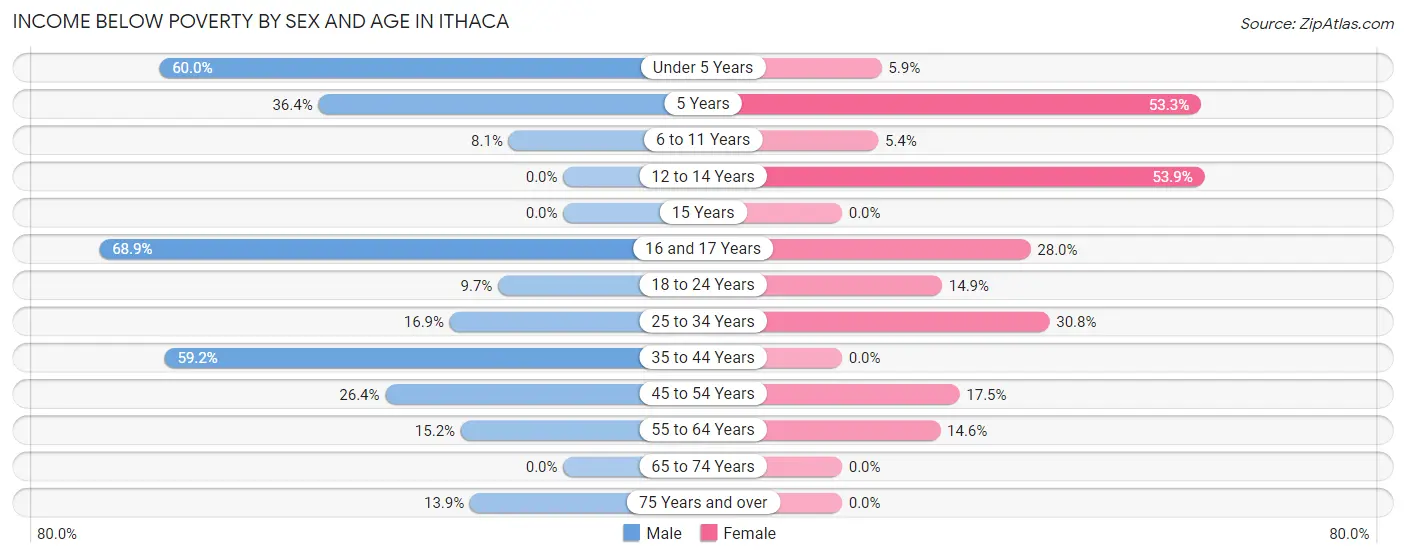
Income Below Poverty by Sex and Age in Ithaca
With 25.8% poverty level for males and 14.0% for females among the residents of Ithaca, 16 and 17 year old males and 12 to 14 year old females are the most vulnerable to poverty, with 51 males (68.9%) and 7 females (53.8%) in their respective age groups living below the poverty level.
| Age Bracket | Male | Female |
| Under 5 Years | 87 (60.0%) | 3 (5.9%) |
| 5 Years | 4 (36.4%) | 16 (53.3%) |
| 6 to 11 Years | 6 (8.1%) | 5 (5.4%) |
| 12 to 14 Years | 0 (0.0%) | 7 (53.8%) |
| 15 Years | 0 (0.0%) | 0 (0.0%) |
| 16 and 17 Years | 51 (68.9%) | 7 (28.0%) |
| 18 to 24 Years | 15 (9.7%) | 26 (14.9%) |
| 25 to 34 Years | 31 (16.9%) | 57 (30.8%) |
| 35 to 44 Years | 77 (59.2%) | 0 (0.0%) |
| 45 to 54 Years | 60 (26.4%) | 33 (17.5%) |
| 55 to 64 Years | 40 (15.2%) | 33 (14.6%) |
| 65 to 74 Years | 0 (0.0%) | 0 (0.0%) |
| 75 Years and over | 9 (13.9%) | 0 (0.0%) |
| Total | 380 (25.8%) | 187 (14.0%) |
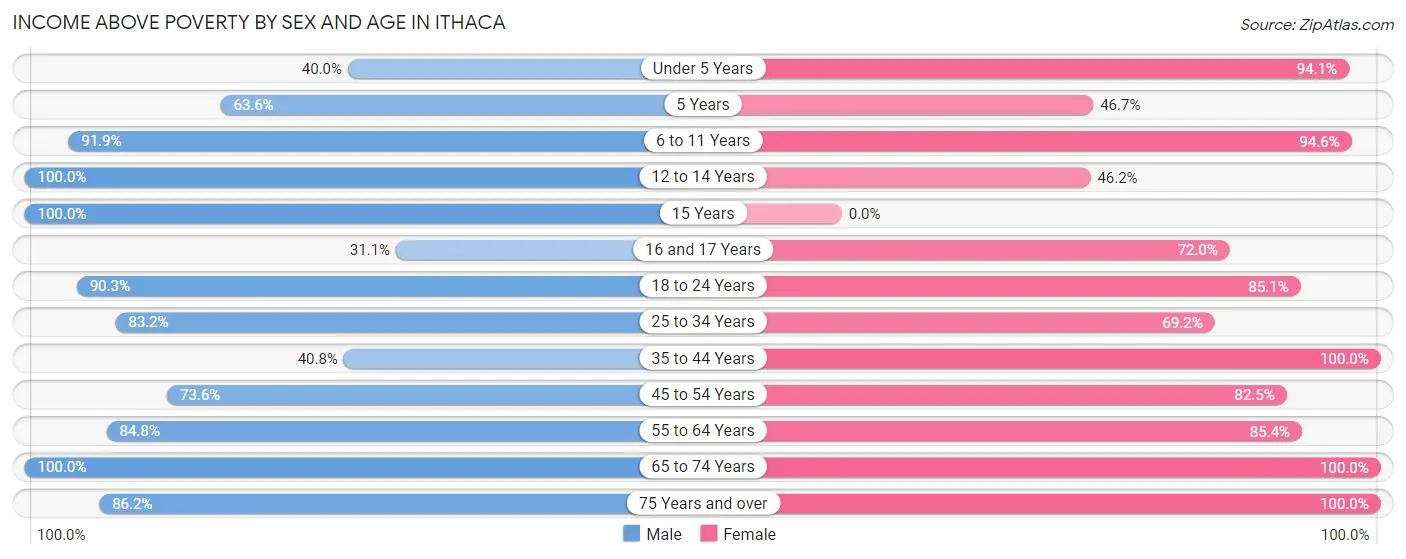
Income Above Poverty by Sex and Age in Ithaca
According to the poverty statistics in Ithaca, males aged 12 to 14 years and females aged 35 to 44 years are the age groups that are most secure financially, with 100.0% of males and 100.0% of females in these age groups living above the poverty line.
| Age Bracket | Male | Female |
| Under 5 Years | 58 (40.0%) | 48 (94.1%) |
| 5 Years | 7 (63.6%) | 14 (46.7%) |
| 6 to 11 Years | 68 (91.9%) | 88 (94.6%) |
| 12 to 14 Years | 8 (100.0%) | 6 (46.2%) |
| 15 Years | 10 (100.0%) | 0 (0.0%) |
| 16 and 17 Years | 23 (31.1%) | 18 (72.0%) |
| 18 to 24 Years | 140 (90.3%) | 149 (85.1%) |
| 25 to 34 Years | 153 (83.2%) | 128 (69.2%) |
| 35 to 44 Years | 53 (40.8%) | 138 (100.0%) |
| 45 to 54 Years | 167 (73.6%) | 156 (82.5%) |
| 55 to 64 Years | 223 (84.8%) | 193 (85.4%) |
| 65 to 74 Years | 125 (100.0%) | 79 (100.0%) |
| 75 Years and over | 56 (86.2%) | 131 (100.0%) |
| Total | 1,091 (74.2%) | 1,148 (86.0%) |
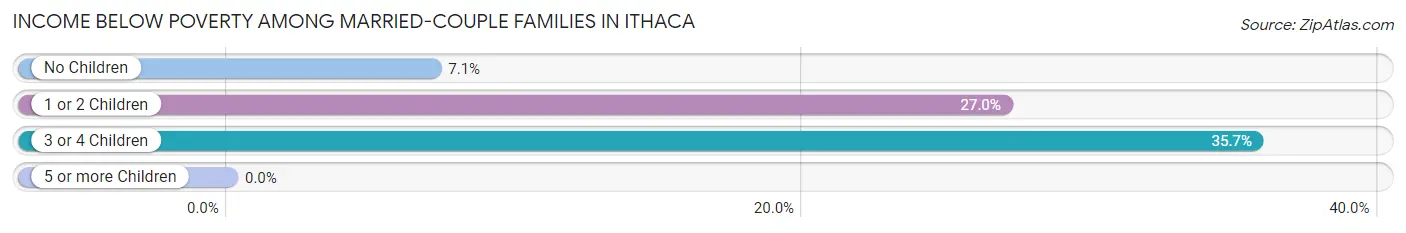
Income Below Poverty Among Married-Couple Families in Ithaca
The poverty statistics for married-couple families in Ithaca show that 14.5% or 77 of the total 531 families live below the poverty line. Families with 3 or 4 children have the highest poverty rate of 35.7%, comprising of 5 families. On the other hand, families with no children have the lowest poverty rate of 7.1%, which includes 24 families.
| Children | Above Poverty | Below Poverty |
| No Children | 315 (92.9%) | 24 (7.1%) |
| 1 or 2 Children | 130 (73.0%) | 48 (27.0%) |
| 3 or 4 Children | 9 (64.3%) | 5 (35.7%) |
| 5 or more Children | 0 (0.0%) | 0 (0.0%) |
| Total | 454 (85.5%) | 77 (14.5%) |
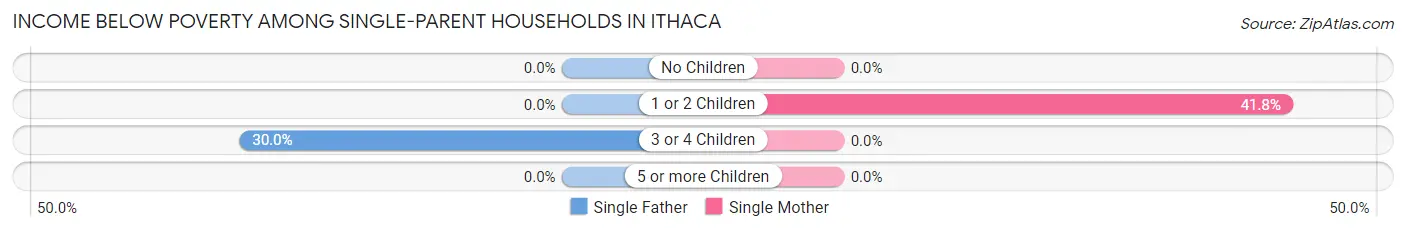
Income Below Poverty Among Single-Parent Households in Ithaca
According to the poverty data in Ithaca, 9.0% or 9 single-father households and 25.0% or 23 single-mother households are living below the poverty line. Among single-father households, those with 3 or 4 children have the highest poverty rate, with 9 households (30.0%) experiencing poverty. Likewise, among single-mother households, those with 1 or 2 children have the highest poverty rate, with 23 households (41.8%) falling below the poverty line.
| Children | Single Father | Single Mother |
| No Children | 0 (0.0%) | 0 (0.0%) |
| 1 or 2 Children | 0 (0.0%) | 23 (41.8%) |
| 3 or 4 Children | 9 (30.0%) | 0 (0.0%) |
| 5 or more Children | 0 (0.0%) | 0 (0.0%) |
| Total | 9 (9.0%) | 23 (25.0%) |
Income Below Poverty Among Married-Couple vs Single-Parent Households in Ithaca
The poverty data for Ithaca shows that 77 of the married-couple family households (14.5%) and 32 of the single-parent households (16.7%) are living below the poverty level. Within the married-couple family households, those with 3 or 4 children have the highest poverty rate, with 5 households (35.7%) falling below the poverty line. Among the single-parent households, those with 1 or 2 children have the highest poverty rate, with 23 household (22.8%) living below poverty.
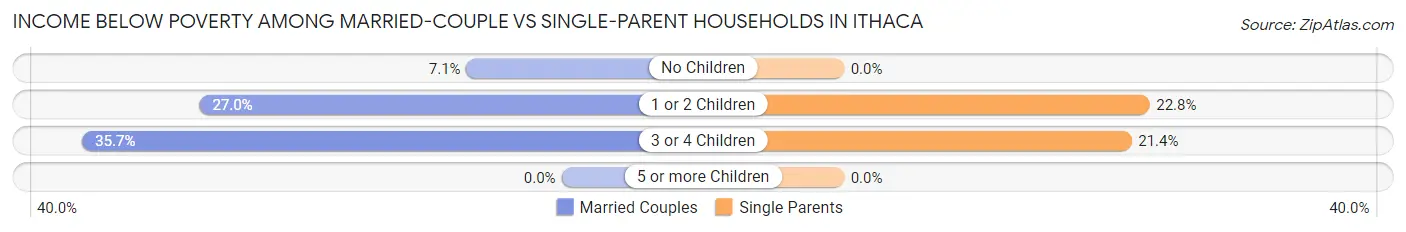
| Children | Married-Couple Families | Single-Parent Households |
| No Children | 24 (7.1%) | 0 (0.0%) |
| 1 or 2 Children | 48 (27.0%) | 23 (22.8%) |
| 3 or 4 Children | 5 (35.7%) | 9 (21.4%) |
| 5 or more Children | 0 (0.0%) | 0 (0.0%) |
| Total | 77 (14.5%) | 32 (16.7%) |
Race in Ithaca
The most populous races in Ithaca are White / Caucasian (2,638 | 92.9%), Hispanic or Latino (223 | 7.9%), and Two or more Races (88 | 3.1%).
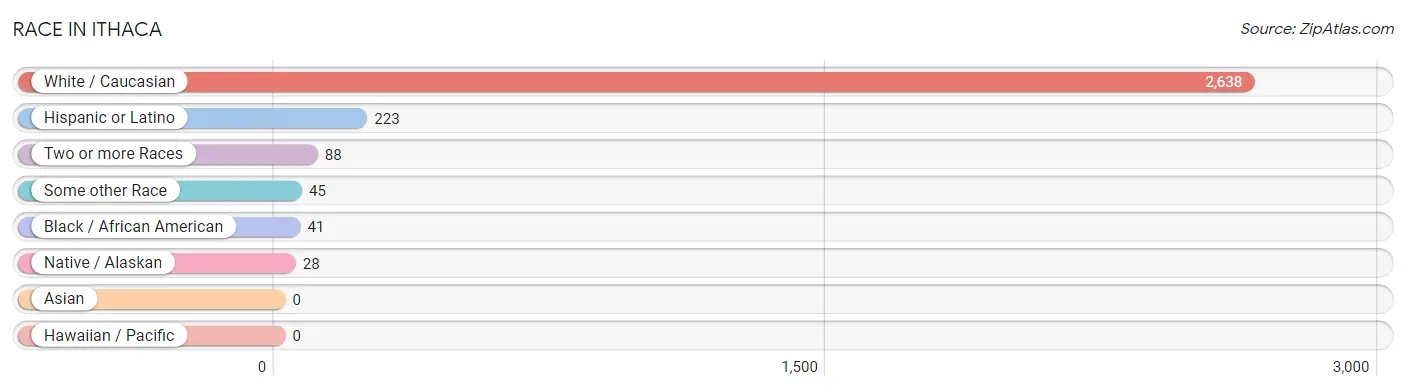
| Race | # Population | % Population |
| Asian | 0 | 0.0% |
| Black / African American | 41 | 1.4% |
| Hawaiian / Pacific | 0 | 0.0% |
| Hispanic or Latino | 223 | 7.9% |
| Native / Alaskan | 28 | 1.0% |
| White / Caucasian | 2,638 | 92.9% |
| Two or more Races | 88 | 3.1% |
| Some other Race | 45 | 1.6% |
| Total | 2,840 | 100.0% |
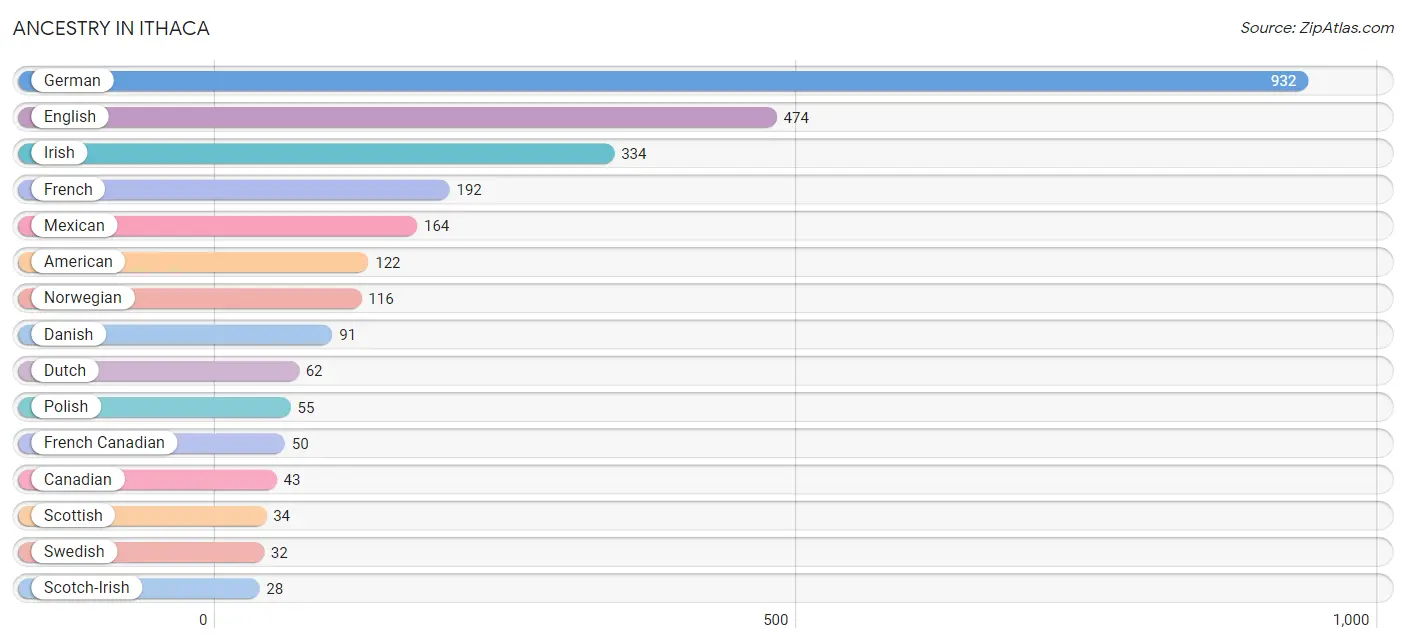
Ancestry in Ithaca
The most populous ancestries reported in Ithaca are German (932 | 32.8%), English (474 | 16.7%), Irish (334 | 11.8%), French (192 | 6.8%), and Mexican (164 | 5.8%), together accounting for 73.8% of all Ithaca residents.
| Ancestry | # Population | % Population |
| American | 122 | 4.3% |
| Arab | 7 | 0.3% |
| Austrian | 6 | 0.2% |
| Belgian | 27 | 0.9% |
| Bhutanese | 10 | 0.4% |
| Canadian | 43 | 1.5% |
| Chippewa | 4 | 0.1% |
| Colombian | 26 | 0.9% |
| Czech | 19 | 0.7% |
| Danish | 91 | 3.2% |
| Dutch | 62 | 2.2% |
| Eastern European | 11 | 0.4% |
| English | 474 | 16.7% |
| European | 16 | 0.6% |
| French | 192 | 6.8% |
| French American Indian | 11 | 0.4% |
| French Canadian | 50 | 1.8% |
| German | 932 | 32.8% |
| Hungarian | 5 | 0.2% |
| Irish | 334 | 11.8% |
| Italian | 12 | 0.4% |
| Lebanese | 7 | 0.3% |
| Mexican | 164 | 5.8% |
| Norwegian | 116 | 4.1% |
| Polish | 55 | 1.9% |
| Puerto Rican | 8 | 0.3% |
| Scotch-Irish | 28 | 1.0% |
| Scottish | 34 | 1.2% |
| Slovak | 28 | 1.0% |
| South American | 26 | 0.9% |
| Spaniard | 25 | 0.9% |
| Swedish | 32 | 1.1% |
| Welsh | 10 | 0.4% | View All 33 Rows |
Immigrants in Ithaca
The most numerous immigrant groups reported in Ithaca came from Canada (33 | 1.2%), Australia (2 | 0.1%), and Oceania (2 | 0.1%), together accounting for 1.3% of all Ithaca residents.
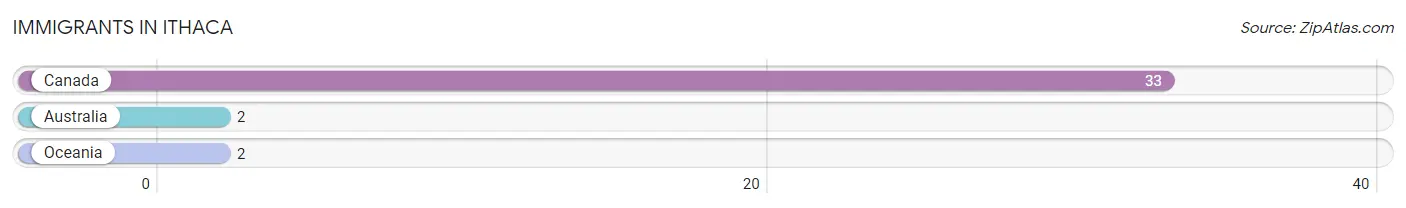
| Immigration Origin | # Population | % Population |
| Australia | 2 | 0.1% |
| Canada | 33 | 1.2% |
| Oceania | 2 | 0.1% | View All 3 Rows |
Sex and Age in Ithaca
Sex and Age in Ithaca
The most populous age groups in Ithaca are 20 to 24 Years (151 | 10.1%) for men and 20 to 24 Years (164 | 12.2%) for women.
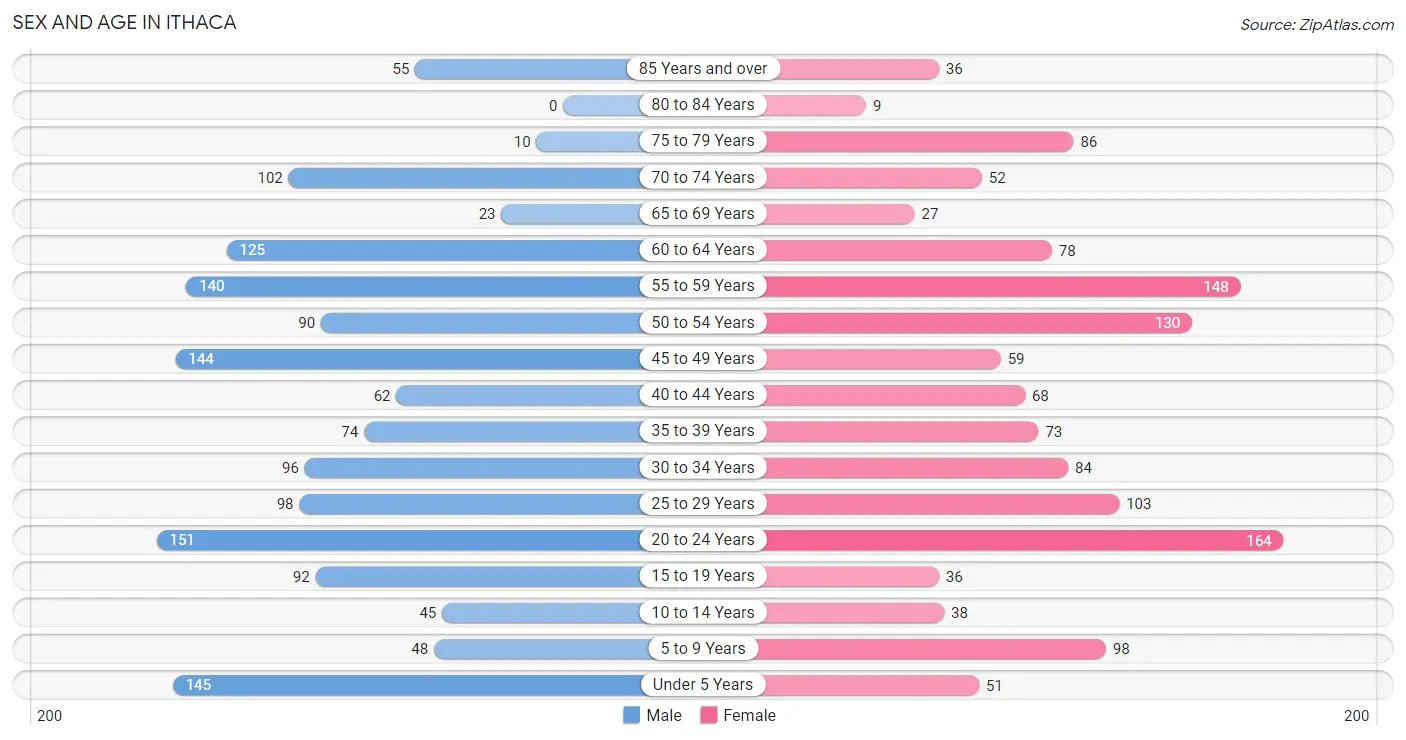
| Age Bracket | Male | Female |
| Under 5 Years | 145 (9.7%) | 51 (3.8%) |
| 5 to 9 Years | 48 (3.2%) | 98 (7.3%) |
| 10 to 14 Years | 45 (3.0%) | 38 (2.8%) |
| 15 to 19 Years | 92 (6.1%) | 36 (2.7%) |
| 20 to 24 Years | 151 (10.1%) | 164 (12.2%) |
| 25 to 29 Years | 98 (6.5%) | 103 (7.7%) |
| 30 to 34 Years | 96 (6.4%) | 84 (6.3%) |
| 35 to 39 Years | 74 (4.9%) | 73 (5.4%) |
| 40 to 44 Years | 62 (4.1%) | 68 (5.1%) |
| 45 to 49 Years | 144 (9.6%) | 59 (4.4%) |
| 50 to 54 Years | 90 (6.0%) | 130 (9.7%) |
| 55 to 59 Years | 140 (9.3%) | 148 (11.0%) |
| 60 to 64 Years | 125 (8.3%) | 78 (5.8%) |
| 65 to 69 Years | 23 (1.5%) | 27 (2.0%) |
| 70 to 74 Years | 102 (6.8%) | 52 (3.9%) |
| 75 to 79 Years | 10 (0.7%) | 86 (6.4%) |
| 80 to 84 Years | 0 (0.0%) | 9 (0.7%) |
| 85 Years and over | 55 (3.7%) | 36 (2.7%) |
| Total | 1,500 (100.0%) | 1,340 (100.0%) |
Families and Households in Ithaca
Median Family Size in Ithaca
The median family size in Ithaca is 2.84 persons per family, with single male/father families (100 | 13.8%) accounting for the largest median family size of 3.12 persons per family. On the other hand, single female/mother families (92 | 12.7%) represent the smallest median family size with 2.24 persons per family.
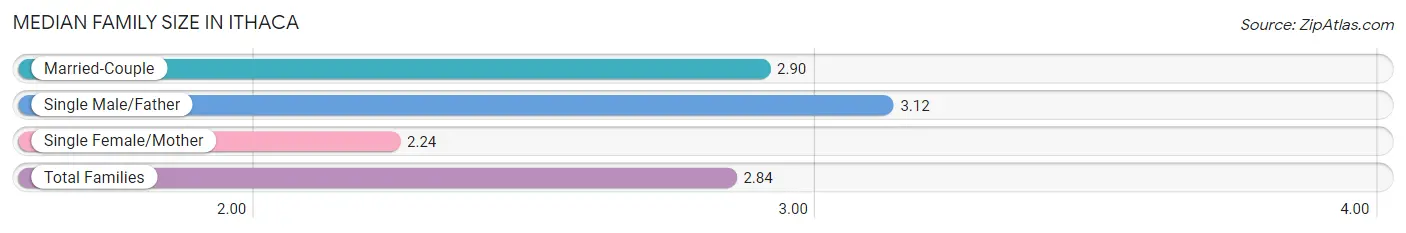
| Family Type | # Families | Family Size |
| Married-Couple | 531 (73.4%) | 2.90 |
| Single Male/Father | 100 (13.8%) | 3.12 |
| Single Female/Mother | 92 (12.7%) | 2.24 |
| Total Families | 723 (100.0%) | 2.84 |
Median Household Size in Ithaca
The median household size in Ithaca is 2.32 persons per household, with single male/father households (100 | 8.5%) accounting for the largest median household size of 3.48 persons per household. non-family households (460 | 38.9%) represent the smallest median household size with 1.35 persons per household.
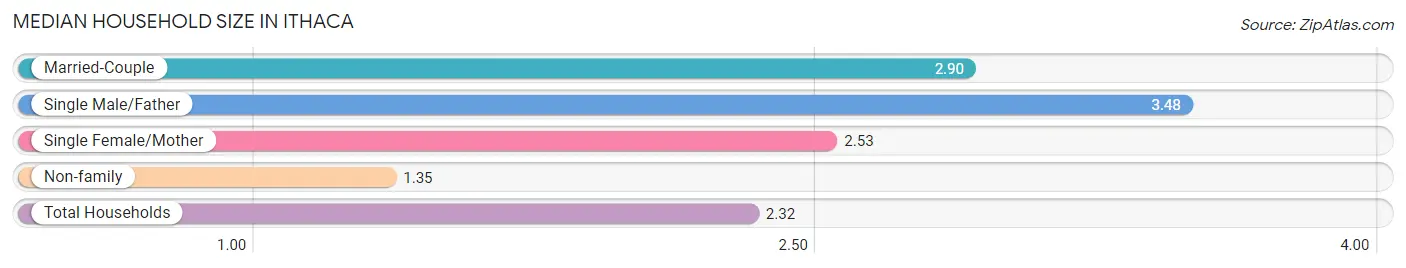
| Household Type | # Households | Household Size |
| Married-Couple | 531 (44.9%) | 2.90 |
| Single Male/Father | 100 (8.5%) | 3.48 |
| Single Female/Mother | 92 (7.8%) | 2.53 |
| Non-family | 460 (38.9%) | 1.35 |
| Total Households | 1,183 (100.0%) | 2.32 |
Household Size by Marriage Status in Ithaca
Out of a total of 1,183 households in Ithaca, 723 (61.1%) are family households, while 460 (38.9%) are nonfamily households. The most numerous type of family households are 2-person households, comprising 282, and the most common type of nonfamily households are 1-person households, comprising 373.
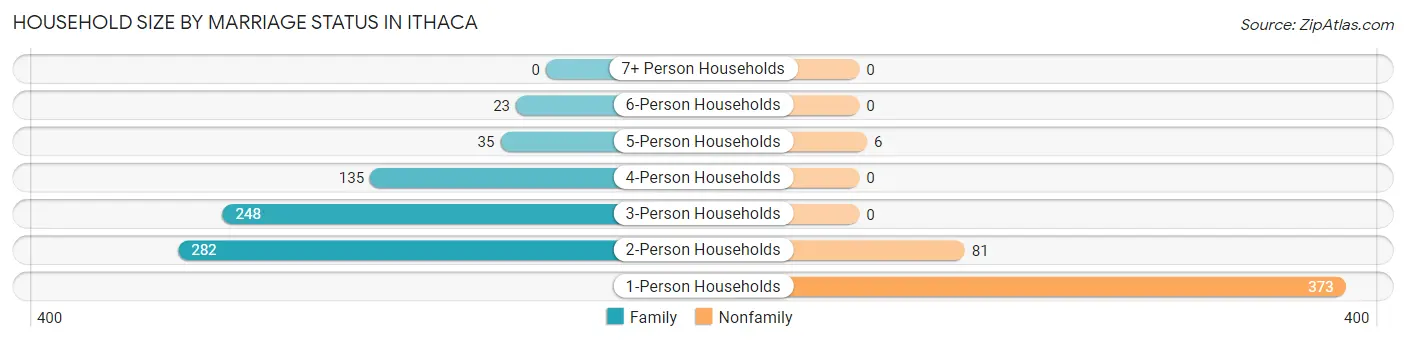
| Household Size | Family Households | Nonfamily Households |
| 1-Person Households | - | 373 (31.5%) |
| 2-Person Households | 282 (23.8%) | 81 (6.9%) |
| 3-Person Households | 248 (21.0%) | 0 (0.0%) |
| 4-Person Households | 135 (11.4%) | 0 (0.0%) |
| 5-Person Households | 35 (3.0%) | 6 (0.5%) |
| 6-Person Households | 23 (1.9%) | 0 (0.0%) |
| 7+ Person Households | 0 (0.0%) | 0 (0.0%) |
| Total | 723 (61.1%) | 460 (38.9%) |
Female Fertility in Ithaca
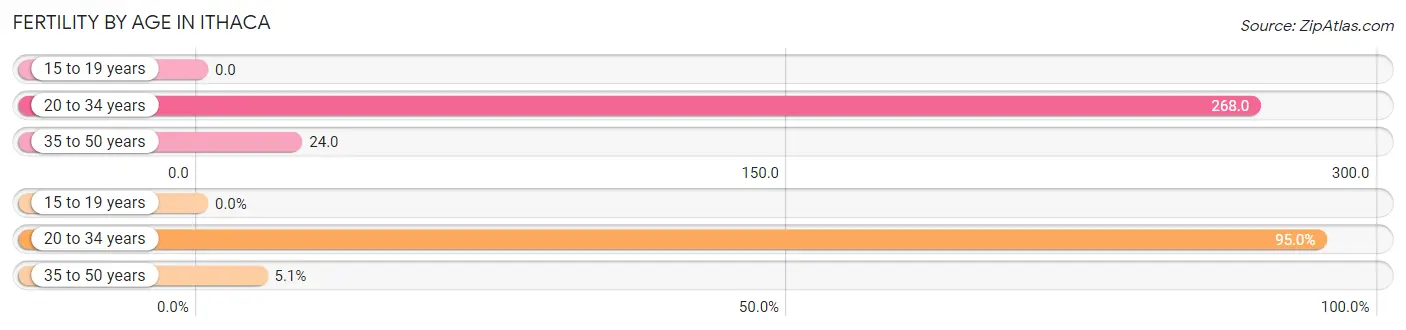
Fertility by Age in Ithaca
Average fertility rate in Ithaca is 167.0 births per 1,000 women. Women in the age bracket of 20 to 34 years have the highest fertility rate with 268.0 births per 1,000 women. Women in the age bracket of 20 to 34 years acount for 95.0% of all women with births.
| Age Bracket | Women with Births | Births / 1,000 Women |
| 15 to 19 years | 0 (0.0%) | 0.0 |
| 20 to 34 years | 94 (95.0%) | 268.0 |
| 35 to 50 years | 5 (5.1%) | 24.0 |
| Total | 99 (100.0%) | 167.0 |
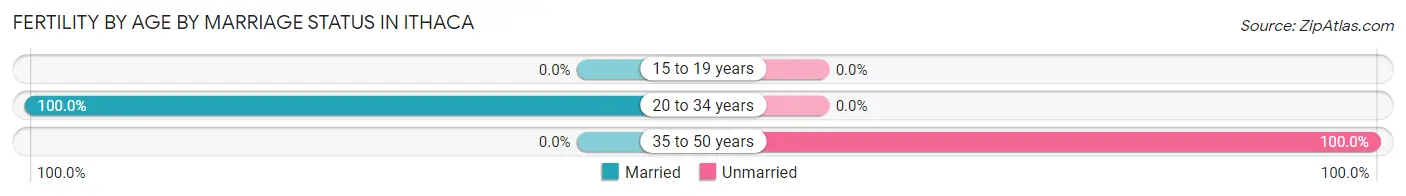
Fertility by Age by Marriage Status in Ithaca
94.9% of women with births (99) in Ithaca are married. The highest percentage of unmarried women with births falls into 35 to 50 years age bracket with 100.0% of them unmarried at the time of birth, while the lowest percentage of unmarried women with births belong to 20 to 34 years age bracket with 0.0% of them unmarried.
| Age Bracket | Married | Unmarried |
| 15 to 19 years | 0 (0.0%) | 0 (0.0%) |
| 20 to 34 years | 94 (100.0%) | 0 (0.0%) |
| 35 to 50 years | 0 (0.0%) | 5 (100.0%) |
| Total | 94 (95.0%) | 5 (5.1%) |
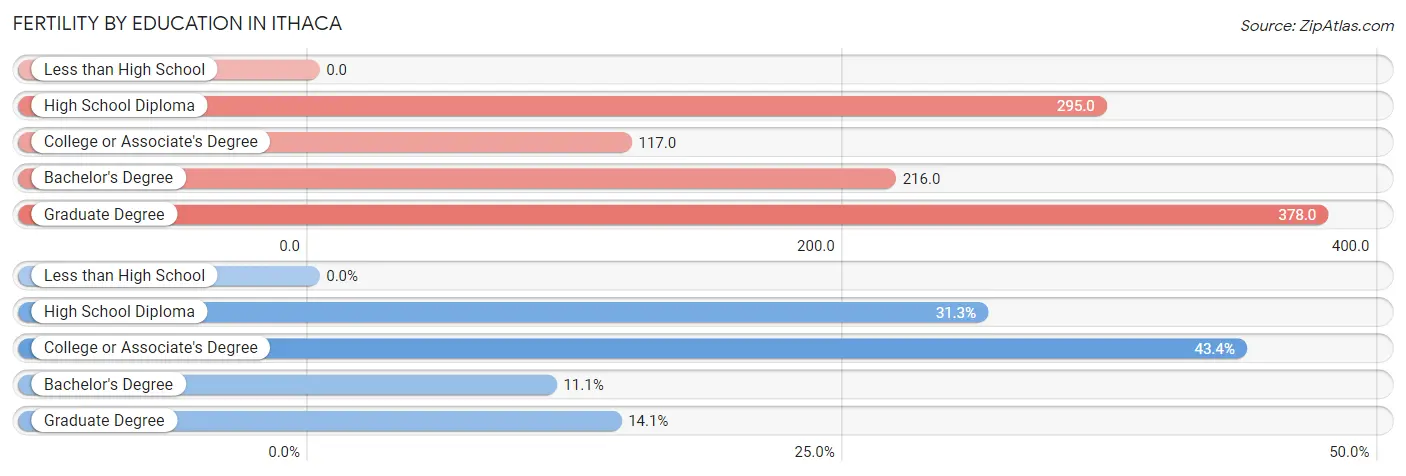
Fertility by Education in Ithaca
| Educational Attainment | Women with Births | Births / 1,000 Women |
| Less than High School | 0 (0.0%) | 0.0 |
| High School Diploma | 31 (31.3%) | 295.0 |
| College or Associate's Degree | 43 (43.4%) | 117.0 |
| Bachelor's Degree | 11 (11.1%) | 216.0 |
| Graduate Degree | 14 (14.1%) | 378.0 |
| Total | 99 (100.0%) | 167.0 |
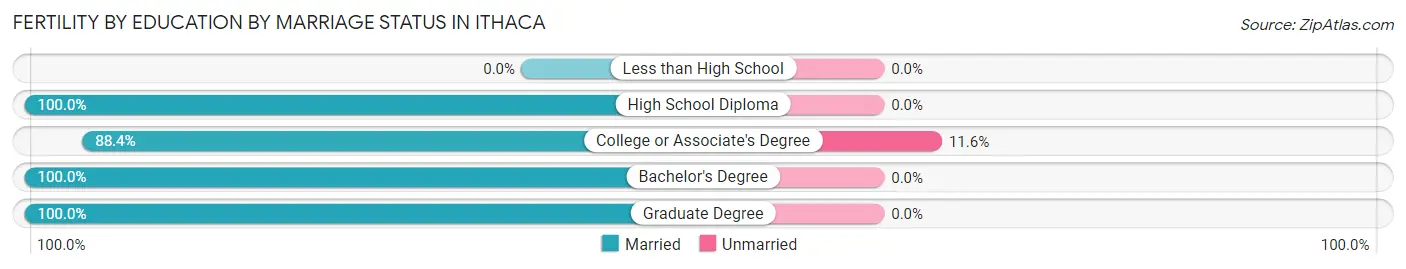
Fertility by Education by Marriage Status in Ithaca
5.1% of women with births in Ithaca are unmarried. Women with the educational attainment of high school diploma are most likely to be married with 100.0% of them married at childbirth, while women with the educational attainment of college or associate's degree are least likely to be married with 11.6% of them unmarried at childbirth.
| Educational Attainment | Married | Unmarried |
| Less than High School | 0 (0.0%) | 0 (0.0%) |
| High School Diploma | 31 (100.0%) | 0 (0.0%) |
| College or Associate's Degree | 38 (88.4%) | 5 (11.6%) |
| Bachelor's Degree | 11 (100.0%) | 0 (0.0%) |
| Graduate Degree | 14 (100.0%) | 0 (0.0%) |
| Total | 94 (95.0%) | 5 (5.1%) |
Employment Characteristics in Ithaca
Employment by Class of Employer in Ithaca
Among the 1,550 employed individuals in Ithaca, private company employees (873 | 56.3%), not-for-profit organizations (301 | 19.4%), and local government employees (150 | 9.7%) make up the most common classes of employment.
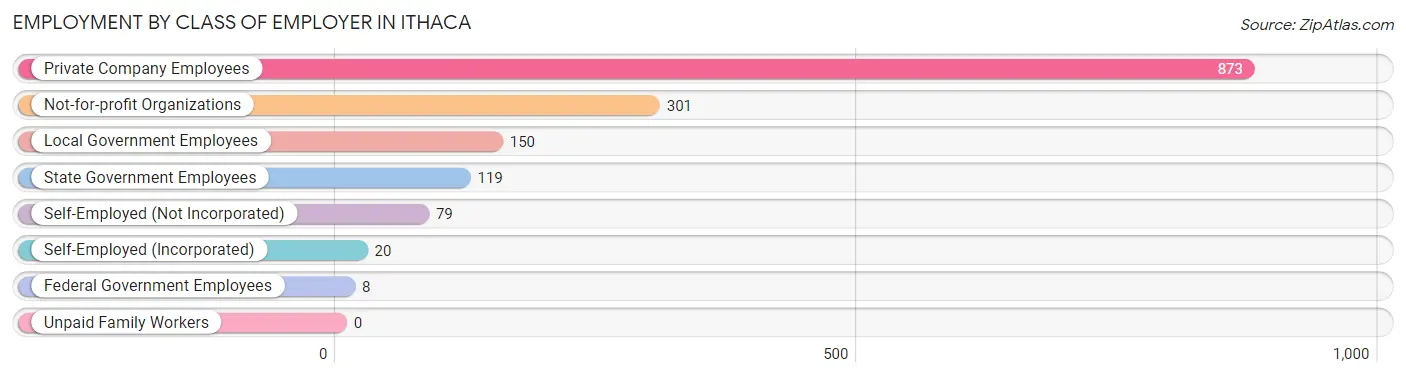
| Employer Class | # Employees | % Employees |
| Private Company Employees | 873 | 56.3% |
| Self-Employed (Incorporated) | 20 | 1.3% |
| Self-Employed (Not Incorporated) | 79 | 5.1% |
| Not-for-profit Organizations | 301 | 19.4% |
| Local Government Employees | 150 | 9.7% |
| State Government Employees | 119 | 7.7% |
| Federal Government Employees | 8 | 0.5% |
| Unpaid Family Workers | 0 | 0.0% |
| Total | 1,550 | 100.0% |
Employment Status by Age in Ithaca
According to the labor force statistics for Ithaca, out of the total population over 16 years of age (2,405), 66.4% or 1,597 individuals are in the labor force, with 0.8% or 13 of them unemployed. The age group with the highest labor force participation rate is 55 to 59 years, with 86.5% or 249 individuals in the labor force. Within the labor force, the 55 to 59 years age range has the highest percentage of unemployed individuals, with 5.2% or 13 of them being unemployed.
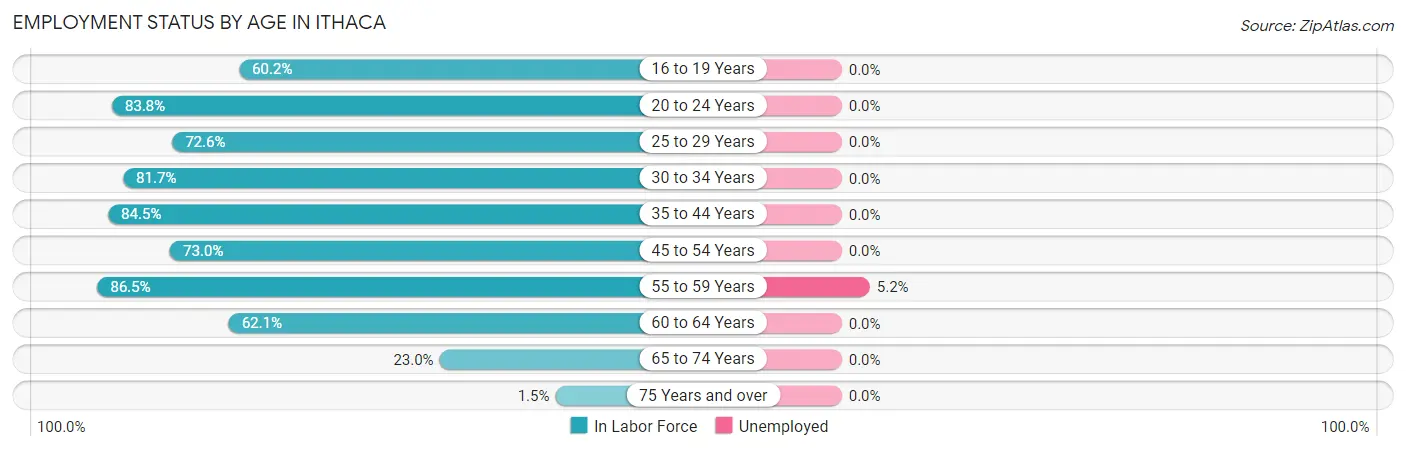
| Age Bracket | In Labor Force | Unemployed |
| 16 to 19 Years | 71 (60.2%) | 0 (0.0%) |
| 20 to 24 Years | 264 (83.8%) | 0 (0.0%) |
| 25 to 29 Years | 146 (72.6%) | 0 (0.0%) |
| 30 to 34 Years | 147 (81.7%) | 0 (0.0%) |
| 35 to 44 Years | 234 (84.5%) | 0 (0.0%) |
| 45 to 54 Years | 309 (73.0%) | 0 (0.0%) |
| 55 to 59 Years | 249 (86.5%) | 13 (5.2%) |
| 60 to 64 Years | 126 (62.1%) | 0 (0.0%) |
| 65 to 74 Years | 47 (23.0%) | 0 (0.0%) |
| 75 Years and over | 3 (1.5%) | 0 (0.0%) |
| Total | 1,597 (66.4%) | 13 (0.8%) |
Employment Status by Educational Attainment in Ithaca
According to labor force statistics for Ithaca, 77.0% of individuals (1,210) out of the total population between 25 and 64 years of age (1,572) are in the labor force, with 1.1% or 13 of them being unemployed. The group with the highest labor force participation rate are those with the educational attainment of bachelor's degree or higher, with 87.2% or 401 individuals in the labor force. Within the labor force, individuals with bachelor's degree or higher education have the highest percentage of unemployment, with 3.2% or 13 of them being unemployed.
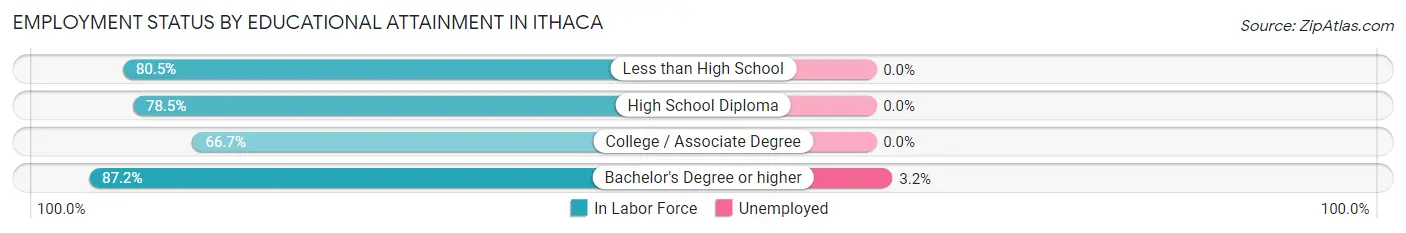
| Educational Attainment | In Labor Force | Unemployed |
| Less than High School | 95 (80.5%) | 0 (0.0%) |
| High School Diploma | 346 (78.5%) | 0 (0.0%) |
| College / Associate Degree | 369 (66.7%) | 0 (0.0%) |
| Bachelor's Degree or higher | 401 (87.2%) | 15 (3.2%) |
| Total | 1,210 (77.0%) | 17 (1.1%) |
Employment Occupations by Sex in Ithaca
Management, Business, Science and Arts Occupations
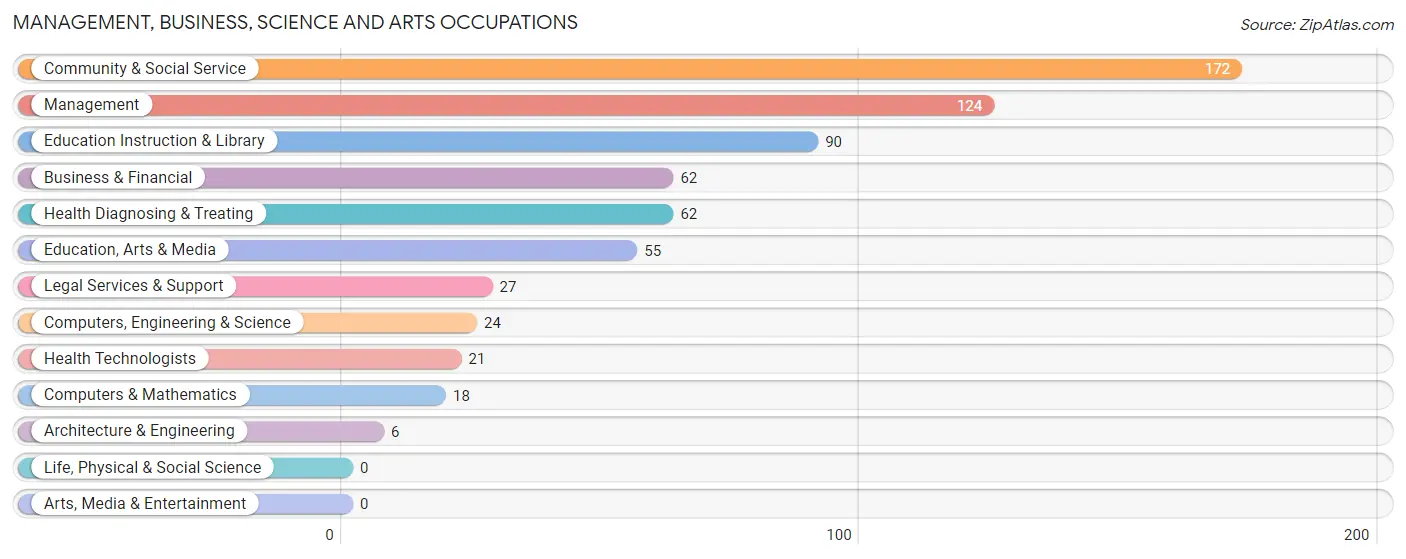
The most common Management, Business, Science and Arts occupations in Ithaca are Community & Social Service (172 | 10.9%), Management (124 | 7.8%), Education Instruction & Library (90 | 5.7%), Business & Financial (62 | 3.9%), and Health Diagnosing & Treating (62 | 3.9%).
Management, Business, Science and Arts Occupations by Sex
Within the Management, Business, Science and Arts occupations in Ithaca, the most male-oriented occupations are Computers, Engineering & Science (100.0%), Computers & Mathematics (100.0%), and Architecture & Engineering (100.0%), while the most female-oriented occupations are Education, Arts & Media (100.0%), Legal Services & Support (100.0%), and Health Diagnosing & Treating (100.0%).
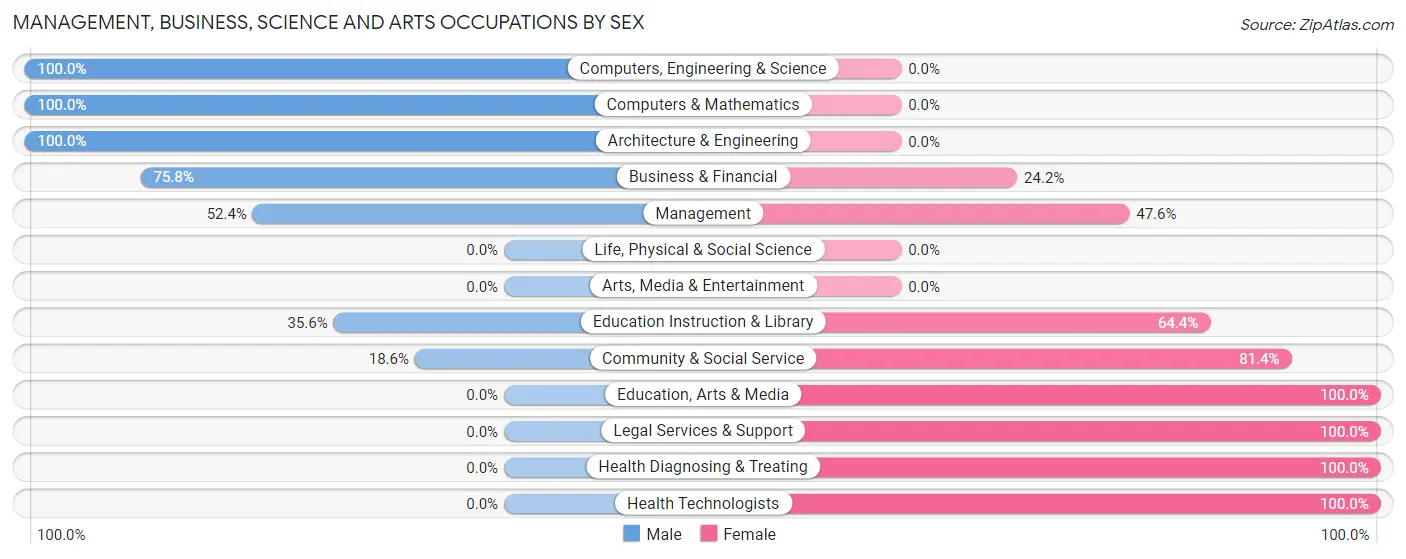
| Occupation | Male | Female |
| Management | 65 (52.4%) | 59 (47.6%) |
| Business & Financial | 47 (75.8%) | 15 (24.2%) |
| Computers, Engineering & Science | 24 (100.0%) | 0 (0.0%) |
| Computers & Mathematics | 18 (100.0%) | 0 (0.0%) |
| Architecture & Engineering | 6 (100.0%) | 0 (0.0%) |
| Life, Physical & Social Science | 0 (0.0%) | 0 (0.0%) |
| Community & Social Service | 32 (18.6%) | 140 (81.4%) |
| Education, Arts & Media | 0 (0.0%) | 55 (100.0%) |
| Legal Services & Support | 0 (0.0%) | 27 (100.0%) |
| Education Instruction & Library | 32 (35.6%) | 58 (64.4%) |
| Arts, Media & Entertainment | 0 (0.0%) | 0 (0.0%) |
| Health Diagnosing & Treating | 0 (0.0%) | 62 (100.0%) |
| Health Technologists | 0 (0.0%) | 21 (100.0%) |
| Total (Category) | 168 (37.8%) | 276 (62.2%) |
| Total (Overall) | 815 (51.5%) | 768 (48.5%) |
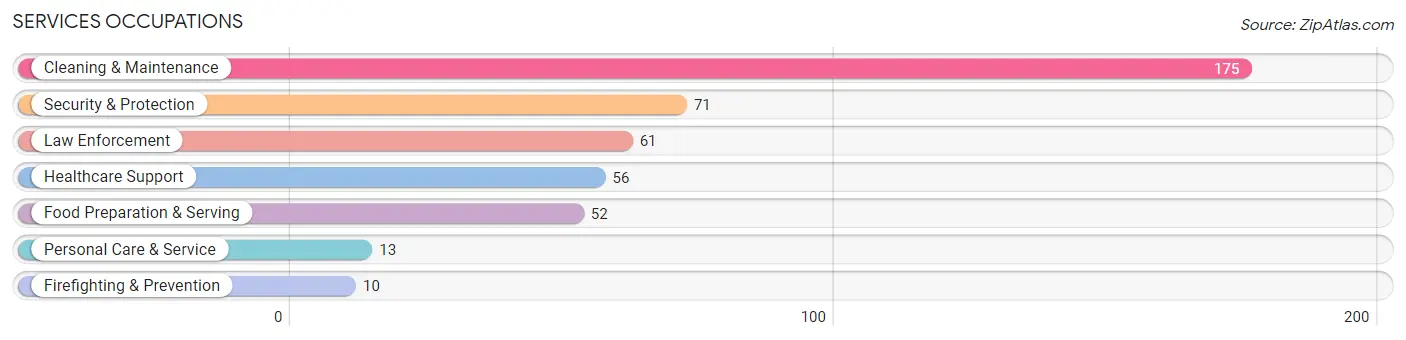
Services Occupations
The most common Services occupations in Ithaca are Cleaning & Maintenance (175 | 11.1%), Security & Protection (71 | 4.5%), Law Enforcement (61 | 3.8%), Healthcare Support (56 | 3.5%), and Food Preparation & Serving (52 | 3.3%).
Services Occupations by Sex
Within the Services occupations in Ithaca, the most male-oriented occupations are Firefighting & Prevention (100.0%), Security & Protection (80.3%), and Law Enforcement (77.0%), while the most female-oriented occupations are Healthcare Support (100.0%), Personal Care & Service (100.0%), and Cleaning & Maintenance (50.9%).
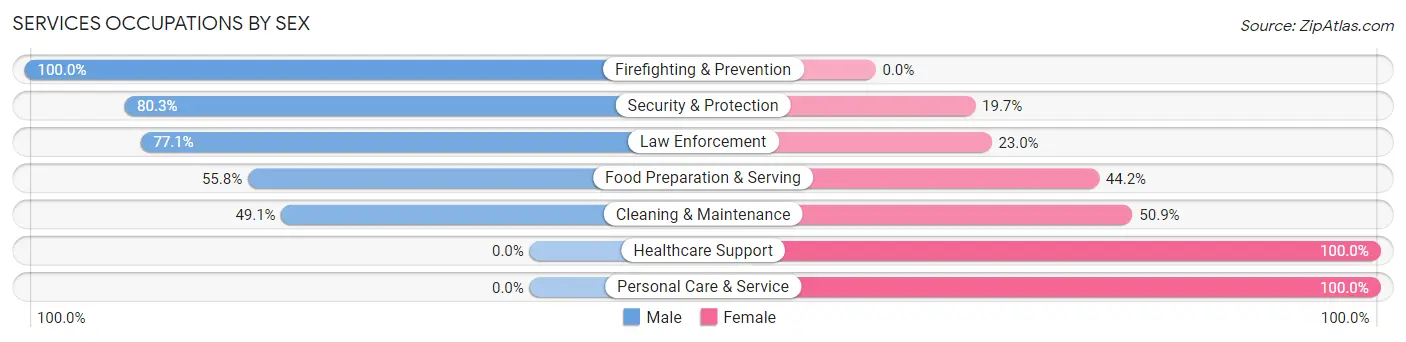
| Occupation | Male | Female |
| Healthcare Support | 0 (0.0%) | 56 (100.0%) |
| Security & Protection | 57 (80.3%) | 14 (19.7%) |
| Firefighting & Prevention | 10 (100.0%) | 0 (0.0%) |
| Law Enforcement | 47 (77.0%) | 14 (23.0%) |
| Food Preparation & Serving | 29 (55.8%) | 23 (44.2%) |
| Cleaning & Maintenance | 86 (49.1%) | 89 (50.9%) |
| Personal Care & Service | 0 (0.0%) | 13 (100.0%) |
| Total (Category) | 172 (46.9%) | 195 (53.1%) |
| Total (Overall) | 815 (51.5%) | 768 (48.5%) |
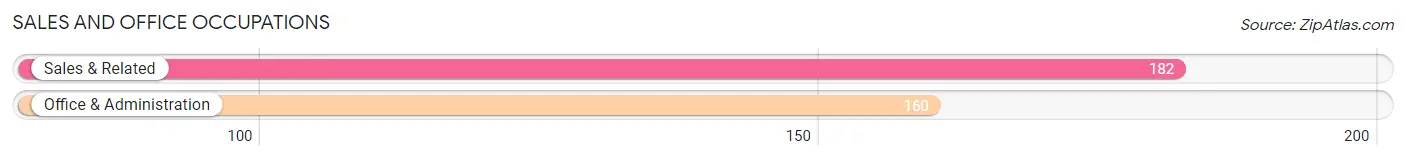
Sales and Office Occupations
The most common Sales and Office occupations in Ithaca are Sales & Related (182 | 11.5%), and Office & Administration (160 | 10.1%).
Sales and Office Occupations by Sex
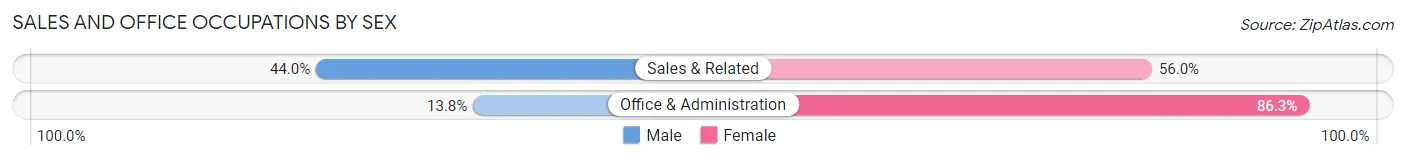
| Occupation | Male | Female |
| Sales & Related | 80 (44.0%) | 102 (56.0%) |
| Office & Administration | 22 (13.8%) | 138 (86.3%) |
| Total (Category) | 102 (29.8%) | 240 (70.2%) |
| Total (Overall) | 815 (51.5%) | 768 (48.5%) |
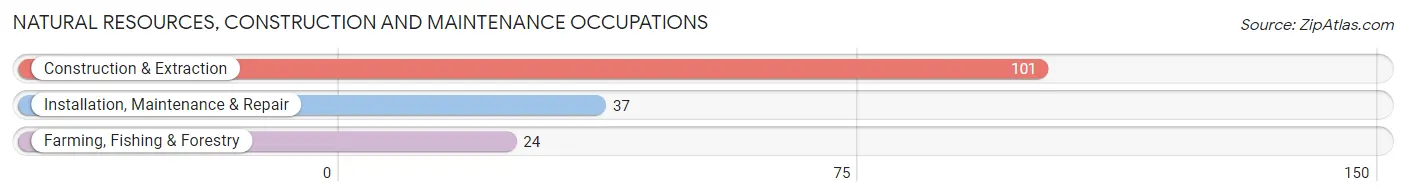
Natural Resources, Construction and Maintenance Occupations
The most common Natural Resources, Construction and Maintenance occupations in Ithaca are Construction & Extraction (101 | 6.4%), Installation, Maintenance & Repair (37 | 2.3%), and Farming, Fishing & Forestry (24 | 1.5%).
Natural Resources, Construction and Maintenance Occupations by Sex
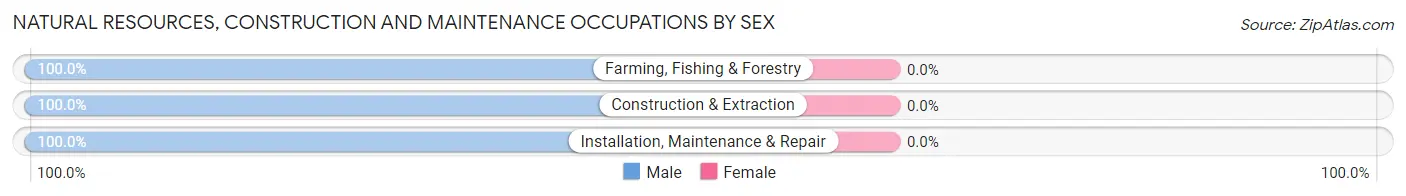
| Occupation | Male | Female |
| Farming, Fishing & Forestry | 24 (100.0%) | 0 (0.0%) |
| Construction & Extraction | 101 (100.0%) | 0 (0.0%) |
| Installation, Maintenance & Repair | 37 (100.0%) | 0 (0.0%) |
| Total (Category) | 162 (100.0%) | 0 (0.0%) |
| Total (Overall) | 815 (51.5%) | 768 (48.5%) |
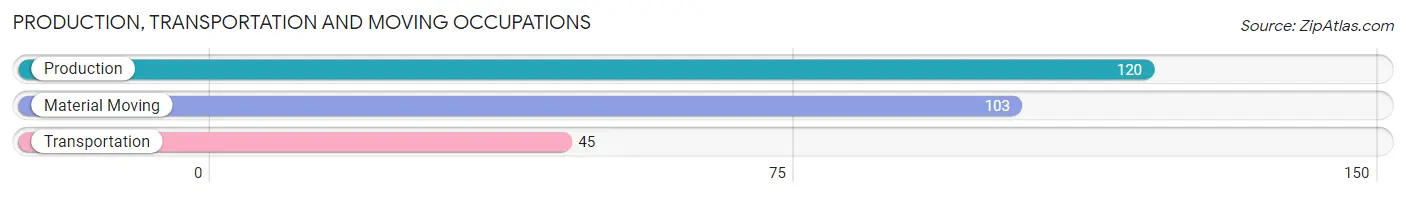
Production, Transportation and Moving Occupations
The most common Production, Transportation and Moving occupations in Ithaca are Production (120 | 7.6%), Material Moving (103 | 6.5%), and Transportation (45 | 2.8%).
Production, Transportation and Moving Occupations by Sex
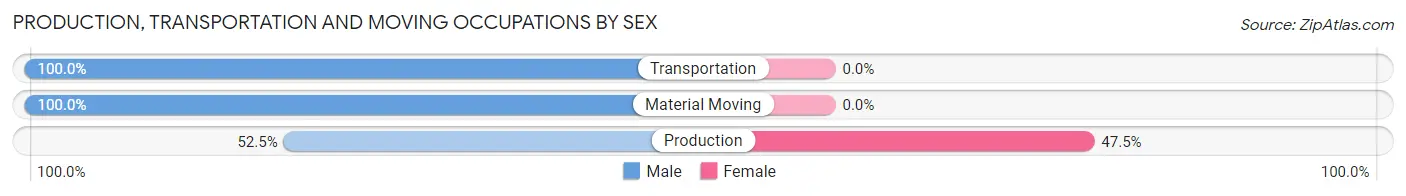
| Occupation | Male | Female |
| Production | 63 (52.5%) | 57 (47.5%) |
| Transportation | 45 (100.0%) | 0 (0.0%) |
| Material Moving | 103 (100.0%) | 0 (0.0%) |
| Total (Category) | 211 (78.7%) | 57 (21.3%) |
| Total (Overall) | 815 (51.5%) | 768 (48.5%) |
Employment Industries by Sex in Ithaca
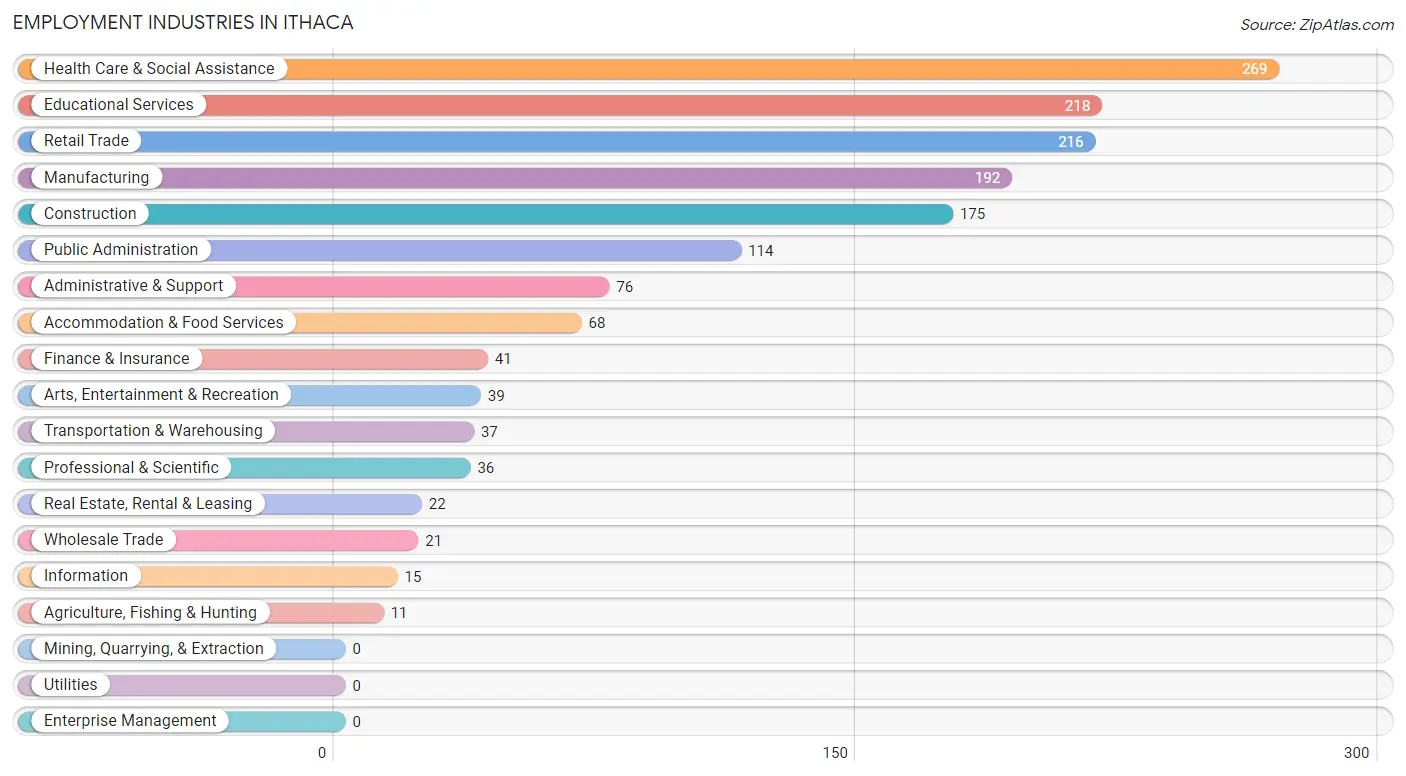
Employment Industries in Ithaca
The major employment industries in Ithaca include Health Care & Social Assistance (269 | 17.0%), Educational Services (218 | 13.8%), Retail Trade (216 | 13.6%), Manufacturing (192 | 12.1%), and Construction (175 | 11.1%).
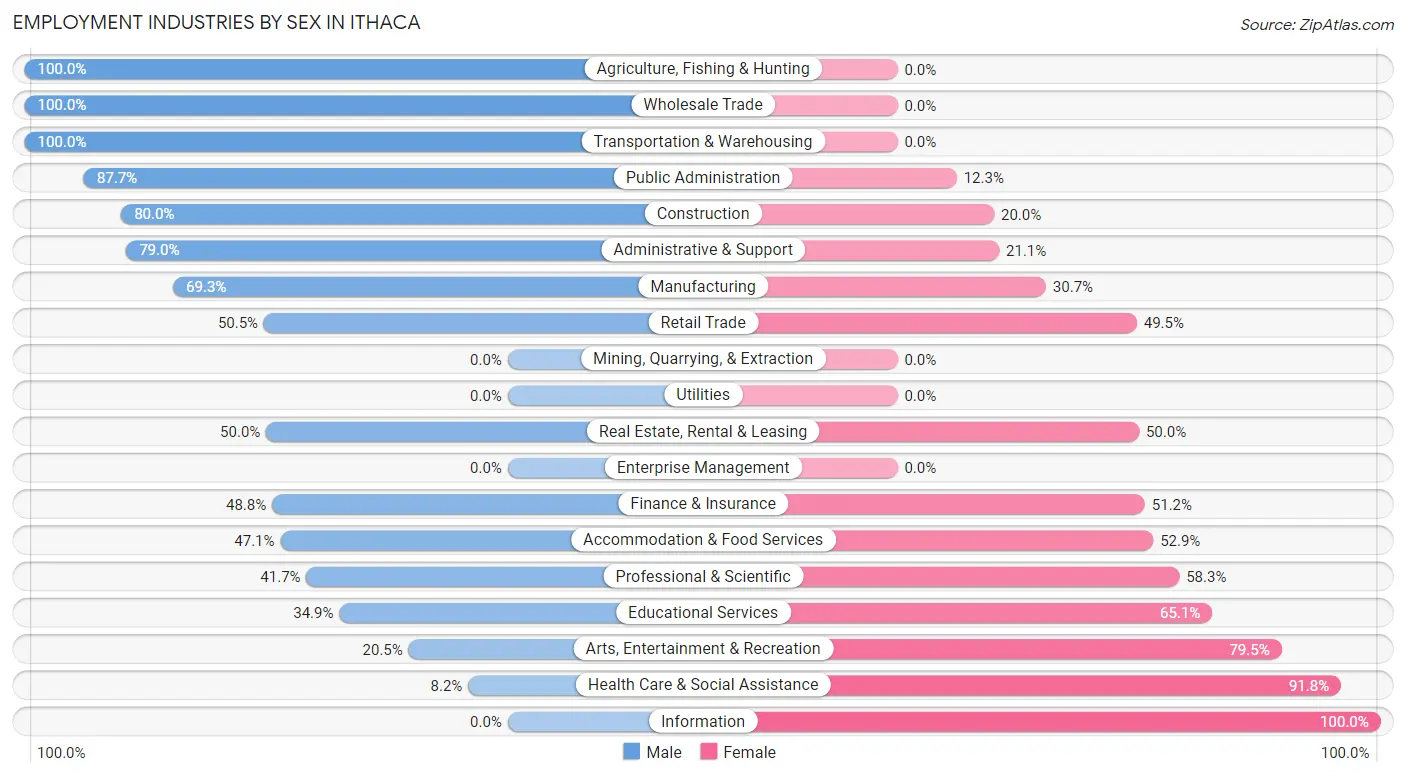
Employment Industries by Sex in Ithaca
The Ithaca industries that see more men than women are Agriculture, Fishing & Hunting (100.0%), Wholesale Trade (100.0%), and Transportation & Warehousing (100.0%), whereas the industries that tend to have a higher number of women are Information (100.0%), Health Care & Social Assistance (91.8%), and Arts, Entertainment & Recreation (79.5%).
| Industry | Male | Female |
| Agriculture, Fishing & Hunting | 11 (100.0%) | 0 (0.0%) |
| Mining, Quarrying, & Extraction | 0 (0.0%) | 0 (0.0%) |
| Construction | 140 (80.0%) | 35 (20.0%) |
| Manufacturing | 133 (69.3%) | 59 (30.7%) |
| Wholesale Trade | 21 (100.0%) | 0 (0.0%) |
| Retail Trade | 109 (50.5%) | 107 (49.5%) |
| Transportation & Warehousing | 37 (100.0%) | 0 (0.0%) |
| Utilities | 0 (0.0%) | 0 (0.0%) |
| Information | 0 (0.0%) | 15 (100.0%) |
| Finance & Insurance | 20 (48.8%) | 21 (51.2%) |
| Real Estate, Rental & Leasing | 11 (50.0%) | 11 (50.0%) |
| Professional & Scientific | 15 (41.7%) | 21 (58.3%) |
| Enterprise Management | 0 (0.0%) | 0 (0.0%) |
| Administrative & Support | 60 (78.9%) | 16 (21.0%) |
| Educational Services | 76 (34.9%) | 142 (65.1%) |
| Health Care & Social Assistance | 22 (8.2%) | 247 (91.8%) |
| Arts, Entertainment & Recreation | 8 (20.5%) | 31 (79.5%) |
| Accommodation & Food Services | 32 (47.1%) | 36 (52.9%) |
| Public Administration | 100 (87.7%) | 14 (12.3%) |
| Total | 815 (51.5%) | 768 (48.5%) |
Education in Ithaca
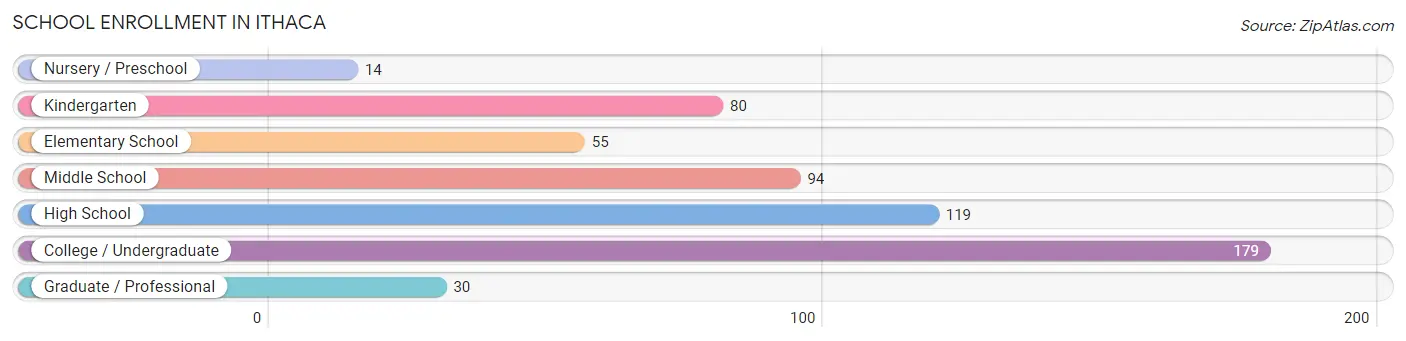
School Enrollment in Ithaca
The most common levels of schooling among the 571 students in Ithaca are college / undergraduate (179 | 31.4%), high school (119 | 20.8%), and middle school (94 | 16.5%).
| School Level | # Students | % Students |
| Nursery / Preschool | 14 | 2.5% |
| Kindergarten | 80 | 14.0% |
| Elementary School | 55 | 9.6% |
| Middle School | 94 | 16.5% |
| High School | 119 | 20.8% |
| College / Undergraduate | 179 | 31.4% |
| Graduate / Professional | 30 | 5.2% |
| Total | 571 | 100.0% |
School Enrollment by Age by Funding Source in Ithaca
Out of a total of 571 students who are enrolled in schools in Ithaca, 110 (19.3%) attend a private institution, while the remaining 461 (80.7%) are enrolled in public schools. The age group of 3 to 4 year olds has the highest likelihood of being enrolled in private schools, with 11 (78.6% in the age bracket) enrolled. Conversely, the age group of 10 to 14 year olds has the lowest likelihood of being enrolled in a private school, with 83 (100.0% in the age bracket) attending a public institution.
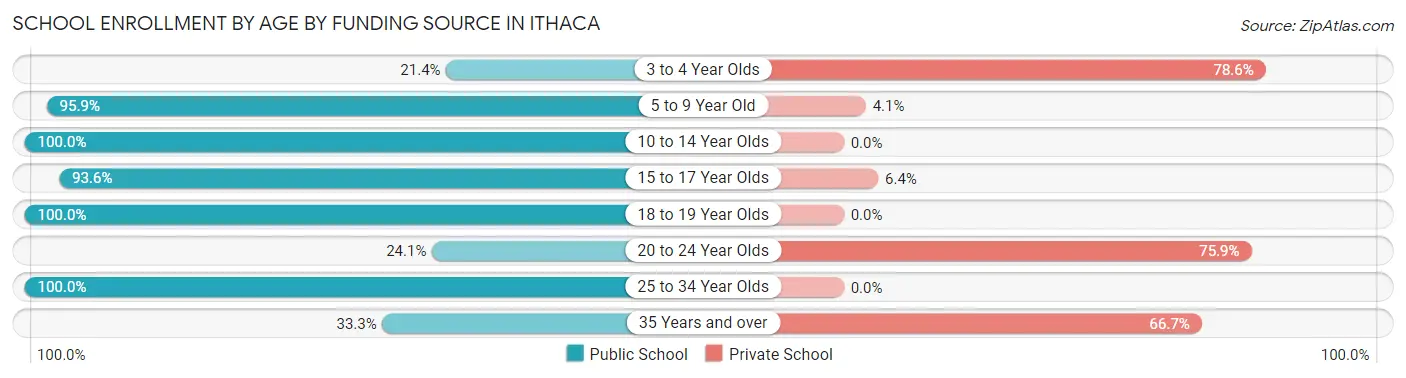
| Age Bracket | Public School | Private School |
| 3 to 4 Year Olds | 3 (21.4%) | 11 (78.6%) |
| 5 to 9 Year Old | 140 (95.9%) | 6 (4.1%) |
| 10 to 14 Year Olds | 83 (100.0%) | 0 (0.0%) |
| 15 to 17 Year Olds | 102 (93.6%) | 7 (6.4%) |
| 18 to 19 Year Olds | 19 (100.0%) | 0 (0.0%) |
| 20 to 24 Year Olds | 26 (24.1%) | 82 (75.9%) |
| 25 to 34 Year Olds | 86 (100.0%) | 0 (0.0%) |
| 35 Years and over | 2 (33.3%) | 4 (66.7%) |
| Total | 461 (80.7%) | 110 (19.3%) |
Educational Attainment by Field of Study in Ithaca
Science & technology (117 | 23.0%), business (116 | 22.8%), education (97 | 19.1%), arts & humanities (83 | 16.3%), and psychology (31 | 6.1%) are the most common fields of study among 508 individuals in Ithaca who have obtained a bachelor's degree or higher.
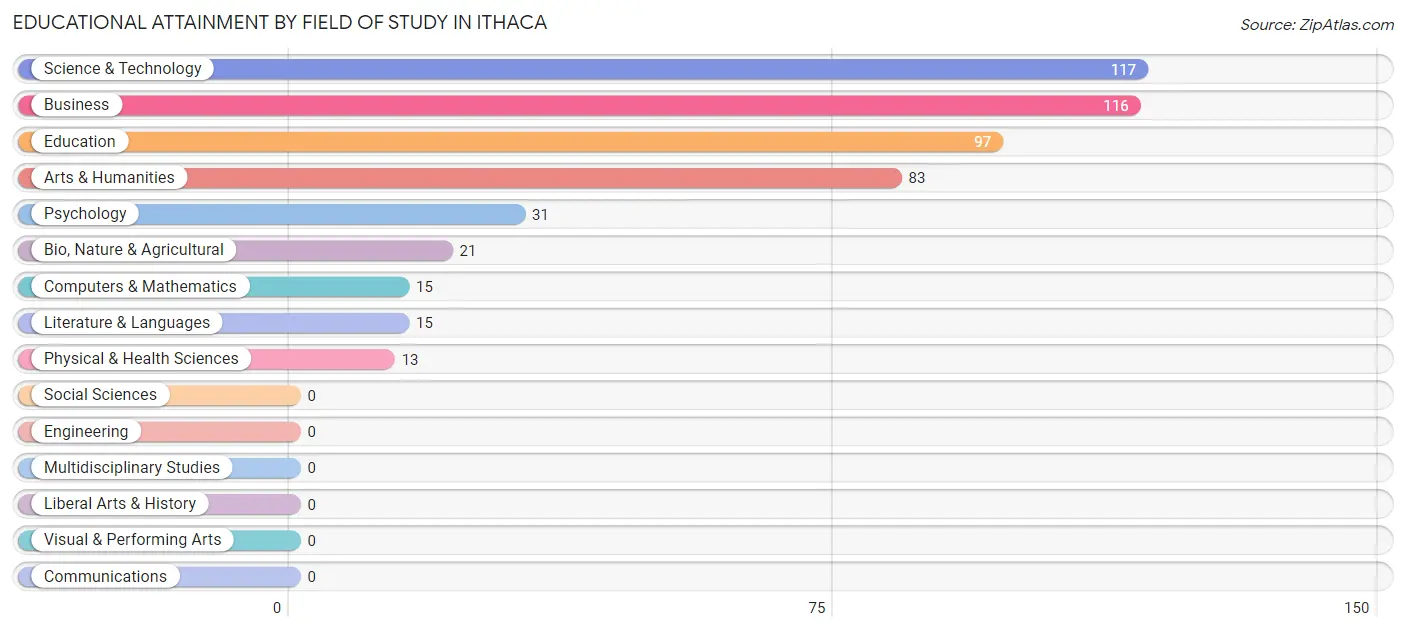
| Field of Study | # Graduates | % Graduates |
| Computers & Mathematics | 15 | 2.9% |
| Bio, Nature & Agricultural | 21 | 4.1% |
| Physical & Health Sciences | 13 | 2.6% |
| Psychology | 31 | 6.1% |
| Social Sciences | 0 | 0.0% |
| Engineering | 0 | 0.0% |
| Multidisciplinary Studies | 0 | 0.0% |
| Science & Technology | 117 | 23.0% |
| Business | 116 | 22.8% |
| Education | 97 | 19.1% |
| Literature & Languages | 15 | 2.9% |
| Liberal Arts & History | 0 | 0.0% |
| Visual & Performing Arts | 0 | 0.0% |
| Communications | 0 | 0.0% |
| Arts & Humanities | 83 | 16.3% |
| Total | 508 | 100.0% |
Transportation & Commute in Ithaca
Vehicle Availability by Sex in Ithaca
The most prevalent vehicle ownership categories in Ithaca are males with 2 vehicles (255, accounting for 34.0%) and females with 2 vehicles (256, making up 34.7%).
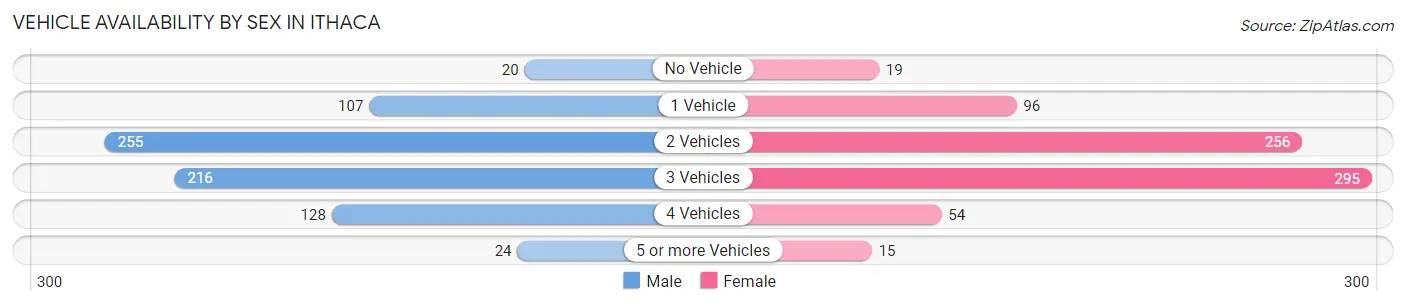
| Vehicles Available | Male | Female |
| No Vehicle | 20 (2.7%) | 19 (2.6%) |
| 1 Vehicle | 107 (14.3%) | 96 (13.1%) |
| 2 Vehicles | 255 (34.0%) | 256 (34.8%) |
| 3 Vehicles | 216 (28.8%) | 295 (40.1%) |
| 4 Vehicles | 128 (17.1%) | 54 (7.3%) |
| 5 or more Vehicles | 24 (3.2%) | 15 (2.0%) |
| Total | 750 (100.0%) | 735 (100.0%) |
Commute Time in Ithaca
The most frequently occuring commute durations in Ithaca are 30 to 34 minutes (229 commuters, 14.9%), 20 to 24 minutes (215 commuters, 14.0%), and 45 to 59 minutes (199 commuters, 13.0%).
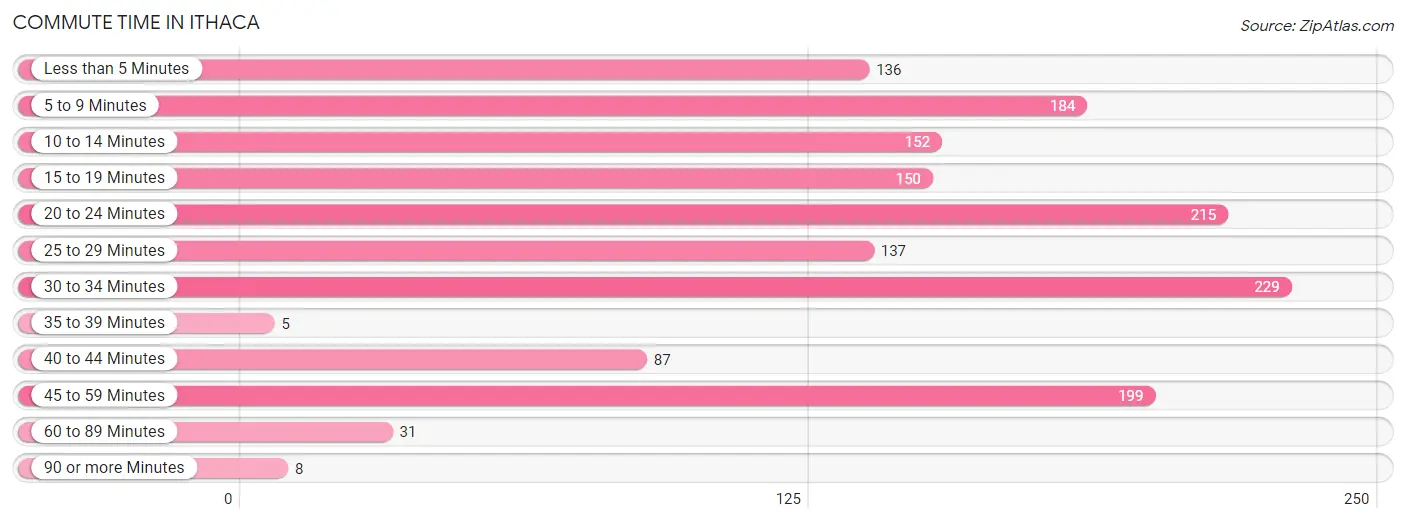
| Commute Time | # Commuters | % Commuters |
| Less than 5 Minutes | 136 | 8.9% |
| 5 to 9 Minutes | 184 | 12.0% |
| 10 to 14 Minutes | 152 | 9.9% |
| 15 to 19 Minutes | 150 | 9.8% |
| 20 to 24 Minutes | 215 | 14.0% |
| 25 to 29 Minutes | 137 | 8.9% |
| 30 to 34 Minutes | 229 | 14.9% |
| 35 to 39 Minutes | 5 | 0.3% |
| 40 to 44 Minutes | 87 | 5.7% |
| 45 to 59 Minutes | 199 | 13.0% |
| 60 to 89 Minutes | 31 | 2.0% |
| 90 or more Minutes | 8 | 0.5% |
Commute Time by Sex in Ithaca
The most common commute times in Ithaca are 45 to 59 minutes (147 commuters, 18.0%) for males and 20 to 24 minutes (148 commuters, 20.6%) for females.
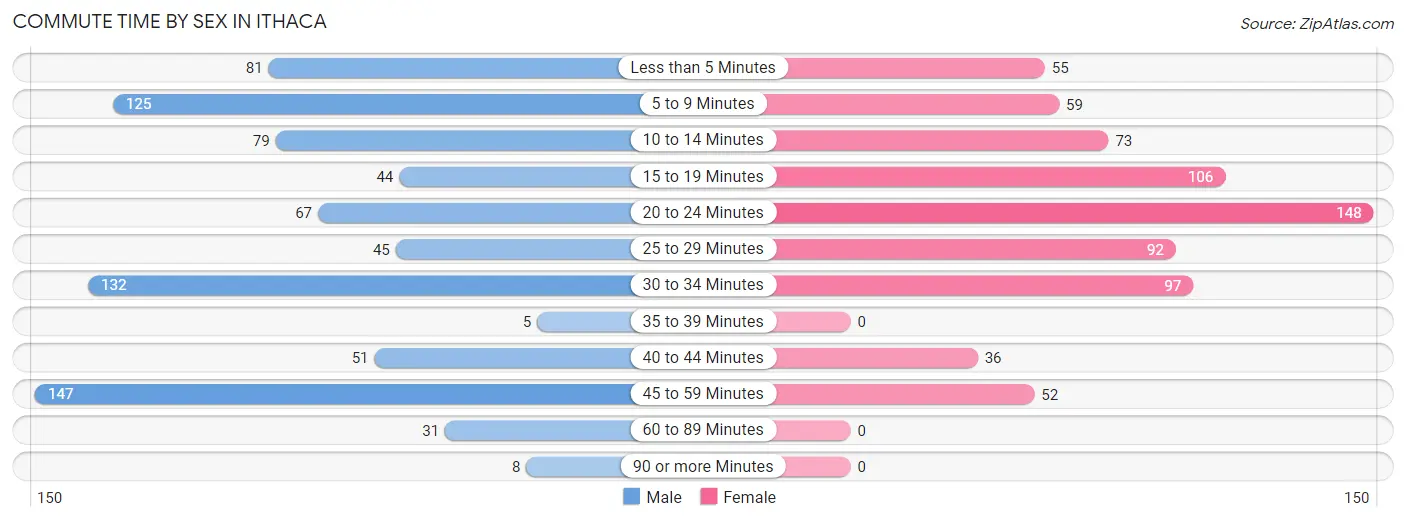
| Commute Time | Male | Female |
| Less than 5 Minutes | 81 (9.9%) | 55 (7.7%) |
| 5 to 9 Minutes | 125 (15.3%) | 59 (8.2%) |
| 10 to 14 Minutes | 79 (9.7%) | 73 (10.2%) |
| 15 to 19 Minutes | 44 (5.4%) | 106 (14.8%) |
| 20 to 24 Minutes | 67 (8.2%) | 148 (20.6%) |
| 25 to 29 Minutes | 45 (5.5%) | 92 (12.8%) |
| 30 to 34 Minutes | 132 (16.2%) | 97 (13.5%) |
| 35 to 39 Minutes | 5 (0.6%) | 0 (0.0%) |
| 40 to 44 Minutes | 51 (6.3%) | 36 (5.0%) |
| 45 to 59 Minutes | 147 (18.0%) | 52 (7.2%) |
| 60 to 89 Minutes | 31 (3.8%) | 0 (0.0%) |
| 90 or more Minutes | 8 (1.0%) | 0 (0.0%) |
Time of Departure to Work by Sex in Ithaca
The most frequent times of departure to work in Ithaca are 7:30 AM to 7:59 AM (126, 15.5%) for males and 7:30 AM to 7:59 AM (180, 25.1%) for females.
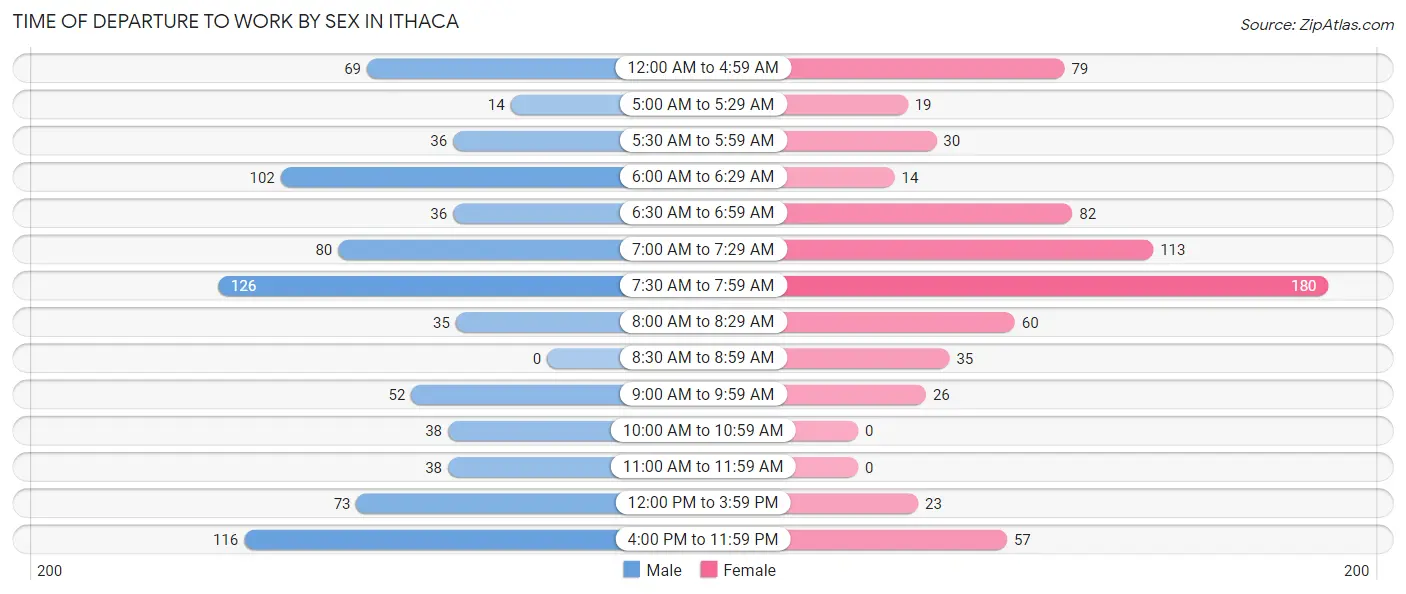
| Time of Departure | Male | Female |
| 12:00 AM to 4:59 AM | 69 (8.5%) | 79 (11.0%) |
| 5:00 AM to 5:29 AM | 14 (1.7%) | 19 (2.6%) |
| 5:30 AM to 5:59 AM | 36 (4.4%) | 30 (4.2%) |
| 6:00 AM to 6:29 AM | 102 (12.5%) | 14 (1.9%) |
| 6:30 AM to 6:59 AM | 36 (4.4%) | 82 (11.4%) |
| 7:00 AM to 7:29 AM | 80 (9.8%) | 113 (15.7%) |
| 7:30 AM to 7:59 AM | 126 (15.5%) | 180 (25.1%) |
| 8:00 AM to 8:29 AM | 35 (4.3%) | 60 (8.4%) |
| 8:30 AM to 8:59 AM | 0 (0.0%) | 35 (4.9%) |
| 9:00 AM to 9:59 AM | 52 (6.4%) | 26 (3.6%) |
| 10:00 AM to 10:59 AM | 38 (4.7%) | 0 (0.0%) |
| 11:00 AM to 11:59 AM | 38 (4.7%) | 0 (0.0%) |
| 12:00 PM to 3:59 PM | 73 (9.0%) | 23 (3.2%) |
| 4:00 PM to 11:59 PM | 116 (14.2%) | 57 (7.9%) |
| Total | 815 (100.0%) | 718 (100.0%) |
Housing Occupancy in Ithaca
Occupancy by Ownership in Ithaca
Of the total 1,183 dwellings in Ithaca, owner-occupied units account for 846 (71.5%), while renter-occupied units make up 337 (28.5%).
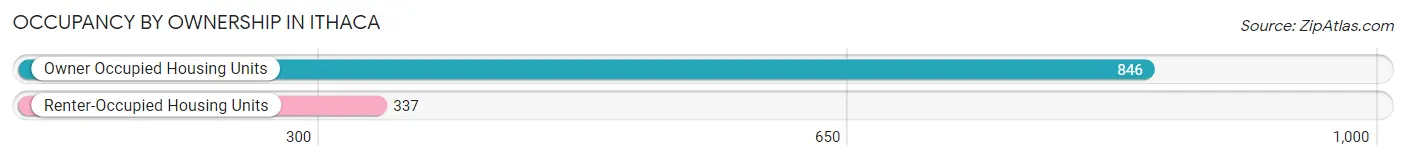
| Occupancy | # Housing Units | % Housing Units |
| Owner Occupied Housing Units | 846 | 71.5% |
| Renter-Occupied Housing Units | 337 | 28.5% |
| Total Occupied Housing Units | 1,183 | 100.0% |
Occupancy by Household Size in Ithaca
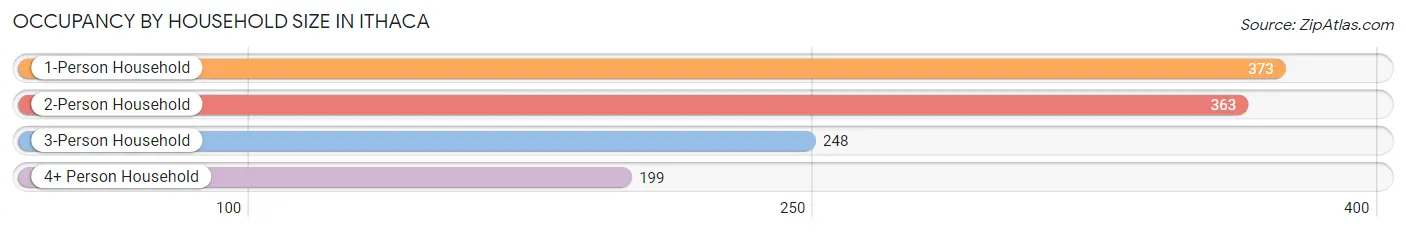
| Household Size | # Housing Units | % Housing Units |
| 1-Person Household | 373 | 31.5% |
| 2-Person Household | 363 | 30.7% |
| 3-Person Household | 248 | 21.0% |
| 4+ Person Household | 199 | 16.8% |
| Total Housing Units | 1,183 | 100.0% |
Occupancy by Ownership by Household Size in Ithaca
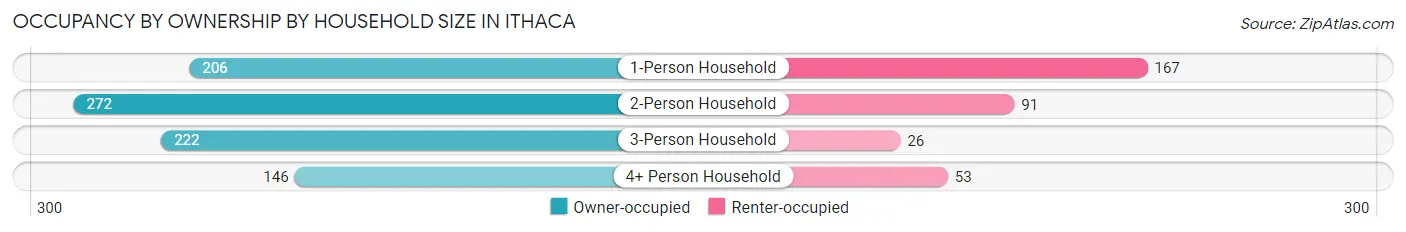
| Household Size | Owner-occupied | Renter-occupied |
| 1-Person Household | 206 (55.2%) | 167 (44.8%) |
| 2-Person Household | 272 (74.9%) | 91 (25.1%) |
| 3-Person Household | 222 (89.5%) | 26 (10.5%) |
| 4+ Person Household | 146 (73.4%) | 53 (26.6%) |
| Total Housing Units | 846 (71.5%) | 337 (28.5%) |
Occupancy by Educational Attainment in Ithaca
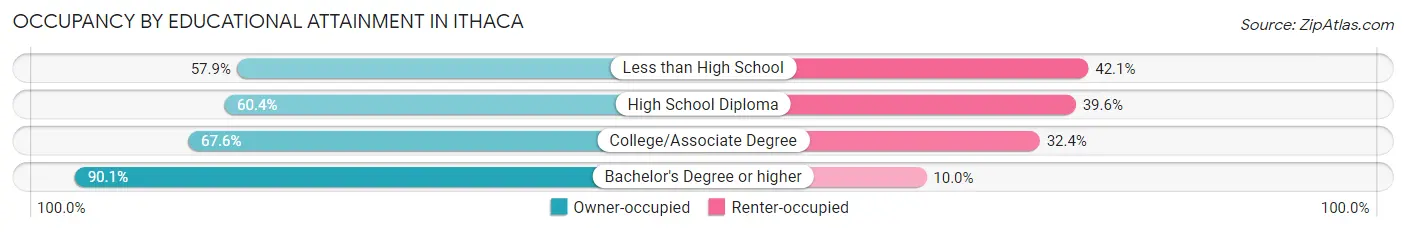
| Household Size | Owner-occupied | Renter-occupied |
| Less than High School | 62 (57.9%) | 45 (42.1%) |
| High School Diploma | 226 (60.4%) | 148 (39.6%) |
| College/Associate Degree | 223 (67.6%) | 107 (32.4%) |
| Bachelor's Degree or higher | 335 (90.0%) | 37 (10.0%) |
Occupancy by Age of Householder in Ithaca
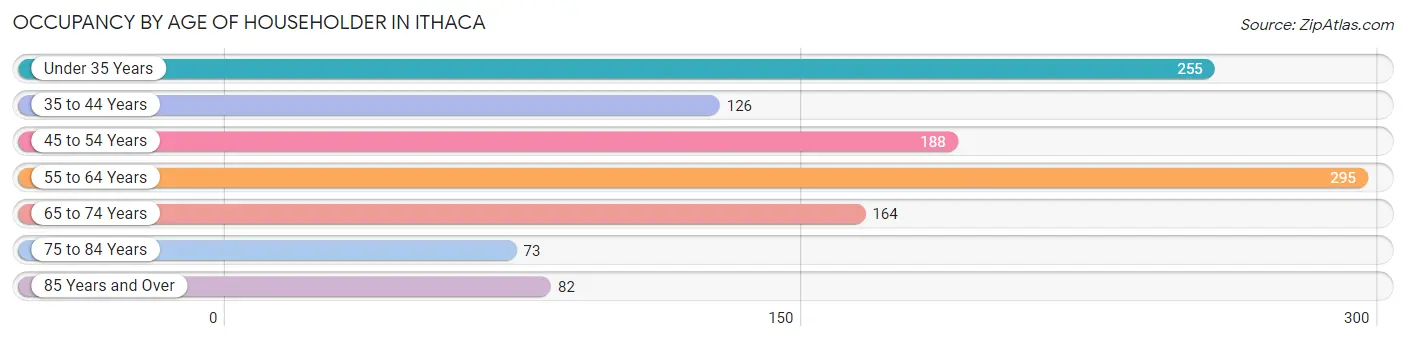
| Age Bracket | # Households | % Households |
| Under 35 Years | 255 | 21.6% |
| 35 to 44 Years | 126 | 10.6% |
| 45 to 54 Years | 188 | 15.9% |
| 55 to 64 Years | 295 | 24.9% |
| 65 to 74 Years | 164 | 13.9% |
| 75 to 84 Years | 73 | 6.2% |
| 85 Years and Over | 82 | 6.9% |
| Total | 1,183 | 100.0% |
Housing Finances in Ithaca
Median Income by Occupancy in Ithaca
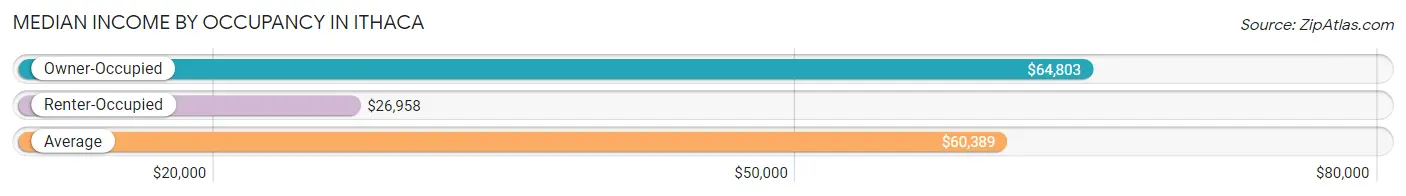
| Occupancy Type | # Households | Median Income |
| Owner-Occupied | 846 (71.5%) | $64,803 |
| Renter-Occupied | 337 (28.5%) | $26,958 |
| Average | 1,183 (100.0%) | $60,389 |
Occupancy by Householder Income Bracket in Ithaca
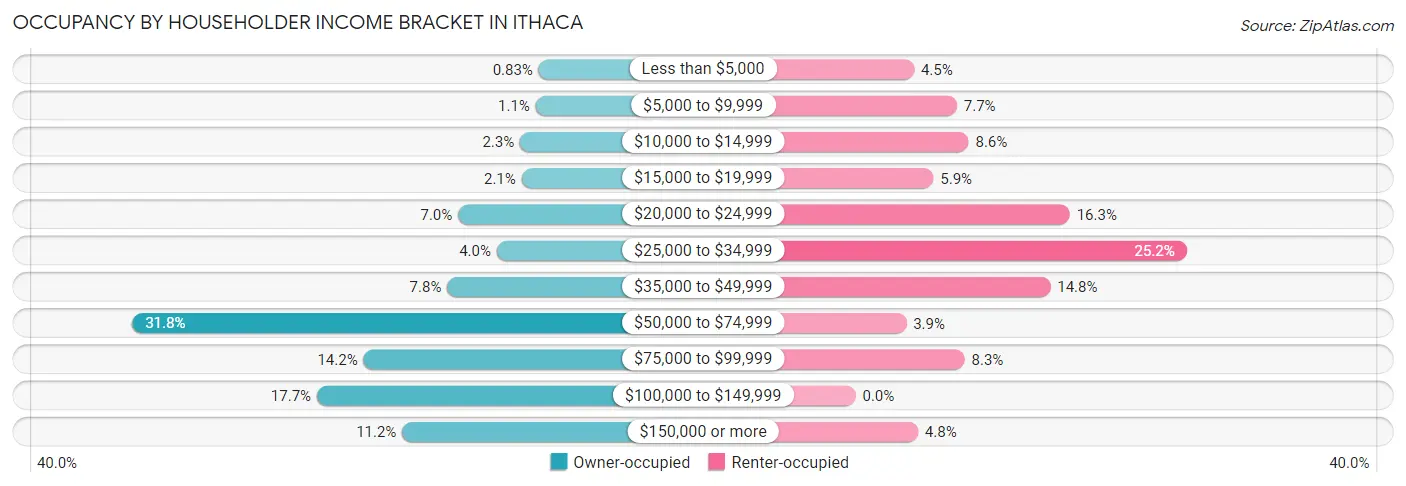
| Income Bracket | Owner-occupied | Renter-occupied |
| Less than $5,000 | 7 (0.8%) | 15 (4.4%) |
| $5,000 to $9,999 | 9 (1.1%) | 26 (7.7%) |
| $10,000 to $14,999 | 19 (2.2%) | 29 (8.6%) |
| $15,000 to $19,999 | 18 (2.1%) | 20 (5.9%) |
| $20,000 to $24,999 | 59 (7.0%) | 55 (16.3%) |
| $25,000 to $34,999 | 34 (4.0%) | 85 (25.2%) |
| $35,000 to $49,999 | 66 (7.8%) | 50 (14.8%) |
| $50,000 to $74,999 | 269 (31.8%) | 13 (3.9%) |
| $75,000 to $99,999 | 120 (14.2%) | 28 (8.3%) |
| $100,000 to $149,999 | 150 (17.7%) | 0 (0.0%) |
| $150,000 or more | 95 (11.2%) | 16 (4.8%) |
| Total | 846 (100.0%) | 337 (100.0%) |
Monthly Housing Cost Tiers in Ithaca
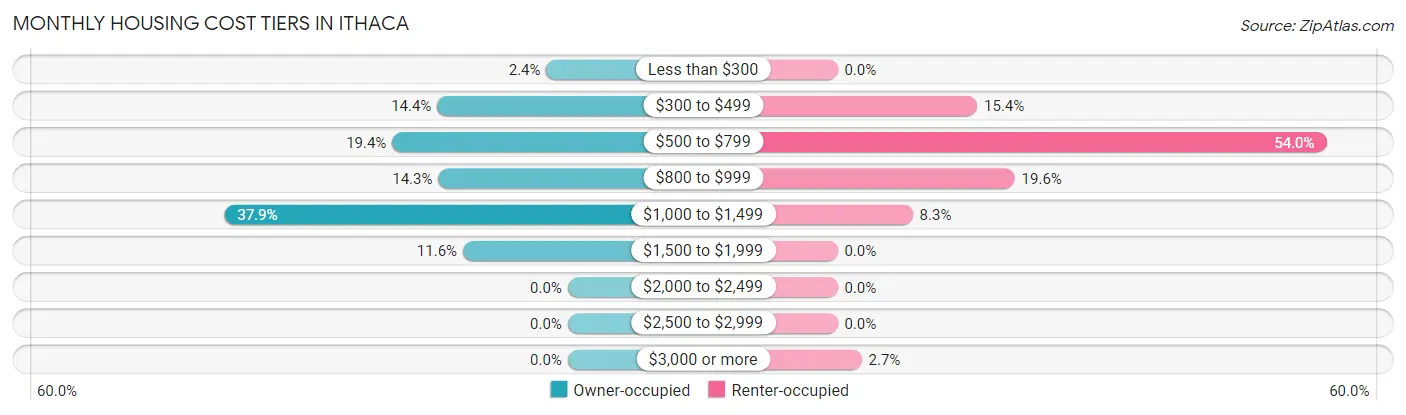
| Monthly Cost | Owner-occupied | Renter-occupied |
| Less than $300 | 20 (2.4%) | 0 (0.0%) |
| $300 to $499 | 122 (14.4%) | 52 (15.4%) |
| $500 to $799 | 164 (19.4%) | 182 (54.0%) |
| $800 to $999 | 121 (14.3%) | 66 (19.6%) |
| $1,000 to $1,499 | 321 (37.9%) | 28 (8.3%) |
| $1,500 to $1,999 | 98 (11.6%) | 0 (0.0%) |
| $2,000 to $2,499 | 0 (0.0%) | 0 (0.0%) |
| $2,500 to $2,999 | 0 (0.0%) | 0 (0.0%) |
| $3,000 or more | 0 (0.0%) | 9 (2.7%) |
| Total | 846 (100.0%) | 337 (100.0%) |
Physical Housing Characteristics in Ithaca
Housing Structures in Ithaca
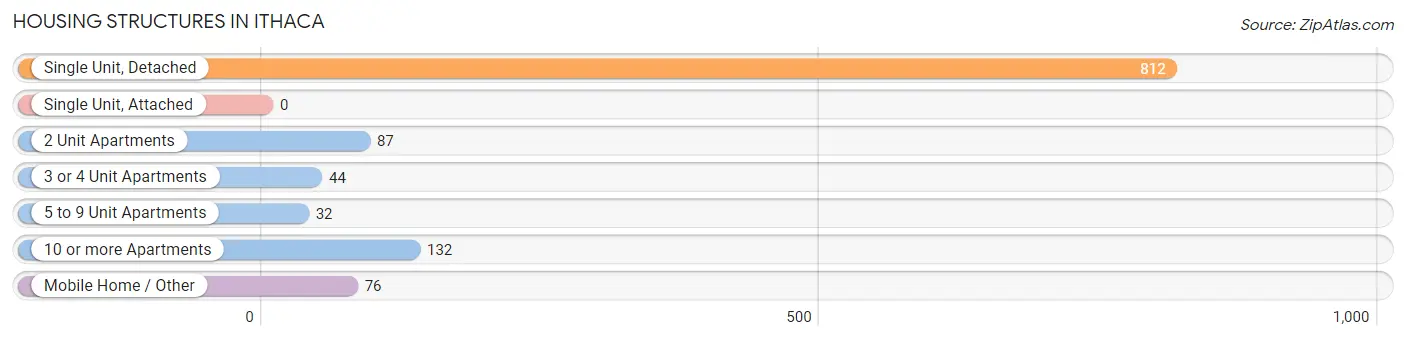
| Structure Type | # Housing Units | % Housing Units |
| Single Unit, Detached | 812 | 68.6% |
| Single Unit, Attached | 0 | 0.0% |
| 2 Unit Apartments | 87 | 7.3% |
| 3 or 4 Unit Apartments | 44 | 3.7% |
| 5 to 9 Unit Apartments | 32 | 2.7% |
| 10 or more Apartments | 132 | 11.2% |
| Mobile Home / Other | 76 | 6.4% |
| Total | 1,183 | 100.0% |
Housing Structures by Occupancy in Ithaca
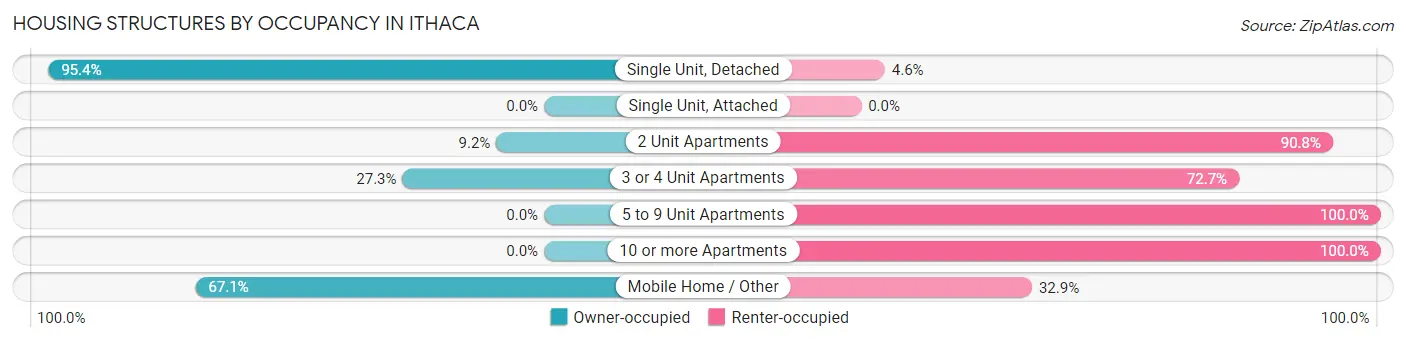
| Structure Type | Owner-occupied | Renter-occupied |
| Single Unit, Detached | 775 (95.4%) | 37 (4.6%) |
| Single Unit, Attached | 0 (0.0%) | 0 (0.0%) |
| 2 Unit Apartments | 8 (9.2%) | 79 (90.8%) |
| 3 or 4 Unit Apartments | 12 (27.3%) | 32 (72.7%) |
| 5 to 9 Unit Apartments | 0 (0.0%) | 32 (100.0%) |
| 10 or more Apartments | 0 (0.0%) | 132 (100.0%) |
| Mobile Home / Other | 51 (67.1%) | 25 (32.9%) |
| Total | 846 (71.5%) | 337 (28.5%) |
Housing Structures by Number of Rooms in Ithaca
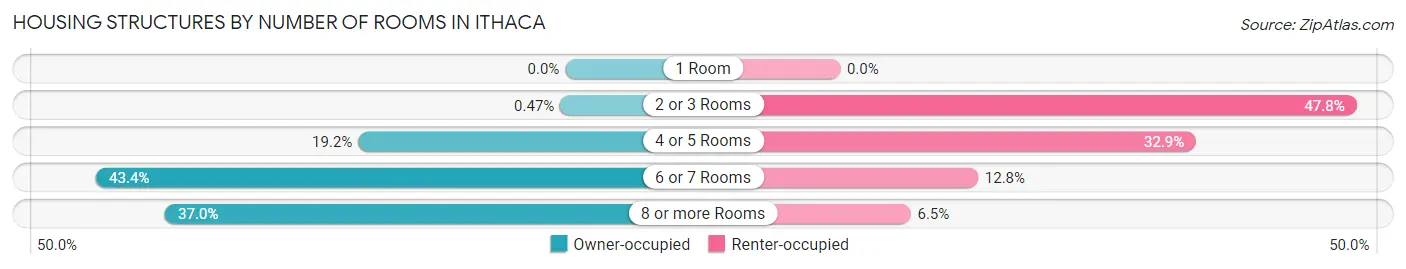
| Number of Rooms | Owner-occupied | Renter-occupied |
| 1 Room | 0 (0.0%) | 0 (0.0%) |
| 2 or 3 Rooms | 4 (0.5%) | 161 (47.8%) |
| 4 or 5 Rooms | 162 (19.2%) | 111 (32.9%) |
| 6 or 7 Rooms | 367 (43.4%) | 43 (12.8%) |
| 8 or more Rooms | 313 (37.0%) | 22 (6.5%) |
| Total | 846 (100.0%) | 337 (100.0%) |
Housing Structure by Heating Type in Ithaca
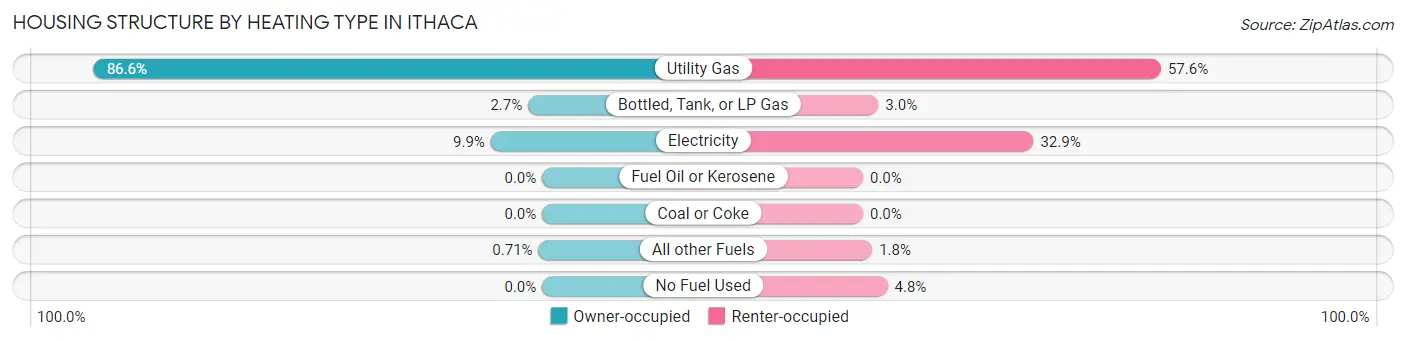
| Heating Type | Owner-occupied | Renter-occupied |
| Utility Gas | 733 (86.6%) | 194 (57.6%) |
| Bottled, Tank, or LP Gas | 23 (2.7%) | 10 (3.0%) |
| Electricity | 84 (9.9%) | 111 (32.9%) |
| Fuel Oil or Kerosene | 0 (0.0%) | 0 (0.0%) |
| Coal or Coke | 0 (0.0%) | 0 (0.0%) |
| All other Fuels | 6 (0.7%) | 6 (1.8%) |
| No Fuel Used | 0 (0.0%) | 16 (4.8%) |
| Total | 846 (100.0%) | 337 (100.0%) |
Household Vehicle Usage in Ithaca
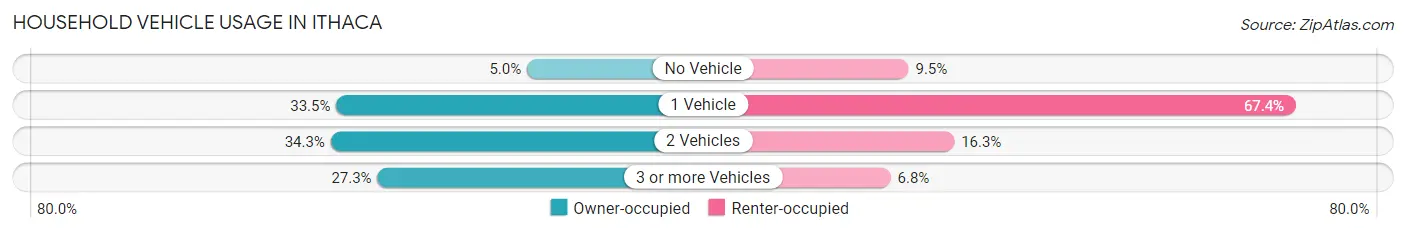
| Vehicles per Household | Owner-occupied | Renter-occupied |
| No Vehicle | 42 (5.0%) | 32 (9.5%) |
| 1 Vehicle | 283 (33.5%) | 227 (67.4%) |
| 2 Vehicles | 290 (34.3%) | 55 (16.3%) |
| 3 or more Vehicles | 231 (27.3%) | 23 (6.8%) |
| Total | 846 (100.0%) | 337 (100.0%) |
Real Estate & Mortgages in Ithaca
Real Estate and Mortgage Overview in Ithaca
| Characteristic | Without Mortgage | With Mortgage |
| Housing Units | 254 | 592 |
| Median Property Value | $113,100 | $135,600 |
| Median Household Income | $42,500 | $77 |
| Monthly Housing Costs | $478 | $0 |
| Real Estate Taxes | $1,783 | $35 |
Property Value by Mortgage Status in Ithaca
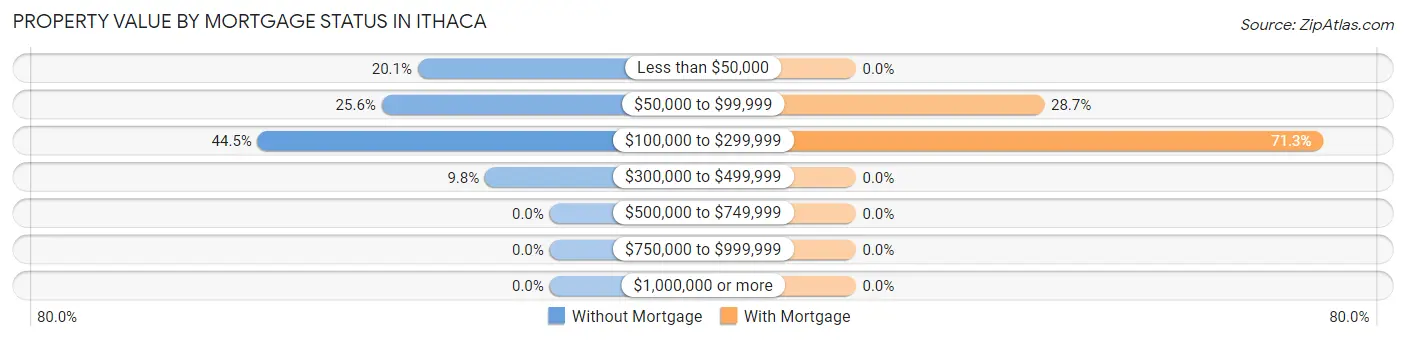
| Property Value | Without Mortgage | With Mortgage |
| Less than $50,000 | 51 (20.1%) | 0 (0.0%) |
| $50,000 to $99,999 | 65 (25.6%) | 170 (28.7%) |
| $100,000 to $299,999 | 113 (44.5%) | 422 (71.3%) |
| $300,000 to $499,999 | 25 (9.8%) | 0 (0.0%) |
| $500,000 to $749,999 | 0 (0.0%) | 0 (0.0%) |
| $750,000 to $999,999 | 0 (0.0%) | 0 (0.0%) |
| $1,000,000 or more | 0 (0.0%) | 0 (0.0%) |
| Total | 254 (100.0%) | 592 (100.0%) |
Household Income by Mortgage Status in Ithaca
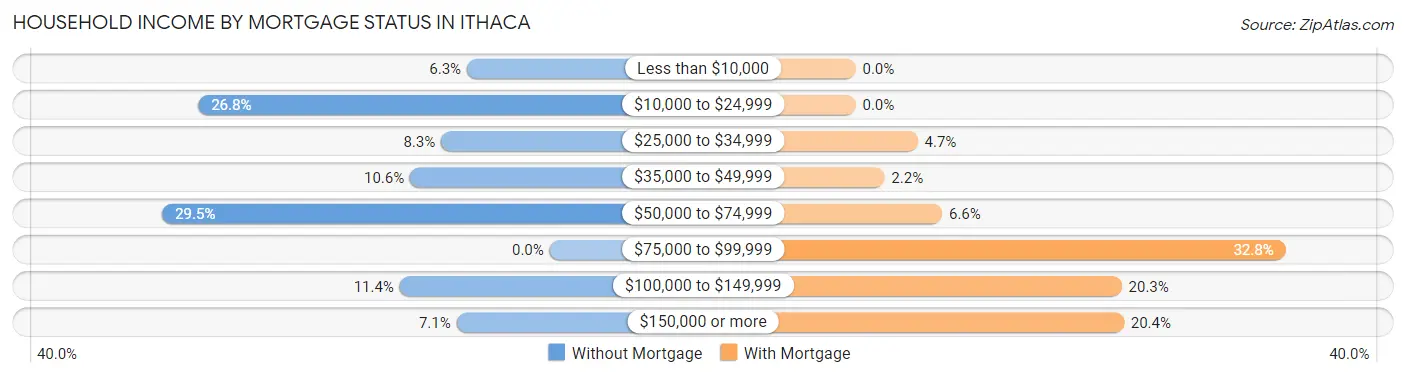
| Household Income | Without Mortgage | With Mortgage |
| Less than $10,000 | 16 (6.3%) | 0 (0.0%) |
| $10,000 to $24,999 | 68 (26.8%) | 0 (0.0%) |
| $25,000 to $34,999 | 21 (8.3%) | 28 (4.7%) |
| $35,000 to $49,999 | 27 (10.6%) | 13 (2.2%) |
| $50,000 to $74,999 | 75 (29.5%) | 39 (6.6%) |
| $75,000 to $99,999 | 0 (0.0%) | 194 (32.8%) |
| $100,000 to $149,999 | 29 (11.4%) | 120 (20.3%) |
| $150,000 or more | 18 (7.1%) | 121 (20.4%) |
| Total | 254 (100.0%) | 592 (100.0%) |
Property Value to Household Income Ratio in Ithaca
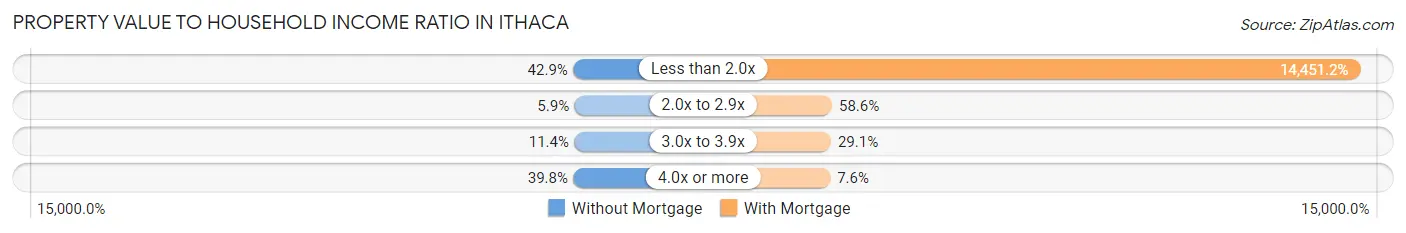
| Value-to-Income Ratio | Without Mortgage | With Mortgage |
| Less than 2.0x | 109 (42.9%) | 85,551 (14,451.2%) |
| 2.0x to 2.9x | 15 (5.9%) | 347 (58.6%) |
| 3.0x to 3.9x | 29 (11.4%) | 172 (29.0%) |
| 4.0x or more | 101 (39.8%) | 45 (7.6%) |
| Total | 254 (100.0%) | 592 (100.0%) |
Real Estate Taxes by Mortgage Status in Ithaca
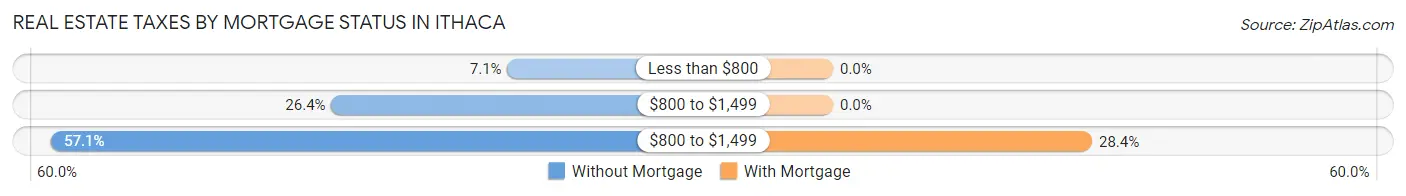
| Property Taxes | Without Mortgage | With Mortgage |
| Less than $800 | 18 (7.1%) | 0 (0.0%) |
| $800 to $1,499 | 67 (26.4%) | 0 (0.0%) |
| $800 to $1,499 | 145 (57.1%) | 168 (28.4%) |
| Total | 254 (100.0%) | 592 (100.0%) |
Health & Disability in Ithaca
Health Insurance Coverage by Age in Ithaca
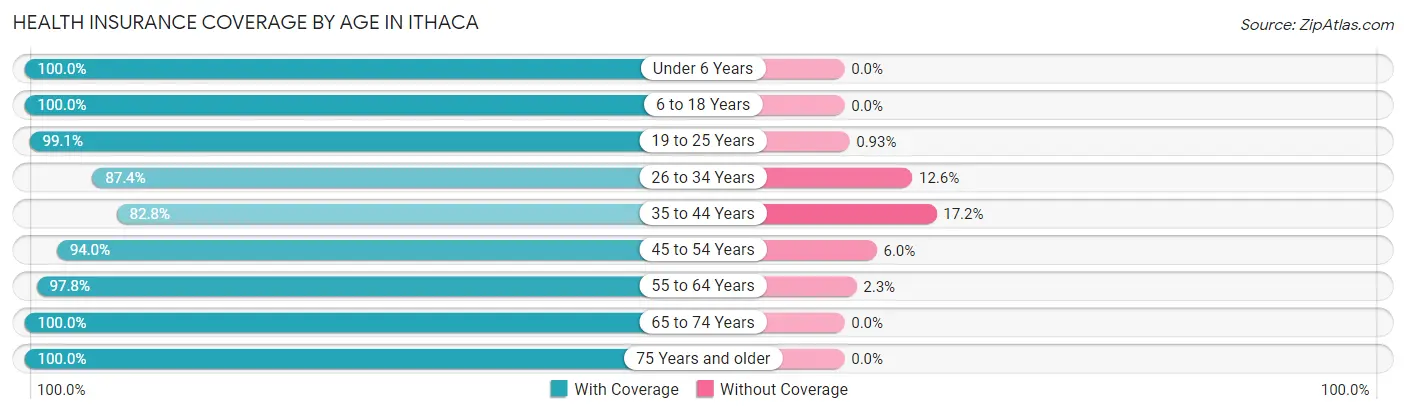
| Age Bracket | With Coverage | Without Coverage |
| Under 6 Years | 237 (100.0%) | 0 (0.0%) |
| 6 to 18 Years | 316 (100.0%) | 0 (0.0%) |
| 19 to 25 Years | 321 (99.1%) | 3 (0.9%) |
| 26 to 34 Years | 311 (87.4%) | 45 (12.6%) |
| 35 to 44 Years | 222 (82.8%) | 46 (17.2%) |
| 45 to 54 Years | 391 (94.0%) | 25 (6.0%) |
| 55 to 64 Years | 478 (97.8%) | 11 (2.2%) |
| 65 to 74 Years | 204 (100.0%) | 0 (0.0%) |
| 75 Years and older | 196 (100.0%) | 0 (0.0%) |
| Total | 2,676 (95.4%) | 130 (4.6%) |
Health Insurance Coverage by Citizenship Status in Ithaca
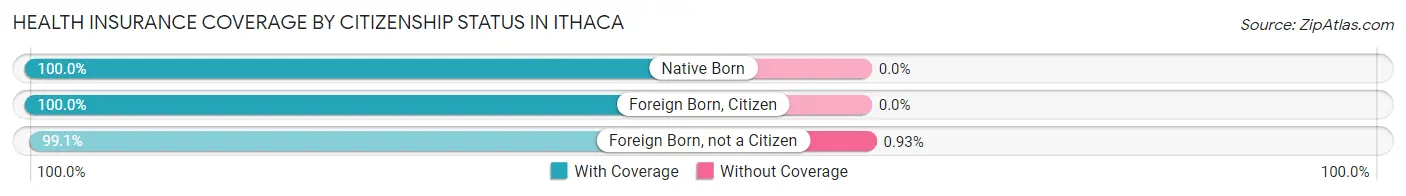
| Citizenship Status | With Coverage | Without Coverage |
| Native Born | 237 (100.0%) | 0 (0.0%) |
| Foreign Born, Citizen | 316 (100.0%) | 0 (0.0%) |
| Foreign Born, not a Citizen | 321 (99.1%) | 3 (0.9%) |
Health Insurance Coverage by Household Income in Ithaca
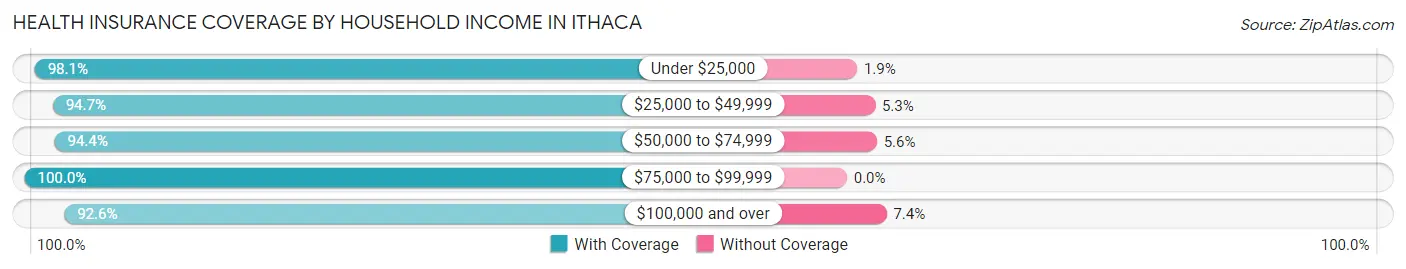
| Household Income | With Coverage | Without Coverage |
| Under $25,000 | 411 (98.1%) | 8 (1.9%) |
| $25,000 to $49,999 | 377 (94.7%) | 21 (5.3%) |
| $50,000 to $74,999 | 622 (94.4%) | 37 (5.6%) |
| $75,000 to $99,999 | 404 (100.0%) | 0 (0.0%) |
| $100,000 and over | 797 (92.6%) | 64 (7.4%) |
Public vs Private Health Insurance Coverage by Age in Ithaca
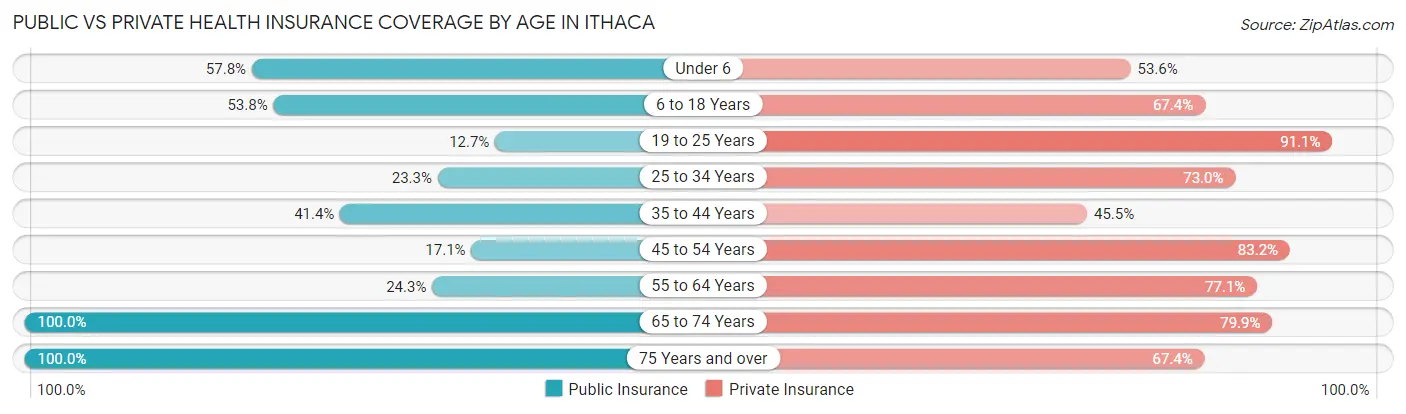
| Age Bracket | Public Insurance | Private Insurance |
| Under 6 | 137 (57.8%) | 127 (53.6%) |
| 6 to 18 Years | 170 (53.8%) | 213 (67.4%) |
| 19 to 25 Years | 41 (12.7%) | 295 (91.0%) |
| 25 to 34 Years | 83 (23.3%) | 260 (73.0%) |
| 35 to 44 Years | 111 (41.4%) | 122 (45.5%) |
| 45 to 54 Years | 71 (17.1%) | 346 (83.2%) |
| 55 to 64 Years | 119 (24.3%) | 377 (77.1%) |
| 65 to 74 Years | 204 (100.0%) | 163 (79.9%) |
| 75 Years and over | 196 (100.0%) | 132 (67.3%) |
| Total | 1,132 (40.3%) | 2,035 (72.5%) |
Disability Status by Sex by Age in Ithaca
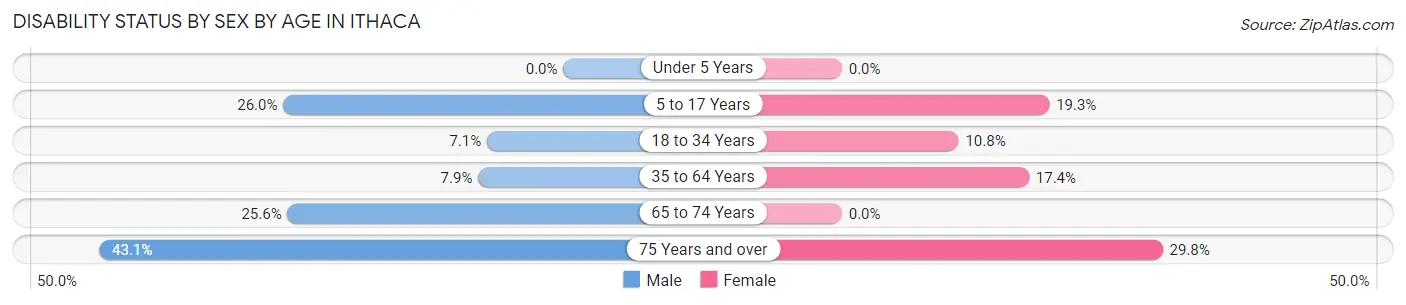
| Age Bracket | Male | Female |
| Under 5 Years | 0 (0.0%) | 0 (0.0%) |
| 5 to 17 Years | 46 (26.0%) | 31 (19.3%) |
| 18 to 34 Years | 24 (7.1%) | 39 (10.8%) |
| 35 to 64 Years | 49 (7.9%) | 96 (17.4%) |
| 65 to 74 Years | 32 (25.6%) | 0 (0.0%) |
| 75 Years and over | 28 (43.1%) | 39 (29.8%) |
Disability Class by Sex by Age in Ithaca
Disability Class: Hearing Difficulty
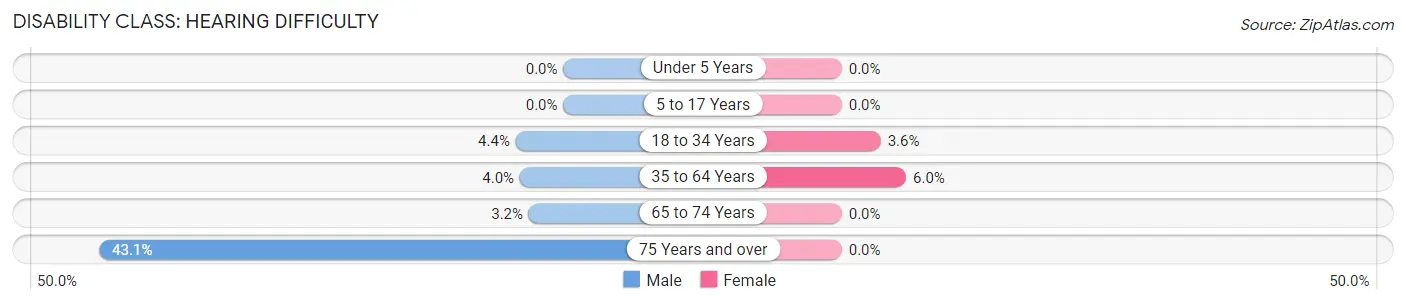
| Age Bracket | Male | Female |
| Under 5 Years | 0 (0.0%) | 0 (0.0%) |
| 5 to 17 Years | 0 (0.0%) | 0 (0.0%) |
| 18 to 34 Years | 15 (4.4%) | 13 (3.6%) |
| 35 to 64 Years | 25 (4.0%) | 33 (6.0%) |
| 65 to 74 Years | 4 (3.2%) | 0 (0.0%) |
| 75 Years and over | 28 (43.1%) | 0 (0.0%) |
Disability Class: Vision Difficulty
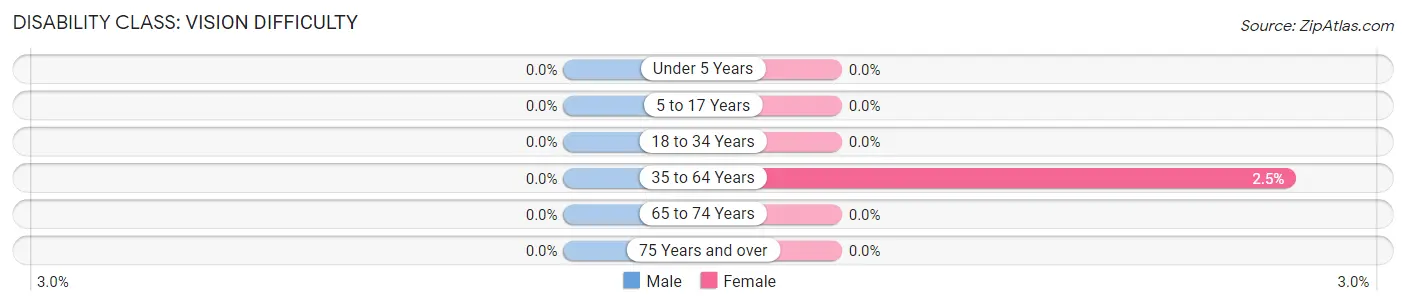
| Age Bracket | Male | Female |
| Under 5 Years | 0 (0.0%) | 0 (0.0%) |
| 5 to 17 Years | 0 (0.0%) | 0 (0.0%) |
| 18 to 34 Years | 0 (0.0%) | 0 (0.0%) |
| 35 to 64 Years | 0 (0.0%) | 14 (2.5%) |
| 65 to 74 Years | 0 (0.0%) | 0 (0.0%) |
| 75 Years and over | 0 (0.0%) | 0 (0.0%) |
Disability Class: Cognitive Difficulty
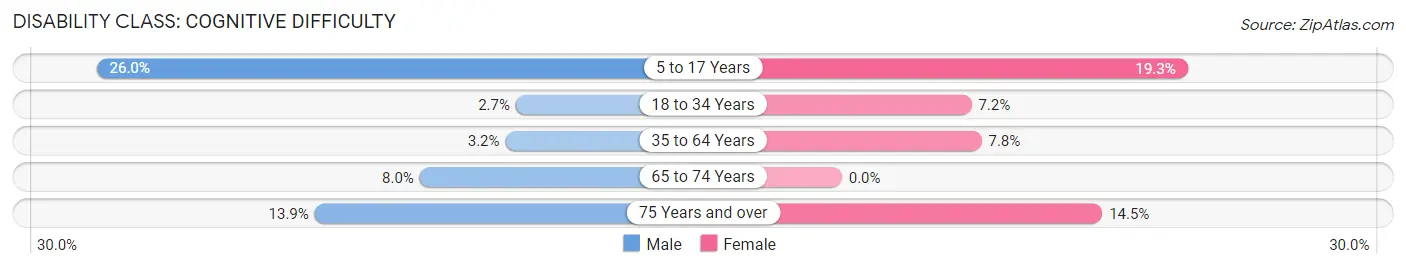
| Age Bracket | Male | Female |
| 5 to 17 Years | 46 (26.0%) | 31 (19.3%) |
| 18 to 34 Years | 9 (2.6%) | 26 (7.2%) |
| 35 to 64 Years | 20 (3.2%) | 43 (7.8%) |
| 65 to 74 Years | 10 (8.0%) | 0 (0.0%) |
| 75 Years and over | 9 (13.9%) | 19 (14.5%) |
Disability Class: Ambulatory Difficulty
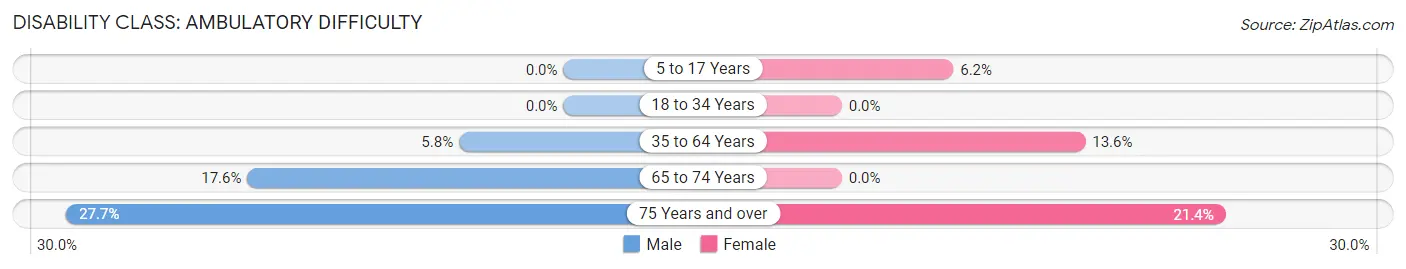
| Age Bracket | Male | Female |
| 5 to 17 Years | 0 (0.0%) | 10 (6.2%) |
| 18 to 34 Years | 0 (0.0%) | 0 (0.0%) |
| 35 to 64 Years | 36 (5.8%) | 75 (13.6%) |
| 65 to 74 Years | 22 (17.6%) | 0 (0.0%) |
| 75 Years and over | 18 (27.7%) | 28 (21.4%) |
Disability Class: Self-Care Difficulty
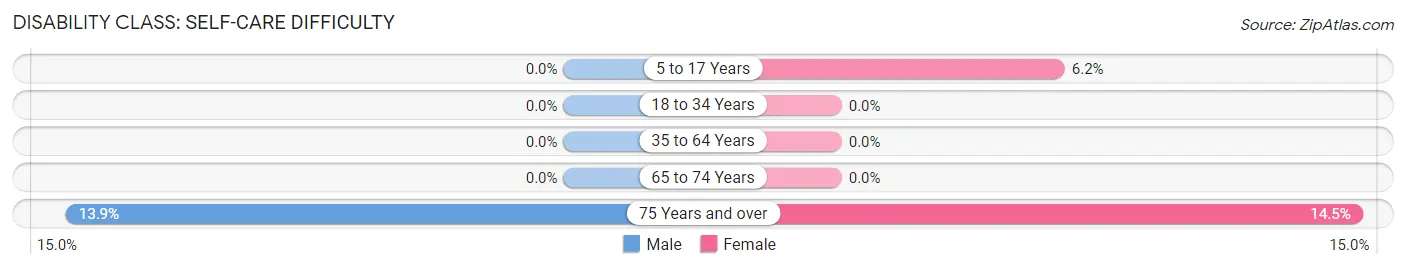
| Age Bracket | Male | Female |
| 5 to 17 Years | 0 (0.0%) | 10 (6.2%) |
| 18 to 34 Years | 0 (0.0%) | 0 (0.0%) |
| 35 to 64 Years | 0 (0.0%) | 0 (0.0%) |
| 65 to 74 Years | 0 (0.0%) | 0 (0.0%) |
| 75 Years and over | 9 (13.9%) | 19 (14.5%) |
Technology Access in Ithaca
Computing Device Access in Ithaca
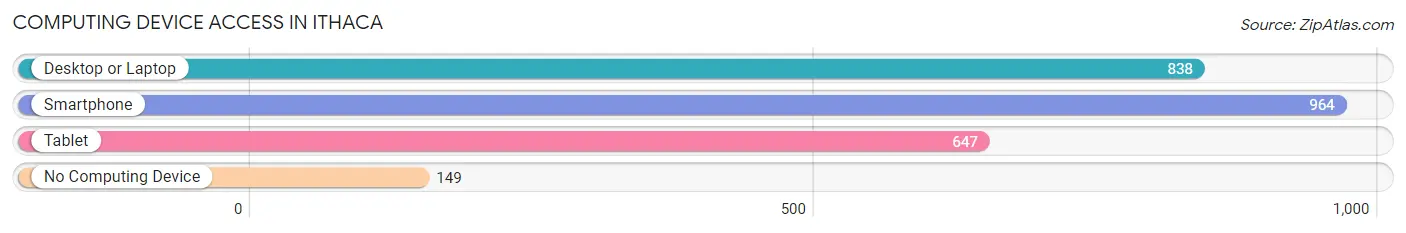
| Device Type | # Households | % Households |
| Desktop or Laptop | 838 | 70.8% |
| Smartphone | 964 | 81.5% |
| Tablet | 647 | 54.7% |
| No Computing Device | 149 | 12.6% |
| Total | 1,183 | 100.0% |
Internet Access in Ithaca
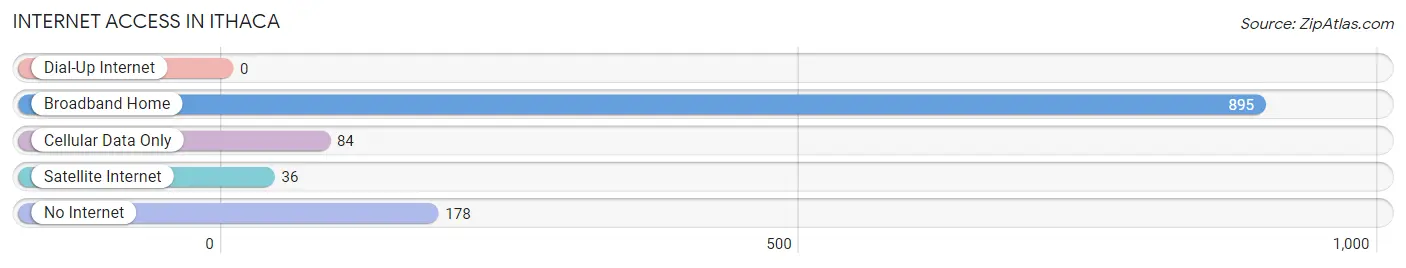
| Internet Type | # Households | % Households |
| Dial-Up Internet | 0 | 0.0% |
| Broadband Home | 895 | 75.7% |
| Cellular Data Only | 84 | 7.1% |
| Satellite Internet | 36 | 3.0% |
| No Internet | 178 | 15.0% |
| Total | 1,183 | 100.0% |
Ithaca Summary
Ithaca is a small city located in Gratiot County, Michigan. It is situated in the middle of the state, about halfway between Lansing and Saginaw. The city is home to a population of 3,072 people, according to the 2010 census.
History
Ithaca was founded in 1854 by a group of settlers from New York. The city was named after the Greek island of Ithaca, which was the home of the legendary hero Odysseus. The settlers were attracted to the area by the abundance of timber and the potential for farming.
The first settlers built a sawmill and a gristmill, and the city quickly grew. By 1859, Ithaca had a population of over 500 people. The city was incorporated in 1871, and the first mayor was elected in 1872.
In the late 19th century, Ithaca was a major center for the lumber industry. The city was home to several sawmills and lumber yards, and the surrounding area was heavily logged. The city also had a thriving agricultural industry, with several farms and orchards in the area.
Geography
Ithaca is located in the middle of Michigan, about halfway between Lansing and Saginaw. The city is situated on the banks of the Pine River, which flows through the city and into the nearby Lake Huron.
The city is surrounded by rolling hills and farmland. The terrain is mostly flat, with some areas of higher elevation. The city is located in a temperate climate zone, with hot summers and cold winters.
Economy
Ithaca’s economy is largely based on agriculture and manufacturing. The city is home to several farms and orchards, and the surrounding area is heavily logged. The city also has several manufacturing plants, including a paper mill and a plastics factory.
The city is also home to several small businesses, including restaurants, retail stores, and service providers. The city is also home to a branch of the Michigan State University Extension Service, which provides educational and research services to the local community.
Demographics
According to the 2010 census, Ithaca has a population of 3,072 people. The population is predominantly white (94.3%), with small percentages of African American (2.2%), Hispanic (1.7%), and Asian (0.8%) residents. The median household income is $37,941, and the median age is 40.
The city is home to several churches, including the First Presbyterian Church, the First United Methodist Church, and the Church of the Nazarene. The city also has several schools, including Ithaca High School, Ithaca Middle School, and Ithaca Elementary School.
Conclusion
Ithaca is a small city located in Gratiot County, Michigan. It is situated in the middle of the state, about halfway between Lansing and Saginaw. The city is home to a population of 3,072 people, according to the 2010 census. The city’s economy is largely based on agriculture and manufacturing, and the city is home to several small businesses. The population is predominantly white, with small percentages of African American, Hispanic, and Asian residents. Ithaca is home to several churches and schools, and the city is served by the Michigan State University Extension Service.
Common Questions
What is Per Capita Income in Ithaca?
Per Capita income in Ithaca is $30,666.
What is the Median Family Income in Ithaca?
Median Family Income in Ithaca is $74,861.
What is the Median Household income in Ithaca?
Median Household Income in Ithaca is $60,389.
What is Income or Wage Gap in Ithaca?
Income or Wage Gap in Ithaca is 20.4%.
Women in Ithaca earn 79.6 cents for every dollar earned by a man.
What is Inequality or Gini Index in Ithaca?
Inequality or Gini Index in Ithaca is 0.41.
What is the Total Population of Ithaca?
Total Population of Ithaca is 2,840.
What is the Total Male Population of Ithaca?
Total Male Population of Ithaca is 1,500.
What is the Total Female Population of Ithaca?
Total Female Population of Ithaca is 1,340.
What is the Ratio of Males per 100 Females in Ithaca?
There are 111.94 Males per 100 Females in Ithaca.
What is the Ratio of Females per 100 Males in Ithaca?
There are 89.33 Females per 100 Males in Ithaca.
What is the Median Population Age in Ithaca?
Median Population Age in Ithaca is 42.2 Years.
What is the Average Family Size in Ithaca
Average Family Size in Ithaca is 2.8 People.
What is the Average Household Size in Ithaca
Average Household Size in Ithaca is 2.3 People.
How Large is the Labor Force in Ithaca?
There are 1,597 People in the Labor Forcein in Ithaca.
What is the Percentage of People in the Labor Force in Ithaca?
66.4% of People are in the Labor Force in Ithaca.
What is the Unemployment Rate in Ithaca?
Unemployment Rate in Ithaca is 0.8%.