Iron River, MI Map & Demographics
Iron River Map
Iron River Overview
$26,206
PER CAPITA INCOME
$68,241
AVG FAMILY INCOME
$48,333
AVG HOUSEHOLD INCOME
9.2%
WAGE / INCOME GAP [ % ]
90.8¢/ $1
WAGE / INCOME GAP [ $ ]
$16,376
FAMILY INCOME DEFICIT
0.40
INEQUALITY / GINI INDEX
2,995
TOTAL POPULATION
1,456
MALE POPULATION
1,539
FEMALE POPULATION
94.61
MALES / 100 FEMALES
105.70
FEMALES / 100 MALES
41.3
MEDIAN AGE
2.9
AVG FAMILY SIZE
2.3
AVG HOUSEHOLD SIZE
1,511
LABOR FORCE [ PEOPLE ]
60.7%
PERCENT IN LABOR FORCE
4.2%
UNEMPLOYMENT RATE
Iron River Zip Codes
Iron River Area Codes
Income in Iron River
Income Overview in Iron River
Per Capita Income in Iron River is $26,206, while median incomes of families and households are $68,241 and $48,333 respectively.
| Characteristic | Number | Measure |
| Per Capita Income | 2,995 | $26,206 |
| Median Family Income | 766 | $68,241 |
| Mean Family Income | 766 | $73,413 |
| Median Household Income | 1,286 | $48,333 |
| Mean Household Income | 1,286 | $59,658 |
| Income Deficit | 766 | $16,376 |
| Wage / Income Gap (%) | 2,995 | 9.22% |
| Wage / Income Gap ($) | 2,995 | 90.78¢ per $1 |
| Gini / Inequality Index | 2,995 | 0.40 |
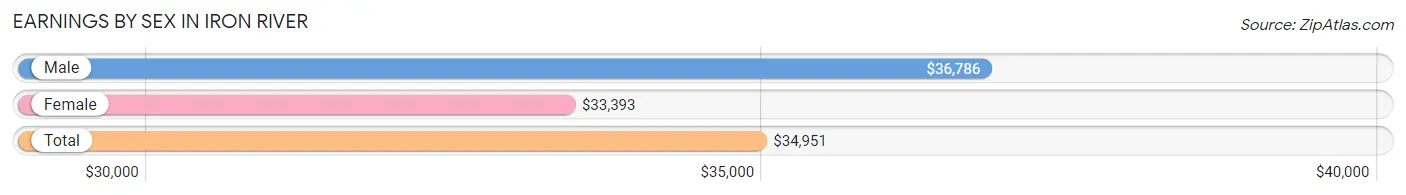
Earnings by Sex in Iron River
Average Earnings in Iron River are $34,951, $36,786 for men and $33,393 for women, a difference of 9.2%.
| Sex | Number | Average Earnings |
| Male | 832 (52.6%) | $36,786 |
| Female | 749 (47.4%) | $33,393 |
| Total | 1,581 (100.0%) | $34,951 |
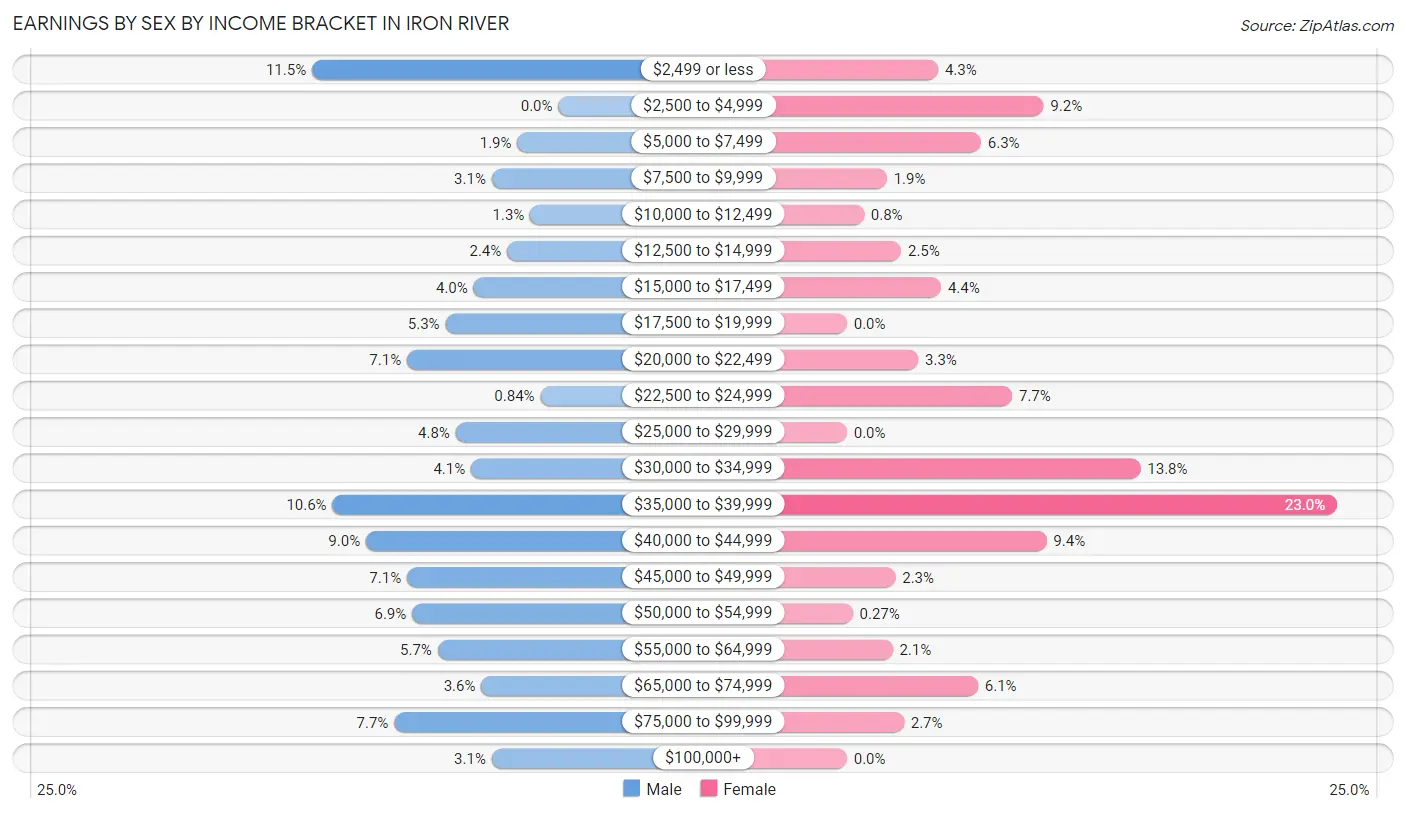
Earnings by Sex by Income Bracket in Iron River
The most common earnings brackets in Iron River are $2,499 or less for men (96 | 11.5%) and $35,000 to $39,999 for women (172 | 23.0%).
| Income | Male | Female |
| $2,499 or less | 96 (11.5%) | 32 (4.3%) |
| $2,500 to $4,999 | 0 (0.0%) | 69 (9.2%) |
| $5,000 to $7,499 | 16 (1.9%) | 47 (6.3%) |
| $7,500 to $9,999 | 26 (3.1%) | 14 (1.9%) |
| $10,000 to $12,499 | 11 (1.3%) | 6 (0.8%) |
| $12,500 to $14,999 | 20 (2.4%) | 19 (2.5%) |
| $15,000 to $17,499 | 33 (4.0%) | 33 (4.4%) |
| $17,500 to $19,999 | 44 (5.3%) | 0 (0.0%) |
| $20,000 to $22,499 | 59 (7.1%) | 25 (3.3%) |
| $22,500 to $24,999 | 7 (0.8%) | 58 (7.7%) |
| $25,000 to $29,999 | 40 (4.8%) | 0 (0.0%) |
| $30,000 to $34,999 | 34 (4.1%) | 103 (13.8%) |
| $35,000 to $39,999 | 88 (10.6%) | 172 (23.0%) |
| $40,000 to $44,999 | 75 (9.0%) | 70 (9.3%) |
| $45,000 to $49,999 | 59 (7.1%) | 17 (2.3%) |
| $50,000 to $54,999 | 57 (6.9%) | 2 (0.3%) |
| $55,000 to $64,999 | 47 (5.7%) | 16 (2.1%) |
| $65,000 to $74,999 | 30 (3.6%) | 46 (6.1%) |
| $75,000 to $99,999 | 64 (7.7%) | 20 (2.7%) |
| $100,000+ | 26 (3.1%) | 0 (0.0%) |
| Total | 832 (100.0%) | 749 (100.0%) |
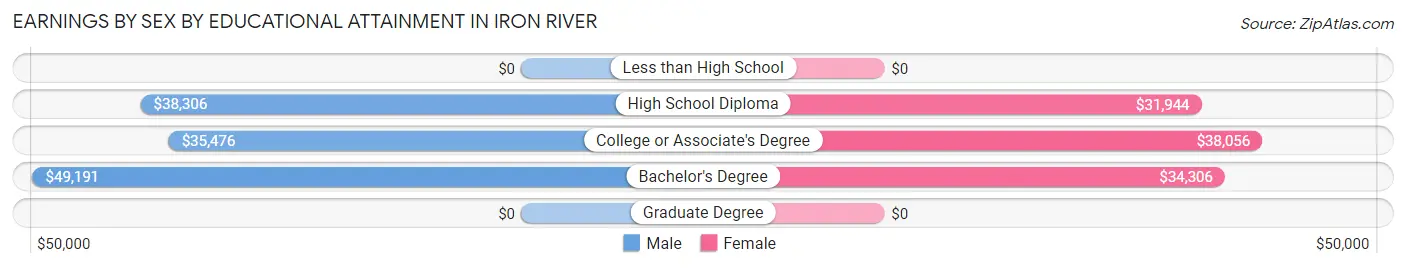
Earnings by Sex by Educational Attainment in Iron River
Average earnings in Iron River are $38,777 for men and $33,010 for women, a difference of 14.9%. Men with an educational attainment of bachelor's degree enjoy the highest average annual earnings of $49,191, while those with college or associate's degree education earn the least with $35,476. Women with an educational attainment of college or associate's degree earn the most with the average annual earnings of $38,056, while those with high school diploma education have the smallest earnings of $31,944.
| Educational Attainment | Male Income | Female Income |
| Less than High School | - | - |
| High School Diploma | $38,306 | $31,944 |
| College or Associate's Degree | $35,476 | $38,056 |
| Bachelor's Degree | $49,191 | $34,306 |
| Graduate Degree | - | - |
| Total | $38,777 | $33,010 |
Family Income in Iron River
Family Income Brackets in Iron River
According to the Iron River family income data, there are 182 families falling into the $50,000 to $74,999 income range, which is the most common income bracket and makes up 23.8% of all families.
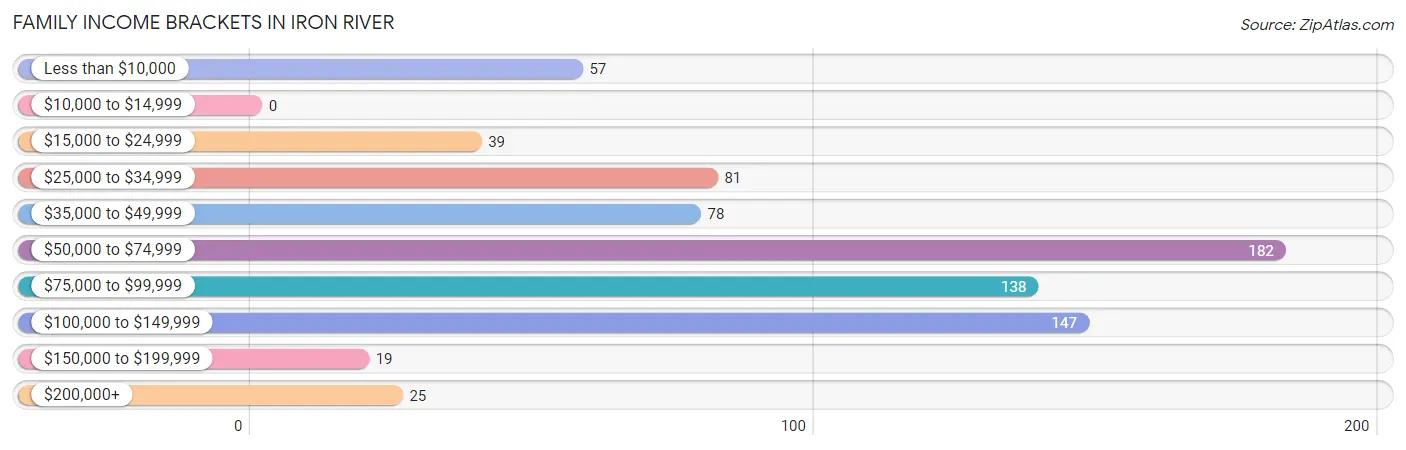
| Income Bracket | # Families | % Families |
| Less than $10,000 | 57 | 7.4% |
| $10,000 to $14,999 | 0 | 0.0% |
| $15,000 to $24,999 | 39 | 5.1% |
| $25,000 to $34,999 | 81 | 10.6% |
| $35,000 to $49,999 | 78 | 10.2% |
| $50,000 to $74,999 | 182 | 23.8% |
| $75,000 to $99,999 | 138 | 18.0% |
| $100,000 to $149,999 | 147 | 19.2% |
| $150,000 to $199,999 | 19 | 2.5% |
| $200,000+ | 25 | 3.3% |
Family Income by Famaliy Size in Iron River
3-person families (192 | 25.1%) account for the highest median family income in Iron River with $74,554 per family, while 2-person families (428 | 55.9%) have the highest median income of $33,560 per family member.
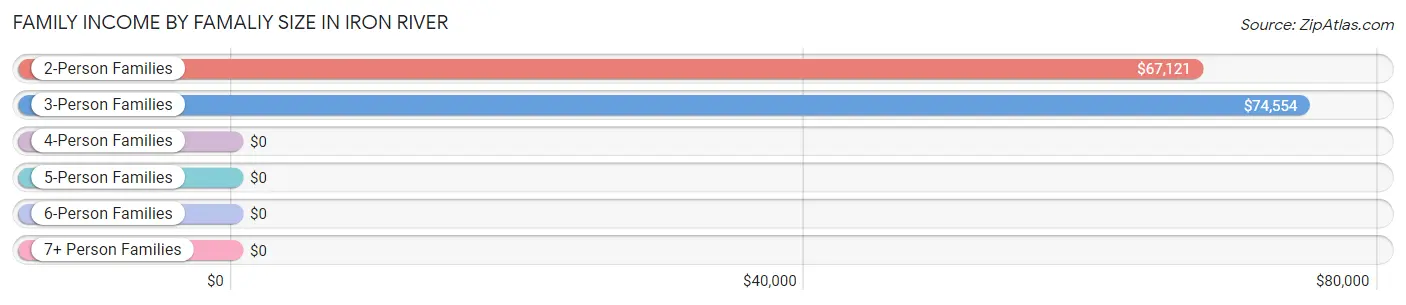
| Income Bracket | # Families | Median Income |
| 2-Person Families | 428 (55.9%) | $67,121 |
| 3-Person Families | 192 (25.1%) | $74,554 |
| 4-Person Families | 82 (10.7%) | $0 |
| 5-Person Families | 25 (3.3%) | $0 |
| 6-Person Families | 39 (5.1%) | $0 |
| 7+ Person Families | 0 (0.0%) | $0 |
| Total | 766 (100.0%) | $68,241 |
Family Income by Number of Earners in Iron River
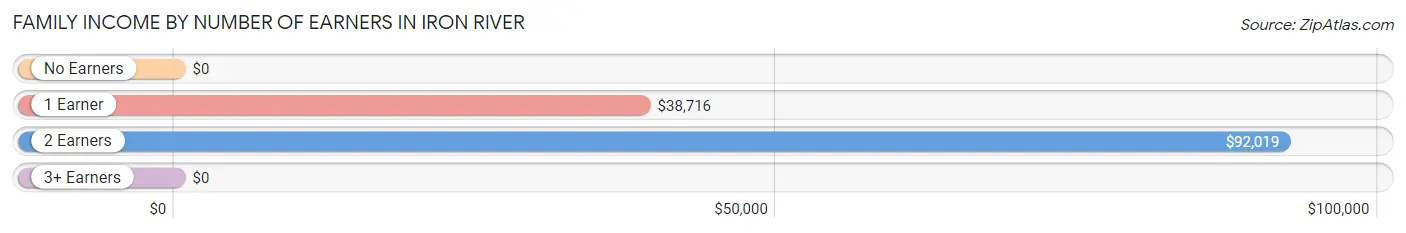
| Number of Earners | # Families | Median Income |
| No Earners | 152 (19.8%) | $0 |
| 1 Earner | 232 (30.3%) | $38,716 |
| 2 Earners | 352 (46.0%) | $92,019 |
| 3+ Earners | 30 (3.9%) | $0 |
| Total | 766 (100.0%) | $68,241 |
Household Income in Iron River
Household Income Brackets in Iron River
With 207 households falling in the category, the $50,000 to $74,999 income range is the most frequent in Iron River, accounting for 16.1% of all households. In contrast, only 24 households (1.9%) fall into the $200,000+ income bracket, making it the least populous group.
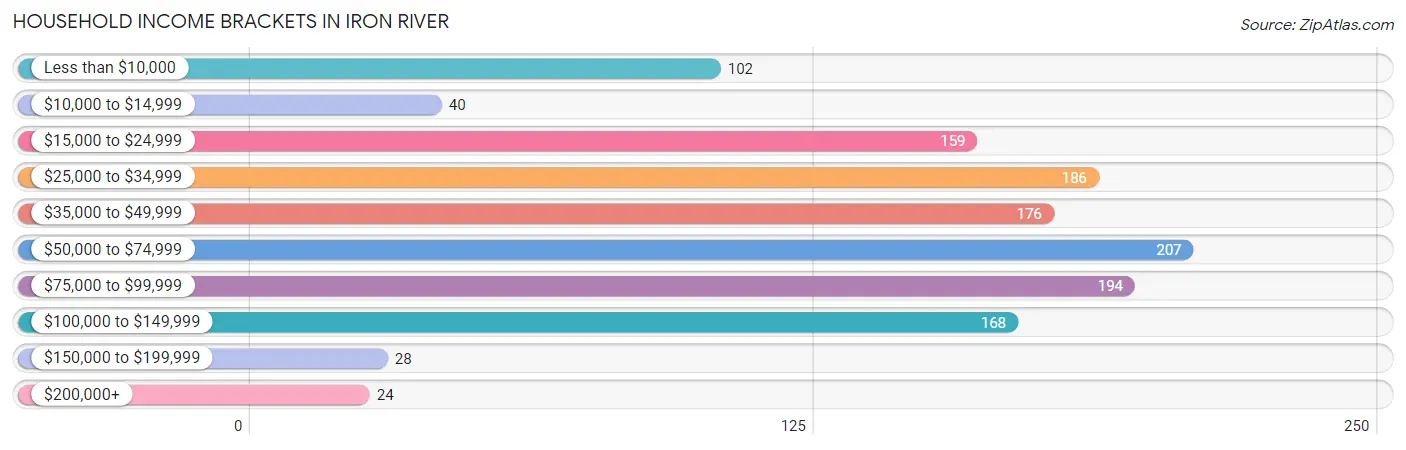
| Income Bracket | # Households | % Households |
| Less than $10,000 | 102 | 7.9% |
| $10,000 to $14,999 | 40 | 3.1% |
| $15,000 to $24,999 | 159 | 12.4% |
| $25,000 to $34,999 | 186 | 14.5% |
| $35,000 to $49,999 | 176 | 13.7% |
| $50,000 to $74,999 | 207 | 16.1% |
| $75,000 to $99,999 | 194 | 15.1% |
| $100,000 to $149,999 | 168 | 13.1% |
| $150,000 to $199,999 | 28 | 2.2% |
| $200,000+ | 24 | 1.9% |
Household Income by Householder Age in Iron River
The median household income in Iron River is $48,333, with the highest median household income of $65,673 found in the 25 to 44 years age bracket for the primary householder. A total of 293 households (22.8%) fall into this category. Meanwhile, the 15 to 24 years age bracket for the primary householder has the lowest median household income of $0, with 94 households (7.3%) in this group.
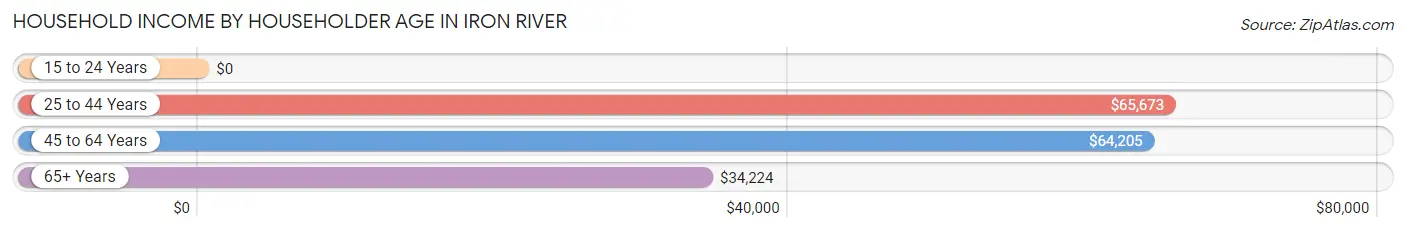
| Income Bracket | # Households | Median Income |
| 15 to 24 Years | 94 (7.3%) | $0 |
| 25 to 44 Years | 293 (22.8%) | $65,673 |
| 45 to 64 Years | 549 (42.7%) | $64,205 |
| 65+ Years | 350 (27.2%) | $34,224 |
| Total | 1,286 (100.0%) | $48,333 |
Poverty in Iron River
Income Below Poverty by Sex and Age in Iron River
With 12.0% poverty level for males and 21.1% for females among the residents of Iron River, under 5 year old males and under 5 year old females are the most vulnerable to poverty, with 59 males (60.2%) and 59 females (60.8%) in their respective age groups living below the poverty level.
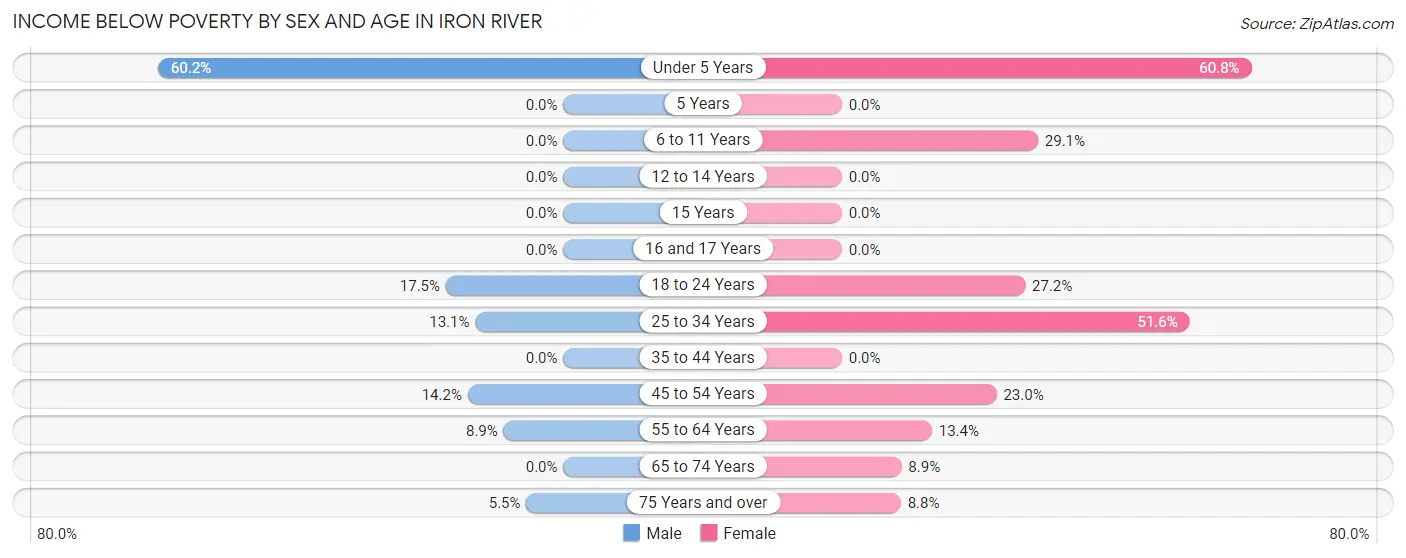
| Age Bracket | Male | Female |
| Under 5 Years | 59 (60.2%) | 59 (60.8%) |
| 5 Years | 0 (0.0%) | 0 (0.0%) |
| 6 to 11 Years | 0 (0.0%) | 46 (29.1%) |
| 12 to 14 Years | 0 (0.0%) | 0 (0.0%) |
| 15 Years | 0 (0.0%) | 0 (0.0%) |
| 16 and 17 Years | 0 (0.0%) | 0 (0.0%) |
| 18 to 24 Years | 41 (17.4%) | 37 (27.2%) |
| 25 to 34 Years | 20 (13.1%) | 79 (51.6%) |
| 35 to 44 Years | 0 (0.0%) | 0 (0.0%) |
| 45 to 54 Years | 24 (14.2%) | 34 (23.0%) |
| 55 to 64 Years | 26 (8.9%) | 35 (13.4%) |
| 65 to 74 Years | 0 (0.0%) | 17 (8.8%) |
| 75 Years and over | 5 (5.5%) | 7 (8.7%) |
| Total | 175 (12.0%) | 314 (21.1%) |
Income Above Poverty by Sex and Age in Iron River
According to the poverty statistics in Iron River, males aged 6 to 11 years and females aged 12 to 14 years are the age groups that are most secure financially, with 100.0% of males and 100.0% of females in these age groups living above the poverty line.
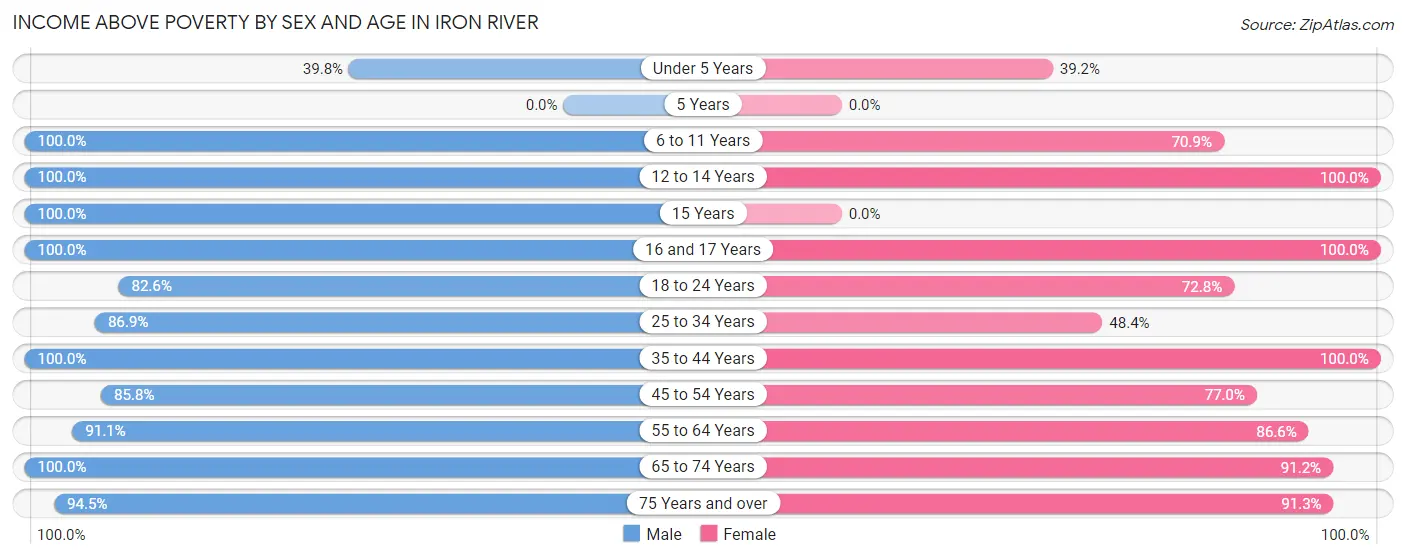
| Age Bracket | Male | Female |
| Under 5 Years | 39 (39.8%) | 38 (39.2%) |
| 5 Years | 0 (0.0%) | 0 (0.0%) |
| 6 to 11 Years | 57 (100.0%) | 112 (70.9%) |
| 12 to 14 Years | 39 (100.0%) | 30 (100.0%) |
| 15 Years | 25 (100.0%) | 0 (0.0%) |
| 16 and 17 Years | 35 (100.0%) | 36 (100.0%) |
| 18 to 24 Years | 194 (82.6%) | 99 (72.8%) |
| 25 to 34 Years | 133 (86.9%) | 74 (48.4%) |
| 35 to 44 Years | 139 (100.0%) | 197 (100.0%) |
| 45 to 54 Years | 145 (85.8%) | 114 (77.0%) |
| 55 to 64 Years | 267 (91.1%) | 227 (86.6%) |
| 65 to 74 Years | 118 (100.0%) | 175 (91.1%) |
| 75 Years and over | 86 (94.5%) | 73 (91.2%) |
| Total | 1,277 (87.9%) | 1,175 (78.9%) |
Income Below Poverty Among Married-Couple Families in Iron River
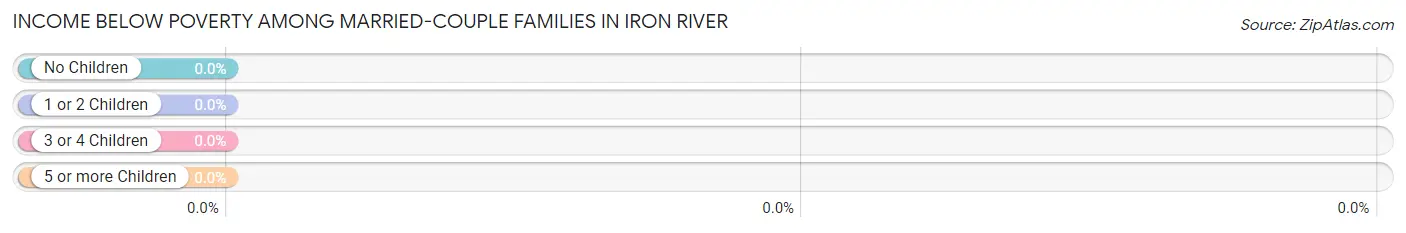
| Children | Above Poverty | Below Poverty |
| No Children | 392 (100.0%) | 0 (0.0%) |
| 1 or 2 Children | 50 (100.0%) | 0 (0.0%) |
| 3 or 4 Children | 38 (100.0%) | 0 (0.0%) |
| 5 or more Children | 0 (0.0%) | 0 (0.0%) |
| Total | 480 (100.0%) | 0 (0.0%) |
Income Below Poverty Among Single-Parent Households in Iron River
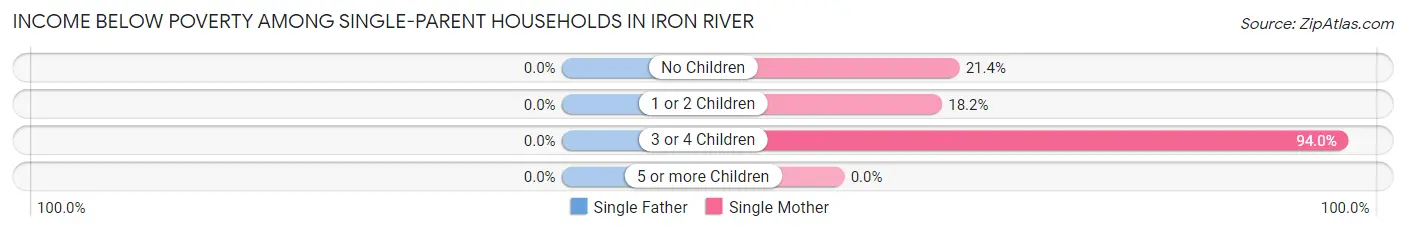
| Children | Single Father | Single Mother |
| No Children | 0 (0.0%) | 9 (21.4%) |
| 1 or 2 Children | 0 (0.0%) | 20 (18.2%) |
| 3 or 4 Children | 0 (0.0%) | 63 (94.0%) |
| 5 or more Children | 0 (0.0%) | 0 (0.0%) |
| Total | 0 (0.0%) | 92 (42.0%) |
Income Below Poverty Among Married-Couple vs Single-Parent Households in Iron River
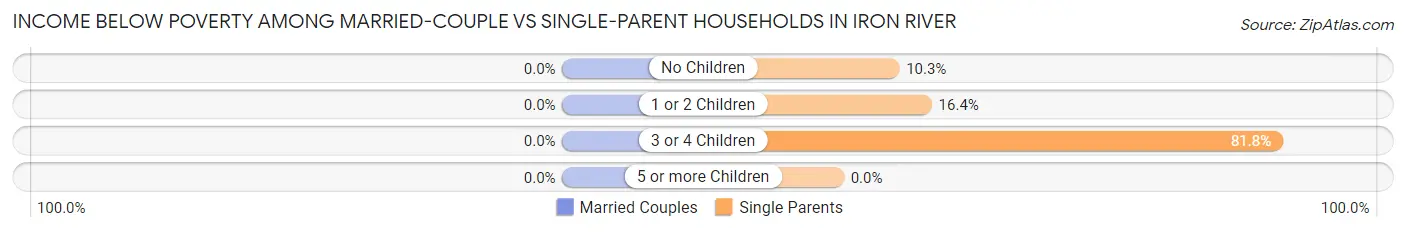
| Children | Married-Couple Families | Single-Parent Households |
| No Children | 0 (0.0%) | 9 (10.3%) |
| 1 or 2 Children | 0 (0.0%) | 20 (16.4%) |
| 3 or 4 Children | 0 (0.0%) | 63 (81.8%) |
| 5 or more Children | 0 (0.0%) | 0 (0.0%) |
| Total | 0 (0.0%) | 92 (32.2%) |
Race in Iron River
The most populous races in Iron River are White / Caucasian (2,831 | 94.5%), Hispanic or Latino (124 | 4.1%), and Two or more Races (105 | 3.5%).
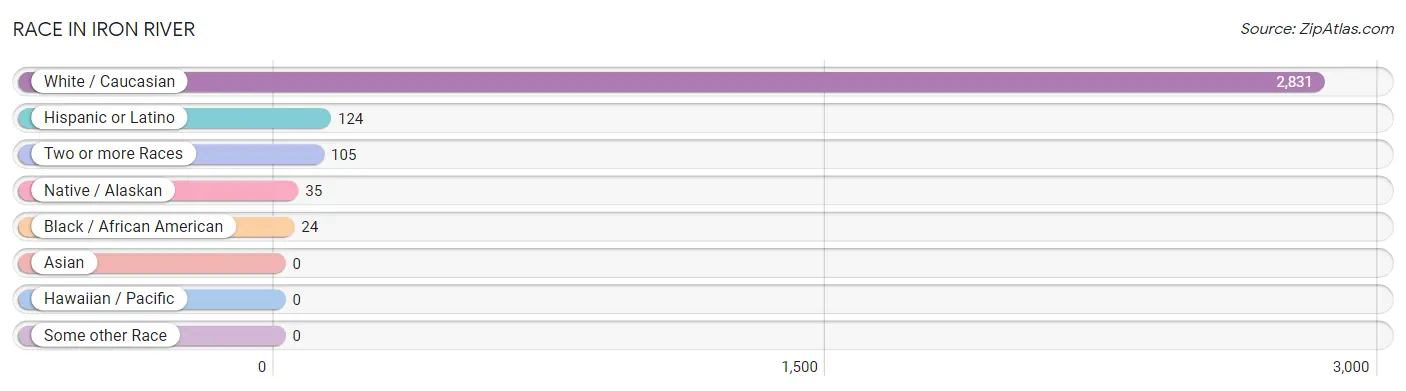
| Race | # Population | % Population |
| Asian | 0 | 0.0% |
| Black / African American | 24 | 0.8% |
| Hawaiian / Pacific | 0 | 0.0% |
| Hispanic or Latino | 124 | 4.1% |
| Native / Alaskan | 35 | 1.2% |
| White / Caucasian | 2,831 | 94.5% |
| Two or more Races | 105 | 3.5% |
| Some other Race | 0 | 0.0% |
| Total | 2,995 | 100.0% |
Ancestry in Iron River
The most populous ancestries reported in Iron River are Italian (537 | 17.9%), German (451 | 15.1%), American (353 | 11.8%), Polish (321 | 10.7%), and Swedish (304 | 10.2%), together accounting for 65.6% of all Iron River residents.
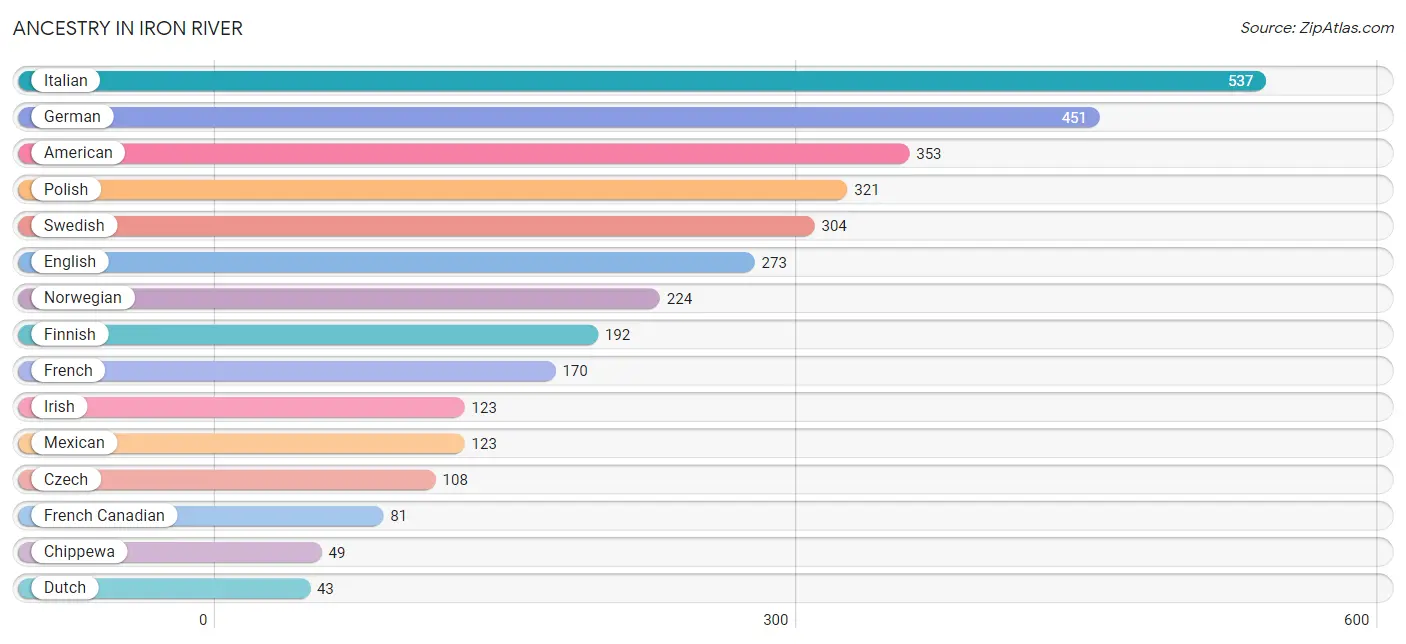
| Ancestry | # Population | % Population |
| American | 353 | 11.8% |
| Arab | 5 | 0.2% |
| Austrian | 7 | 0.2% |
| Belgian | 15 | 0.5% |
| British | 7 | 0.2% |
| Bulgarian | 32 | 1.1% |
| Central American | 1 | 0.0% |
| Chippewa | 49 | 1.6% |
| Czech | 108 | 3.6% |
| Dutch | 43 | 1.4% |
| English | 273 | 9.1% |
| European | 27 | 0.9% |
| Finnish | 192 | 6.4% |
| French | 170 | 5.7% |
| French Canadian | 81 | 2.7% |
| German | 451 | 15.1% |
| Greek | 9 | 0.3% |
| Honduran | 1 | 0.0% |
| Irish | 123 | 4.1% |
| Italian | 537 | 17.9% |
| Lebanese | 5 | 0.2% |
| Mexican | 123 | 4.1% |
| Norwegian | 224 | 7.5% |
| Polish | 321 | 10.7% |
| Russian | 27 | 0.9% |
| Scottish | 22 | 0.7% |
| Slavic | 11 | 0.4% |
| Slovene | 16 | 0.5% |
| Swedish | 304 | 10.2% |
| Welsh | 20 | 0.7% | View All 30 Rows |
Immigrants in Iron River
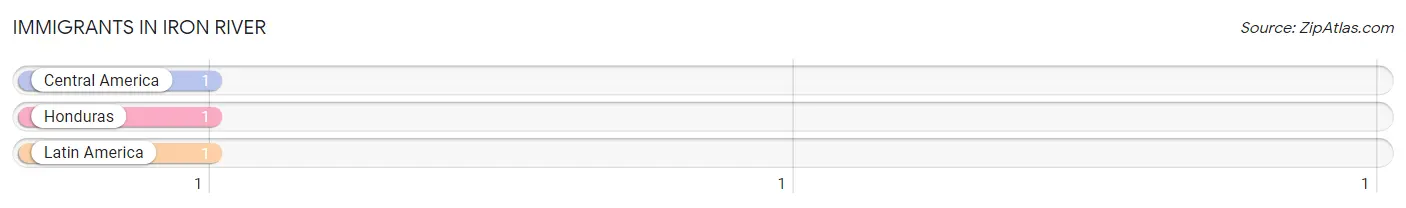
The most numerous immigrant groups reported in Iron River came from Central America (1 | 0.0%), Honduras (1 | 0.0%), and Latin America (1 | 0.0%), together accounting for 0.1% of all Iron River residents.
| Immigration Origin | # Population | % Population |
| Central America | 1 | 0.0% |
| Honduras | 1 | 0.0% |
| Latin America | 1 | 0.0% | View All 3 Rows |
Sex and Age in Iron River
Sex and Age in Iron River
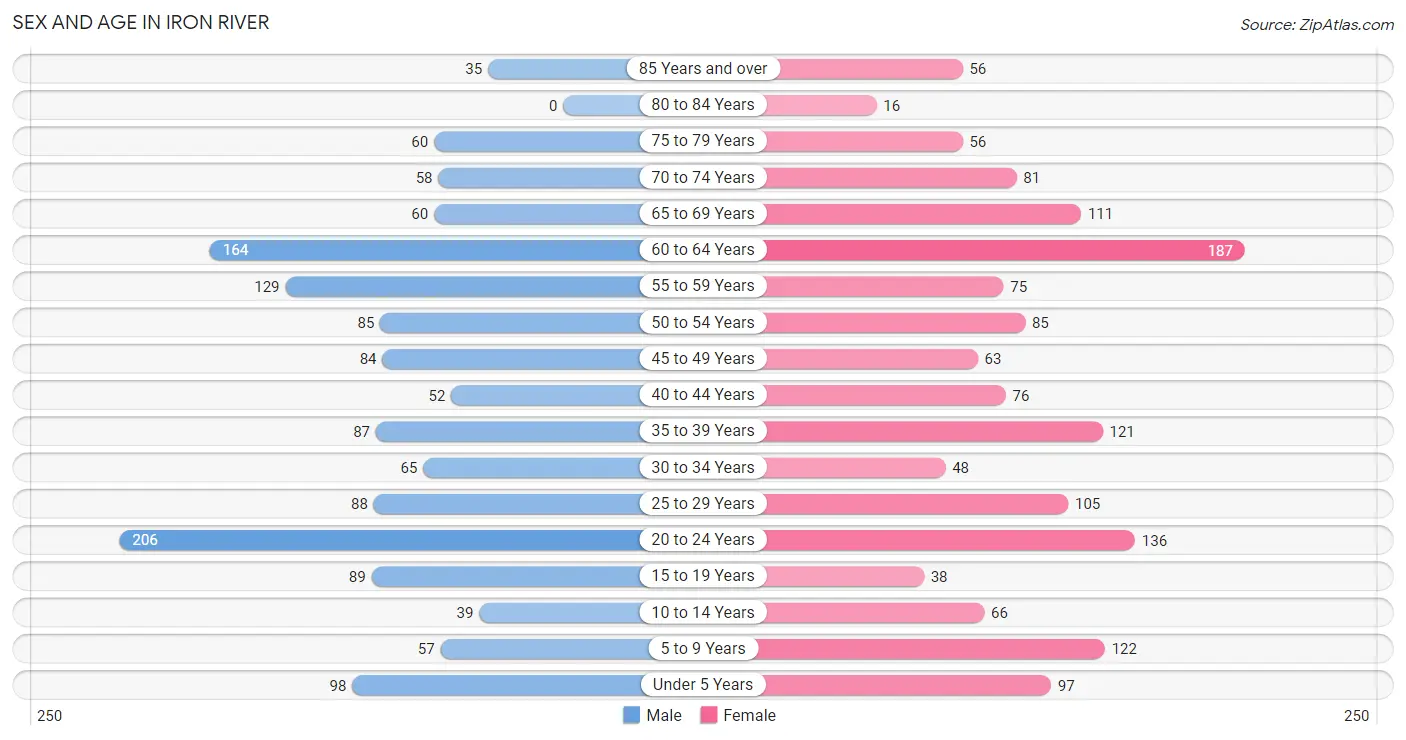
The most populous age groups in Iron River are 20 to 24 Years (206 | 14.1%) for men and 60 to 64 Years (187 | 12.1%) for women.
| Age Bracket | Male | Female |
| Under 5 Years | 98 (6.7%) | 97 (6.3%) |
| 5 to 9 Years | 57 (3.9%) | 122 (7.9%) |
| 10 to 14 Years | 39 (2.7%) | 66 (4.3%) |
| 15 to 19 Years | 89 (6.1%) | 38 (2.5%) |
| 20 to 24 Years | 206 (14.1%) | 136 (8.8%) |
| 25 to 29 Years | 88 (6.0%) | 105 (6.8%) |
| 30 to 34 Years | 65 (4.5%) | 48 (3.1%) |
| 35 to 39 Years | 87 (6.0%) | 121 (7.9%) |
| 40 to 44 Years | 52 (3.6%) | 76 (4.9%) |
| 45 to 49 Years | 84 (5.8%) | 63 (4.1%) |
| 50 to 54 Years | 85 (5.8%) | 85 (5.5%) |
| 55 to 59 Years | 129 (8.9%) | 75 (4.9%) |
| 60 to 64 Years | 164 (11.3%) | 187 (12.1%) |
| 65 to 69 Years | 60 (4.1%) | 111 (7.2%) |
| 70 to 74 Years | 58 (4.0%) | 81 (5.3%) |
| 75 to 79 Years | 60 (4.1%) | 56 (3.6%) |
| 80 to 84 Years | 0 (0.0%) | 16 (1.0%) |
| 85 Years and over | 35 (2.4%) | 56 (3.6%) |
| Total | 1,456 (100.0%) | 1,539 (100.0%) |
Families and Households in Iron River
Median Family Size in Iron River
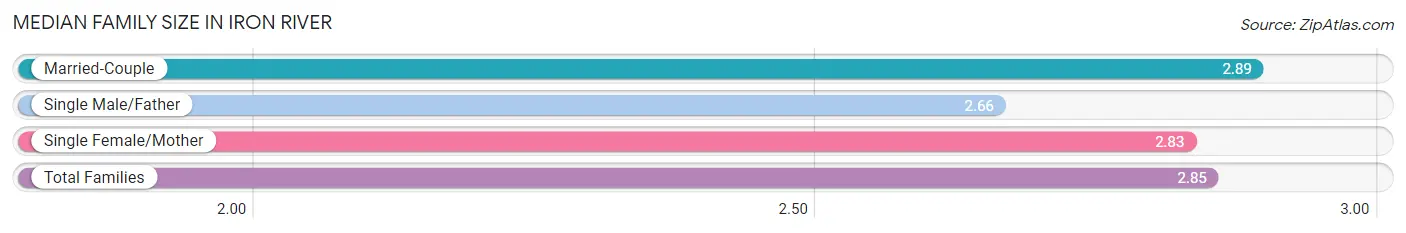
The median family size in Iron River is 2.85 persons per family, with married-couple families (480 | 62.7%) accounting for the largest median family size of 2.89 persons per family. On the other hand, single male/father families (67 | 8.7%) represent the smallest median family size with 2.66 persons per family.
| Family Type | # Families | Family Size |
| Married-Couple | 480 (62.7%) | 2.89 |
| Single Male/Father | 67 (8.7%) | 2.66 |
| Single Female/Mother | 219 (28.6%) | 2.83 |
| Total Families | 766 (100.0%) | 2.85 |
Median Household Size in Iron River
The median household size in Iron River is 2.26 persons per household, with single female/mother households (219 | 17.0%) accounting for the largest median household size of 3.32 persons per household. non-family households (520 | 40.4%) represent the smallest median household size with 1.08 persons per household.

| Household Type | # Households | Household Size |
| Married-Couple | 480 (37.3%) | 2.92 |
| Single Male/Father | 67 (5.2%) | 3.25 |
| Single Female/Mother | 219 (17.0%) | 3.32 |
| Non-family | 520 (40.4%) | 1.08 |
| Total Households | 1,286 (100.0%) | 2.26 |
Household Size by Marriage Status in Iron River
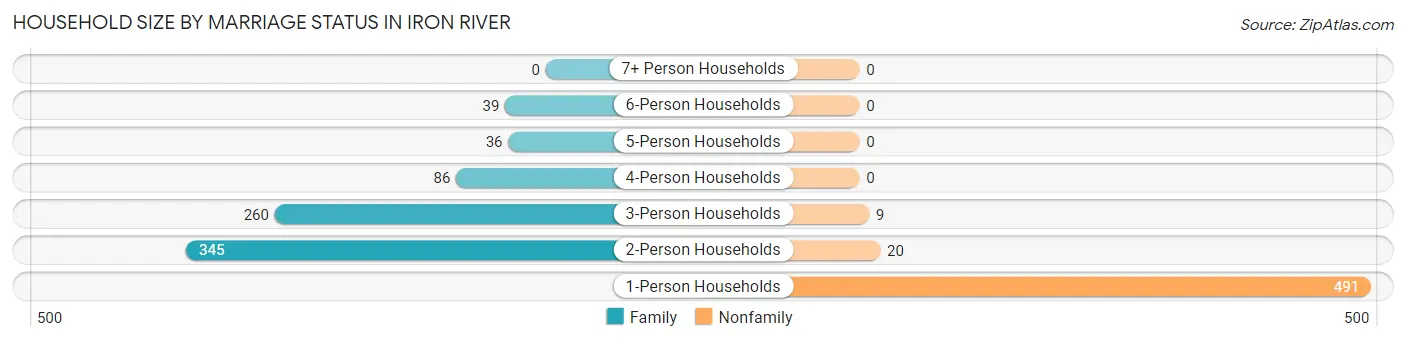
Out of a total of 1,286 households in Iron River, 766 (59.6%) are family households, while 520 (40.4%) are nonfamily households. The most numerous type of family households are 2-person households, comprising 345, and the most common type of nonfamily households are 1-person households, comprising 491.
| Household Size | Family Households | Nonfamily Households |
| 1-Person Households | - | 491 (38.2%) |
| 2-Person Households | 345 (26.8%) | 20 (1.6%) |
| 3-Person Households | 260 (20.2%) | 9 (0.7%) |
| 4-Person Households | 86 (6.7%) | 0 (0.0%) |
| 5-Person Households | 36 (2.8%) | 0 (0.0%) |
| 6-Person Households | 39 (3.0%) | 0 (0.0%) |
| 7+ Person Households | 0 (0.0%) | 0 (0.0%) |
| Total | 766 (59.6%) | 520 (40.4%) |
Female Fertility in Iron River
Fertility by Age in Iron River
Average fertility rate in Iron River is 152.0 births per 1,000 women. Women in the age bracket of 20 to 34 years have the highest fertility rate with 322.0 births per 1,000 women. Women in the age bracket of 20 to 34 years acount for 100.0% of all women with births.
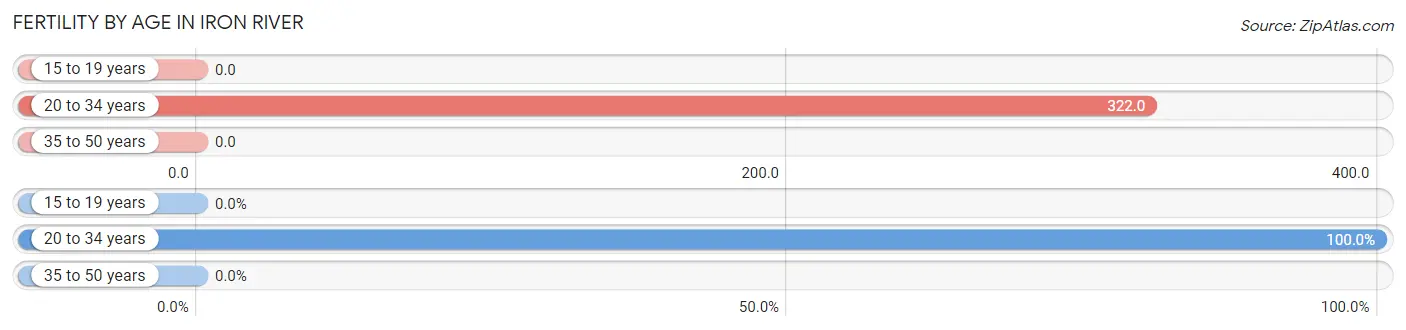
| Age Bracket | Women with Births | Births / 1,000 Women |
| 15 to 19 years | 0 (0.0%) | 0.0 |
| 20 to 34 years | 93 (100.0%) | 322.0 |
| 35 to 50 years | 0 (0.0%) | 0.0 |
| Total | 93 (100.0%) | 152.0 |
Fertility by Age by Marriage Status in Iron River
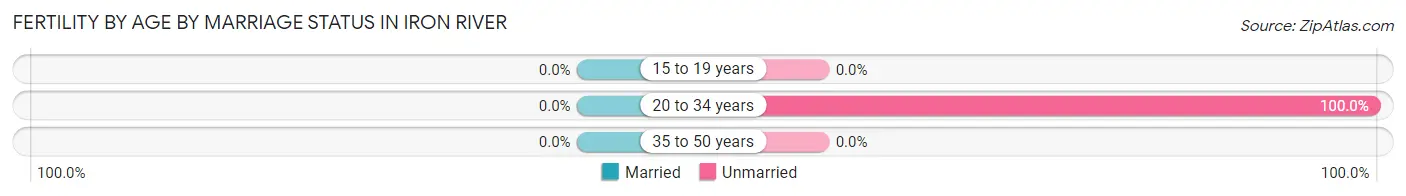
| Age Bracket | Married | Unmarried |
| 15 to 19 years | 0 (0.0%) | 0 (0.0%) |
| 20 to 34 years | 0 (0.0%) | 93 (100.0%) |
| 35 to 50 years | 0 (0.0%) | 0 (0.0%) |
| Total | 0 (0.0%) | 93 (100.0%) |
Fertility by Education in Iron River
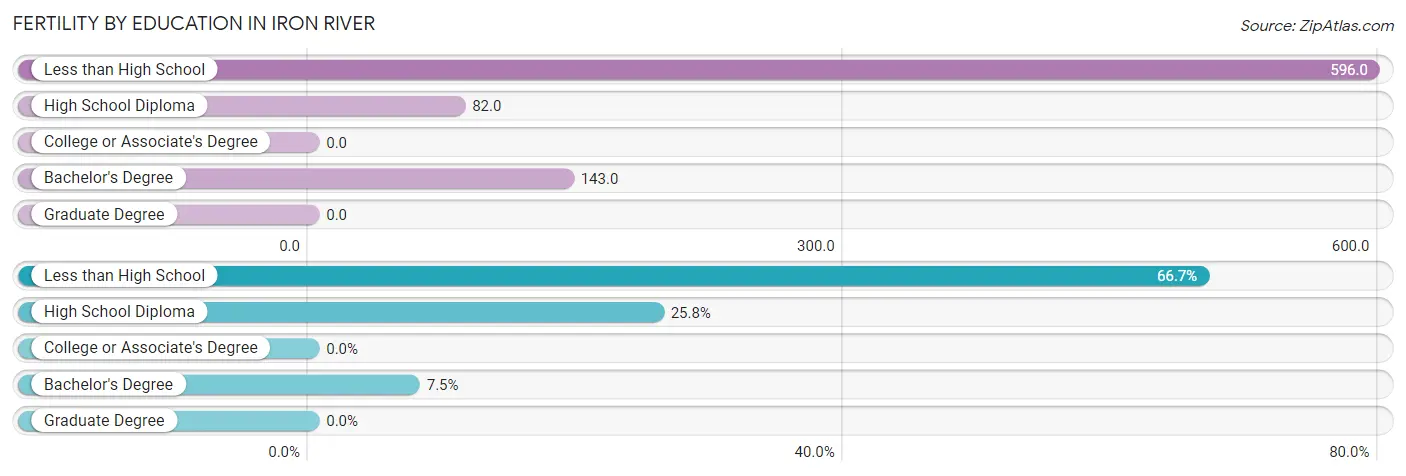
| Educational Attainment | Women with Births | Births / 1,000 Women |
| Less than High School | 62 (66.7%) | 596.0 |
| High School Diploma | 24 (25.8%) | 82.0 |
| College or Associate's Degree | 0 (0.0%) | 0.0 |
| Bachelor's Degree | 7 (7.5%) | 143.0 |
| Graduate Degree | 0 (0.0%) | 0.0 |
| Total | 93 (100.0%) | 152.0 |
Fertility by Education by Marriage Status in Iron River
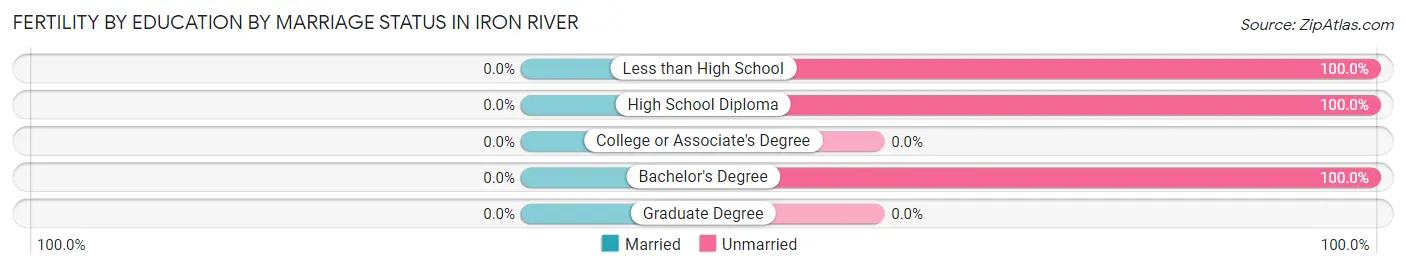
| Educational Attainment | Married | Unmarried |
| Less than High School | 0 (0.0%) | 62 (100.0%) |
| High School Diploma | 0 (0.0%) | 24 (100.0%) |
| College or Associate's Degree | 0 (0.0%) | 0 (0.0%) |
| Bachelor's Degree | 0 (0.0%) | 7 (100.0%) |
| Graduate Degree | 0 (0.0%) | 0 (0.0%) |
| Total | 0 (0.0%) | 93 (100.0%) |
Employment Characteristics in Iron River
Employment by Class of Employer in Iron River
Among the 1,435 employed individuals in Iron River, private company employees (926 | 64.5%), not-for-profit organizations (204 | 14.2%), and local government employees (160 | 11.2%) make up the most common classes of employment.
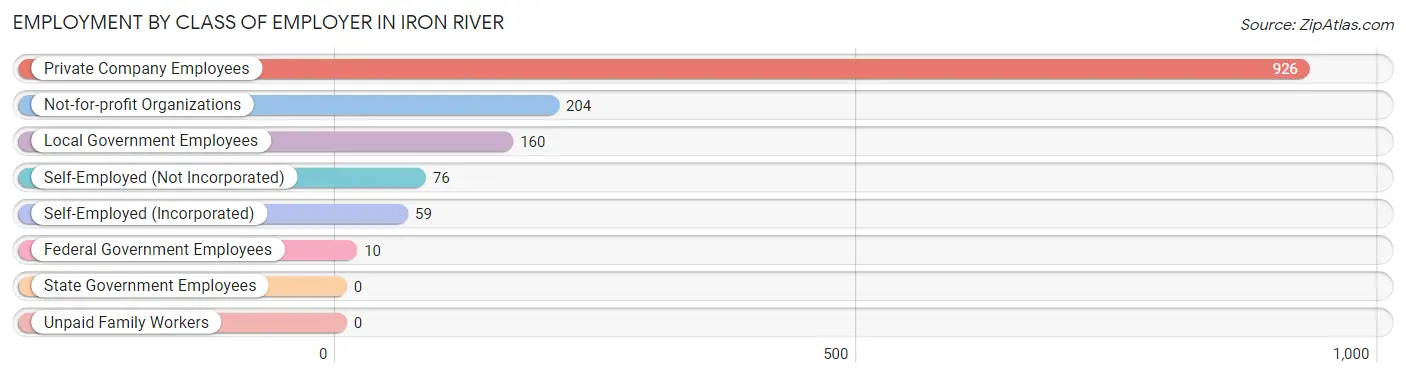
| Employer Class | # Employees | % Employees |
| Private Company Employees | 926 | 64.5% |
| Self-Employed (Incorporated) | 59 | 4.1% |
| Self-Employed (Not Incorporated) | 76 | 5.3% |
| Not-for-profit Organizations | 204 | 14.2% |
| Local Government Employees | 160 | 11.2% |
| State Government Employees | 0 | 0.0% |
| Federal Government Employees | 10 | 0.7% |
| Unpaid Family Workers | 0 | 0.0% |
| Total | 1,435 | 100.0% |
Employment Status by Age in Iron River
According to the labor force statistics for Iron River, out of the total population over 16 years of age (2,490), 60.7% or 1,511 individuals are in the labor force, with 4.2% or 63 of them unemployed. The age group with the highest labor force participation rate is 35 to 44 years, with 96.1% or 323 individuals in the labor force. Within the labor force, the 16 to 19 years age range has the highest percentage of unemployed individuals, with 27.3% or 9 of them being unemployed.
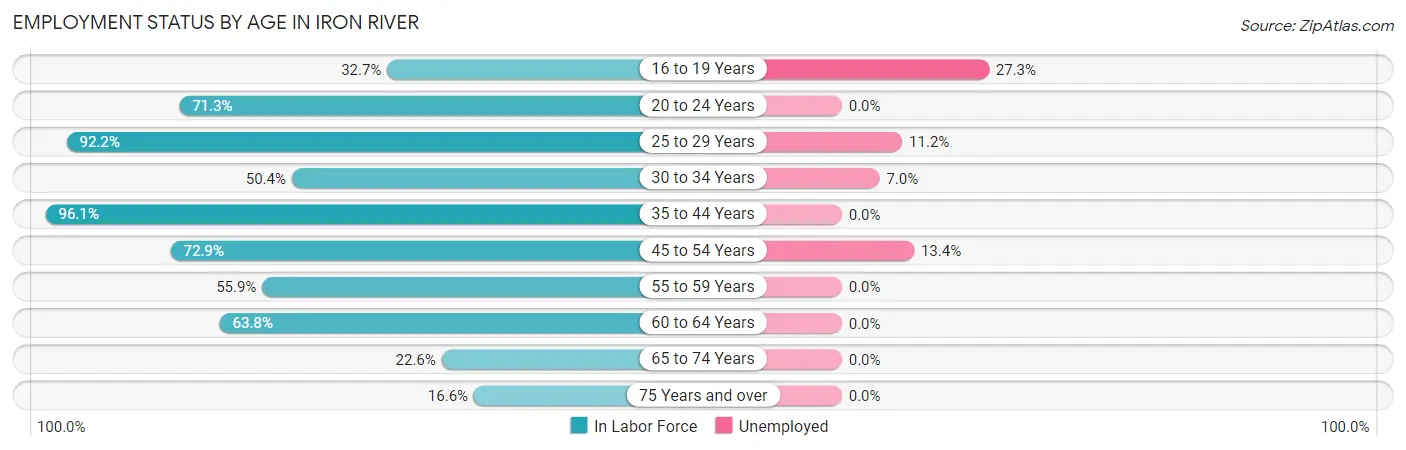
| Age Bracket | In Labor Force | Unemployed |
| 16 to 19 Years | 33 (32.7%) | 9 (27.3%) |
| 20 to 24 Years | 244 (71.3%) | 0 (0.0%) |
| 25 to 29 Years | 178 (92.2%) | 20 (11.2%) |
| 30 to 34 Years | 57 (50.4%) | 4 (7.0%) |
| 35 to 44 Years | 323 (96.1%) | 0 (0.0%) |
| 45 to 54 Years | 231 (72.9%) | 31 (13.4%) |
| 55 to 59 Years | 114 (55.9%) | 0 (0.0%) |
| 60 to 64 Years | 224 (63.8%) | 0 (0.0%) |
| 65 to 74 Years | 70 (22.6%) | 0 (0.0%) |
| 75 Years and over | 37 (16.6%) | 0 (0.0%) |
| Total | 1,511 (60.7%) | 63 (4.2%) |
Employment Status by Educational Attainment in Iron River
According to labor force statistics for Iron River, 74.4% of individuals (1,126) out of the total population between 25 and 64 years of age (1,514) are in the labor force, with 4.9% or 55 of them being unemployed. The group with the highest labor force participation rate are those with the educational attainment of bachelor's degree or higher, with 76.4% or 220 individuals in the labor force. Within the labor force, individuals with less than high school education have the highest percentage of unemployment, with 33.3% or 20 of them being unemployed.
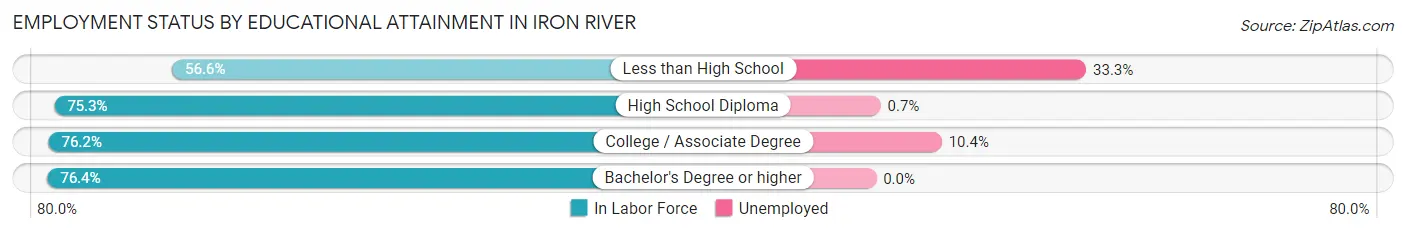
| Educational Attainment | In Labor Force | Unemployed |
| Less than High School | 60 (56.6%) | 35 (33.3%) |
| High School Diploma | 550 (75.3%) | 5 (0.7%) |
| College / Associate Degree | 297 (76.2%) | 41 (10.4%) |
| Bachelor's Degree or higher | 220 (76.4%) | 0 (0.0%) |
| Total | 1,126 (74.4%) | 74 (4.9%) |
Employment Occupations by Sex in Iron River
Management, Business, Science and Arts Occupations
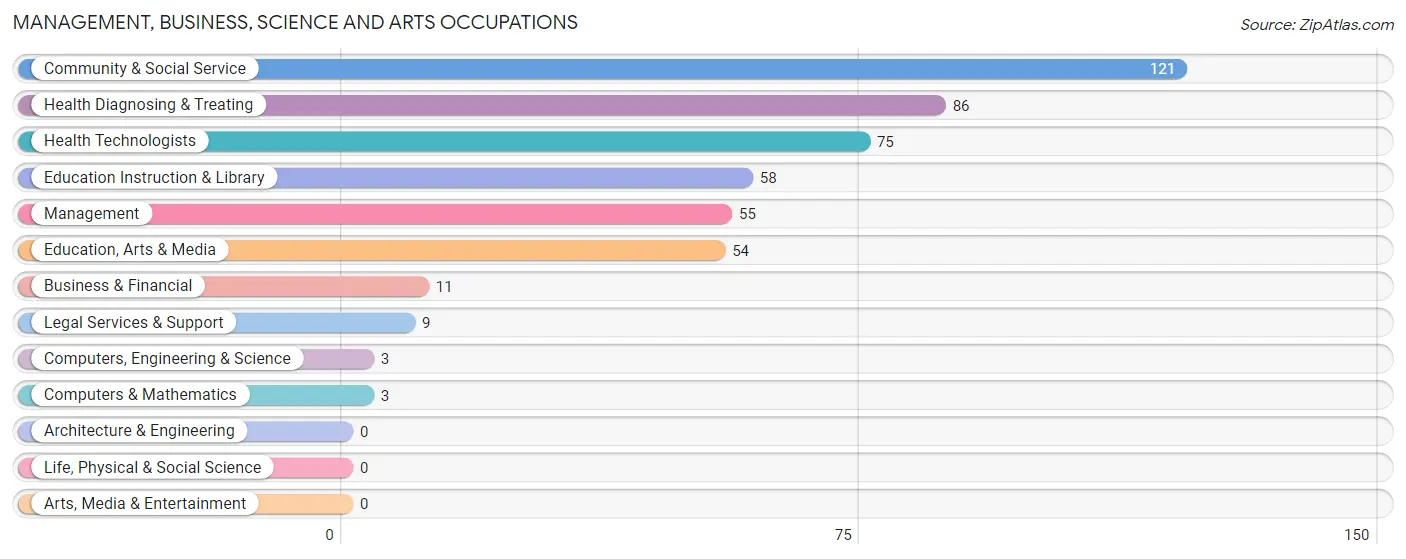
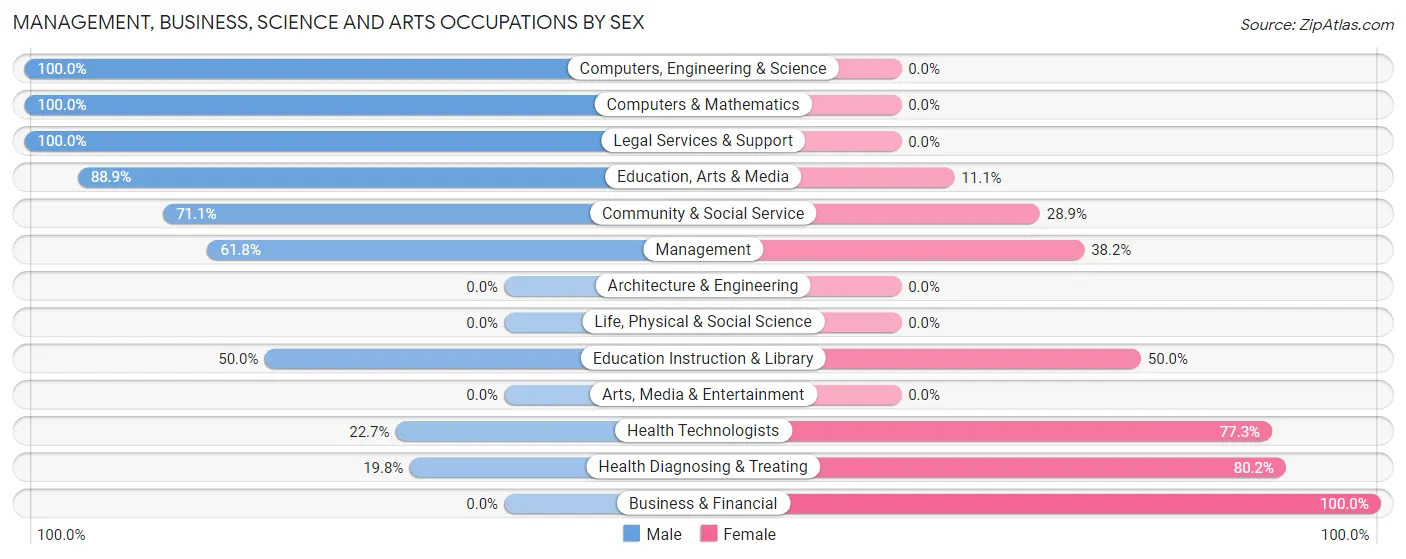
The most common Management, Business, Science and Arts occupations in Iron River are Community & Social Service (121 | 8.4%), Health Diagnosing & Treating (86 | 5.9%), Health Technologists (75 | 5.2%), Education Instruction & Library (58 | 4.0%), and Management (55 | 3.8%).
Management, Business, Science and Arts Occupations by Sex
Within the Management, Business, Science and Arts occupations in Iron River, the most male-oriented occupations are Computers, Engineering & Science (100.0%), Computers & Mathematics (100.0%), and Legal Services & Support (100.0%), while the most female-oriented occupations are Business & Financial (100.0%), Health Diagnosing & Treating (80.2%), and Health Technologists (77.3%).
| Occupation | Male | Female |
| Management | 34 (61.8%) | 21 (38.2%) |
| Business & Financial | 0 (0.0%) | 11 (100.0%) |
| Computers, Engineering & Science | 3 (100.0%) | 0 (0.0%) |
| Computers & Mathematics | 3 (100.0%) | 0 (0.0%) |
| Architecture & Engineering | 0 (0.0%) | 0 (0.0%) |
| Life, Physical & Social Science | 0 (0.0%) | 0 (0.0%) |
| Community & Social Service | 86 (71.1%) | 35 (28.9%) |
| Education, Arts & Media | 48 (88.9%) | 6 (11.1%) |
| Legal Services & Support | 9 (100.0%) | 0 (0.0%) |
| Education Instruction & Library | 29 (50.0%) | 29 (50.0%) |
| Arts, Media & Entertainment | 0 (0.0%) | 0 (0.0%) |
| Health Diagnosing & Treating | 17 (19.8%) | 69 (80.2%) |
| Health Technologists | 17 (22.7%) | 58 (77.3%) |
| Total (Category) | 140 (50.7%) | 136 (49.3%) |
| Total (Overall) | 805 (55.6%) | 642 (44.4%) |
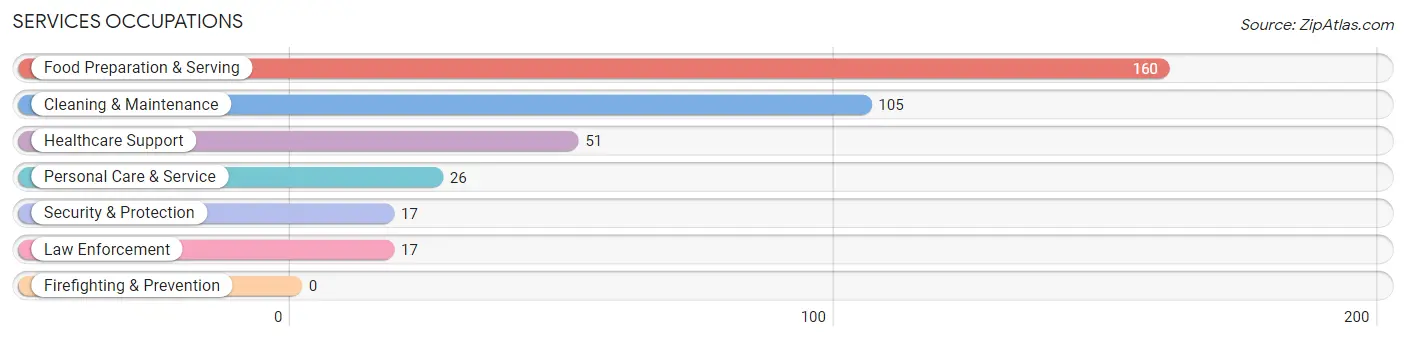
Services Occupations
The most common Services occupations in Iron River are Food Preparation & Serving (160 | 11.1%), Cleaning & Maintenance (105 | 7.3%), Healthcare Support (51 | 3.5%), Personal Care & Service (26 | 1.8%), and Security & Protection (17 | 1.2%).
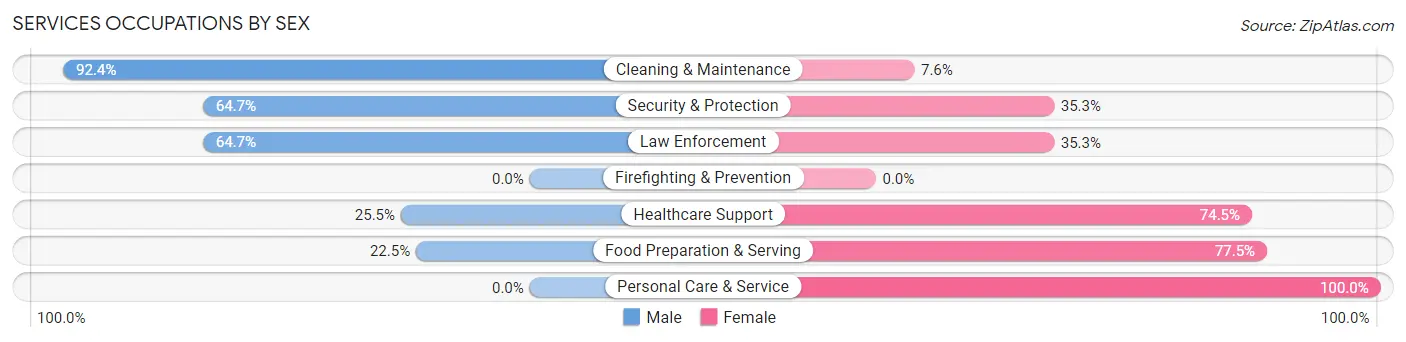
Services Occupations by Sex
Within the Services occupations in Iron River, the most male-oriented occupations are Cleaning & Maintenance (92.4%), Security & Protection (64.7%), and Law Enforcement (64.7%), while the most female-oriented occupations are Personal Care & Service (100.0%), Food Preparation & Serving (77.5%), and Healthcare Support (74.5%).
| Occupation | Male | Female |
| Healthcare Support | 13 (25.5%) | 38 (74.5%) |
| Security & Protection | 11 (64.7%) | 6 (35.3%) |
| Firefighting & Prevention | 0 (0.0%) | 0 (0.0%) |
| Law Enforcement | 11 (64.7%) | 6 (35.3%) |
| Food Preparation & Serving | 36 (22.5%) | 124 (77.5%) |
| Cleaning & Maintenance | 97 (92.4%) | 8 (7.6%) |
| Personal Care & Service | 0 (0.0%) | 26 (100.0%) |
| Total (Category) | 157 (43.7%) | 202 (56.3%) |
| Total (Overall) | 805 (55.6%) | 642 (44.4%) |
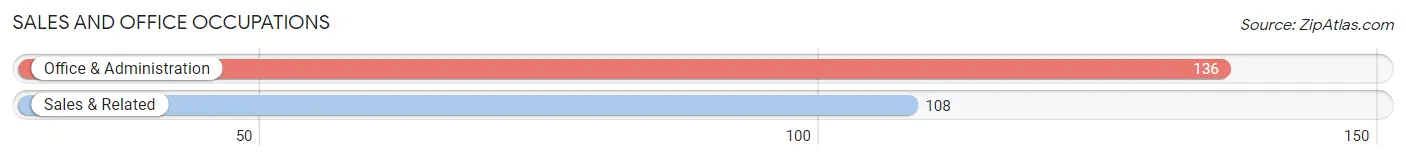
Sales and Office Occupations
The most common Sales and Office occupations in Iron River are Office & Administration (136 | 9.4%), and Sales & Related (108 | 7.5%).
Sales and Office Occupations by Sex
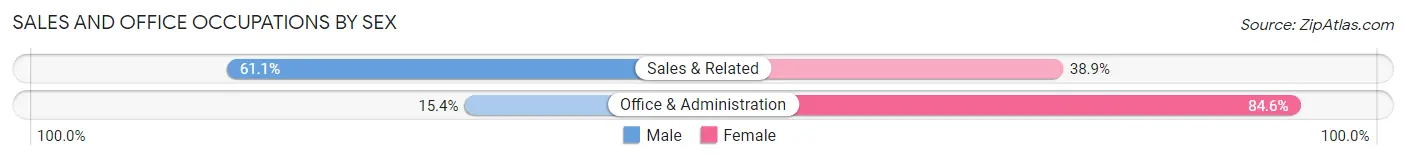
| Occupation | Male | Female |
| Sales & Related | 66 (61.1%) | 42 (38.9%) |
| Office & Administration | 21 (15.4%) | 115 (84.6%) |
| Total (Category) | 87 (35.7%) | 157 (64.3%) |
| Total (Overall) | 805 (55.6%) | 642 (44.4%) |
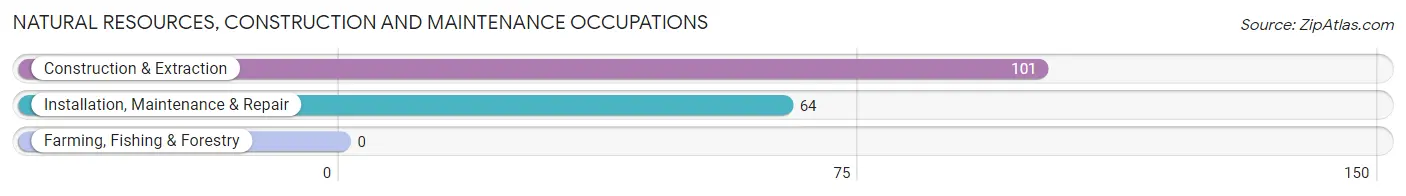
Natural Resources, Construction and Maintenance Occupations
The most common Natural Resources, Construction and Maintenance occupations in Iron River are Construction & Extraction (101 | 7.0%), and Installation, Maintenance & Repair (64 | 4.4%).
Natural Resources, Construction and Maintenance Occupations by Sex
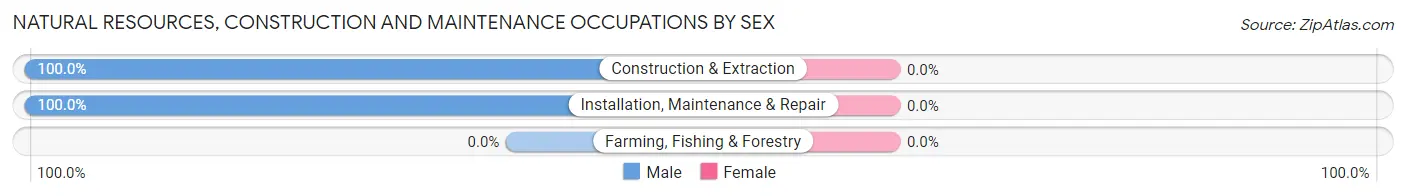
| Occupation | Male | Female |
| Farming, Fishing & Forestry | 0 (0.0%) | 0 (0.0%) |
| Construction & Extraction | 101 (100.0%) | 0 (0.0%) |
| Installation, Maintenance & Repair | 64 (100.0%) | 0 (0.0%) |
| Total (Category) | 165 (100.0%) | 0 (0.0%) |
| Total (Overall) | 805 (55.6%) | 642 (44.4%) |
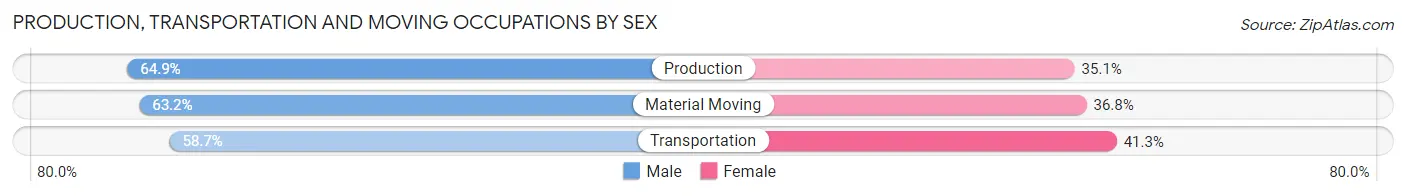
Production, Transportation and Moving Occupations
The most common Production, Transportation and Moving occupations in Iron River are Production (245 | 16.9%), Material Moving (95 | 6.6%), and Transportation (63 | 4.3%).
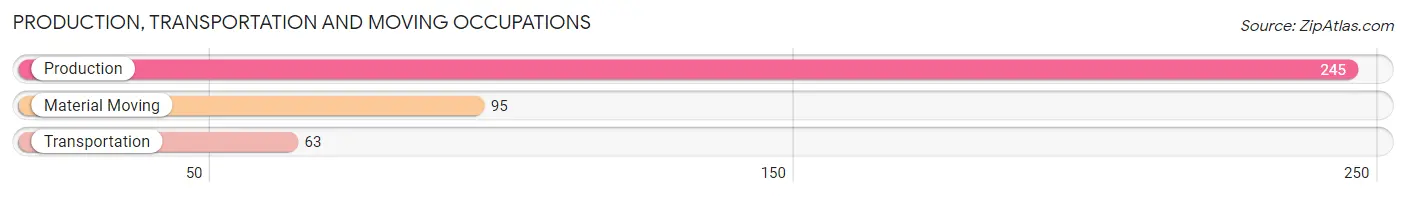
Production, Transportation and Moving Occupations by Sex
| Occupation | Male | Female |
| Production | 159 (64.9%) | 86 (35.1%) |
| Transportation | 37 (58.7%) | 26 (41.3%) |
| Material Moving | 60 (63.2%) | 35 (36.8%) |
| Total (Category) | 256 (63.5%) | 147 (36.5%) |
| Total (Overall) | 805 (55.6%) | 642 (44.4%) |
Employment Industries by Sex in Iron River
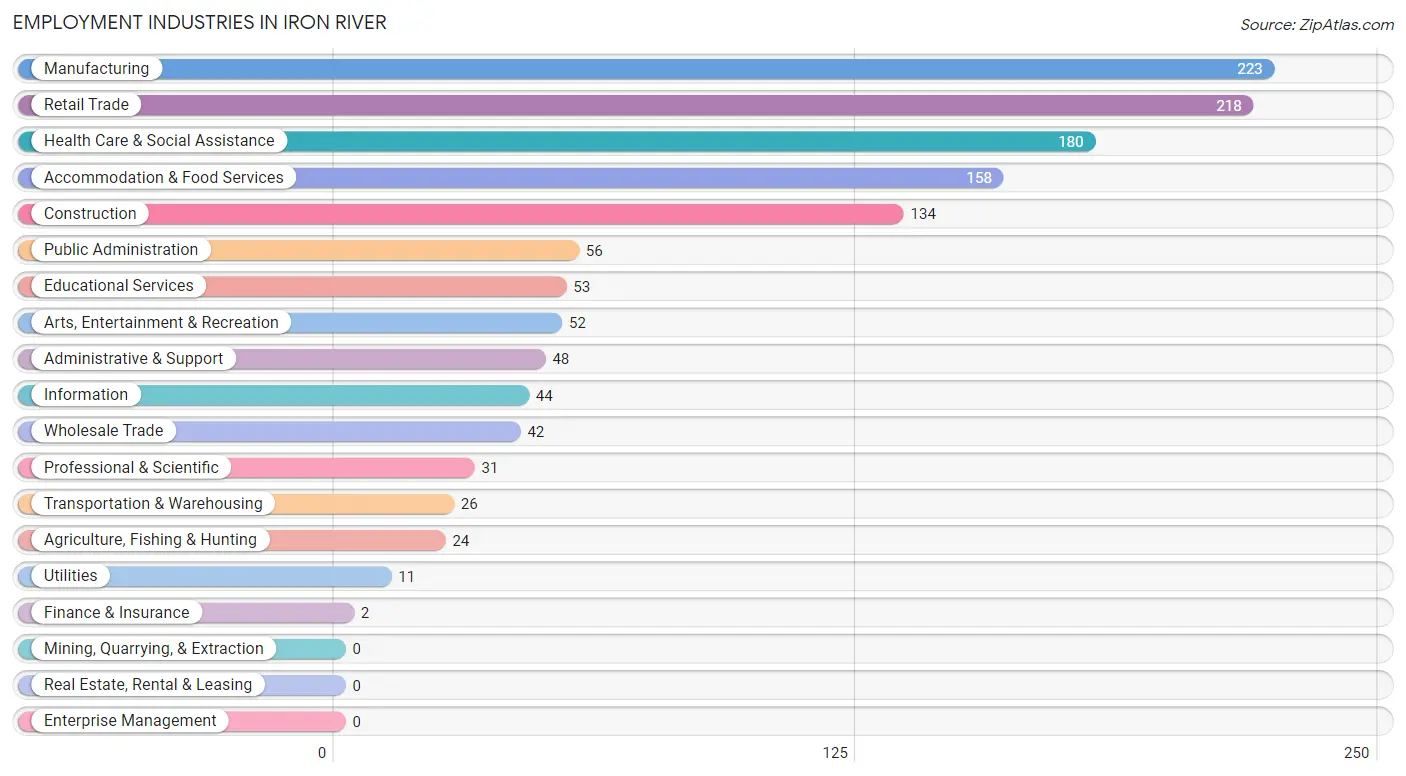
Employment Industries in Iron River
The major employment industries in Iron River include Manufacturing (223 | 15.4%), Retail Trade (218 | 15.1%), Health Care & Social Assistance (180 | 12.4%), Accommodation & Food Services (158 | 10.9%), and Construction (134 | 9.3%).
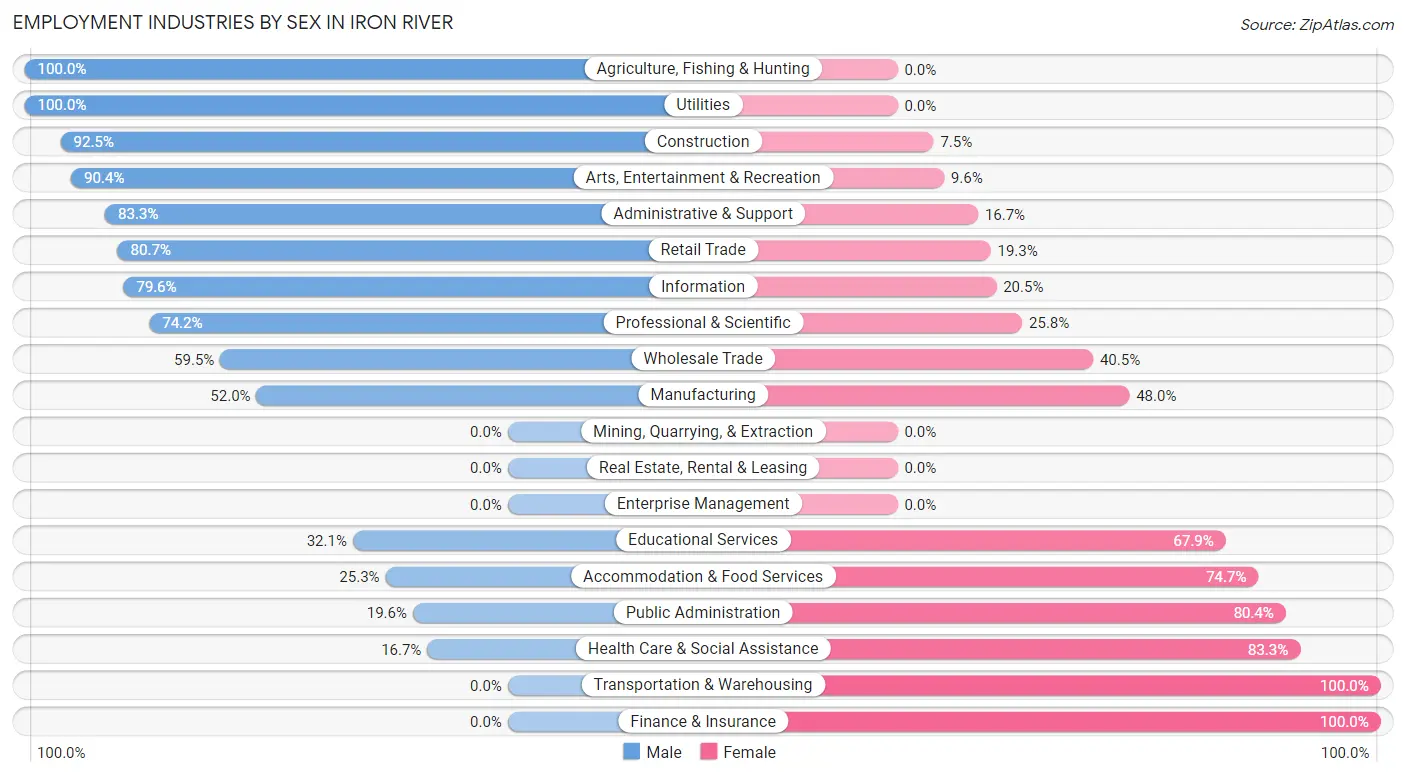
Employment Industries by Sex in Iron River
The Iron River industries that see more men than women are Agriculture, Fishing & Hunting (100.0%), Utilities (100.0%), and Construction (92.5%), whereas the industries that tend to have a higher number of women are Transportation & Warehousing (100.0%), Finance & Insurance (100.0%), and Health Care & Social Assistance (83.3%).
| Industry | Male | Female |
| Agriculture, Fishing & Hunting | 24 (100.0%) | 0 (0.0%) |
| Mining, Quarrying, & Extraction | 0 (0.0%) | 0 (0.0%) |
| Construction | 124 (92.5%) | 10 (7.5%) |
| Manufacturing | 116 (52.0%) | 107 (48.0%) |
| Wholesale Trade | 25 (59.5%) | 17 (40.5%) |
| Retail Trade | 176 (80.7%) | 42 (19.3%) |
| Transportation & Warehousing | 0 (0.0%) | 26 (100.0%) |
| Utilities | 11 (100.0%) | 0 (0.0%) |
| Information | 35 (79.5%) | 9 (20.4%) |
| Finance & Insurance | 0 (0.0%) | 2 (100.0%) |
| Real Estate, Rental & Leasing | 0 (0.0%) | 0 (0.0%) |
| Professional & Scientific | 23 (74.2%) | 8 (25.8%) |
| Enterprise Management | 0 (0.0%) | 0 (0.0%) |
| Administrative & Support | 40 (83.3%) | 8 (16.7%) |
| Educational Services | 17 (32.1%) | 36 (67.9%) |
| Health Care & Social Assistance | 30 (16.7%) | 150 (83.3%) |
| Arts, Entertainment & Recreation | 47 (90.4%) | 5 (9.6%) |
| Accommodation & Food Services | 40 (25.3%) | 118 (74.7%) |
| Public Administration | 11 (19.6%) | 45 (80.4%) |
| Total | 805 (55.6%) | 642 (44.4%) |
Education in Iron River
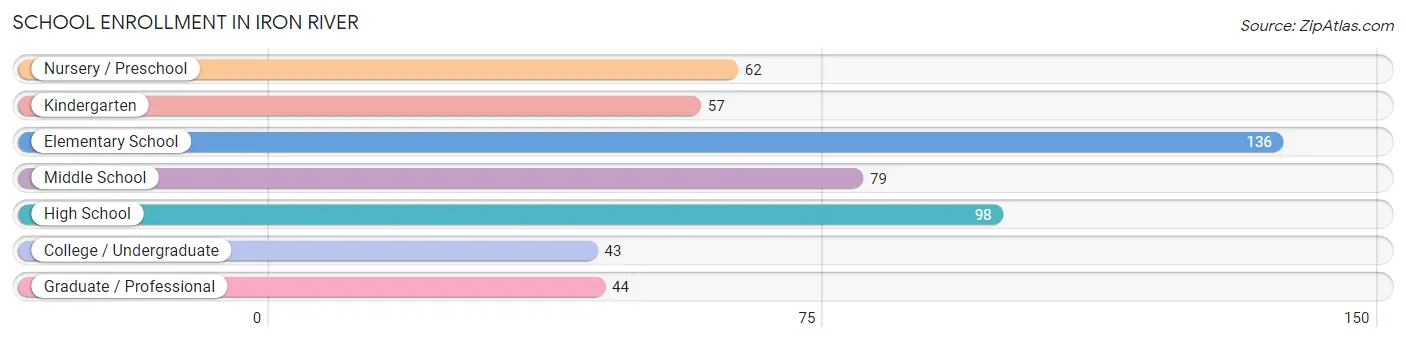
School Enrollment in Iron River
The most common levels of schooling among the 519 students in Iron River are elementary school (136 | 26.2%), high school (98 | 18.9%), and middle school (79 | 15.2%).
| School Level | # Students | % Students |
| Nursery / Preschool | 62 | 11.9% |
| Kindergarten | 57 | 11.0% |
| Elementary School | 136 | 26.2% |
| Middle School | 79 | 15.2% |
| High School | 98 | 18.9% |
| College / Undergraduate | 43 | 8.3% |
| Graduate / Professional | 44 | 8.5% |
| Total | 519 | 100.0% |
School Enrollment by Age by Funding Source in Iron River
Out of a total of 519 students who are enrolled in schools in Iron River, 32 (6.2%) attend a private institution, while the remaining 487 (93.8%) are enrolled in public schools. The age group of 25 to 34 year olds has the highest likelihood of being enrolled in private schools, with 9 (27.3% in the age bracket) enrolled. Conversely, the age group of 3 to 4 year olds has the lowest likelihood of being enrolled in a private school, with 62 (100.0% in the age bracket) attending a public institution.
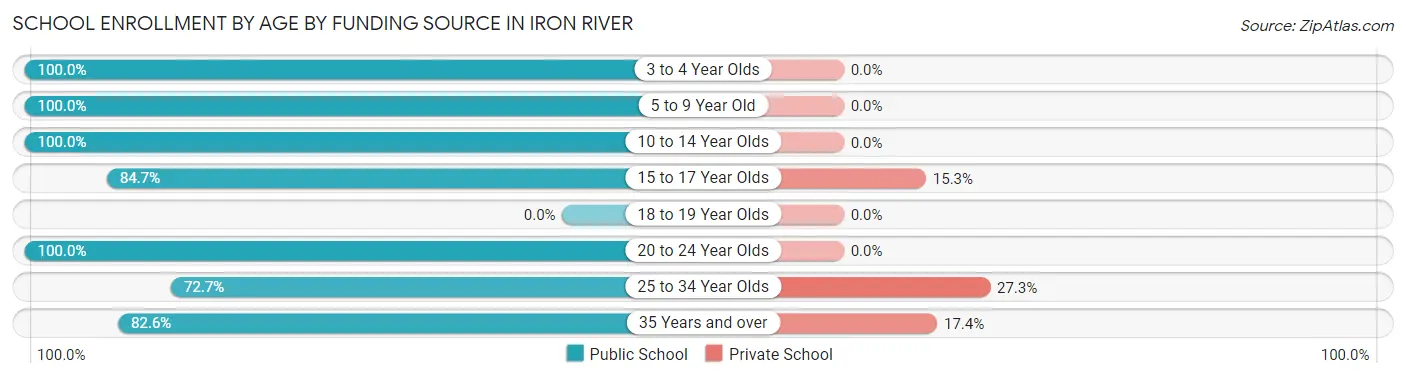
| Age Bracket | Public School | Private School |
| 3 to 4 Year Olds | 62 (100.0%) | 0 (0.0%) |
| 5 to 9 Year Old | 167 (100.0%) | 0 (0.0%) |
| 10 to 14 Year Olds | 105 (100.0%) | 0 (0.0%) |
| 15 to 17 Year Olds | 83 (84.7%) | 15 (15.3%) |
| 18 to 19 Year Olds | 0 (0.0%) | 0 (0.0%) |
| 20 to 24 Year Olds | 8 (100.0%) | 0 (0.0%) |
| 25 to 34 Year Olds | 24 (72.7%) | 9 (27.3%) |
| 35 Years and over | 38 (82.6%) | 8 (17.4%) |
| Total | 487 (93.8%) | 32 (6.2%) |
Educational Attainment by Field of Study in Iron River
Science & technology (58 | 14.0%), arts & humanities (57 | 13.7%), bio, nature & agricultural (55 | 13.3%), business (48 | 11.6%), and education (43 | 10.4%) are the most common fields of study among 415 individuals in Iron River who have obtained a bachelor's degree or higher.
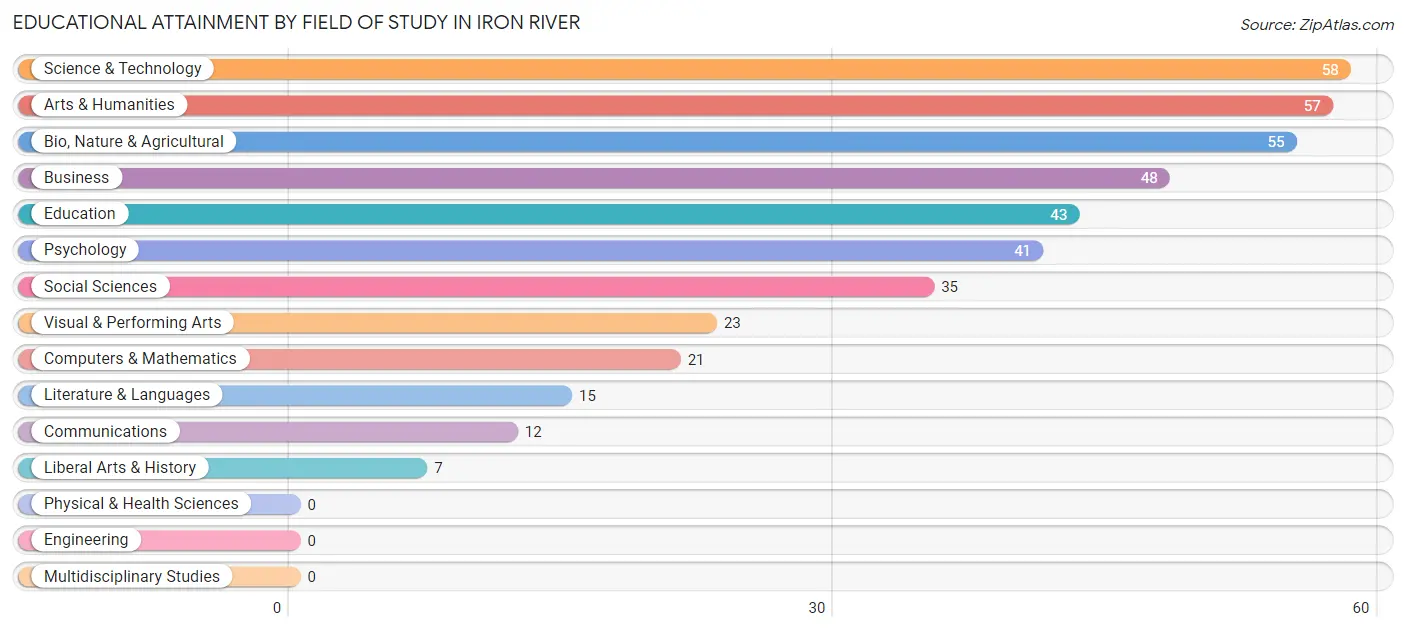
| Field of Study | # Graduates | % Graduates |
| Computers & Mathematics | 21 | 5.1% |
| Bio, Nature & Agricultural | 55 | 13.3% |
| Physical & Health Sciences | 0 | 0.0% |
| Psychology | 41 | 9.9% |
| Social Sciences | 35 | 8.4% |
| Engineering | 0 | 0.0% |
| Multidisciplinary Studies | 0 | 0.0% |
| Science & Technology | 58 | 14.0% |
| Business | 48 | 11.6% |
| Education | 43 | 10.4% |
| Literature & Languages | 15 | 3.6% |
| Liberal Arts & History | 7 | 1.7% |
| Visual & Performing Arts | 23 | 5.5% |
| Communications | 12 | 2.9% |
| Arts & Humanities | 57 | 13.7% |
| Total | 415 | 100.0% |
Transportation & Commute in Iron River
Vehicle Availability by Sex in Iron River
The most prevalent vehicle ownership categories in Iron River are males with 2 vehicles (371, accounting for 46.5%) and females with 2 vehicles (161, making up 58.7%).
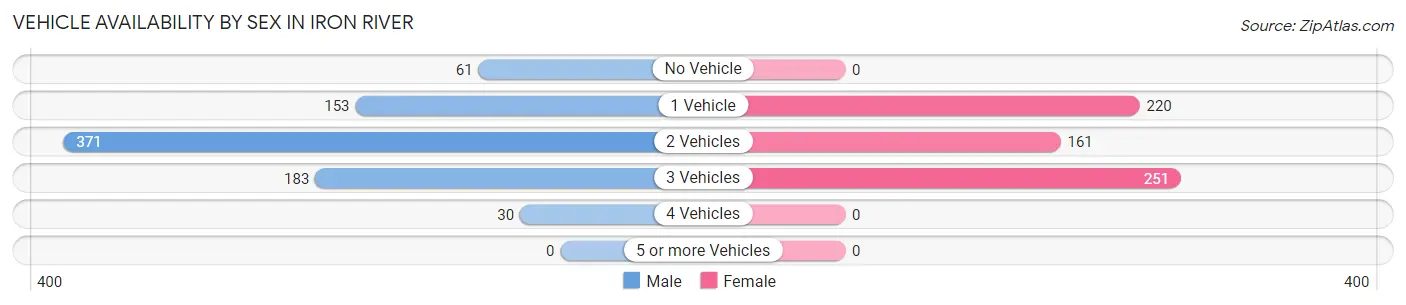
| Vehicles Available | Male | Female |
| No Vehicle | 61 (7.6%) | 0 (0.0%) |
| 1 Vehicle | 153 (19.2%) | 220 (34.8%) |
| 2 Vehicles | 371 (46.5%) | 161 (25.5%) |
| 3 Vehicles | 183 (22.9%) | 251 (39.7%) |
| 4 Vehicles | 30 (3.8%) | 0 (0.0%) |
| 5 or more Vehicles | 0 (0.0%) | 0 (0.0%) |
| Total | 798 (100.0%) | 632 (100.0%) |
Commute Time in Iron River
The most frequently occuring commute durations in Iron River are 5 to 9 minutes (513 commuters, 37.7%), 10 to 14 minutes (229 commuters, 16.8%), and 15 to 19 minutes (143 commuters, 10.5%).
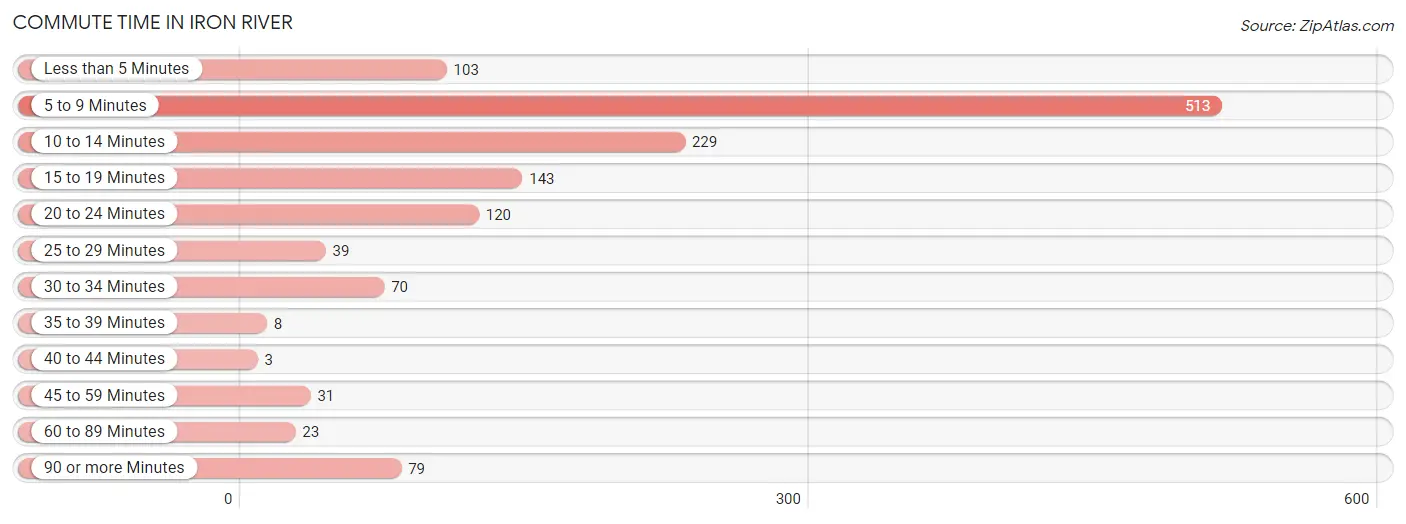
| Commute Time | # Commuters | % Commuters |
| Less than 5 Minutes | 103 | 7.6% |
| 5 to 9 Minutes | 513 | 37.7% |
| 10 to 14 Minutes | 229 | 16.8% |
| 15 to 19 Minutes | 143 | 10.5% |
| 20 to 24 Minutes | 120 | 8.8% |
| 25 to 29 Minutes | 39 | 2.9% |
| 30 to 34 Minutes | 70 | 5.1% |
| 35 to 39 Minutes | 8 | 0.6% |
| 40 to 44 Minutes | 3 | 0.2% |
| 45 to 59 Minutes | 31 | 2.3% |
| 60 to 89 Minutes | 23 | 1.7% |
| 90 or more Minutes | 79 | 5.8% |
Commute Time by Sex in Iron River
The most common commute times in Iron River are 5 to 9 minutes (203 commuters, 27.5%) for males and 5 to 9 minutes (310 commuters, 49.8%) for females.
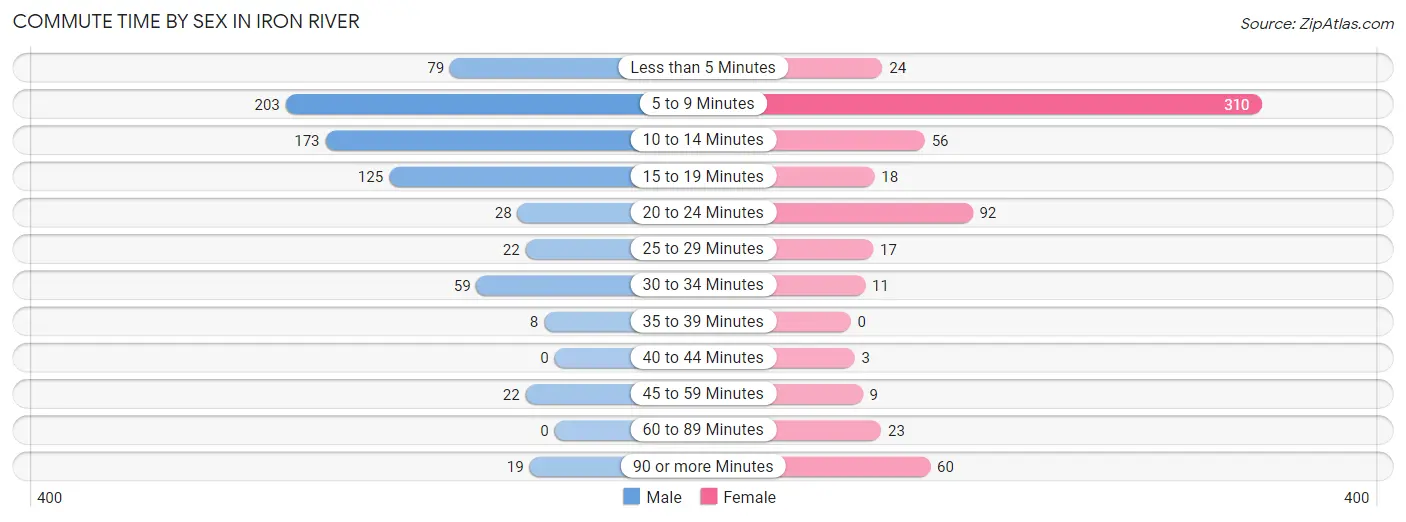
| Commute Time | Male | Female |
| Less than 5 Minutes | 79 (10.7%) | 24 (3.8%) |
| 5 to 9 Minutes | 203 (27.5%) | 310 (49.8%) |
| 10 to 14 Minutes | 173 (23.4%) | 56 (9.0%) |
| 15 to 19 Minutes | 125 (16.9%) | 18 (2.9%) |
| 20 to 24 Minutes | 28 (3.8%) | 92 (14.8%) |
| 25 to 29 Minutes | 22 (3.0%) | 17 (2.7%) |
| 30 to 34 Minutes | 59 (8.0%) | 11 (1.8%) |
| 35 to 39 Minutes | 8 (1.1%) | 0 (0.0%) |
| 40 to 44 Minutes | 0 (0.0%) | 3 (0.5%) |
| 45 to 59 Minutes | 22 (3.0%) | 9 (1.4%) |
| 60 to 89 Minutes | 0 (0.0%) | 23 (3.7%) |
| 90 or more Minutes | 19 (2.6%) | 60 (9.6%) |
Time of Departure to Work by Sex in Iron River
The most frequent times of departure to work in Iron River are 12:00 AM to 4:59 AM (132, 17.9%) for males and 12:00 AM to 4:59 AM (154, 24.7%) for females.
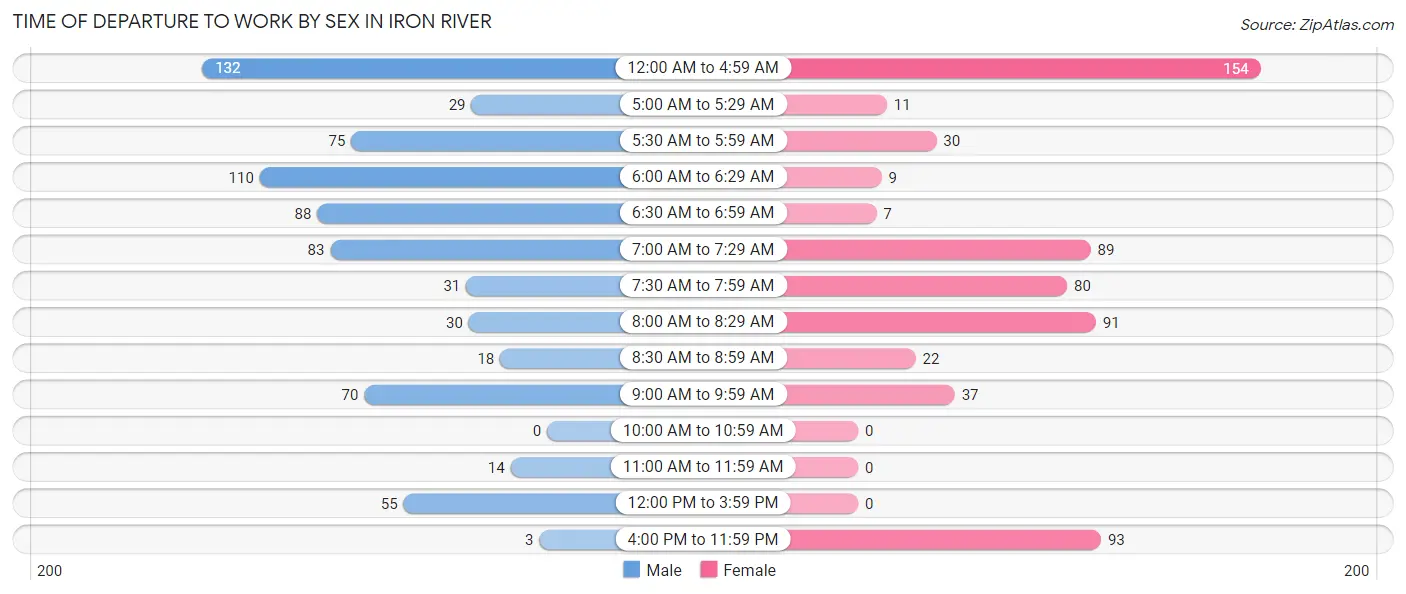
| Time of Departure | Male | Female |
| 12:00 AM to 4:59 AM | 132 (17.9%) | 154 (24.7%) |
| 5:00 AM to 5:29 AM | 29 (3.9%) | 11 (1.8%) |
| 5:30 AM to 5:59 AM | 75 (10.2%) | 30 (4.8%) |
| 6:00 AM to 6:29 AM | 110 (14.9%) | 9 (1.4%) |
| 6:30 AM to 6:59 AM | 88 (11.9%) | 7 (1.1%) |
| 7:00 AM to 7:29 AM | 83 (11.3%) | 89 (14.3%) |
| 7:30 AM to 7:59 AM | 31 (4.2%) | 80 (12.8%) |
| 8:00 AM to 8:29 AM | 30 (4.1%) | 91 (14.6%) |
| 8:30 AM to 8:59 AM | 18 (2.4%) | 22 (3.5%) |
| 9:00 AM to 9:59 AM | 70 (9.5%) | 37 (5.9%) |
| 10:00 AM to 10:59 AM | 0 (0.0%) | 0 (0.0%) |
| 11:00 AM to 11:59 AM | 14 (1.9%) | 0 (0.0%) |
| 12:00 PM to 3:59 PM | 55 (7.4%) | 0 (0.0%) |
| 4:00 PM to 11:59 PM | 3 (0.4%) | 93 (14.9%) |
| Total | 738 (100.0%) | 623 (100.0%) |
Housing Occupancy in Iron River
Occupancy by Ownership in Iron River
Of the total 1,286 dwellings in Iron River, owner-occupied units account for 846 (65.8%), while renter-occupied units make up 440 (34.2%).
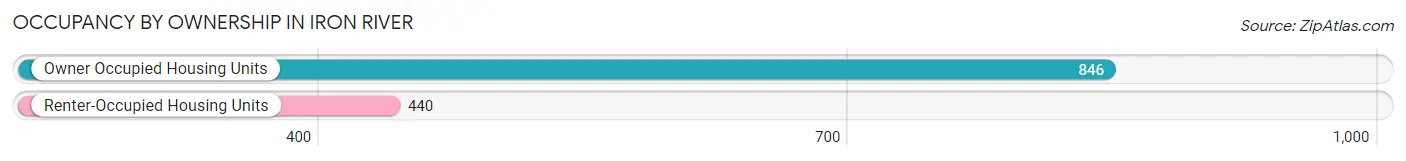
| Occupancy | # Housing Units | % Housing Units |
| Owner Occupied Housing Units | 846 | 65.8% |
| Renter-Occupied Housing Units | 440 | 34.2% |
| Total Occupied Housing Units | 1,286 | 100.0% |
Occupancy by Household Size in Iron River
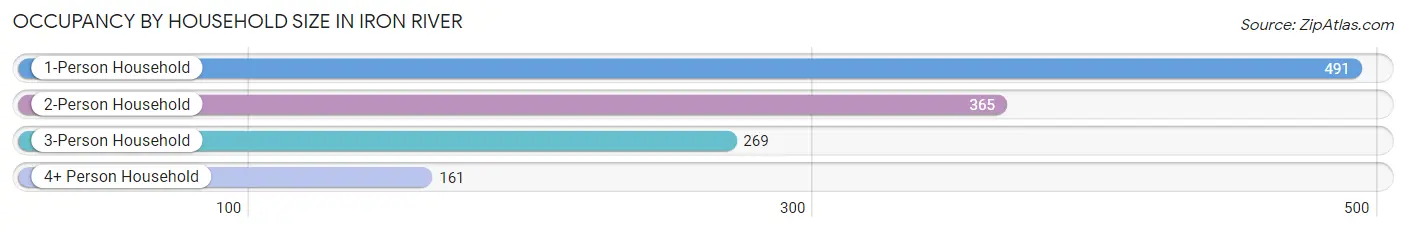
| Household Size | # Housing Units | % Housing Units |
| 1-Person Household | 491 | 38.2% |
| 2-Person Household | 365 | 28.4% |
| 3-Person Household | 269 | 20.9% |
| 4+ Person Household | 161 | 12.5% |
| Total Housing Units | 1,286 | 100.0% |
Occupancy by Ownership by Household Size in Iron River
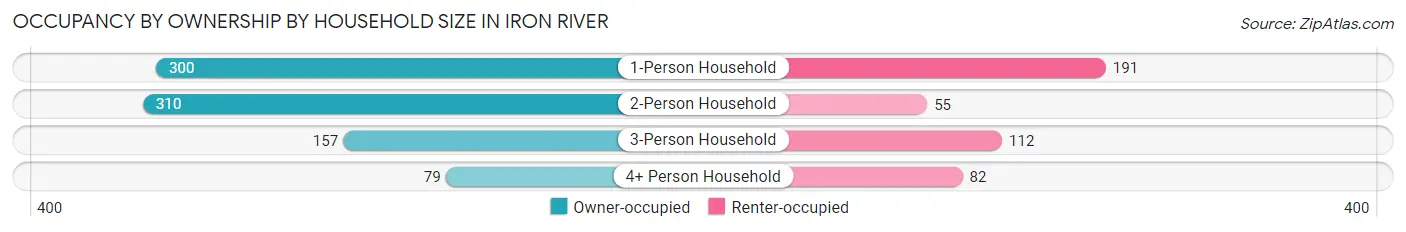
| Household Size | Owner-occupied | Renter-occupied |
| 1-Person Household | 300 (61.1%) | 191 (38.9%) |
| 2-Person Household | 310 (84.9%) | 55 (15.1%) |
| 3-Person Household | 157 (58.4%) | 112 (41.6%) |
| 4+ Person Household | 79 (49.1%) | 82 (50.9%) |
| Total Housing Units | 846 (65.8%) | 440 (34.2%) |
Occupancy by Educational Attainment in Iron River
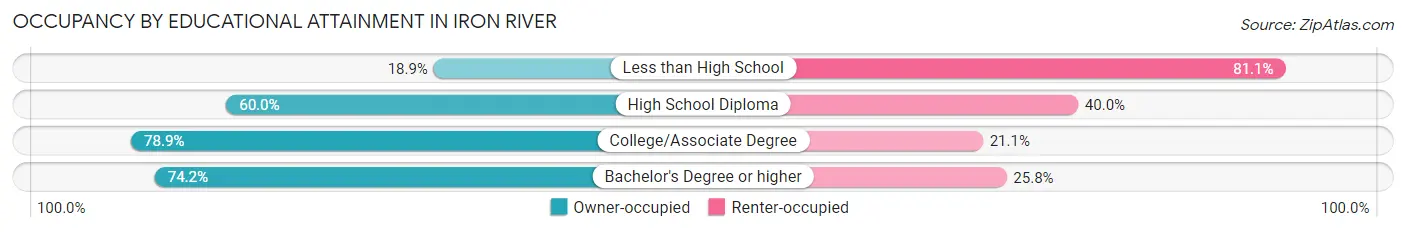
| Household Size | Owner-occupied | Renter-occupied |
| Less than High School | 17 (18.9%) | 73 (81.1%) |
| High School Diploma | 327 (60.0%) | 218 (40.0%) |
| College/Associate Degree | 321 (78.9%) | 86 (21.1%) |
| Bachelor's Degree or higher | 181 (74.2%) | 63 (25.8%) |
Occupancy by Age of Householder in Iron River
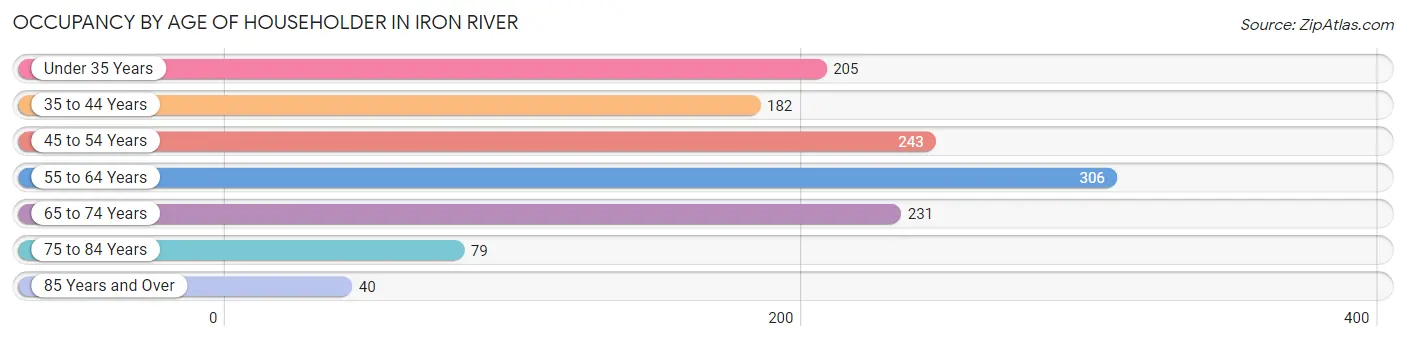
| Age Bracket | # Households | % Households |
| Under 35 Years | 205 | 15.9% |
| 35 to 44 Years | 182 | 14.1% |
| 45 to 54 Years | 243 | 18.9% |
| 55 to 64 Years | 306 | 23.8% |
| 65 to 74 Years | 231 | 18.0% |
| 75 to 84 Years | 79 | 6.1% |
| 85 Years and Over | 40 | 3.1% |
| Total | 1,286 | 100.0% |
Housing Finances in Iron River
Median Income by Occupancy in Iron River
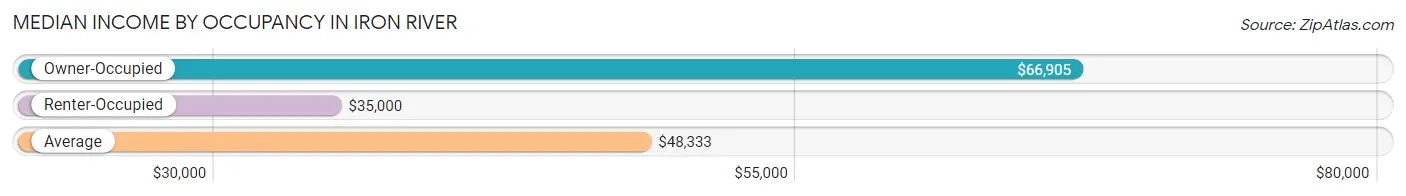
| Occupancy Type | # Households | Median Income |
| Owner-Occupied | 846 (65.8%) | $66,905 |
| Renter-Occupied | 440 (34.2%) | $35,000 |
| Average | 1,286 (100.0%) | $48,333 |
Occupancy by Householder Income Bracket in Iron River
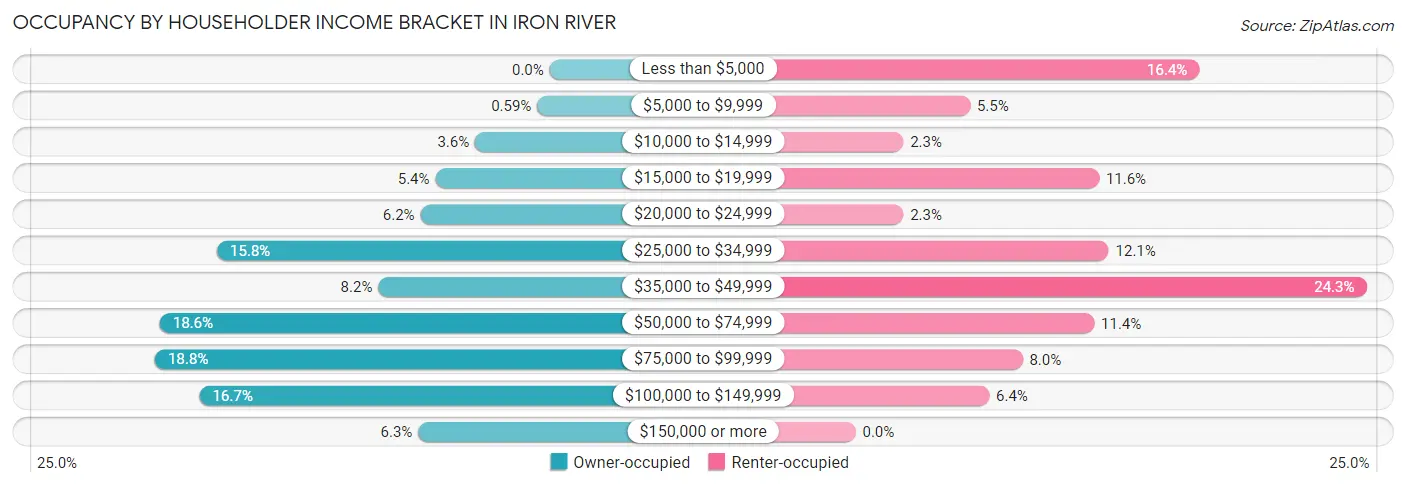
| Income Bracket | Owner-occupied | Renter-occupied |
| Less than $5,000 | 0 (0.0%) | 72 (16.4%) |
| $5,000 to $9,999 | 5 (0.6%) | 24 (5.4%) |
| $10,000 to $14,999 | 30 (3.5%) | 10 (2.3%) |
| $15,000 to $19,999 | 46 (5.4%) | 51 (11.6%) |
| $20,000 to $24,999 | 52 (6.1%) | 10 (2.3%) |
| $25,000 to $34,999 | 134 (15.8%) | 53 (12.0%) |
| $35,000 to $49,999 | 69 (8.2%) | 107 (24.3%) |
| $50,000 to $74,999 | 157 (18.6%) | 50 (11.4%) |
| $75,000 to $99,999 | 159 (18.8%) | 35 (8.0%) |
| $100,000 to $149,999 | 141 (16.7%) | 28 (6.4%) |
| $150,000 or more | 53 (6.3%) | 0 (0.0%) |
| Total | 846 (100.0%) | 440 (100.0%) |
Monthly Housing Cost Tiers in Iron River
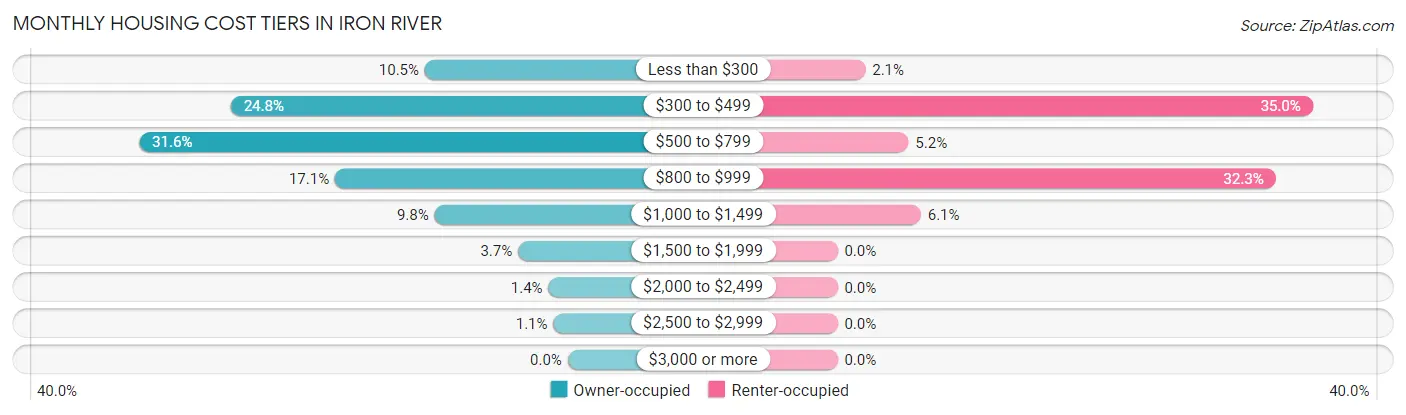
| Monthly Cost | Owner-occupied | Renter-occupied |
| Less than $300 | 89 (10.5%) | 9 (2.1%) |
| $300 to $499 | 210 (24.8%) | 154 (35.0%) |
| $500 to $799 | 267 (31.6%) | 23 (5.2%) |
| $800 to $999 | 145 (17.1%) | 142 (32.3%) |
| $1,000 to $1,499 | 83 (9.8%) | 27 (6.1%) |
| $1,500 to $1,999 | 31 (3.7%) | 0 (0.0%) |
| $2,000 to $2,499 | 12 (1.4%) | 0 (0.0%) |
| $2,500 to $2,999 | 9 (1.1%) | 0 (0.0%) |
| $3,000 or more | 0 (0.0%) | 0 (0.0%) |
| Total | 846 (100.0%) | 440 (100.0%) |
Physical Housing Characteristics in Iron River
Housing Structures in Iron River
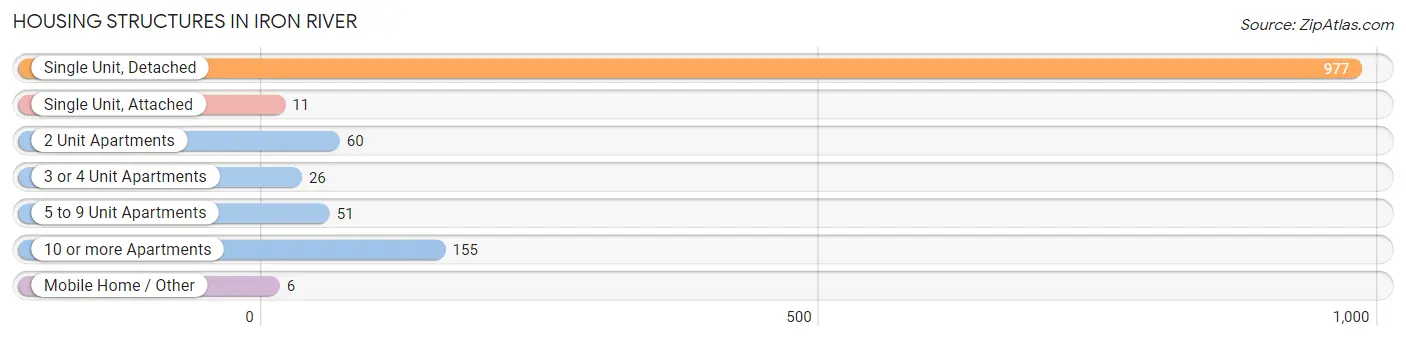
| Structure Type | # Housing Units | % Housing Units |
| Single Unit, Detached | 977 | 76.0% |
| Single Unit, Attached | 11 | 0.9% |
| 2 Unit Apartments | 60 | 4.7% |
| 3 or 4 Unit Apartments | 26 | 2.0% |
| 5 to 9 Unit Apartments | 51 | 4.0% |
| 10 or more Apartments | 155 | 12.0% |
| Mobile Home / Other | 6 | 0.5% |
| Total | 1,286 | 100.0% |
Housing Structures by Occupancy in Iron River
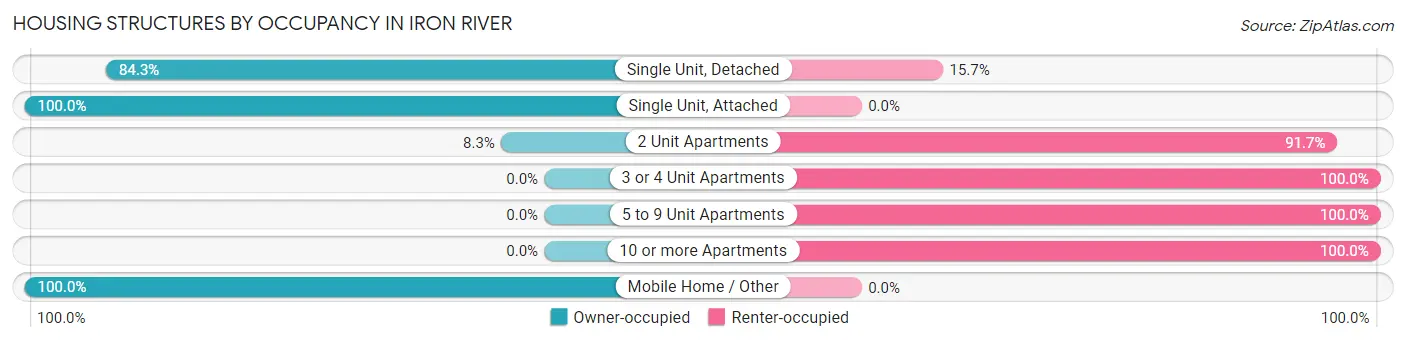
| Structure Type | Owner-occupied | Renter-occupied |
| Single Unit, Detached | 824 (84.3%) | 153 (15.7%) |
| Single Unit, Attached | 11 (100.0%) | 0 (0.0%) |
| 2 Unit Apartments | 5 (8.3%) | 55 (91.7%) |
| 3 or 4 Unit Apartments | 0 (0.0%) | 26 (100.0%) |
| 5 to 9 Unit Apartments | 0 (0.0%) | 51 (100.0%) |
| 10 or more Apartments | 0 (0.0%) | 155 (100.0%) |
| Mobile Home / Other | 6 (100.0%) | 0 (0.0%) |
| Total | 846 (65.8%) | 440 (34.2%) |
Housing Structures by Number of Rooms in Iron River
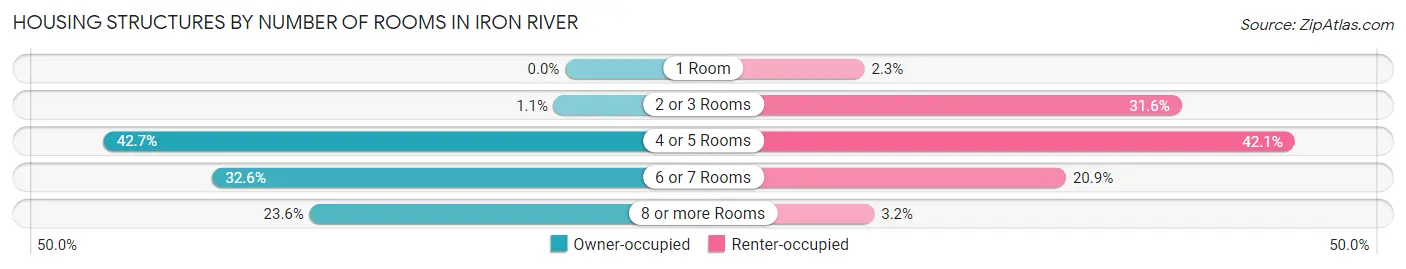
| Number of Rooms | Owner-occupied | Renter-occupied |
| 1 Room | 0 (0.0%) | 10 (2.3%) |
| 2 or 3 Rooms | 9 (1.1%) | 139 (31.6%) |
| 4 or 5 Rooms | 361 (42.7%) | 185 (42.0%) |
| 6 or 7 Rooms | 276 (32.6%) | 92 (20.9%) |
| 8 or more Rooms | 200 (23.6%) | 14 (3.2%) |
| Total | 846 (100.0%) | 440 (100.0%) |
Housing Structure by Heating Type in Iron River
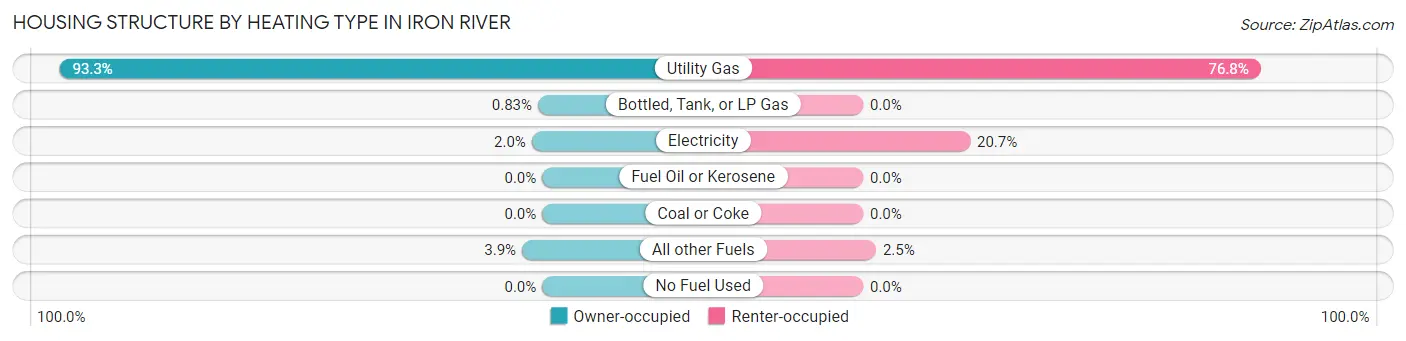
| Heating Type | Owner-occupied | Renter-occupied |
| Utility Gas | 789 (93.3%) | 338 (76.8%) |
| Bottled, Tank, or LP Gas | 7 (0.8%) | 0 (0.0%) |
| Electricity | 17 (2.0%) | 91 (20.7%) |
| Fuel Oil or Kerosene | 0 (0.0%) | 0 (0.0%) |
| Coal or Coke | 0 (0.0%) | 0 (0.0%) |
| All other Fuels | 33 (3.9%) | 11 (2.5%) |
| No Fuel Used | 0 (0.0%) | 0 (0.0%) |
| Total | 846 (100.0%) | 440 (100.0%) |
Household Vehicle Usage in Iron River
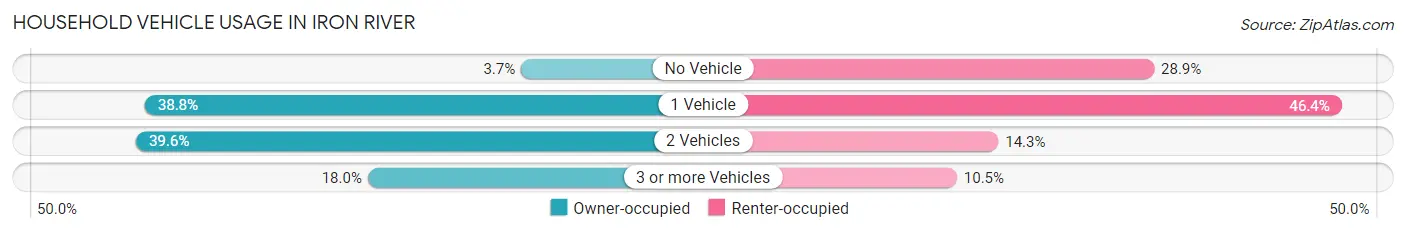
| Vehicles per Household | Owner-occupied | Renter-occupied |
| No Vehicle | 31 (3.7%) | 127 (28.9%) |
| 1 Vehicle | 328 (38.8%) | 204 (46.4%) |
| 2 Vehicles | 335 (39.6%) | 63 (14.3%) |
| 3 or more Vehicles | 152 (18.0%) | 46 (10.4%) |
| Total | 846 (100.0%) | 440 (100.0%) |
Real Estate & Mortgages in Iron River
Real Estate and Mortgage Overview in Iron River
| Characteristic | Without Mortgage | With Mortgage |
| Housing Units | 471 | 375 |
| Median Property Value | $57,900 | $79,300 |
| Median Household Income | $66,555 | $34 |
| Monthly Housing Costs | $437 | $0 |
| Real Estate Taxes | $983 | $13 |
Property Value by Mortgage Status in Iron River
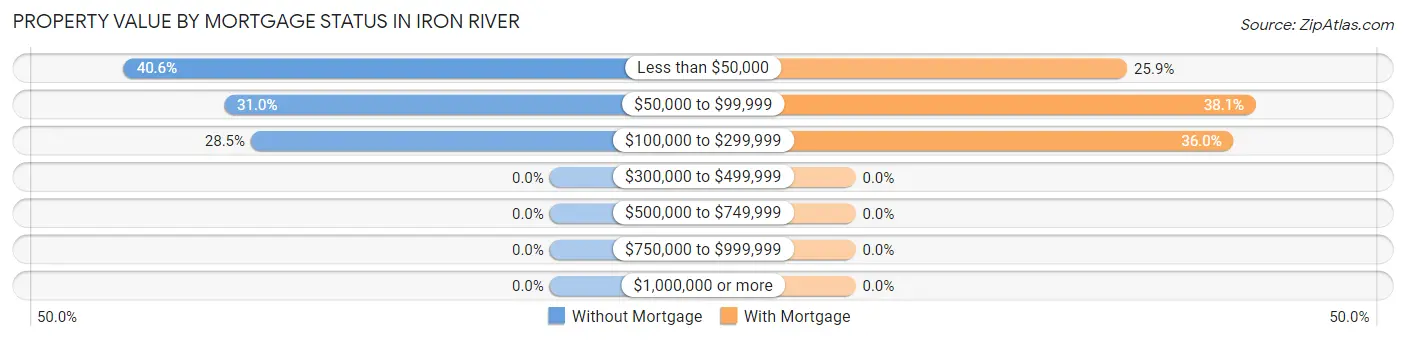
| Property Value | Without Mortgage | With Mortgage |
| Less than $50,000 | 191 (40.6%) | 97 (25.9%) |
| $50,000 to $99,999 | 146 (31.0%) | 143 (38.1%) |
| $100,000 to $299,999 | 134 (28.4%) | 135 (36.0%) |
| $300,000 to $499,999 | 0 (0.0%) | 0 (0.0%) |
| $500,000 to $749,999 | 0 (0.0%) | 0 (0.0%) |
| $750,000 to $999,999 | 0 (0.0%) | 0 (0.0%) |
| $1,000,000 or more | 0 (0.0%) | 0 (0.0%) |
| Total | 471 (100.0%) | 375 (100.0%) |
Household Income by Mortgage Status in Iron River
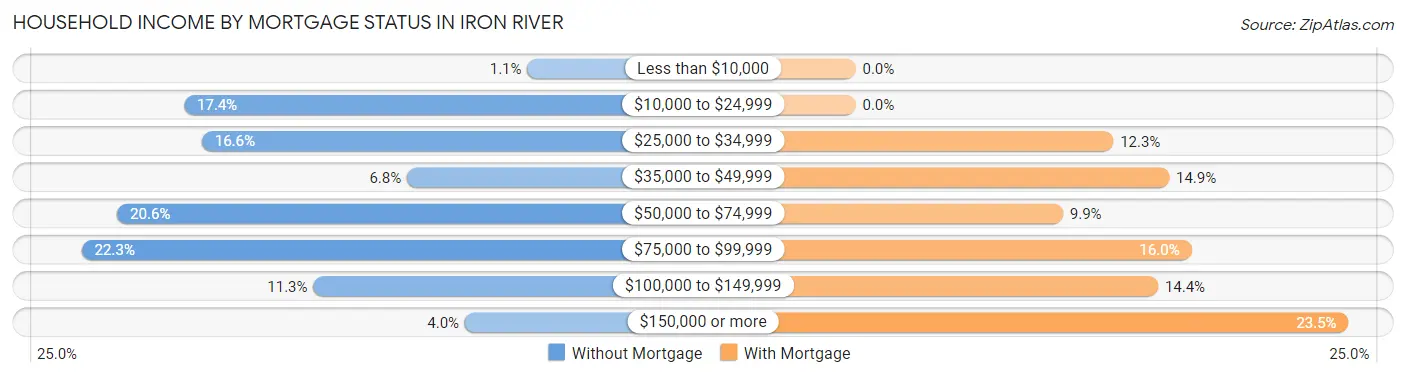
| Household Income | Without Mortgage | With Mortgage |
| Less than $10,000 | 5 (1.1%) | 0 (0.0%) |
| $10,000 to $24,999 | 82 (17.4%) | 0 (0.0%) |
| $25,000 to $34,999 | 78 (16.6%) | 46 (12.3%) |
| $35,000 to $49,999 | 32 (6.8%) | 56 (14.9%) |
| $50,000 to $74,999 | 97 (20.6%) | 37 (9.9%) |
| $75,000 to $99,999 | 105 (22.3%) | 60 (16.0%) |
| $100,000 to $149,999 | 53 (11.3%) | 54 (14.4%) |
| $150,000 or more | 19 (4.0%) | 88 (23.5%) |
| Total | 471 (100.0%) | 375 (100.0%) |
Property Value to Household Income Ratio in Iron River
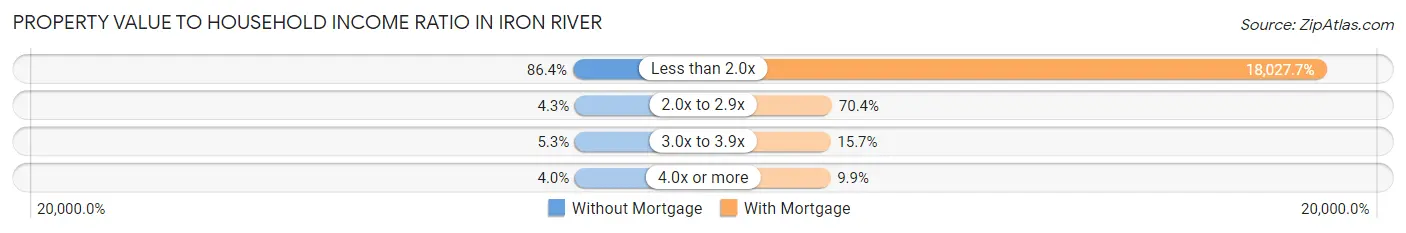
| Value-to-Income Ratio | Without Mortgage | With Mortgage |
| Less than 2.0x | 407 (86.4%) | 67,604 (18,027.7%) |
| 2.0x to 2.9x | 20 (4.3%) | 264 (70.4%) |
| 3.0x to 3.9x | 25 (5.3%) | 59 (15.7%) |
| 4.0x or more | 19 (4.0%) | 37 (9.9%) |
| Total | 471 (100.0%) | 375 (100.0%) |
Real Estate Taxes by Mortgage Status in Iron River
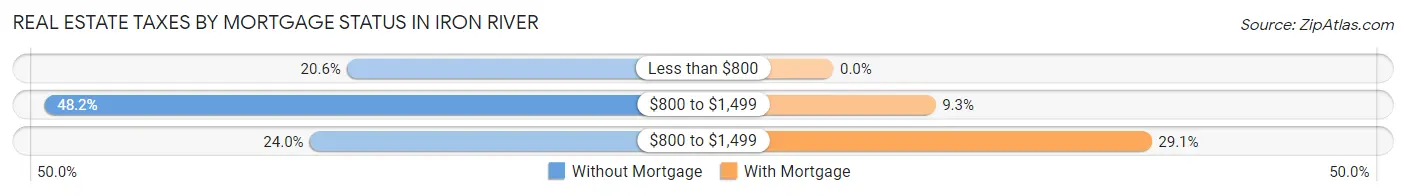
| Property Taxes | Without Mortgage | With Mortgage |
| Less than $800 | 97 (20.6%) | 0 (0.0%) |
| $800 to $1,499 | 227 (48.2%) | 35 (9.3%) |
| $800 to $1,499 | 113 (24.0%) | 109 (29.1%) |
| Total | 471 (100.0%) | 375 (100.0%) |
Health & Disability in Iron River
Health Insurance Coverage by Age in Iron River
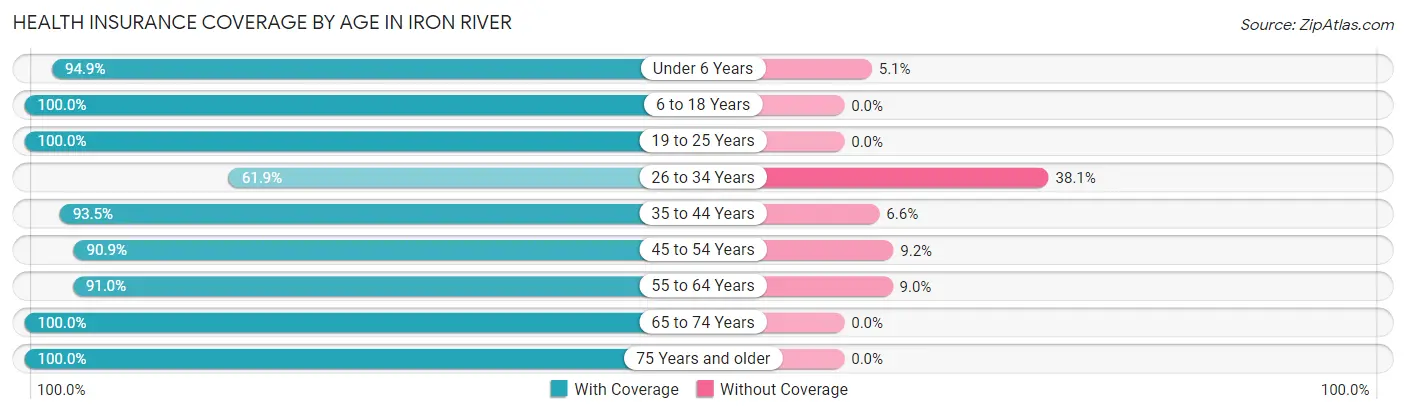
| Age Bracket | With Coverage | Without Coverage |
| Under 6 Years | 185 (94.9%) | 10 (5.1%) |
| 6 to 18 Years | 393 (100.0%) | 0 (0.0%) |
| 19 to 25 Years | 391 (100.0%) | 0 (0.0%) |
| 26 to 34 Years | 169 (61.9%) | 104 (38.1%) |
| 35 to 44 Years | 314 (93.4%) | 22 (6.6%) |
| 45 to 54 Years | 288 (90.8%) | 29 (9.1%) |
| 55 to 64 Years | 505 (91.0%) | 50 (9.0%) |
| 65 to 74 Years | 310 (100.0%) | 0 (0.0%) |
| 75 Years and older | 171 (100.0%) | 0 (0.0%) |
| Total | 2,726 (92.7%) | 215 (7.3%) |
Health Insurance Coverage by Citizenship Status in Iron River
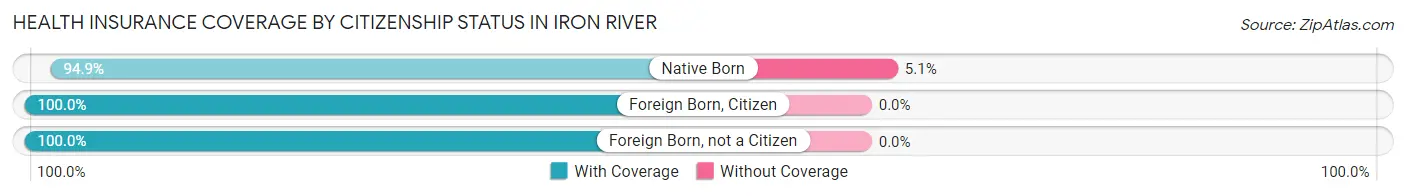
| Citizenship Status | With Coverage | Without Coverage |
| Native Born | 185 (94.9%) | 10 (5.1%) |
| Foreign Born, Citizen | 393 (100.0%) | 0 (0.0%) |
| Foreign Born, not a Citizen | 391 (100.0%) | 0 (0.0%) |
Health Insurance Coverage by Household Income in Iron River
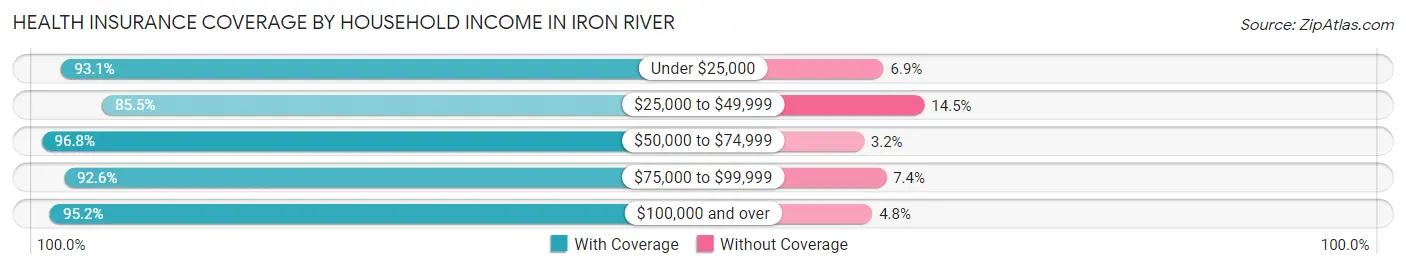
| Household Income | With Coverage | Without Coverage |
| Under $25,000 | 445 (93.1%) | 33 (6.9%) |
| $25,000 to $49,999 | 582 (85.5%) | 99 (14.5%) |
| $50,000 to $74,999 | 668 (96.8%) | 22 (3.2%) |
| $75,000 to $99,999 | 376 (92.6%) | 30 (7.4%) |
| $100,000 and over | 619 (95.2%) | 31 (4.8%) |
Public vs Private Health Insurance Coverage by Age in Iron River
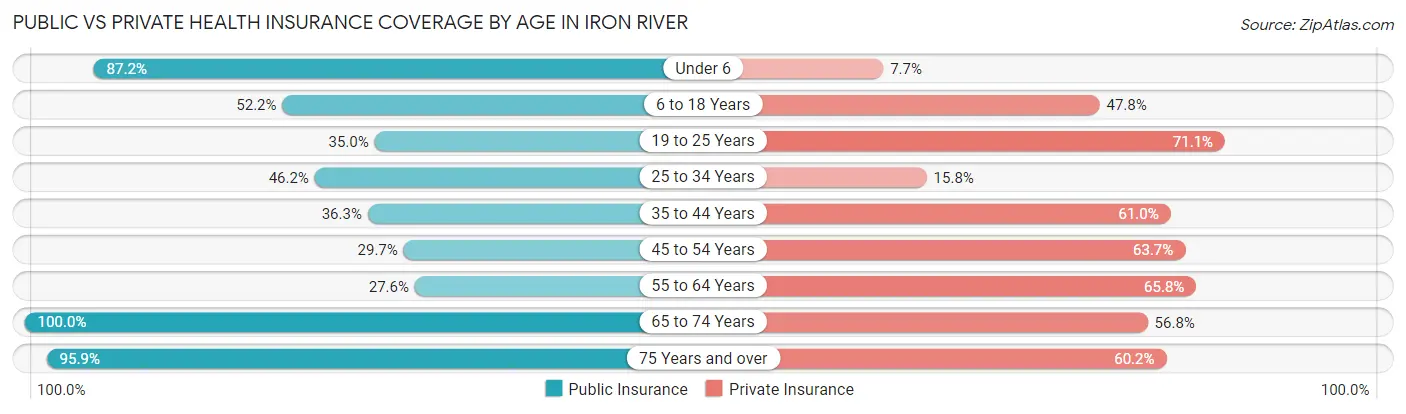
| Age Bracket | Public Insurance | Private Insurance |
| Under 6 | 170 (87.2%) | 15 (7.7%) |
| 6 to 18 Years | 205 (52.2%) | 188 (47.8%) |
| 19 to 25 Years | 137 (35.0%) | 278 (71.1%) |
| 25 to 34 Years | 126 (46.2%) | 43 (15.8%) |
| 35 to 44 Years | 122 (36.3%) | 205 (61.0%) |
| 45 to 54 Years | 94 (29.6%) | 202 (63.7%) |
| 55 to 64 Years | 153 (27.6%) | 365 (65.8%) |
| 65 to 74 Years | 310 (100.0%) | 176 (56.8%) |
| 75 Years and over | 164 (95.9%) | 103 (60.2%) |
| Total | 1,481 (50.4%) | 1,575 (53.5%) |
Disability Status by Sex by Age in Iron River
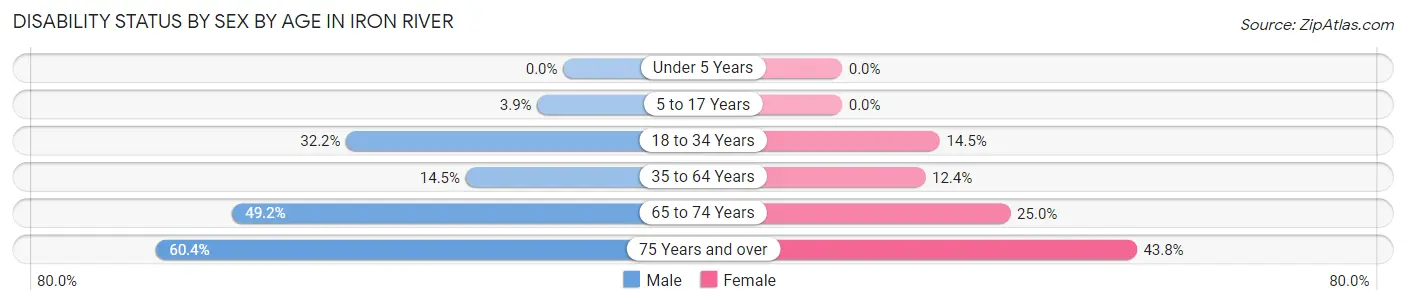
| Age Bracket | Male | Female |
| Under 5 Years | 0 (0.0%) | 0 (0.0%) |
| 5 to 17 Years | 6 (3.8%) | 0 (0.0%) |
| 18 to 34 Years | 125 (32.2%) | 42 (14.5%) |
| 35 to 64 Years | 87 (14.5%) | 75 (12.4%) |
| 65 to 74 Years | 58 (49.1%) | 48 (25.0%) |
| 75 Years and over | 55 (60.4%) | 35 (43.8%) |
Disability Class by Sex by Age in Iron River
Disability Class: Hearing Difficulty
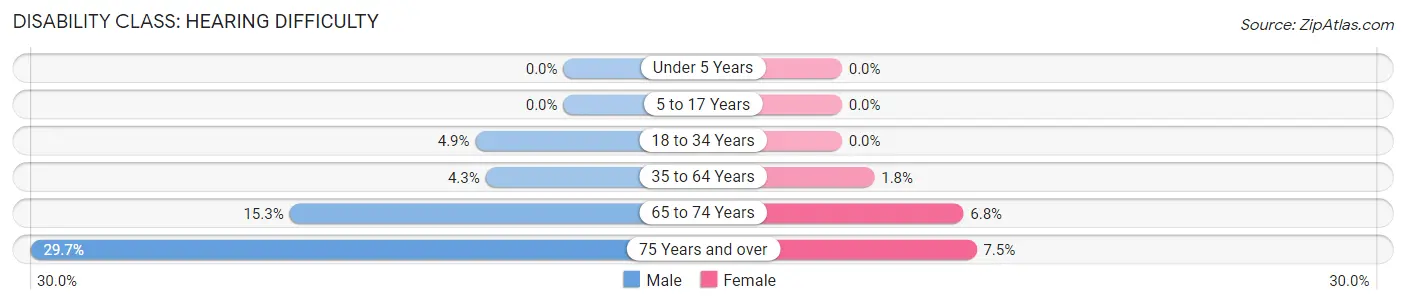
| Age Bracket | Male | Female |
| Under 5 Years | 0 (0.0%) | 0 (0.0%) |
| 5 to 17 Years | 0 (0.0%) | 0 (0.0%) |
| 18 to 34 Years | 19 (4.9%) | 0 (0.0%) |
| 35 to 64 Years | 26 (4.3%) | 11 (1.8%) |
| 65 to 74 Years | 18 (15.2%) | 13 (6.8%) |
| 75 Years and over | 27 (29.7%) | 6 (7.5%) |
Disability Class: Vision Difficulty
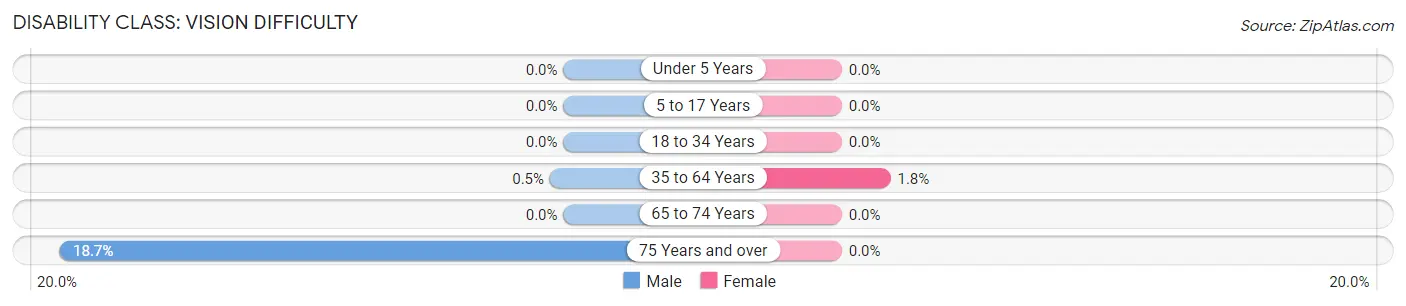
| Age Bracket | Male | Female |
| Under 5 Years | 0 (0.0%) | 0 (0.0%) |
| 5 to 17 Years | 0 (0.0%) | 0 (0.0%) |
| 18 to 34 Years | 0 (0.0%) | 0 (0.0%) |
| 35 to 64 Years | 3 (0.5%) | 11 (1.8%) |
| 65 to 74 Years | 0 (0.0%) | 0 (0.0%) |
| 75 Years and over | 17 (18.7%) | 0 (0.0%) |
Disability Class: Cognitive Difficulty
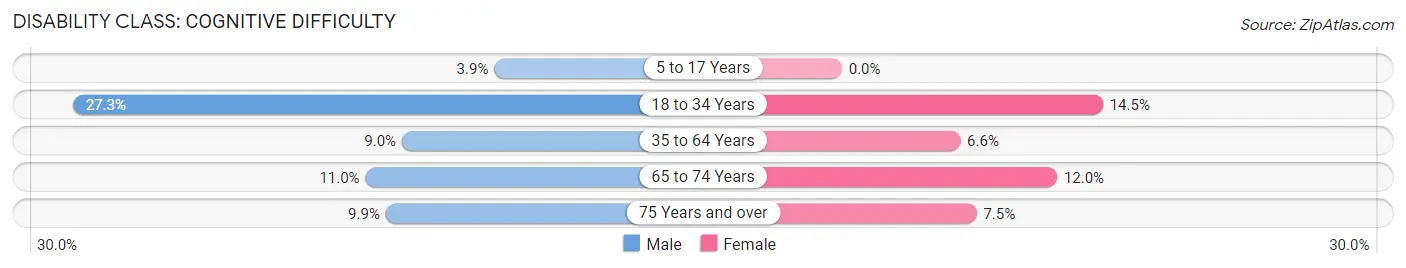
| Age Bracket | Male | Female |
| 5 to 17 Years | 6 (3.8%) | 0 (0.0%) |
| 18 to 34 Years | 106 (27.3%) | 42 (14.5%) |
| 35 to 64 Years | 54 (9.0%) | 40 (6.6%) |
| 65 to 74 Years | 13 (11.0%) | 23 (12.0%) |
| 75 Years and over | 9 (9.9%) | 6 (7.5%) |
Disability Class: Ambulatory Difficulty
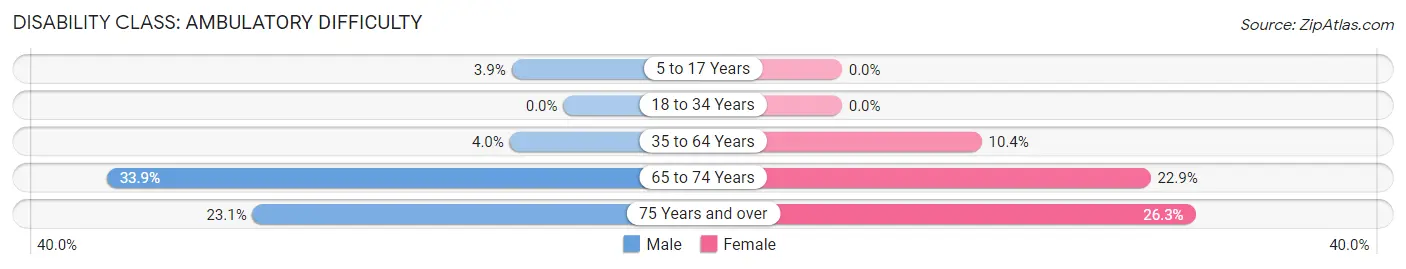
| Age Bracket | Male | Female |
| 5 to 17 Years | 6 (3.8%) | 0 (0.0%) |
| 18 to 34 Years | 0 (0.0%) | 0 (0.0%) |
| 35 to 64 Years | 24 (4.0%) | 63 (10.4%) |
| 65 to 74 Years | 40 (33.9%) | 44 (22.9%) |
| 75 Years and over | 21 (23.1%) | 21 (26.3%) |
Disability Class: Self-Care Difficulty
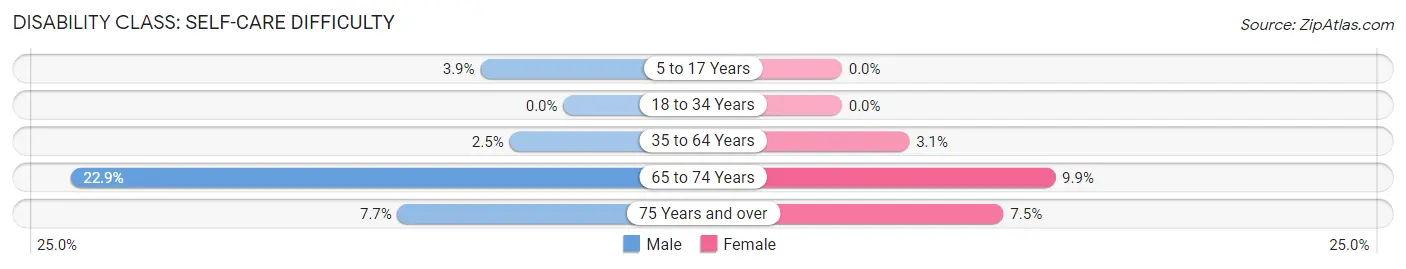
| Age Bracket | Male | Female |
| 5 to 17 Years | 6 (3.8%) | 0 (0.0%) |
| 18 to 34 Years | 0 (0.0%) | 0 (0.0%) |
| 35 to 64 Years | 15 (2.5%) | 19 (3.1%) |
| 65 to 74 Years | 27 (22.9%) | 19 (9.9%) |
| 75 Years and over | 7 (7.7%) | 6 (7.5%) |
Technology Access in Iron River
Computing Device Access in Iron River
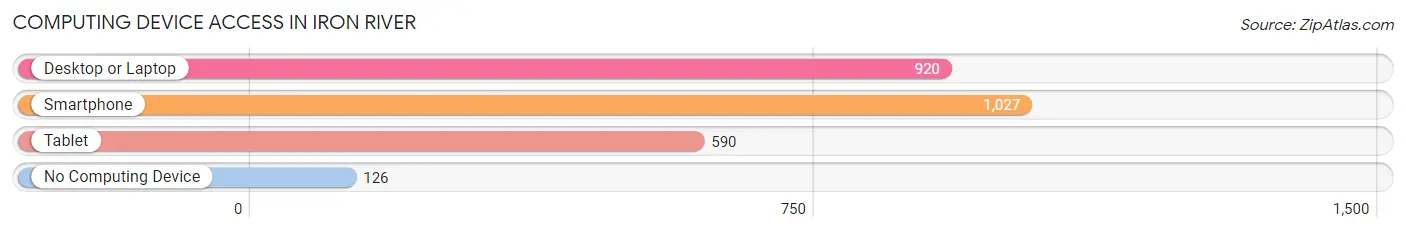
| Device Type | # Households | % Households |
| Desktop or Laptop | 920 | 71.5% |
| Smartphone | 1,027 | 79.9% |
| Tablet | 590 | 45.9% |
| No Computing Device | 126 | 9.8% |
| Total | 1,286 | 100.0% |
Internet Access in Iron River
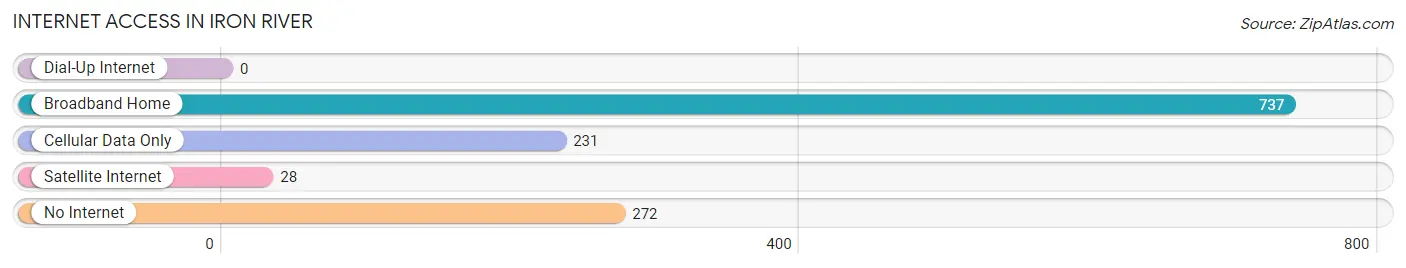
| Internet Type | # Households | % Households |
| Dial-Up Internet | 0 | 0.0% |
| Broadband Home | 737 | 57.3% |
| Cellular Data Only | 231 | 18.0% |
| Satellite Internet | 28 | 2.2% |
| No Internet | 272 | 21.1% |
| Total | 1,286 | 100.0% |
Iron River Summary
Iron River is a city located in Iron County, Michigan, United States. It is the county seat of Iron County. The population was 3,029 at the 2010 census. It is the principal city of the Iron River Micropolitan Statistical Area, which includes all of Iron County.
History
Iron River was first settled in 1885 by a group of Swedish immigrants. The city was named after the nearby Iron River, which was named for the iron ore found in the area. The first post office was established in 1887. The city was incorporated in 1889.
Iron River was an important center for the lumber industry in the late 19th and early 20th centuries. The city was also home to a large iron ore mine, which operated from the late 19th century until the mid-20th century.
Geography
Iron River is located at 46°25′N 88°37′W (46.4133, -88.6167). According to the United States Census Bureau, the city has a total area of 3.2 square miles (8.3 km2), all land.
Economy
Iron River's economy is largely based on tourism and the service industry. The city is home to several restaurants, hotels, and other businesses that cater to tourists. The city is also home to several manufacturing companies, including a paper mill and a steel mill.
Demographics
As of the census of 2010, there were 3,029 people, 1,310 households, and 790 families residing in the city. The population density was 945.3 inhabitants per square mile (364.7/km2). There were 1,521 housing units at an average density of 476.6 per square mile (184.2/km2). The racial makeup of the city was 97.2% White, 0.3% African American, 0.7% Native American, 0.3% Asian, 0.1% Pacific Islander, 0.3% from other races, and 1.2% from two or more races. Hispanic or Latino of any race were 1.3% of the population.
There were 1,310 households, of which 28.2% had children under the age of 18 living with them, 44.2% were married couples living together, 12.7% had a female householder with no husband present, 5.2% had a male householder with no wife present, and 38.0% were non-families. 33.2% of all households were made up of individuals, and 16.2% had someone living alone who was 65 years of age or older. The average household size was 2.30 and the average family size was 2.90.
The median age in the city was 43.2 years. 22.7% of residents were under the age of 18; 7.2% were between the ages of 18 and 24; 22.7% were from 25 to 44; 28.2% were from 45 to 64; and 19.2% were 65 years of age or older. The gender makeup of the city was 48.2% male and 51.8% female.
Conclusion
Iron River is a city located in Iron County, Michigan, United States. It is the county seat of Iron County and has a population of 3,029 as of the 2010 census. The city's economy is largely based on tourism and the service industry, and it is home to several manufacturing companies. The city is also home to a large iron ore mine, which operated from the late 19th century until the mid-20th century. The racial makeup of the city is 97.2% White, 0.3% African American, 0.7% Native American, 0.3% Asian, 0.1% Pacific Islander, 0.3% from other races, and 1.2% from two or more races. The median age in the city is 43.2 years, and the gender makeup is 48.2% male and 51.8% female.
Common Questions
What is Per Capita Income in Iron River?
Per Capita income in Iron River is $26,206.
What is the Median Family Income in Iron River?
Median Family Income in Iron River is $68,241.
What is the Median Household income in Iron River?
Median Household Income in Iron River is $48,333.
What is Income or Wage Gap in Iron River?
Income or Wage Gap in Iron River is 9.2%.
Women in Iron River earn 90.8 cents for every dollar earned by a man.
What is Family Income Deficit in Iron River?
Family Income Deficit in Iron River is $16,376.
Families that are below poverty line in Iron River earn $16,376 less on average than the poverty threshold level.
What is Inequality or Gini Index in Iron River?
Inequality or Gini Index in Iron River is 0.40.
What is the Total Population of Iron River?
Total Population of Iron River is 2,995.
What is the Total Male Population of Iron River?
Total Male Population of Iron River is 1,456.
What is the Total Female Population of Iron River?
Total Female Population of Iron River is 1,539.
What is the Ratio of Males per 100 Females in Iron River?
There are 94.61 Males per 100 Females in Iron River.
What is the Ratio of Females per 100 Males in Iron River?
There are 105.70 Females per 100 Males in Iron River.
What is the Median Population Age in Iron River?
Median Population Age in Iron River is 41.3 Years.
What is the Average Family Size in Iron River
Average Family Size in Iron River is 2.9 People.
What is the Average Household Size in Iron River
Average Household Size in Iron River is 2.3 People.
How Large is the Labor Force in Iron River?
There are 1,511 People in the Labor Forcein in Iron River.
What is the Percentage of People in the Labor Force in Iron River?
60.7% of People are in the Labor Force in Iron River.
What is the Unemployment Rate in Iron River?
Unemployment Rate in Iron River is 4.2%.