Henderson, MI Map & Demographics
Henderson Map
Henderson Overview
$35,501
PER CAPITA INCOME
$97,813
AVG FAMILY INCOME
$76,750
AVG HOUSEHOLD INCOME
51.9%
WAGE / INCOME GAP [ % ]
48.1¢/ $1
WAGE / INCOME GAP [ $ ]
0.34
INEQUALITY / GINI INDEX
288
TOTAL POPULATION
163
MALE POPULATION
125
FEMALE POPULATION
130.40
MALES / 100 FEMALES
76.69
FEMALES / 100 MALES
53.4
MEDIAN AGE
2.6
AVG FAMILY SIZE
2.1
AVG HOUSEHOLD SIZE
167
LABOR FORCE [ PEOPLE ]
64.7%
PERCENT IN LABOR FORCE
3.6%
UNEMPLOYMENT RATE
Henderson Zip Codes
Henderson Area Codes
Income in Henderson
Income Overview in Henderson
Per Capita Income in Henderson is $35,501, while median incomes of families and households are $97,813 and $76,750 respectively.
| Characteristic | Number | Measure |
| Per Capita Income | 288 | $35,501 |
| Median Family Income | 83 | $97,813 |
| Mean Family Income | 83 | $82,912 |
| Median Household Income | 140 | $76,750 |
| Mean Household Income | 140 | $73,177 |
| Income Deficit | 83 | $0 |
| Wage / Income Gap (%) | 288 | 51.95% |
| Wage / Income Gap ($) | 288 | 48.05¢ per $1 |
| Gini / Inequality Index | 288 | 0.34 |
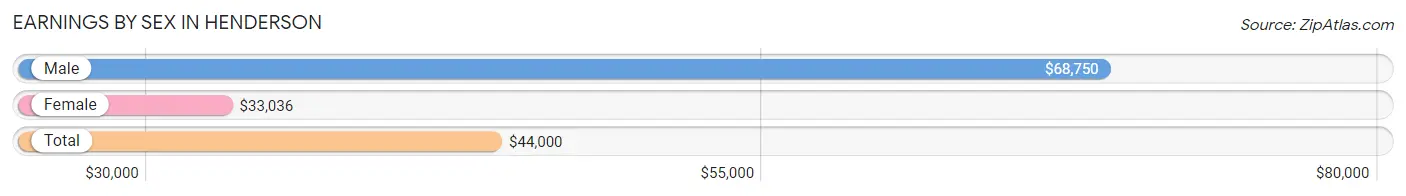
Earnings by Sex in Henderson
Average Earnings in Henderson are $44,000, $68,750 for men and $33,036 for women, a difference of 51.9%.
| Sex | Number | Average Earnings |
| Male | 110 (66.3%) | $68,750 |
| Female | 56 (33.7%) | $33,036 |
| Total | 166 (100.0%) | $44,000 |
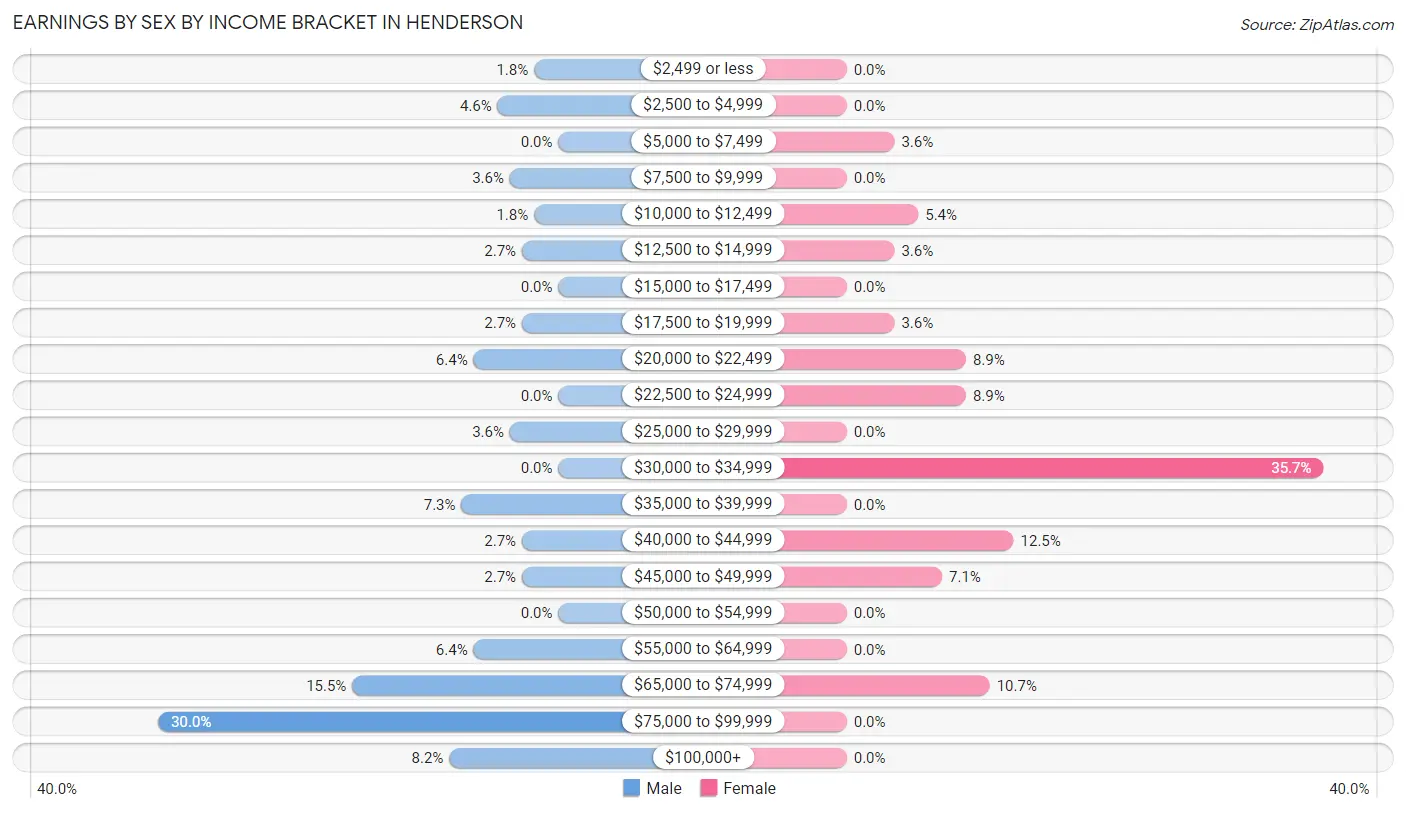
Earnings by Sex by Income Bracket in Henderson
The most common earnings brackets in Henderson are $75,000 to $99,999 for men (33 | 30.0%) and $30,000 to $34,999 for women (20 | 35.7%).
| Income | Male | Female |
| $2,499 or less | 2 (1.8%) | 0 (0.0%) |
| $2,500 to $4,999 | 5 (4.5%) | 0 (0.0%) |
| $5,000 to $7,499 | 0 (0.0%) | 2 (3.6%) |
| $7,500 to $9,999 | 4 (3.6%) | 0 (0.0%) |
| $10,000 to $12,499 | 2 (1.8%) | 3 (5.4%) |
| $12,500 to $14,999 | 3 (2.7%) | 2 (3.6%) |
| $15,000 to $17,499 | 0 (0.0%) | 0 (0.0%) |
| $17,500 to $19,999 | 3 (2.7%) | 2 (3.6%) |
| $20,000 to $22,499 | 7 (6.4%) | 5 (8.9%) |
| $22,500 to $24,999 | 0 (0.0%) | 5 (8.9%) |
| $25,000 to $29,999 | 4 (3.6%) | 0 (0.0%) |
| $30,000 to $34,999 | 0 (0.0%) | 20 (35.7%) |
| $35,000 to $39,999 | 8 (7.3%) | 0 (0.0%) |
| $40,000 to $44,999 | 3 (2.7%) | 7 (12.5%) |
| $45,000 to $49,999 | 3 (2.7%) | 4 (7.1%) |
| $50,000 to $54,999 | 0 (0.0%) | 0 (0.0%) |
| $55,000 to $64,999 | 7 (6.4%) | 0 (0.0%) |
| $65,000 to $74,999 | 17 (15.4%) | 6 (10.7%) |
| $75,000 to $99,999 | 33 (30.0%) | 0 (0.0%) |
| $100,000+ | 9 (8.2%) | 0 (0.0%) |
| Total | 110 (100.0%) | 56 (100.0%) |
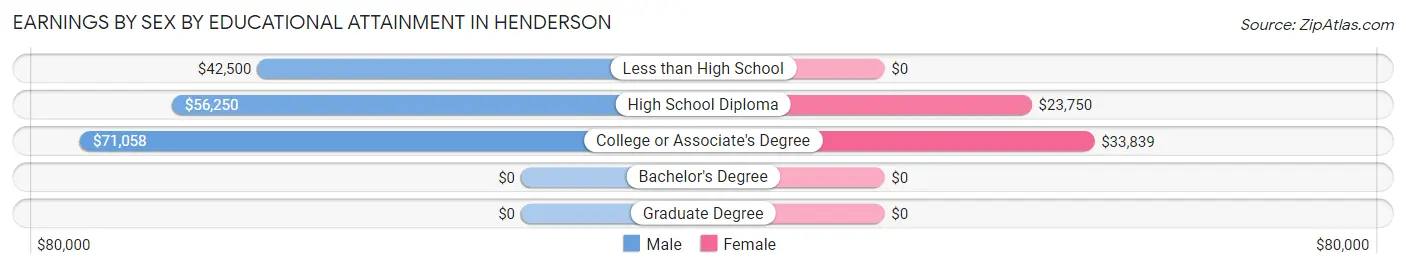
Earnings by Sex by Educational Attainment in Henderson
Average earnings in Henderson are $70,385 for men and $33,036 for women, a difference of 53.1%. Men with an educational attainment of college or associate's degree enjoy the highest average annual earnings of $71,058, while those with less than high school education earn the least with $42,500. Women with an educational attainment of college or associate's degree earn the most with the average annual earnings of $33,839, while those with high school diploma education have the smallest earnings of $23,750.
| Educational Attainment | Male Income | Female Income |
| Less than High School | $42,500 | $0 |
| High School Diploma | $56,250 | $23,750 |
| College or Associate's Degree | $71,058 | $33,839 |
| Bachelor's Degree | - | - |
| Graduate Degree | - | - |
| Total | $70,385 | $33,036 |
Family Income in Henderson
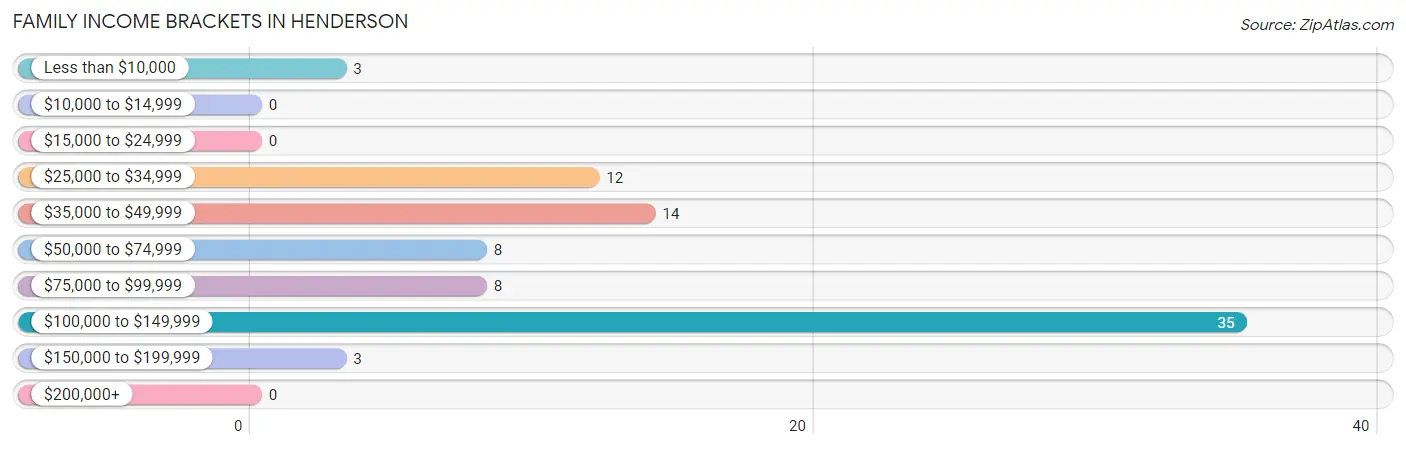
Family Income Brackets in Henderson
According to the Henderson family income data, there are 35 families falling into the $100,000 to $149,999 income range, which is the most common income bracket and makes up 42.2% of all families.
| Income Bracket | # Families | % Families |
| Less than $10,000 | 3 | 3.6% |
| $10,000 to $14,999 | 0 | 0.0% |
| $15,000 to $24,999 | 0 | 0.0% |
| $25,000 to $34,999 | 12 | 14.5% |
| $35,000 to $49,999 | 14 | 16.9% |
| $50,000 to $74,999 | 8 | 9.6% |
| $75,000 to $99,999 | 8 | 9.6% |
| $100,000 to $149,999 | 35 | 42.2% |
| $150,000 to $199,999 | 3 | 3.6% |
| $200,000+ | 0 | 0.0% |
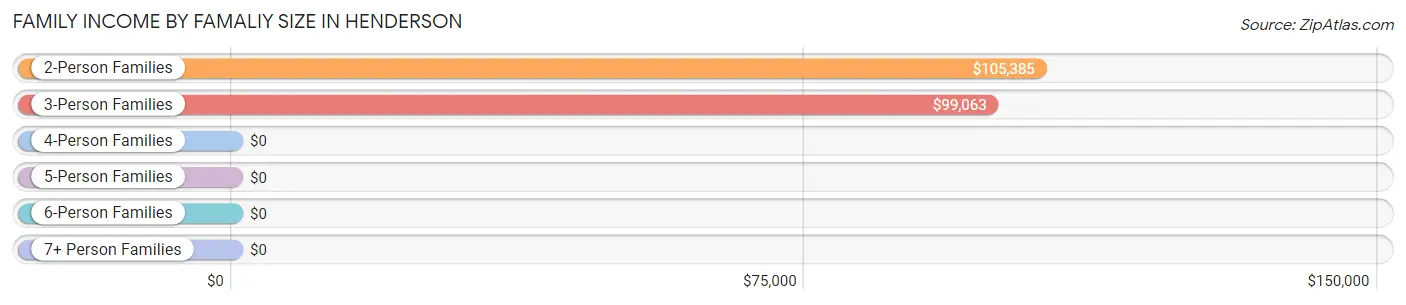
Family Income by Famaliy Size in Henderson
2-person families (52 | 62.6%) account for the highest median family income in Henderson with $105,385 per family, while 2-person families (52 | 62.6%) have the highest median income of $52,692 per family member.
| Income Bracket | # Families | Median Income |
| 2-Person Families | 52 (62.6%) | $105,385 |
| 3-Person Families | 15 (18.1%) | $99,063 |
| 4-Person Families | 14 (16.9%) | $0 |
| 5-Person Families | 0 (0.0%) | $0 |
| 6-Person Families | 2 (2.4%) | $0 |
| 7+ Person Families | 0 (0.0%) | $0 |
| Total | 83 (100.0%) | $97,813 |
Family Income by Number of Earners in Henderson
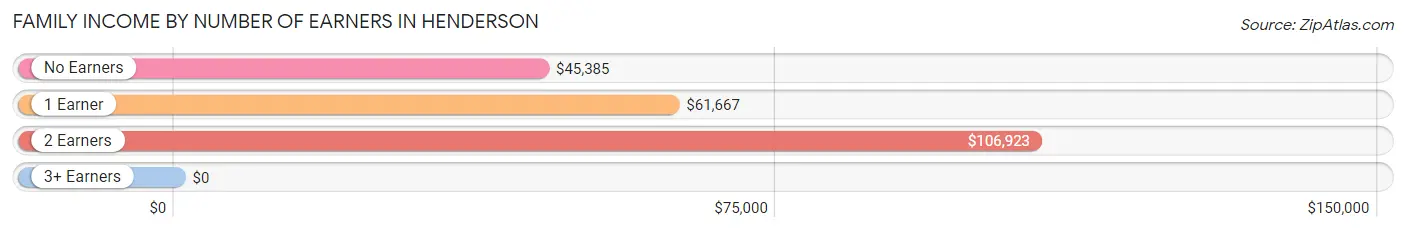
| Number of Earners | # Families | Median Income |
| No Earners | 22 (26.5%) | $45,385 |
| 1 Earner | 24 (28.9%) | $61,667 |
| 2 Earners | 32 (38.6%) | $106,923 |
| 3+ Earners | 5 (6.0%) | $0 |
| Total | 83 (100.0%) | $97,813 |
Household Income in Henderson
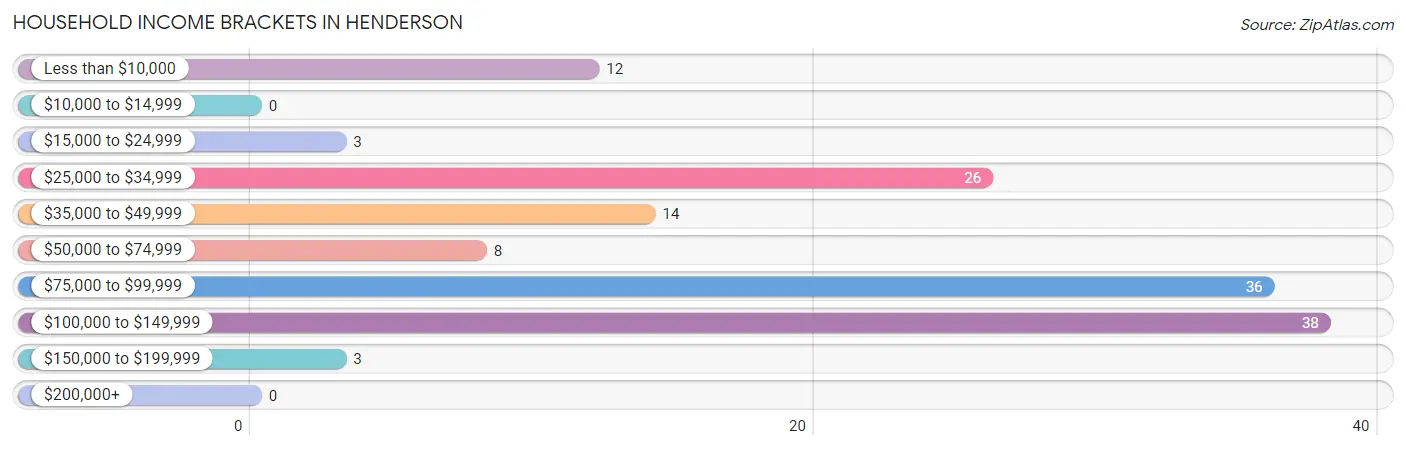
Household Income Brackets in Henderson
With 38 households falling in the category, the $100,000 to $149,999 income range is the most frequent in Henderson, accounting for 27.1% of all households.
| Income Bracket | # Households | % Households |
| Less than $10,000 | 12 | 8.6% |
| $10,000 to $14,999 | 0 | 0.0% |
| $15,000 to $24,999 | 3 | 2.1% |
| $25,000 to $34,999 | 26 | 18.6% |
| $35,000 to $49,999 | 14 | 10.0% |
| $50,000 to $74,999 | 8 | 5.7% |
| $75,000 to $99,999 | 36 | 25.7% |
| $100,000 to $149,999 | 38 | 27.1% |
| $150,000 to $199,999 | 3 | 2.1% |
| $200,000+ | 0 | 0.0% |
Household Income by Householder Age in Henderson
The median household income in Henderson is $76,750, with the highest median household income of $97,679 found in the 45 to 64 years age bracket for the primary householder. A total of 94 households (67.1%) fall into this category.
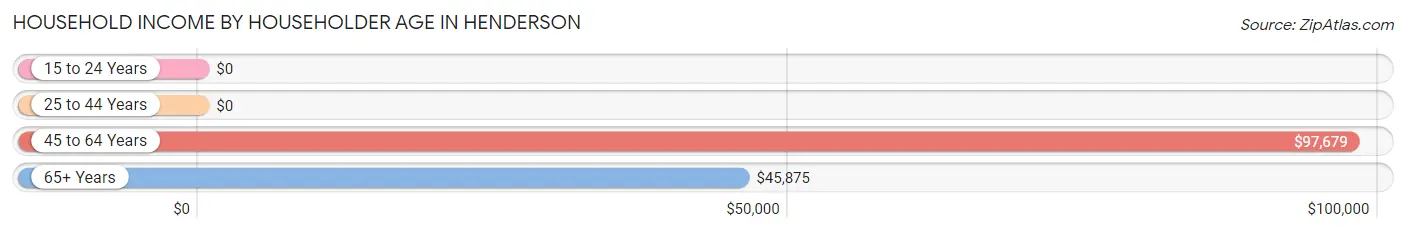
| Income Bracket | # Households | Median Income |
| 15 to 24 Years | 0 (0.0%) | $0 |
| 25 to 44 Years | 23 (16.4%) | $0 |
| 45 to 64 Years | 94 (67.1%) | $97,679 |
| 65+ Years | 23 (16.4%) | $45,875 |
| Total | 140 (100.0%) | $76,750 |
Poverty in Henderson
Income Below Poverty by Sex and Age in Henderson
With 12.9% poverty level for males and 6.4% for females among the residents of Henderson, under 5 year old males and 55 to 64 year old females are the most vulnerable to poverty, with 3 males (100.0%) and 8 females (16.0%) in their respective age groups living below the poverty level.
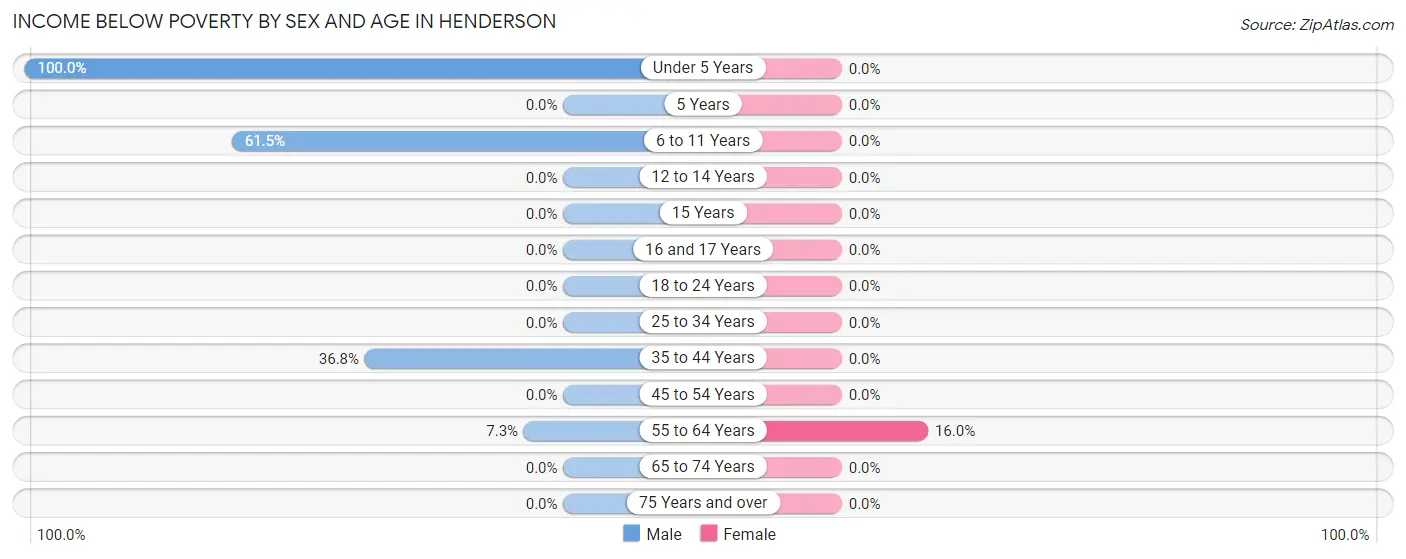
| Age Bracket | Male | Female |
| Under 5 Years | 3 (100.0%) | 0 (0.0%) |
| 5 Years | 0 (0.0%) | 0 (0.0%) |
| 6 to 11 Years | 8 (61.5%) | 0 (0.0%) |
| 12 to 14 Years | 0 (0.0%) | 0 (0.0%) |
| 15 Years | 0 (0.0%) | 0 (0.0%) |
| 16 and 17 Years | 0 (0.0%) | 0 (0.0%) |
| 18 to 24 Years | 0 (0.0%) | 0 (0.0%) |
| 25 to 34 Years | 0 (0.0%) | 0 (0.0%) |
| 35 to 44 Years | 7 (36.8%) | 0 (0.0%) |
| 45 to 54 Years | 0 (0.0%) | 0 (0.0%) |
| 55 to 64 Years | 3 (7.3%) | 8 (16.0%) |
| 65 to 74 Years | 0 (0.0%) | 0 (0.0%) |
| 75 Years and over | 0 (0.0%) | 0 (0.0%) |
| Total | 21 (12.9%) | 8 (6.4%) |
Income Above Poverty by Sex and Age in Henderson
According to the poverty statistics in Henderson, males aged 12 to 14 years and females aged 6 to 11 years are the age groups that are most secure financially, with 100.0% of males and 100.0% of females in these age groups living above the poverty line.
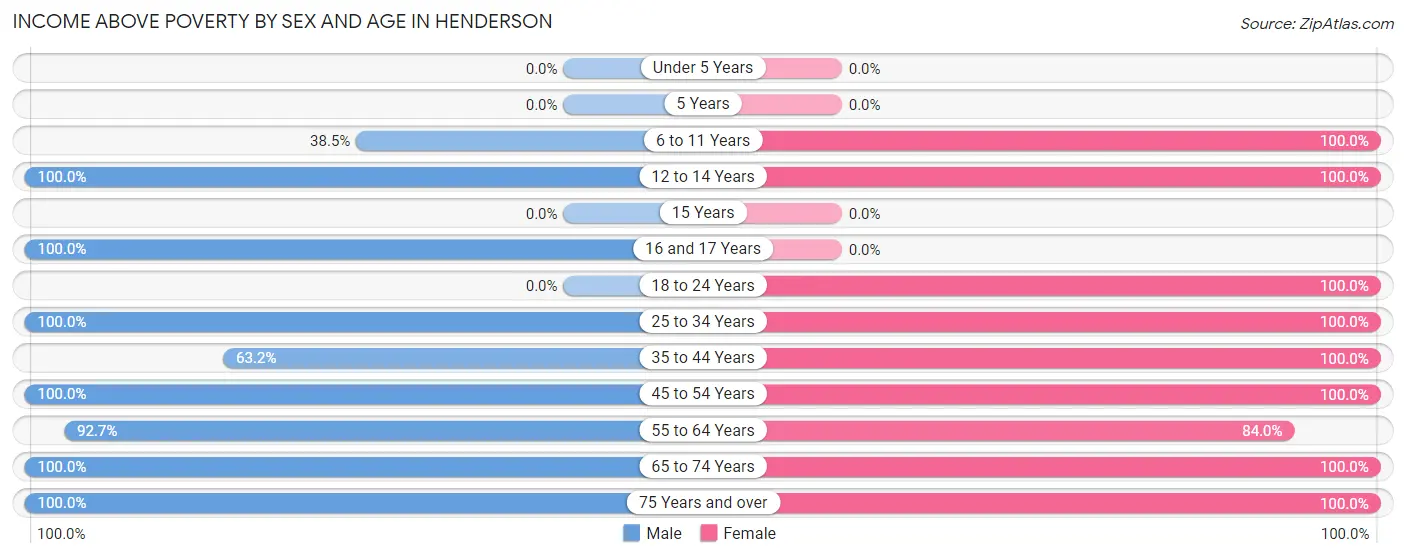
| Age Bracket | Male | Female |
| Under 5 Years | 0 (0.0%) | 0 (0.0%) |
| 5 Years | 0 (0.0%) | 0 (0.0%) |
| 6 to 11 Years | 5 (38.5%) | 7 (100.0%) |
| 12 to 14 Years | 3 (100.0%) | 4 (100.0%) |
| 15 Years | 0 (0.0%) | 0 (0.0%) |
| 16 and 17 Years | 6 (100.0%) | 0 (0.0%) |
| 18 to 24 Years | 0 (0.0%) | 3 (100.0%) |
| 25 to 34 Years | 14 (100.0%) | 15 (100.0%) |
| 35 to 44 Years | 12 (63.2%) | 13 (100.0%) |
| 45 to 54 Years | 46 (100.0%) | 7 (100.0%) |
| 55 to 64 Years | 38 (92.7%) | 42 (84.0%) |
| 65 to 74 Years | 13 (100.0%) | 20 (100.0%) |
| 75 Years and over | 5 (100.0%) | 6 (100.0%) |
| Total | 142 (87.1%) | 117 (93.6%) |
Income Below Poverty Among Married-Couple Families in Henderson
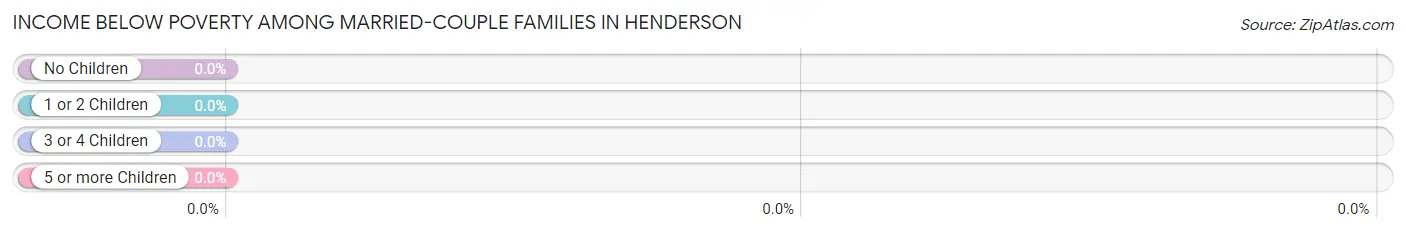
| Children | Above Poverty | Below Poverty |
| No Children | 58 (100.0%) | 0 (0.0%) |
| 1 or 2 Children | 12 (100.0%) | 0 (0.0%) |
| 3 or 4 Children | 0 (0.0%) | 0 (0.0%) |
| 5 or more Children | 0 (0.0%) | 0 (0.0%) |
| Total | 70 (100.0%) | 0 (0.0%) |
Income Below Poverty Among Single-Parent Households in Henderson
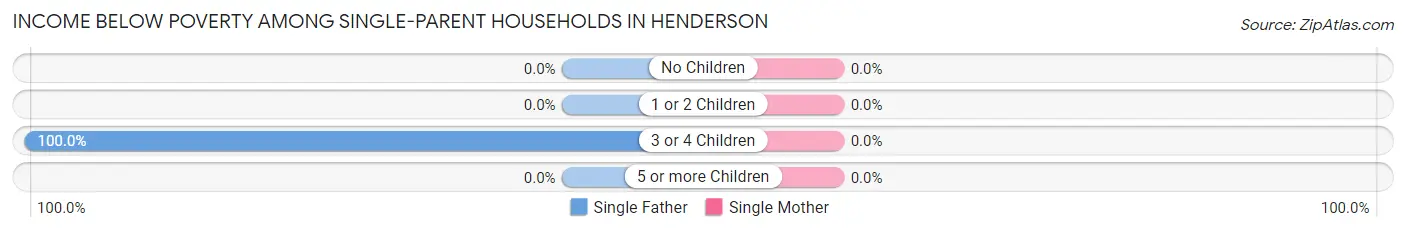
| Children | Single Father | Single Mother |
| No Children | 0 (0.0%) | 0 (0.0%) |
| 1 or 2 Children | 0 (0.0%) | 0 (0.0%) |
| 3 or 4 Children | 3 (100.0%) | 0 (0.0%) |
| 5 or more Children | 0 (0.0%) | 0 (0.0%) |
| Total | 3 (50.0%) | 0 (0.0%) |
Income Below Poverty Among Married-Couple vs Single-Parent Households in Henderson
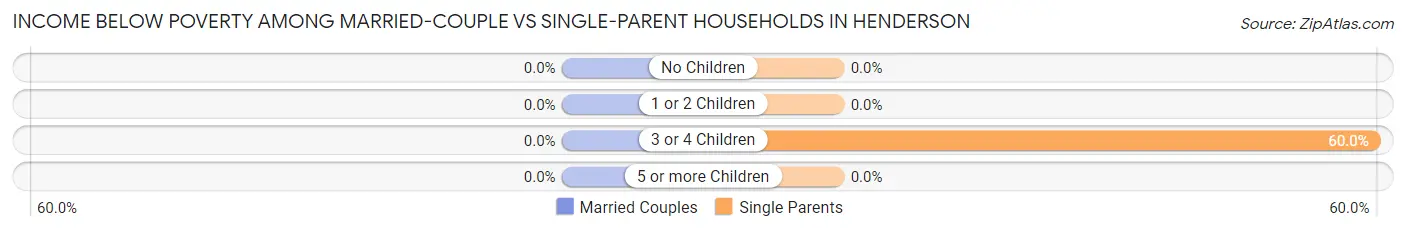
| Children | Married-Couple Families | Single-Parent Households |
| No Children | 0 (0.0%) | 0 (0.0%) |
| 1 or 2 Children | 0 (0.0%) | 0 (0.0%) |
| 3 or 4 Children | 0 (0.0%) | 3 (60.0%) |
| 5 or more Children | 0 (0.0%) | 0 (0.0%) |
| Total | 0 (0.0%) | 3 (23.1%) |
Race in Henderson
The most populous races in Henderson are White / Caucasian (276 | 95.8%), Hispanic or Latino (18 | 6.2%), and Two or more Races (12 | 4.2%).
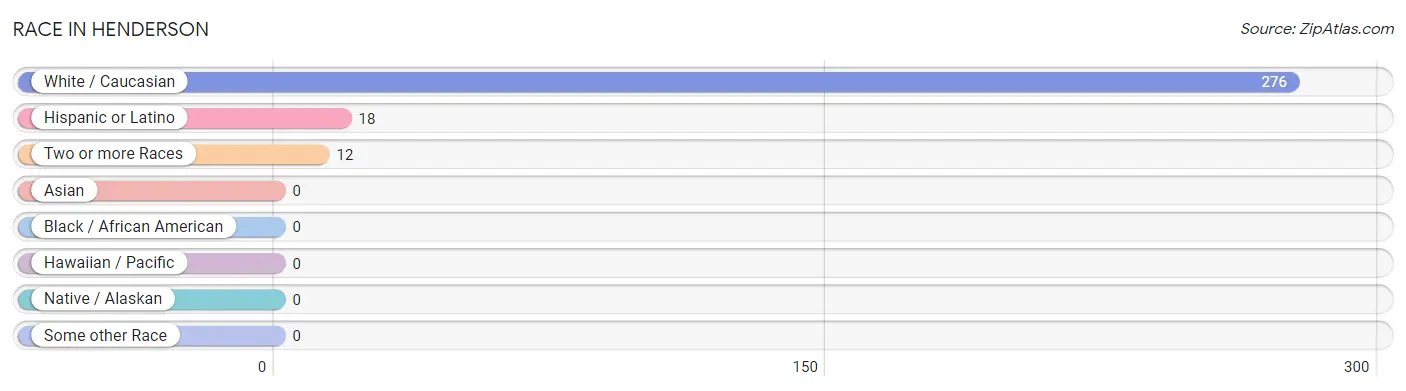
| Race | # Population | % Population |
| Asian | 0 | 0.0% |
| Black / African American | 0 | 0.0% |
| Hawaiian / Pacific | 0 | 0.0% |
| Hispanic or Latino | 18 | 6.2% |
| Native / Alaskan | 0 | 0.0% |
| White / Caucasian | 276 | 95.8% |
| Two or more Races | 12 | 4.2% |
| Some other Race | 0 | 0.0% |
| Total | 288 | 100.0% |
Ancestry in Henderson
The most populous ancestries reported in Henderson are German (83 | 28.8%), English (74 | 25.7%), American (26 | 9.0%), Polish (20 | 6.9%), and Irish (18 | 6.2%), together accounting for 76.7% of all Henderson residents.
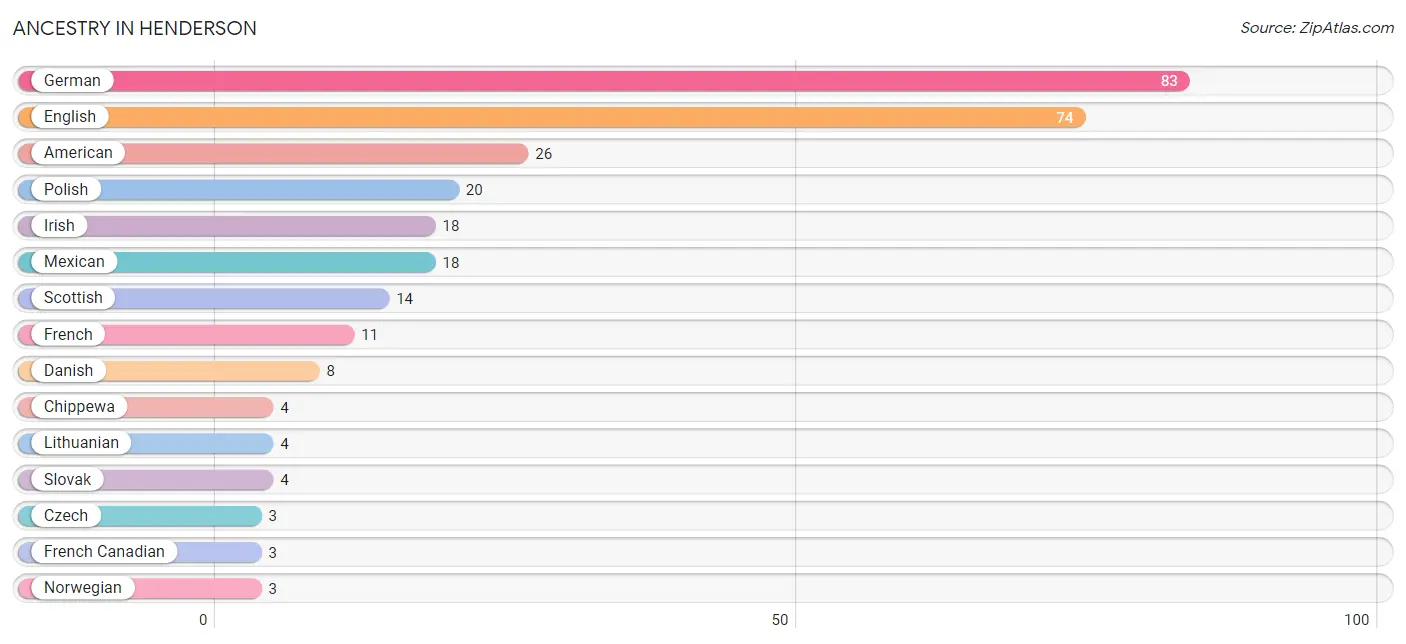
| Ancestry | # Population | % Population |
| American | 26 | 9.0% |
| Chippewa | 4 | 1.4% |
| Czech | 3 | 1.0% |
| Danish | 8 | 2.8% |
| English | 74 | 25.7% |
| French | 11 | 3.8% |
| French Canadian | 3 | 1.0% |
| German | 83 | 28.8% |
| Irish | 18 | 6.2% |
| Lithuanian | 4 | 1.4% |
| Mexican | 18 | 6.2% |
| Norwegian | 3 | 1.0% |
| Polish | 20 | 6.9% |
| Scottish | 14 | 4.9% |
| Slovak | 4 | 1.4% |
| Swedish | 3 | 1.0% | View All 16 Rows |
Immigrants in Henderson

| Immigration Origin | # Population | % Population | View All 0 Rows |
Sex and Age in Henderson
Sex and Age in Henderson
The most populous age groups in Henderson are 50 to 54 Years (26 | 16.0%) for men and 60 to 64 Years (39 | 31.2%) for women.
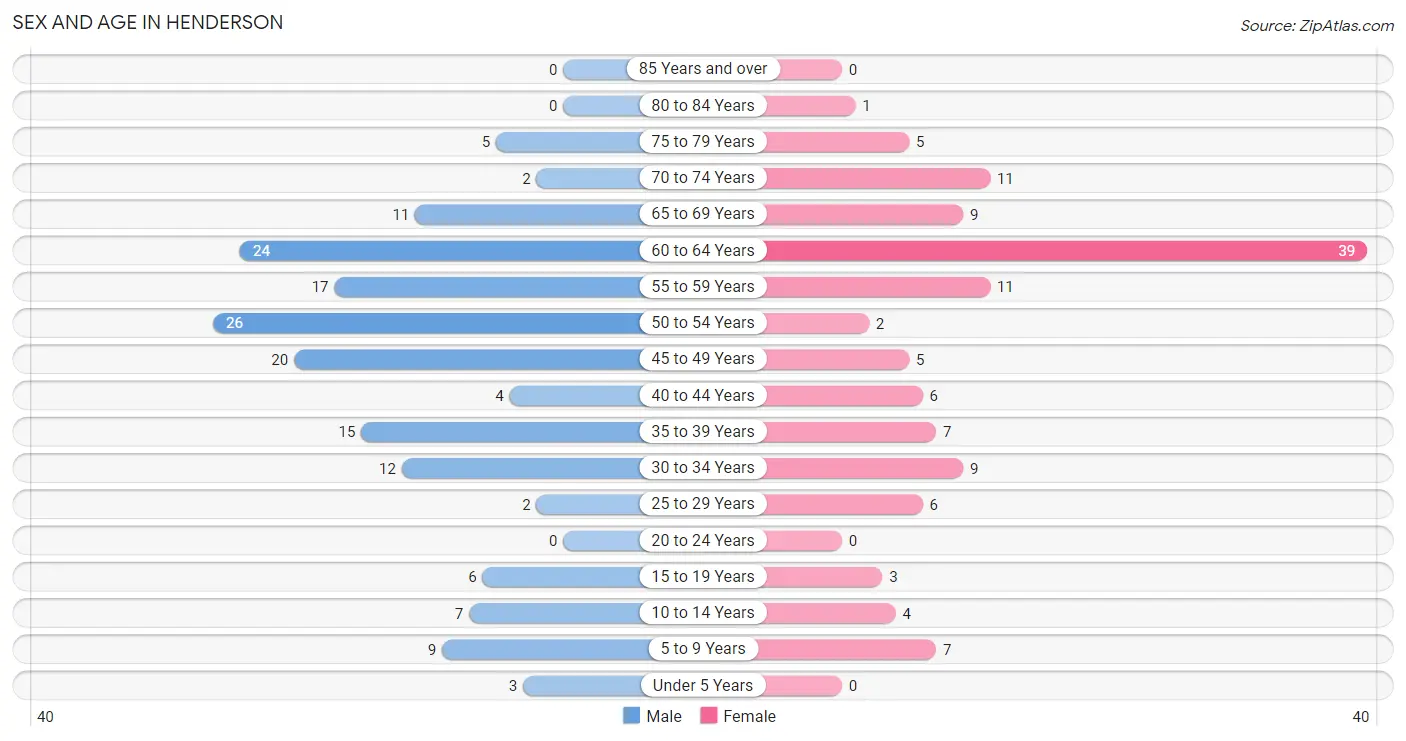
| Age Bracket | Male | Female |
| Under 5 Years | 3 (1.8%) | 0 (0.0%) |
| 5 to 9 Years | 9 (5.5%) | 7 (5.6%) |
| 10 to 14 Years | 7 (4.3%) | 4 (3.2%) |
| 15 to 19 Years | 6 (3.7%) | 3 (2.4%) |
| 20 to 24 Years | 0 (0.0%) | 0 (0.0%) |
| 25 to 29 Years | 2 (1.2%) | 6 (4.8%) |
| 30 to 34 Years | 12 (7.4%) | 9 (7.2%) |
| 35 to 39 Years | 15 (9.2%) | 7 (5.6%) |
| 40 to 44 Years | 4 (2.5%) | 6 (4.8%) |
| 45 to 49 Years | 20 (12.3%) | 5 (4.0%) |
| 50 to 54 Years | 26 (16.0%) | 2 (1.6%) |
| 55 to 59 Years | 17 (10.4%) | 11 (8.8%) |
| 60 to 64 Years | 24 (14.7%) | 39 (31.2%) |
| 65 to 69 Years | 11 (6.8%) | 9 (7.2%) |
| 70 to 74 Years | 2 (1.2%) | 11 (8.8%) |
| 75 to 79 Years | 5 (3.1%) | 5 (4.0%) |
| 80 to 84 Years | 0 (0.0%) | 1 (0.8%) |
| 85 Years and over | 0 (0.0%) | 0 (0.0%) |
| Total | 163 (100.0%) | 125 (100.0%) |
Families and Households in Henderson
Median Family Size in Henderson
The median family size in Henderson is 2.65 persons per family, with single male/father families (6 | 7.2%) accounting for the largest median family size of 3.83 persons per family. On the other hand, married-couple families (70 | 84.3%) represent the smallest median family size with 2.47 persons per family.
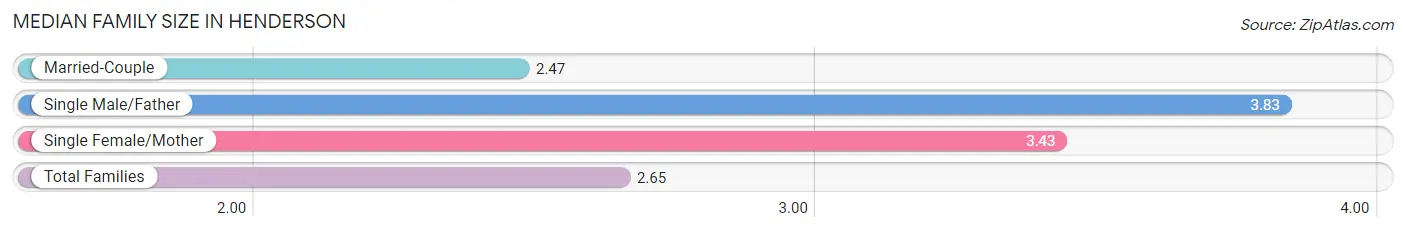
| Family Type | # Families | Family Size |
| Married-Couple | 70 (84.3%) | 2.47 |
| Single Male/Father | 6 (7.2%) | 3.83 |
| Single Female/Mother | 7 (8.4%) | 3.43 |
| Total Families | 83 (100.0%) | 2.65 |
Median Household Size in Henderson
The median household size in Henderson is 2.06 persons per household, with single male/father households (6 | 4.3%) accounting for the largest median household size of 4.67 persons per household. non-family households (57 | 40.7%) represent the smallest median household size with 1.11 persons per household.
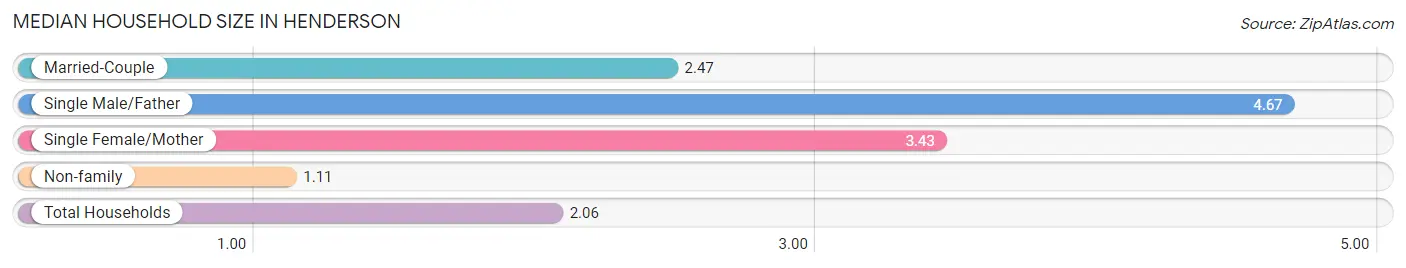
| Household Type | # Households | Household Size |
| Married-Couple | 70 (50.0%) | 2.47 |
| Single Male/Father | 6 (4.3%) | 4.67 |
| Single Female/Mother | 7 (5.0%) | 3.43 |
| Non-family | 57 (40.7%) | 1.11 |
| Total Households | 140 (100.0%) | 2.06 |
Household Size by Marriage Status in Henderson
Out of a total of 140 households in Henderson, 83 (59.3%) are family households, while 57 (40.7%) are nonfamily households. The most numerous type of family households are 2-person households, comprising 52, and the most common type of nonfamily households are 1-person households, comprising 50.
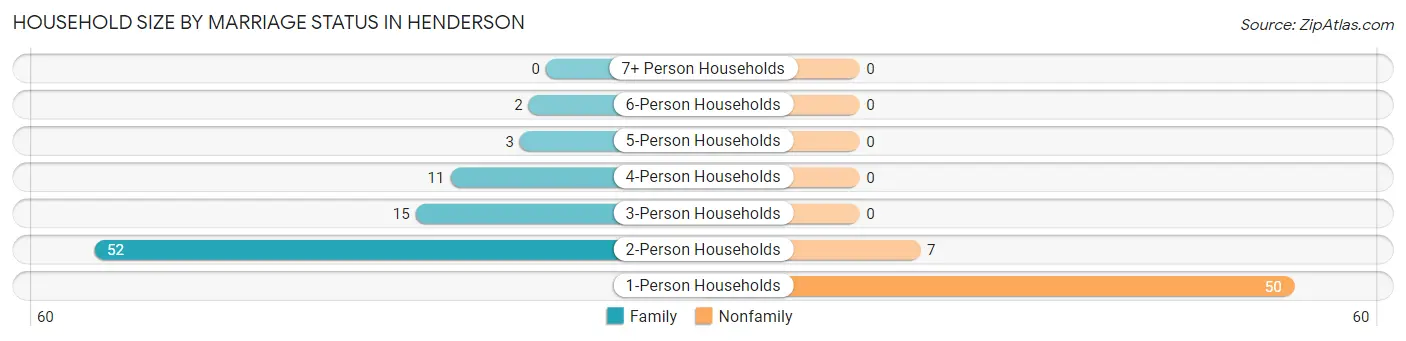
| Household Size | Family Households | Nonfamily Households |
| 1-Person Households | - | 50 (35.7%) |
| 2-Person Households | 52 (37.1%) | 7 (5.0%) |
| 3-Person Households | 15 (10.7%) | 0 (0.0%) |
| 4-Person Households | 11 (7.9%) | 0 (0.0%) |
| 5-Person Households | 3 (2.1%) | 0 (0.0%) |
| 6-Person Households | 2 (1.4%) | 0 (0.0%) |
| 7+ Person Households | 0 (0.0%) | 0 (0.0%) |
| Total | 83 (59.3%) | 57 (40.7%) |
Female Fertility in Henderson
Fertility by Age in Henderson
| Age Bracket | Women with Births | Births / 1,000 Women |
| 15 to 19 years | 0 (0.0%) | 0.0 |
| 20 to 34 years | 0 (0.0%) | 0.0 |
| 35 to 50 years | 0 (0.0%) | 0.0 |
| Total | 0 (0.0%) | 0.0 |
Fertility by Age by Marriage Status in Henderson
| Age Bracket | Married | Unmarried |
| 15 to 19 years | 0 (0.0%) | 0 (0.0%) |
| 20 to 34 years | 0 (0.0%) | 0 (0.0%) |
| 35 to 50 years | 0 (0.0%) | 0 (0.0%) |
| Total | 0 (0.0%) | 0 (0.0%) |
Fertility by Education in Henderson
| Educational Attainment | Women with Births | Births / 1,000 Women |
| Less than High School | 0 (0.0%) | 0.0 |
| High School Diploma | 0 (0.0%) | 0.0 |
| College or Associate's Degree | 0 (0.0%) | 0.0 |
| Bachelor's Degree | 0 (0.0%) | 0.0 |
| Graduate Degree | 0 (0.0%) | 0.0 |
| Total | 0 (0.0%) | 0.0 |
Fertility by Education by Marriage Status in Henderson
| Educational Attainment | Married | Unmarried |
| Less than High School | 0 (0.0%) | 0 (0.0%) |
| High School Diploma | 0 (0.0%) | 0 (0.0%) |
| College or Associate's Degree | 0 (0.0%) | 0 (0.0%) |
| Bachelor's Degree | 0 (0.0%) | 0 (0.0%) |
| Graduate Degree | 0 (0.0%) | 0 (0.0%) |
| Total | 0 (0.0%) | 0 (0.0%) |
Employment Characteristics in Henderson
Employment by Class of Employer in Henderson
Among the 158 employed individuals in Henderson, private company employees (115 | 72.8%), local government employees (14 | 8.9%), and self-employed (not incorporated) (11 | 7.0%) make up the most common classes of employment.
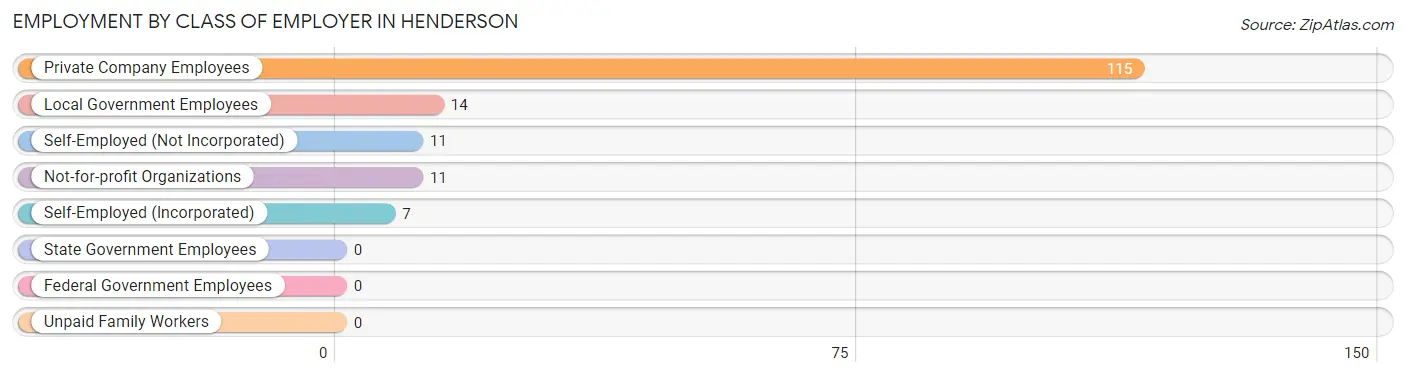
| Employer Class | # Employees | % Employees |
| Private Company Employees | 115 | 72.8% |
| Self-Employed (Incorporated) | 7 | 4.4% |
| Self-Employed (Not Incorporated) | 11 | 7.0% |
| Not-for-profit Organizations | 11 | 7.0% |
| Local Government Employees | 14 | 8.9% |
| State Government Employees | 0 | 0.0% |
| Federal Government Employees | 0 | 0.0% |
| Unpaid Family Workers | 0 | 0.0% |
| Total | 158 | 100.0% |
Employment Status by Age in Henderson
According to the labor force statistics for Henderson, out of the total population over 16 years of age (258), 64.7% or 167 individuals are in the labor force, with 3.6% or 6 of them unemployed. The age group with the highest labor force participation rate is 30 to 34 years, with 100.0% or 21 individuals in the labor force. Within the labor force, the 16 to 19 years age range has the highest percentage of unemployed individuals, with 33.3% or 2 of them being unemployed.
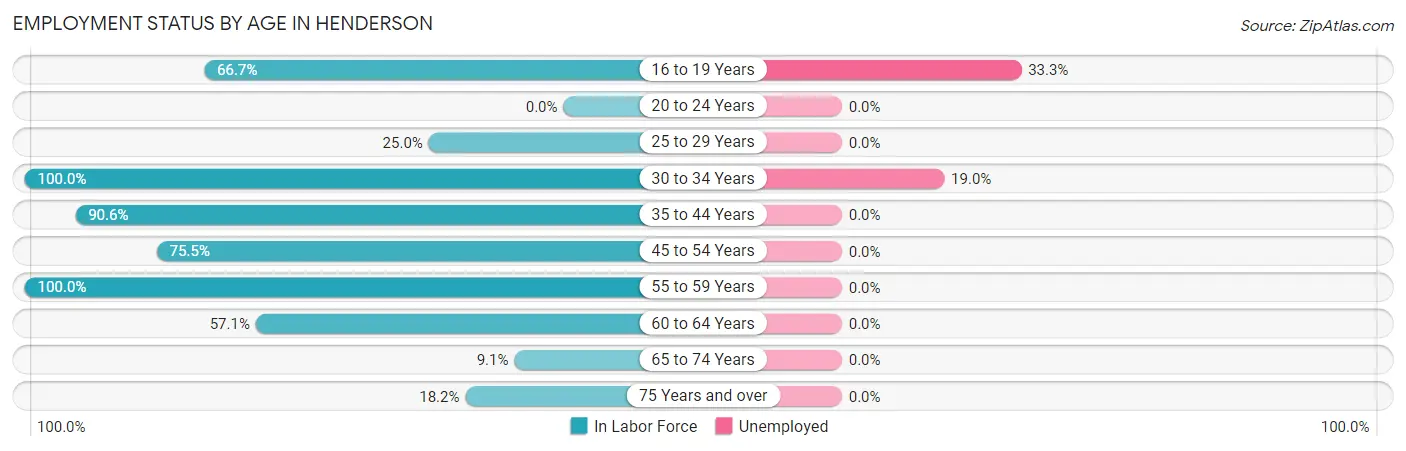
| Age Bracket | In Labor Force | Unemployed |
| 16 to 19 Years | 6 (66.7%) | 2 (33.3%) |
| 20 to 24 Years | 0 (0.0%) | 0 (0.0%) |
| 25 to 29 Years | 2 (25.0%) | 0 (0.0%) |
| 30 to 34 Years | 21 (100.0%) | 4 (19.0%) |
| 35 to 44 Years | 29 (90.6%) | 0 (0.0%) |
| 45 to 54 Years | 40 (75.5%) | 0 (0.0%) |
| 55 to 59 Years | 28 (100.0%) | 0 (0.0%) |
| 60 to 64 Years | 36 (57.1%) | 0 (0.0%) |
| 65 to 74 Years | 3 (9.1%) | 0 (0.0%) |
| 75 Years and over | 2 (18.2%) | 0 (0.0%) |
| Total | 167 (64.7%) | 6 (3.6%) |
Employment Status by Educational Attainment in Henderson
According to labor force statistics for Henderson, 76.1% of individuals (156) out of the total population between 25 and 64 years of age (205) are in the labor force, with 2.6% or 4 of them being unemployed. The group with the highest labor force participation rate are those with the educational attainment of bachelor's degree or higher, with 87.5% or 28 individuals in the labor force. Within the labor force, individuals with college / associate degree education have the highest percentage of unemployment, with 5.6% or 4 of them being unemployed.
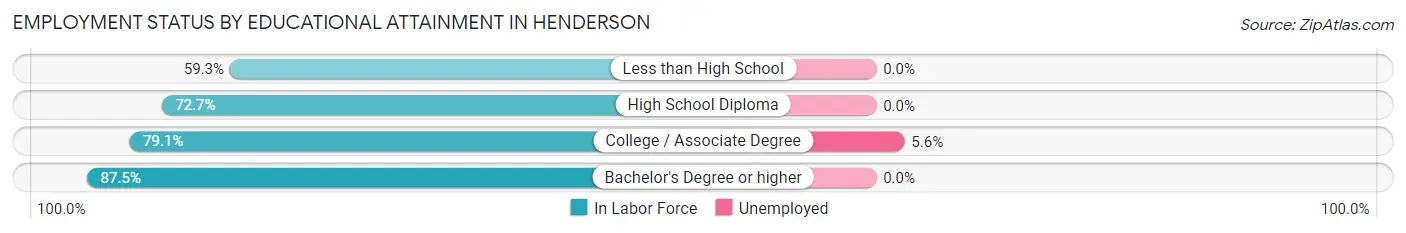
| Educational Attainment | In Labor Force | Unemployed |
| Less than High School | 16 (59.3%) | 0 (0.0%) |
| High School Diploma | 40 (72.7%) | 0 (0.0%) |
| College / Associate Degree | 72 (79.1%) | 5 (5.6%) |
| Bachelor's Degree or higher | 28 (87.5%) | 0 (0.0%) |
| Total | 156 (76.1%) | 5 (2.6%) |
Employment Occupations by Sex in Henderson
Management, Business, Science and Arts Occupations
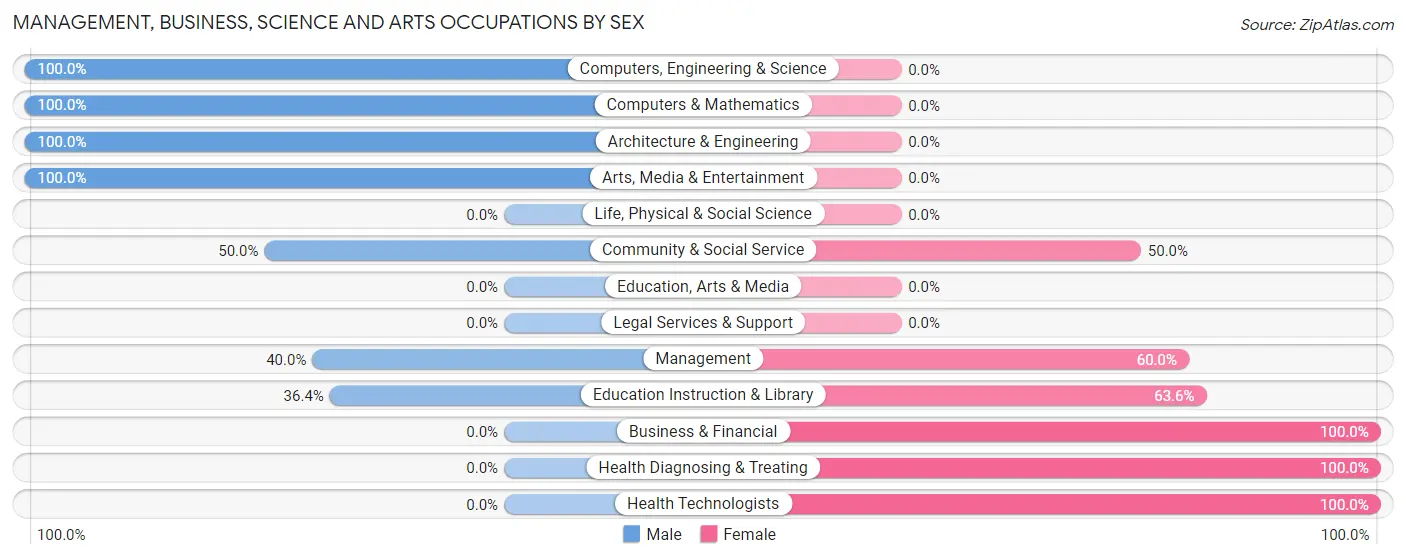
The most common Management, Business, Science and Arts occupations in Henderson are Computers, Engineering & Science (17 | 10.6%), Architecture & Engineering (14 | 8.7%), Community & Social Service (14 | 8.7%), Education Instruction & Library (11 | 6.8%), and Health Diagnosing & Treating (11 | 6.8%).
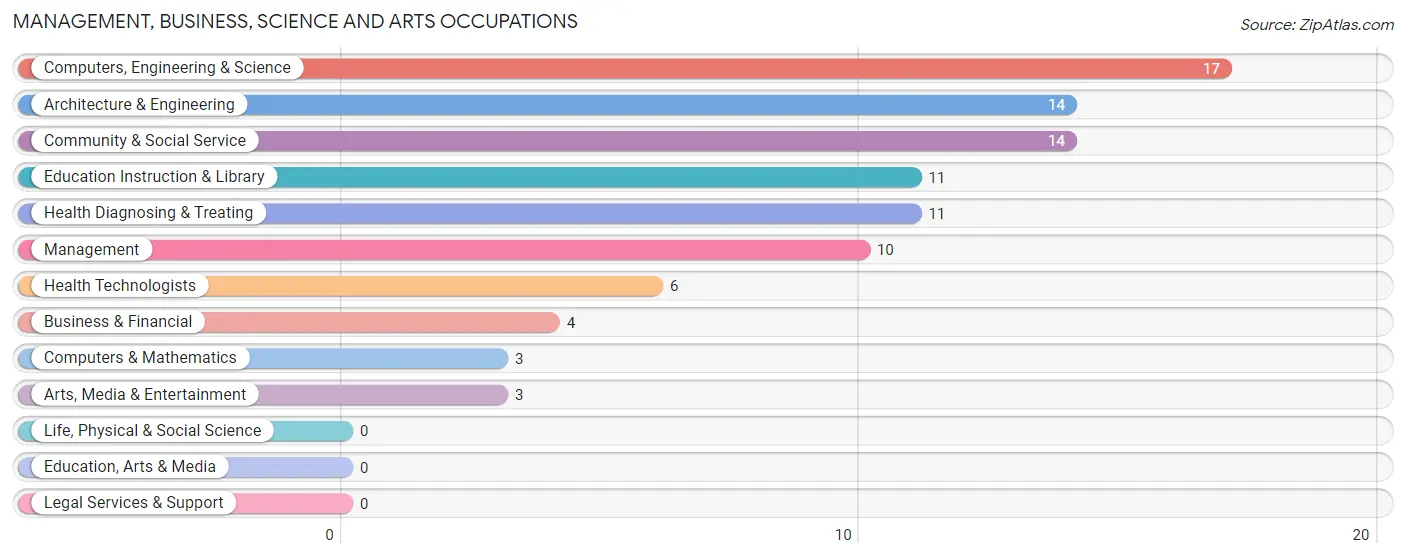
Management, Business, Science and Arts Occupations by Sex
Within the Management, Business, Science and Arts occupations in Henderson, the most male-oriented occupations are Computers, Engineering & Science (100.0%), Computers & Mathematics (100.0%), and Architecture & Engineering (100.0%), while the most female-oriented occupations are Business & Financial (100.0%), Health Diagnosing & Treating (100.0%), and Health Technologists (100.0%).
| Occupation | Male | Female |
| Management | 4 (40.0%) | 6 (60.0%) |
| Business & Financial | 0 (0.0%) | 4 (100.0%) |
| Computers, Engineering & Science | 17 (100.0%) | 0 (0.0%) |
| Computers & Mathematics | 3 (100.0%) | 0 (0.0%) |
| Architecture & Engineering | 14 (100.0%) | 0 (0.0%) |
| Life, Physical & Social Science | 0 (0.0%) | 0 (0.0%) |
| Community & Social Service | 7 (50.0%) | 7 (50.0%) |
| Education, Arts & Media | 0 (0.0%) | 0 (0.0%) |
| Legal Services & Support | 0 (0.0%) | 0 (0.0%) |
| Education Instruction & Library | 4 (36.4%) | 7 (63.6%) |
| Arts, Media & Entertainment | 3 (100.0%) | 0 (0.0%) |
| Health Diagnosing & Treating | 0 (0.0%) | 11 (100.0%) |
| Health Technologists | 0 (0.0%) | 6 (100.0%) |
| Total (Category) | 28 (50.0%) | 28 (50.0%) |
| Total (Overall) | 105 (65.2%) | 56 (34.8%) |
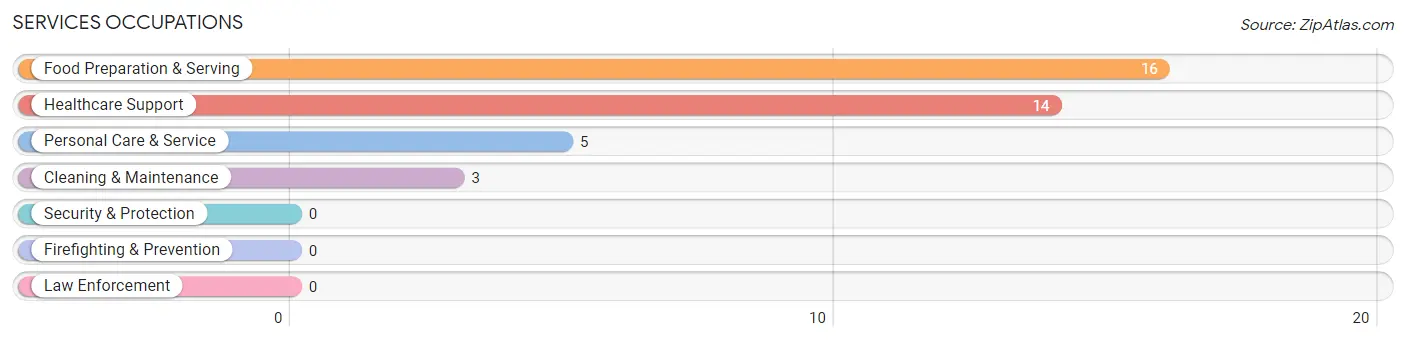
Services Occupations
The most common Services occupations in Henderson are Food Preparation & Serving (16 | 9.9%), Healthcare Support (14 | 8.7%), Personal Care & Service (5 | 3.1%), and Cleaning & Maintenance (3 | 1.9%).
Services Occupations by Sex
Within the Services occupations in Henderson, the most male-oriented occupations are Food Preparation & Serving (100.0%), and Cleaning & Maintenance (100.0%), while the most female-oriented occupations are Healthcare Support (100.0%), and Personal Care & Service (100.0%).
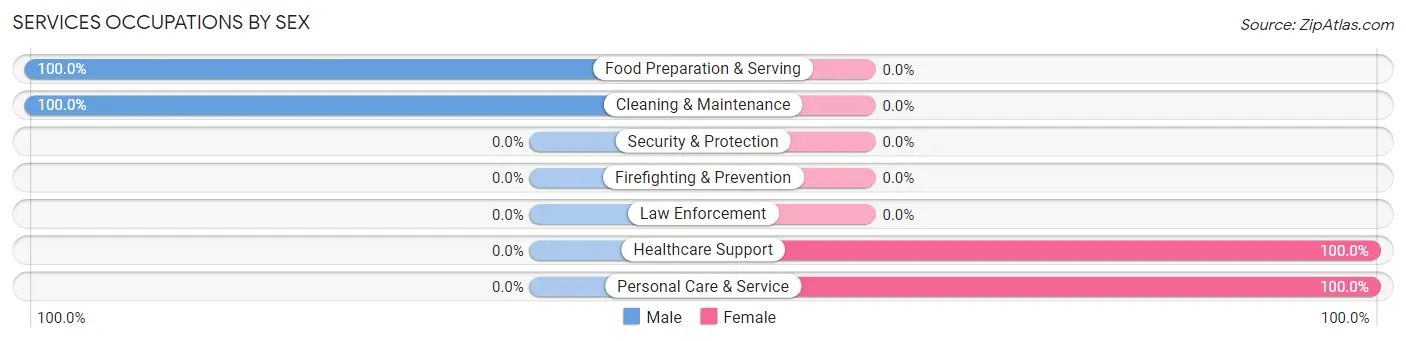
| Occupation | Male | Female |
| Healthcare Support | 0 (0.0%) | 14 (100.0%) |
| Security & Protection | 0 (0.0%) | 0 (0.0%) |
| Firefighting & Prevention | 0 (0.0%) | 0 (0.0%) |
| Law Enforcement | 0 (0.0%) | 0 (0.0%) |
| Food Preparation & Serving | 16 (100.0%) | 0 (0.0%) |
| Cleaning & Maintenance | 3 (100.0%) | 0 (0.0%) |
| Personal Care & Service | 0 (0.0%) | 5 (100.0%) |
| Total (Category) | 19 (50.0%) | 19 (50.0%) |
| Total (Overall) | 105 (65.2%) | 56 (34.8%) |
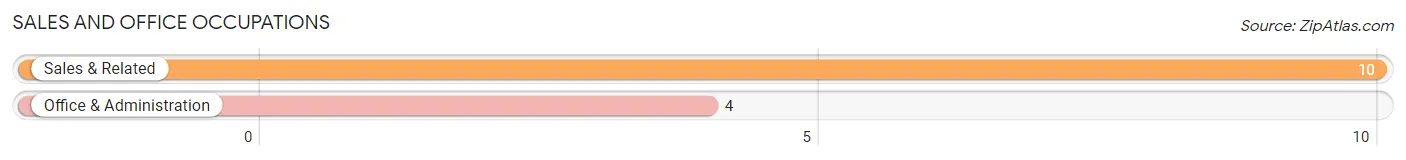
Sales and Office Occupations
The most common Sales and Office occupations in Henderson are Sales & Related (10 | 6.2%), and Office & Administration (4 | 2.5%).
Sales and Office Occupations by Sex
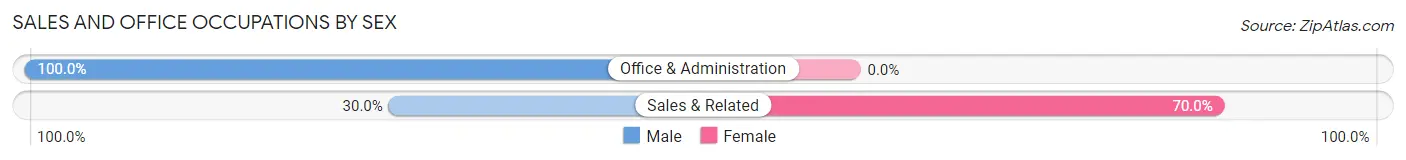
| Occupation | Male | Female |
| Sales & Related | 3 (30.0%) | 7 (70.0%) |
| Office & Administration | 4 (100.0%) | 0 (0.0%) |
| Total (Category) | 7 (50.0%) | 7 (50.0%) |
| Total (Overall) | 105 (65.2%) | 56 (34.8%) |
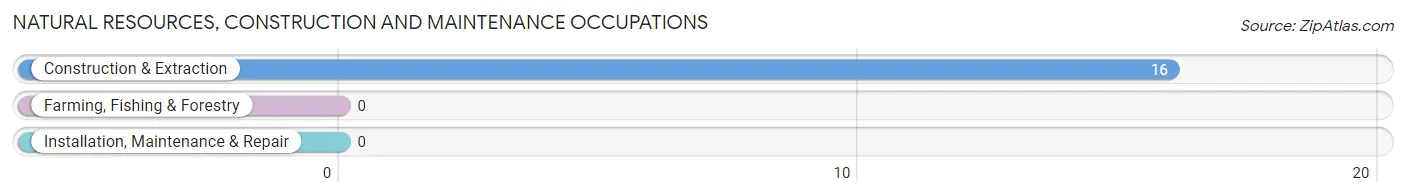
Natural Resources, Construction and Maintenance Occupations
The most common Natural Resources, Construction and Maintenance occupations in Henderson are , and Construction & Extraction (16 | 9.9%).
Natural Resources, Construction and Maintenance Occupations by Sex
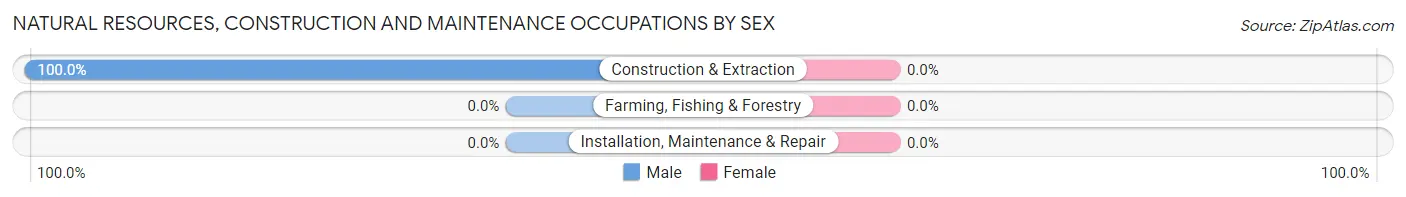
| Occupation | Male | Female |
| Farming, Fishing & Forestry | 0 (0.0%) | 0 (0.0%) |
| Construction & Extraction | 16 (100.0%) | 0 (0.0%) |
| Installation, Maintenance & Repair | 0 (0.0%) | 0 (0.0%) |
| Total (Category) | 16 (100.0%) | 0 (0.0%) |
| Total (Overall) | 105 (65.2%) | 56 (34.8%) |
Production, Transportation and Moving Occupations
The most common Production, Transportation and Moving occupations in Henderson are Production (29 | 18.0%), and Transportation (8 | 5.0%).
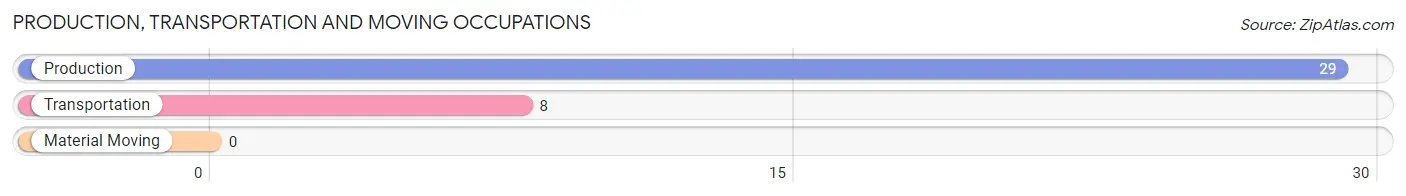
Production, Transportation and Moving Occupations by Sex
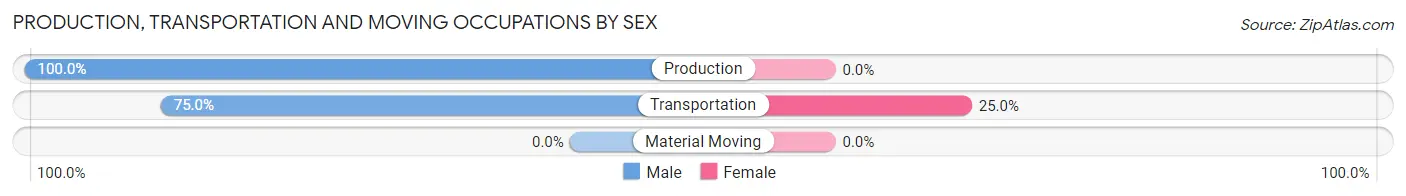
| Occupation | Male | Female |
| Production | 29 (100.0%) | 0 (0.0%) |
| Transportation | 6 (75.0%) | 2 (25.0%) |
| Material Moving | 0 (0.0%) | 0 (0.0%) |
| Total (Category) | 35 (94.6%) | 2 (5.4%) |
| Total (Overall) | 105 (65.2%) | 56 (34.8%) |
Employment Industries by Sex in Henderson
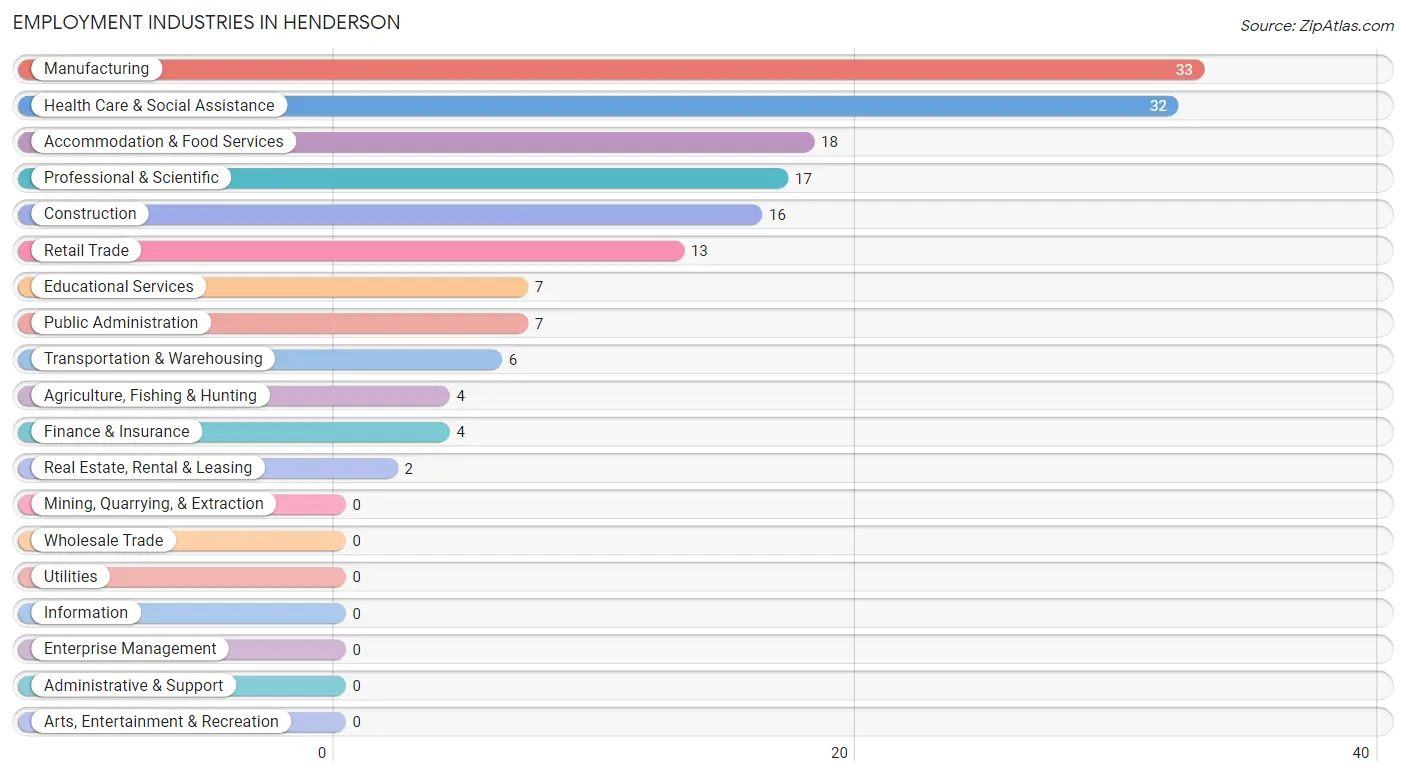
Employment Industries in Henderson
The major employment industries in Henderson include Manufacturing (33 | 20.5%), Health Care & Social Assistance (32 | 19.9%), Accommodation & Food Services (18 | 11.2%), Professional & Scientific (17 | 10.6%), and Construction (16 | 9.9%).
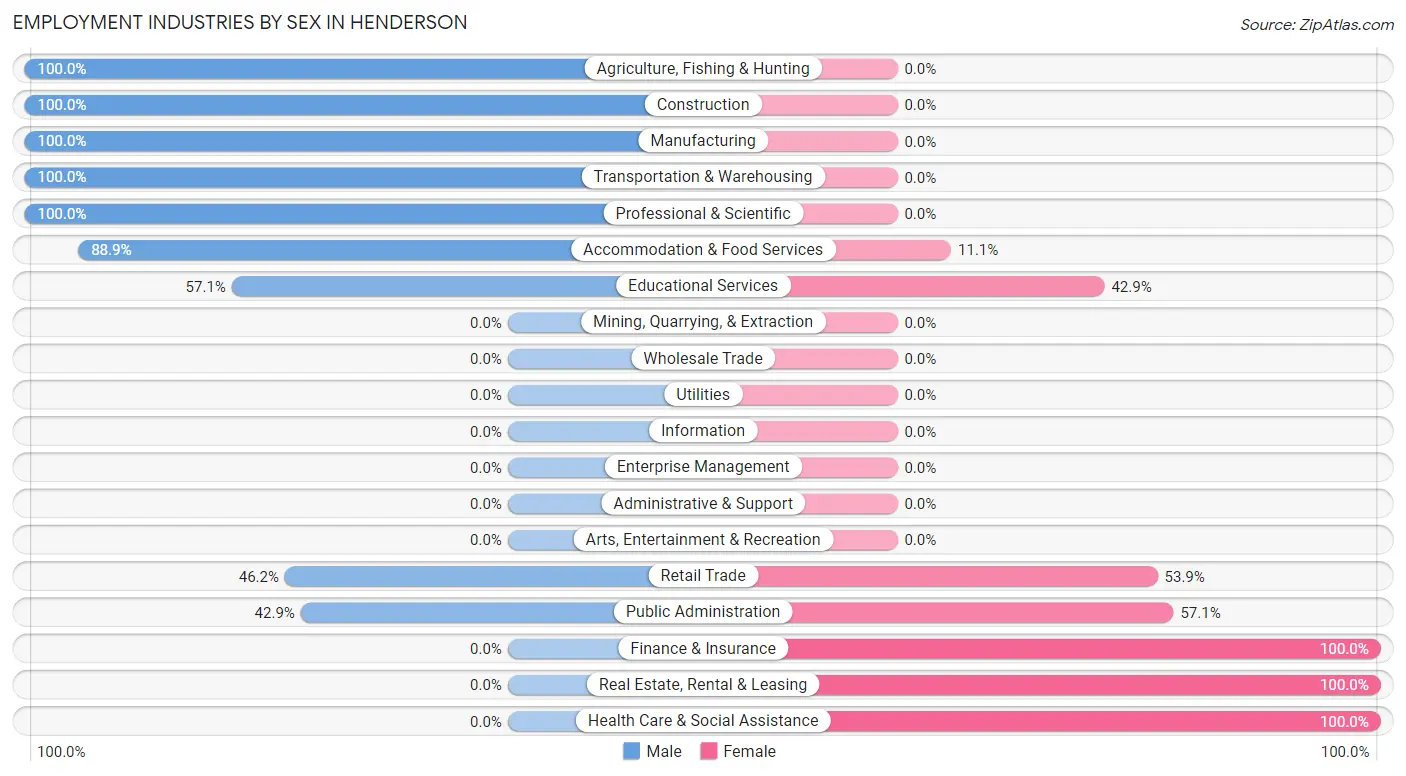
Employment Industries by Sex in Henderson
The Henderson industries that see more men than women are Agriculture, Fishing & Hunting (100.0%), Construction (100.0%), and Manufacturing (100.0%), whereas the industries that tend to have a higher number of women are Finance & Insurance (100.0%), Real Estate, Rental & Leasing (100.0%), and Health Care & Social Assistance (100.0%).
| Industry | Male | Female |
| Agriculture, Fishing & Hunting | 4 (100.0%) | 0 (0.0%) |
| Mining, Quarrying, & Extraction | 0 (0.0%) | 0 (0.0%) |
| Construction | 16 (100.0%) | 0 (0.0%) |
| Manufacturing | 33 (100.0%) | 0 (0.0%) |
| Wholesale Trade | 0 (0.0%) | 0 (0.0%) |
| Retail Trade | 6 (46.2%) | 7 (53.8%) |
| Transportation & Warehousing | 6 (100.0%) | 0 (0.0%) |
| Utilities | 0 (0.0%) | 0 (0.0%) |
| Information | 0 (0.0%) | 0 (0.0%) |
| Finance & Insurance | 0 (0.0%) | 4 (100.0%) |
| Real Estate, Rental & Leasing | 0 (0.0%) | 2 (100.0%) |
| Professional & Scientific | 17 (100.0%) | 0 (0.0%) |
| Enterprise Management | 0 (0.0%) | 0 (0.0%) |
| Administrative & Support | 0 (0.0%) | 0 (0.0%) |
| Educational Services | 4 (57.1%) | 3 (42.9%) |
| Health Care & Social Assistance | 0 (0.0%) | 32 (100.0%) |
| Arts, Entertainment & Recreation | 0 (0.0%) | 0 (0.0%) |
| Accommodation & Food Services | 16 (88.9%) | 2 (11.1%) |
| Public Administration | 3 (42.9%) | 4 (57.1%) |
| Total | 105 (65.2%) | 56 (34.8%) |
Education in Henderson
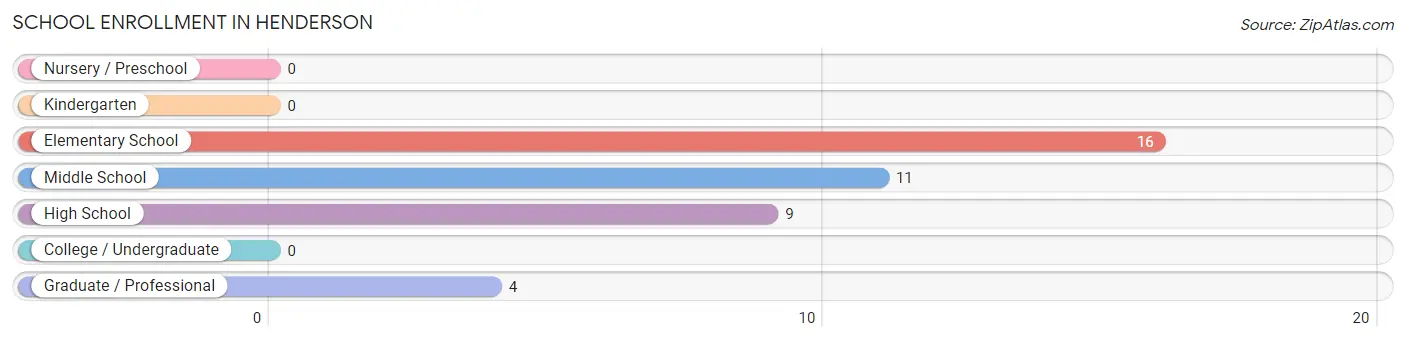
School Enrollment in Henderson
The most common levels of schooling among the 40 students in Henderson are elementary school (16 | 40.0%), middle school (11 | 27.5%), and high school (9 | 22.5%).
| School Level | # Students | % Students |
| Nursery / Preschool | 0 | 0.0% |
| Kindergarten | 0 | 0.0% |
| Elementary School | 16 | 40.0% |
| Middle School | 11 | 27.5% |
| High School | 9 | 22.5% |
| College / Undergraduate | 0 | 0.0% |
| Graduate / Professional | 4 | 10.0% |
| Total | 40 | 100.0% |
School Enrollment by Age by Funding Source in Henderson
Out of a total of 40 students who are enrolled in schools in Henderson, 4 (10.0%) attend a private institution, while the remaining 36 (90.0%) are enrolled in public schools. The age group of 35 years and over has the highest likelihood of being enrolled in private schools, with 4 (100.0% in the age bracket) enrolled. Conversely, the age group of 5 to 9 year old has the lowest likelihood of being enrolled in a private school, with 16 (100.0% in the age bracket) attending a public institution.
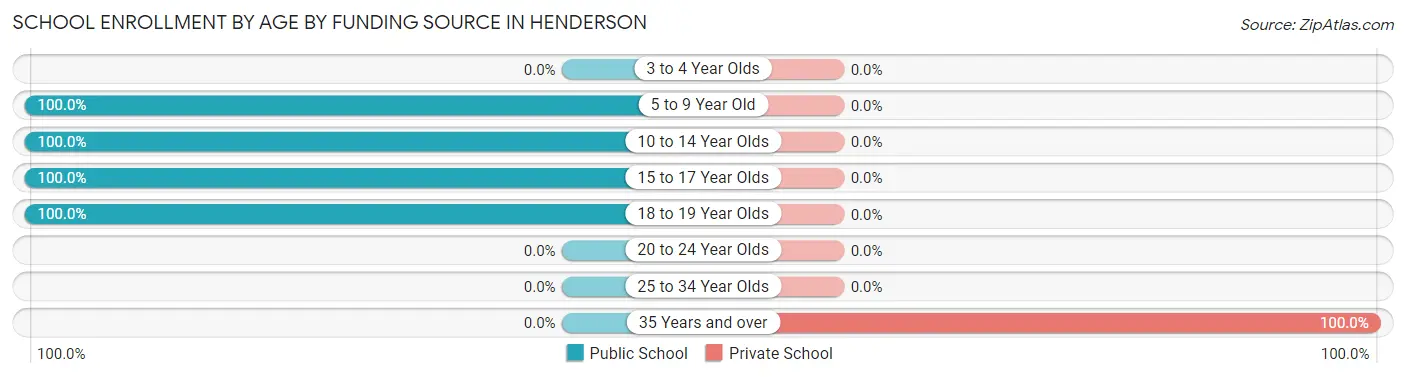
| Age Bracket | Public School | Private School |
| 3 to 4 Year Olds | 0 (0.0%) | 0 (0.0%) |
| 5 to 9 Year Old | 16 (100.0%) | 0 (0.0%) |
| 10 to 14 Year Olds | 11 (100.0%) | 0 (0.0%) |
| 15 to 17 Year Olds | 6 (100.0%) | 0 (0.0%) |
| 18 to 19 Year Olds | 3 (100.0%) | 0 (0.0%) |
| 20 to 24 Year Olds | 0 (0.0%) | 0 (0.0%) |
| 25 to 34 Year Olds | 0 (0.0%) | 0 (0.0%) |
| 35 Years and over | 0 (0.0%) | 4 (100.0%) |
| Total | 36 (90.0%) | 4 (10.0%) |
Educational Attainment by Field of Study in Henderson
Engineering (14 | 37.8%), business (12 | 32.4%), science & technology (7 | 18.9%), and education (4 | 10.8%) are the most common fields of study among 37 individuals in Henderson who have obtained a bachelor's degree or higher.
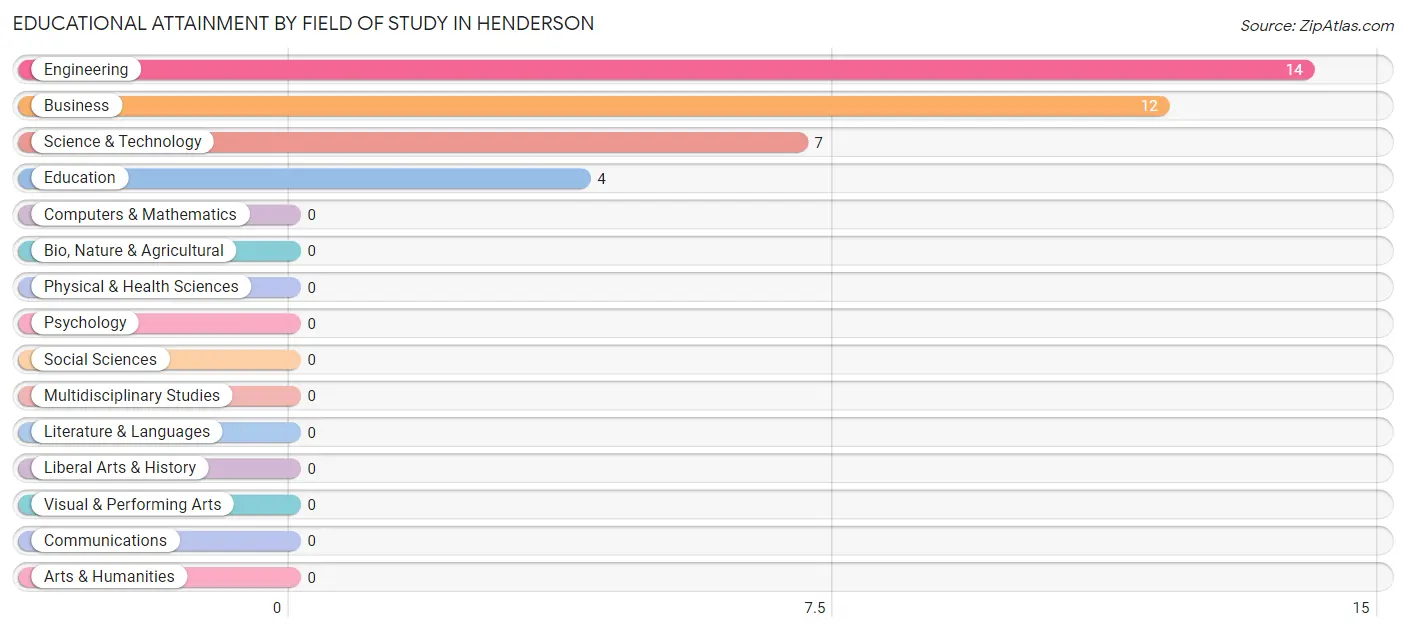
| Field of Study | # Graduates | % Graduates |
| Computers & Mathematics | 0 | 0.0% |
| Bio, Nature & Agricultural | 0 | 0.0% |
| Physical & Health Sciences | 0 | 0.0% |
| Psychology | 0 | 0.0% |
| Social Sciences | 0 | 0.0% |
| Engineering | 14 | 37.8% |
| Multidisciplinary Studies | 0 | 0.0% |
| Science & Technology | 7 | 18.9% |
| Business | 12 | 32.4% |
| Education | 4 | 10.8% |
| Literature & Languages | 0 | 0.0% |
| Liberal Arts & History | 0 | 0.0% |
| Visual & Performing Arts | 0 | 0.0% |
| Communications | 0 | 0.0% |
| Arts & Humanities | 0 | 0.0% |
| Total | 37 | 100.0% |
Transportation & Commute in Henderson
Vehicle Availability by Sex in Henderson
The most prevalent vehicle ownership categories in Henderson are males with 2 vehicles (57, accounting for 55.9%) and females with 2 vehicles (19, making up 101.8%).
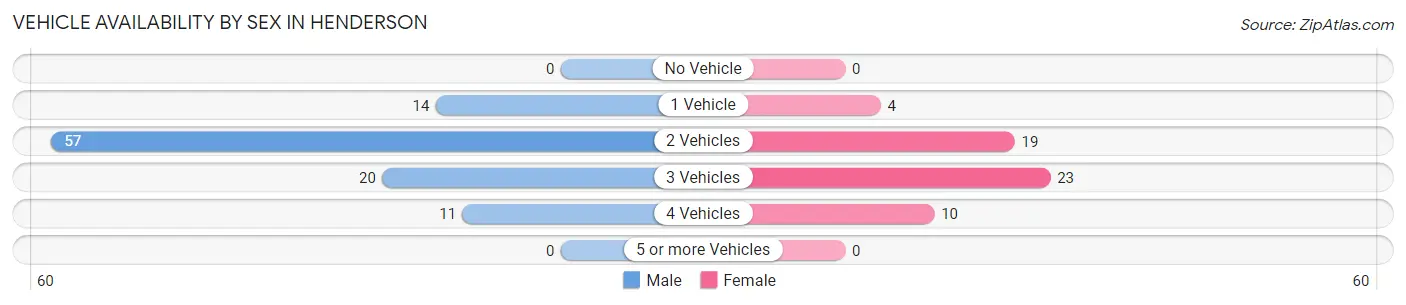
| Vehicles Available | Male | Female |
| No Vehicle | 0 (0.0%) | 0 (0.0%) |
| 1 Vehicle | 14 (13.7%) | 4 (7.1%) |
| 2 Vehicles | 57 (55.9%) | 19 (33.9%) |
| 3 Vehicles | 20 (19.6%) | 23 (41.1%) |
| 4 Vehicles | 11 (10.8%) | 10 (17.9%) |
| 5 or more Vehicles | 0 (0.0%) | 0 (0.0%) |
| Total | 102 (100.0%) | 56 (100.0%) |
Commute Time in Henderson
The most frequently occuring commute durations in Henderson are 15 to 19 minutes (44 commuters, 30.3%), 45 to 59 minutes (34 commuters, 23.4%), and 10 to 14 minutes (30 commuters, 20.7%).
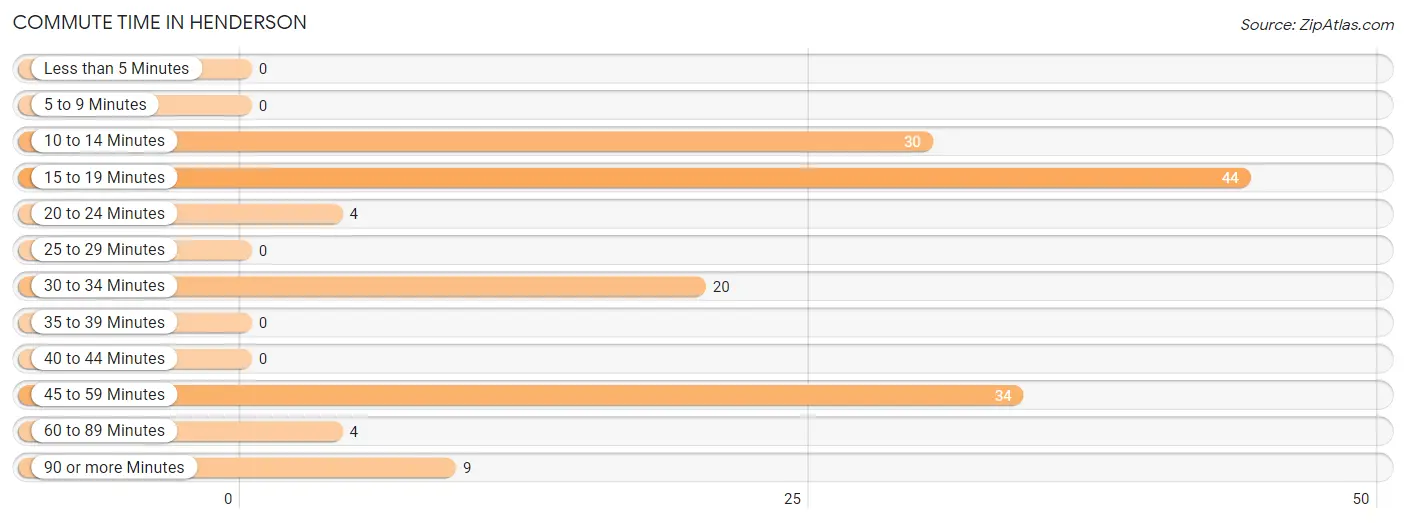
| Commute Time | # Commuters | % Commuters |
| Less than 5 Minutes | 0 | 0.0% |
| 5 to 9 Minutes | 0 | 0.0% |
| 10 to 14 Minutes | 30 | 20.7% |
| 15 to 19 Minutes | 44 | 30.3% |
| 20 to 24 Minutes | 4 | 2.8% |
| 25 to 29 Minutes | 0 | 0.0% |
| 30 to 34 Minutes | 20 | 13.8% |
| 35 to 39 Minutes | 0 | 0.0% |
| 40 to 44 Minutes | 0 | 0.0% |
| 45 to 59 Minutes | 34 | 23.4% |
| 60 to 89 Minutes | 4 | 2.8% |
| 90 or more Minutes | 9 | 6.2% |
Commute Time by Sex in Henderson
The most common commute times in Henderson are 45 to 59 minutes (30 commuters, 31.2%) for males and 15 to 19 minutes (24 commuters, 49.0%) for females.
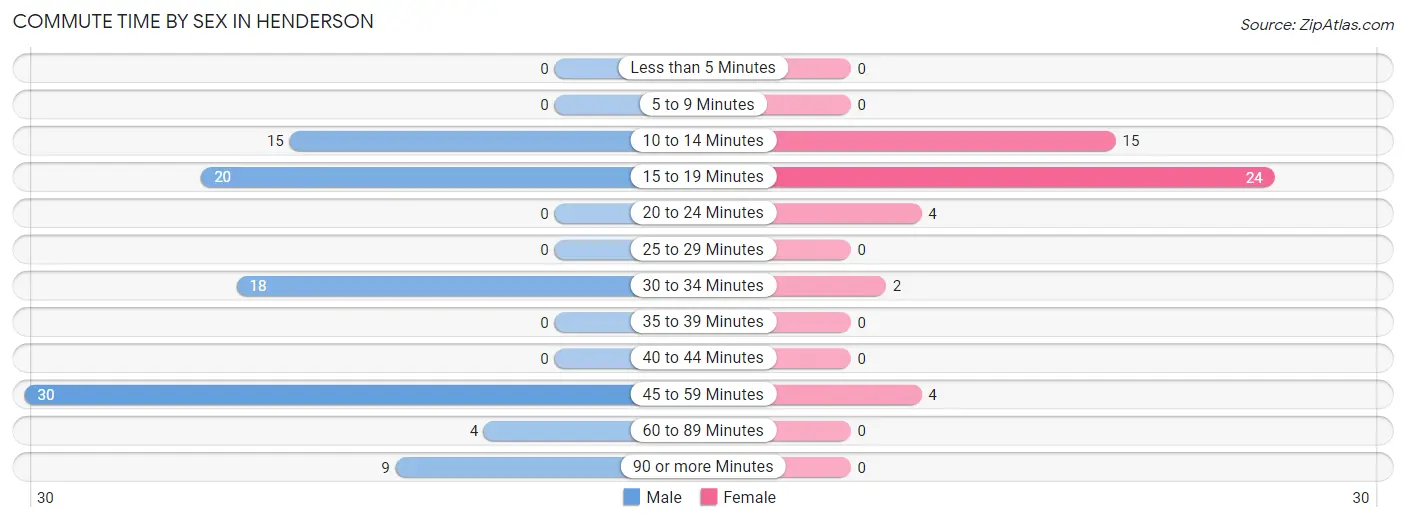
| Commute Time | Male | Female |
| Less than 5 Minutes | 0 (0.0%) | 0 (0.0%) |
| 5 to 9 Minutes | 0 (0.0%) | 0 (0.0%) |
| 10 to 14 Minutes | 15 (15.6%) | 15 (30.6%) |
| 15 to 19 Minutes | 20 (20.8%) | 24 (49.0%) |
| 20 to 24 Minutes | 0 (0.0%) | 4 (8.2%) |
| 25 to 29 Minutes | 0 (0.0%) | 0 (0.0%) |
| 30 to 34 Minutes | 18 (18.8%) | 2 (4.1%) |
| 35 to 39 Minutes | 0 (0.0%) | 0 (0.0%) |
| 40 to 44 Minutes | 0 (0.0%) | 0 (0.0%) |
| 45 to 59 Minutes | 30 (31.2%) | 4 (8.2%) |
| 60 to 89 Minutes | 4 (4.2%) | 0 (0.0%) |
| 90 or more Minutes | 9 (9.4%) | 0 (0.0%) |
Time of Departure to Work by Sex in Henderson
The most frequent times of departure to work in Henderson are 5:00 AM to 5:29 AM (21, 21.9%) for males and 5:00 AM to 5:29 AM (10, 20.4%) for females.
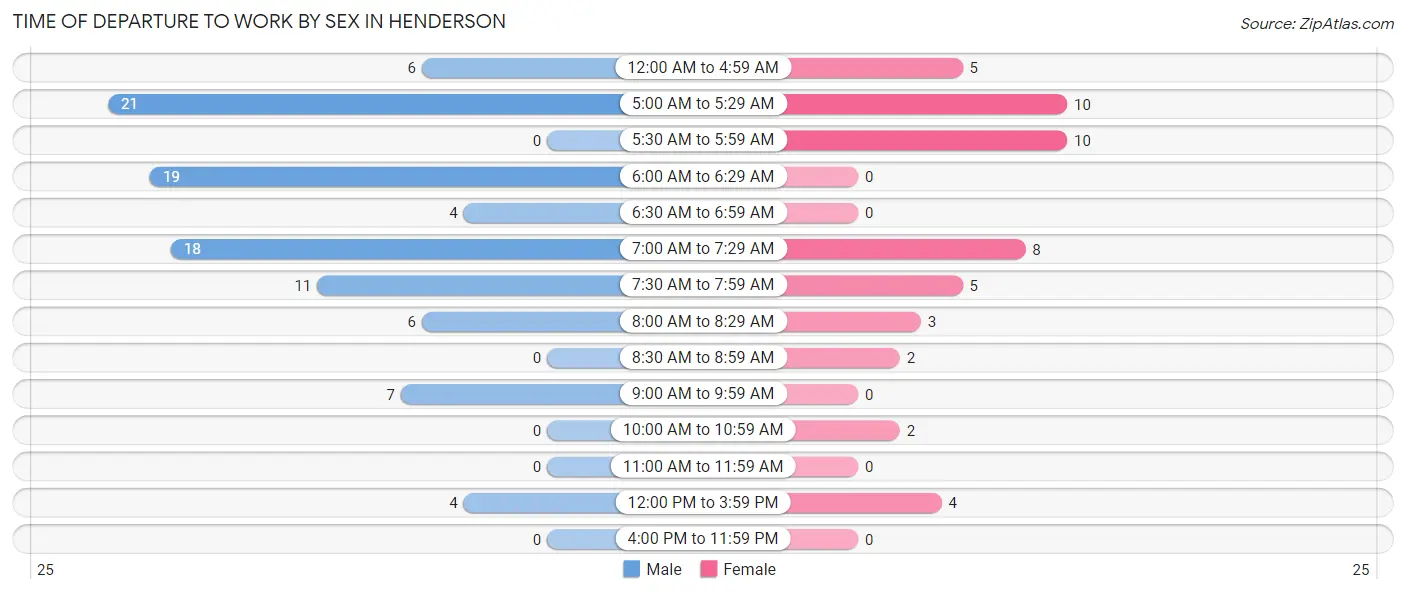
| Time of Departure | Male | Female |
| 12:00 AM to 4:59 AM | 6 (6.2%) | 5 (10.2%) |
| 5:00 AM to 5:29 AM | 21 (21.9%) | 10 (20.4%) |
| 5:30 AM to 5:59 AM | 0 (0.0%) | 10 (20.4%) |
| 6:00 AM to 6:29 AM | 19 (19.8%) | 0 (0.0%) |
| 6:30 AM to 6:59 AM | 4 (4.2%) | 0 (0.0%) |
| 7:00 AM to 7:29 AM | 18 (18.8%) | 8 (16.3%) |
| 7:30 AM to 7:59 AM | 11 (11.5%) | 5 (10.2%) |
| 8:00 AM to 8:29 AM | 6 (6.2%) | 3 (6.1%) |
| 8:30 AM to 8:59 AM | 0 (0.0%) | 2 (4.1%) |
| 9:00 AM to 9:59 AM | 7 (7.3%) | 0 (0.0%) |
| 10:00 AM to 10:59 AM | 0 (0.0%) | 2 (4.1%) |
| 11:00 AM to 11:59 AM | 0 (0.0%) | 0 (0.0%) |
| 12:00 PM to 3:59 PM | 4 (4.2%) | 4 (8.2%) |
| 4:00 PM to 11:59 PM | 0 (0.0%) | 0 (0.0%) |
| Total | 96 (100.0%) | 49 (100.0%) |
Housing Occupancy in Henderson
Occupancy by Ownership in Henderson
Of the total 140 dwellings in Henderson, owner-occupied units account for 120 (85.7%), while renter-occupied units make up 20 (14.3%).
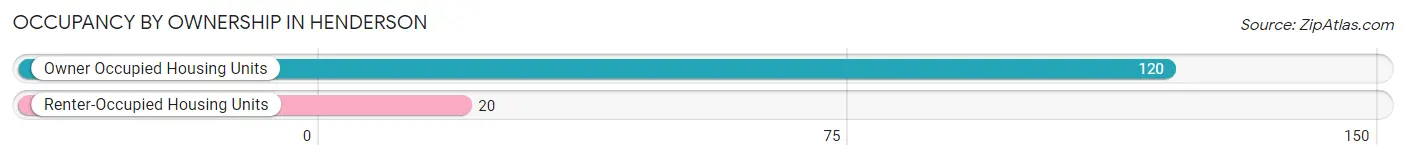
| Occupancy | # Housing Units | % Housing Units |
| Owner Occupied Housing Units | 120 | 85.7% |
| Renter-Occupied Housing Units | 20 | 14.3% |
| Total Occupied Housing Units | 140 | 100.0% |
Occupancy by Household Size in Henderson
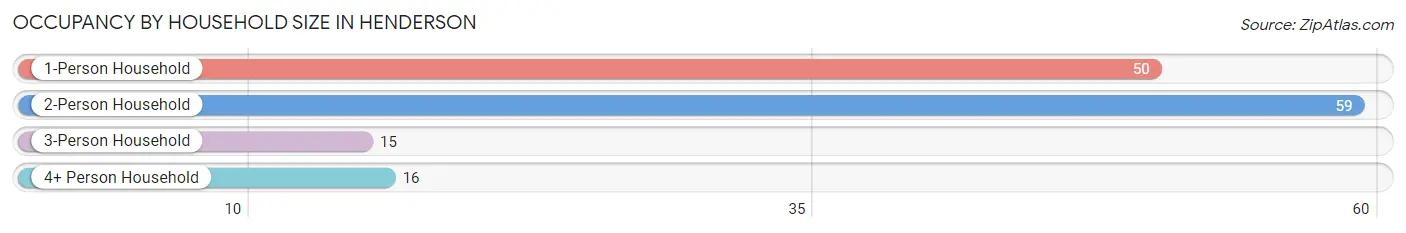
| Household Size | # Housing Units | % Housing Units |
| 1-Person Household | 50 | 35.7% |
| 2-Person Household | 59 | 42.1% |
| 3-Person Household | 15 | 10.7% |
| 4+ Person Household | 16 | 11.4% |
| Total Housing Units | 140 | 100.0% |
Occupancy by Ownership by Household Size in Henderson
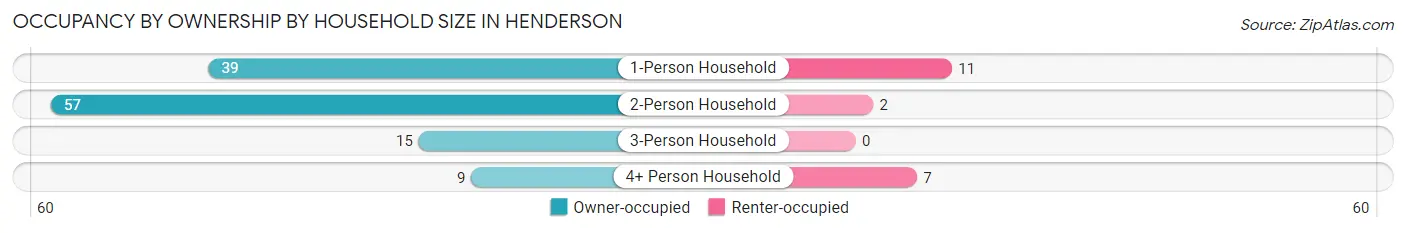
| Household Size | Owner-occupied | Renter-occupied |
| 1-Person Household | 39 (78.0%) | 11 (22.0%) |
| 2-Person Household | 57 (96.6%) | 2 (3.4%) |
| 3-Person Household | 15 (100.0%) | 0 (0.0%) |
| 4+ Person Household | 9 (56.2%) | 7 (43.8%) |
| Total Housing Units | 120 (85.7%) | 20 (14.3%) |
Occupancy by Educational Attainment in Henderson
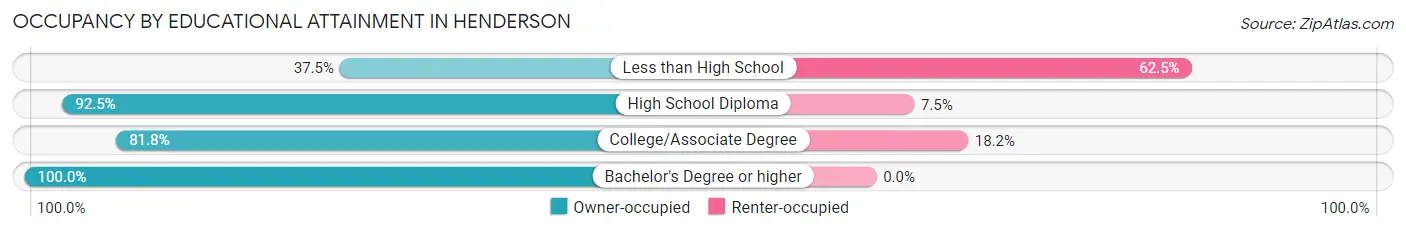
| Household Size | Owner-occupied | Renter-occupied |
| Less than High School | 3 (37.5%) | 5 (62.5%) |
| High School Diploma | 37 (92.5%) | 3 (7.5%) |
| College/Associate Degree | 54 (81.8%) | 12 (18.2%) |
| Bachelor's Degree or higher | 26 (100.0%) | 0 (0.0%) |
Occupancy by Age of Householder in Henderson
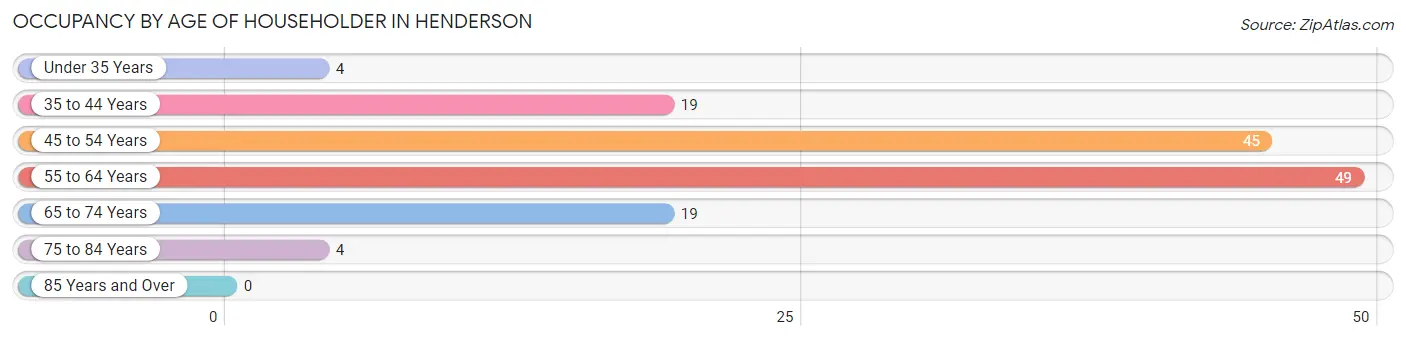
| Age Bracket | # Households | % Households |
| Under 35 Years | 4 | 2.9% |
| 35 to 44 Years | 19 | 13.6% |
| 45 to 54 Years | 45 | 32.1% |
| 55 to 64 Years | 49 | 35.0% |
| 65 to 74 Years | 19 | 13.6% |
| 75 to 84 Years | 4 | 2.9% |
| 85 Years and Over | 0 | 0.0% |
| Total | 140 | 100.0% |
Housing Finances in Henderson
Median Income by Occupancy in Henderson
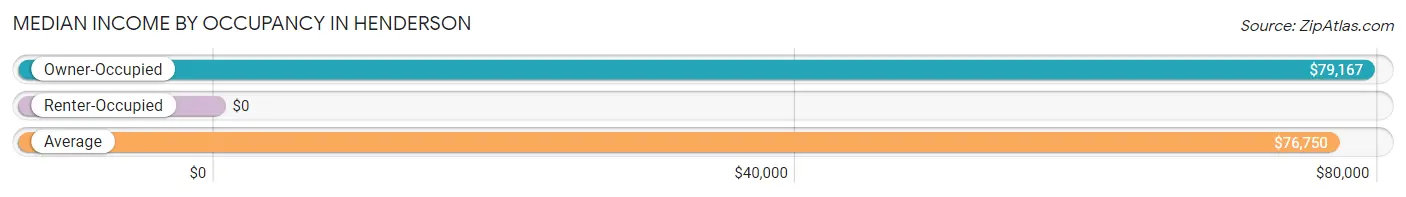
| Occupancy Type | # Households | Median Income |
| Owner-Occupied | 120 (85.7%) | $79,167 |
| Renter-Occupied | 20 (14.3%) | $0 |
| Average | 140 (100.0%) | $76,750 |
Occupancy by Householder Income Bracket in Henderson
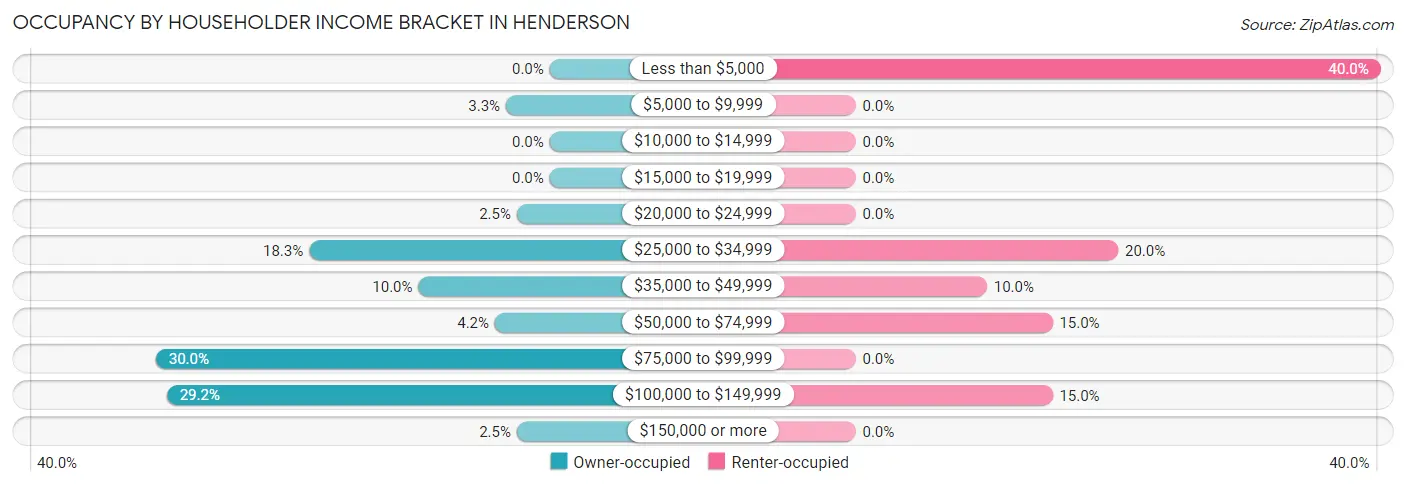
| Income Bracket | Owner-occupied | Renter-occupied |
| Less than $5,000 | 0 (0.0%) | 8 (40.0%) |
| $5,000 to $9,999 | 4 (3.3%) | 0 (0.0%) |
| $10,000 to $14,999 | 0 (0.0%) | 0 (0.0%) |
| $15,000 to $19,999 | 0 (0.0%) | 0 (0.0%) |
| $20,000 to $24,999 | 3 (2.5%) | 0 (0.0%) |
| $25,000 to $34,999 | 22 (18.3%) | 4 (20.0%) |
| $35,000 to $49,999 | 12 (10.0%) | 2 (10.0%) |
| $50,000 to $74,999 | 5 (4.2%) | 3 (15.0%) |
| $75,000 to $99,999 | 36 (30.0%) | 0 (0.0%) |
| $100,000 to $149,999 | 35 (29.2%) | 3 (15.0%) |
| $150,000 or more | 3 (2.5%) | 0 (0.0%) |
| Total | 120 (100.0%) | 20 (100.0%) |
Monthly Housing Cost Tiers in Henderson
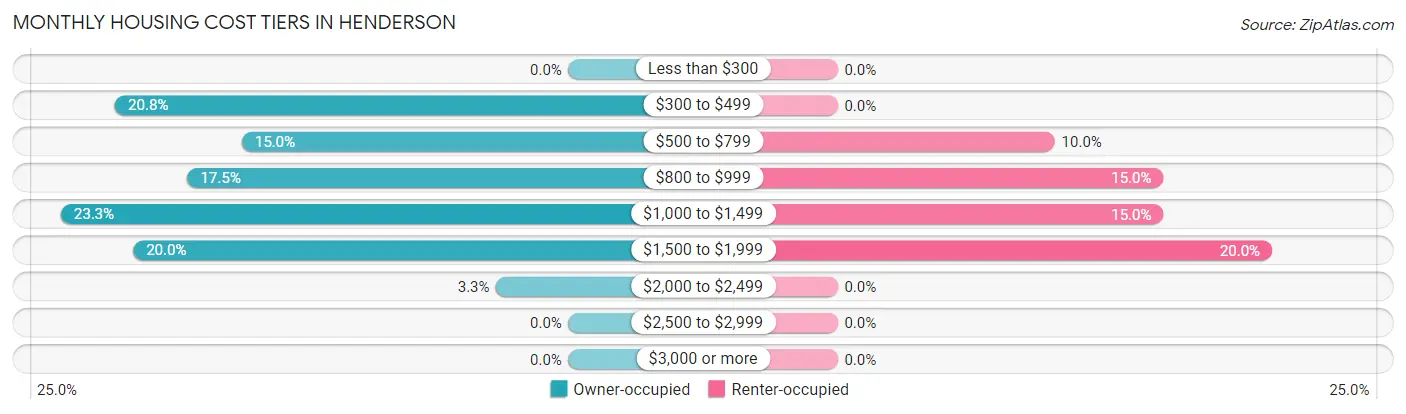
| Monthly Cost | Owner-occupied | Renter-occupied |
| Less than $300 | 0 (0.0%) | 0 (0.0%) |
| $300 to $499 | 25 (20.8%) | 0 (0.0%) |
| $500 to $799 | 18 (15.0%) | 2 (10.0%) |
| $800 to $999 | 21 (17.5%) | 3 (15.0%) |
| $1,000 to $1,499 | 28 (23.3%) | 3 (15.0%) |
| $1,500 to $1,999 | 24 (20.0%) | 4 (20.0%) |
| $2,000 to $2,499 | 4 (3.3%) | 0 (0.0%) |
| $2,500 to $2,999 | 0 (0.0%) | 0 (0.0%) |
| $3,000 or more | 0 (0.0%) | 0 (0.0%) |
| Total | 120 (100.0%) | 20 (100.0%) |
Physical Housing Characteristics in Henderson
Housing Structures in Henderson
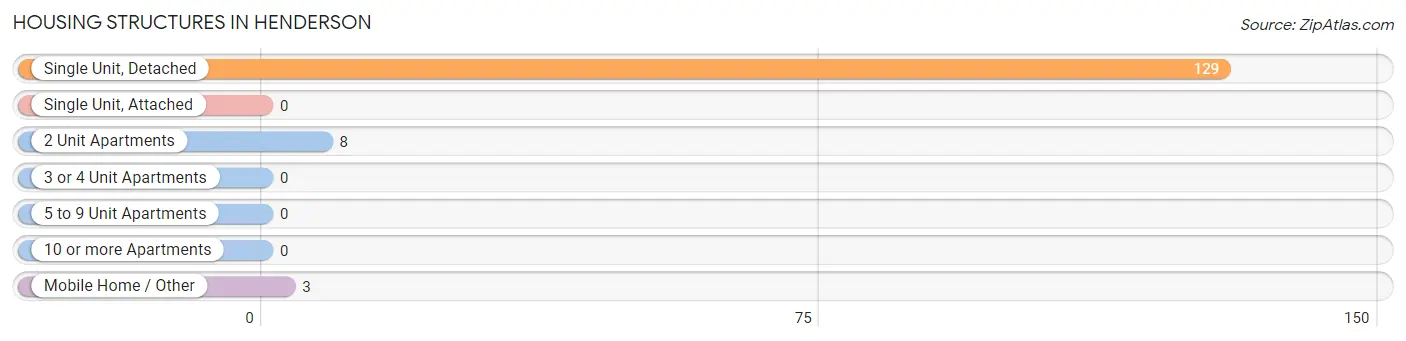
| Structure Type | # Housing Units | % Housing Units |
| Single Unit, Detached | 129 | 92.1% |
| Single Unit, Attached | 0 | 0.0% |
| 2 Unit Apartments | 8 | 5.7% |
| 3 or 4 Unit Apartments | 0 | 0.0% |
| 5 to 9 Unit Apartments | 0 | 0.0% |
| 10 or more Apartments | 0 | 0.0% |
| Mobile Home / Other | 3 | 2.1% |
| Total | 140 | 100.0% |
Housing Structures by Occupancy in Henderson
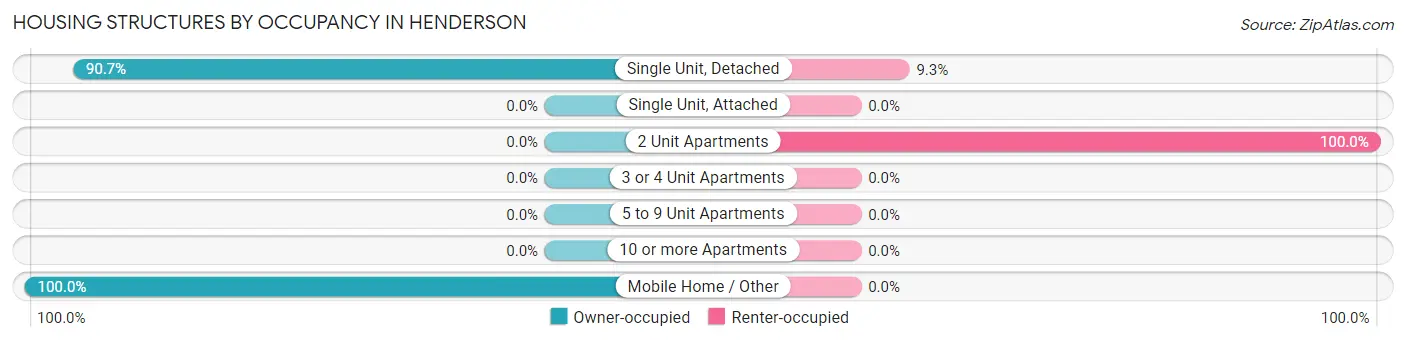
| Structure Type | Owner-occupied | Renter-occupied |
| Single Unit, Detached | 117 (90.7%) | 12 (9.3%) |
| Single Unit, Attached | 0 (0.0%) | 0 (0.0%) |
| 2 Unit Apartments | 0 (0.0%) | 8 (100.0%) |
| 3 or 4 Unit Apartments | 0 (0.0%) | 0 (0.0%) |
| 5 to 9 Unit Apartments | 0 (0.0%) | 0 (0.0%) |
| 10 or more Apartments | 0 (0.0%) | 0 (0.0%) |
| Mobile Home / Other | 3 (100.0%) | 0 (0.0%) |
| Total | 120 (85.7%) | 20 (14.3%) |
Housing Structures by Number of Rooms in Henderson
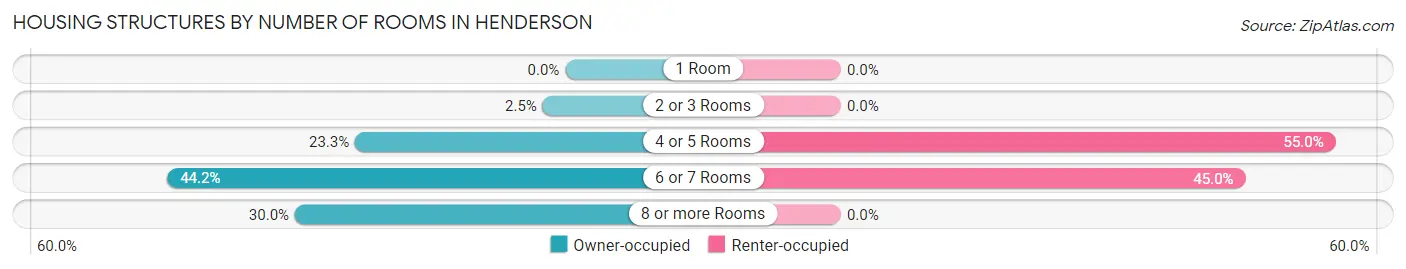
| Number of Rooms | Owner-occupied | Renter-occupied |
| 1 Room | 0 (0.0%) | 0 (0.0%) |
| 2 or 3 Rooms | 3 (2.5%) | 0 (0.0%) |
| 4 or 5 Rooms | 28 (23.3%) | 11 (55.0%) |
| 6 or 7 Rooms | 53 (44.2%) | 9 (45.0%) |
| 8 or more Rooms | 36 (30.0%) | 0 (0.0%) |
| Total | 120 (100.0%) | 20 (100.0%) |
Housing Structure by Heating Type in Henderson
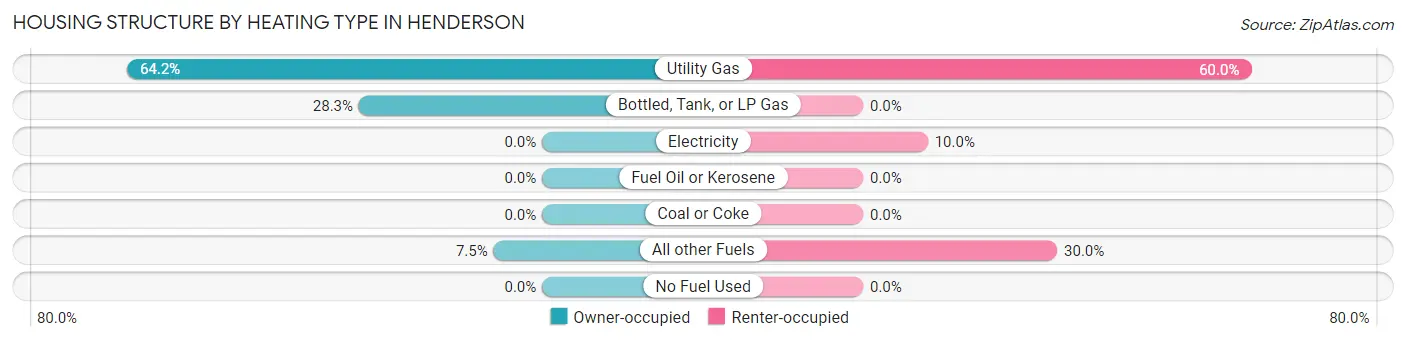
| Heating Type | Owner-occupied | Renter-occupied |
| Utility Gas | 77 (64.2%) | 12 (60.0%) |
| Bottled, Tank, or LP Gas | 34 (28.3%) | 0 (0.0%) |
| Electricity | 0 (0.0%) | 2 (10.0%) |
| Fuel Oil or Kerosene | 0 (0.0%) | 0 (0.0%) |
| Coal or Coke | 0 (0.0%) | 0 (0.0%) |
| All other Fuels | 9 (7.5%) | 6 (30.0%) |
| No Fuel Used | 0 (0.0%) | 0 (0.0%) |
| Total | 120 (100.0%) | 20 (100.0%) |
Household Vehicle Usage in Henderson
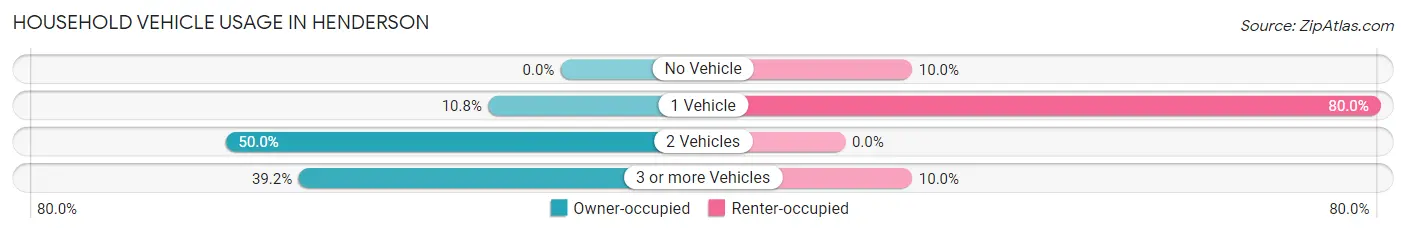
| Vehicles per Household | Owner-occupied | Renter-occupied |
| No Vehicle | 0 (0.0%) | 2 (10.0%) |
| 1 Vehicle | 13 (10.8%) | 16 (80.0%) |
| 2 Vehicles | 60 (50.0%) | 0 (0.0%) |
| 3 or more Vehicles | 47 (39.2%) | 2 (10.0%) |
| Total | 120 (100.0%) | 20 (100.0%) |
Real Estate & Mortgages in Henderson
Real Estate and Mortgage Overview in Henderson
| Characteristic | Without Mortgage | With Mortgage |
| Housing Units | 50 | 70 |
| Median Property Value | $187,500 | $190,000 |
| Median Household Income | $51,250 | $0 |
| Monthly Housing Costs | $500 | $0 |
| Real Estate Taxes | $1,450 | $4 |
Property Value by Mortgage Status in Henderson
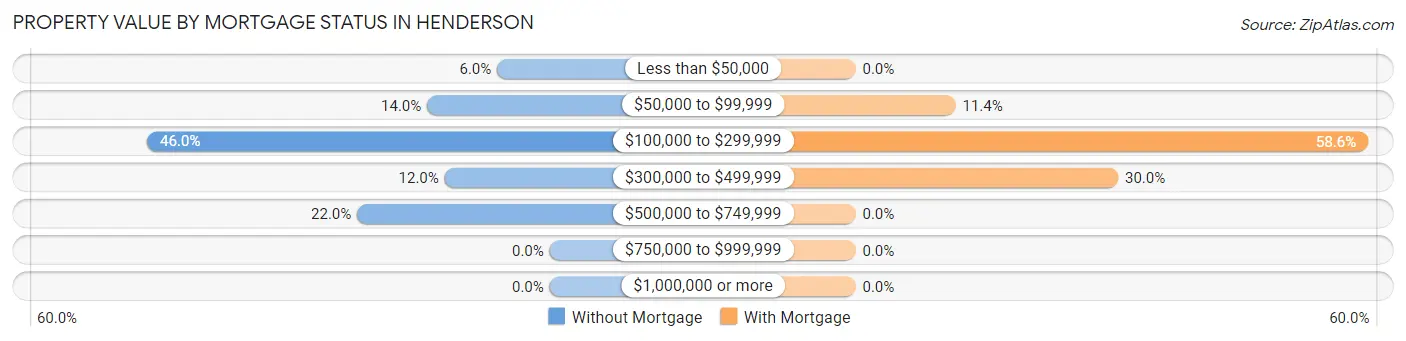
| Property Value | Without Mortgage | With Mortgage |
| Less than $50,000 | 3 (6.0%) | 0 (0.0%) |
| $50,000 to $99,999 | 7 (14.0%) | 8 (11.4%) |
| $100,000 to $299,999 | 23 (46.0%) | 41 (58.6%) |
| $300,000 to $499,999 | 6 (12.0%) | 21 (30.0%) |
| $500,000 to $749,999 | 11 (22.0%) | 0 (0.0%) |
| $750,000 to $999,999 | 0 (0.0%) | 0 (0.0%) |
| $1,000,000 or more | 0 (0.0%) | 0 (0.0%) |
| Total | 50 (100.0%) | 70 (100.0%) |
Household Income by Mortgage Status in Henderson
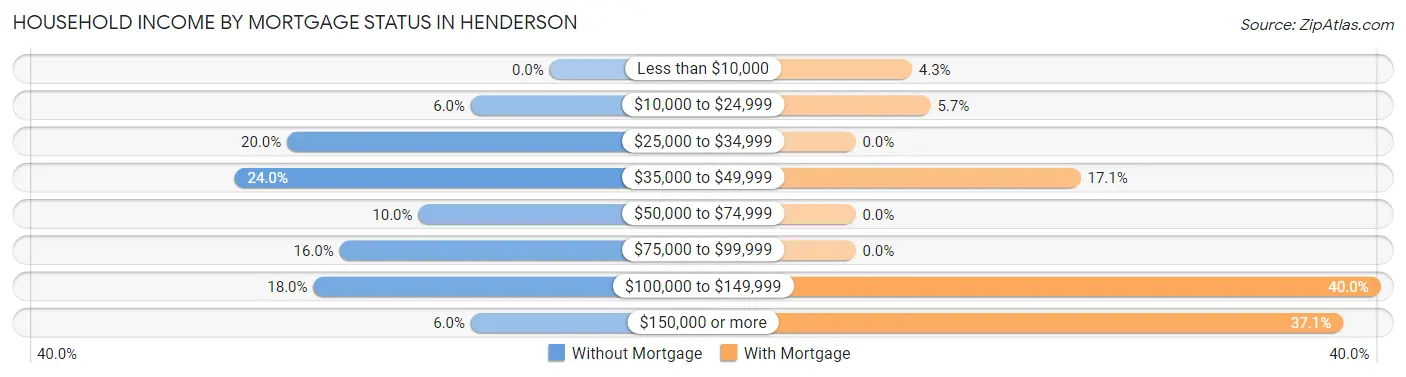
| Household Income | Without Mortgage | With Mortgage |
| Less than $10,000 | 0 (0.0%) | 3 (4.3%) |
| $10,000 to $24,999 | 3 (6.0%) | 4 (5.7%) |
| $25,000 to $34,999 | 10 (20.0%) | 0 (0.0%) |
| $35,000 to $49,999 | 12 (24.0%) | 12 (17.1%) |
| $50,000 to $74,999 | 5 (10.0%) | 0 (0.0%) |
| $75,000 to $99,999 | 8 (16.0%) | 0 (0.0%) |
| $100,000 to $149,999 | 9 (18.0%) | 28 (40.0%) |
| $150,000 or more | 3 (6.0%) | 26 (37.1%) |
| Total | 50 (100.0%) | 70 (100.0%) |
Property Value to Household Income Ratio in Henderson
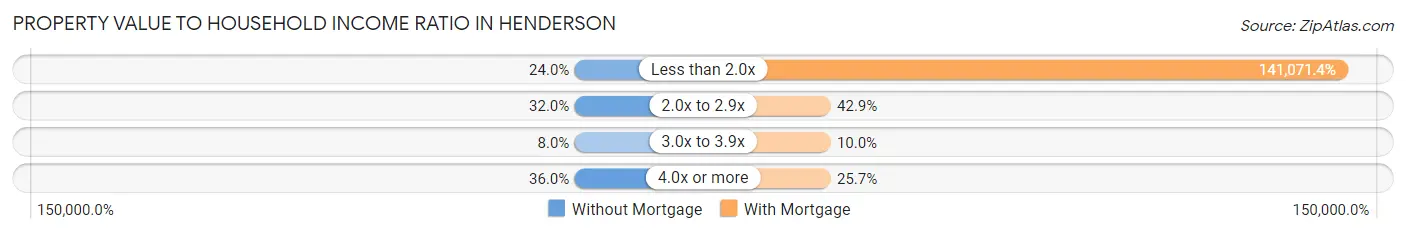
| Value-to-Income Ratio | Without Mortgage | With Mortgage |
| Less than 2.0x | 12 (24.0%) | 98,750 (141,071.4%) |
| 2.0x to 2.9x | 16 (32.0%) | 30 (42.9%) |
| 3.0x to 3.9x | 4 (8.0%) | 7 (10.0%) |
| 4.0x or more | 18 (36.0%) | 18 (25.7%) |
| Total | 50 (100.0%) | 70 (100.0%) |
Real Estate Taxes by Mortgage Status in Henderson
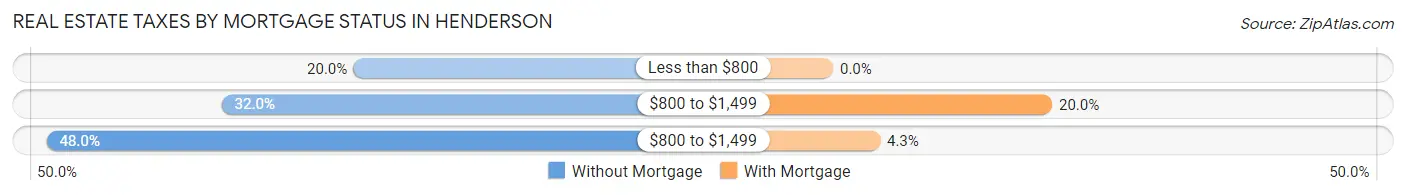
| Property Taxes | Without Mortgage | With Mortgage |
| Less than $800 | 10 (20.0%) | 0 (0.0%) |
| $800 to $1,499 | 16 (32.0%) | 14 (20.0%) |
| $800 to $1,499 | 24 (48.0%) | 3 (4.3%) |
| Total | 50 (100.0%) | 70 (100.0%) |
Health & Disability in Henderson
Health Insurance Coverage by Age in Henderson
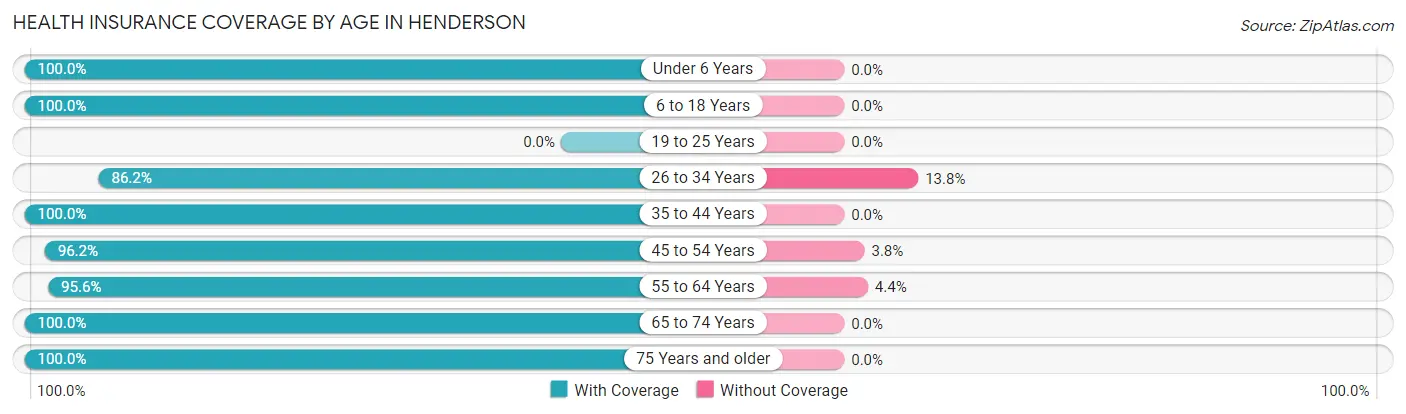
| Age Bracket | With Coverage | Without Coverage |
| Under 6 Years | 3 (100.0%) | 0 (0.0%) |
| 6 to 18 Years | 36 (100.0%) | 0 (0.0%) |
| 19 to 25 Years | 0 (0.0%) | 0 (0.0%) |
| 26 to 34 Years | 25 (86.2%) | 4 (13.8%) |
| 35 to 44 Years | 32 (100.0%) | 0 (0.0%) |
| 45 to 54 Years | 51 (96.2%) | 2 (3.8%) |
| 55 to 64 Years | 87 (95.6%) | 4 (4.4%) |
| 65 to 74 Years | 33 (100.0%) | 0 (0.0%) |
| 75 Years and older | 11 (100.0%) | 0 (0.0%) |
| Total | 278 (96.5%) | 10 (3.5%) |
Health Insurance Coverage by Citizenship Status in Henderson
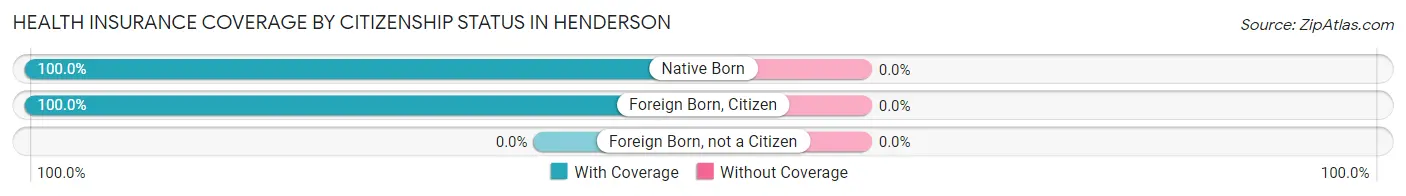
| Citizenship Status | With Coverage | Without Coverage |
| Native Born | 3 (100.0%) | 0 (0.0%) |
| Foreign Born, Citizen | 36 (100.0%) | 0 (0.0%) |
| Foreign Born, not a Citizen | 0 (0.0%) | 0 (0.0%) |
Health Insurance Coverage by Household Income in Henderson
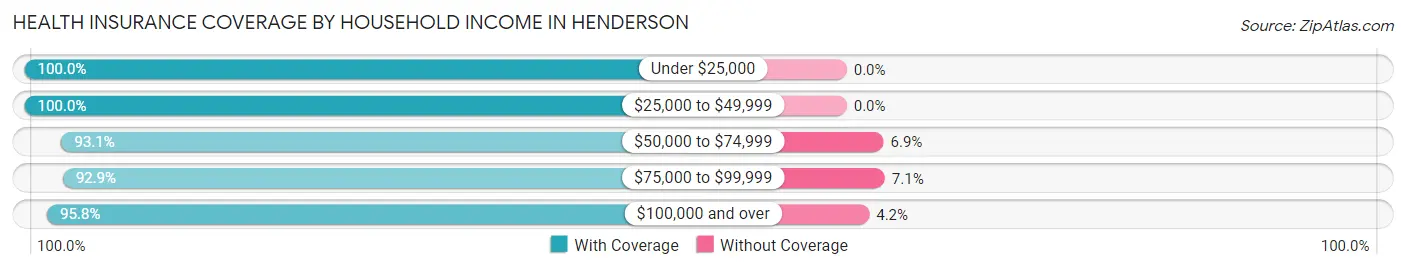
| Household Income | With Coverage | Without Coverage |
| Under $25,000 | 17 (100.0%) | 0 (0.0%) |
| $25,000 to $49,999 | 91 (100.0%) | 0 (0.0%) |
| $50,000 to $74,999 | 27 (93.1%) | 2 (6.9%) |
| $75,000 to $99,999 | 52 (92.9%) | 4 (7.1%) |
| $100,000 and over | 91 (95.8%) | 4 (4.2%) |
Public vs Private Health Insurance Coverage by Age in Henderson
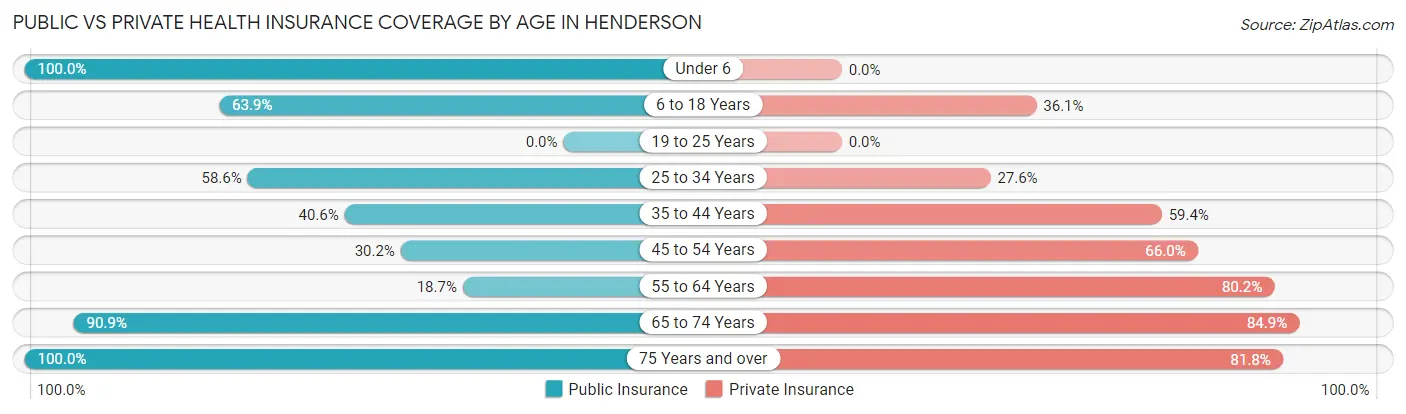
| Age Bracket | Public Insurance | Private Insurance |
| Under 6 | 3 (100.0%) | 0 (0.0%) |
| 6 to 18 Years | 23 (63.9%) | 13 (36.1%) |
| 19 to 25 Years | 0 (0.0%) | 0 (0.0%) |
| 25 to 34 Years | 17 (58.6%) | 8 (27.6%) |
| 35 to 44 Years | 13 (40.6%) | 19 (59.4%) |
| 45 to 54 Years | 16 (30.2%) | 35 (66.0%) |
| 55 to 64 Years | 17 (18.7%) | 73 (80.2%) |
| 65 to 74 Years | 30 (90.9%) | 28 (84.9%) |
| 75 Years and over | 11 (100.0%) | 9 (81.8%) |
| Total | 130 (45.1%) | 185 (64.2%) |
Disability Status by Sex by Age in Henderson
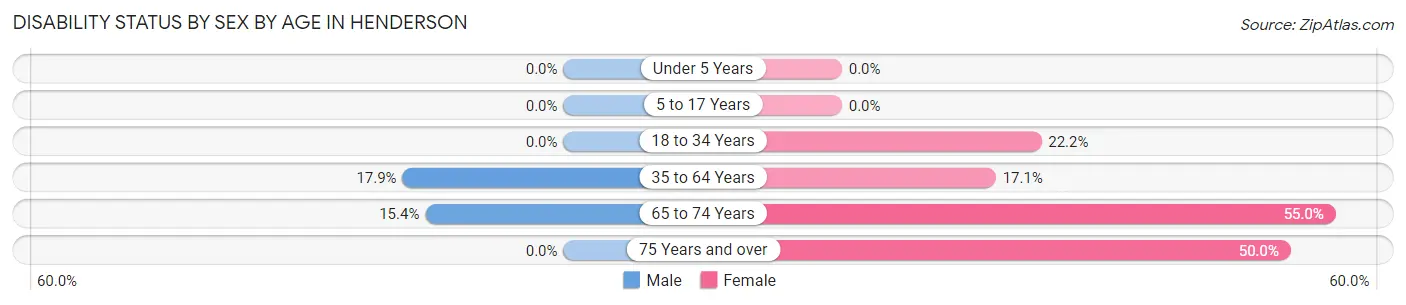
| Age Bracket | Male | Female |
| Under 5 Years | 0 (0.0%) | 0 (0.0%) |
| 5 to 17 Years | 0 (0.0%) | 0 (0.0%) |
| 18 to 34 Years | 0 (0.0%) | 4 (22.2%) |
| 35 to 64 Years | 19 (17.9%) | 12 (17.1%) |
| 65 to 74 Years | 2 (15.4%) | 11 (55.0%) |
| 75 Years and over | 0 (0.0%) | 3 (50.0%) |
Disability Class by Sex by Age in Henderson
Disability Class: Hearing Difficulty
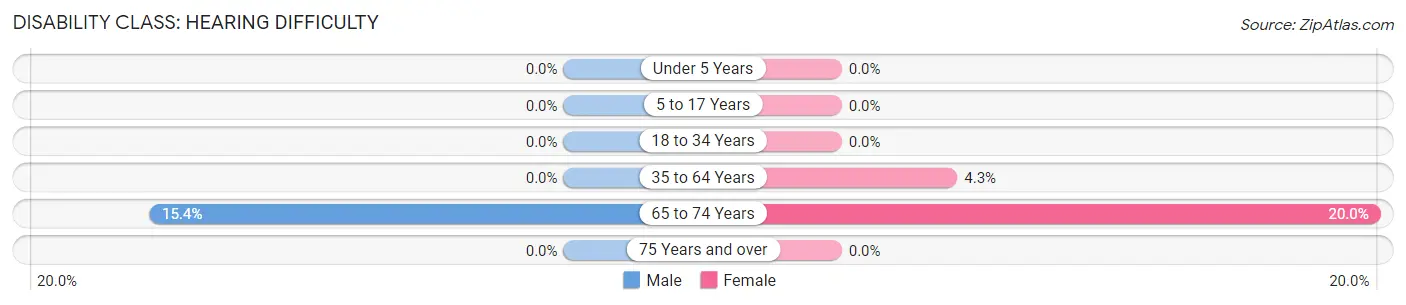
| Age Bracket | Male | Female |
| Under 5 Years | 0 (0.0%) | 0 (0.0%) |
| 5 to 17 Years | 0 (0.0%) | 0 (0.0%) |
| 18 to 34 Years | 0 (0.0%) | 0 (0.0%) |
| 35 to 64 Years | 0 (0.0%) | 3 (4.3%) |
| 65 to 74 Years | 2 (15.4%) | 4 (20.0%) |
| 75 Years and over | 0 (0.0%) | 0 (0.0%) |
Disability Class: Vision Difficulty
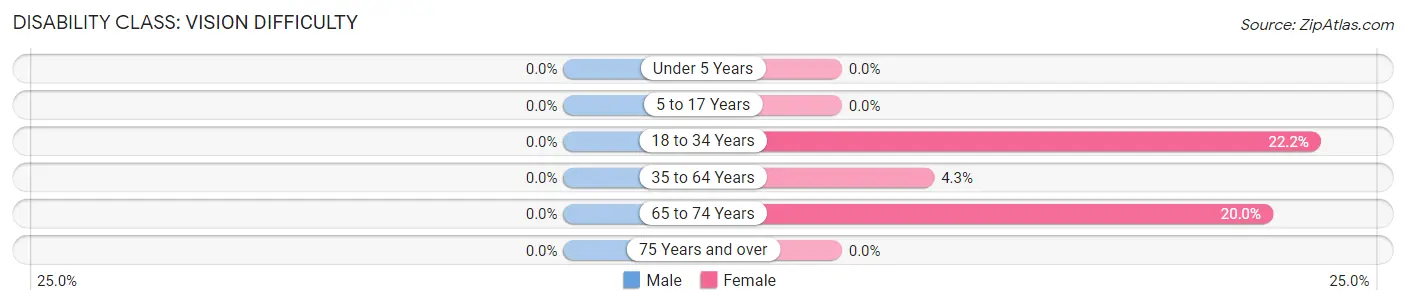
| Age Bracket | Male | Female |
| Under 5 Years | 0 (0.0%) | 0 (0.0%) |
| 5 to 17 Years | 0 (0.0%) | 0 (0.0%) |
| 18 to 34 Years | 0 (0.0%) | 4 (22.2%) |
| 35 to 64 Years | 0 (0.0%) | 3 (4.3%) |
| 65 to 74 Years | 0 (0.0%) | 4 (20.0%) |
| 75 Years and over | 0 (0.0%) | 0 (0.0%) |
Disability Class: Cognitive Difficulty
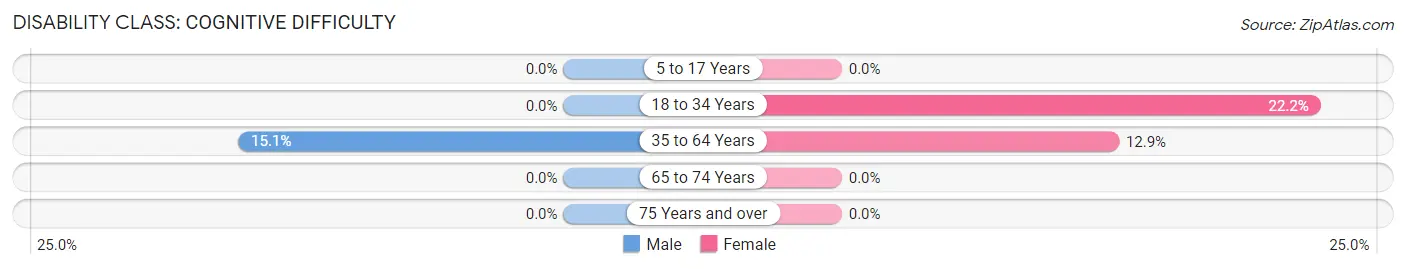
| Age Bracket | Male | Female |
| 5 to 17 Years | 0 (0.0%) | 0 (0.0%) |
| 18 to 34 Years | 0 (0.0%) | 4 (22.2%) |
| 35 to 64 Years | 16 (15.1%) | 9 (12.9%) |
| 65 to 74 Years | 0 (0.0%) | 0 (0.0%) |
| 75 Years and over | 0 (0.0%) | 0 (0.0%) |
Disability Class: Ambulatory Difficulty
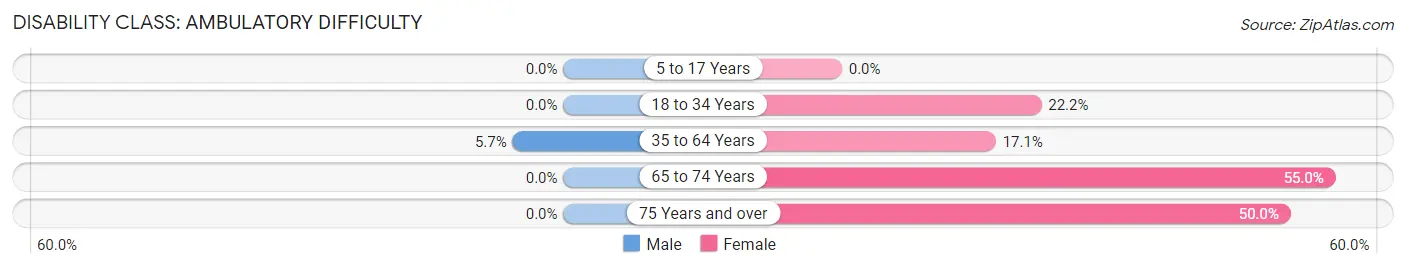
| Age Bracket | Male | Female |
| 5 to 17 Years | 0 (0.0%) | 0 (0.0%) |
| 18 to 34 Years | 0 (0.0%) | 4 (22.2%) |
| 35 to 64 Years | 6 (5.7%) | 12 (17.1%) |
| 65 to 74 Years | 0 (0.0%) | 11 (55.0%) |
| 75 Years and over | 0 (0.0%) | 3 (50.0%) |
Disability Class: Self-Care Difficulty
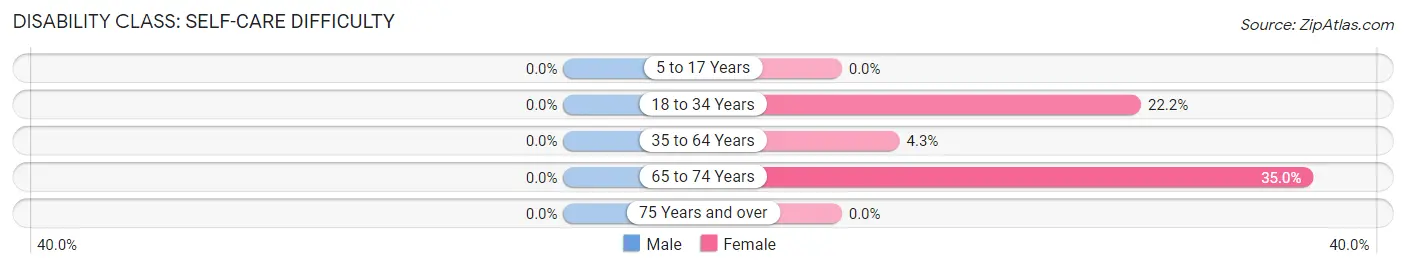
| Age Bracket | Male | Female |
| 5 to 17 Years | 0 (0.0%) | 0 (0.0%) |
| 18 to 34 Years | 0 (0.0%) | 4 (22.2%) |
| 35 to 64 Years | 0 (0.0%) | 3 (4.3%) |
| 65 to 74 Years | 0 (0.0%) | 7 (35.0%) |
| 75 Years and over | 0 (0.0%) | 0 (0.0%) |
Technology Access in Henderson
Computing Device Access in Henderson
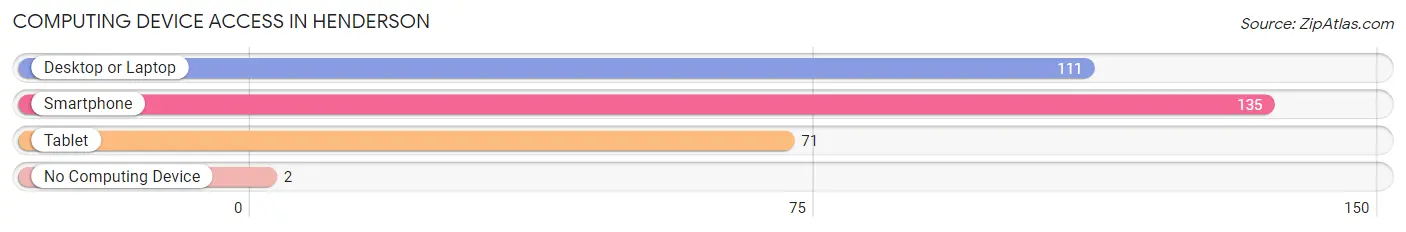
| Device Type | # Households | % Households |
| Desktop or Laptop | 111 | 79.3% |
| Smartphone | 135 | 96.4% |
| Tablet | 71 | 50.7% |
| No Computing Device | 2 | 1.4% |
| Total | 140 | 100.0% |
Internet Access in Henderson
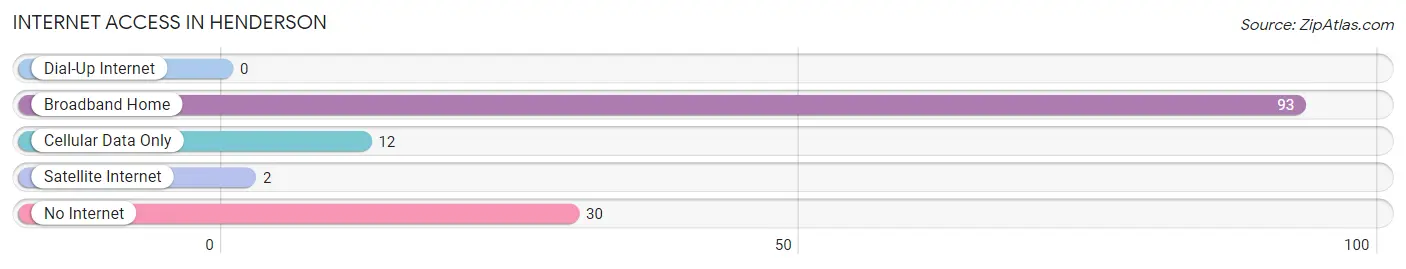
| Internet Type | # Households | % Households |
| Dial-Up Internet | 0 | 0.0% |
| Broadband Home | 93 | 66.4% |
| Cellular Data Only | 12 | 8.6% |
| Satellite Internet | 2 | 1.4% |
| No Internet | 30 | 21.4% |
| Total | 140 | 100.0% |
Henderson Summary
Henderson, Michigan is a small village located in the Upper Peninsula of Michigan. It is situated in the western part of the state, near the border with Wisconsin. The village is located in Menominee County, and is part of the Menominee Indian Reservation. The population of Henderson was estimated to be around 500 people in 2020.
Geography
Henderson is located in the Upper Peninsula of Michigan, near the border with Wisconsin. The village is situated in Menominee County, and is part of the Menominee Indian Reservation. The village is located on the Menominee River, which is a tributary of Lake Michigan. The village is surrounded by forests and lakes, and is a popular destination for outdoor recreation.
The climate in Henderson is typical of the Upper Peninsula, with cold winters and warm summers. The average temperature in the winter is around 20 degrees Fahrenheit, and the average temperature in the summer is around 70 degrees Fahrenheit. The average annual precipitation is around 30 inches.
Economy
The economy of Henderson is largely based on tourism and outdoor recreation. The village is a popular destination for fishing, hunting, and camping. There are several resorts and lodges in the area, as well as a number of restaurants and bars. The village also has a small retail sector, with a few stores and shops.
The village is also home to a number of small businesses, including a sawmill, a lumber yard, and a few other small businesses. The village is also home to a number of small farms, which produce a variety of crops, including potatoes, corn, and hay.
Demographics
The population of Henderson was estimated to be around 500 people in 2020. The majority of the population is of Native American descent, with the majority being members of the Menominee tribe. The village also has a small population of non-Native Americans, including African Americans, Hispanics, and Asians.
The median household income in Henderson is around $30,000, and the median home value is around $90,000. The village has a high rate of poverty, with around 25% of the population living below the poverty line.
Conclusion
Henderson, Michigan is a small village located in the Upper Peninsula of Michigan. It is situated in the western part of the state, near the border with Wisconsin. The village is located in Menominee County, and is part of the Menominee Indian Reservation. The population of Henderson was estimated to be around 500 people in 2020. The economy of Henderson is largely based on tourism and outdoor recreation, and the village has a small retail sector. The majority of the population is of Native American descent, with the majority being members of the Menominee tribe. The median household income in Henderson is around $30,000, and the median home value is around $90,000. The village has a high rate of poverty, with around 25% of the population living below the poverty line.
Common Questions
What is Per Capita Income in Henderson?
Per Capita income in Henderson is $35,501.
What is the Median Family Income in Henderson?
Median Family Income in Henderson is $97,813.
What is the Median Household income in Henderson?
Median Household Income in Henderson is $76,750.
What is Income or Wage Gap in Henderson?
Income or Wage Gap in Henderson is 51.9%.
Women in Henderson earn 48.1 cents for every dollar earned by a man.
What is Inequality or Gini Index in Henderson?
Inequality or Gini Index in Henderson is 0.34.
What is the Total Population of Henderson?
Total Population of Henderson is 288.
What is the Total Male Population of Henderson?
Total Male Population of Henderson is 163.
What is the Total Female Population of Henderson?
Total Female Population of Henderson is 125.
What is the Ratio of Males per 100 Females in Henderson?
There are 130.40 Males per 100 Females in Henderson.
What is the Ratio of Females per 100 Males in Henderson?
There are 76.69 Females per 100 Males in Henderson.
What is the Median Population Age in Henderson?
Median Population Age in Henderson is 53.4 Years.
What is the Average Family Size in Henderson
Average Family Size in Henderson is 2.6 People.
What is the Average Household Size in Henderson
Average Household Size in Henderson is 2.1 People.
How Large is the Labor Force in Henderson?
There are 167 People in the Labor Forcein in Henderson.
What is the Percentage of People in the Labor Force in Henderson?
64.7% of People are in the Labor Force in Henderson.
What is the Unemployment Rate in Henderson?
Unemployment Rate in Henderson is 3.6%.