Hemlock, MI Map & Demographics
Hemlock Map
Hemlock Overview
$34,399
PER CAPITA INCOME
$82,917
AVG FAMILY INCOME
$58,787
AVG HOUSEHOLD INCOME
52.8%
WAGE / INCOME GAP [ % ]
47.2¢/ $1
WAGE / INCOME GAP [ $ ]
0.39
INEQUALITY / GINI INDEX
1,226
TOTAL POPULATION
523
MALE POPULATION
703
FEMALE POPULATION
74.40
MALES / 100 FEMALES
134.42
FEMALES / 100 MALES
39.4
MEDIAN AGE
3.0
AVG FAMILY SIZE
2.4
AVG HOUSEHOLD SIZE
804
LABOR FORCE [ PEOPLE ]
79.1%
PERCENT IN LABOR FORCE
Hemlock Zip Codes
Hemlock Area Codes
Income in Hemlock
Income Overview in Hemlock
Per Capita Income in Hemlock is $34,399, while median incomes of families and households are $82,917 and $58,787 respectively.
| Characteristic | Number | Measure |
| Per Capita Income | 1,226 | $34,399 |
| Median Family Income | 338 | $82,917 |
| Mean Family Income | 338 | $94,866 |
| Median Household Income | 513 | $58,787 |
| Mean Household Income | 513 | $81,162 |
| Income Deficit | 338 | $0 |
| Wage / Income Gap (%) | 1,226 | 52.81% |
| Wage / Income Gap ($) | 1,226 | 47.19¢ per $1 |
| Gini / Inequality Index | 1,226 | 0.39 |
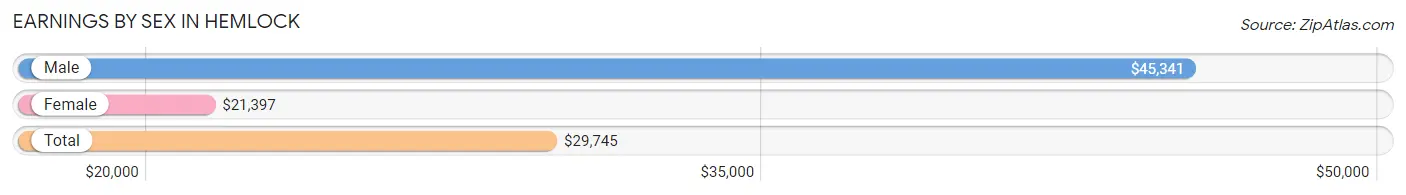
Earnings by Sex in Hemlock
Average Earnings in Hemlock are $29,745, $45,341 for men and $21,397 for women, a difference of 52.8%.
| Sex | Number | Average Earnings |
| Male | 374 (46.1%) | $45,341 |
| Female | 437 (53.9%) | $21,397 |
| Total | 811 (100.0%) | $29,745 |
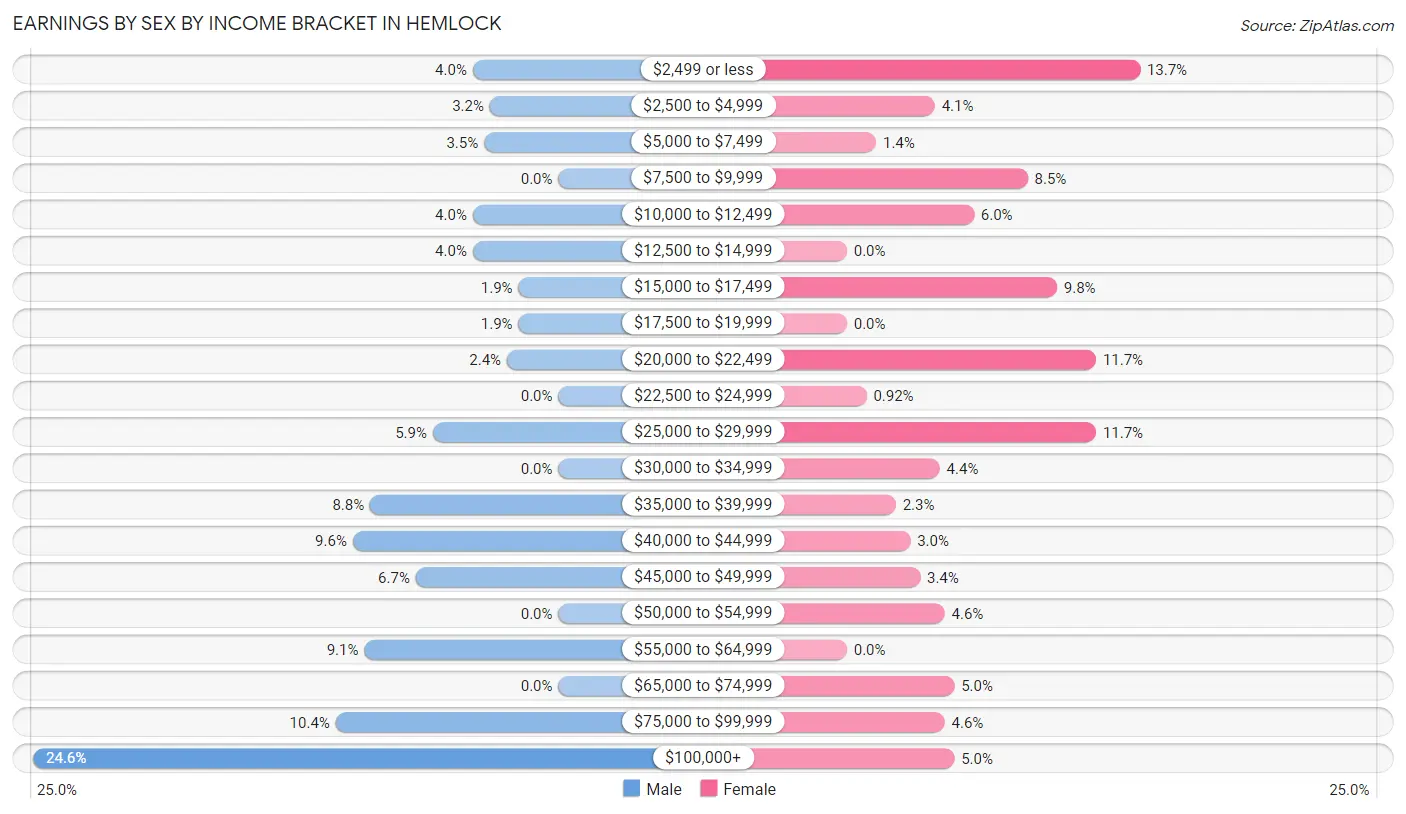
Earnings by Sex by Income Bracket in Hemlock
The most common earnings brackets in Hemlock are $100,000+ for men (92 | 24.6%) and $2,499 or less for women (60 | 13.7%).
| Income | Male | Female |
| $2,499 or less | 15 (4.0%) | 60 (13.7%) |
| $2,500 to $4,999 | 12 (3.2%) | 18 (4.1%) |
| $5,000 to $7,499 | 13 (3.5%) | 6 (1.4%) |
| $7,500 to $9,999 | 0 (0.0%) | 37 (8.5%) |
| $10,000 to $12,499 | 15 (4.0%) | 26 (5.9%) |
| $12,500 to $14,999 | 15 (4.0%) | 0 (0.0%) |
| $15,000 to $17,499 | 7 (1.9%) | 43 (9.8%) |
| $17,500 to $19,999 | 7 (1.9%) | 0 (0.0%) |
| $20,000 to $22,499 | 9 (2.4%) | 51 (11.7%) |
| $22,500 to $24,999 | 0 (0.0%) | 4 (0.9%) |
| $25,000 to $29,999 | 22 (5.9%) | 51 (11.7%) |
| $30,000 to $34,999 | 0 (0.0%) | 19 (4.3%) |
| $35,000 to $39,999 | 33 (8.8%) | 10 (2.3%) |
| $40,000 to $44,999 | 36 (9.6%) | 13 (3.0%) |
| $45,000 to $49,999 | 25 (6.7%) | 15 (3.4%) |
| $50,000 to $54,999 | 0 (0.0%) | 20 (4.6%) |
| $55,000 to $64,999 | 34 (9.1%) | 0 (0.0%) |
| $65,000 to $74,999 | 0 (0.0%) | 22 (5.0%) |
| $75,000 to $99,999 | 39 (10.4%) | 20 (4.6%) |
| $100,000+ | 92 (24.6%) | 22 (5.0%) |
| Total | 374 (100.0%) | 437 (100.0%) |
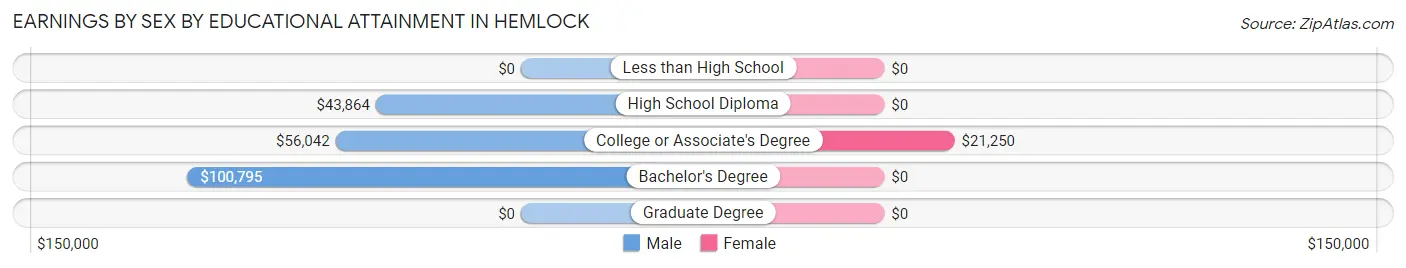
Earnings by Sex by Educational Attainment in Hemlock
Average earnings in Hemlock are $58,816 for men and $26,316 for women, a difference of 55.3%. Men with an educational attainment of bachelor's degree enjoy the highest average annual earnings of $100,795, while those with high school diploma education earn the least with $43,864. Women with an educational attainment of college or associate's degree earn the most with the average annual earnings of $21,250, while those with college or associate's degree education have the smallest earnings of $21,250.
| Educational Attainment | Male Income | Female Income |
| Less than High School | - | - |
| High School Diploma | $43,864 | $0 |
| College or Associate's Degree | $56,042 | $21,250 |
| Bachelor's Degree | $100,795 | $0 |
| Graduate Degree | - | - |
| Total | $58,816 | $26,316 |
Family Income in Hemlock
Family Income Brackets in Hemlock
According to the Hemlock family income data, there are 80 families falling into the $150,000 to $199,999 income range, which is the most common income bracket and makes up 23.7% of all families.
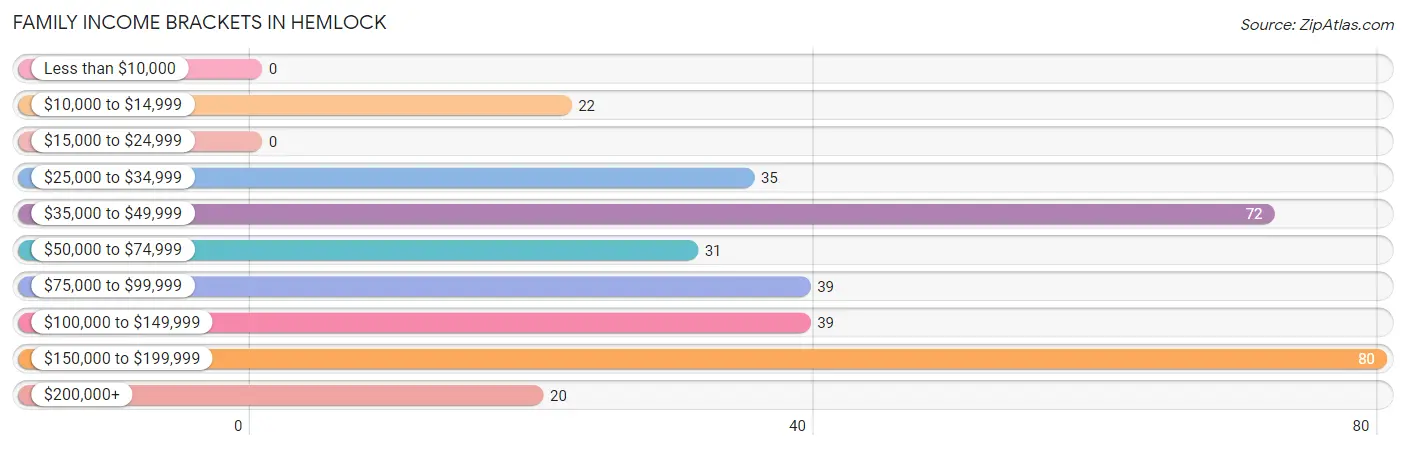
| Income Bracket | # Families | % Families |
| Less than $10,000 | 0 | 0.0% |
| $10,000 to $14,999 | 22 | 6.5% |
| $15,000 to $24,999 | 0 | 0.0% |
| $25,000 to $34,999 | 35 | 10.4% |
| $35,000 to $49,999 | 72 | 21.3% |
| $50,000 to $74,999 | 31 | 9.2% |
| $75,000 to $99,999 | 39 | 11.5% |
| $100,000 to $149,999 | 39 | 11.5% |
| $150,000 to $199,999 | 80 | 23.7% |
| $200,000+ | 20 | 5.9% |
Family Income by Famaliy Size in Hemlock
4-person families (97 | 28.7%) account for the highest median family income in Hemlock with $172,772 per family, while 4-person families (97 | 28.7%) have the highest median income of $43,193 per family member.
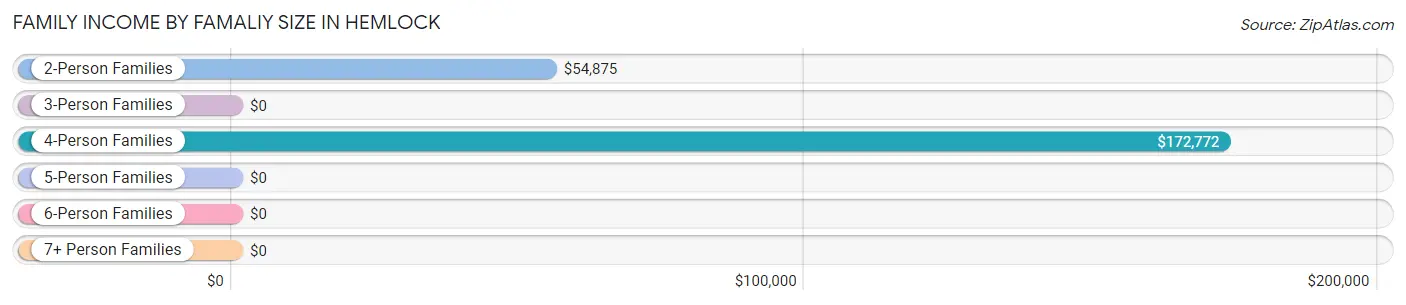
| Income Bracket | # Families | Median Income |
| 2-Person Families | 183 (54.1%) | $54,875 |
| 3-Person Families | 36 (10.6%) | $0 |
| 4-Person Families | 97 (28.7%) | $172,772 |
| 5-Person Families | 9 (2.7%) | $0 |
| 6-Person Families | 13 (3.8%) | $0 |
| 7+ Person Families | 0 (0.0%) | $0 |
| Total | 338 (100.0%) | $82,917 |
Family Income by Number of Earners in Hemlock
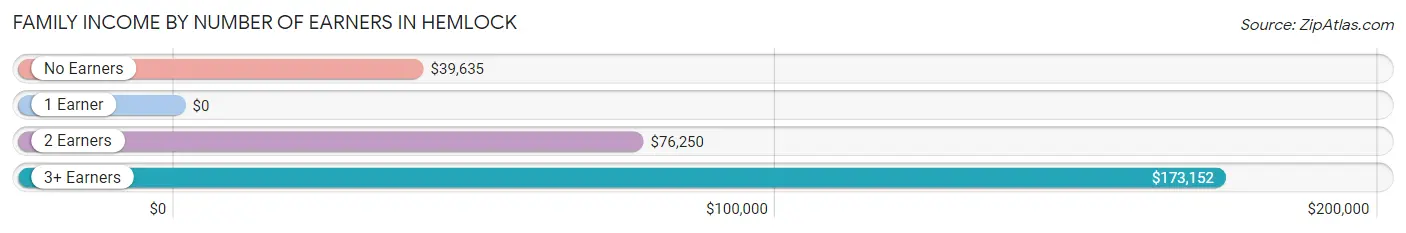
| Number of Earners | # Families | Median Income |
| No Earners | 41 (12.1%) | $39,635 |
| 1 Earner | 108 (32.0%) | $0 |
| 2 Earners | 115 (34.0%) | $76,250 |
| 3+ Earners | 74 (21.9%) | $173,152 |
| Total | 338 (100.0%) | $82,917 |
Household Income in Hemlock
Household Income Brackets in Hemlock
With 130 households falling in the category, the $35,000 to $49,999 income range is the most frequent in Hemlock, accounting for 25.3% of all households.
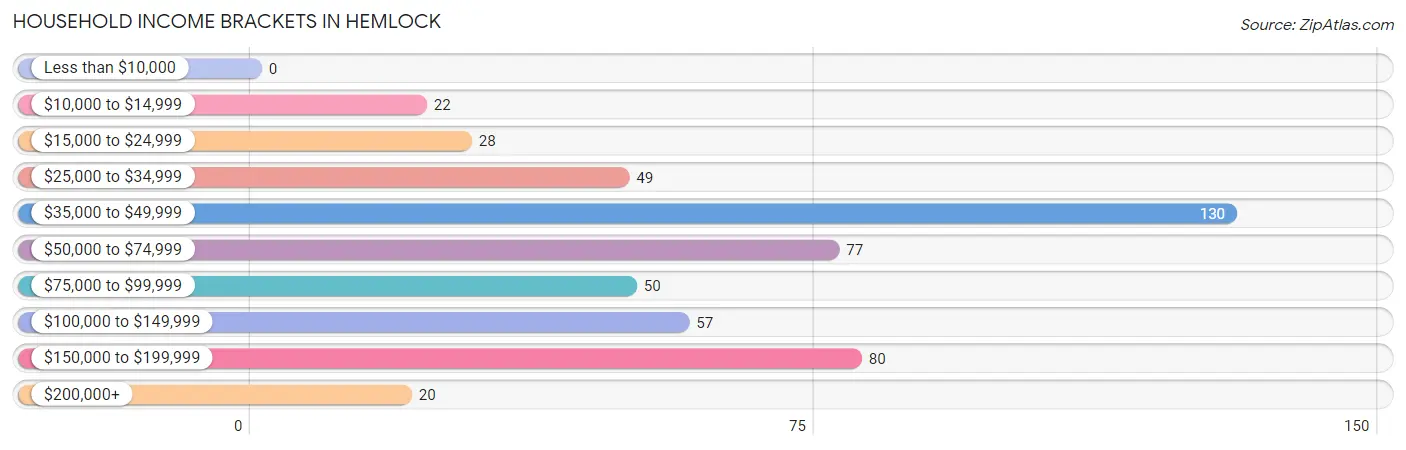
| Income Bracket | # Households | % Households |
| Less than $10,000 | 0 | 0.0% |
| $10,000 to $14,999 | 22 | 4.3% |
| $15,000 to $24,999 | 28 | 5.5% |
| $25,000 to $34,999 | 49 | 9.6% |
| $35,000 to $49,999 | 130 | 25.3% |
| $50,000 to $74,999 | 77 | 15.0% |
| $75,000 to $99,999 | 50 | 9.7% |
| $100,000 to $149,999 | 57 | 11.1% |
| $150,000 to $199,999 | 80 | 15.6% |
| $200,000+ | 20 | 3.9% |
Household Income by Householder Age in Hemlock
The median household income in Hemlock is $58,787, with the highest median household income of $83,542 found in the 45 to 64 years age bracket for the primary householder. A total of 250 households (48.7%) fall into this category. Meanwhile, the 15 to 24 years age bracket for the primary householder has the lowest median household income of $0, with 14 households (2.7%) in this group.
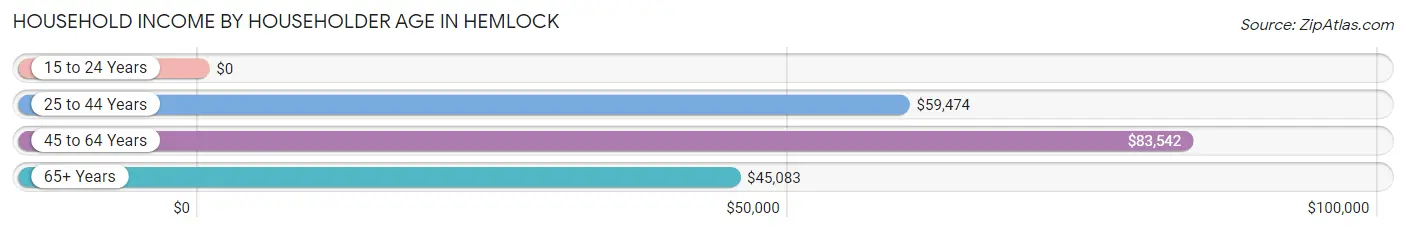
| Income Bracket | # Households | Median Income |
| 15 to 24 Years | 14 (2.7%) | $0 |
| 25 to 44 Years | 158 (30.8%) | $59,474 |
| 45 to 64 Years | 250 (48.7%) | $83,542 |
| 65+ Years | 91 (17.7%) | $45,083 |
| Total | 513 (100.0%) | $58,787 |
Poverty in Hemlock
Income Below Poverty by Sex and Age in Hemlock
With 2.9% poverty level for males and 7.2% for females among the residents of Hemlock, 35 to 44 year old males and 35 to 44 year old females are the most vulnerable to poverty, with 15 males (25.0%) and 22 females (23.9%) in their respective age groups living below the poverty level.
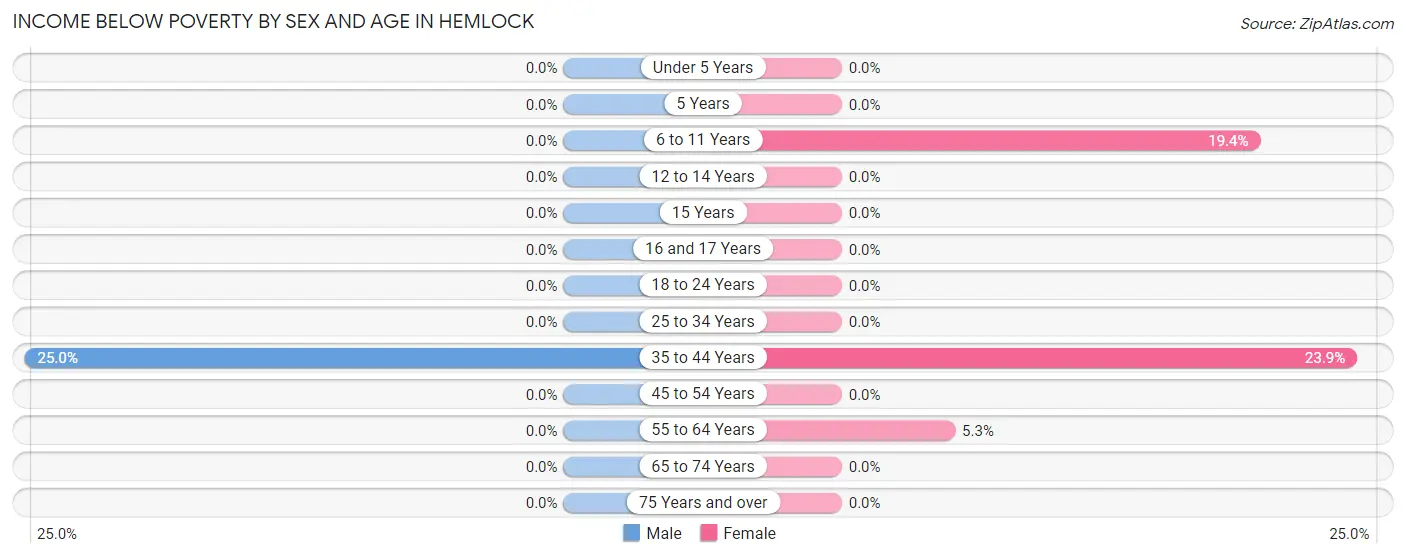
| Age Bracket | Male | Female |
| Under 5 Years | 0 (0.0%) | 0 (0.0%) |
| 5 Years | 0 (0.0%) | 0 (0.0%) |
| 6 to 11 Years | 0 (0.0%) | 20 (19.4%) |
| 12 to 14 Years | 0 (0.0%) | 0 (0.0%) |
| 15 Years | 0 (0.0%) | 0 (0.0%) |
| 16 and 17 Years | 0 (0.0%) | 0 (0.0%) |
| 18 to 24 Years | 0 (0.0%) | 0 (0.0%) |
| 25 to 34 Years | 0 (0.0%) | 0 (0.0%) |
| 35 to 44 Years | 15 (25.0%) | 22 (23.9%) |
| 45 to 54 Years | 0 (0.0%) | 0 (0.0%) |
| 55 to 64 Years | 0 (0.0%) | 9 (5.3%) |
| 65 to 74 Years | 0 (0.0%) | 0 (0.0%) |
| 75 Years and over | 0 (0.0%) | 0 (0.0%) |
| Total | 15 (2.9%) | 51 (7.2%) |
Income Above Poverty by Sex and Age in Hemlock
According to the poverty statistics in Hemlock, males aged under 5 years and females aged 12 to 14 years are the age groups that are most secure financially, with 100.0% of males and 100.0% of females in these age groups living above the poverty line.
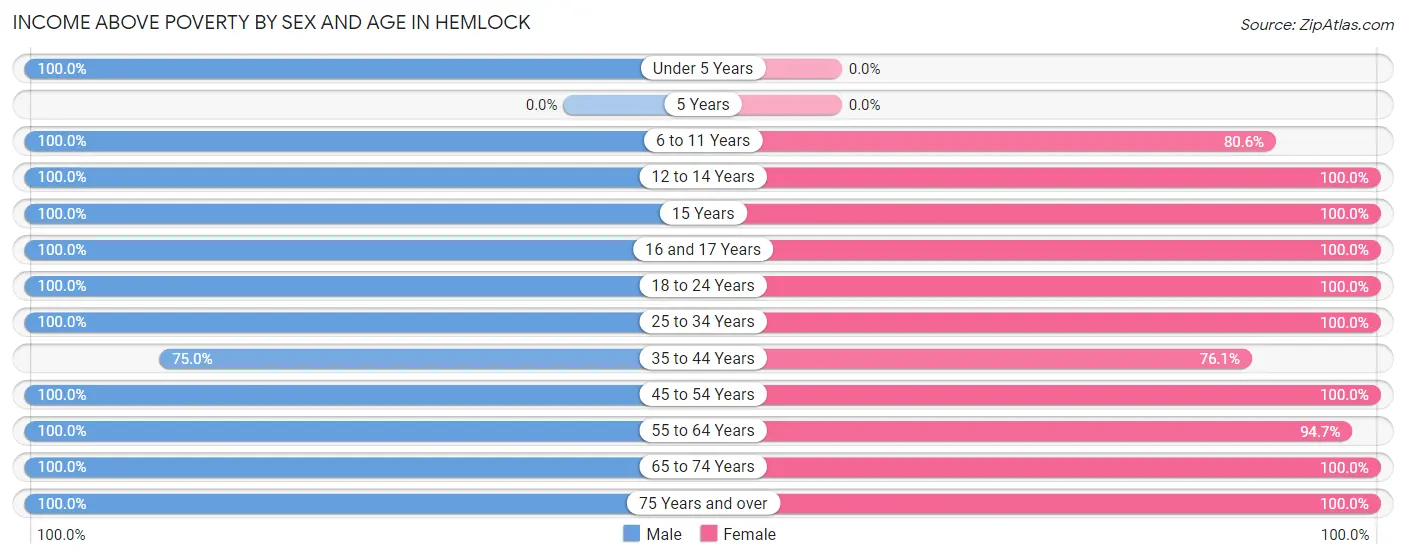
| Age Bracket | Male | Female |
| Under 5 Years | 28 (100.0%) | 0 (0.0%) |
| 5 Years | 0 (0.0%) | 0 (0.0%) |
| 6 to 11 Years | 22 (100.0%) | 83 (80.6%) |
| 12 to 14 Years | 4 (100.0%) | 31 (100.0%) |
| 15 Years | 13 (100.0%) | 9 (100.0%) |
| 16 and 17 Years | 27 (100.0%) | 34 (100.0%) |
| 18 to 24 Years | 61 (100.0%) | 54 (100.0%) |
| 25 to 34 Years | 79 (100.0%) | 66 (100.0%) |
| 35 to 44 Years | 45 (75.0%) | 70 (76.1%) |
| 45 to 54 Years | 110 (100.0%) | 74 (100.0%) |
| 55 to 64 Years | 80 (100.0%) | 162 (94.7%) |
| 65 to 74 Years | 27 (100.0%) | 37 (100.0%) |
| 75 Years and over | 12 (100.0%) | 32 (100.0%) |
| Total | 508 (97.1%) | 652 (92.7%) |
Income Below Poverty Among Married-Couple Families in Hemlock
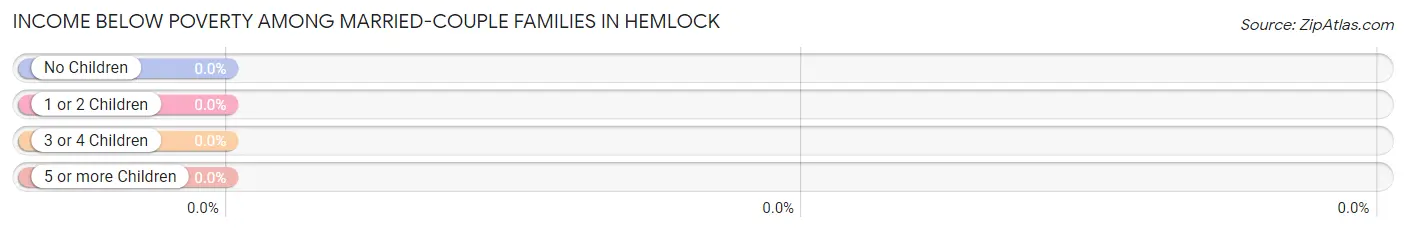
| Children | Above Poverty | Below Poverty |
| No Children | 127 (100.0%) | 0 (0.0%) |
| 1 or 2 Children | 58 (100.0%) | 0 (0.0%) |
| 3 or 4 Children | 9 (100.0%) | 0 (0.0%) |
| 5 or more Children | 0 (0.0%) | 0 (0.0%) |
| Total | 194 (100.0%) | 0 (0.0%) |
Income Below Poverty Among Single-Parent Households in Hemlock
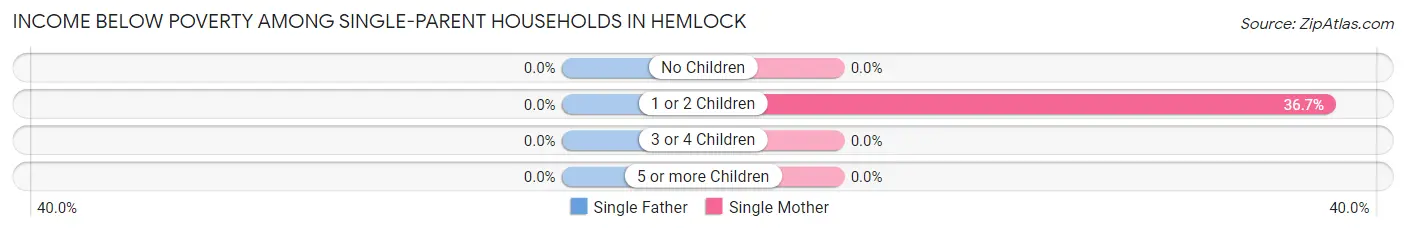
| Children | Single Father | Single Mother |
| No Children | 0 (0.0%) | 0 (0.0%) |
| 1 or 2 Children | 0 (0.0%) | 22 (36.7%) |
| 3 or 4 Children | 0 (0.0%) | 0 (0.0%) |
| 5 or more Children | 0 (0.0%) | 0 (0.0%) |
| Total | 0 (0.0%) | 22 (20.2%) |
Income Below Poverty Among Married-Couple vs Single-Parent Households in Hemlock
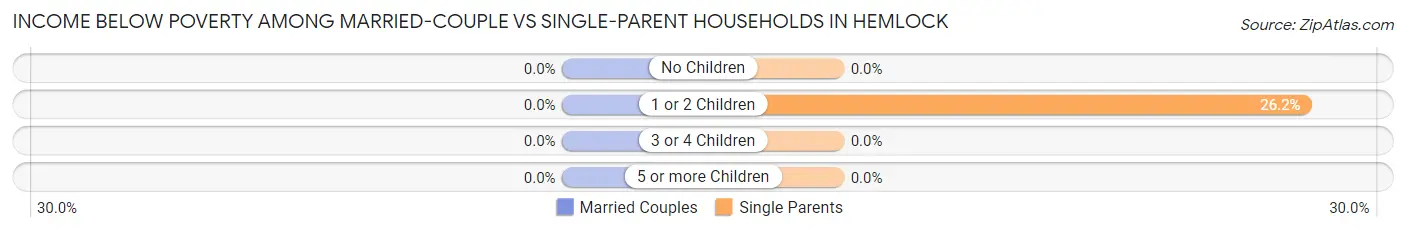
| Children | Married-Couple Families | Single-Parent Households |
| No Children | 0 (0.0%) | 0 (0.0%) |
| 1 or 2 Children | 0 (0.0%) | 22 (26.2%) |
| 3 or 4 Children | 0 (0.0%) | 0 (0.0%) |
| 5 or more Children | 0 (0.0%) | 0 (0.0%) |
| Total | 0 (0.0%) | 22 (15.3%) |
Race in Hemlock
The most populous races in Hemlock are White / Caucasian (1,162 | 94.8%), Hispanic or Latino (57 | 4.6%), and Asian (32 | 2.6%).
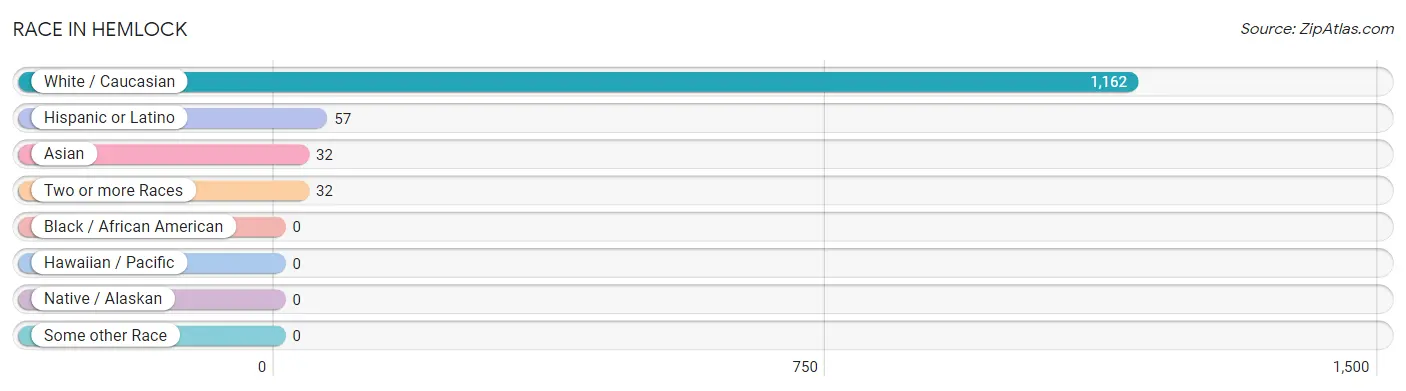
| Race | # Population | % Population |
| Asian | 32 | 2.6% |
| Black / African American | 0 | 0.0% |
| Hawaiian / Pacific | 0 | 0.0% |
| Hispanic or Latino | 57 | 4.6% |
| Native / Alaskan | 0 | 0.0% |
| White / Caucasian | 1,162 | 94.8% |
| Two or more Races | 32 | 2.6% |
| Some other Race | 0 | 0.0% |
| Total | 1,226 | 100.0% |
Ancestry in Hemlock
The most populous ancestries reported in Hemlock are German (581 | 47.4%), Polish (140 | 11.4%), English (137 | 11.2%), Irish (96 | 7.8%), and Northern European (55 | 4.5%), together accounting for 82.3% of all Hemlock residents.
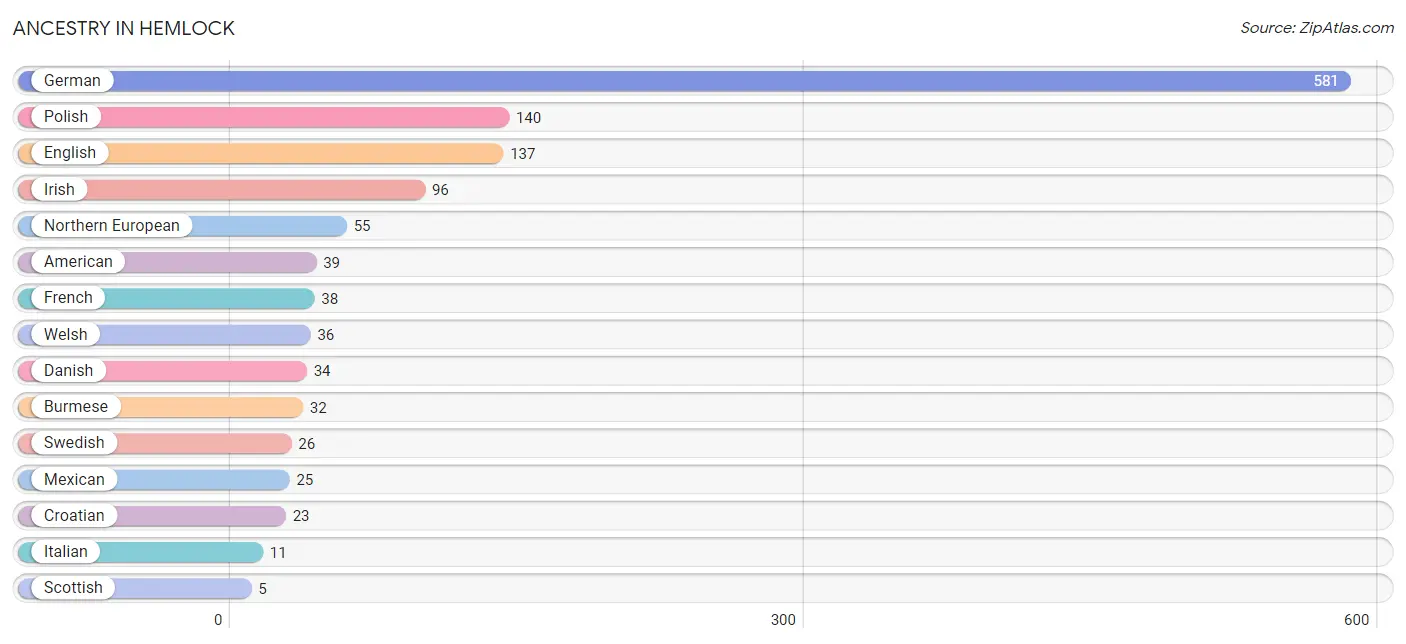
| Ancestry | # Population | % Population |
| American | 39 | 3.2% |
| Burmese | 32 | 2.6% |
| Croatian | 23 | 1.9% |
| Danish | 34 | 2.8% |
| English | 137 | 11.2% |
| French | 38 | 3.1% |
| German | 581 | 47.4% |
| Irish | 96 | 7.8% |
| Italian | 11 | 0.9% |
| Mexican | 25 | 2.0% |
| Northern European | 55 | 4.5% |
| Polish | 140 | 11.4% |
| Scottish | 5 | 0.4% |
| Swedish | 26 | 2.1% |
| Welsh | 36 | 2.9% | View All 15 Rows |
Immigrants in Hemlock
The most numerous immigrant groups reported in Hemlock came from Asia (32 | 2.6%), Eastern Asia (32 | 2.6%), and Korea (32 | 2.6%), together accounting for 7.8% of all Hemlock residents.
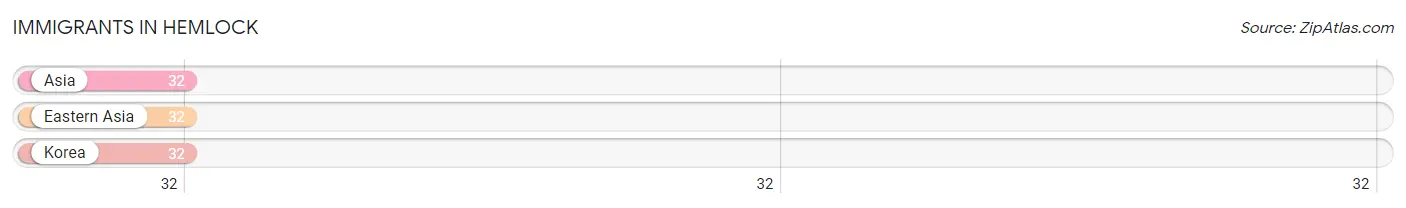
| Immigration Origin | # Population | % Population |
| Asia | 32 | 2.6% |
| Eastern Asia | 32 | 2.6% |
| Korea | 32 | 2.6% | View All 3 Rows |
Sex and Age in Hemlock
Sex and Age in Hemlock
The most populous age groups in Hemlock are 15 to 19 Years (65 | 12.4%) for men and 55 to 59 Years (95 | 13.5%) for women.
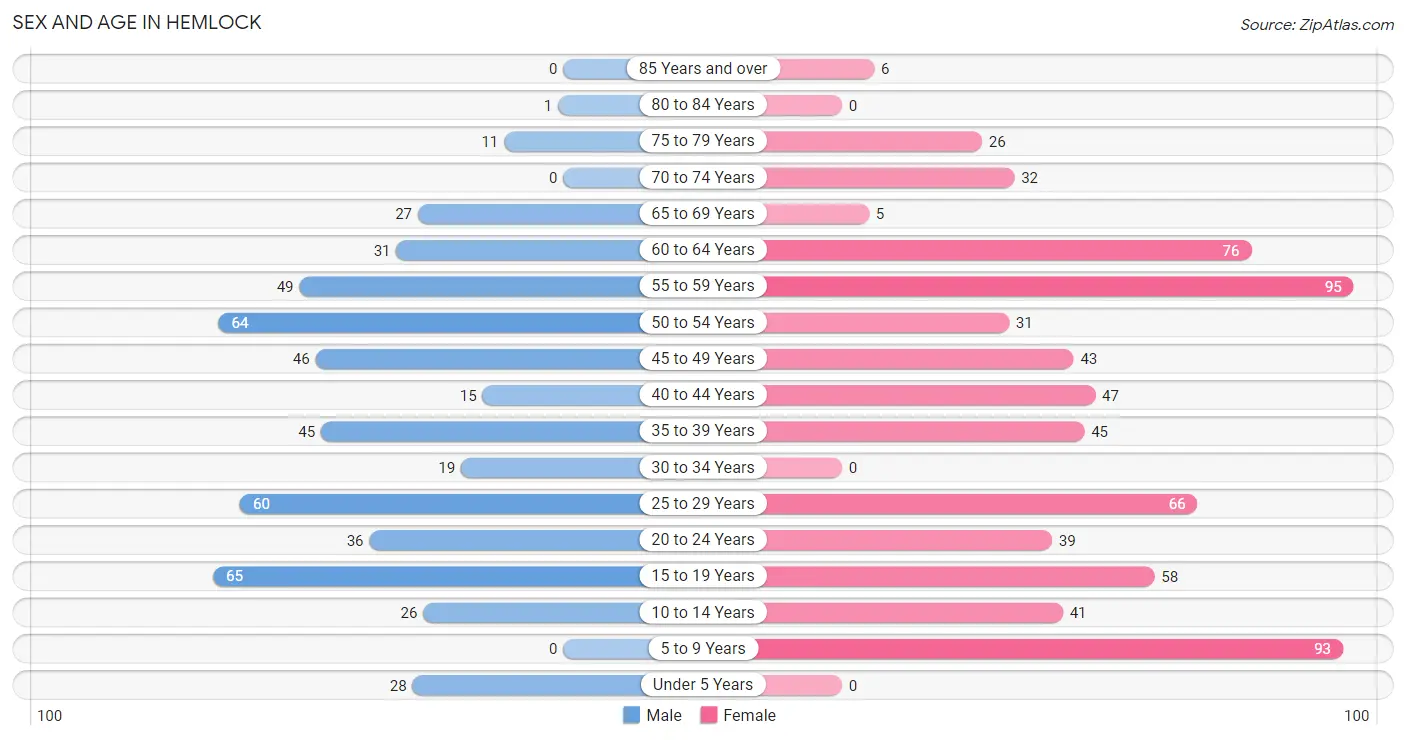
| Age Bracket | Male | Female |
| Under 5 Years | 28 (5.3%) | 0 (0.0%) |
| 5 to 9 Years | 0 (0.0%) | 93 (13.2%) |
| 10 to 14 Years | 26 (5.0%) | 41 (5.8%) |
| 15 to 19 Years | 65 (12.4%) | 58 (8.3%) |
| 20 to 24 Years | 36 (6.9%) | 39 (5.6%) |
| 25 to 29 Years | 60 (11.5%) | 66 (9.4%) |
| 30 to 34 Years | 19 (3.6%) | 0 (0.0%) |
| 35 to 39 Years | 45 (8.6%) | 45 (6.4%) |
| 40 to 44 Years | 15 (2.9%) | 47 (6.7%) |
| 45 to 49 Years | 46 (8.8%) | 43 (6.1%) |
| 50 to 54 Years | 64 (12.2%) | 31 (4.4%) |
| 55 to 59 Years | 49 (9.4%) | 95 (13.5%) |
| 60 to 64 Years | 31 (5.9%) | 76 (10.8%) |
| 65 to 69 Years | 27 (5.2%) | 5 (0.7%) |
| 70 to 74 Years | 0 (0.0%) | 32 (4.5%) |
| 75 to 79 Years | 11 (2.1%) | 26 (3.7%) |
| 80 to 84 Years | 1 (0.2%) | 0 (0.0%) |
| 85 Years and over | 0 (0.0%) | 6 (0.9%) |
| Total | 523 (100.0%) | 703 (100.0%) |
Families and Households in Hemlock
Median Family Size in Hemlock
The median family size in Hemlock is 2.95 persons per family, with married-couple families (194 | 57.4%) accounting for the largest median family size of 3.3 persons per family. On the other hand, single male/father families (35 | 10.4%) represent the smallest median family size with 2.46 persons per family.
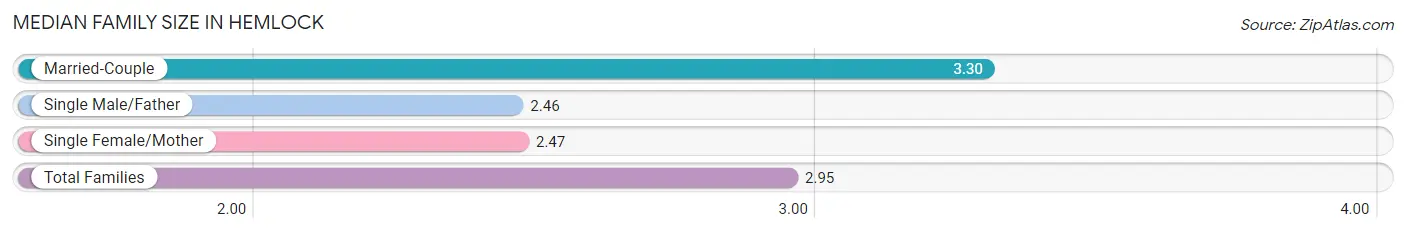
| Family Type | # Families | Family Size |
| Married-Couple | 194 (57.4%) | 3.30 |
| Single Male/Father | 35 (10.4%) | 2.46 |
| Single Female/Mother | 109 (32.3%) | 2.47 |
| Total Families | 338 (100.0%) | 2.95 |
Median Household Size in Hemlock
The median household size in Hemlock is 2.39 persons per household, with married-couple households (194 | 37.8%) accounting for the largest median household size of 3.3 persons per household. non-family households (175 | 34.1%) represent the smallest median household size with 1.17 persons per household.
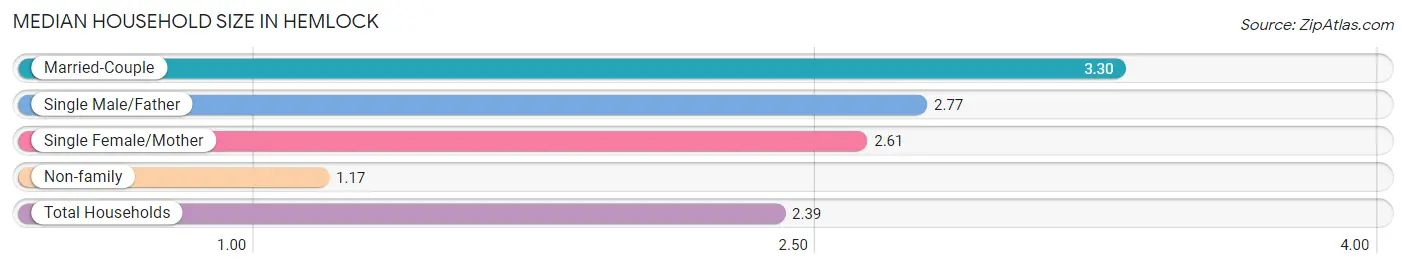
| Household Type | # Households | Household Size |
| Married-Couple | 194 (37.8%) | 3.30 |
| Single Male/Father | 35 (6.8%) | 2.77 |
| Single Female/Mother | 109 (21.2%) | 2.61 |
| Non-family | 175 (34.1%) | 1.17 |
| Total Households | 513 (100.0%) | 2.39 |
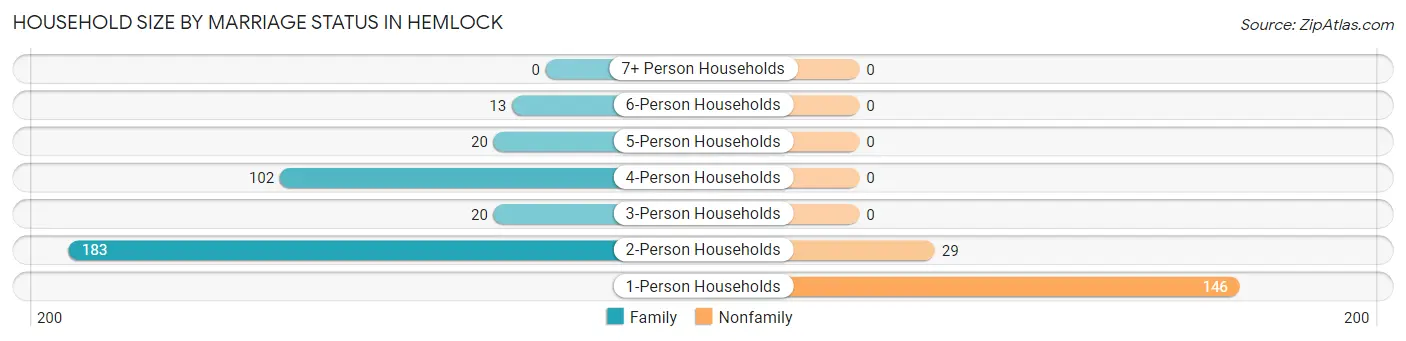
Household Size by Marriage Status in Hemlock
Out of a total of 513 households in Hemlock, 338 (65.9%) are family households, while 175 (34.1%) are nonfamily households. The most numerous type of family households are 2-person households, comprising 183, and the most common type of nonfamily households are 1-person households, comprising 146.
| Household Size | Family Households | Nonfamily Households |
| 1-Person Households | - | 146 (28.5%) |
| 2-Person Households | 183 (35.7%) | 29 (5.7%) |
| 3-Person Households | 20 (3.9%) | 0 (0.0%) |
| 4-Person Households | 102 (19.9%) | 0 (0.0%) |
| 5-Person Households | 20 (3.9%) | 0 (0.0%) |
| 6-Person Households | 13 (2.5%) | 0 (0.0%) |
| 7+ Person Households | 0 (0.0%) | 0 (0.0%) |
| Total | 338 (65.9%) | 175 (34.1%) |
Female Fertility in Hemlock
Fertility by Age in Hemlock
| Age Bracket | Women with Births | Births / 1,000 Women |
| 15 to 19 years | 0 (0.0%) | 0.0 |
| 20 to 34 years | 0 (0.0%) | 0.0 |
| 35 to 50 years | 0 (0.0%) | 0.0 |
| Total | 0 (0.0%) | 0.0 |
Fertility by Age by Marriage Status in Hemlock
| Age Bracket | Married | Unmarried |
| 15 to 19 years | 0 (0.0%) | 0 (0.0%) |
| 20 to 34 years | 0 (0.0%) | 0 (0.0%) |
| 35 to 50 years | 0 (0.0%) | 0 (0.0%) |
| Total | 0 (0.0%) | 0 (0.0%) |
Fertility by Education in Hemlock
| Educational Attainment | Women with Births | Births / 1,000 Women |
| Less than High School | 0 (0.0%) | 0.0 |
| High School Diploma | 0 (0.0%) | 0.0 |
| College or Associate's Degree | 0 (0.0%) | 0.0 |
| Bachelor's Degree | 0 (0.0%) | 0.0 |
| Graduate Degree | 0 (0.0%) | 0.0 |
| Total | 0 (0.0%) | 0.0 |
Fertility by Education by Marriage Status in Hemlock
| Educational Attainment | Married | Unmarried |
| Less than High School | 0 (0.0%) | 0 (0.0%) |
| High School Diploma | 0 (0.0%) | 0 (0.0%) |
| College or Associate's Degree | 0 (0.0%) | 0 (0.0%) |
| Bachelor's Degree | 0 (0.0%) | 0 (0.0%) |
| Graduate Degree | 0 (0.0%) | 0 (0.0%) |
| Total | 0 (0.0%) | 0 (0.0%) |
Employment Characteristics in Hemlock
Employment by Class of Employer in Hemlock
Among the 797 employed individuals in Hemlock, private company employees (571 | 71.6%), self-employed (incorporated) (77 | 9.7%), and not-for-profit organizations (50 | 6.3%) make up the most common classes of employment.
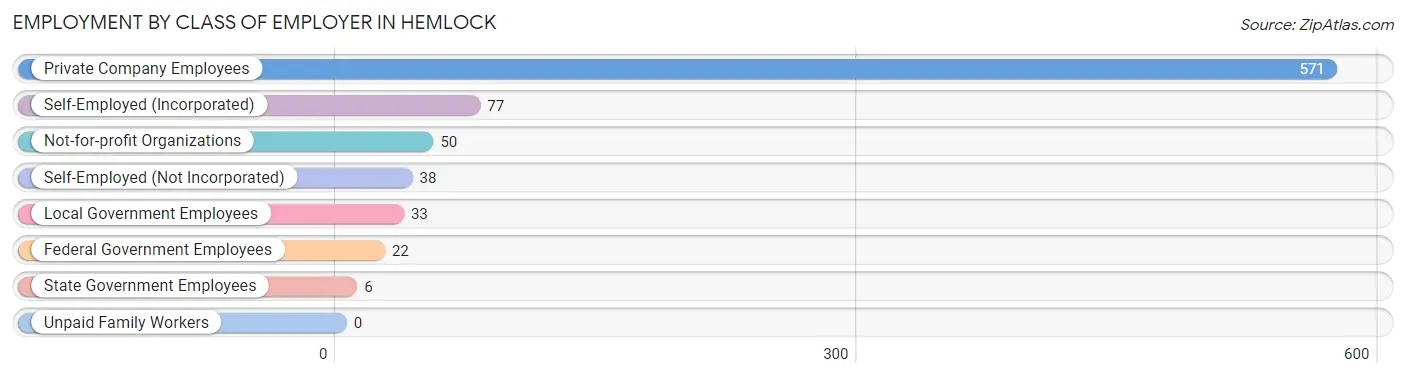
| Employer Class | # Employees | % Employees |
| Private Company Employees | 571 | 71.6% |
| Self-Employed (Incorporated) | 77 | 9.7% |
| Self-Employed (Not Incorporated) | 38 | 4.8% |
| Not-for-profit Organizations | 50 | 6.3% |
| Local Government Employees | 33 | 4.1% |
| State Government Employees | 6 | 0.7% |
| Federal Government Employees | 22 | 2.8% |
| Unpaid Family Workers | 0 | 0.0% |
| Total | 797 | 100.0% |
Employment Status by Age in Hemlock
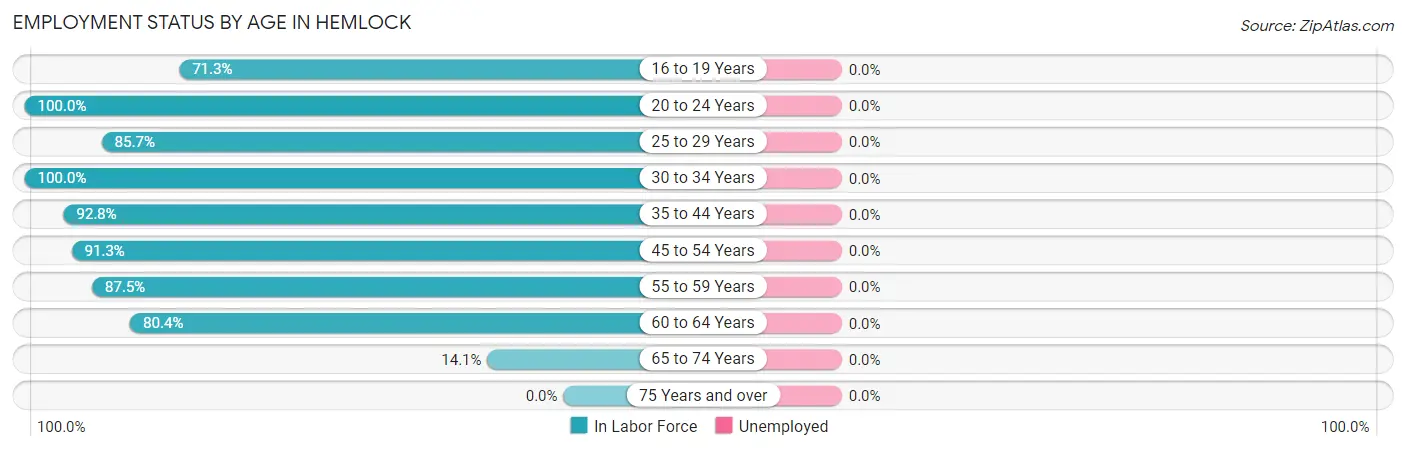
| Age Bracket | In Labor Force | Unemployed |
| 16 to 19 Years | 72 (71.3%) | 0 (0.0%) |
| 20 to 24 Years | 75 (100.0%) | 0 (0.0%) |
| 25 to 29 Years | 108 (85.7%) | 0 (0.0%) |
| 30 to 34 Years | 19 (100.0%) | 0 (0.0%) |
| 35 to 44 Years | 141 (92.8%) | 0 (0.0%) |
| 45 to 54 Years | 168 (91.3%) | 0 (0.0%) |
| 55 to 59 Years | 126 (87.5%) | 0 (0.0%) |
| 60 to 64 Years | 86 (80.4%) | 0 (0.0%) |
| 65 to 74 Years | 9 (14.1%) | 0 (0.0%) |
| 75 Years and over | 0 (0.0%) | 0 (0.0%) |
| Total | 804 (79.1%) | 0 (0.0%) |
Employment Status by Educational Attainment in Hemlock
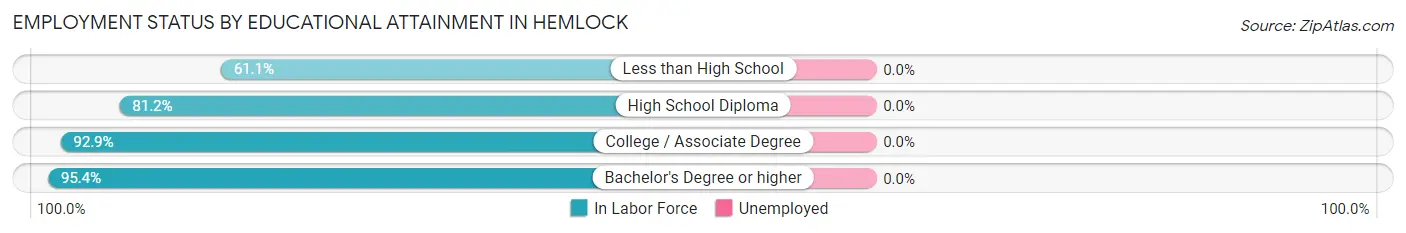
| Educational Attainment | In Labor Force | Unemployed |
| Less than High School | 11 (61.1%) | 0 (0.0%) |
| High School Diploma | 216 (81.2%) | 0 (0.0%) |
| College / Associate Degree | 235 (92.9%) | 0 (0.0%) |
| Bachelor's Degree or higher | 186 (95.4%) | 0 (0.0%) |
| Total | 648 (88.5%) | 0 (0.0%) |
Employment Occupations by Sex in Hemlock
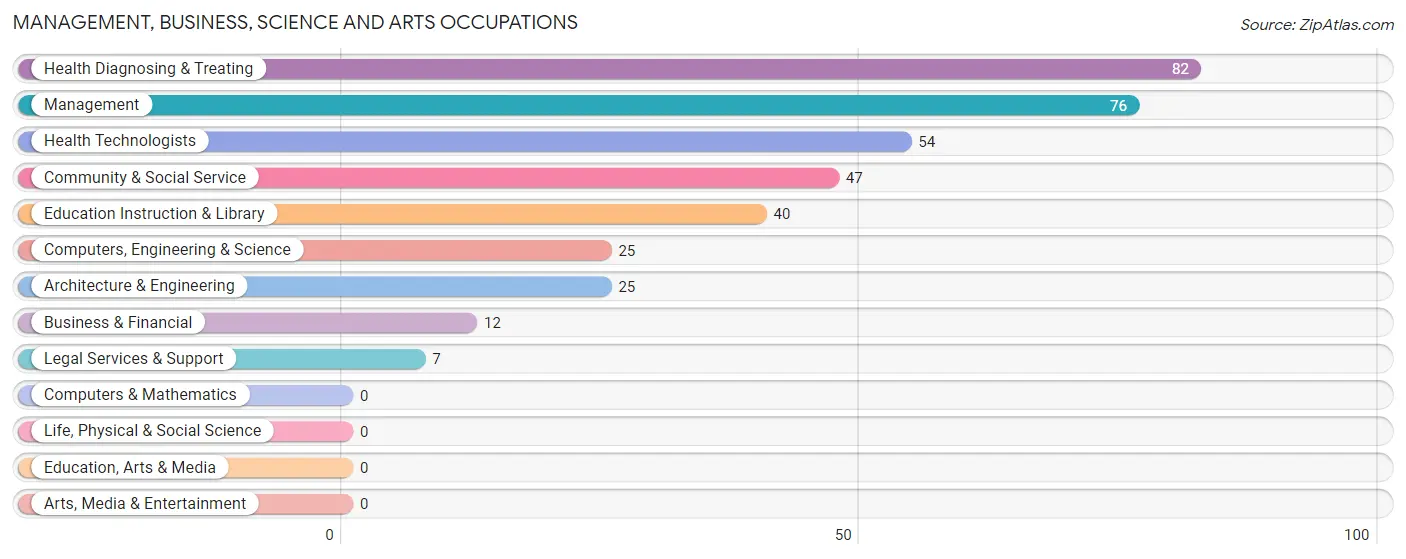
Management, Business, Science and Arts Occupations
The most common Management, Business, Science and Arts occupations in Hemlock are Health Diagnosing & Treating (82 | 10.2%), Management (76 | 9.5%), Health Technologists (54 | 6.7%), Community & Social Service (47 | 5.9%), and Education Instruction & Library (40 | 5.0%).
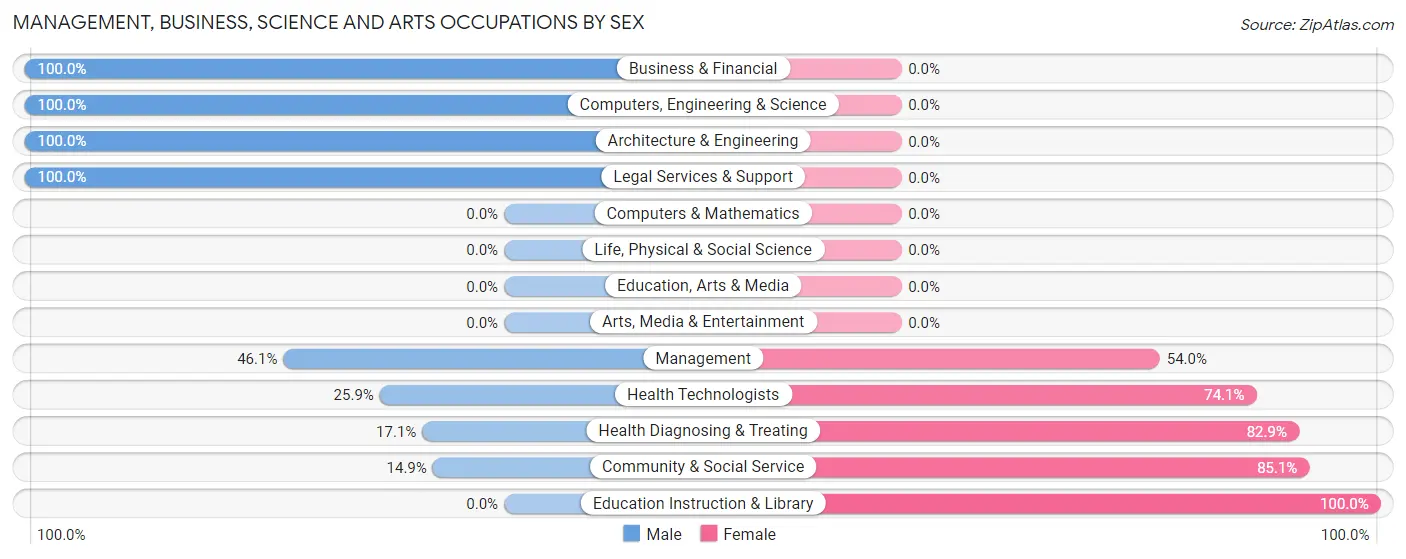
Management, Business, Science and Arts Occupations by Sex
Within the Management, Business, Science and Arts occupations in Hemlock, the most male-oriented occupations are Business & Financial (100.0%), Computers, Engineering & Science (100.0%), and Architecture & Engineering (100.0%), while the most female-oriented occupations are Education Instruction & Library (100.0%), Community & Social Service (85.1%), and Health Diagnosing & Treating (82.9%).
| Occupation | Male | Female |
| Management | 35 (46.1%) | 41 (53.9%) |
| Business & Financial | 12 (100.0%) | 0 (0.0%) |
| Computers, Engineering & Science | 25 (100.0%) | 0 (0.0%) |
| Computers & Mathematics | 0 (0.0%) | 0 (0.0%) |
| Architecture & Engineering | 25 (100.0%) | 0 (0.0%) |
| Life, Physical & Social Science | 0 (0.0%) | 0 (0.0%) |
| Community & Social Service | 7 (14.9%) | 40 (85.1%) |
| Education, Arts & Media | 0 (0.0%) | 0 (0.0%) |
| Legal Services & Support | 7 (100.0%) | 0 (0.0%) |
| Education Instruction & Library | 0 (0.0%) | 40 (100.0%) |
| Arts, Media & Entertainment | 0 (0.0%) | 0 (0.0%) |
| Health Diagnosing & Treating | 14 (17.1%) | 68 (82.9%) |
| Health Technologists | 14 (25.9%) | 40 (74.1%) |
| Total (Category) | 93 (38.4%) | 149 (61.6%) |
| Total (Overall) | 369 (45.9%) | 435 (54.1%) |
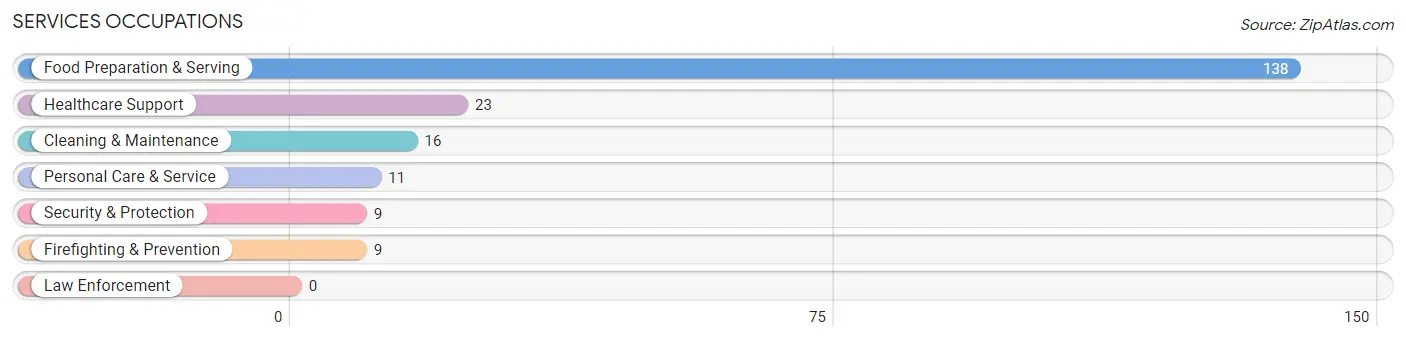
Services Occupations
The most common Services occupations in Hemlock are Food Preparation & Serving (138 | 17.2%), Healthcare Support (23 | 2.9%), Cleaning & Maintenance (16 | 2.0%), Personal Care & Service (11 | 1.4%), and Security & Protection (9 | 1.1%).
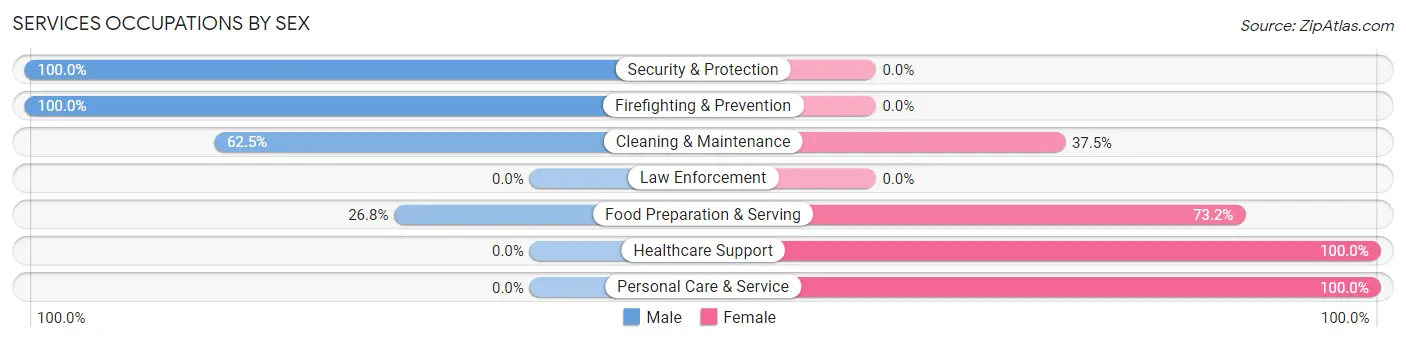
Services Occupations by Sex
Within the Services occupations in Hemlock, the most male-oriented occupations are Security & Protection (100.0%), Firefighting & Prevention (100.0%), and Cleaning & Maintenance (62.5%), while the most female-oriented occupations are Healthcare Support (100.0%), Personal Care & Service (100.0%), and Food Preparation & Serving (73.2%).
| Occupation | Male | Female |
| Healthcare Support | 0 (0.0%) | 23 (100.0%) |
| Security & Protection | 9 (100.0%) | 0 (0.0%) |
| Firefighting & Prevention | 9 (100.0%) | 0 (0.0%) |
| Law Enforcement | 0 (0.0%) | 0 (0.0%) |
| Food Preparation & Serving | 37 (26.8%) | 101 (73.2%) |
| Cleaning & Maintenance | 10 (62.5%) | 6 (37.5%) |
| Personal Care & Service | 0 (0.0%) | 11 (100.0%) |
| Total (Category) | 56 (28.4%) | 141 (71.6%) |
| Total (Overall) | 369 (45.9%) | 435 (54.1%) |
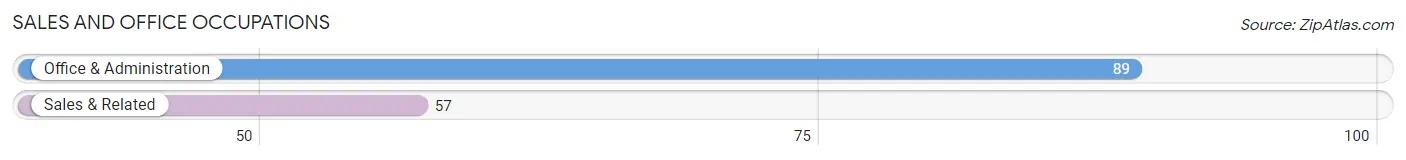
Sales and Office Occupations
The most common Sales and Office occupations in Hemlock are Office & Administration (89 | 11.1%), and Sales & Related (57 | 7.1%).
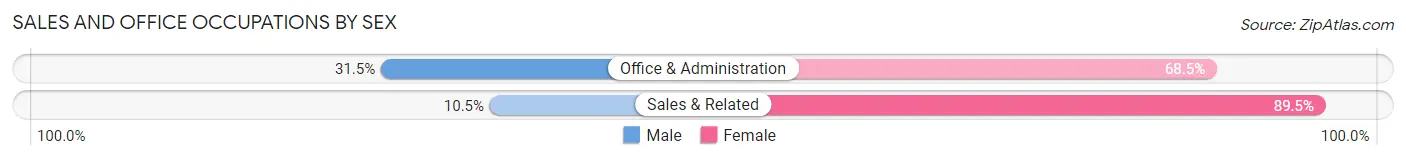
Sales and Office Occupations by Sex
| Occupation | Male | Female |
| Sales & Related | 6 (10.5%) | 51 (89.5%) |
| Office & Administration | 28 (31.5%) | 61 (68.5%) |
| Total (Category) | 34 (23.3%) | 112 (76.7%) |
| Total (Overall) | 369 (45.9%) | 435 (54.1%) |
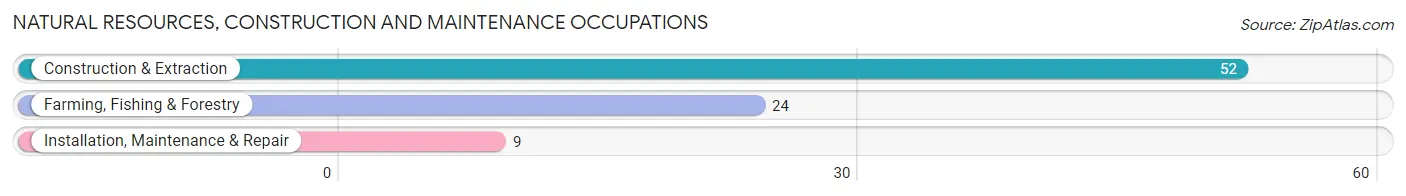
Natural Resources, Construction and Maintenance Occupations
The most common Natural Resources, Construction and Maintenance occupations in Hemlock are Construction & Extraction (52 | 6.5%), Farming, Fishing & Forestry (24 | 3.0%), and Installation, Maintenance & Repair (9 | 1.1%).
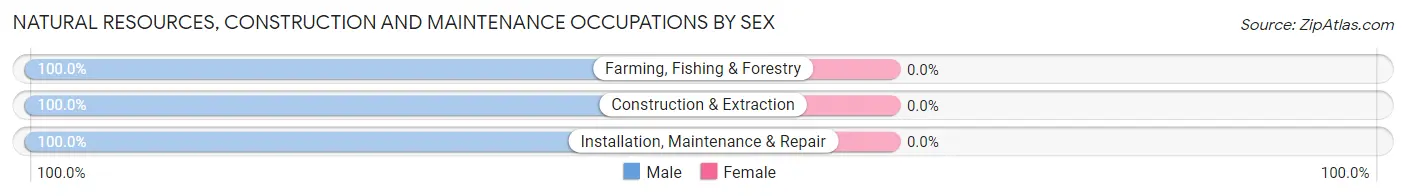
Natural Resources, Construction and Maintenance Occupations by Sex
| Occupation | Male | Female |
| Farming, Fishing & Forestry | 24 (100.0%) | 0 (0.0%) |
| Construction & Extraction | 52 (100.0%) | 0 (0.0%) |
| Installation, Maintenance & Repair | 9 (100.0%) | 0 (0.0%) |
| Total (Category) | 85 (100.0%) | 0 (0.0%) |
| Total (Overall) | 369 (45.9%) | 435 (54.1%) |
Production, Transportation and Moving Occupations
The most common Production, Transportation and Moving occupations in Hemlock are Production (63 | 7.8%), Transportation (41 | 5.1%), and Material Moving (30 | 3.7%).
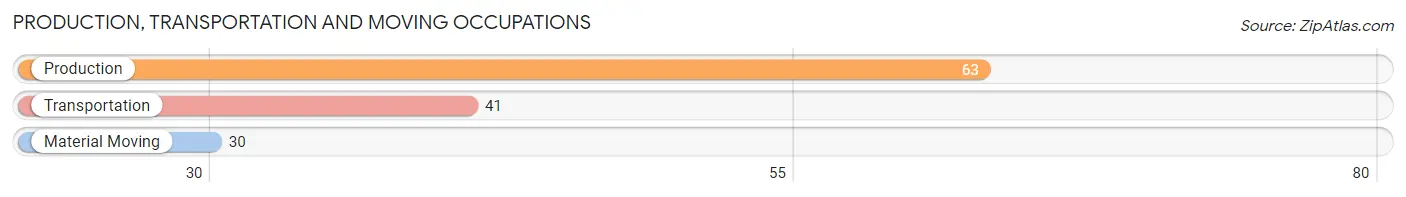
Production, Transportation and Moving Occupations by Sex
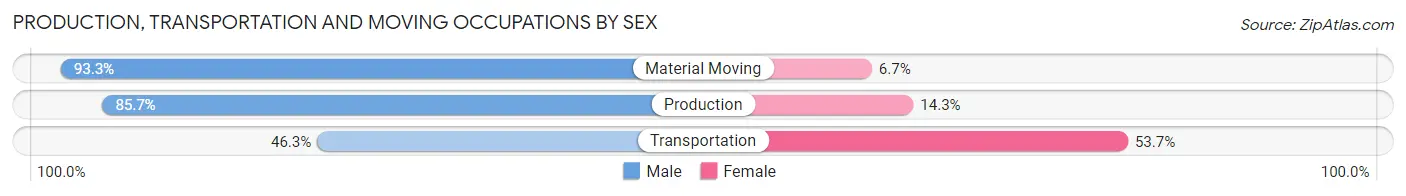
| Occupation | Male | Female |
| Production | 54 (85.7%) | 9 (14.3%) |
| Transportation | 19 (46.3%) | 22 (53.7%) |
| Material Moving | 28 (93.3%) | 2 (6.7%) |
| Total (Category) | 101 (75.4%) | 33 (24.6%) |
| Total (Overall) | 369 (45.9%) | 435 (54.1%) |
Employment Industries by Sex in Hemlock
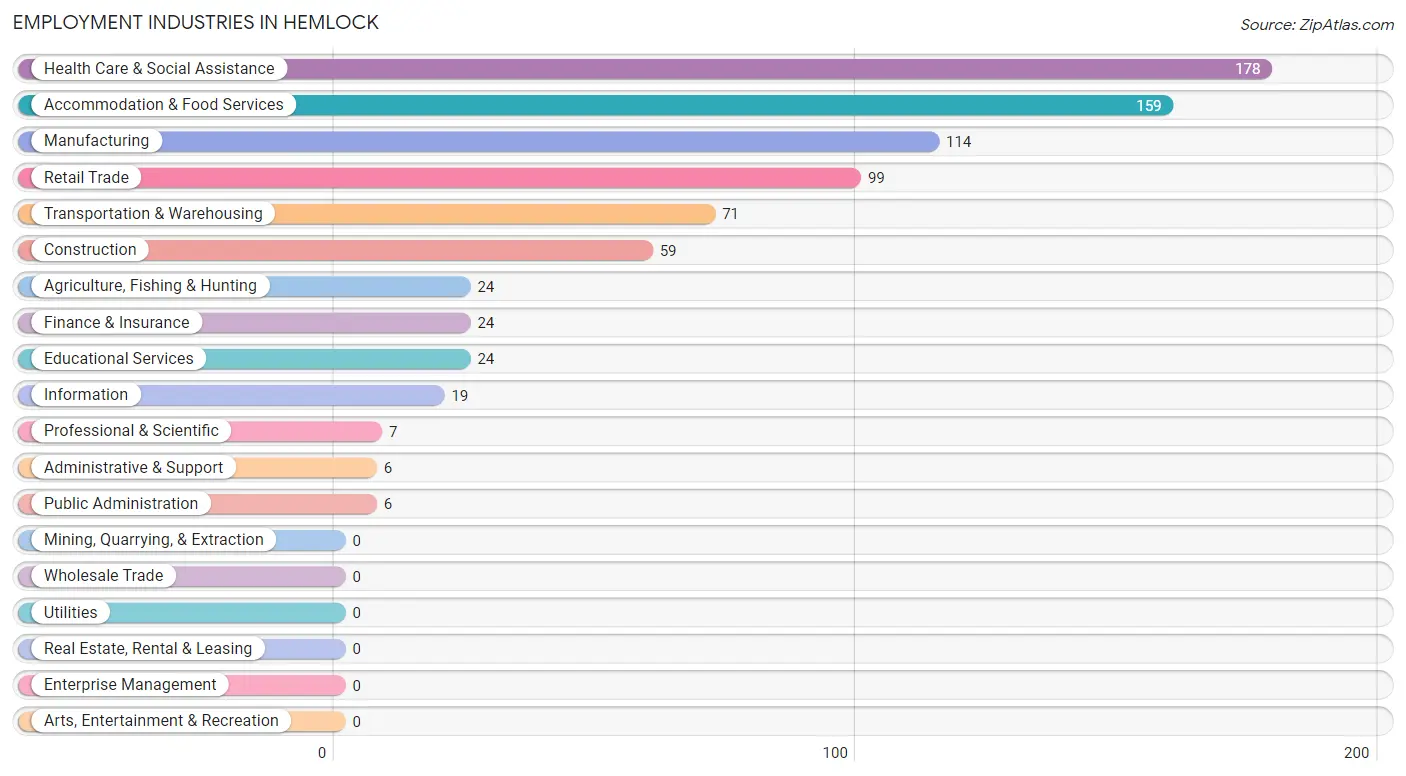
Employment Industries in Hemlock
The major employment industries in Hemlock include Health Care & Social Assistance (178 | 22.1%), Accommodation & Food Services (159 | 19.8%), Manufacturing (114 | 14.2%), Retail Trade (99 | 12.3%), and Transportation & Warehousing (71 | 8.8%).
Employment Industries by Sex in Hemlock
The Hemlock industries that see more men than women are Agriculture, Fishing & Hunting (100.0%), Professional & Scientific (100.0%), and Manufacturing (93.9%), whereas the industries that tend to have a higher number of women are Information (100.0%), Administrative & Support (100.0%), and Public Administration (100.0%).
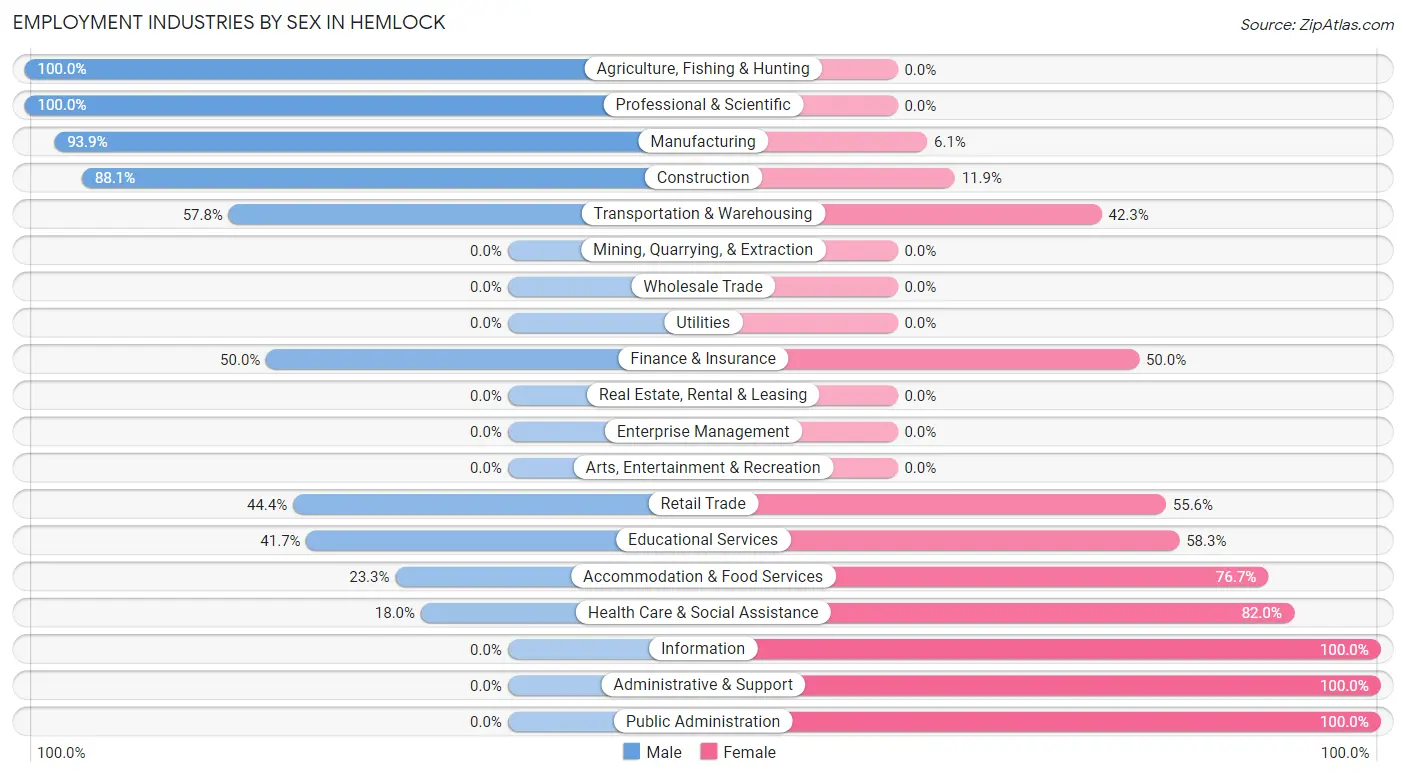
| Industry | Male | Female |
| Agriculture, Fishing & Hunting | 24 (100.0%) | 0 (0.0%) |
| Mining, Quarrying, & Extraction | 0 (0.0%) | 0 (0.0%) |
| Construction | 52 (88.1%) | 7 (11.9%) |
| Manufacturing | 107 (93.9%) | 7 (6.1%) |
| Wholesale Trade | 0 (0.0%) | 0 (0.0%) |
| Retail Trade | 44 (44.4%) | 55 (55.6%) |
| Transportation & Warehousing | 41 (57.8%) | 30 (42.2%) |
| Utilities | 0 (0.0%) | 0 (0.0%) |
| Information | 0 (0.0%) | 19 (100.0%) |
| Finance & Insurance | 12 (50.0%) | 12 (50.0%) |
| Real Estate, Rental & Leasing | 0 (0.0%) | 0 (0.0%) |
| Professional & Scientific | 7 (100.0%) | 0 (0.0%) |
| Enterprise Management | 0 (0.0%) | 0 (0.0%) |
| Administrative & Support | 0 (0.0%) | 6 (100.0%) |
| Educational Services | 10 (41.7%) | 14 (58.3%) |
| Health Care & Social Assistance | 32 (18.0%) | 146 (82.0%) |
| Arts, Entertainment & Recreation | 0 (0.0%) | 0 (0.0%) |
| Accommodation & Food Services | 37 (23.3%) | 122 (76.7%) |
| Public Administration | 0 (0.0%) | 6 (100.0%) |
| Total | 369 (45.9%) | 435 (54.1%) |
Education in Hemlock
School Enrollment in Hemlock
The most common levels of schooling among the 336 students in Hemlock are high school (122 | 36.3%), elementary school (93 | 27.7%), and middle school (41 | 12.2%).
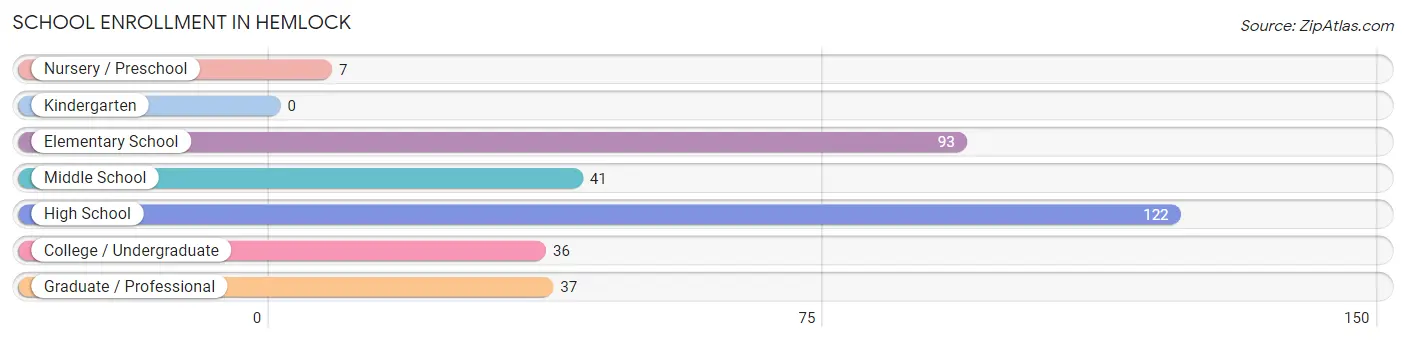
| School Level | # Students | % Students |
| Nursery / Preschool | 7 | 2.1% |
| Kindergarten | 0 | 0.0% |
| Elementary School | 93 | 27.7% |
| Middle School | 41 | 12.2% |
| High School | 122 | 36.3% |
| College / Undergraduate | 36 | 10.7% |
| Graduate / Professional | 37 | 11.0% |
| Total | 336 | 100.0% |
School Enrollment by Age by Funding Source in Hemlock
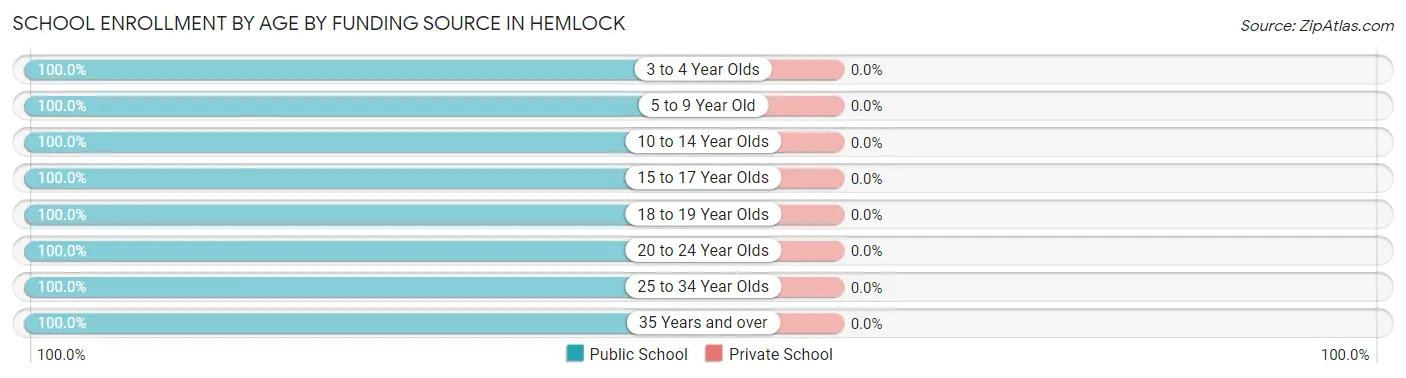
| Age Bracket | Public School | Private School |
| 3 to 4 Year Olds | 7 (100.0%) | 0 (0.0%) |
| 5 to 9 Year Old | 93 (100.0%) | 0 (0.0%) |
| 10 to 14 Year Olds | 67 (100.0%) | 0 (0.0%) |
| 15 to 17 Year Olds | 83 (100.0%) | 0 (0.0%) |
| 18 to 19 Year Olds | 28 (100.0%) | 0 (0.0%) |
| 20 to 24 Year Olds | 23 (100.0%) | 0 (0.0%) |
| 25 to 34 Year Olds | 12 (100.0%) | 0 (0.0%) |
| 35 Years and over | 23 (100.0%) | 0 (0.0%) |
| Total | 336 (100.0%) | 0 (0.0%) |
Educational Attainment by Field of Study in Hemlock
Science & technology (59 | 28.5%), education (31 | 15.0%), engineering (25 | 12.1%), business (24 | 11.6%), and literature & languages (19 | 9.2%) are the most common fields of study among 207 individuals in Hemlock who have obtained a bachelor's degree or higher.
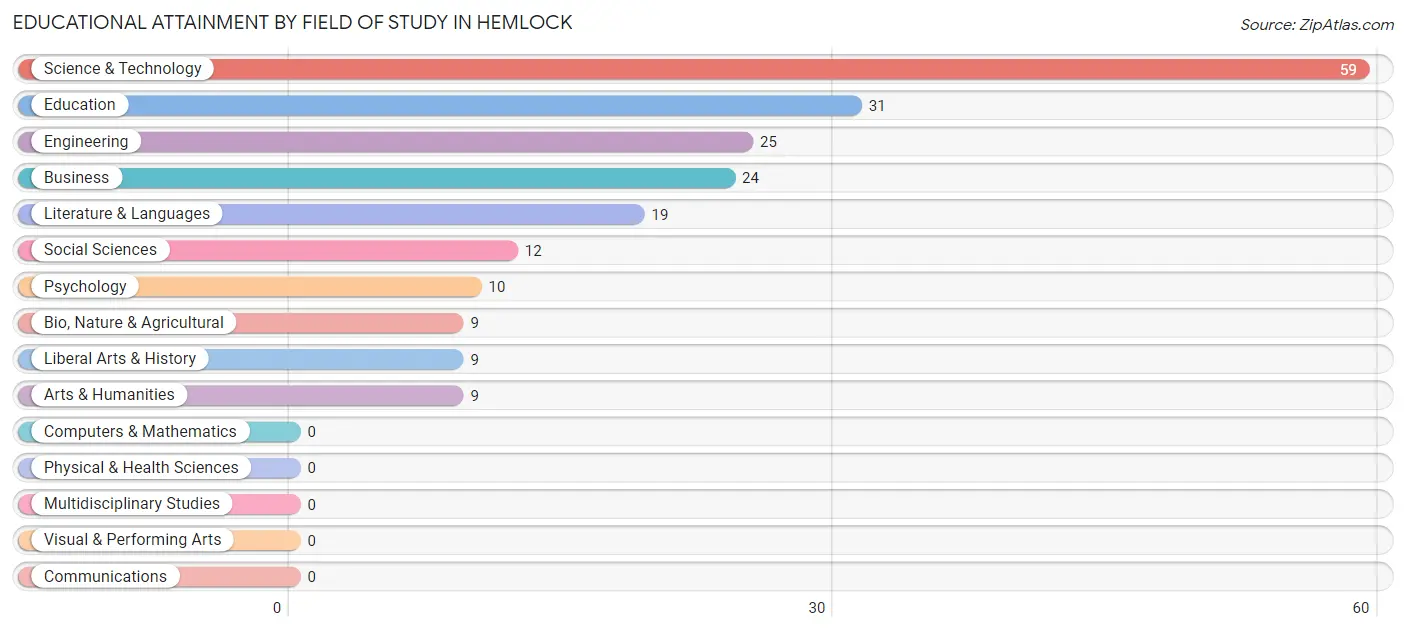
| Field of Study | # Graduates | % Graduates |
| Computers & Mathematics | 0 | 0.0% |
| Bio, Nature & Agricultural | 9 | 4.3% |
| Physical & Health Sciences | 0 | 0.0% |
| Psychology | 10 | 4.8% |
| Social Sciences | 12 | 5.8% |
| Engineering | 25 | 12.1% |
| Multidisciplinary Studies | 0 | 0.0% |
| Science & Technology | 59 | 28.5% |
| Business | 24 | 11.6% |
| Education | 31 | 15.0% |
| Literature & Languages | 19 | 9.2% |
| Liberal Arts & History | 9 | 4.3% |
| Visual & Performing Arts | 0 | 0.0% |
| Communications | 0 | 0.0% |
| Arts & Humanities | 9 | 4.3% |
| Total | 207 | 100.0% |
Transportation & Commute in Hemlock
Vehicle Availability by Sex in Hemlock
The most prevalent vehicle ownership categories in Hemlock are males with 3 vehicles (121, accounting for 33.4%) and females with 3 vehicles (136, making up 27.8%).
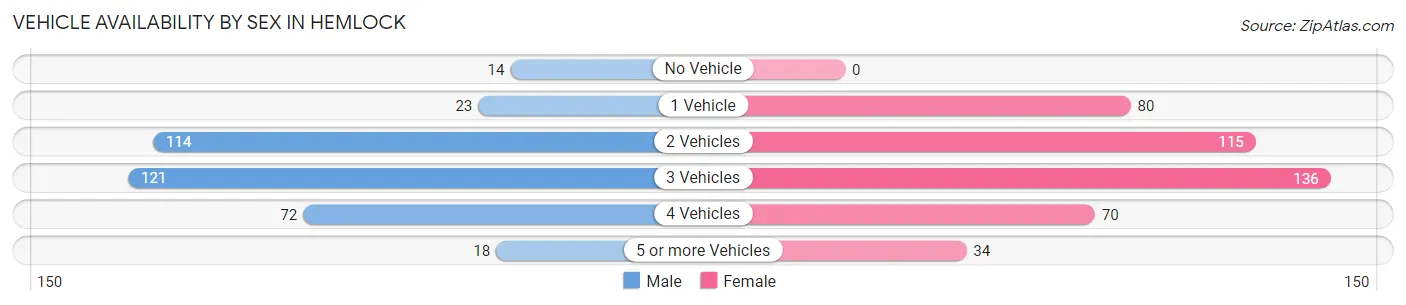
| Vehicles Available | Male | Female |
| No Vehicle | 14 (3.9%) | 0 (0.0%) |
| 1 Vehicle | 23 (6.4%) | 80 (18.4%) |
| 2 Vehicles | 114 (31.5%) | 115 (26.4%) |
| 3 Vehicles | 121 (33.4%) | 136 (31.3%) |
| 4 Vehicles | 72 (19.9%) | 70 (16.1%) |
| 5 or more Vehicles | 18 (5.0%) | 34 (7.8%) |
| Total | 362 (100.0%) | 435 (100.0%) |
Commute Time in Hemlock
The most frequently occuring commute durations in Hemlock are 25 to 29 minutes (170 commuters, 21.8%), 5 to 9 minutes (132 commuters, 16.9%), and 30 to 34 minutes (112 commuters, 14.3%).
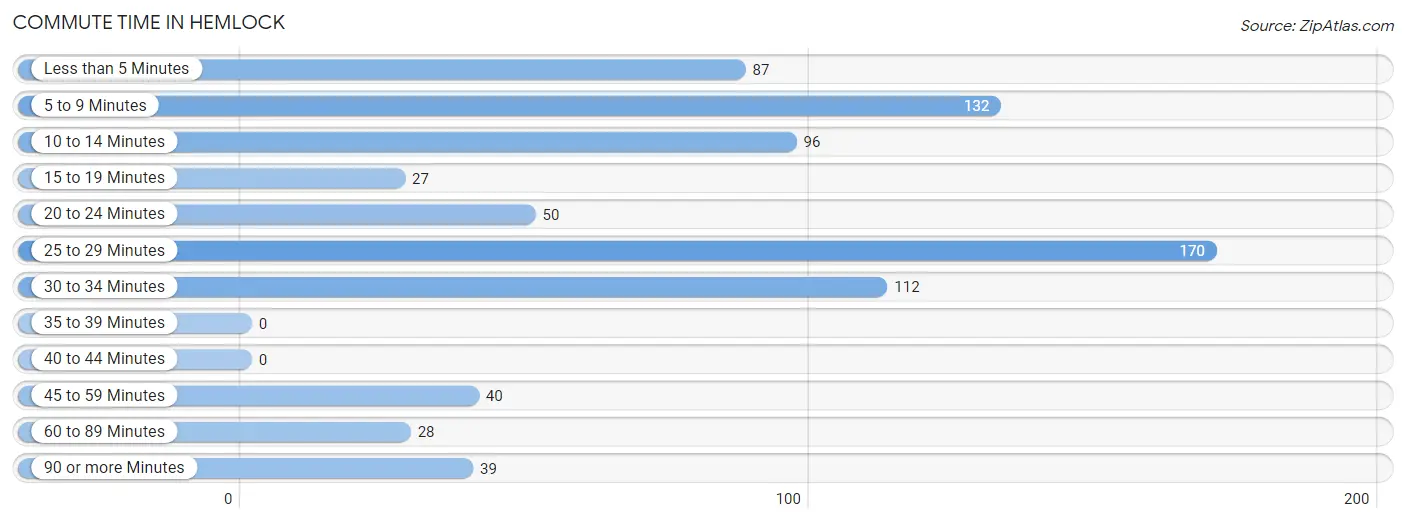
| Commute Time | # Commuters | % Commuters |
| Less than 5 Minutes | 87 | 11.1% |
| 5 to 9 Minutes | 132 | 16.9% |
| 10 to 14 Minutes | 96 | 12.3% |
| 15 to 19 Minutes | 27 | 3.5% |
| 20 to 24 Minutes | 50 | 6.4% |
| 25 to 29 Minutes | 170 | 21.8% |
| 30 to 34 Minutes | 112 | 14.3% |
| 35 to 39 Minutes | 0 | 0.0% |
| 40 to 44 Minutes | 0 | 0.0% |
| 45 to 59 Minutes | 40 | 5.1% |
| 60 to 89 Minutes | 28 | 3.6% |
| 90 or more Minutes | 39 | 5.0% |
Commute Time by Sex in Hemlock
The most common commute times in Hemlock are 5 to 9 minutes (99 commuters, 27.4%) for males and 25 to 29 minutes (131 commuters, 31.3%) for females.
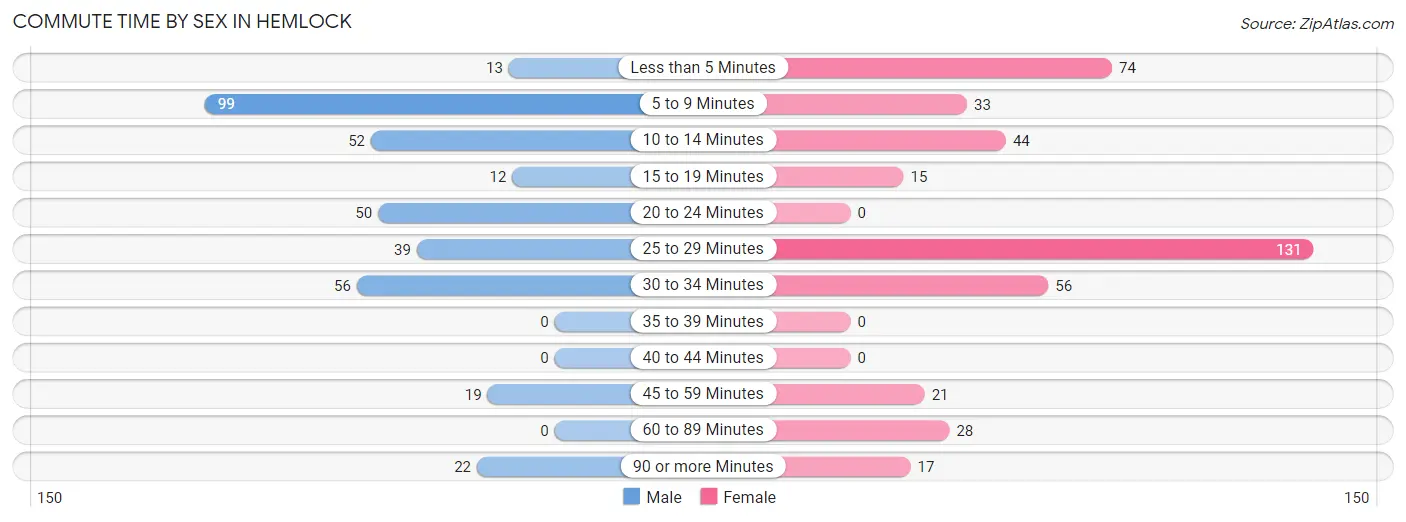
| Commute Time | Male | Female |
| Less than 5 Minutes | 13 (3.6%) | 74 (17.7%) |
| 5 to 9 Minutes | 99 (27.4%) | 33 (7.9%) |
| 10 to 14 Minutes | 52 (14.4%) | 44 (10.5%) |
| 15 to 19 Minutes | 12 (3.3%) | 15 (3.6%) |
| 20 to 24 Minutes | 50 (13.8%) | 0 (0.0%) |
| 25 to 29 Minutes | 39 (10.8%) | 131 (31.3%) |
| 30 to 34 Minutes | 56 (15.5%) | 56 (13.4%) |
| 35 to 39 Minutes | 0 (0.0%) | 0 (0.0%) |
| 40 to 44 Minutes | 0 (0.0%) | 0 (0.0%) |
| 45 to 59 Minutes | 19 (5.2%) | 21 (5.0%) |
| 60 to 89 Minutes | 0 (0.0%) | 28 (6.7%) |
| 90 or more Minutes | 22 (6.1%) | 17 (4.1%) |
Time of Departure to Work by Sex in Hemlock
The most frequent times of departure to work in Hemlock are 7:30 AM to 7:59 AM (60, 16.6%) for males and 7:00 AM to 7:29 AM (110, 26.3%) for females.
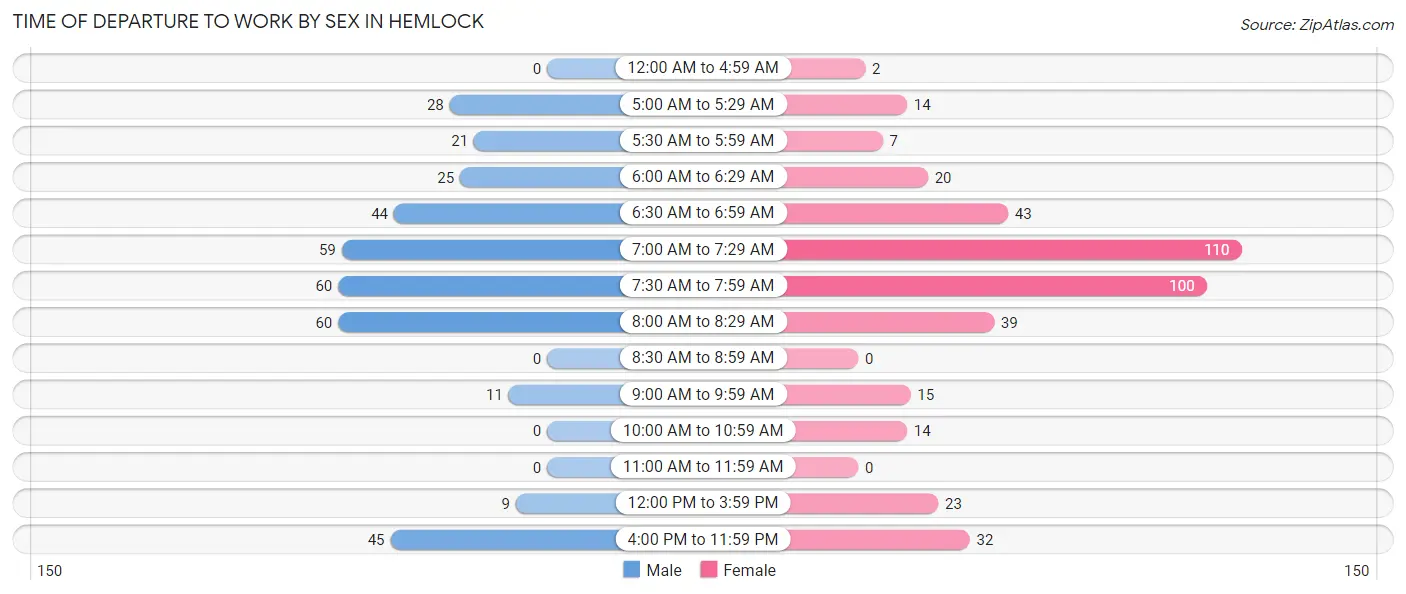
| Time of Departure | Male | Female |
| 12:00 AM to 4:59 AM | 0 (0.0%) | 2 (0.5%) |
| 5:00 AM to 5:29 AM | 28 (7.7%) | 14 (3.3%) |
| 5:30 AM to 5:59 AM | 21 (5.8%) | 7 (1.7%) |
| 6:00 AM to 6:29 AM | 25 (6.9%) | 20 (4.8%) |
| 6:30 AM to 6:59 AM | 44 (12.1%) | 43 (10.3%) |
| 7:00 AM to 7:29 AM | 59 (16.3%) | 110 (26.3%) |
| 7:30 AM to 7:59 AM | 60 (16.6%) | 100 (23.9%) |
| 8:00 AM to 8:29 AM | 60 (16.6%) | 39 (9.3%) |
| 8:30 AM to 8:59 AM | 0 (0.0%) | 0 (0.0%) |
| 9:00 AM to 9:59 AM | 11 (3.0%) | 15 (3.6%) |
| 10:00 AM to 10:59 AM | 0 (0.0%) | 14 (3.3%) |
| 11:00 AM to 11:59 AM | 0 (0.0%) | 0 (0.0%) |
| 12:00 PM to 3:59 PM | 9 (2.5%) | 23 (5.5%) |
| 4:00 PM to 11:59 PM | 45 (12.4%) | 32 (7.6%) |
| Total | 362 (100.0%) | 419 (100.0%) |
Housing Occupancy in Hemlock
Occupancy by Ownership in Hemlock
Of the total 513 dwellings in Hemlock, owner-occupied units account for 399 (77.8%), while renter-occupied units make up 114 (22.2%).
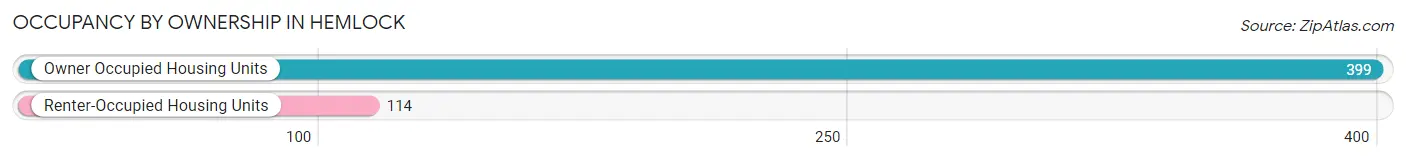
| Occupancy | # Housing Units | % Housing Units |
| Owner Occupied Housing Units | 399 | 77.8% |
| Renter-Occupied Housing Units | 114 | 22.2% |
| Total Occupied Housing Units | 513 | 100.0% |
Occupancy by Household Size in Hemlock
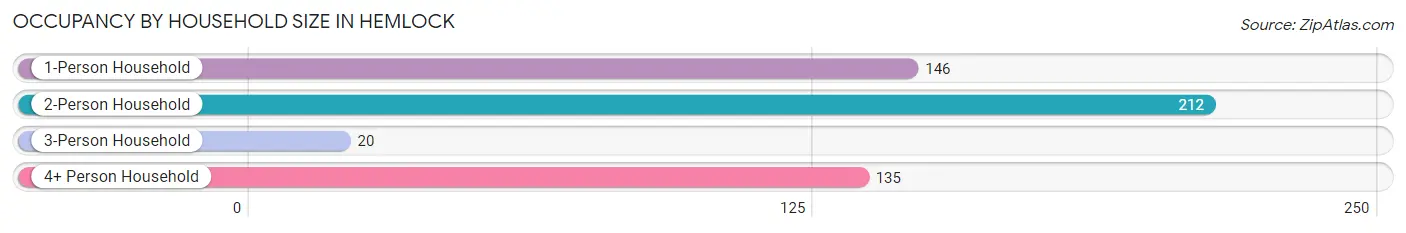
| Household Size | # Housing Units | % Housing Units |
| 1-Person Household | 146 | 28.5% |
| 2-Person Household | 212 | 41.3% |
| 3-Person Household | 20 | 3.9% |
| 4+ Person Household | 135 | 26.3% |
| Total Housing Units | 513 | 100.0% |
Occupancy by Ownership by Household Size in Hemlock
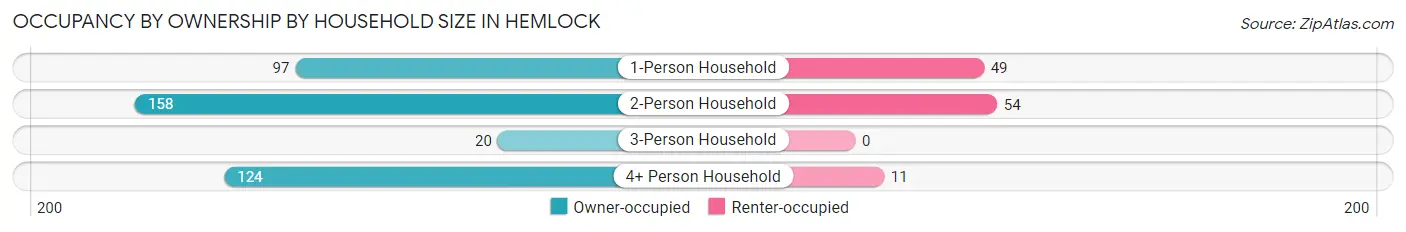
| Household Size | Owner-occupied | Renter-occupied |
| 1-Person Household | 97 (66.4%) | 49 (33.6%) |
| 2-Person Household | 158 (74.5%) | 54 (25.5%) |
| 3-Person Household | 20 (100.0%) | 0 (0.0%) |
| 4+ Person Household | 124 (91.8%) | 11 (8.2%) |
| Total Housing Units | 399 (77.8%) | 114 (22.2%) |
Occupancy by Educational Attainment in Hemlock
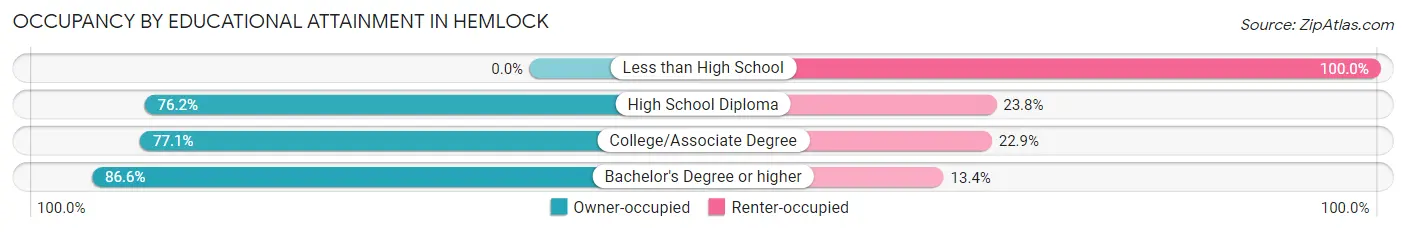
| Household Size | Owner-occupied | Renter-occupied |
| Less than High School | 0 (0.0%) | 11 (100.0%) |
| High School Diploma | 128 (76.2%) | 40 (23.8%) |
| College/Associate Degree | 148 (77.1%) | 44 (22.9%) |
| Bachelor's Degree or higher | 123 (86.6%) | 19 (13.4%) |
Occupancy by Age of Householder in Hemlock
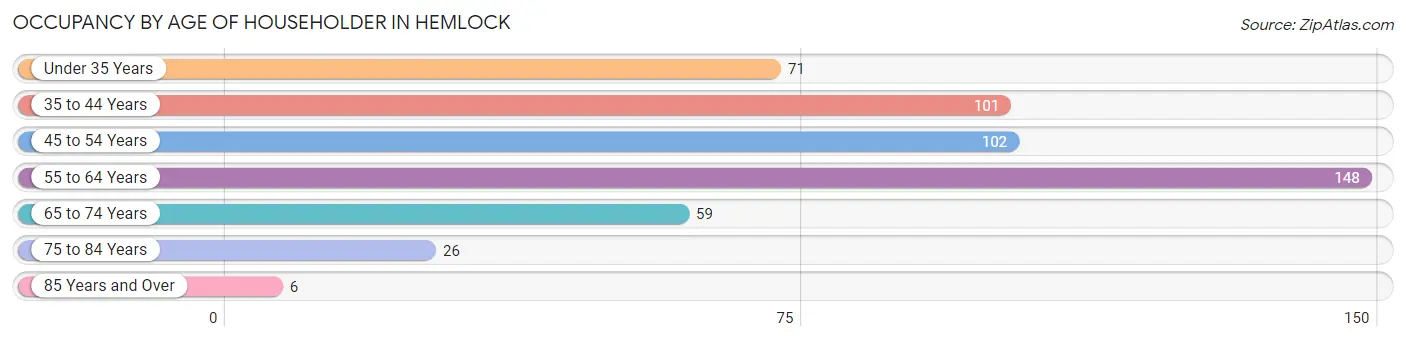
| Age Bracket | # Households | % Households |
| Under 35 Years | 71 | 13.8% |
| 35 to 44 Years | 101 | 19.7% |
| 45 to 54 Years | 102 | 19.9% |
| 55 to 64 Years | 148 | 28.8% |
| 65 to 74 Years | 59 | 11.5% |
| 75 to 84 Years | 26 | 5.1% |
| 85 Years and Over | 6 | 1.2% |
| Total | 513 | 100.0% |
Housing Finances in Hemlock
Median Income by Occupancy in Hemlock
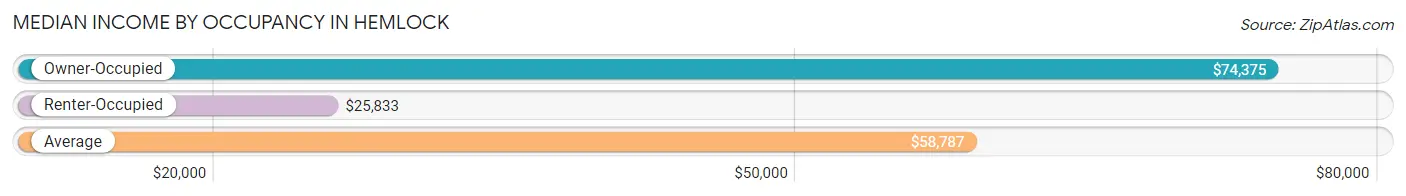
| Occupancy Type | # Households | Median Income |
| Owner-Occupied | 399 (77.8%) | $74,375 |
| Renter-Occupied | 114 (22.2%) | $25,833 |
| Average | 513 (100.0%) | $58,787 |
Occupancy by Householder Income Bracket in Hemlock
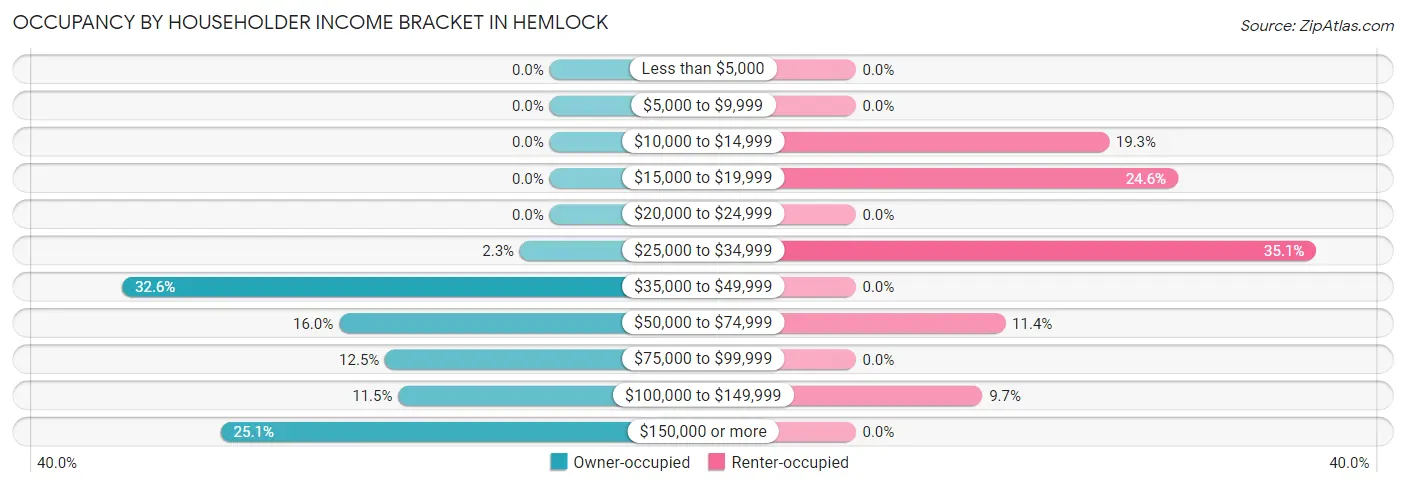
| Income Bracket | Owner-occupied | Renter-occupied |
| Less than $5,000 | 0 (0.0%) | 0 (0.0%) |
| $5,000 to $9,999 | 0 (0.0%) | 0 (0.0%) |
| $10,000 to $14,999 | 0 (0.0%) | 22 (19.3%) |
| $15,000 to $19,999 | 0 (0.0%) | 28 (24.6%) |
| $20,000 to $24,999 | 0 (0.0%) | 0 (0.0%) |
| $25,000 to $34,999 | 9 (2.3%) | 40 (35.1%) |
| $35,000 to $49,999 | 130 (32.6%) | 0 (0.0%) |
| $50,000 to $74,999 | 64 (16.0%) | 13 (11.4%) |
| $75,000 to $99,999 | 50 (12.5%) | 0 (0.0%) |
| $100,000 to $149,999 | 46 (11.5%) | 11 (9.7%) |
| $150,000 or more | 100 (25.1%) | 0 (0.0%) |
| Total | 399 (100.0%) | 114 (100.0%) |
Monthly Housing Cost Tiers in Hemlock
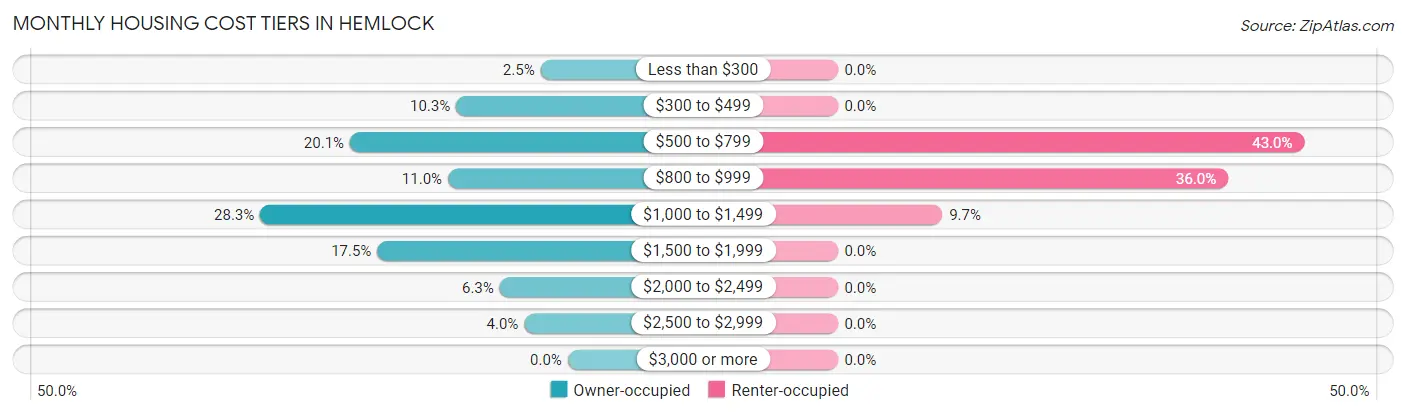
| Monthly Cost | Owner-occupied | Renter-occupied |
| Less than $300 | 10 (2.5%) | 0 (0.0%) |
| $300 to $499 | 41 (10.3%) | 0 (0.0%) |
| $500 to $799 | 80 (20.1%) | 49 (43.0%) |
| $800 to $999 | 44 (11.0%) | 41 (36.0%) |
| $1,000 to $1,499 | 113 (28.3%) | 11 (9.7%) |
| $1,500 to $1,999 | 70 (17.5%) | 0 (0.0%) |
| $2,000 to $2,499 | 25 (6.3%) | 0 (0.0%) |
| $2,500 to $2,999 | 16 (4.0%) | 0 (0.0%) |
| $3,000 or more | 0 (0.0%) | 0 (0.0%) |
| Total | 399 (100.0%) | 114 (100.0%) |
Physical Housing Characteristics in Hemlock
Housing Structures in Hemlock
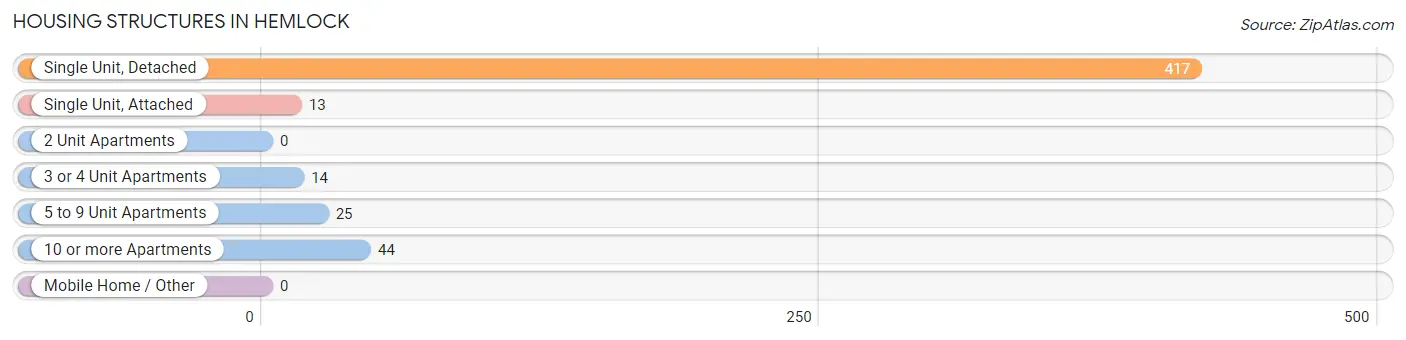
| Structure Type | # Housing Units | % Housing Units |
| Single Unit, Detached | 417 | 81.3% |
| Single Unit, Attached | 13 | 2.5% |
| 2 Unit Apartments | 0 | 0.0% |
| 3 or 4 Unit Apartments | 14 | 2.7% |
| 5 to 9 Unit Apartments | 25 | 4.9% |
| 10 or more Apartments | 44 | 8.6% |
| Mobile Home / Other | 0 | 0.0% |
| Total | 513 | 100.0% |
Housing Structures by Occupancy in Hemlock
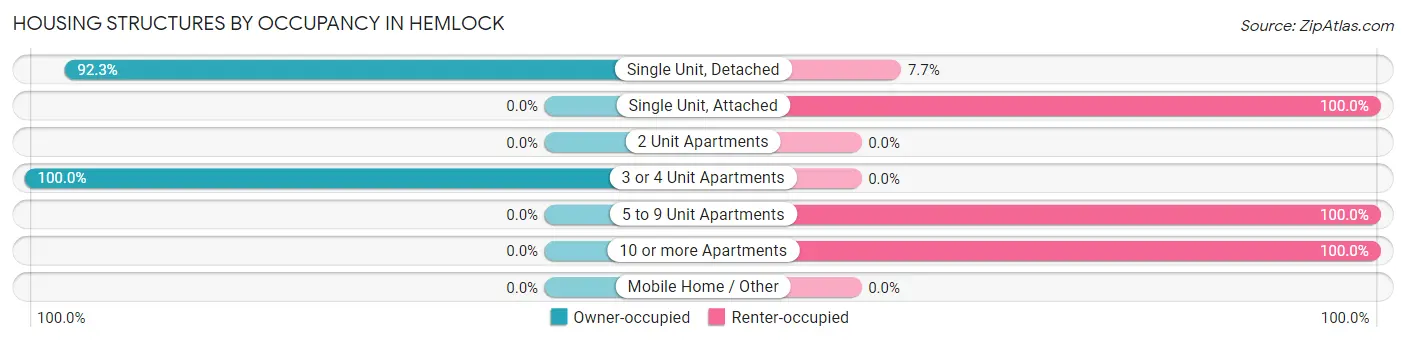
| Structure Type | Owner-occupied | Renter-occupied |
| Single Unit, Detached | 385 (92.3%) | 32 (7.7%) |
| Single Unit, Attached | 0 (0.0%) | 13 (100.0%) |
| 2 Unit Apartments | 0 (0.0%) | 0 (0.0%) |
| 3 or 4 Unit Apartments | 14 (100.0%) | 0 (0.0%) |
| 5 to 9 Unit Apartments | 0 (0.0%) | 25 (100.0%) |
| 10 or more Apartments | 0 (0.0%) | 44 (100.0%) |
| Mobile Home / Other | 0 (0.0%) | 0 (0.0%) |
| Total | 399 (77.8%) | 114 (22.2%) |
Housing Structures by Number of Rooms in Hemlock
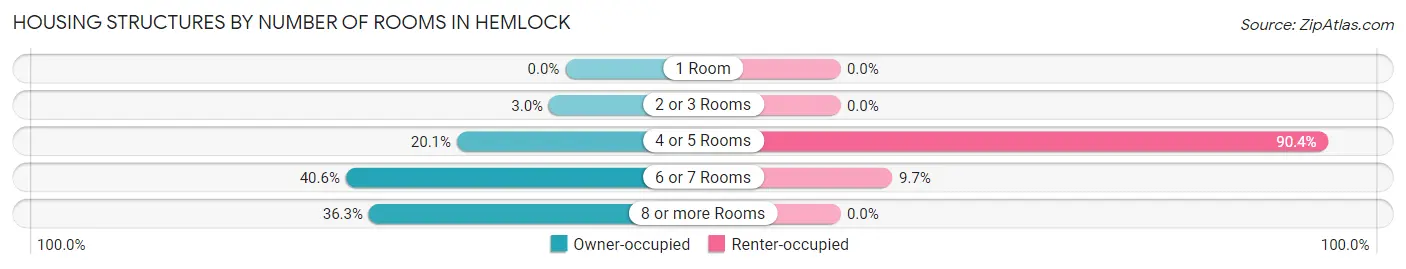
| Number of Rooms | Owner-occupied | Renter-occupied |
| 1 Room | 0 (0.0%) | 0 (0.0%) |
| 2 or 3 Rooms | 12 (3.0%) | 0 (0.0%) |
| 4 or 5 Rooms | 80 (20.1%) | 103 (90.3%) |
| 6 or 7 Rooms | 162 (40.6%) | 11 (9.7%) |
| 8 or more Rooms | 145 (36.3%) | 0 (0.0%) |
| Total | 399 (100.0%) | 114 (100.0%) |
Housing Structure by Heating Type in Hemlock
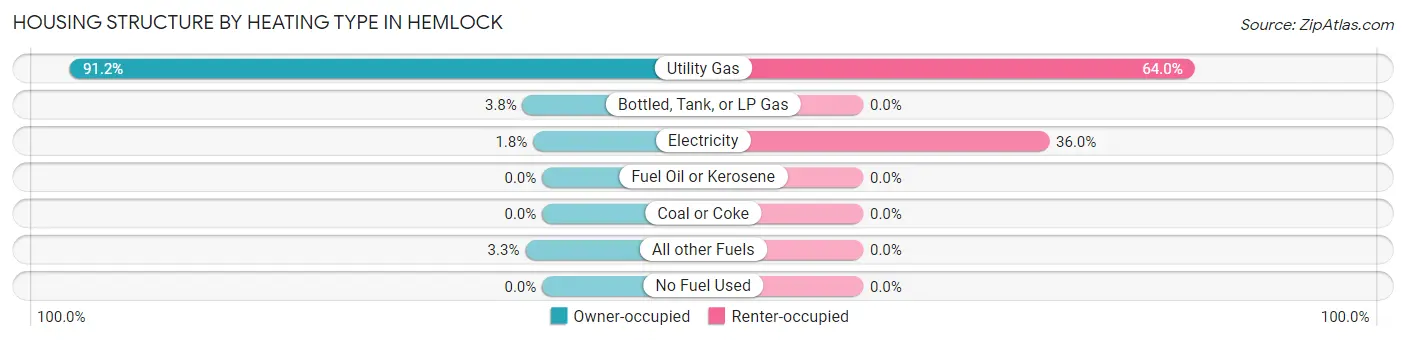
| Heating Type | Owner-occupied | Renter-occupied |
| Utility Gas | 364 (91.2%) | 73 (64.0%) |
| Bottled, Tank, or LP Gas | 15 (3.8%) | 0 (0.0%) |
| Electricity | 7 (1.8%) | 41 (36.0%) |
| Fuel Oil or Kerosene | 0 (0.0%) | 0 (0.0%) |
| Coal or Coke | 0 (0.0%) | 0 (0.0%) |
| All other Fuels | 13 (3.3%) | 0 (0.0%) |
| No Fuel Used | 0 (0.0%) | 0 (0.0%) |
| Total | 399 (100.0%) | 114 (100.0%) |
Household Vehicle Usage in Hemlock
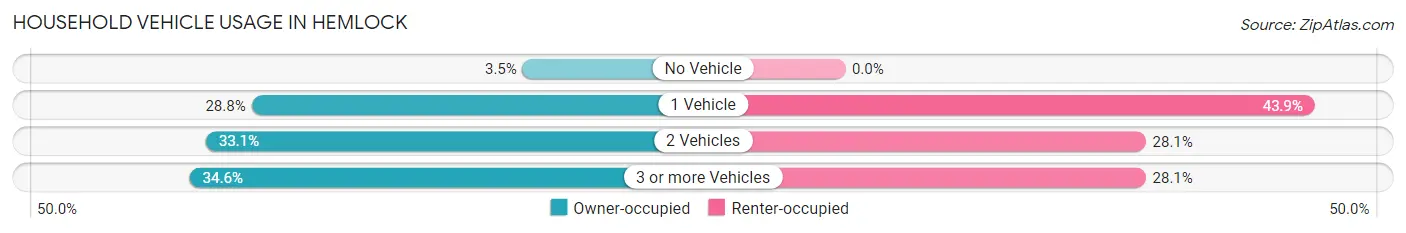
| Vehicles per Household | Owner-occupied | Renter-occupied |
| No Vehicle | 14 (3.5%) | 0 (0.0%) |
| 1 Vehicle | 115 (28.8%) | 50 (43.9%) |
| 2 Vehicles | 132 (33.1%) | 32 (28.1%) |
| 3 or more Vehicles | 138 (34.6%) | 32 (28.1%) |
| Total | 399 (100.0%) | 114 (100.0%) |
Real Estate & Mortgages in Hemlock
Real Estate and Mortgage Overview in Hemlock
| Characteristic | Without Mortgage | With Mortgage |
| Housing Units | 134 | 265 |
| Median Property Value | $156,300 | $184,000 |
| Median Household Income | - | - |
| Monthly Housing Costs | $542 | $0 |
| Real Estate Taxes | $2,043 | $0 |
Property Value by Mortgage Status in Hemlock
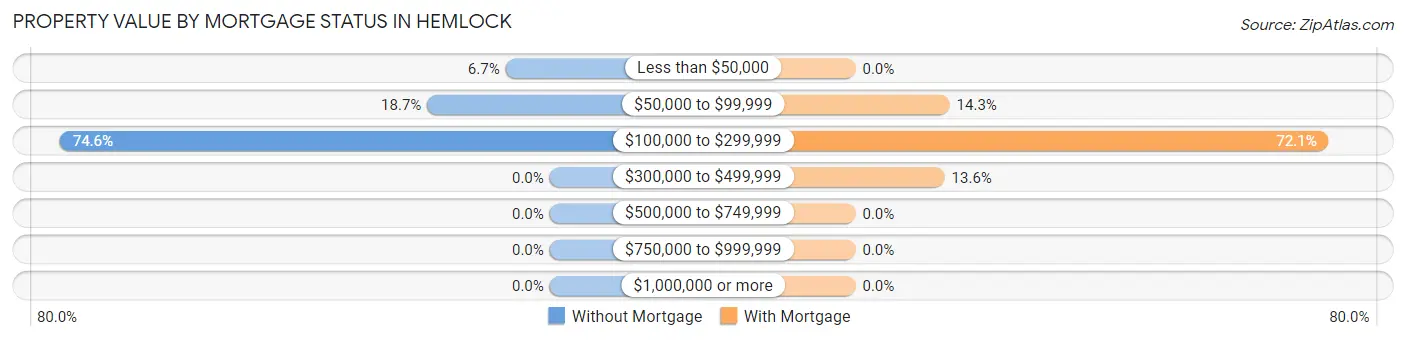
| Property Value | Without Mortgage | With Mortgage |
| Less than $50,000 | 9 (6.7%) | 0 (0.0%) |
| $50,000 to $99,999 | 25 (18.7%) | 38 (14.3%) |
| $100,000 to $299,999 | 100 (74.6%) | 191 (72.1%) |
| $300,000 to $499,999 | 0 (0.0%) | 36 (13.6%) |
| $500,000 to $749,999 | 0 (0.0%) | 0 (0.0%) |
| $750,000 to $999,999 | 0 (0.0%) | 0 (0.0%) |
| $1,000,000 or more | 0 (0.0%) | 0 (0.0%) |
| Total | 134 (100.0%) | 265 (100.0%) |
Household Income by Mortgage Status in Hemlock
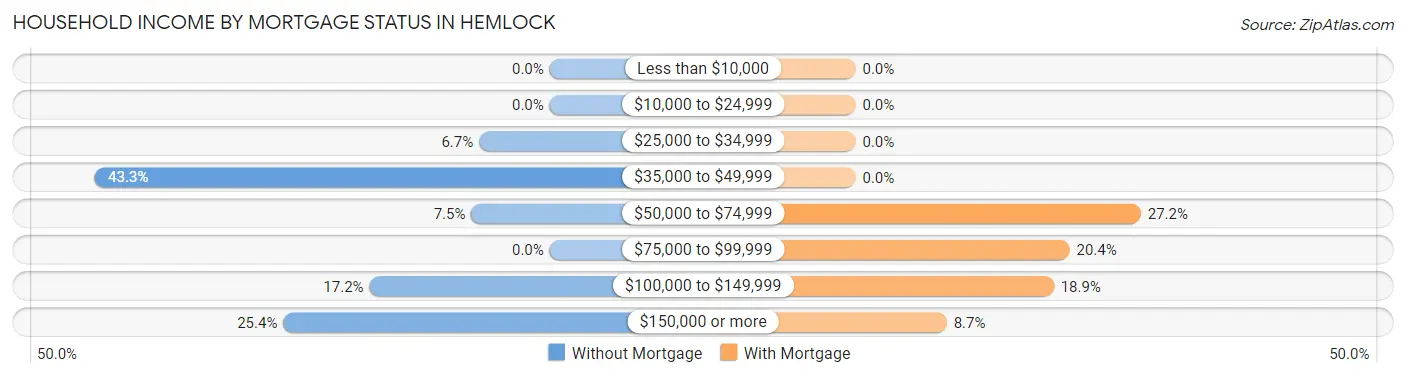
| Household Income | Without Mortgage | With Mortgage |
| Less than $10,000 | 0 (0.0%) | 0 (0.0%) |
| $10,000 to $24,999 | 0 (0.0%) | 0 (0.0%) |
| $25,000 to $34,999 | 9 (6.7%) | 0 (0.0%) |
| $35,000 to $49,999 | 58 (43.3%) | 0 (0.0%) |
| $50,000 to $74,999 | 10 (7.5%) | 72 (27.2%) |
| $75,000 to $99,999 | 0 (0.0%) | 54 (20.4%) |
| $100,000 to $149,999 | 23 (17.2%) | 50 (18.9%) |
| $150,000 or more | 34 (25.4%) | 23 (8.7%) |
| Total | 134 (100.0%) | 265 (100.0%) |
Property Value to Household Income Ratio in Hemlock
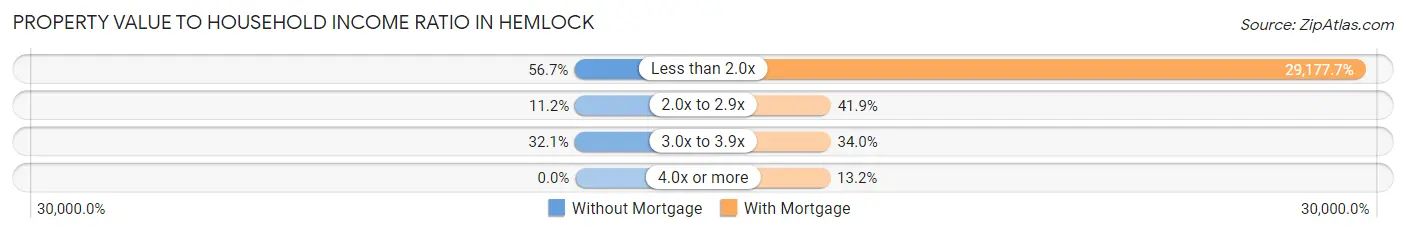
| Value-to-Income Ratio | Without Mortgage | With Mortgage |
| Less than 2.0x | 76 (56.7%) | 77,321 (29,177.7%) |
| 2.0x to 2.9x | 15 (11.2%) | 111 (41.9%) |
| 3.0x to 3.9x | 43 (32.1%) | 90 (34.0%) |
| 4.0x or more | 0 (0.0%) | 35 (13.2%) |
| Total | 134 (100.0%) | 265 (100.0%) |
Real Estate Taxes by Mortgage Status in Hemlock
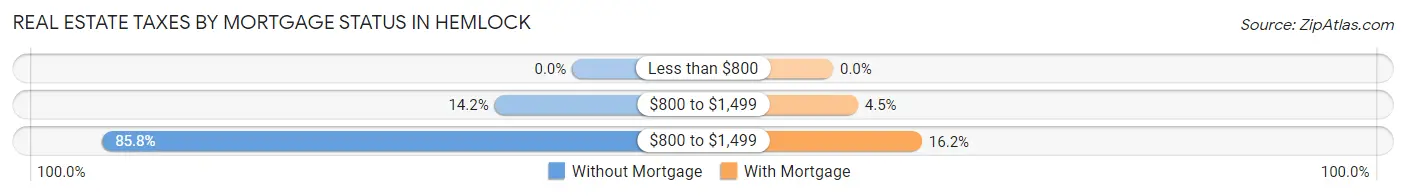
| Property Taxes | Without Mortgage | With Mortgage |
| Less than $800 | 0 (0.0%) | 0 (0.0%) |
| $800 to $1,499 | 19 (14.2%) | 12 (4.5%) |
| $800 to $1,499 | 115 (85.8%) | 43 (16.2%) |
| Total | 134 (100.0%) | 265 (100.0%) |
Health & Disability in Hemlock
Health Insurance Coverage by Age in Hemlock
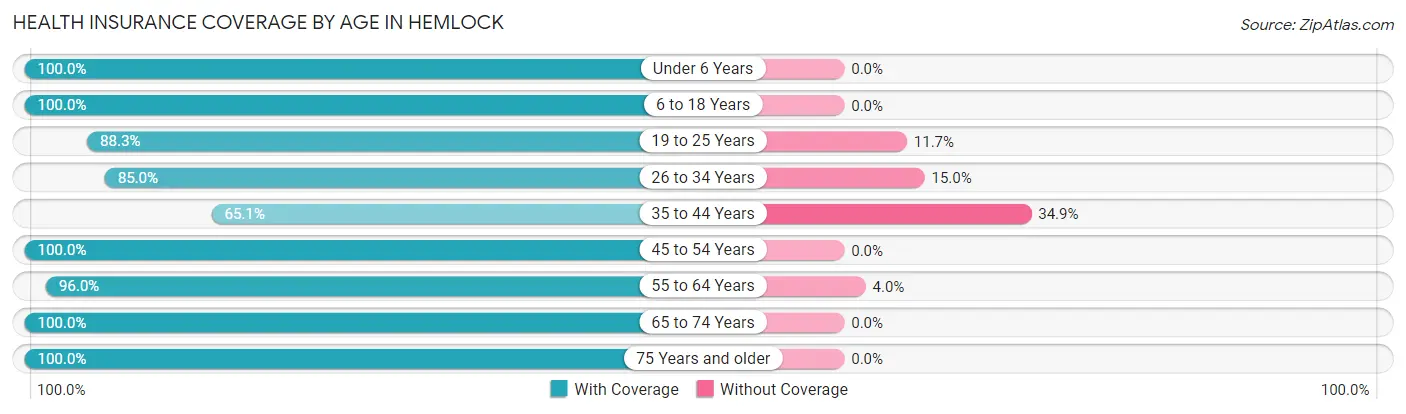
| Age Bracket | With Coverage | Without Coverage |
| Under 6 Years | 28 (100.0%) | 0 (0.0%) |
| 6 to 18 Years | 256 (100.0%) | 0 (0.0%) |
| 19 to 25 Years | 106 (88.3%) | 14 (11.7%) |
| 26 to 34 Years | 108 (85.0%) | 19 (15.0%) |
| 35 to 44 Years | 99 (65.1%) | 53 (34.9%) |
| 45 to 54 Years | 184 (100.0%) | 0 (0.0%) |
| 55 to 64 Years | 241 (96.0%) | 10 (4.0%) |
| 65 to 74 Years | 64 (100.0%) | 0 (0.0%) |
| 75 Years and older | 44 (100.0%) | 0 (0.0%) |
| Total | 1,130 (92.2%) | 96 (7.8%) |
Health Insurance Coverage by Citizenship Status in Hemlock
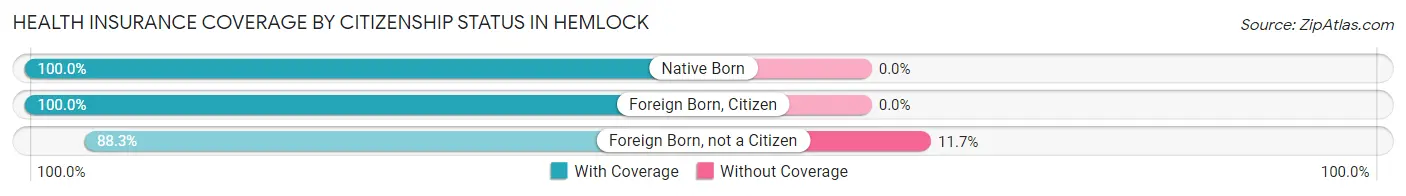
| Citizenship Status | With Coverage | Without Coverage |
| Native Born | 28 (100.0%) | 0 (0.0%) |
| Foreign Born, Citizen | 256 (100.0%) | 0 (0.0%) |
| Foreign Born, not a Citizen | 106 (88.3%) | 14 (11.7%) |
Health Insurance Coverage by Household Income in Hemlock
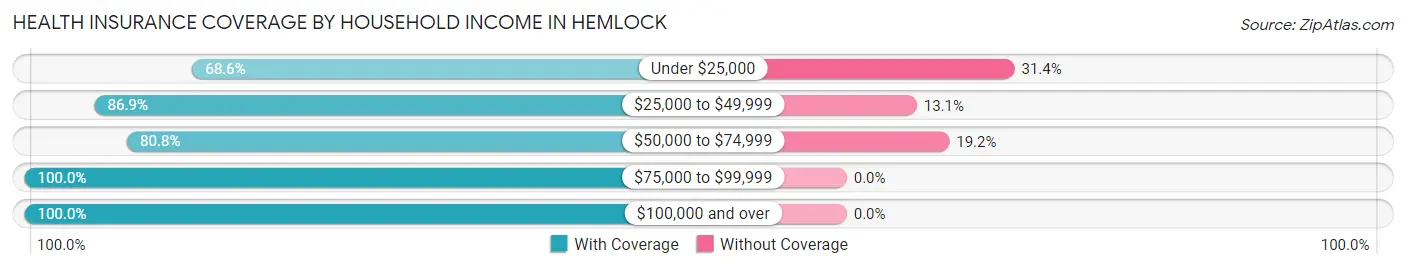
| Household Income | With Coverage | Without Coverage |
| Under $25,000 | 48 (68.6%) | 22 (31.4%) |
| $25,000 to $49,999 | 298 (86.9%) | 45 (13.1%) |
| $50,000 to $74,999 | 122 (80.8%) | 29 (19.2%) |
| $75,000 to $99,999 | 150 (100.0%) | 0 (0.0%) |
| $100,000 and over | 512 (100.0%) | 0 (0.0%) |
Public vs Private Health Insurance Coverage by Age in Hemlock
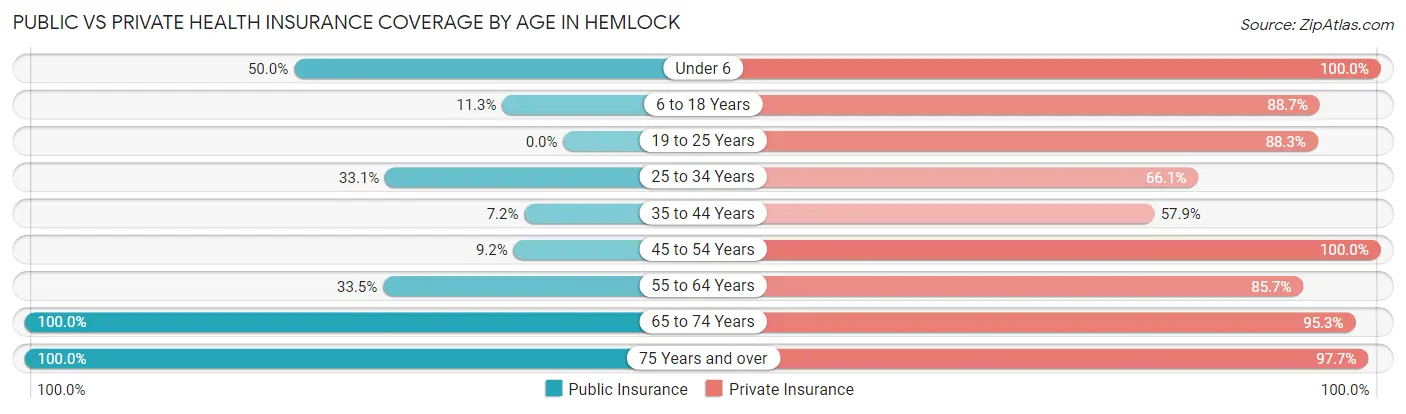
| Age Bracket | Public Insurance | Private Insurance |
| Under 6 | 14 (50.0%) | 28 (100.0%) |
| 6 to 18 Years | 29 (11.3%) | 227 (88.7%) |
| 19 to 25 Years | 0 (0.0%) | 106 (88.3%) |
| 25 to 34 Years | 42 (33.1%) | 84 (66.1%) |
| 35 to 44 Years | 11 (7.2%) | 88 (57.9%) |
| 45 to 54 Years | 17 (9.2%) | 184 (100.0%) |
| 55 to 64 Years | 84 (33.5%) | 215 (85.7%) |
| 65 to 74 Years | 64 (100.0%) | 61 (95.3%) |
| 75 Years and over | 44 (100.0%) | 43 (97.7%) |
| Total | 305 (24.9%) | 1,036 (84.5%) |
Disability Status by Sex by Age in Hemlock
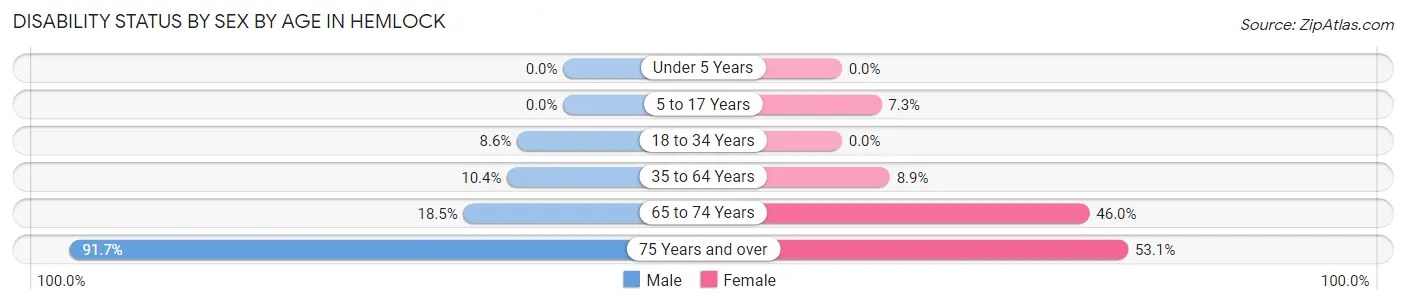
| Age Bracket | Male | Female |
| Under 5 Years | 0 (0.0%) | 0 (0.0%) |
| 5 to 17 Years | 0 (0.0%) | 13 (7.3%) |
| 18 to 34 Years | 12 (8.6%) | 0 (0.0%) |
| 35 to 64 Years | 26 (10.4%) | 30 (8.9%) |
| 65 to 74 Years | 5 (18.5%) | 17 (46.0%) |
| 75 Years and over | 11 (91.7%) | 17 (53.1%) |
Disability Class by Sex by Age in Hemlock
Disability Class: Hearing Difficulty
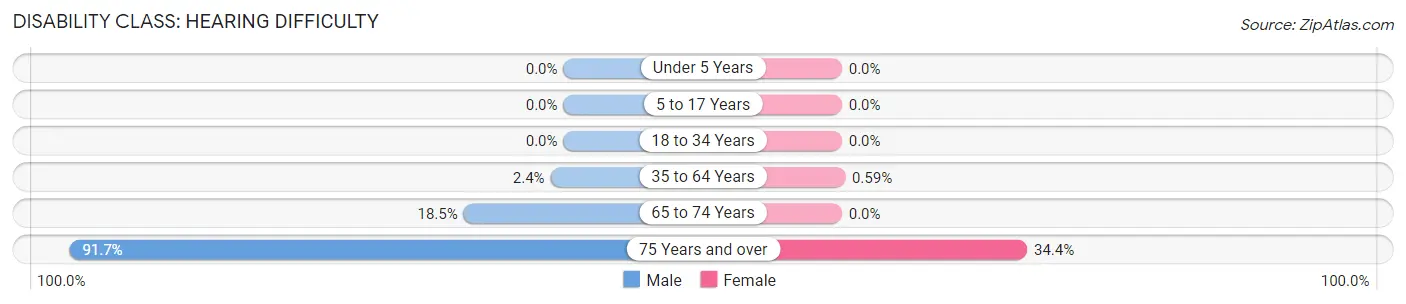
| Age Bracket | Male | Female |
| Under 5 Years | 0 (0.0%) | 0 (0.0%) |
| 5 to 17 Years | 0 (0.0%) | 0 (0.0%) |
| 18 to 34 Years | 0 (0.0%) | 0 (0.0%) |
| 35 to 64 Years | 6 (2.4%) | 2 (0.6%) |
| 65 to 74 Years | 5 (18.5%) | 0 (0.0%) |
| 75 Years and over | 11 (91.7%) | 11 (34.4%) |
Disability Class: Vision Difficulty
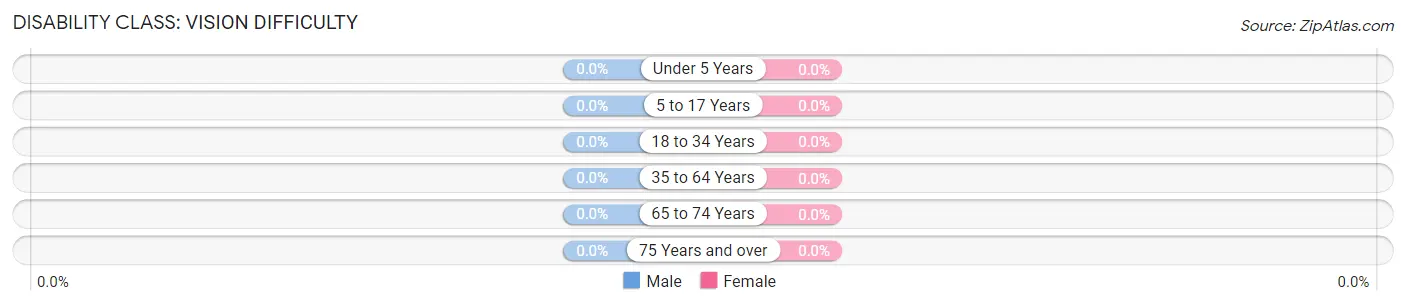
| Age Bracket | Male | Female |
| Under 5 Years | 0 (0.0%) | 0 (0.0%) |
| 5 to 17 Years | 0 (0.0%) | 0 (0.0%) |
| 18 to 34 Years | 0 (0.0%) | 0 (0.0%) |
| 35 to 64 Years | 0 (0.0%) | 0 (0.0%) |
| 65 to 74 Years | 0 (0.0%) | 0 (0.0%) |
| 75 Years and over | 0 (0.0%) | 0 (0.0%) |
Disability Class: Cognitive Difficulty
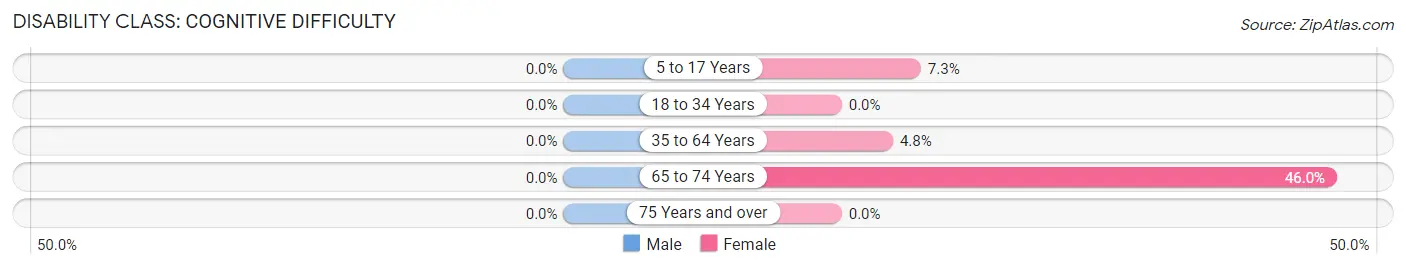
| Age Bracket | Male | Female |
| 5 to 17 Years | 0 (0.0%) | 13 (7.3%) |
| 18 to 34 Years | 0 (0.0%) | 0 (0.0%) |
| 35 to 64 Years | 0 (0.0%) | 16 (4.8%) |
| 65 to 74 Years | 0 (0.0%) | 17 (46.0%) |
| 75 Years and over | 0 (0.0%) | 0 (0.0%) |
Disability Class: Ambulatory Difficulty
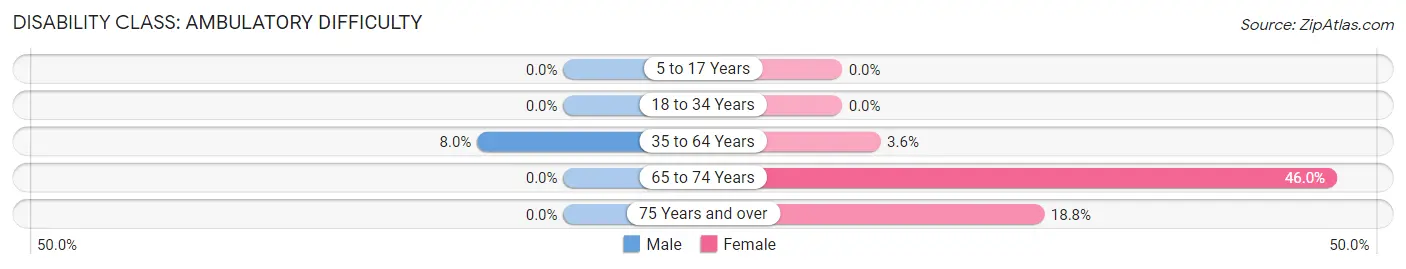
| Age Bracket | Male | Female |
| 5 to 17 Years | 0 (0.0%) | 0 (0.0%) |
| 18 to 34 Years | 0 (0.0%) | 0 (0.0%) |
| 35 to 64 Years | 20 (8.0%) | 12 (3.6%) |
| 65 to 74 Years | 0 (0.0%) | 17 (46.0%) |
| 75 Years and over | 0 (0.0%) | 6 (18.8%) |
Disability Class: Self-Care Difficulty
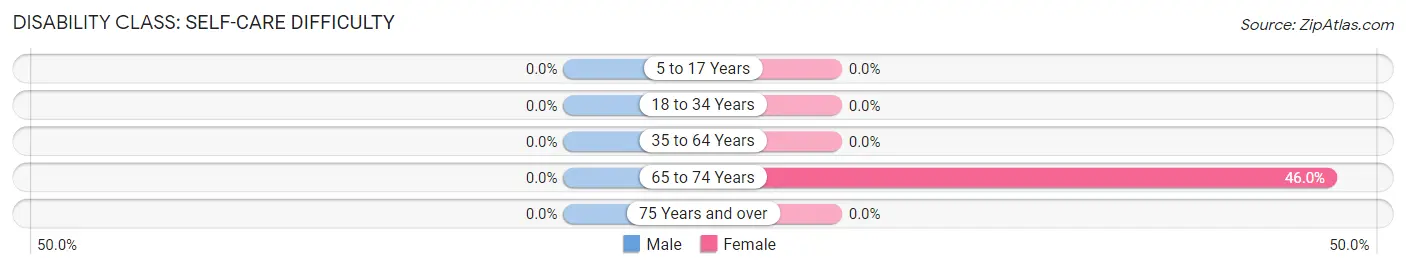
| Age Bracket | Male | Female |
| 5 to 17 Years | 0 (0.0%) | 0 (0.0%) |
| 18 to 34 Years | 0 (0.0%) | 0 (0.0%) |
| 35 to 64 Years | 0 (0.0%) | 0 (0.0%) |
| 65 to 74 Years | 0 (0.0%) | 17 (46.0%) |
| 75 Years and over | 0 (0.0%) | 0 (0.0%) |
Technology Access in Hemlock
Computing Device Access in Hemlock
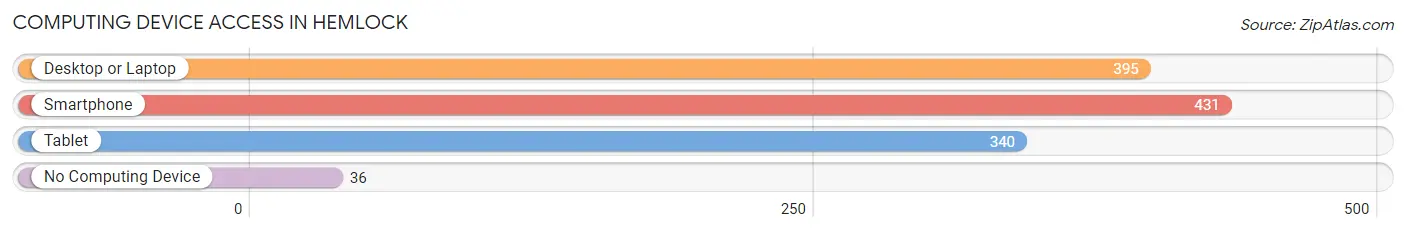
| Device Type | # Households | % Households |
| Desktop or Laptop | 395 | 77.0% |
| Smartphone | 431 | 84.0% |
| Tablet | 340 | 66.3% |
| No Computing Device | 36 | 7.0% |
| Total | 513 | 100.0% |
Internet Access in Hemlock
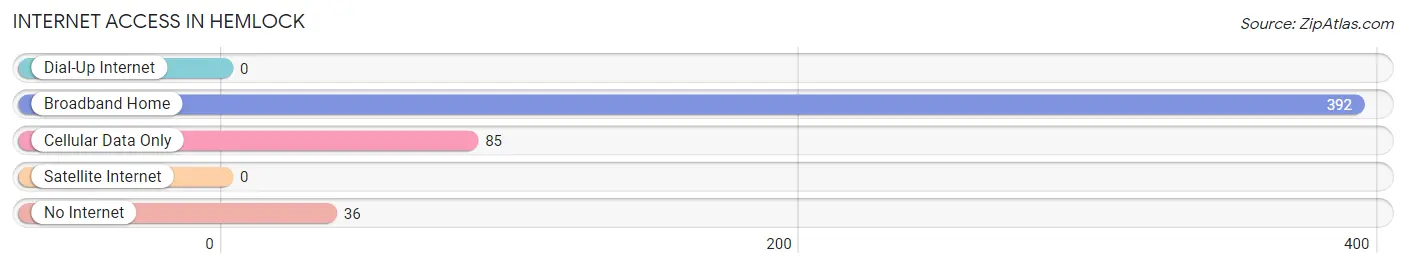
| Internet Type | # Households | % Households |
| Dial-Up Internet | 0 | 0.0% |
| Broadband Home | 392 | 76.4% |
| Cellular Data Only | 85 | 16.6% |
| Satellite Internet | 0 | 0.0% |
| No Internet | 36 | 7.0% |
| Total | 513 | 100.0% |
Hemlock Summary
Hemlock, Michigan is a small village located in Saginaw County, Michigan. It is situated on the banks of the Tittabawassee River, approximately 10 miles north of Saginaw. The village has a population of 1,845 people, according to the 2010 census.
Geography
Hemlock is located in the Saginaw Valley region of Michigan. The village is situated on the banks of the Tittabawassee River, which flows through the village and is a major source of recreation for the area. The village is surrounded by rolling hills and farmland, and is located approximately 10 miles north of Saginaw.
Economy
Hemlock’s economy is largely based on agriculture and manufacturing. The village is home to several small businesses, including a grocery store, a hardware store, and a few restaurants. The village also has a few small industrial parks, which are home to several manufacturing companies.
Demographics
According to the 2010 census, the population of Hemlock was 1,845 people. The racial makeup of the village was 95.3% White, 0.9% African American, 0.3% Native American, 0.7% Asian, 0.1% Pacific Islander, 0.7% from other races, and 1.9% from two or more races. Hispanic or Latino of any race were 2.2% of the population.
The median income for a household in the village was $41,250, and the median income for a family was $50,000. The per capita income for the village was $19,945. About 8.2% of families and 10.2% of the population were below the poverty line, including 14.2% of those under age 18 and 6.2% of those age 65 or over.
History
Hemlock was first settled in 1836 by a group of German immigrants. The village was originally named “Hemlock Grove” after the abundance of hemlock trees in the area. The village was officially incorporated in 1867.
In the late 19th century, Hemlock was a thriving agricultural community. The village was home to several grain mills, a sawmill, and a grist mill. The village also had a large lumber industry, which provided lumber for the surrounding area.
In the early 20th century, Hemlock began to experience a decline in its economy. The lumber industry had largely moved away, and the village was no longer a major agricultural center. The village’s population began to decline, and by the 1950s, the population had dropped to just over 1,000 people.
In recent years, Hemlock has experienced a resurgence in its economy. The village has become a popular destination for outdoor recreation, and the village has seen an increase in tourism. The village has also seen an increase in small businesses, and the population has grown to its current level of 1,845 people.
Common Questions
What is Per Capita Income in Hemlock?
Per Capita income in Hemlock is $34,399.
What is the Median Family Income in Hemlock?
Median Family Income in Hemlock is $82,917.
What is the Median Household income in Hemlock?
Median Household Income in Hemlock is $58,787.
What is Income or Wage Gap in Hemlock?
Income or Wage Gap in Hemlock is 52.8%.
Women in Hemlock earn 47.2 cents for every dollar earned by a man.
What is Inequality or Gini Index in Hemlock?
Inequality or Gini Index in Hemlock is 0.39.
What is the Total Population of Hemlock?
Total Population of Hemlock is 1,226.
What is the Total Male Population of Hemlock?
Total Male Population of Hemlock is 523.
What is the Total Female Population of Hemlock?
Total Female Population of Hemlock is 703.
What is the Ratio of Males per 100 Females in Hemlock?
There are 74.40 Males per 100 Females in Hemlock.
What is the Ratio of Females per 100 Males in Hemlock?
There are 134.42 Females per 100 Males in Hemlock.
What is the Median Population Age in Hemlock?
Median Population Age in Hemlock is 39.4 Years.
What is the Average Family Size in Hemlock
Average Family Size in Hemlock is 3.0 People.
What is the Average Household Size in Hemlock
Average Household Size in Hemlock is 2.4 People.
How Large is the Labor Force in Hemlock?
There are 804 People in the Labor Forcein in Hemlock.
What is the Percentage of People in the Labor Force in Hemlock?
79.1% of People are in the Labor Force in Hemlock.