Hastings, MI Map & Demographics
Hastings Map
Hastings Overview
$30,930
PER CAPITA INCOME
$75,069
AVG FAMILY INCOME
$54,118
AVG HOUSEHOLD INCOME
32.2%
WAGE / INCOME GAP [ % ]
67.8¢/ $1
WAGE / INCOME GAP [ $ ]
0.40
INEQUALITY / GINI INDEX
7,504
TOTAL POPULATION
3,386
MALE POPULATION
4,118
FEMALE POPULATION
82.22
MALES / 100 FEMALES
121.62
FEMALES / 100 MALES
38.1
MEDIAN AGE
3.2
AVG FAMILY SIZE
2.3
AVG HOUSEHOLD SIZE
3,599
LABOR FORCE [ PEOPLE ]
56.8%
PERCENT IN LABOR FORCE
6.5%
UNEMPLOYMENT RATE
Hastings Zip Codes
Hastings Area Codes
Income in Hastings
Income Overview in Hastings
Per Capita Income in Hastings is $30,930, while median incomes of families and households are $75,069 and $54,118 respectively.
| Characteristic | Number | Measure |
| Per Capita Income | 7,504 | $30,930 |
| Median Family Income | 1,596 | $75,069 |
| Mean Family Income | 1,596 | $83,352 |
| Median Household Income | 3,260 | $54,118 |
| Mean Household Income | 3,260 | $69,269 |
| Income Deficit | 1,596 | $0 |
| Wage / Income Gap (%) | 7,504 | 32.23% |
| Wage / Income Gap ($) | 7,504 | 67.77¢ per $1 |
| Gini / Inequality Index | 7,504 | 0.40 |
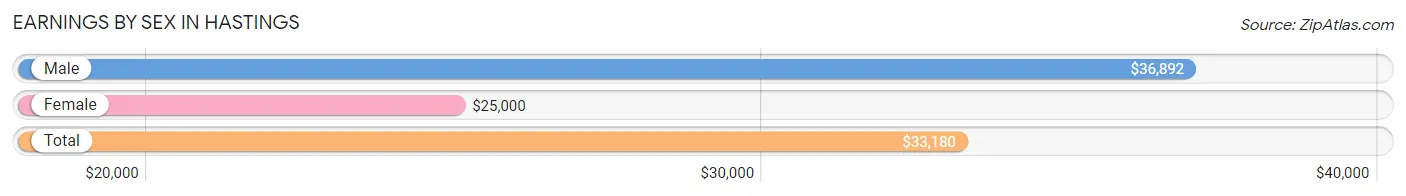
Earnings by Sex in Hastings
Average Earnings in Hastings are $33,180, $36,892 for men and $25,000 for women, a difference of 32.2%.
| Sex | Number | Average Earnings |
| Male | 1,899 (46.8%) | $36,892 |
| Female | 2,162 (53.2%) | $25,000 |
| Total | 4,061 (100.0%) | $33,180 |
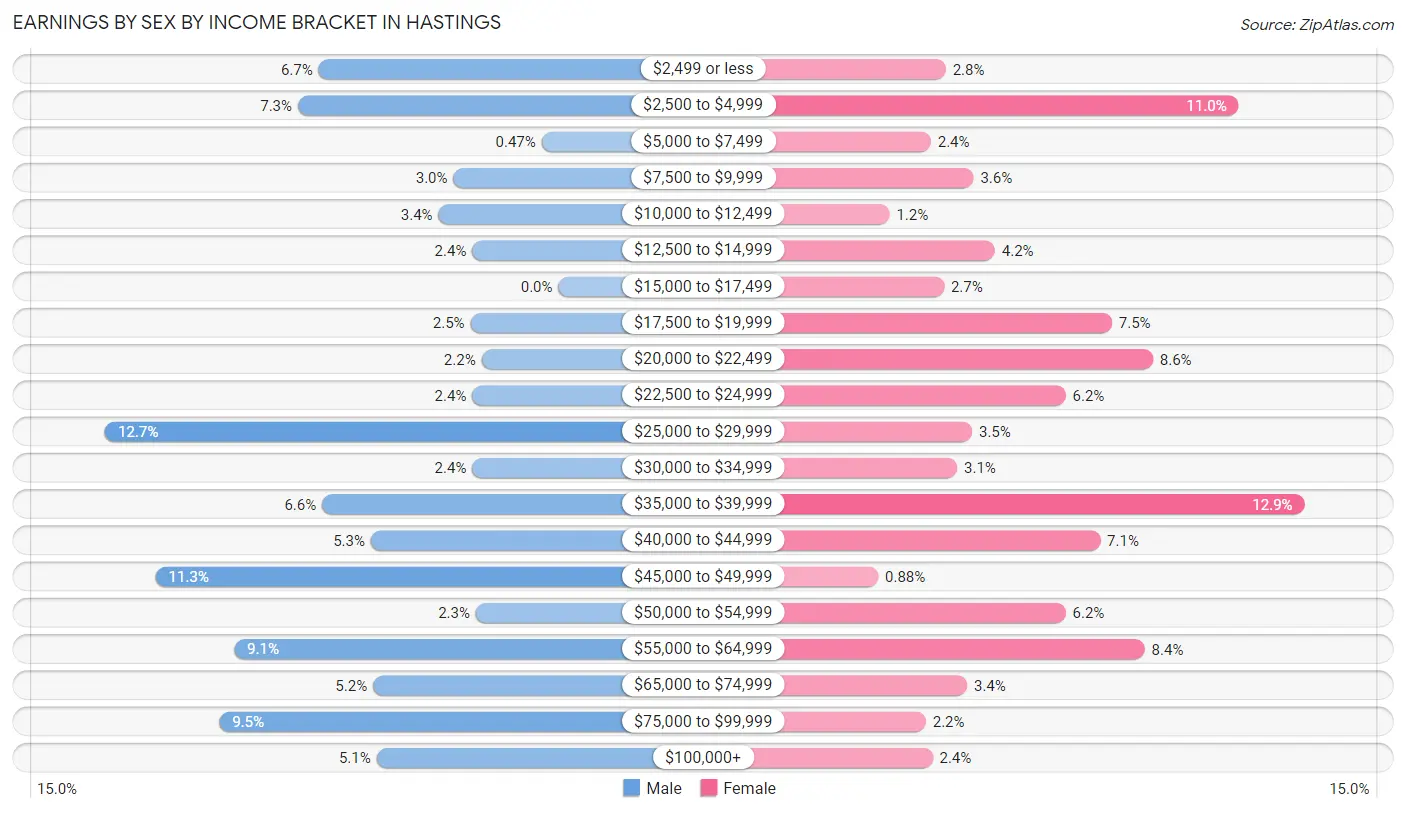
Earnings by Sex by Income Bracket in Hastings
The most common earnings brackets in Hastings are $25,000 to $29,999 for men (242 | 12.7%) and $35,000 to $39,999 for women (278 | 12.9%).
| Income | Male | Female |
| $2,499 or less | 128 (6.7%) | 60 (2.8%) |
| $2,500 to $4,999 | 139 (7.3%) | 238 (11.0%) |
| $5,000 to $7,499 | 9 (0.5%) | 51 (2.4%) |
| $7,500 to $9,999 | 56 (2.9%) | 77 (3.6%) |
| $10,000 to $12,499 | 64 (3.4%) | 26 (1.2%) |
| $12,500 to $14,999 | 46 (2.4%) | 90 (4.2%) |
| $15,000 to $17,499 | 0 (0.0%) | 59 (2.7%) |
| $17,500 to $19,999 | 47 (2.5%) | 161 (7.4%) |
| $20,000 to $22,499 | 41 (2.2%) | 186 (8.6%) |
| $22,500 to $24,999 | 46 (2.4%) | 133 (6.1%) |
| $25,000 to $29,999 | 242 (12.7%) | 76 (3.5%) |
| $30,000 to $34,999 | 46 (2.4%) | 67 (3.1%) |
| $35,000 to $39,999 | 126 (6.6%) | 278 (12.9%) |
| $40,000 to $44,999 | 100 (5.3%) | 154 (7.1%) |
| $45,000 to $49,999 | 215 (11.3%) | 19 (0.9%) |
| $50,000 to $54,999 | 44 (2.3%) | 133 (6.1%) |
| $55,000 to $64,999 | 173 (9.1%) | 181 (8.4%) |
| $65,000 to $74,999 | 99 (5.2%) | 73 (3.4%) |
| $75,000 to $99,999 | 181 (9.5%) | 48 (2.2%) |
| $100,000+ | 97 (5.1%) | 52 (2.4%) |
| Total | 1,899 (100.0%) | 2,162 (100.0%) |
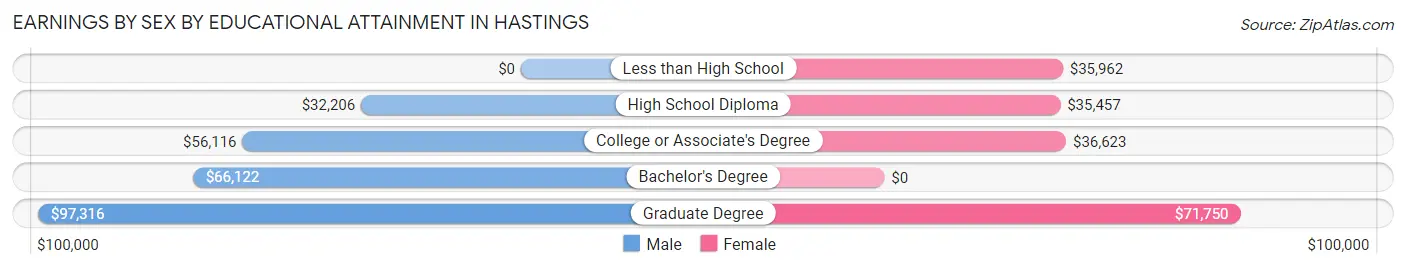
Earnings by Sex by Educational Attainment in Hastings
Average earnings in Hastings are $46,379 for men and $36,454 for women, a difference of 21.4%. Men with an educational attainment of graduate degree enjoy the highest average annual earnings of $97,316, while those with high school diploma education earn the least with $32,206. Women with an educational attainment of graduate degree earn the most with the average annual earnings of $71,750, while those with high school diploma education have the smallest earnings of $35,457.
| Educational Attainment | Male Income | Female Income |
| Less than High School | - | - |
| High School Diploma | $32,206 | $35,457 |
| College or Associate's Degree | $56,116 | $36,623 |
| Bachelor's Degree | $66,122 | $0 |
| Graduate Degree | $97,316 | $71,750 |
| Total | $46,379 | $36,454 |
Family Income in Hastings
Family Income Brackets in Hastings
According to the Hastings family income data, there are 417 families falling into the $50,000 to $74,999 income range, which is the most common income bracket and makes up 26.1% of all families.
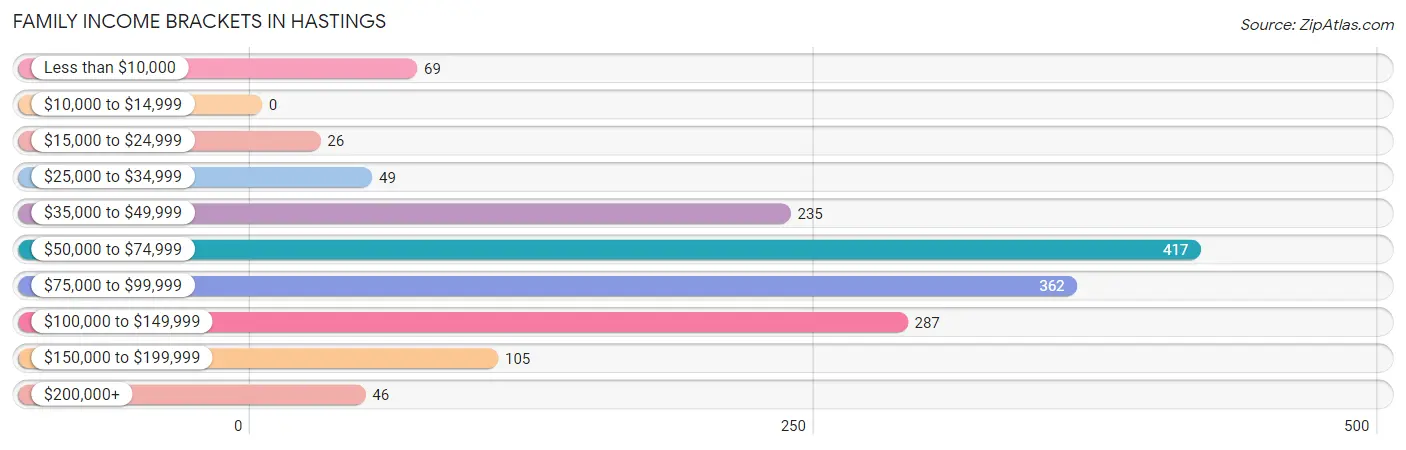
| Income Bracket | # Families | % Families |
| Less than $10,000 | 69 | 4.3% |
| $10,000 to $14,999 | 0 | 0.0% |
| $15,000 to $24,999 | 26 | 1.6% |
| $25,000 to $34,999 | 49 | 3.1% |
| $35,000 to $49,999 | 235 | 14.7% |
| $50,000 to $74,999 | 417 | 26.1% |
| $75,000 to $99,999 | 362 | 22.7% |
| $100,000 to $149,999 | 287 | 18.0% |
| $150,000 to $199,999 | 105 | 6.6% |
| $200,000+ | 46 | 2.9% |
Family Income by Famaliy Size in Hastings
3-person families (283 | 17.7%) account for the highest median family income in Hastings with $113,902 per family, while 3-person families (283 | 17.7%) have the highest median income of $37,967 per family member.
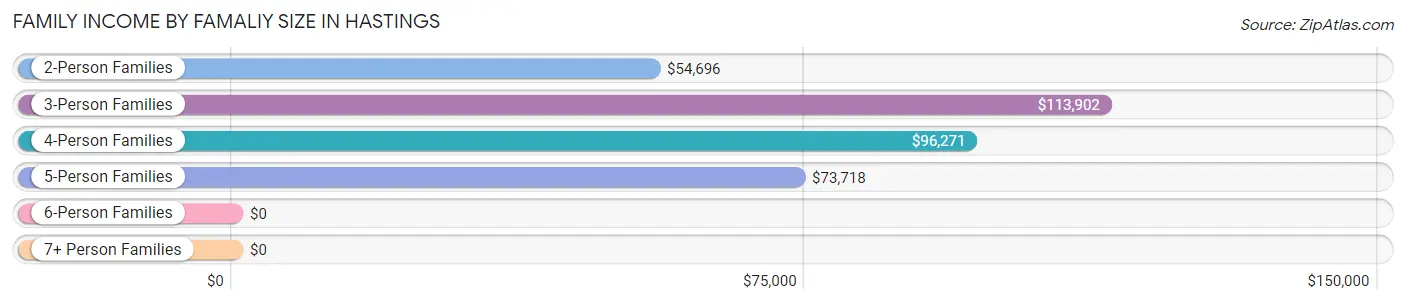
| Income Bracket | # Families | Median Income |
| 2-Person Families | 741 (46.4%) | $54,696 |
| 3-Person Families | 283 (17.7%) | $113,902 |
| 4-Person Families | 340 (21.3%) | $96,271 |
| 5-Person Families | 192 (12.0%) | $73,718 |
| 6-Person Families | 40 (2.5%) | $0 |
| 7+ Person Families | 0 (0.0%) | $0 |
| Total | 1,596 (100.0%) | $75,069 |
Family Income by Number of Earners in Hastings
The median family income in Hastings is $75,069, with families comprising 3+ earners (399) having the highest median family income of $96,716, while families with no earners (288) have the lowest median family income of $50,893, accounting for 25.0% and 18.0% of families, respectively.
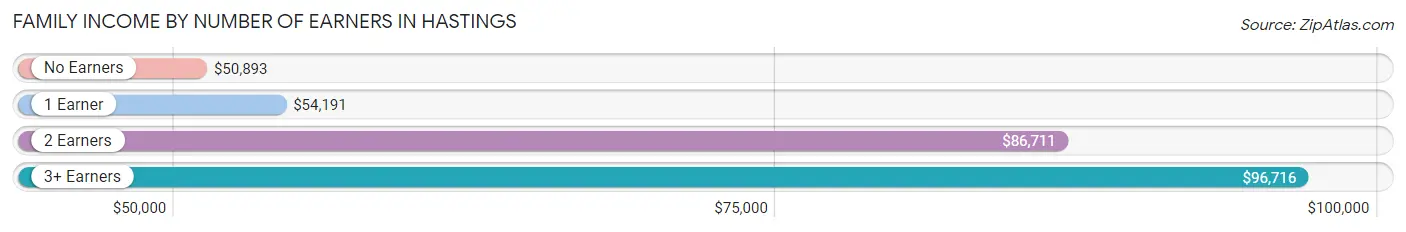
| Number of Earners | # Families | Median Income |
| No Earners | 288 (18.0%) | $50,893 |
| 1 Earner | 457 (28.6%) | $54,191 |
| 2 Earners | 452 (28.3%) | $86,711 |
| 3+ Earners | 399 (25.0%) | $96,716 |
| Total | 1,596 (100.0%) | $75,069 |
Household Income in Hastings
Household Income Brackets in Hastings
With 753 households falling in the category, the $35,000 to $49,999 income range is the most frequent in Hastings, accounting for 23.1% of all households. In contrast, only 29 households (0.9%) fall into the $10,000 to $14,999 income bracket, making it the least populous group.
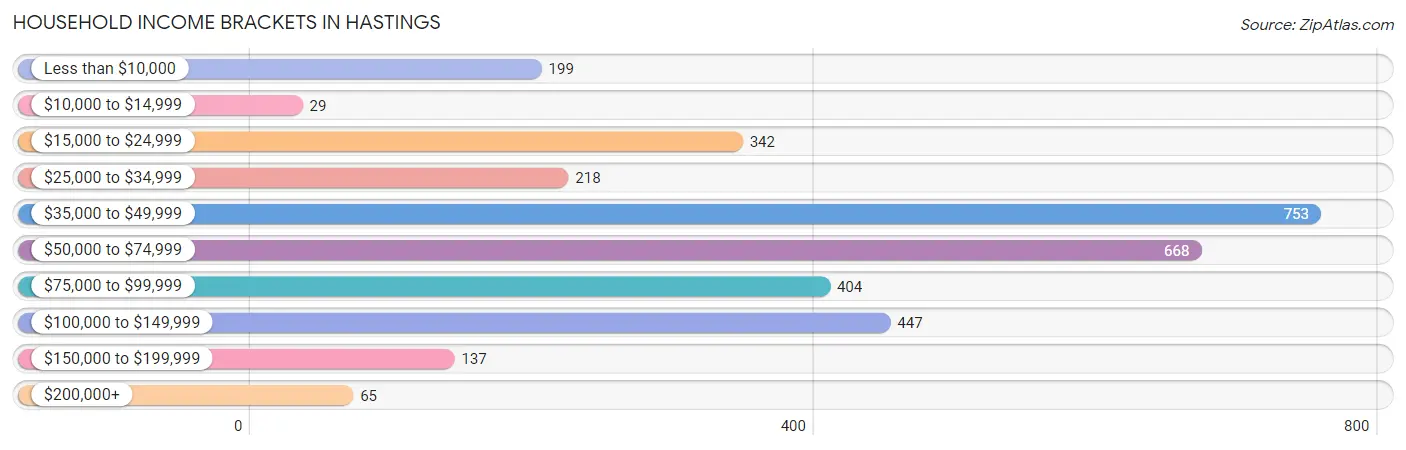
| Income Bracket | # Households | % Households |
| Less than $10,000 | 199 | 6.1% |
| $10,000 to $14,999 | 29 | 0.9% |
| $15,000 to $24,999 | 342 | 10.5% |
| $25,000 to $34,999 | 218 | 6.7% |
| $35,000 to $49,999 | 753 | 23.1% |
| $50,000 to $74,999 | 668 | 20.5% |
| $75,000 to $99,999 | 404 | 12.4% |
| $100,000 to $149,999 | 447 | 13.7% |
| $150,000 to $199,999 | 137 | 4.2% |
| $200,000+ | 65 | 2.0% |
Household Income by Householder Age in Hastings
The median household income in Hastings is $54,118, with the highest median household income of $68,147 found in the 45 to 64 years age bracket for the primary householder. A total of 1,093 households (33.5%) fall into this category. Meanwhile, the 65+ years age bracket for the primary householder has the lowest median household income of $45,157, with 1,088 households (33.4%) in this group.
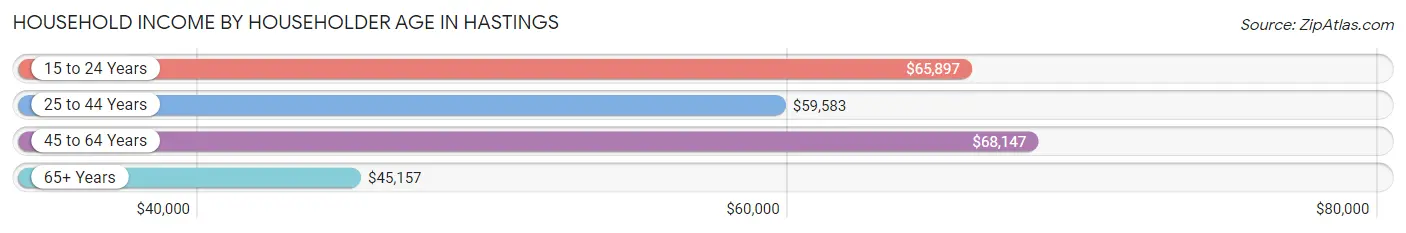
| Income Bracket | # Households | Median Income |
| 15 to 24 Years | 73 (2.2%) | $65,897 |
| 25 to 44 Years | 1,006 (30.9%) | $59,583 |
| 45 to 64 Years | 1,093 (33.5%) | $68,147 |
| 65+ Years | 1,088 (33.4%) | $45,157 |
| Total | 3,260 (100.0%) | $54,118 |
Poverty in Hastings
Income Below Poverty by Sex and Age in Hastings
With 8.3% poverty level for males and 8.9% for females among the residents of Hastings, 15 year old males and 5 year old females are the most vulnerable to poverty, with 23 males (22.1%) and 24 females (25.0%) in their respective age groups living below the poverty level.
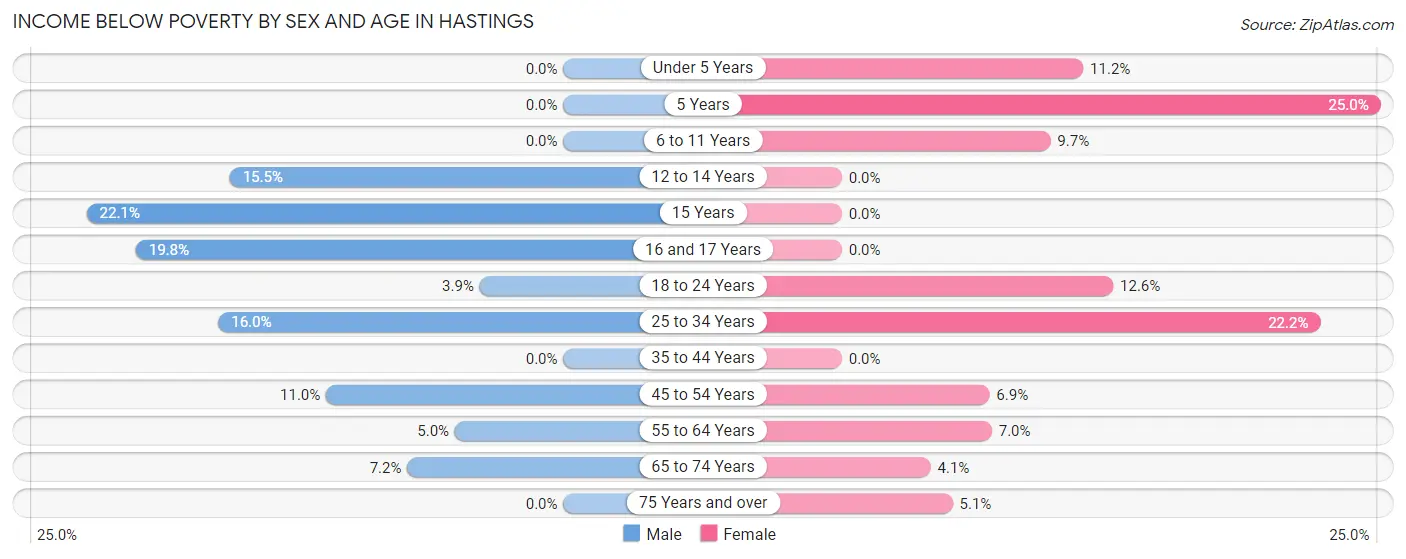
| Age Bracket | Male | Female |
| Under 5 Years | 0 (0.0%) | 27 (11.2%) |
| 5 Years | 0 (0.0%) | 24 (25.0%) |
| 6 to 11 Years | 0 (0.0%) | 24 (9.7%) |
| 12 to 14 Years | 26 (15.5%) | 0 (0.0%) |
| 15 Years | 23 (22.1%) | 0 (0.0%) |
| 16 and 17 Years | 25 (19.8%) | 0 (0.0%) |
| 18 to 24 Years | 18 (3.9%) | 54 (12.6%) |
| 25 to 34 Years | 81 (16.0%) | 127 (22.2%) |
| 35 to 44 Years | 0 (0.0%) | 0 (0.0%) |
| 45 to 54 Years | 58 (11.0%) | 35 (6.9%) |
| 55 to 64 Years | 10 (5.0%) | 25 (7.0%) |
| 65 to 74 Years | 32 (7.2%) | 26 (4.1%) |
| 75 Years and over | 0 (0.0%) | 19 (5.1%) |
| Total | 273 (8.3%) | 361 (8.9%) |
Income Above Poverty by Sex and Age in Hastings
According to the poverty statistics in Hastings, males aged under 5 years and females aged 12 to 14 years are the age groups that are most secure financially, with 100.0% of males and 100.0% of females in these age groups living above the poverty line.
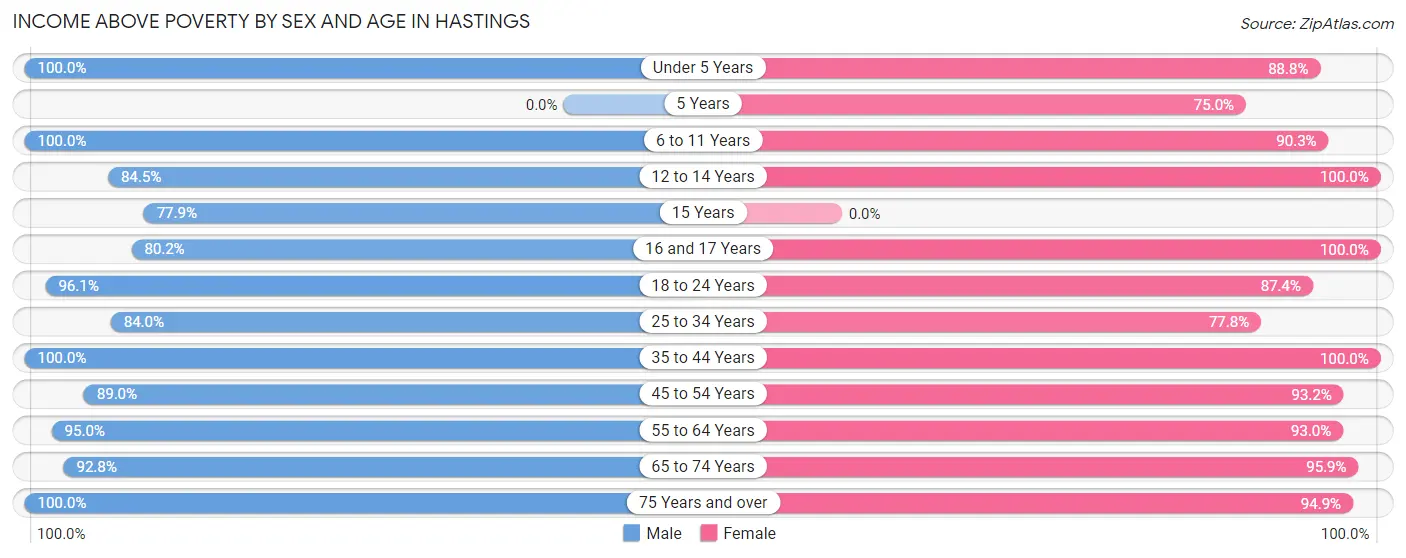
| Age Bracket | Male | Female |
| Under 5 Years | 103 (100.0%) | 214 (88.8%) |
| 5 Years | 0 (0.0%) | 72 (75.0%) |
| 6 to 11 Years | 140 (100.0%) | 224 (90.3%) |
| 12 to 14 Years | 142 (84.5%) | 67 (100.0%) |
| 15 Years | 81 (77.9%) | 0 (0.0%) |
| 16 and 17 Years | 101 (80.2%) | 138 (100.0%) |
| 18 to 24 Years | 446 (96.1%) | 375 (87.4%) |
| 25 to 34 Years | 425 (84.0%) | 445 (77.8%) |
| 35 to 44 Years | 381 (100.0%) | 414 (100.0%) |
| 45 to 54 Years | 469 (89.0%) | 476 (93.1%) |
| 55 to 64 Years | 189 (95.0%) | 334 (93.0%) |
| 65 to 74 Years | 410 (92.8%) | 605 (95.9%) |
| 75 Years and over | 139 (100.0%) | 351 (94.9%) |
| Total | 3,026 (91.7%) | 3,715 (91.1%) |
Income Below Poverty Among Married-Couple Families in Hastings
The poverty statistics for married-couple families in Hastings show that 2.3% or 27 of the total 1,157 families live below the poverty line. Families with no children have the highest poverty rate of 3.6%, comprising of 27 families. On the other hand, families with 1 or 2 children have the lowest poverty rate of 0.0%, which includes 0 families.
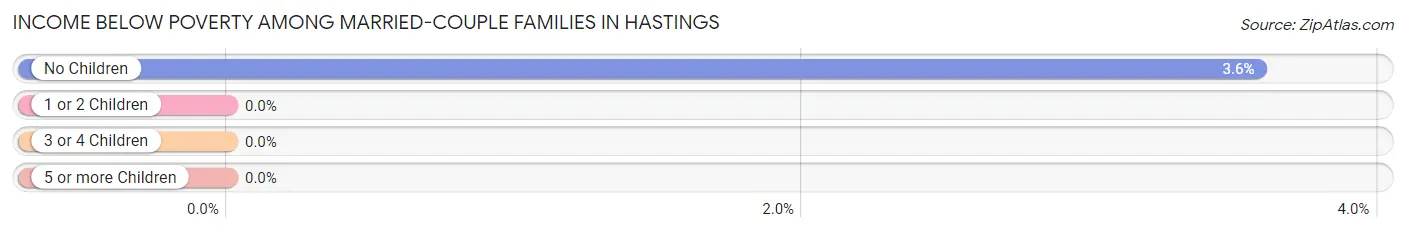
| Children | Above Poverty | Below Poverty |
| No Children | 727 (96.4%) | 27 (3.6%) |
| 1 or 2 Children | 261 (100.0%) | 0 (0.0%) |
| 3 or 4 Children | 142 (100.0%) | 0 (0.0%) |
| 5 or more Children | 0 (0.0%) | 0 (0.0%) |
| Total | 1,130 (97.7%) | 27 (2.3%) |
Income Below Poverty Among Single-Parent Households in Hastings
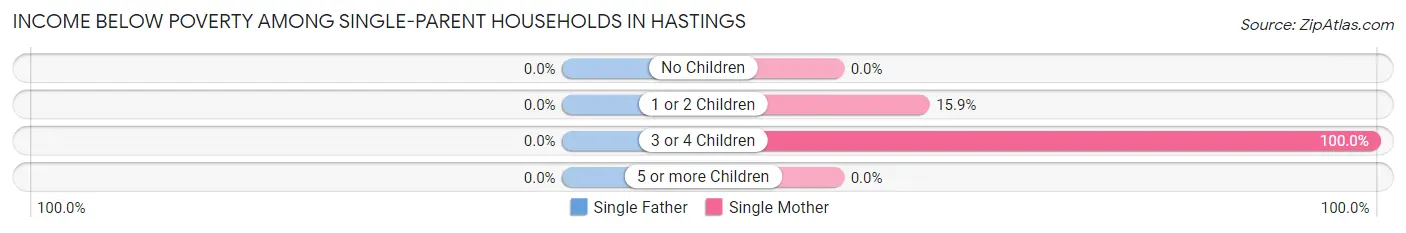
| Children | Single Father | Single Mother |
| No Children | 0 (0.0%) | 0 (0.0%) |
| 1 or 2 Children | 0 (0.0%) | 47 (15.9%) |
| 3 or 4 Children | 0 (0.0%) | 21 (100.0%) |
| 5 or more Children | 0 (0.0%) | 0 (0.0%) |
| Total | 0 (0.0%) | 68 (20.8%) |
Income Below Poverty Among Married-Couple vs Single-Parent Households in Hastings
The poverty data for Hastings shows that 27 of the married-couple family households (2.3%) and 68 of the single-parent households (15.5%) are living below the poverty level. Within the married-couple family households, those with no children have the highest poverty rate, with 27 households (3.6%) falling below the poverty line. Among the single-parent households, those with 3 or 4 children have the highest poverty rate, with 21 household (100.0%) living below poverty.
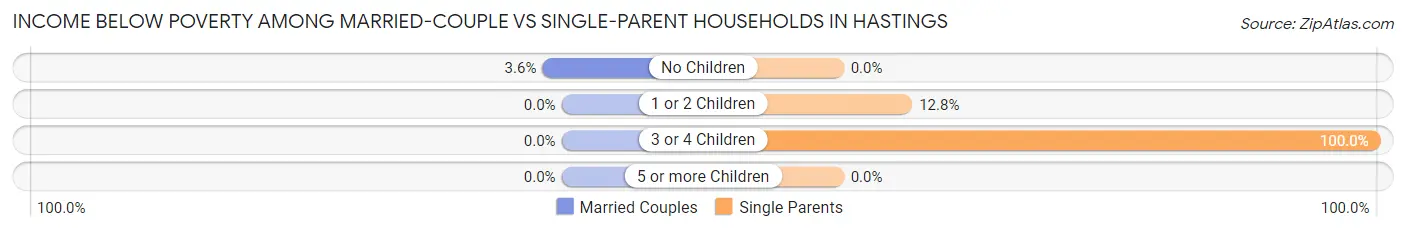
| Children | Married-Couple Families | Single-Parent Households |
| No Children | 27 (3.6%) | 0 (0.0%) |
| 1 or 2 Children | 0 (0.0%) | 47 (12.8%) |
| 3 or 4 Children | 0 (0.0%) | 21 (100.0%) |
| 5 or more Children | 0 (0.0%) | 0 (0.0%) |
| Total | 27 (2.3%) | 68 (15.5%) |
Race in Hastings
The most populous races in Hastings are White / Caucasian (7,328 | 97.7%), Hispanic or Latino (414 | 5.5%), and Two or more Races (101 | 1.3%).
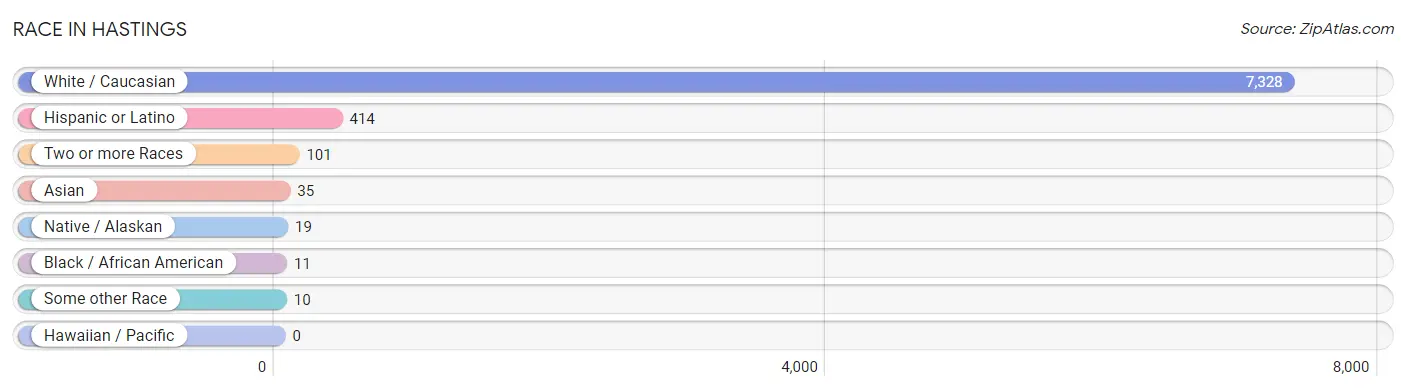
| Race | # Population | % Population |
| Asian | 35 | 0.5% |
| Black / African American | 11 | 0.2% |
| Hawaiian / Pacific | 0 | 0.0% |
| Hispanic or Latino | 414 | 5.5% |
| Native / Alaskan | 19 | 0.3% |
| White / Caucasian | 7,328 | 97.7% |
| Two or more Races | 101 | 1.3% |
| Some other Race | 10 | 0.1% |
| Total | 7,504 | 100.0% |
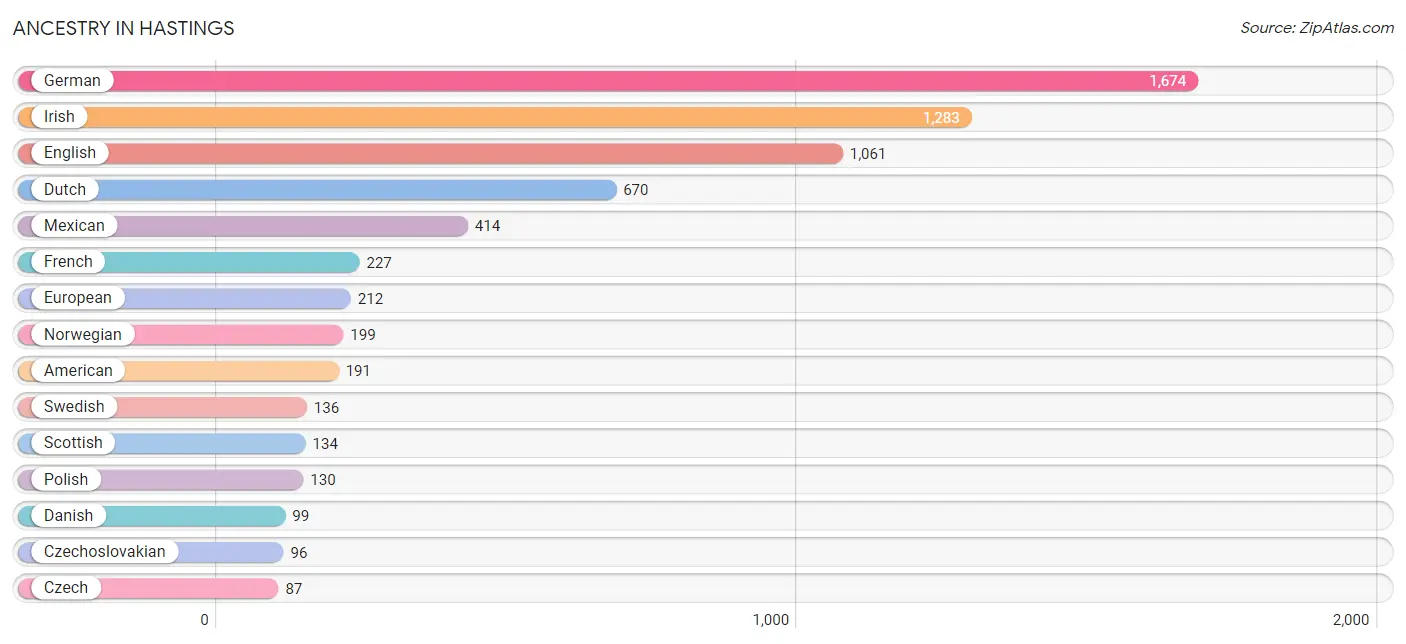
Ancestry in Hastings
The most populous ancestries reported in Hastings are German (1,674 | 22.3%), Irish (1,283 | 17.1%), English (1,061 | 14.1%), Dutch (670 | 8.9%), and Mexican (414 | 5.5%), together accounting for 68.0% of all Hastings residents.
| Ancestry | # Population | % Population |
| American | 191 | 2.5% |
| Austrian | 14 | 0.2% |
| Bhutanese | 31 | 0.4% |
| British | 43 | 0.6% |
| Chickasaw | 10 | 0.1% |
| Chippewa | 19 | 0.3% |
| Czech | 87 | 1.2% |
| Czechoslovakian | 96 | 1.3% |
| Danish | 99 | 1.3% |
| Dutch | 670 | 8.9% |
| English | 1,061 | 14.1% |
| European | 212 | 2.8% |
| French | 227 | 3.0% |
| French Canadian | 49 | 0.6% |
| German | 1,674 | 22.3% |
| Greek | 35 | 0.5% |
| Hungarian | 31 | 0.4% |
| Irish | 1,283 | 17.1% |
| Italian | 69 | 0.9% |
| Mexican | 414 | 5.5% |
| Norwegian | 199 | 2.6% |
| Pennsylvania German | 14 | 0.2% |
| Polish | 130 | 1.7% |
| Scandinavian | 41 | 0.5% |
| Scotch-Irish | 71 | 0.9% |
| Scottish | 134 | 1.8% |
| Sioux | 8 | 0.1% |
| Slavic | 25 | 0.3% |
| Swedish | 136 | 1.8% |
| Swiss | 41 | 0.5% |
| Thai | 4 | 0.1% |
| Ukrainian | 8 | 0.1% |
| Welsh | 50 | 0.7% | View All 33 Rows |
Immigrants in Hastings
The most numerous immigrant groups reported in Hastings came from Canada (40 | 0.5%), Asia (35 | 0.5%), Eastern Asia (31 | 0.4%), Japan (31 | 0.4%), and Europe (22 | 0.3%), together accounting for 2.1% of all Hastings residents.
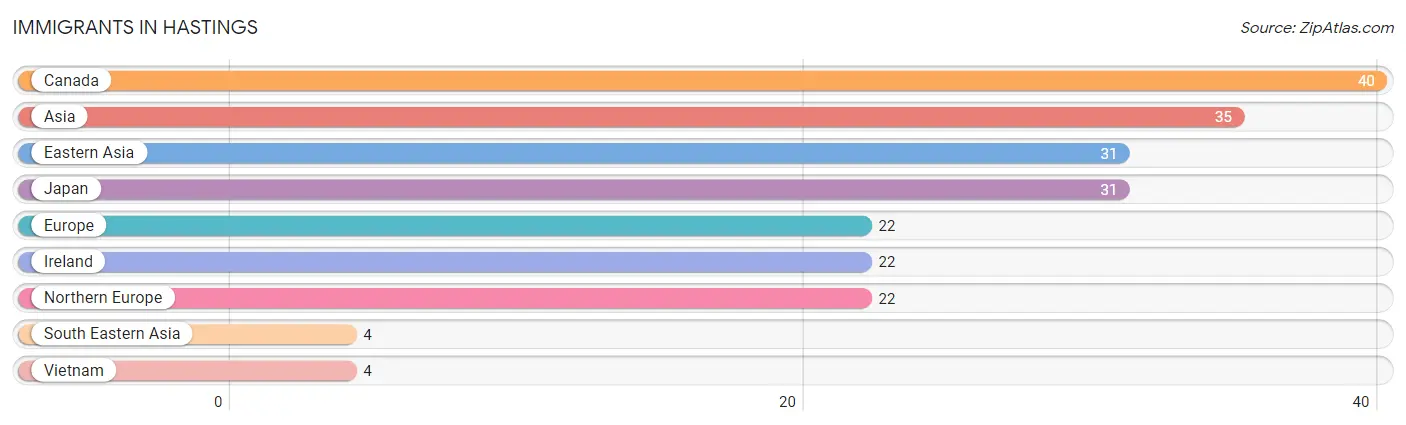
| Immigration Origin | # Population | % Population |
| Asia | 35 | 0.5% |
| Canada | 40 | 0.5% |
| Eastern Asia | 31 | 0.4% |
| Europe | 22 | 0.3% |
| Ireland | 22 | 0.3% |
| Japan | 31 | 0.4% |
| Northern Europe | 22 | 0.3% |
| South Eastern Asia | 4 | 0.1% |
| Vietnam | 4 | 0.1% | View All 9 Rows |
Sex and Age in Hastings
Sex and Age in Hastings
The most populous age groups in Hastings are 50 to 54 Years (386 | 11.4%) for men and 20 to 24 Years (407 | 9.9%) for women.
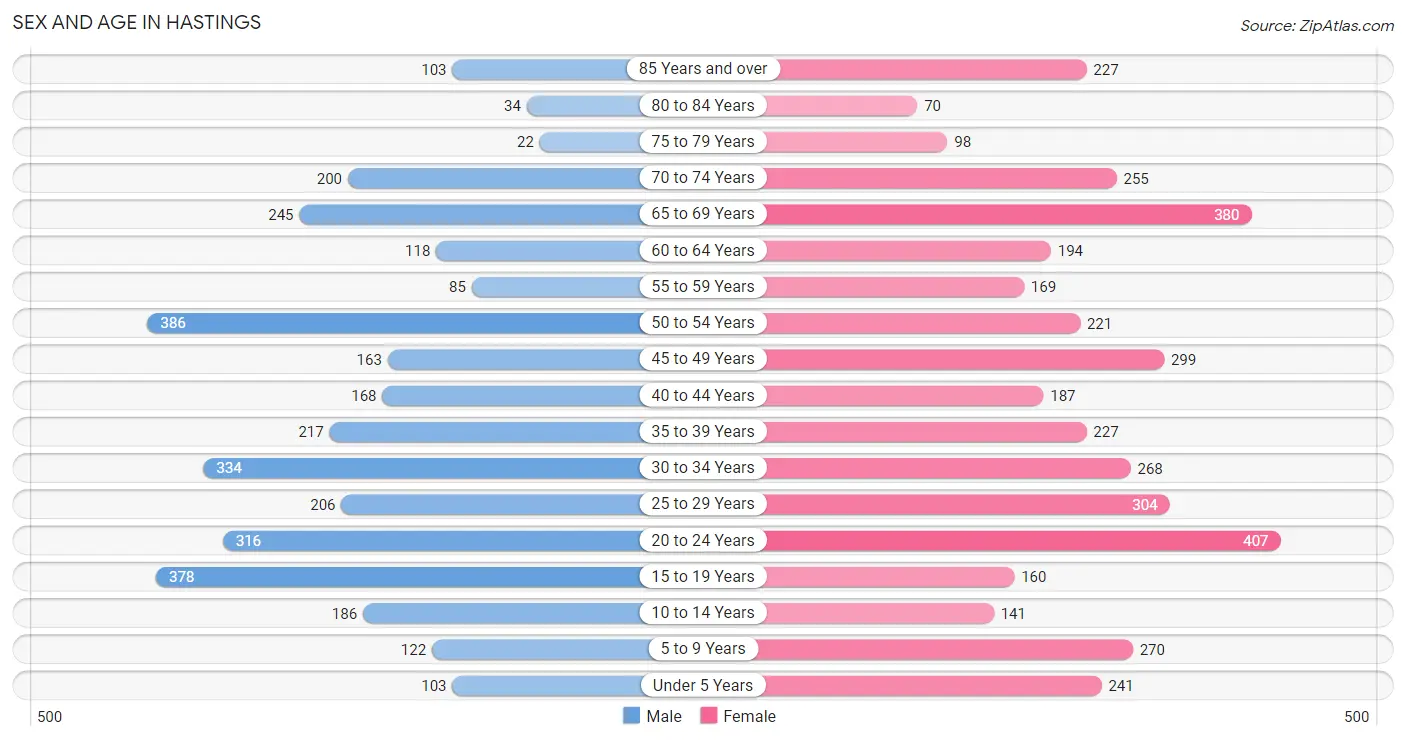
| Age Bracket | Male | Female |
| Under 5 Years | 103 (3.0%) | 241 (5.9%) |
| 5 to 9 Years | 122 (3.6%) | 270 (6.6%) |
| 10 to 14 Years | 186 (5.5%) | 141 (3.4%) |
| 15 to 19 Years | 378 (11.2%) | 160 (3.9%) |
| 20 to 24 Years | 316 (9.3%) | 407 (9.9%) |
| 25 to 29 Years | 206 (6.1%) | 304 (7.4%) |
| 30 to 34 Years | 334 (9.9%) | 268 (6.5%) |
| 35 to 39 Years | 217 (6.4%) | 227 (5.5%) |
| 40 to 44 Years | 168 (5.0%) | 187 (4.5%) |
| 45 to 49 Years | 163 (4.8%) | 299 (7.3%) |
| 50 to 54 Years | 386 (11.4%) | 221 (5.4%) |
| 55 to 59 Years | 85 (2.5%) | 169 (4.1%) |
| 60 to 64 Years | 118 (3.5%) | 194 (4.7%) |
| 65 to 69 Years | 245 (7.2%) | 380 (9.2%) |
| 70 to 74 Years | 200 (5.9%) | 255 (6.2%) |
| 75 to 79 Years | 22 (0.6%) | 98 (2.4%) |
| 80 to 84 Years | 34 (1.0%) | 70 (1.7%) |
| 85 Years and over | 103 (3.0%) | 227 (5.5%) |
| Total | 3,386 (100.0%) | 4,118 (100.0%) |
Families and Households in Hastings
Median Family Size in Hastings
The median family size in Hastings is 3.23 persons per family, with single female/mother families (327 | 20.5%) accounting for the largest median family size of 3.86 persons per family. On the other hand, single male/father families (112 | 7.0%) represent the smallest median family size with 3.01 persons per family.
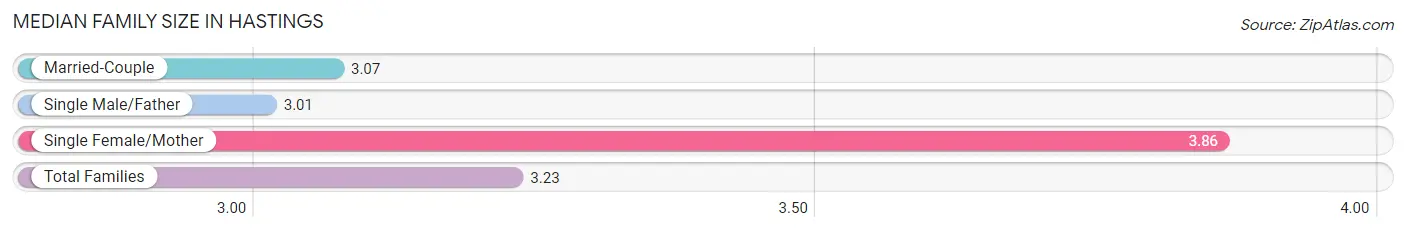
| Family Type | # Families | Family Size |
| Married-Couple | 1,157 (72.5%) | 3.07 |
| Single Male/Father | 112 (7.0%) | 3.01 |
| Single Female/Mother | 327 (20.5%) | 3.86 |
| Total Families | 1,596 (100.0%) | 3.23 |
Median Household Size in Hastings
The median household size in Hastings is 2.26 persons per household, with single female/mother households (327 | 10.0%) accounting for the largest median household size of 4.44 persons per household. non-family households (1,664 | 51.0%) represent the smallest median household size with 1.20 persons per household.
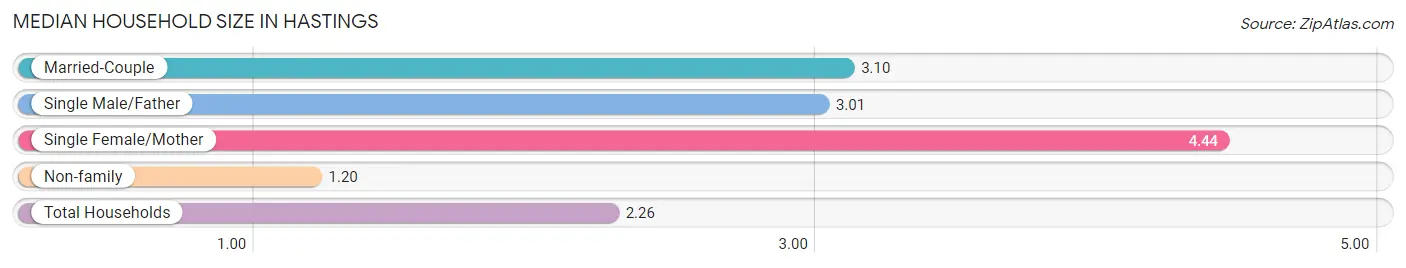
| Household Type | # Households | Household Size |
| Married-Couple | 1,157 (35.5%) | 3.10 |
| Single Male/Father | 112 (3.4%) | 3.01 |
| Single Female/Mother | 327 (10.0%) | 4.44 |
| Non-family | 1,664 (51.0%) | 1.20 |
| Total Households | 3,260 (100.0%) | 2.26 |
Household Size by Marriage Status in Hastings
Out of a total of 3,260 households in Hastings, 1,596 (49.0%) are family households, while 1,664 (51.0%) are nonfamily households. The most numerous type of family households are 2-person households, comprising 709, and the most common type of nonfamily households are 1-person households, comprising 1,449.
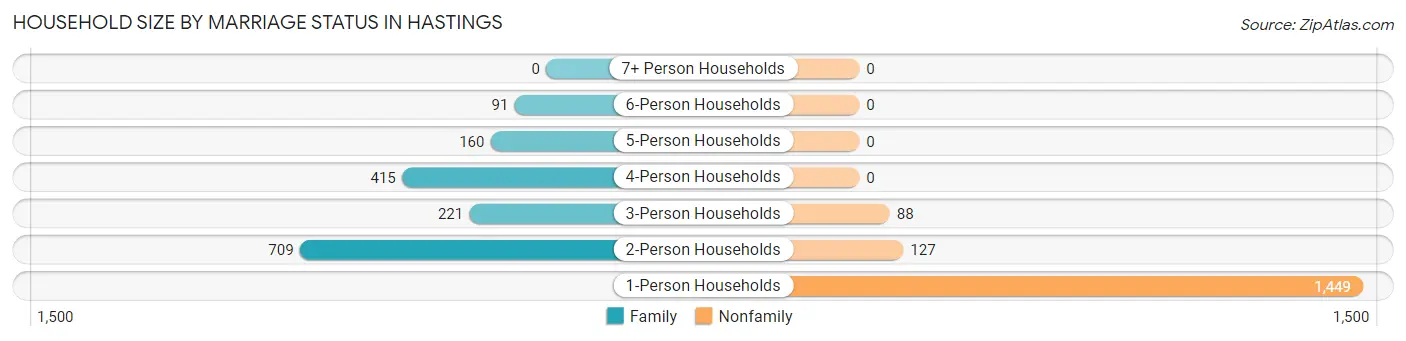
| Household Size | Family Households | Nonfamily Households |
| 1-Person Households | - | 1,449 (44.5%) |
| 2-Person Households | 709 (21.7%) | 127 (3.9%) |
| 3-Person Households | 221 (6.8%) | 88 (2.7%) |
| 4-Person Households | 415 (12.7%) | 0 (0.0%) |
| 5-Person Households | 160 (4.9%) | 0 (0.0%) |
| 6-Person Households | 91 (2.8%) | 0 (0.0%) |
| 7+ Person Households | 0 (0.0%) | 0 (0.0%) |
| Total | 1,596 (49.0%) | 1,664 (51.0%) |
Female Fertility in Hastings
Fertility by Age in Hastings
Average fertility rate in Hastings is 14.0 births per 1,000 women. Women in the age bracket of 15 to 19 years have the highest fertility rate with 63.0 births per 1,000 women. Women in the age bracket of 20 to 34 years acount for 63.0% of all women with births.
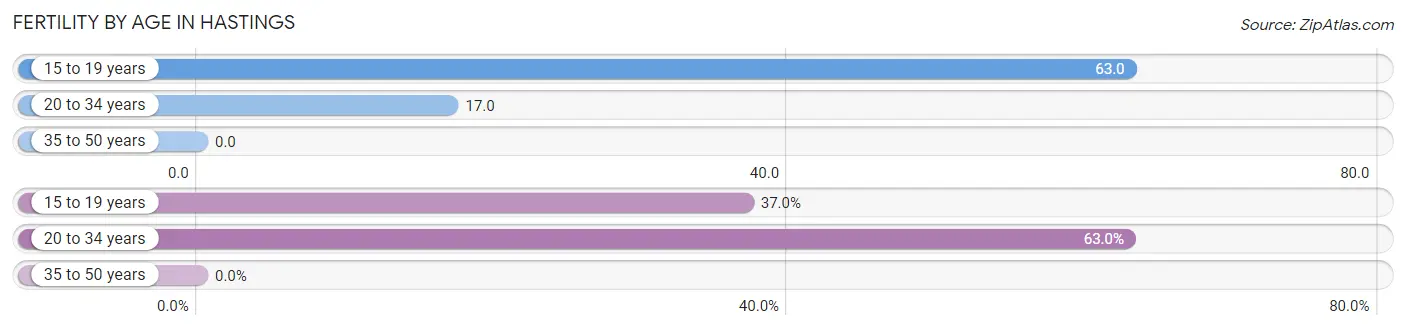
| Age Bracket | Women with Births | Births / 1,000 Women |
| 15 to 19 years | 10 (37.0%) | 63.0 |
| 20 to 34 years | 17 (63.0%) | 17.0 |
| 35 to 50 years | 0 (0.0%) | 0.0 |
| Total | 27 (100.0%) | 14.0 |
Fertility by Age by Marriage Status in Hastings
63.0% of women with births (27) in Hastings are married. The highest percentage of unmarried women with births falls into 15 to 19 years age bracket with 100.0% of them unmarried at the time of birth, while the lowest percentage of unmarried women with births belong to 20 to 34 years age bracket with 0.0% of them unmarried.
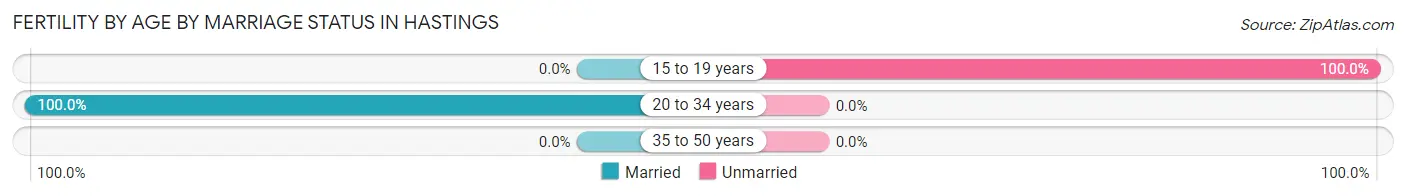
| Age Bracket | Married | Unmarried |
| 15 to 19 years | 0 (0.0%) | 10 (100.0%) |
| 20 to 34 years | 17 (100.0%) | 0 (0.0%) |
| 35 to 50 years | 0 (0.0%) | 0 (0.0%) |
| Total | 17 (63.0%) | 10 (37.0%) |
Fertility by Education in Hastings
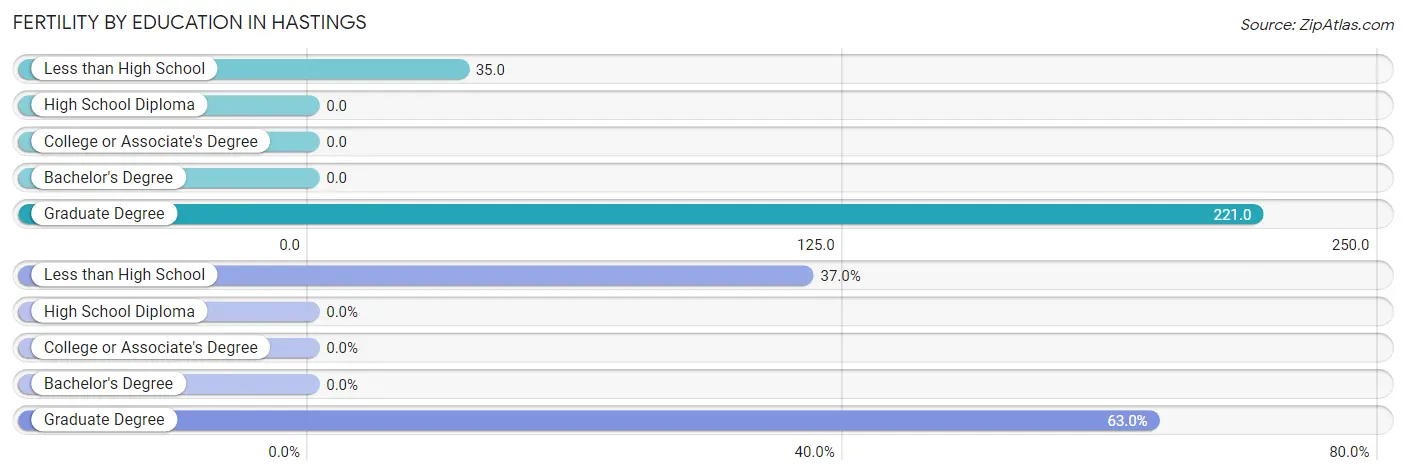
| Educational Attainment | Women with Births | Births / 1,000 Women |
| Less than High School | 10 (37.0%) | 35.0 |
| High School Diploma | 0 (0.0%) | 0.0 |
| College or Associate's Degree | 0 (0.0%) | 0.0 |
| Bachelor's Degree | 0 (0.0%) | 0.0 |
| Graduate Degree | 17 (63.0%) | 221.0 |
| Total | 27 (100.0%) | 14.0 |
Fertility by Education by Marriage Status in Hastings
37.0% of women with births in Hastings are unmarried. Women with the educational attainment of graduate degree are most likely to be married with 100.0% of them married at childbirth, while women with the educational attainment of less than high school are least likely to be married with 100.0% of them unmarried at childbirth.
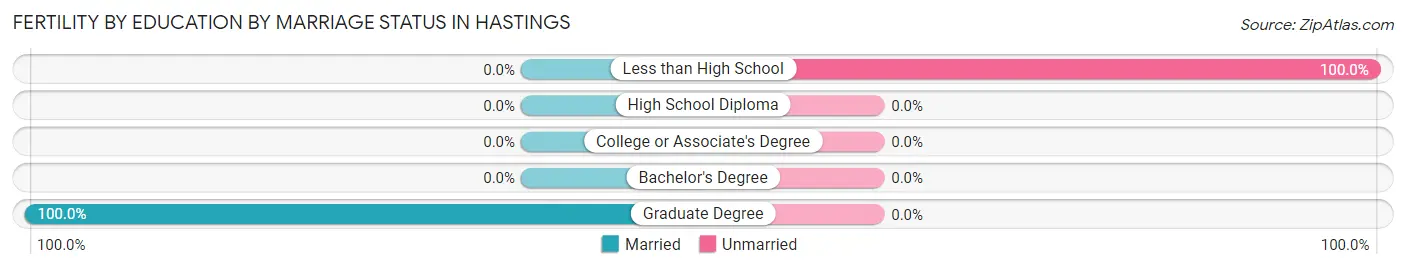
| Educational Attainment | Married | Unmarried |
| Less than High School | 0 (0.0%) | 10 (100.0%) |
| High School Diploma | 0 (0.0%) | 0 (0.0%) |
| College or Associate's Degree | 0 (0.0%) | 0 (0.0%) |
| Bachelor's Degree | 0 (0.0%) | 0 (0.0%) |
| Graduate Degree | 17 (100.0%) | 0 (0.0%) |
| Total | 17 (63.0%) | 10 (37.0%) |
Employment Characteristics in Hastings
Employment by Class of Employer in Hastings
Among the 3,241 employed individuals in Hastings, private company employees (2,447 | 75.5%), not-for-profit organizations (343 | 10.6%), and self-employed (not incorporated) (133 | 4.1%) make up the most common classes of employment.
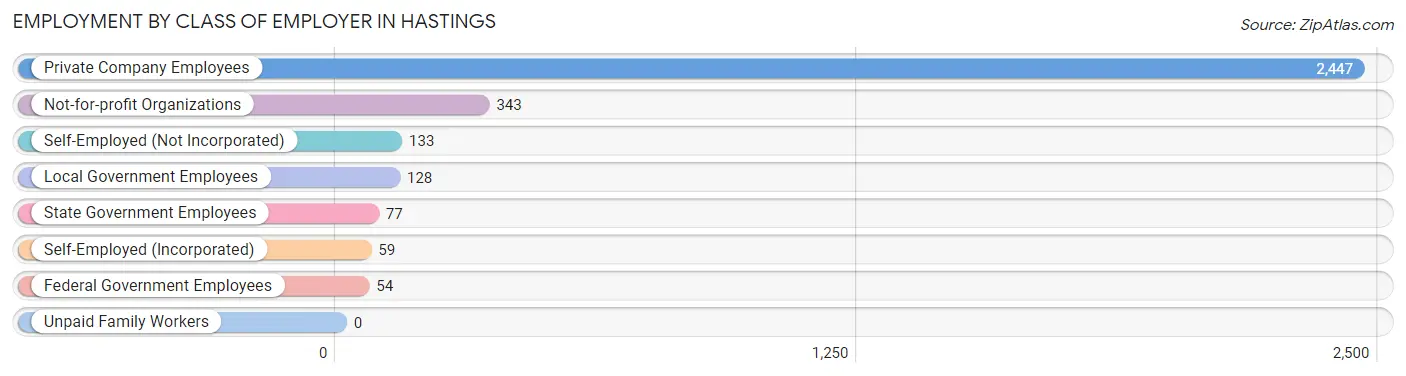
| Employer Class | # Employees | % Employees |
| Private Company Employees | 2,447 | 75.5% |
| Self-Employed (Incorporated) | 59 | 1.8% |
| Self-Employed (Not Incorporated) | 133 | 4.1% |
| Not-for-profit Organizations | 343 | 10.6% |
| Local Government Employees | 128 | 4.0% |
| State Government Employees | 77 | 2.4% |
| Federal Government Employees | 54 | 1.7% |
| Unpaid Family Workers | 0 | 0.0% |
| Total | 3,241 | 100.0% |
Employment Status by Age in Hastings
According to the labor force statistics for Hastings, out of the total population over 16 years of age (6,337), 56.8% or 3,599 individuals are in the labor force, with 6.5% or 234 of them unemployed. The age group with the highest labor force participation rate is 20 to 24 years, with 91.1% or 659 individuals in the labor force. Within the labor force, the 60 to 64 years age range has the highest percentage of unemployed individuals, with 17.6% or 25 of them being unemployed.
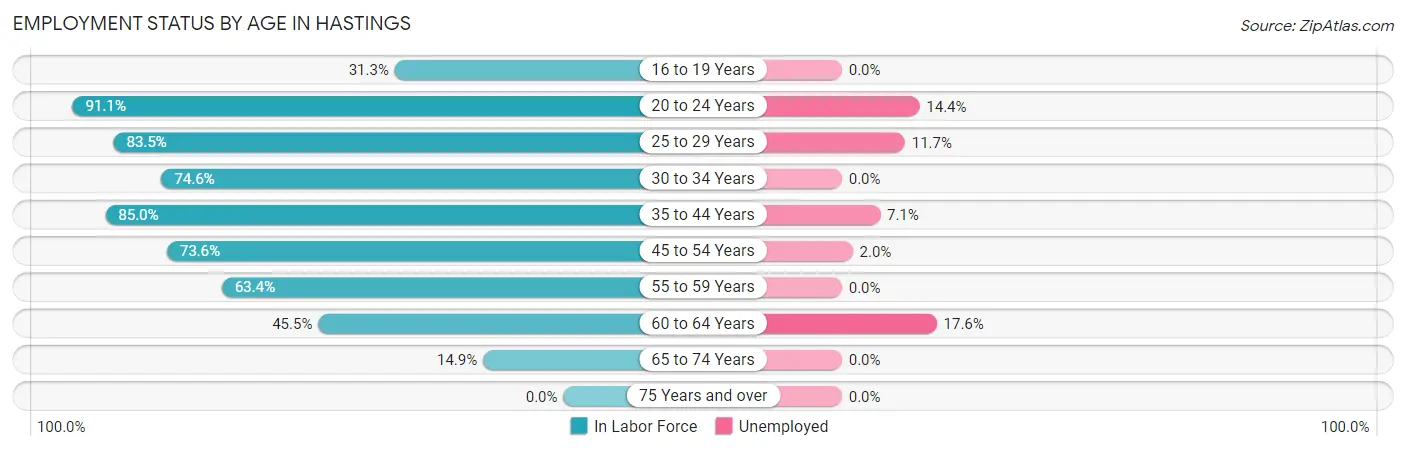
| Age Bracket | In Labor Force | Unemployed |
| 16 to 19 Years | 136 (31.3%) | 0 (0.0%) |
| 20 to 24 Years | 659 (91.1%) | 95 (14.4%) |
| 25 to 29 Years | 426 (83.5%) | 50 (11.7%) |
| 30 to 34 Years | 449 (74.6%) | 0 (0.0%) |
| 35 to 44 Years | 679 (85.0%) | 48 (7.1%) |
| 45 to 54 Years | 787 (73.6%) | 16 (2.0%) |
| 55 to 59 Years | 161 (63.4%) | 0 (0.0%) |
| 60 to 64 Years | 142 (45.5%) | 25 (17.6%) |
| 65 to 74 Years | 161 (14.9%) | 0 (0.0%) |
| 75 Years and over | 0 (0.0%) | 0 (0.0%) |
| Total | 3,599 (56.8%) | 234 (6.5%) |
Employment Status by Educational Attainment in Hastings
According to labor force statistics for Hastings, 74.6% of individuals (2,645) out of the total population between 25 and 64 years of age (3,546) are in the labor force, with 5.3% or 140 of them being unemployed. The group with the highest labor force participation rate are those with the educational attainment of college / associate degree, with 84.5% or 976 individuals in the labor force. Within the labor force, individuals with less than high school education have the highest percentage of unemployment, with 8.2% or 16 of them being unemployed.
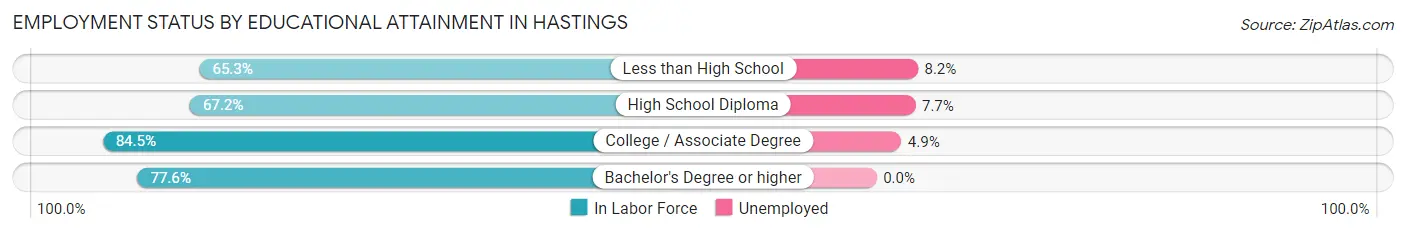
| Educational Attainment | In Labor Force | Unemployed |
| Less than High School | 194 (65.3%) | 24 (8.2%) |
| High School Diploma | 978 (67.2%) | 112 (7.7%) |
| College / Associate Degree | 976 (84.5%) | 57 (4.9%) |
| Bachelor's Degree or higher | 495 (77.6%) | 0 (0.0%) |
| Total | 2,645 (74.6%) | 188 (5.3%) |
Employment Occupations by Sex in Hastings
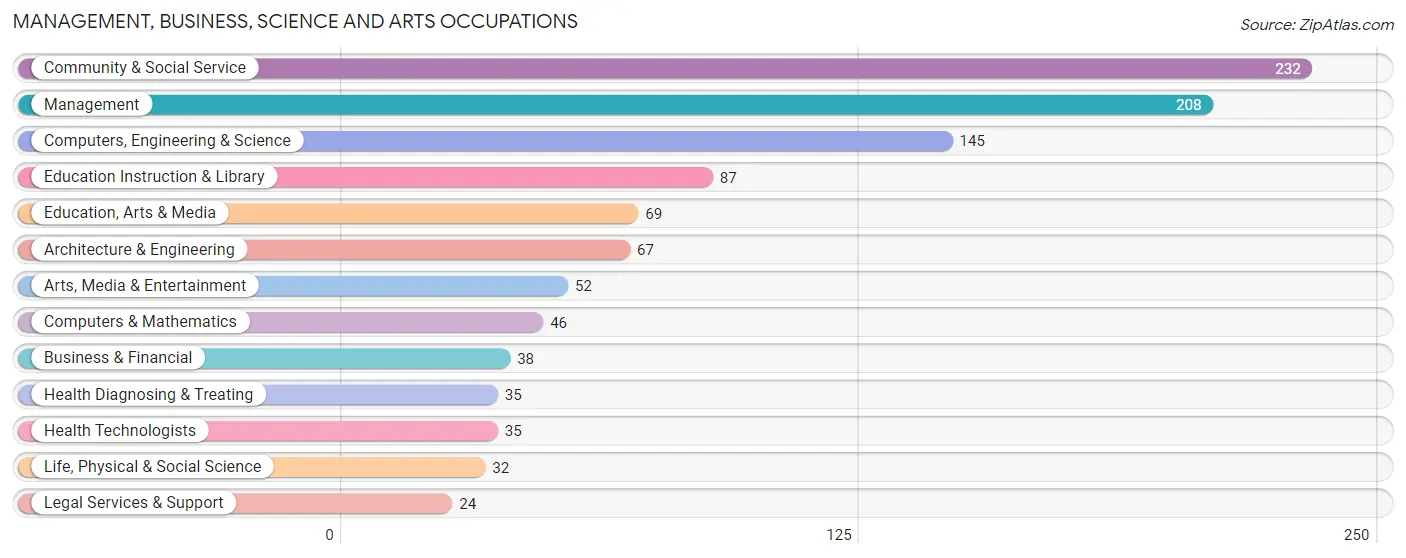
Management, Business, Science and Arts Occupations
The most common Management, Business, Science and Arts occupations in Hastings are Community & Social Service (232 | 6.9%), Management (208 | 6.2%), Computers, Engineering & Science (145 | 4.3%), Education Instruction & Library (87 | 2.6%), and Education, Arts & Media (69 | 2.1%).
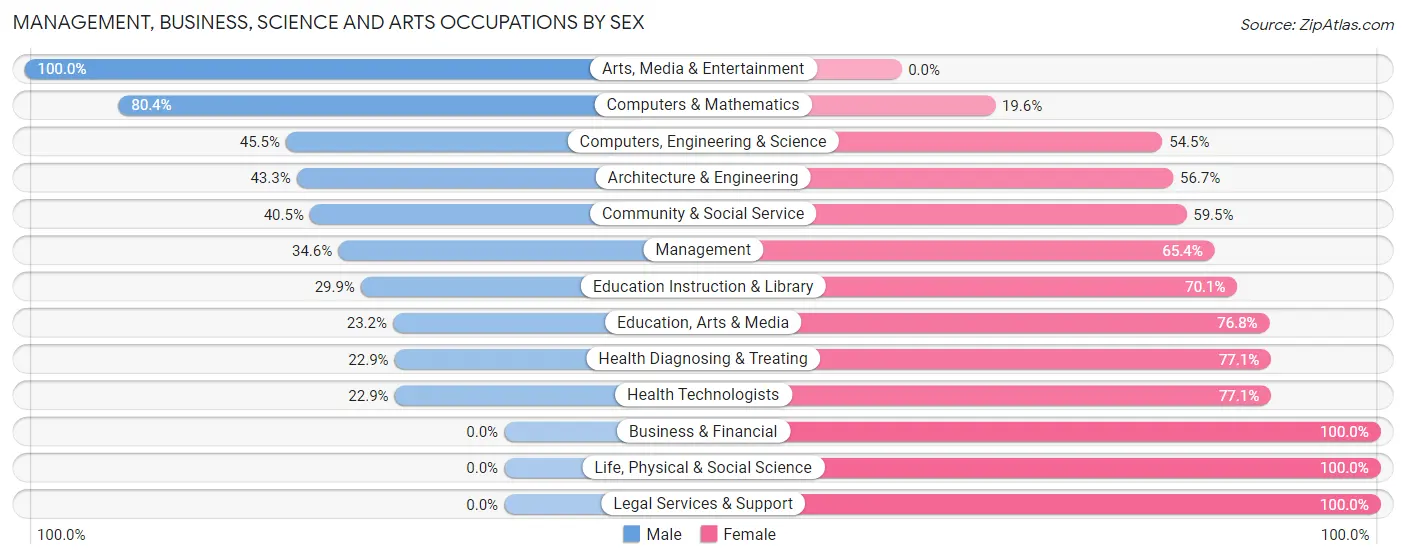
Management, Business, Science and Arts Occupations by Sex
Within the Management, Business, Science and Arts occupations in Hastings, the most male-oriented occupations are Arts, Media & Entertainment (100.0%), Computers & Mathematics (80.4%), and Computers, Engineering & Science (45.5%), while the most female-oriented occupations are Business & Financial (100.0%), Life, Physical & Social Science (100.0%), and Legal Services & Support (100.0%).
| Occupation | Male | Female |
| Management | 72 (34.6%) | 136 (65.4%) |
| Business & Financial | 0 (0.0%) | 38 (100.0%) |
| Computers, Engineering & Science | 66 (45.5%) | 79 (54.5%) |
| Computers & Mathematics | 37 (80.4%) | 9 (19.6%) |
| Architecture & Engineering | 29 (43.3%) | 38 (56.7%) |
| Life, Physical & Social Science | 0 (0.0%) | 32 (100.0%) |
| Community & Social Service | 94 (40.5%) | 138 (59.5%) |
| Education, Arts & Media | 16 (23.2%) | 53 (76.8%) |
| Legal Services & Support | 0 (0.0%) | 24 (100.0%) |
| Education Instruction & Library | 26 (29.9%) | 61 (70.1%) |
| Arts, Media & Entertainment | 52 (100.0%) | 0 (0.0%) |
| Health Diagnosing & Treating | 8 (22.9%) | 27 (77.1%) |
| Health Technologists | 8 (22.9%) | 27 (77.1%) |
| Total (Category) | 240 (36.5%) | 418 (63.5%) |
| Total (Overall) | 1,537 (45.7%) | 1,829 (54.3%) |
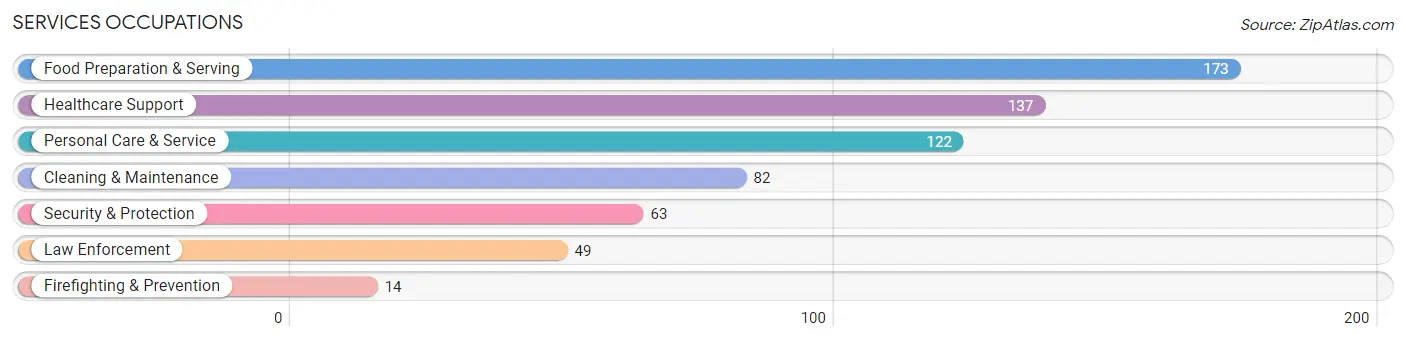
Services Occupations
The most common Services occupations in Hastings are Food Preparation & Serving (173 | 5.1%), Healthcare Support (137 | 4.1%), Personal Care & Service (122 | 3.6%), Cleaning & Maintenance (82 | 2.4%), and Security & Protection (63 | 1.9%).
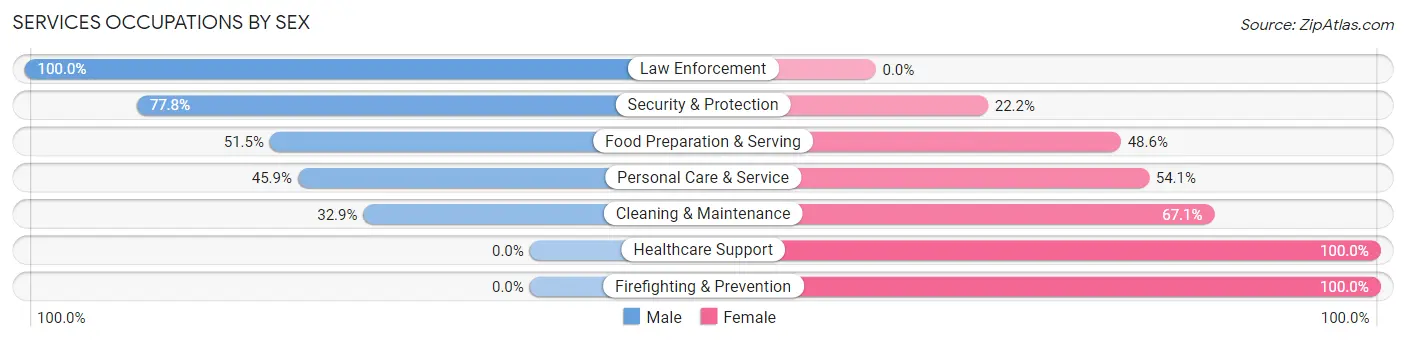
Services Occupations by Sex
Within the Services occupations in Hastings, the most male-oriented occupations are Law Enforcement (100.0%), Security & Protection (77.8%), and Food Preparation & Serving (51.4%), while the most female-oriented occupations are Healthcare Support (100.0%), Firefighting & Prevention (100.0%), and Cleaning & Maintenance (67.1%).
| Occupation | Male | Female |
| Healthcare Support | 0 (0.0%) | 137 (100.0%) |
| Security & Protection | 49 (77.8%) | 14 (22.2%) |
| Firefighting & Prevention | 0 (0.0%) | 14 (100.0%) |
| Law Enforcement | 49 (100.0%) | 0 (0.0%) |
| Food Preparation & Serving | 89 (51.4%) | 84 (48.5%) |
| Cleaning & Maintenance | 27 (32.9%) | 55 (67.1%) |
| Personal Care & Service | 56 (45.9%) | 66 (54.1%) |
| Total (Category) | 221 (38.3%) | 356 (61.7%) |
| Total (Overall) | 1,537 (45.7%) | 1,829 (54.3%) |
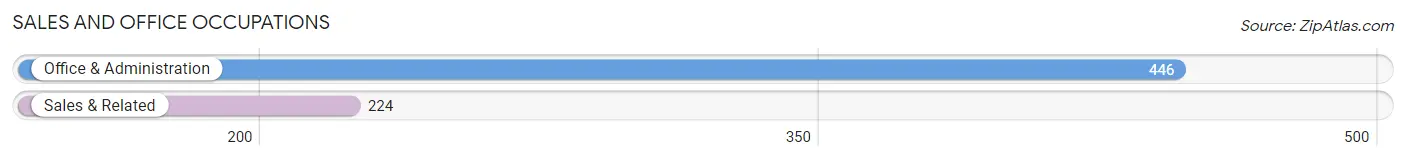
Sales and Office Occupations
The most common Sales and Office occupations in Hastings are Office & Administration (446 | 13.3%), and Sales & Related (224 | 6.7%).
Sales and Office Occupations by Sex
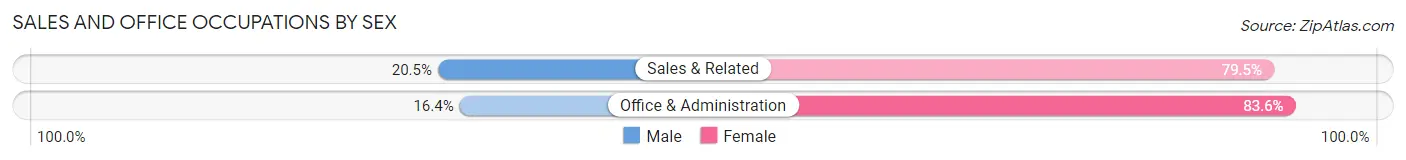
| Occupation | Male | Female |
| Sales & Related | 46 (20.5%) | 178 (79.5%) |
| Office & Administration | 73 (16.4%) | 373 (83.6%) |
| Total (Category) | 119 (17.8%) | 551 (82.2%) |
| Total (Overall) | 1,537 (45.7%) | 1,829 (54.3%) |
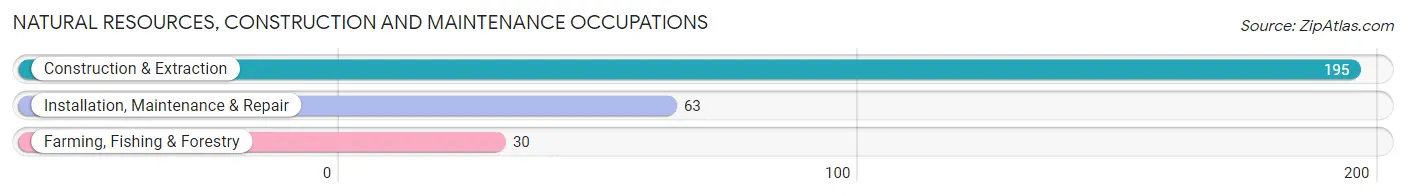
Natural Resources, Construction and Maintenance Occupations
The most common Natural Resources, Construction and Maintenance occupations in Hastings are Construction & Extraction (195 | 5.8%), Installation, Maintenance & Repair (63 | 1.9%), and Farming, Fishing & Forestry (30 | 0.9%).
Natural Resources, Construction and Maintenance Occupations by Sex
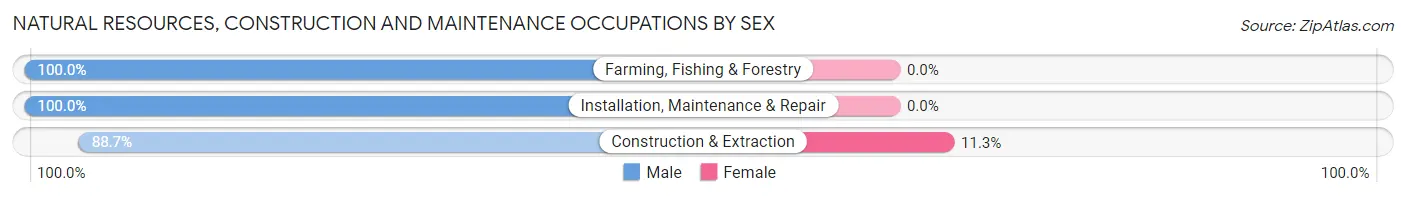
| Occupation | Male | Female |
| Farming, Fishing & Forestry | 30 (100.0%) | 0 (0.0%) |
| Construction & Extraction | 173 (88.7%) | 22 (11.3%) |
| Installation, Maintenance & Repair | 63 (100.0%) | 0 (0.0%) |
| Total (Category) | 266 (92.4%) | 22 (7.6%) |
| Total (Overall) | 1,537 (45.7%) | 1,829 (54.3%) |
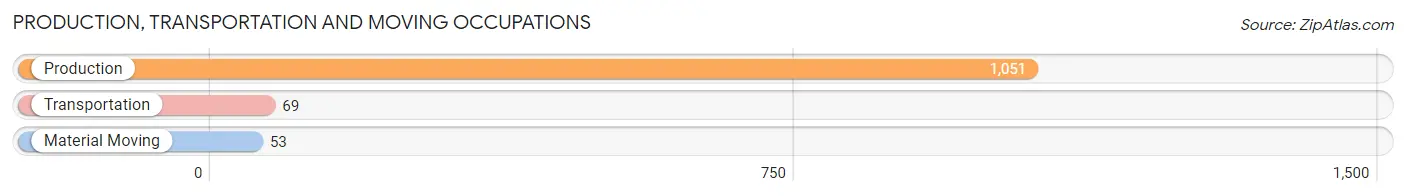
Production, Transportation and Moving Occupations
The most common Production, Transportation and Moving occupations in Hastings are Production (1,051 | 31.2%), Transportation (69 | 2.1%), and Material Moving (53 | 1.6%).
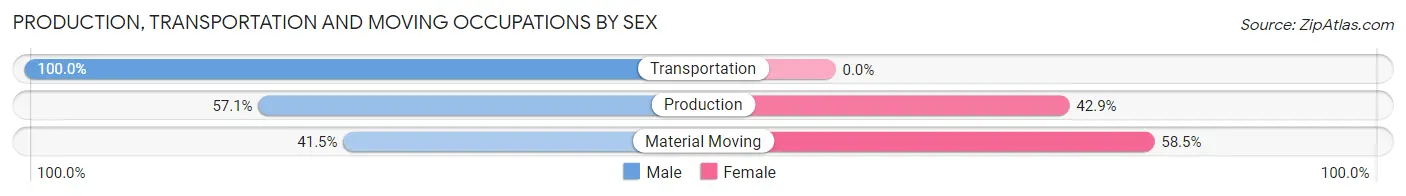
Production, Transportation and Moving Occupations by Sex
| Occupation | Male | Female |
| Production | 600 (57.1%) | 451 (42.9%) |
| Transportation | 69 (100.0%) | 0 (0.0%) |
| Material Moving | 22 (41.5%) | 31 (58.5%) |
| Total (Category) | 691 (58.9%) | 482 (41.1%) |
| Total (Overall) | 1,537 (45.7%) | 1,829 (54.3%) |
Employment Industries by Sex in Hastings
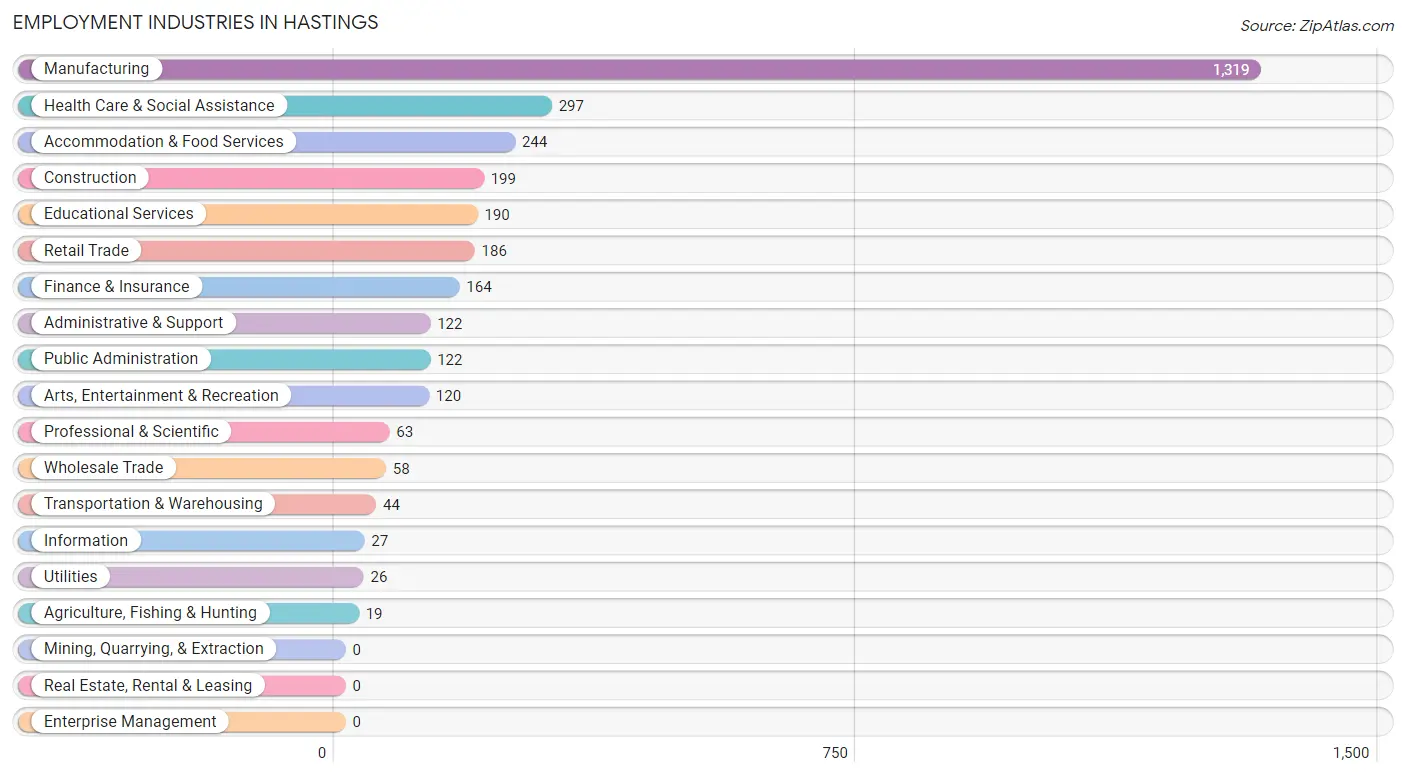
Employment Industries in Hastings
The major employment industries in Hastings include Manufacturing (1,319 | 39.2%), Health Care & Social Assistance (297 | 8.8%), Accommodation & Food Services (244 | 7.2%), Construction (199 | 5.9%), and Educational Services (190 | 5.6%).
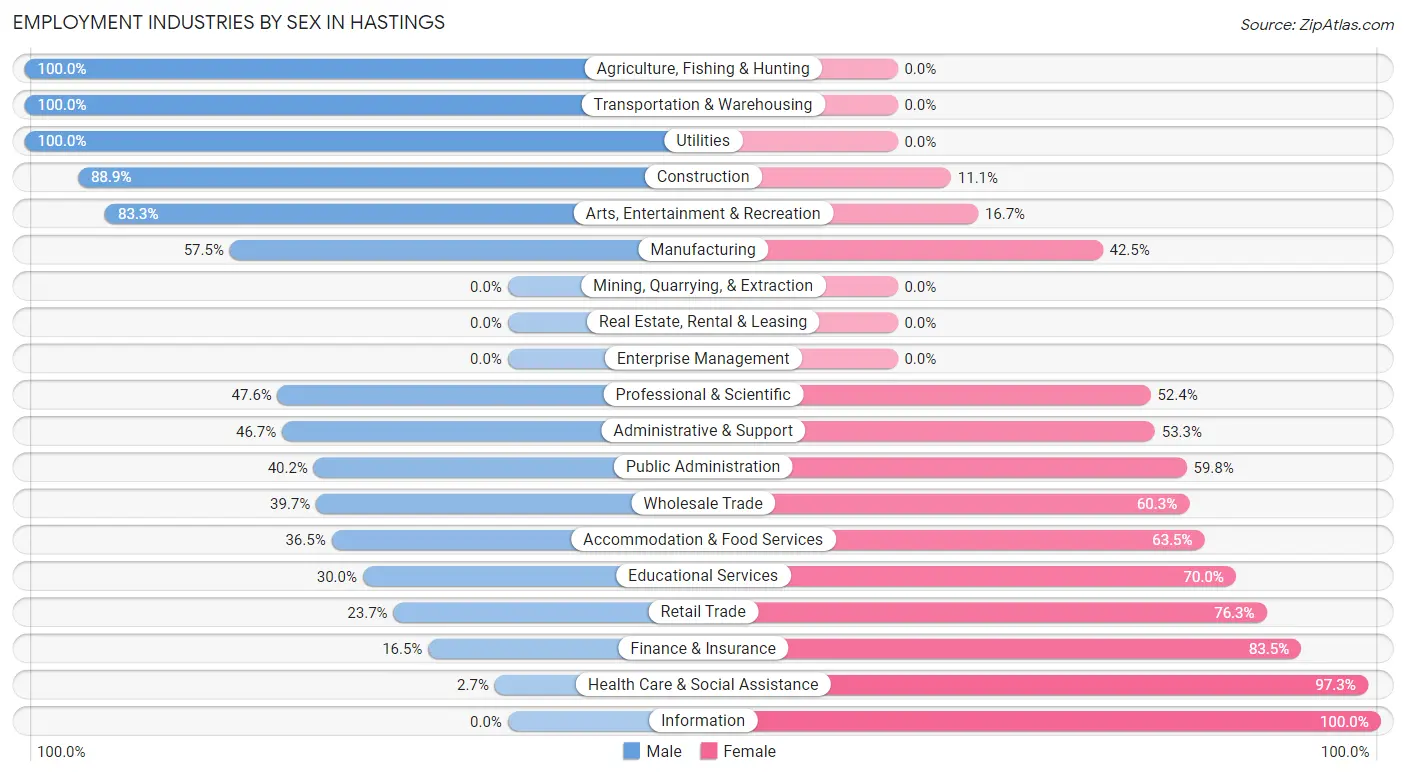
Employment Industries by Sex in Hastings
The Hastings industries that see more men than women are Agriculture, Fishing & Hunting (100.0%), Transportation & Warehousing (100.0%), and Utilities (100.0%), whereas the industries that tend to have a higher number of women are Information (100.0%), Health Care & Social Assistance (97.3%), and Finance & Insurance (83.5%).
| Industry | Male | Female |
| Agriculture, Fishing & Hunting | 19 (100.0%) | 0 (0.0%) |
| Mining, Quarrying, & Extraction | 0 (0.0%) | 0 (0.0%) |
| Construction | 177 (88.9%) | 22 (11.1%) |
| Manufacturing | 759 (57.5%) | 560 (42.5%) |
| Wholesale Trade | 23 (39.7%) | 35 (60.3%) |
| Retail Trade | 44 (23.7%) | 142 (76.3%) |
| Transportation & Warehousing | 44 (100.0%) | 0 (0.0%) |
| Utilities | 26 (100.0%) | 0 (0.0%) |
| Information | 0 (0.0%) | 27 (100.0%) |
| Finance & Insurance | 27 (16.5%) | 137 (83.5%) |
| Real Estate, Rental & Leasing | 0 (0.0%) | 0 (0.0%) |
| Professional & Scientific | 30 (47.6%) | 33 (52.4%) |
| Enterprise Management | 0 (0.0%) | 0 (0.0%) |
| Administrative & Support | 57 (46.7%) | 65 (53.3%) |
| Educational Services | 57 (30.0%) | 133 (70.0%) |
| Health Care & Social Assistance | 8 (2.7%) | 289 (97.3%) |
| Arts, Entertainment & Recreation | 100 (83.3%) | 20 (16.7%) |
| Accommodation & Food Services | 89 (36.5%) | 155 (63.5%) |
| Public Administration | 49 (40.2%) | 73 (59.8%) |
| Total | 1,537 (45.7%) | 1,829 (54.3%) |
Education in Hastings
School Enrollment in Hastings
The most common levels of schooling among the 1,388 students in Hastings are high school (527 | 38.0%), elementary school (238 | 17.2%), and college / undergraduate (234 | 16.9%).
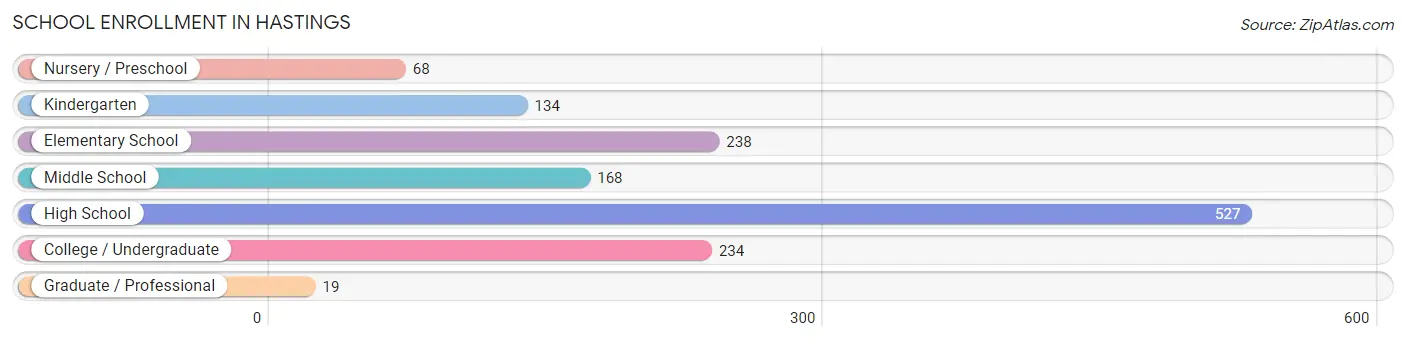
| School Level | # Students | % Students |
| Nursery / Preschool | 68 | 4.9% |
| Kindergarten | 134 | 9.7% |
| Elementary School | 238 | 17.2% |
| Middle School | 168 | 12.1% |
| High School | 527 | 38.0% |
| College / Undergraduate | 234 | 16.9% |
| Graduate / Professional | 19 | 1.4% |
| Total | 1,388 | 100.0% |
School Enrollment by Age by Funding Source in Hastings
Out of a total of 1,388 students who are enrolled in schools in Hastings, 262 (18.9%) attend a private institution, while the remaining 1,126 (81.1%) are enrolled in public schools. The age group of 20 to 24 year olds has the highest likelihood of being enrolled in private schools, with 126 (81.3% in the age bracket) enrolled. Conversely, the age group of 3 to 4 year olds has the lowest likelihood of being enrolled in a private school, with 66 (100.0% in the age bracket) attending a public institution.
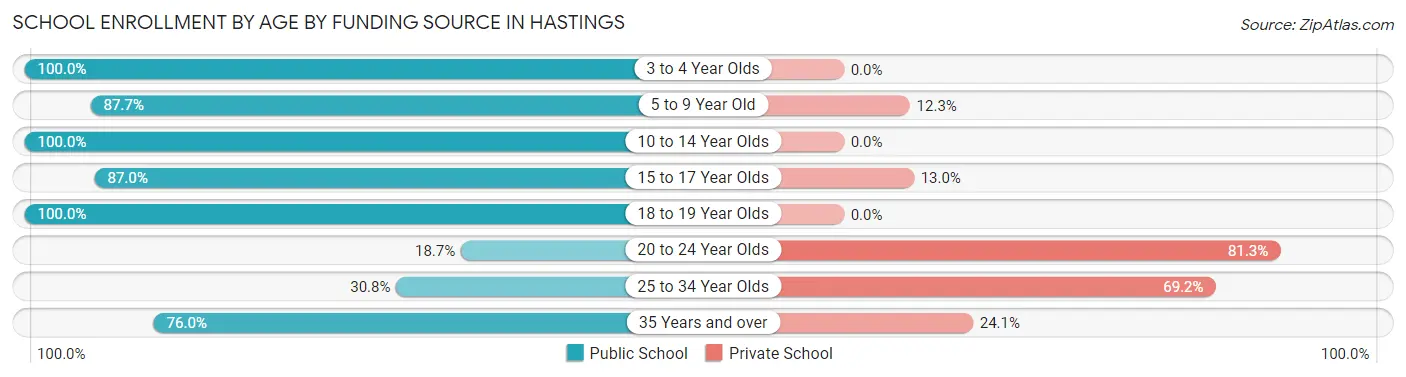
| Age Bracket | Public School | Private School |
| 3 to 4 Year Olds | 66 (100.0%) | 0 (0.0%) |
| 5 to 9 Year Old | 307 (87.7%) | 43 (12.3%) |
| 10 to 14 Year Olds | 206 (100.0%) | 0 (0.0%) |
| 15 to 17 Year Olds | 320 (87.0%) | 48 (13.0%) |
| 18 to 19 Year Olds | 125 (100.0%) | 0 (0.0%) |
| 20 to 24 Year Olds | 29 (18.7%) | 126 (81.3%) |
| 25 to 34 Year Olds | 12 (30.8%) | 27 (69.2%) |
| 35 Years and over | 60 (75.9%) | 19 (24.0%) |
| Total | 1,126 (81.1%) | 262 (18.9%) |
Educational Attainment by Field of Study in Hastings
Education (376 | 26.9%), science & technology (176 | 12.6%), liberal arts & history (174 | 12.5%), business (170 | 12.2%), and psychology (85 | 6.1%) are the most common fields of study among 1,397 individuals in Hastings who have obtained a bachelor's degree or higher.
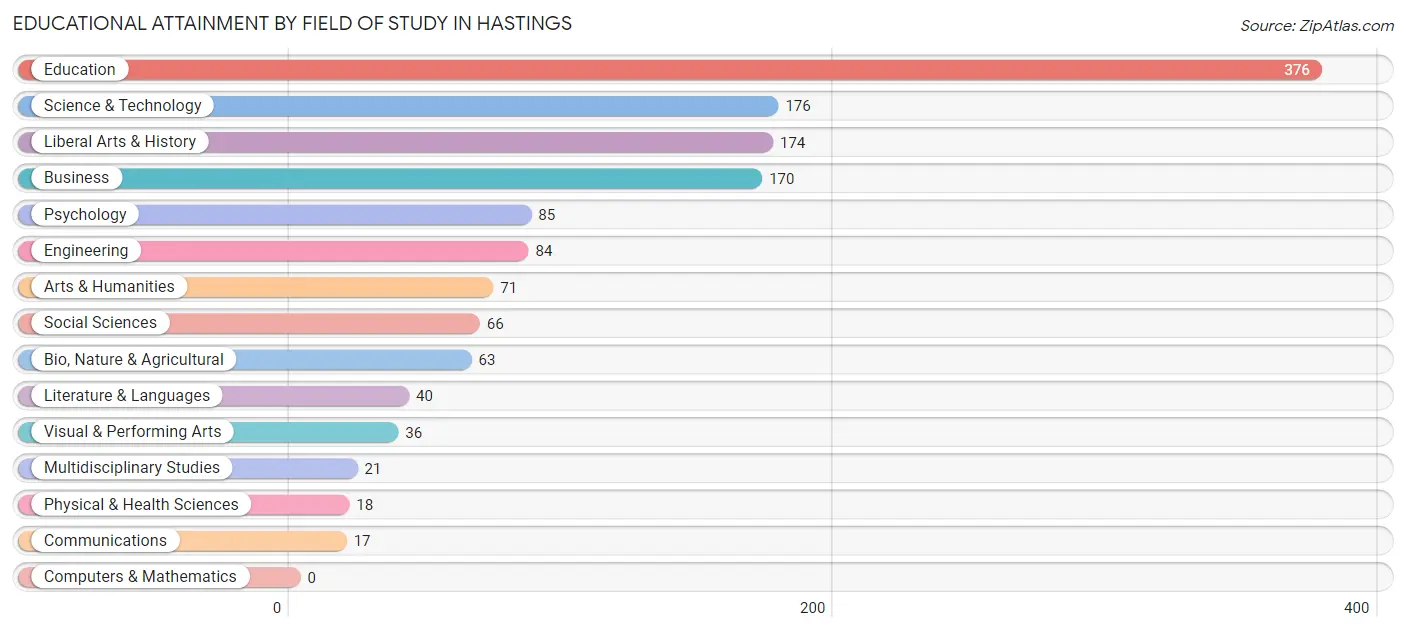
| Field of Study | # Graduates | % Graduates |
| Computers & Mathematics | 0 | 0.0% |
| Bio, Nature & Agricultural | 63 | 4.5% |
| Physical & Health Sciences | 18 | 1.3% |
| Psychology | 85 | 6.1% |
| Social Sciences | 66 | 4.7% |
| Engineering | 84 | 6.0% |
| Multidisciplinary Studies | 21 | 1.5% |
| Science & Technology | 176 | 12.6% |
| Business | 170 | 12.2% |
| Education | 376 | 26.9% |
| Literature & Languages | 40 | 2.9% |
| Liberal Arts & History | 174 | 12.5% |
| Visual & Performing Arts | 36 | 2.6% |
| Communications | 17 | 1.2% |
| Arts & Humanities | 71 | 5.1% |
| Total | 1,397 | 100.0% |
Transportation & Commute in Hastings
Vehicle Availability by Sex in Hastings
The most prevalent vehicle ownership categories in Hastings are males with 2 vehicles (458, accounting for 32.6%) and females with 2 vehicles (649, making up 25.0%).
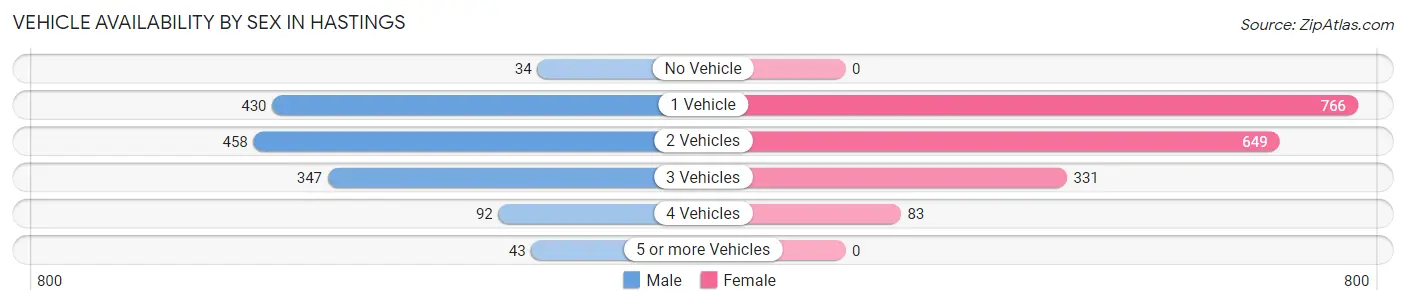
| Vehicles Available | Male | Female |
| No Vehicle | 34 (2.4%) | 0 (0.0%) |
| 1 Vehicle | 430 (30.6%) | 766 (41.9%) |
| 2 Vehicles | 458 (32.6%) | 649 (35.5%) |
| 3 Vehicles | 347 (24.7%) | 331 (18.1%) |
| 4 Vehicles | 92 (6.6%) | 83 (4.5%) |
| 5 or more Vehicles | 43 (3.1%) | 0 (0.0%) |
| Total | 1,404 (100.0%) | 1,829 (100.0%) |
Commute Time in Hastings
The most frequently occuring commute durations in Hastings are 5 to 9 minutes (961 commuters, 32.0%), 45 to 59 minutes (349 commuters, 11.6%), and 10 to 14 minutes (304 commuters, 10.1%).
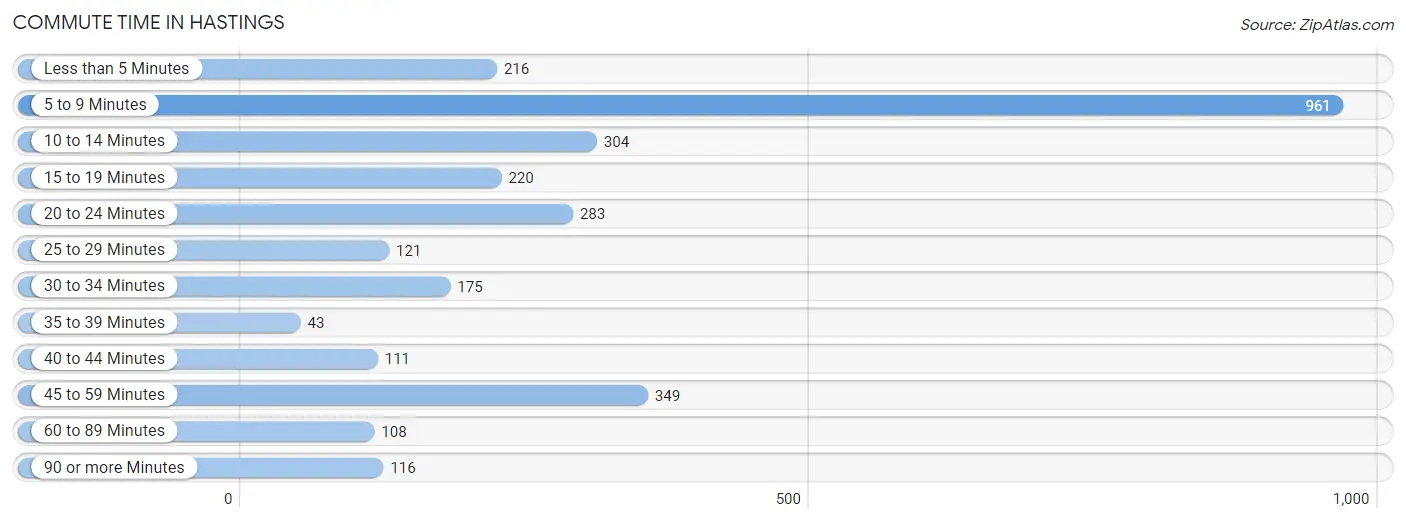
| Commute Time | # Commuters | % Commuters |
| Less than 5 Minutes | 216 | 7.2% |
| 5 to 9 Minutes | 961 | 32.0% |
| 10 to 14 Minutes | 304 | 10.1% |
| 15 to 19 Minutes | 220 | 7.3% |
| 20 to 24 Minutes | 283 | 9.4% |
| 25 to 29 Minutes | 121 | 4.0% |
| 30 to 34 Minutes | 175 | 5.8% |
| 35 to 39 Minutes | 43 | 1.4% |
| 40 to 44 Minutes | 111 | 3.7% |
| 45 to 59 Minutes | 349 | 11.6% |
| 60 to 89 Minutes | 108 | 3.6% |
| 90 or more Minutes | 116 | 3.9% |
Commute Time by Sex in Hastings
The most common commute times in Hastings are 5 to 9 minutes (299 commuters, 21.9%) for males and 5 to 9 minutes (662 commuters, 40.3%) for females.
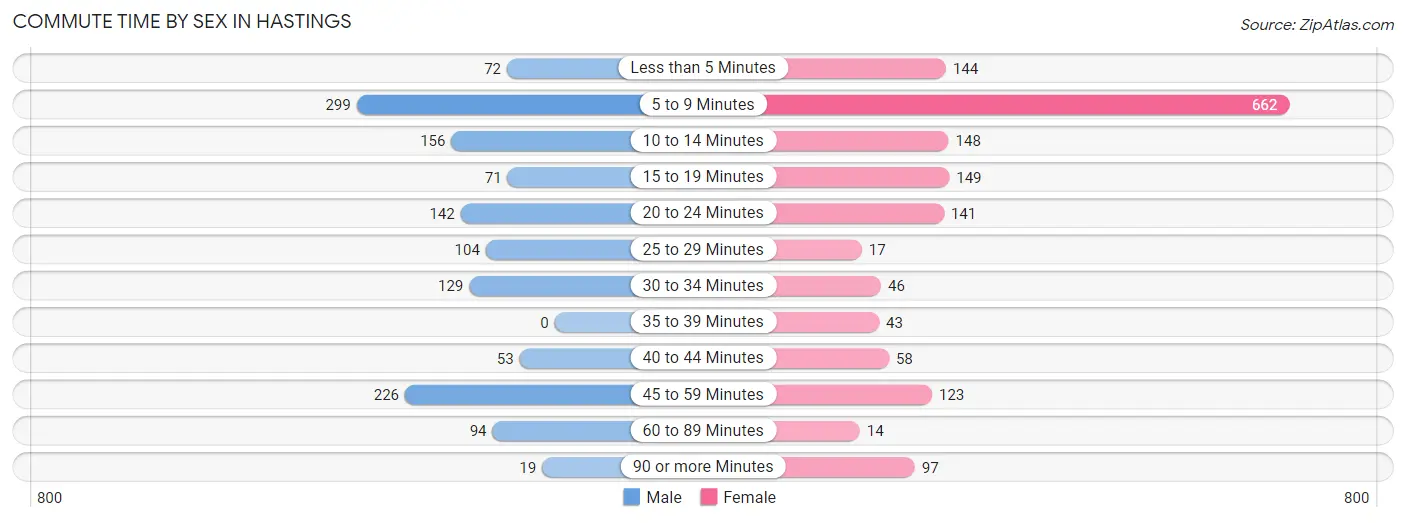
| Commute Time | Male | Female |
| Less than 5 Minutes | 72 (5.3%) | 144 (8.8%) |
| 5 to 9 Minutes | 299 (21.9%) | 662 (40.3%) |
| 10 to 14 Minutes | 156 (11.4%) | 148 (9.0%) |
| 15 to 19 Minutes | 71 (5.2%) | 149 (9.1%) |
| 20 to 24 Minutes | 142 (10.4%) | 141 (8.6%) |
| 25 to 29 Minutes | 104 (7.6%) | 17 (1.0%) |
| 30 to 34 Minutes | 129 (9.5%) | 46 (2.8%) |
| 35 to 39 Minutes | 0 (0.0%) | 43 (2.6%) |
| 40 to 44 Minutes | 53 (3.9%) | 58 (3.5%) |
| 45 to 59 Minutes | 226 (16.6%) | 123 (7.5%) |
| 60 to 89 Minutes | 94 (6.9%) | 14 (0.9%) |
| 90 or more Minutes | 19 (1.4%) | 97 (5.9%) |
Time of Departure to Work by Sex in Hastings
The most frequent times of departure to work in Hastings are 6:00 AM to 6:29 AM (230, 16.9%) for males and 4:00 PM to 11:59 PM (426, 25.9%) for females.
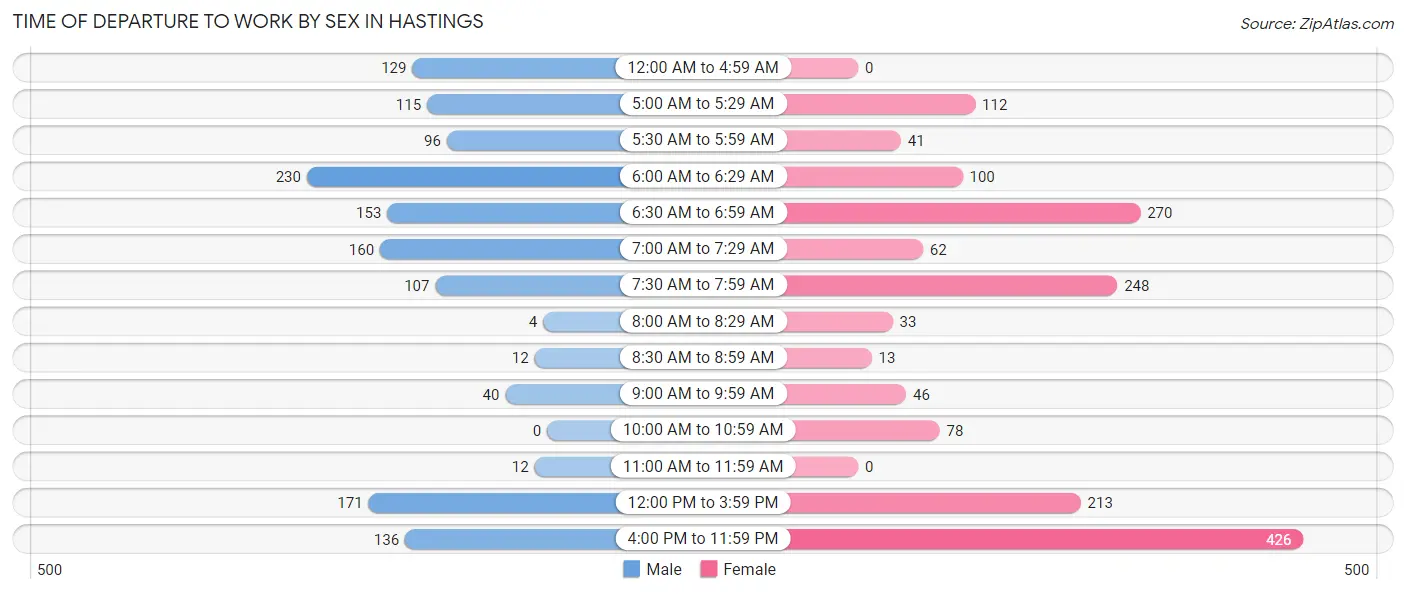
| Time of Departure | Male | Female |
| 12:00 AM to 4:59 AM | 129 (9.5%) | 0 (0.0%) |
| 5:00 AM to 5:29 AM | 115 (8.4%) | 112 (6.8%) |
| 5:30 AM to 5:59 AM | 96 (7.0%) | 41 (2.5%) |
| 6:00 AM to 6:29 AM | 230 (16.9%) | 100 (6.1%) |
| 6:30 AM to 6:59 AM | 153 (11.2%) | 270 (16.4%) |
| 7:00 AM to 7:29 AM | 160 (11.7%) | 62 (3.8%) |
| 7:30 AM to 7:59 AM | 107 (7.8%) | 248 (15.1%) |
| 8:00 AM to 8:29 AM | 4 (0.3%) | 33 (2.0%) |
| 8:30 AM to 8:59 AM | 12 (0.9%) | 13 (0.8%) |
| 9:00 AM to 9:59 AM | 40 (2.9%) | 46 (2.8%) |
| 10:00 AM to 10:59 AM | 0 (0.0%) | 78 (4.8%) |
| 11:00 AM to 11:59 AM | 12 (0.9%) | 0 (0.0%) |
| 12:00 PM to 3:59 PM | 171 (12.5%) | 213 (13.0%) |
| 4:00 PM to 11:59 PM | 136 (10.0%) | 426 (25.9%) |
| Total | 1,365 (100.0%) | 1,642 (100.0%) |
Housing Occupancy in Hastings
Occupancy by Ownership in Hastings
Of the total 3,260 dwellings in Hastings, owner-occupied units account for 2,421 (74.3%), while renter-occupied units make up 839 (25.7%).
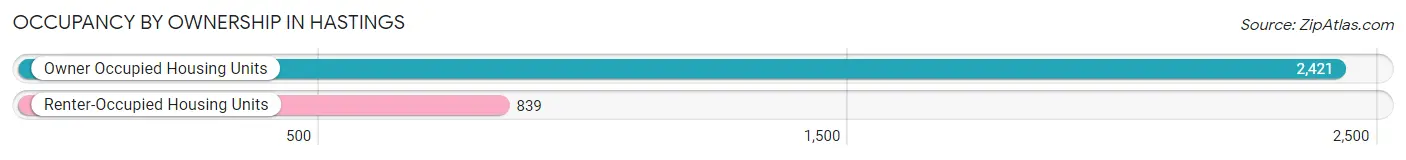
| Occupancy | # Housing Units | % Housing Units |
| Owner Occupied Housing Units | 2,421 | 74.3% |
| Renter-Occupied Housing Units | 839 | 25.7% |
| Total Occupied Housing Units | 3,260 | 100.0% |
Occupancy by Household Size in Hastings
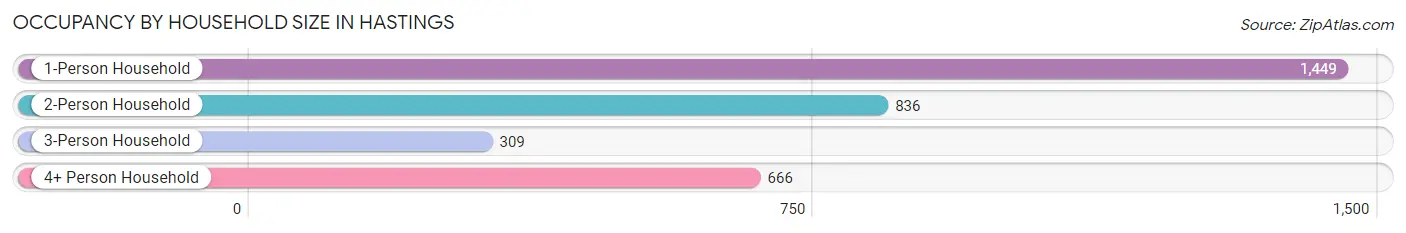
| Household Size | # Housing Units | % Housing Units |
| 1-Person Household | 1,449 | 44.5% |
| 2-Person Household | 836 | 25.6% |
| 3-Person Household | 309 | 9.5% |
| 4+ Person Household | 666 | 20.4% |
| Total Housing Units | 3,260 | 100.0% |
Occupancy by Ownership by Household Size in Hastings
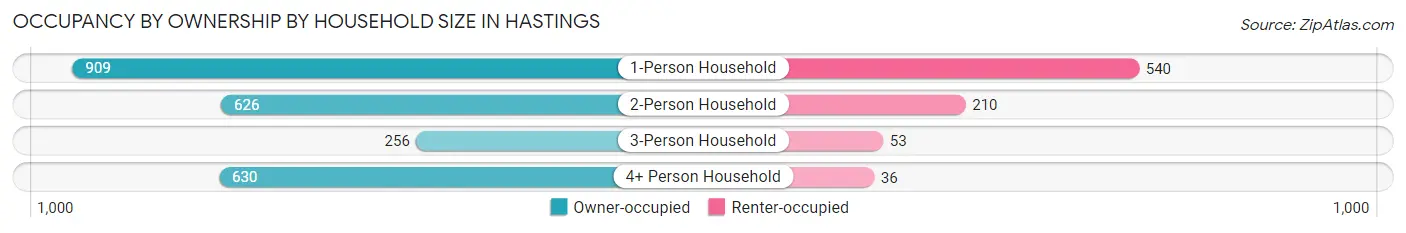
| Household Size | Owner-occupied | Renter-occupied |
| 1-Person Household | 909 (62.7%) | 540 (37.3%) |
| 2-Person Household | 626 (74.9%) | 210 (25.1%) |
| 3-Person Household | 256 (82.9%) | 53 (17.2%) |
| 4+ Person Household | 630 (94.6%) | 36 (5.4%) |
| Total Housing Units | 2,421 (74.3%) | 839 (25.7%) |
Occupancy by Educational Attainment in Hastings
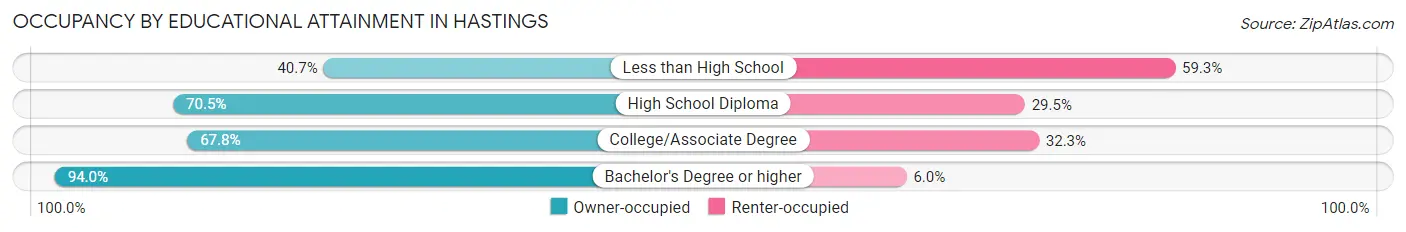
| Household Size | Owner-occupied | Renter-occupied |
| Less than High School | 77 (40.7%) | 112 (59.3%) |
| High School Diploma | 802 (70.5%) | 335 (29.5%) |
| College/Associate Degree | 712 (67.7%) | 339 (32.3%) |
| Bachelor's Degree or higher | 830 (94.0%) | 53 (6.0%) |
Occupancy by Age of Householder in Hastings
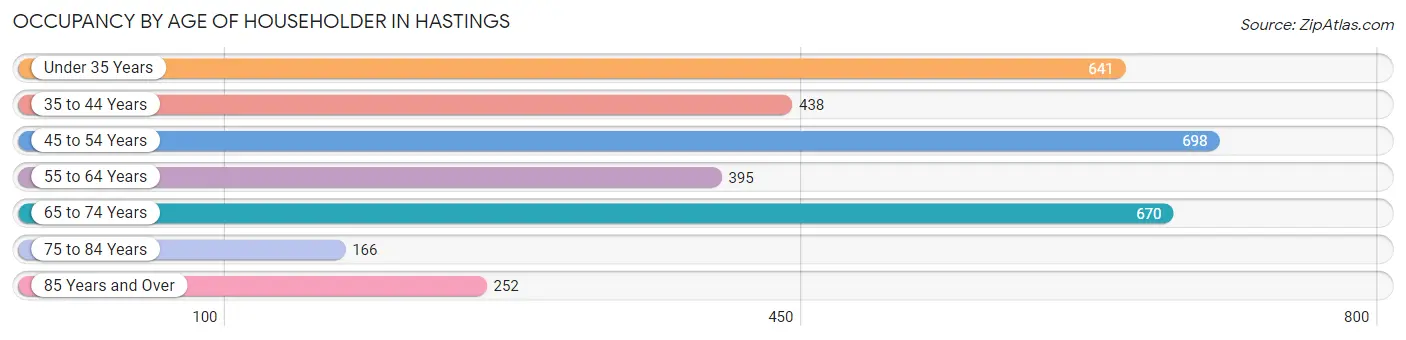
| Age Bracket | # Households | % Households |
| Under 35 Years | 641 | 19.7% |
| 35 to 44 Years | 438 | 13.4% |
| 45 to 54 Years | 698 | 21.4% |
| 55 to 64 Years | 395 | 12.1% |
| 65 to 74 Years | 670 | 20.5% |
| 75 to 84 Years | 166 | 5.1% |
| 85 Years and Over | 252 | 7.7% |
| Total | 3,260 | 100.0% |
Housing Finances in Hastings
Median Income by Occupancy in Hastings
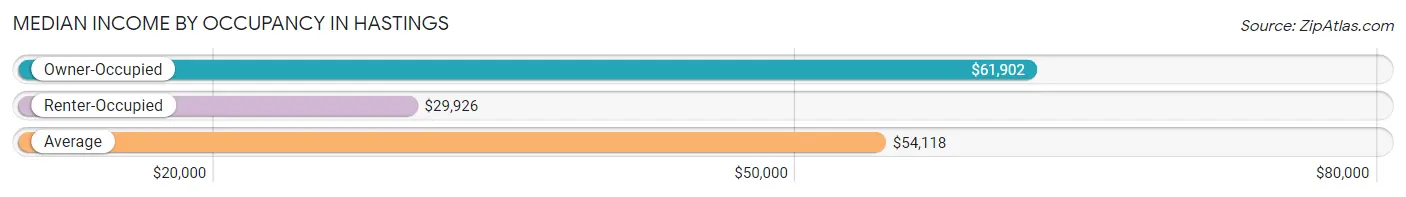
| Occupancy Type | # Households | Median Income |
| Owner-Occupied | 2,421 (74.3%) | $61,902 |
| Renter-Occupied | 839 (25.7%) | $29,926 |
| Average | 3,260 (100.0%) | $54,118 |
Occupancy by Householder Income Bracket in Hastings
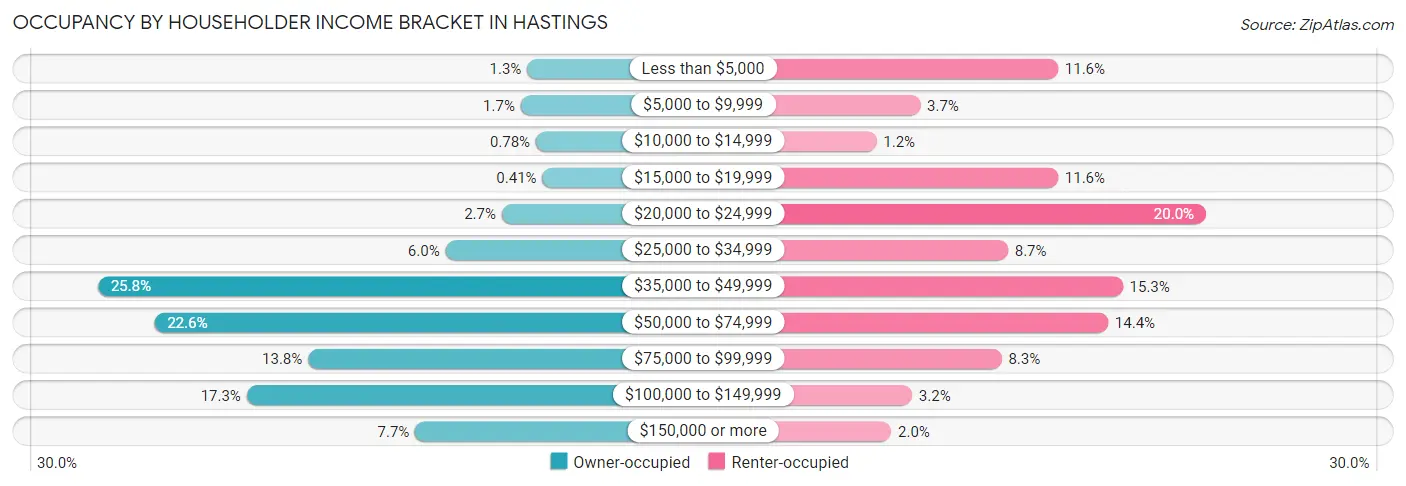
| Income Bracket | Owner-occupied | Renter-occupied |
| Less than $5,000 | 31 (1.3%) | 97 (11.6%) |
| $5,000 to $9,999 | 40 (1.7%) | 31 (3.7%) |
| $10,000 to $14,999 | 19 (0.8%) | 10 (1.2%) |
| $15,000 to $19,999 | 10 (0.4%) | 97 (11.6%) |
| $20,000 to $24,999 | 66 (2.7%) | 168 (20.0%) |
| $25,000 to $34,999 | 144 (5.9%) | 73 (8.7%) |
| $35,000 to $49,999 | 625 (25.8%) | 128 (15.3%) |
| $50,000 to $74,999 | 547 (22.6%) | 121 (14.4%) |
| $75,000 to $99,999 | 334 (13.8%) | 70 (8.3%) |
| $100,000 to $149,999 | 419 (17.3%) | 27 (3.2%) |
| $150,000 or more | 186 (7.7%) | 17 (2.0%) |
| Total | 2,421 (100.0%) | 839 (100.0%) |
Monthly Housing Cost Tiers in Hastings
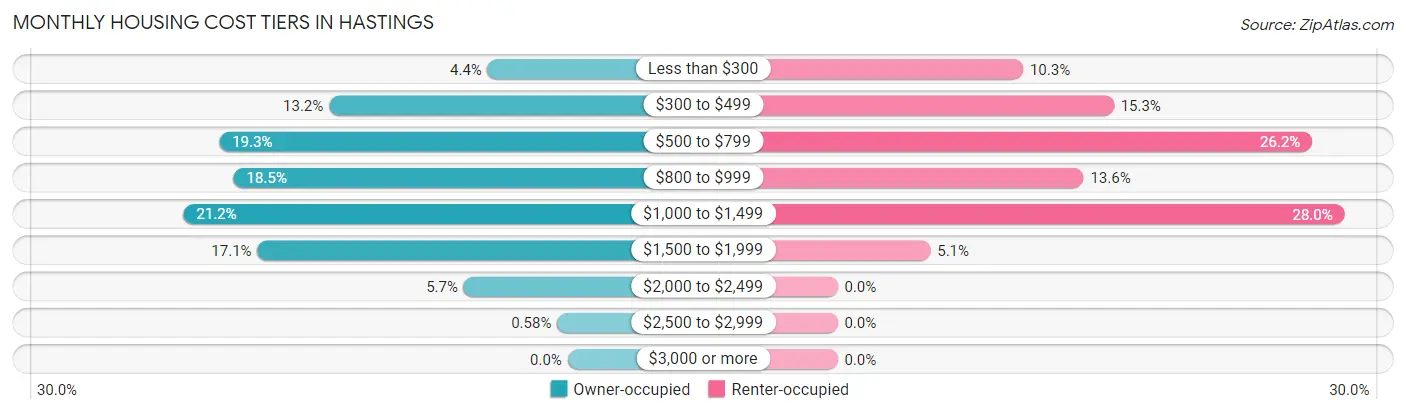
| Monthly Cost | Owner-occupied | Renter-occupied |
| Less than $300 | 107 (4.4%) | 86 (10.2%) |
| $300 to $499 | 319 (13.2%) | 128 (15.3%) |
| $500 to $799 | 466 (19.3%) | 220 (26.2%) |
| $800 to $999 | 447 (18.5%) | 114 (13.6%) |
| $1,000 to $1,499 | 514 (21.2%) | 235 (28.0%) |
| $1,500 to $1,999 | 415 (17.1%) | 43 (5.1%) |
| $2,000 to $2,499 | 139 (5.7%) | 0 (0.0%) |
| $2,500 to $2,999 | 14 (0.6%) | 0 (0.0%) |
| $3,000 or more | 0 (0.0%) | 0 (0.0%) |
| Total | 2,421 (100.0%) | 839 (100.0%) |
Physical Housing Characteristics in Hastings
Housing Structures in Hastings
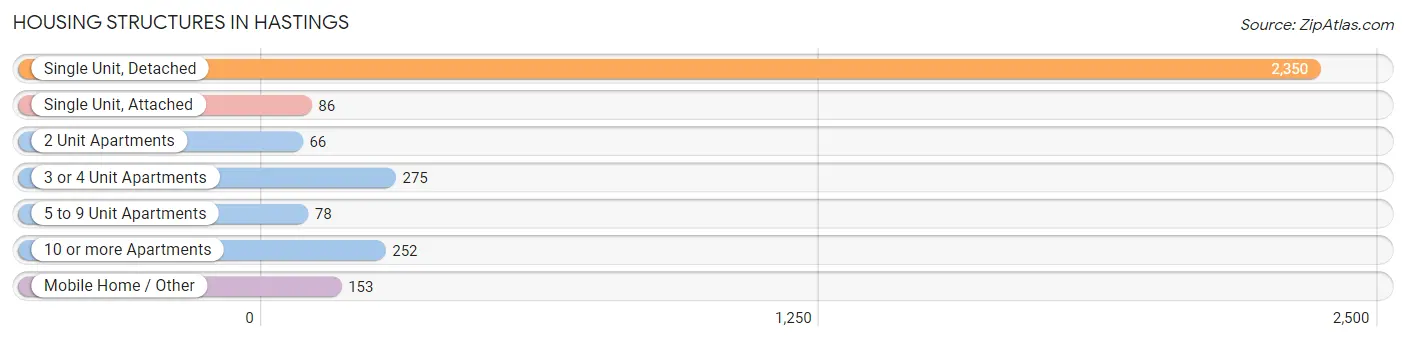
| Structure Type | # Housing Units | % Housing Units |
| Single Unit, Detached | 2,350 | 72.1% |
| Single Unit, Attached | 86 | 2.6% |
| 2 Unit Apartments | 66 | 2.0% |
| 3 or 4 Unit Apartments | 275 | 8.4% |
| 5 to 9 Unit Apartments | 78 | 2.4% |
| 10 or more Apartments | 252 | 7.7% |
| Mobile Home / Other | 153 | 4.7% |
| Total | 3,260 | 100.0% |
Housing Structures by Occupancy in Hastings
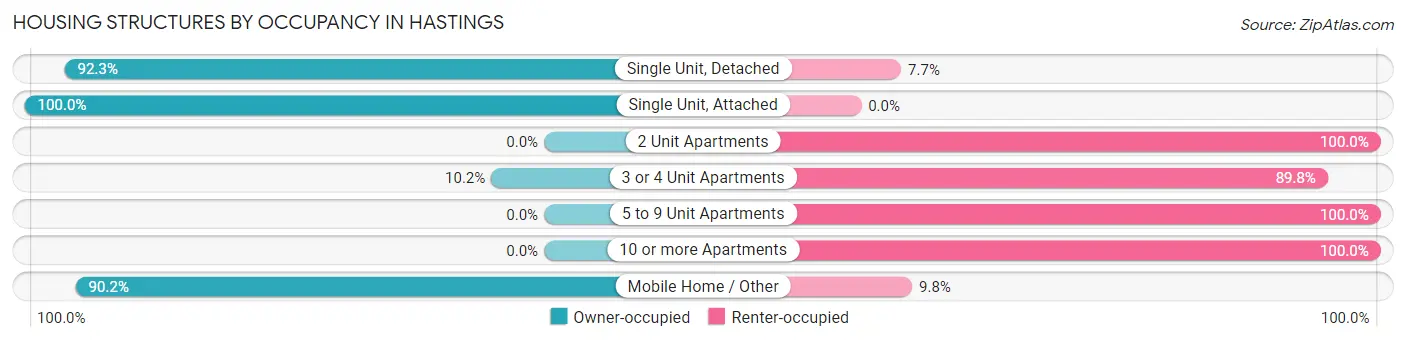
| Structure Type | Owner-occupied | Renter-occupied |
| Single Unit, Detached | 2,169 (92.3%) | 181 (7.7%) |
| Single Unit, Attached | 86 (100.0%) | 0 (0.0%) |
| 2 Unit Apartments | 0 (0.0%) | 66 (100.0%) |
| 3 or 4 Unit Apartments | 28 (10.2%) | 247 (89.8%) |
| 5 to 9 Unit Apartments | 0 (0.0%) | 78 (100.0%) |
| 10 or more Apartments | 0 (0.0%) | 252 (100.0%) |
| Mobile Home / Other | 138 (90.2%) | 15 (9.8%) |
| Total | 2,421 (74.3%) | 839 (25.7%) |
Housing Structures by Number of Rooms in Hastings
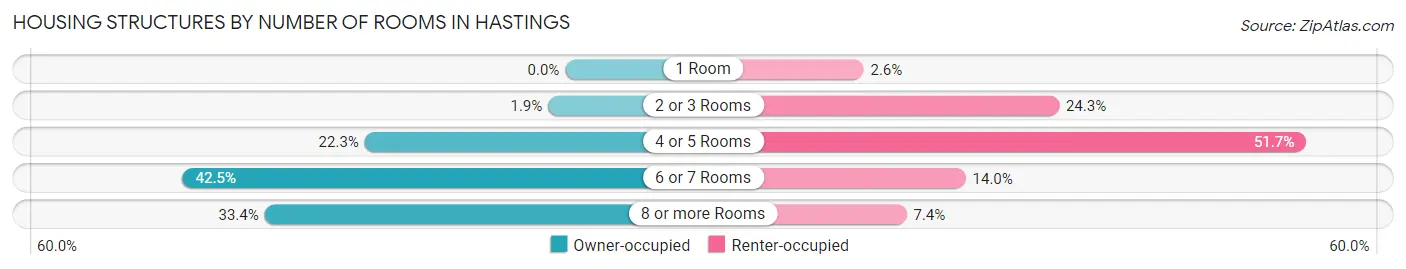
| Number of Rooms | Owner-occupied | Renter-occupied |
| 1 Room | 0 (0.0%) | 22 (2.6%) |
| 2 or 3 Rooms | 46 (1.9%) | 204 (24.3%) |
| 4 or 5 Rooms | 539 (22.3%) | 434 (51.7%) |
| 6 or 7 Rooms | 1,028 (42.5%) | 117 (14.0%) |
| 8 or more Rooms | 808 (33.4%) | 62 (7.4%) |
| Total | 2,421 (100.0%) | 839 (100.0%) |
Housing Structure by Heating Type in Hastings
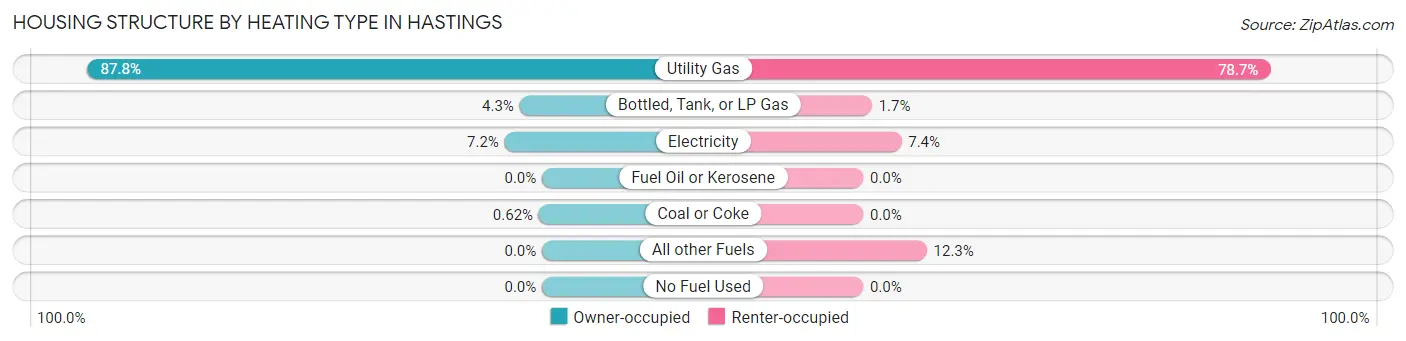
| Heating Type | Owner-occupied | Renter-occupied |
| Utility Gas | 2,126 (87.8%) | 660 (78.7%) |
| Bottled, Tank, or LP Gas | 105 (4.3%) | 14 (1.7%) |
| Electricity | 175 (7.2%) | 62 (7.4%) |
| Fuel Oil or Kerosene | 0 (0.0%) | 0 (0.0%) |
| Coal or Coke | 15 (0.6%) | 0 (0.0%) |
| All other Fuels | 0 (0.0%) | 103 (12.3%) |
| No Fuel Used | 0 (0.0%) | 0 (0.0%) |
| Total | 2,421 (100.0%) | 839 (100.0%) |
Household Vehicle Usage in Hastings

| Vehicles per Household | Owner-occupied | Renter-occupied |
| No Vehicle | 97 (4.0%) | 122 (14.5%) |
| 1 Vehicle | 1,034 (42.7%) | 548 (65.3%) |
| 2 Vehicles | 824 (34.0%) | 126 (15.0%) |
| 3 or more Vehicles | 466 (19.3%) | 43 (5.1%) |
| Total | 2,421 (100.0%) | 839 (100.0%) |
Real Estate & Mortgages in Hastings
Real Estate and Mortgage Overview in Hastings
| Characteristic | Without Mortgage | With Mortgage |
| Housing Units | 771 | 1,650 |
| Median Property Value | $149,500 | $146,200 |
| Median Household Income | $46,250 | $117 |
| Monthly Housing Costs | $503 | $0 |
| Real Estate Taxes | $2,439 | $200 |
Property Value by Mortgage Status in Hastings
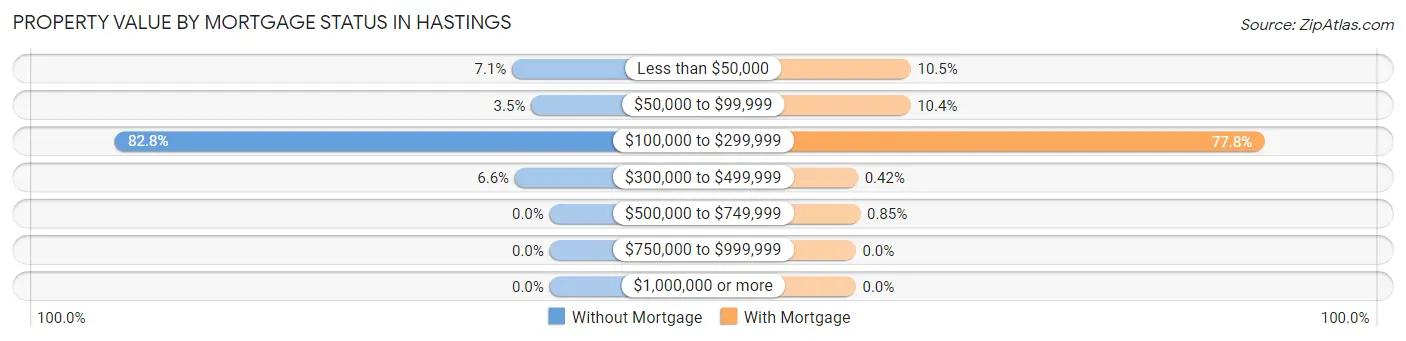
| Property Value | Without Mortgage | With Mortgage |
| Less than $50,000 | 55 (7.1%) | 173 (10.5%) |
| $50,000 to $99,999 | 27 (3.5%) | 172 (10.4%) |
| $100,000 to $299,999 | 638 (82.8%) | 1,284 (77.8%) |
| $300,000 to $499,999 | 51 (6.6%) | 7 (0.4%) |
| $500,000 to $749,999 | 0 (0.0%) | 14 (0.9%) |
| $750,000 to $999,999 | 0 (0.0%) | 0 (0.0%) |
| $1,000,000 or more | 0 (0.0%) | 0 (0.0%) |
| Total | 771 (100.0%) | 1,650 (100.0%) |
Household Income by Mortgage Status in Hastings
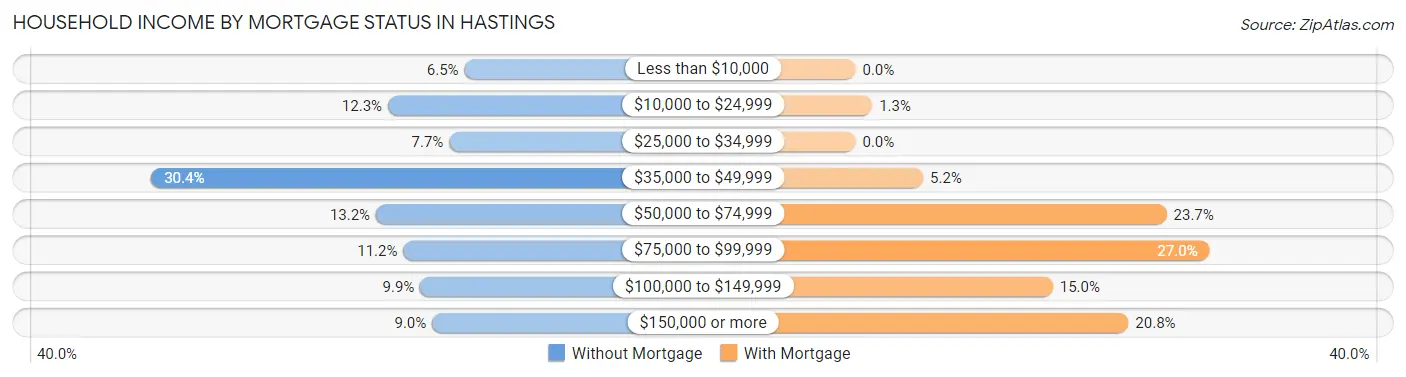
| Household Income | Without Mortgage | With Mortgage |
| Less than $10,000 | 50 (6.5%) | 0 (0.0%) |
| $10,000 to $24,999 | 95 (12.3%) | 21 (1.3%) |
| $25,000 to $34,999 | 59 (7.6%) | 0 (0.0%) |
| $35,000 to $49,999 | 234 (30.3%) | 85 (5.1%) |
| $50,000 to $74,999 | 102 (13.2%) | 391 (23.7%) |
| $75,000 to $99,999 | 86 (11.2%) | 445 (27.0%) |
| $100,000 to $149,999 | 76 (9.9%) | 248 (15.0%) |
| $150,000 or more | 69 (8.9%) | 343 (20.8%) |
| Total | 771 (100.0%) | 1,650 (100.0%) |
Property Value to Household Income Ratio in Hastings
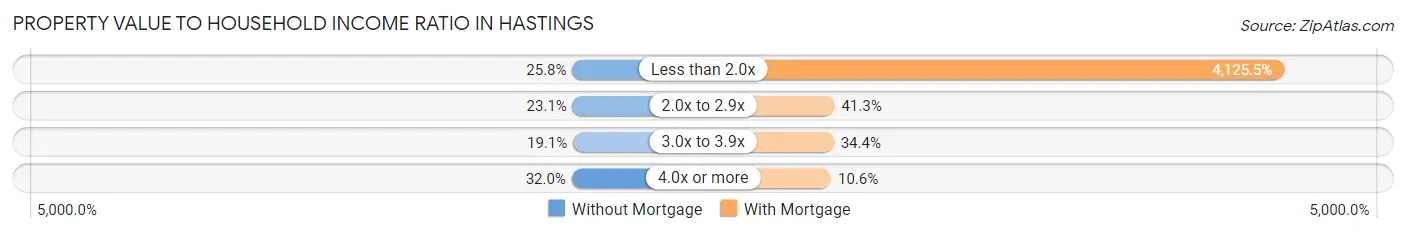
| Value-to-Income Ratio | Without Mortgage | With Mortgage |
| Less than 2.0x | 199 (25.8%) | 68,071 (4,125.5%) |
| 2.0x to 2.9x | 178 (23.1%) | 682 (41.3%) |
| 3.0x to 3.9x | 147 (19.1%) | 568 (34.4%) |
| 4.0x or more | 247 (32.0%) | 174 (10.5%) |
| Total | 771 (100.0%) | 1,650 (100.0%) |
Real Estate Taxes by Mortgage Status in Hastings
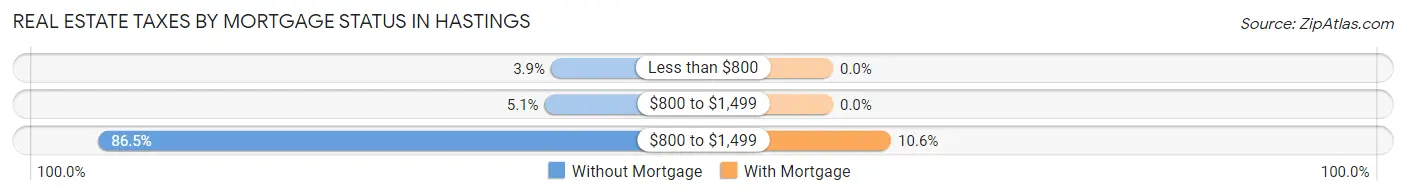
| Property Taxes | Without Mortgage | With Mortgage |
| Less than $800 | 30 (3.9%) | 0 (0.0%) |
| $800 to $1,499 | 39 (5.1%) | 0 (0.0%) |
| $800 to $1,499 | 667 (86.5%) | 175 (10.6%) |
| Total | 771 (100.0%) | 1,650 (100.0%) |
Health & Disability in Hastings
Health Insurance Coverage by Age in Hastings
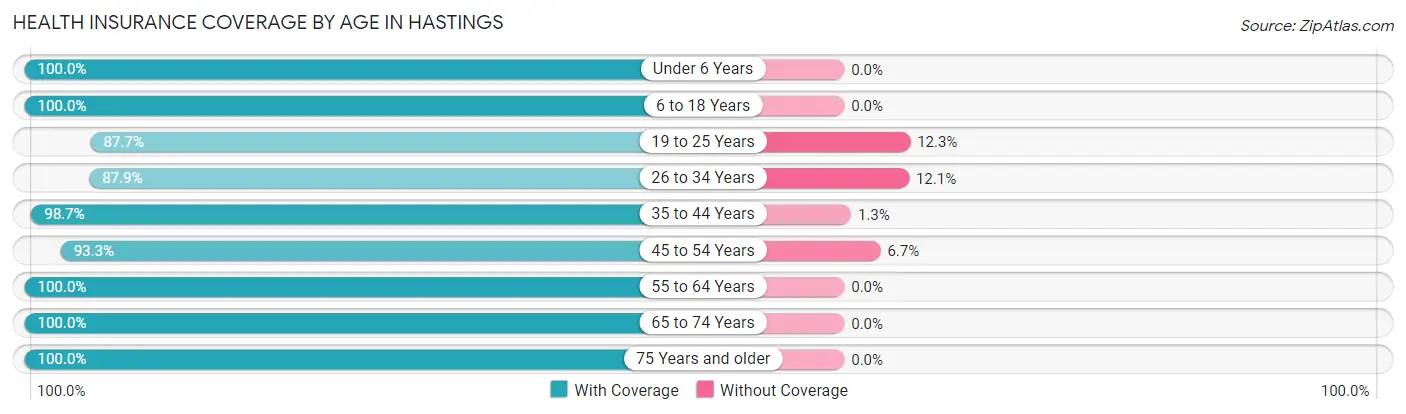
| Age Bracket | With Coverage | Without Coverage |
| Under 6 Years | 440 (100.0%) | 0 (0.0%) |
| 6 to 18 Years | 1,065 (100.0%) | 0 (0.0%) |
| 19 to 25 Years | 849 (87.7%) | 119 (12.3%) |
| 26 to 34 Years | 817 (87.9%) | 112 (12.1%) |
| 35 to 44 Years | 785 (98.7%) | 10 (1.3%) |
| 45 to 54 Years | 968 (93.3%) | 70 (6.7%) |
| 55 to 64 Years | 558 (100.0%) | 0 (0.0%) |
| 65 to 74 Years | 1,073 (100.0%) | 0 (0.0%) |
| 75 Years and older | 509 (100.0%) | 0 (0.0%) |
| Total | 7,064 (95.8%) | 311 (4.2%) |
Health Insurance Coverage by Citizenship Status in Hastings
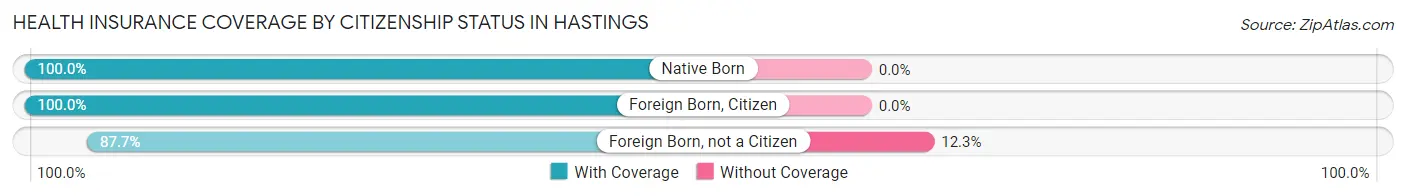
| Citizenship Status | With Coverage | Without Coverage |
| Native Born | 440 (100.0%) | 0 (0.0%) |
| Foreign Born, Citizen | 1,065 (100.0%) | 0 (0.0%) |
| Foreign Born, not a Citizen | 849 (87.7%) | 119 (12.3%) |
Health Insurance Coverage by Household Income in Hastings
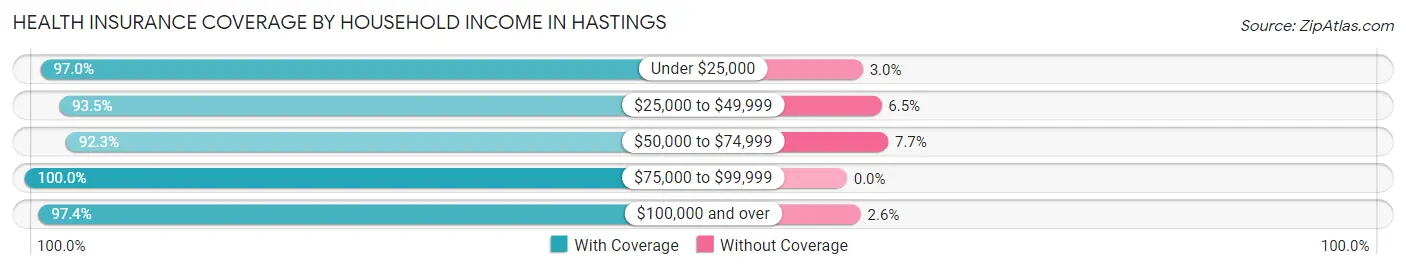
| Household Income | With Coverage | Without Coverage |
| Under $25,000 | 684 (97.0%) | 21 (3.0%) |
| $25,000 to $49,999 | 1,345 (93.5%) | 93 (6.5%) |
| $50,000 to $74,999 | 1,743 (92.3%) | 146 (7.7%) |
| $75,000 to $99,999 | 1,362 (100.0%) | 0 (0.0%) |
| $100,000 and over | 1,922 (97.4%) | 51 (2.6%) |
Public vs Private Health Insurance Coverage by Age in Hastings
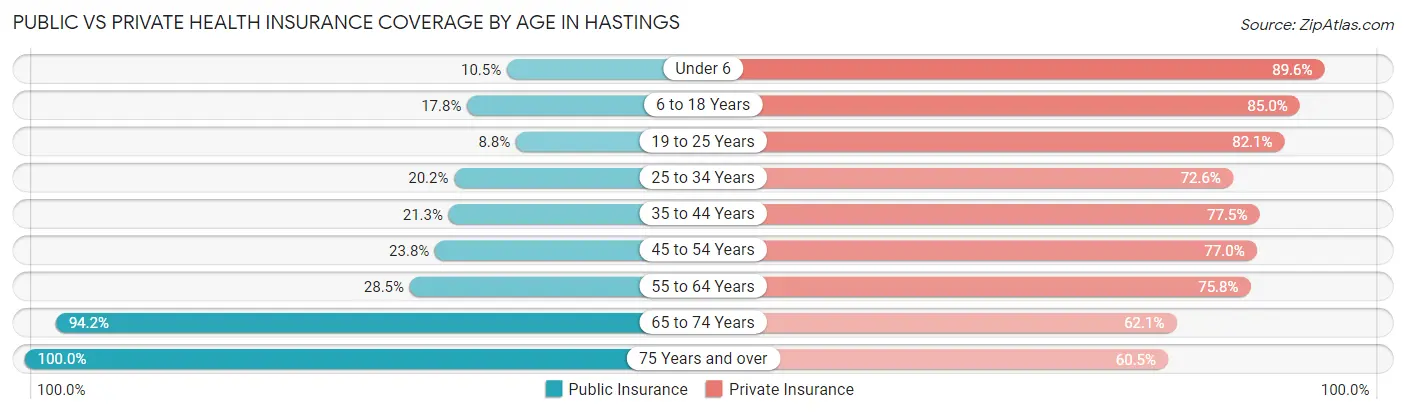
| Age Bracket | Public Insurance | Private Insurance |
| Under 6 | 46 (10.4%) | 394 (89.5%) |
| 6 to 18 Years | 190 (17.8%) | 905 (85.0%) |
| 19 to 25 Years | 85 (8.8%) | 795 (82.1%) |
| 25 to 34 Years | 188 (20.2%) | 674 (72.6%) |
| 35 to 44 Years | 169 (21.3%) | 616 (77.5%) |
| 45 to 54 Years | 247 (23.8%) | 799 (77.0%) |
| 55 to 64 Years | 159 (28.5%) | 423 (75.8%) |
| 65 to 74 Years | 1,011 (94.2%) | 666 (62.1%) |
| 75 Years and over | 509 (100.0%) | 308 (60.5%) |
| Total | 2,604 (35.3%) | 5,580 (75.7%) |
Disability Status by Sex by Age in Hastings
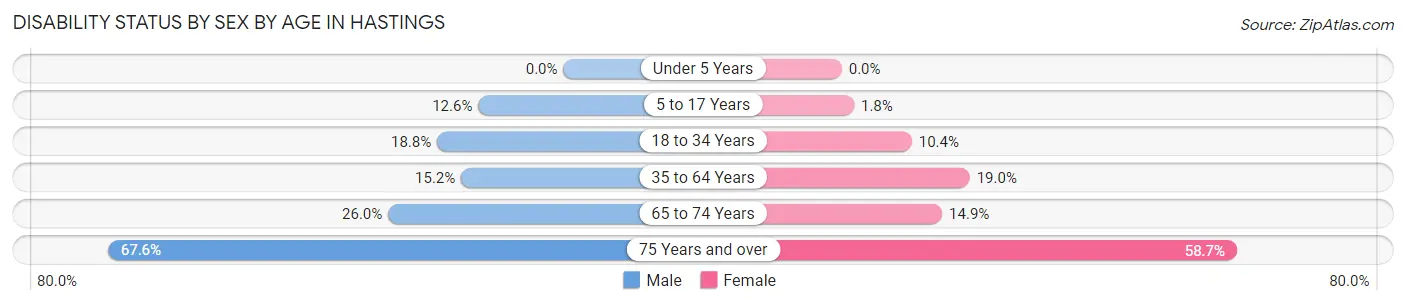
| Age Bracket | Male | Female |
| Under 5 Years | 0 (0.0%) | 0 (0.0%) |
| 5 to 17 Years | 68 (12.6%) | 10 (1.8%) |
| 18 to 34 Years | 182 (18.8%) | 104 (10.4%) |
| 35 to 64 Years | 168 (15.2%) | 244 (19.0%) |
| 65 to 74 Years | 115 (26.0%) | 94 (14.9%) |
| 75 Years and over | 94 (67.6%) | 217 (58.7%) |
Disability Class by Sex by Age in Hastings
Disability Class: Hearing Difficulty
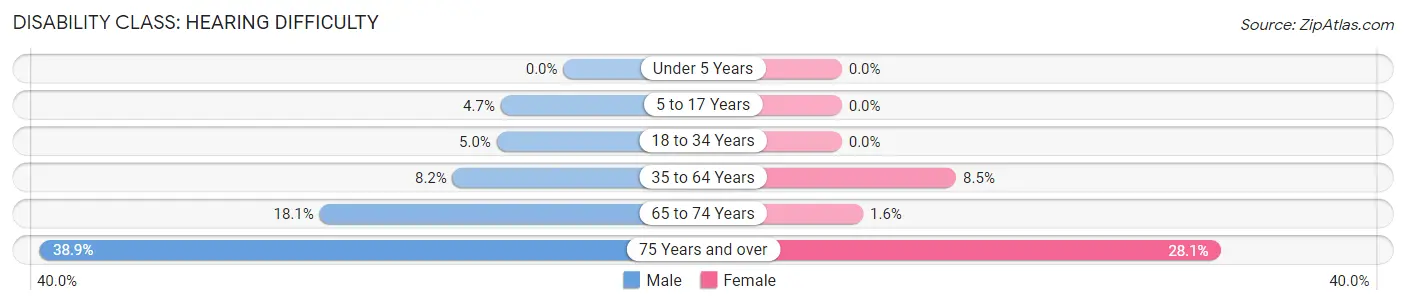
| Age Bracket | Male | Female |
| Under 5 Years | 0 (0.0%) | 0 (0.0%) |
| 5 to 17 Years | 25 (4.6%) | 0 (0.0%) |
| 18 to 34 Years | 48 (5.0%) | 0 (0.0%) |
| 35 to 64 Years | 91 (8.2%) | 109 (8.5%) |
| 65 to 74 Years | 80 (18.1%) | 10 (1.6%) |
| 75 Years and over | 54 (38.9%) | 104 (28.1%) |
Disability Class: Vision Difficulty
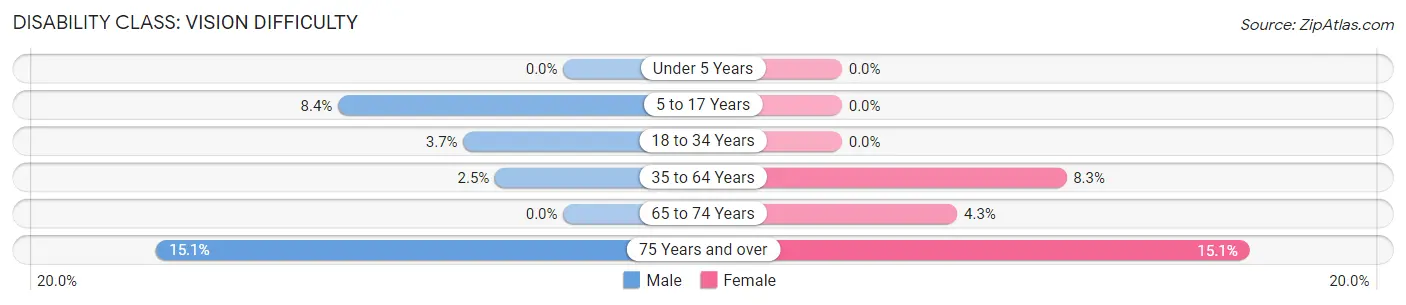
| Age Bracket | Male | Female |
| Under 5 Years | 0 (0.0%) | 0 (0.0%) |
| 5 to 17 Years | 45 (8.4%) | 0 (0.0%) |
| 18 to 34 Years | 36 (3.7%) | 0 (0.0%) |
| 35 to 64 Years | 28 (2.5%) | 107 (8.3%) |
| 65 to 74 Years | 0 (0.0%) | 27 (4.3%) |
| 75 Years and over | 21 (15.1%) | 56 (15.1%) |
Disability Class: Cognitive Difficulty
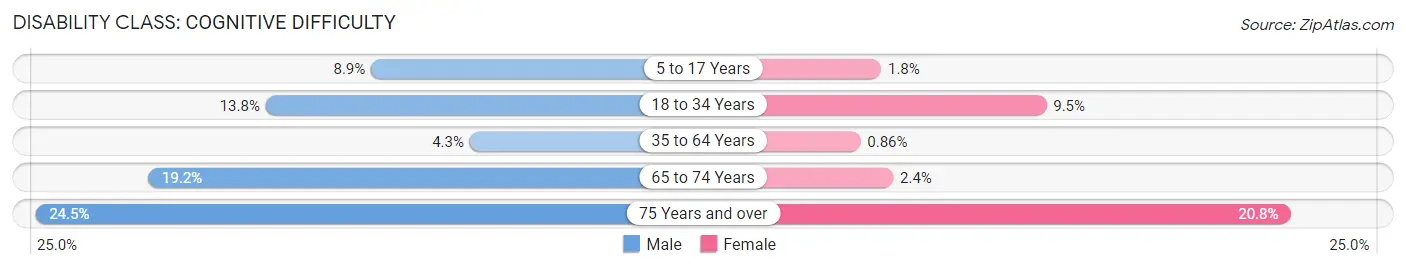
| Age Bracket | Male | Female |
| 5 to 17 Years | 48 (8.9%) | 10 (1.8%) |
| 18 to 34 Years | 134 (13.8%) | 95 (9.5%) |
| 35 to 64 Years | 48 (4.3%) | 11 (0.9%) |
| 65 to 74 Years | 85 (19.2%) | 15 (2.4%) |
| 75 Years and over | 34 (24.5%) | 77 (20.8%) |
Disability Class: Ambulatory Difficulty
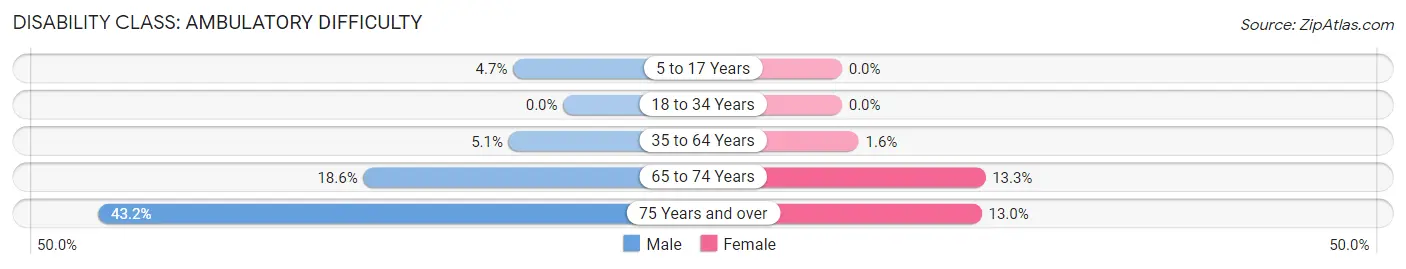
| Age Bracket | Male | Female |
| 5 to 17 Years | 25 (4.6%) | 0 (0.0%) |
| 18 to 34 Years | 0 (0.0%) | 0 (0.0%) |
| 35 to 64 Years | 56 (5.1%) | 20 (1.6%) |
| 65 to 74 Years | 82 (18.5%) | 84 (13.3%) |
| 75 Years and over | 60 (43.2%) | 48 (13.0%) |
Disability Class: Self-Care Difficulty
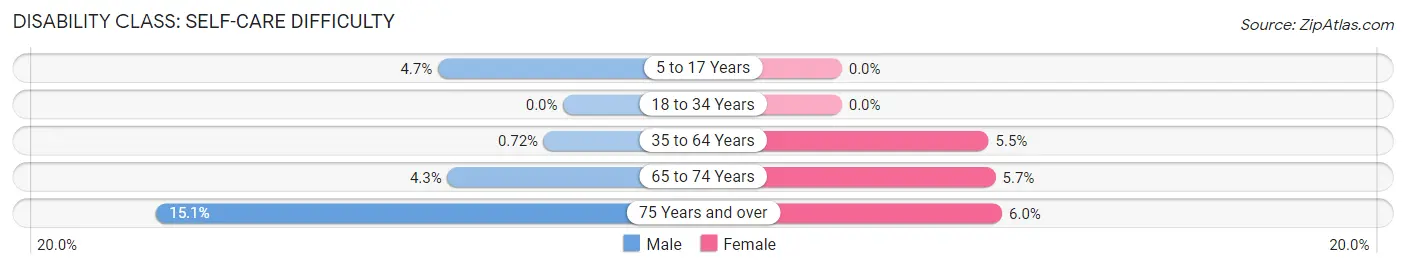
| Age Bracket | Male | Female |
| 5 to 17 Years | 25 (4.6%) | 0 (0.0%) |
| 18 to 34 Years | 0 (0.0%) | 0 (0.0%) |
| 35 to 64 Years | 8 (0.7%) | 70 (5.4%) |
| 65 to 74 Years | 19 (4.3%) | 36 (5.7%) |
| 75 Years and over | 21 (15.1%) | 22 (5.9%) |
Technology Access in Hastings
Computing Device Access in Hastings
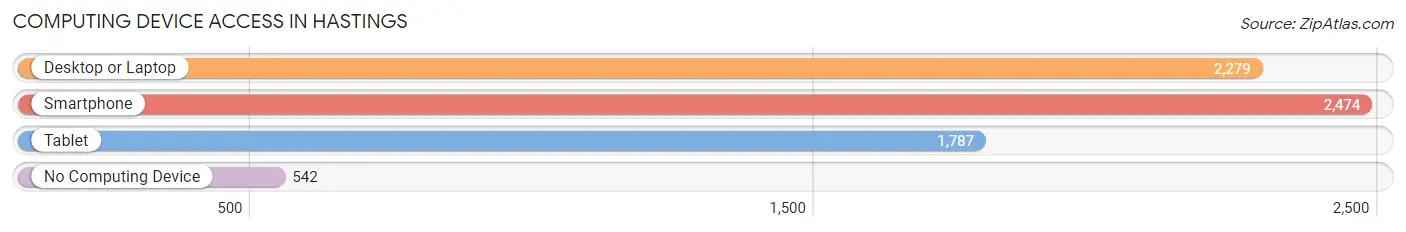
| Device Type | # Households | % Households |
| Desktop or Laptop | 2,279 | 69.9% |
| Smartphone | 2,474 | 75.9% |
| Tablet | 1,787 | 54.8% |
| No Computing Device | 542 | 16.6% |
| Total | 3,260 | 100.0% |
Internet Access in Hastings
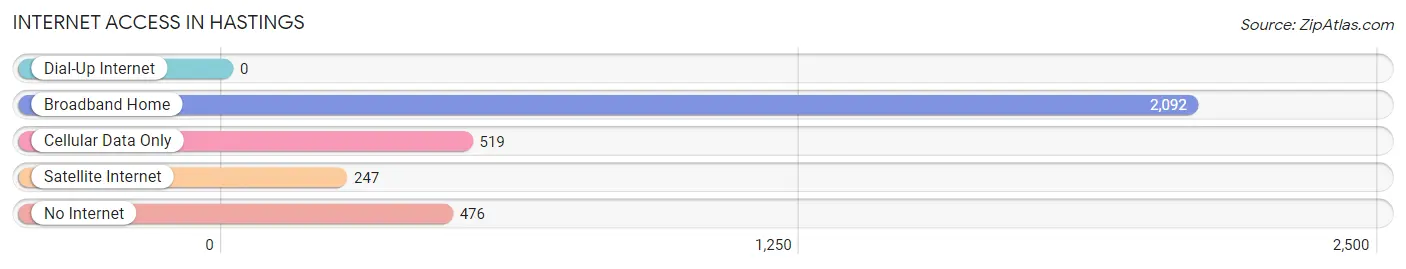
| Internet Type | # Households | % Households |
| Dial-Up Internet | 0 | 0.0% |
| Broadband Home | 2,092 | 64.2% |
| Cellular Data Only | 519 | 15.9% |
| Satellite Internet | 247 | 7.6% |
| No Internet | 476 | 14.6% |
| Total | 3,260 | 100.0% |
Hastings Summary
Hastings, Michigan is a small city located in the southwestern corner of Barry County, Michigan. It is situated on the banks of the Thornapple River, and is approximately 30 miles southeast of Grand Rapids. The city has a population of 7,350, according to the 2010 census.
History
Hastings was founded in 1836 by a group of settlers from New York. The city was named after Hastings, New York, the hometown of the settlers. The city was incorporated in 1871.
In the late 19th century, Hastings was a major center for the lumber industry. The city was home to several sawmills and lumber yards, and the Thornapple River was used to transport logs to the mills. The city also had a thriving agricultural industry, with many farmers growing apples, potatoes, and other crops.
In the early 20th century, Hastings began to transition away from its reliance on the lumber industry. The city became a center for manufacturing, with several factories producing furniture, auto parts, and other goods.
Geography
Hastings is located in the southwestern corner of Barry County, Michigan. The city is situated on the banks of the Thornapple River, and is approximately 30 miles southeast of Grand Rapids. The city has a total area of 4.2 square miles, all of which is land.
The city is located in a region of rolling hills and wooded areas. The climate is humid continental, with hot summers and cold winters.
Economy
Hastings has a diverse economy, with a mix of manufacturing, retail, and service industries. The city is home to several factories, including a furniture manufacturer, an auto parts manufacturer, and a plastics manufacturer.
The city also has a thriving retail sector, with several stores and restaurants located in the downtown area. The city is also home to several service businesses, including medical and legal offices, and a variety of other professional services.
Demographics
According to the 2010 census, Hastings has a population of 7,350. The city has a median household income of $41,945, and a median home value of $117,400. The city is predominantly white, with a population that is 94.3% white, 2.2% Hispanic, 1.2% African American, and 1.2% Asian.
Conclusion
Hastings, Michigan is a small city located in the southwestern corner of Barry County, Michigan. It is situated on the banks of the Thornapple River, and is approximately 30 miles southeast of Grand Rapids. The city has a population of 7,350, according to the 2010 census. Hastings has a diverse economy, with a mix of manufacturing, retail, and service industries. The city is predominantly white, with a population that is 94.3% white, 2.2% Hispanic, 1.2% African American, and 1.2% Asian.
Common Questions
What is Per Capita Income in Hastings?
Per Capita income in Hastings is $30,930.
What is the Median Family Income in Hastings?
Median Family Income in Hastings is $75,069.
What is the Median Household income in Hastings?
Median Household Income in Hastings is $54,118.
What is Income or Wage Gap in Hastings?
Income or Wage Gap in Hastings is 32.2%.
Women in Hastings earn 67.8 cents for every dollar earned by a man.
What is Inequality or Gini Index in Hastings?
Inequality or Gini Index in Hastings is 0.40.
What is the Total Population of Hastings?
Total Population of Hastings is 7,504.
What is the Total Male Population of Hastings?
Total Male Population of Hastings is 3,386.
What is the Total Female Population of Hastings?
Total Female Population of Hastings is 4,118.
What is the Ratio of Males per 100 Females in Hastings?
There are 82.22 Males per 100 Females in Hastings.
What is the Ratio of Females per 100 Males in Hastings?
There are 121.62 Females per 100 Males in Hastings.
What is the Median Population Age in Hastings?
Median Population Age in Hastings is 38.1 Years.
What is the Average Family Size in Hastings
Average Family Size in Hastings is 3.2 People.
What is the Average Household Size in Hastings
Average Household Size in Hastings is 2.3 People.
How Large is the Labor Force in Hastings?
There are 3,599 People in the Labor Forcein in Hastings.
What is the Percentage of People in the Labor Force in Hastings?
56.8% of People are in the Labor Force in Hastings.
What is the Unemployment Rate in Hastings?
Unemployment Rate in Hastings is 6.5%.