Galesburg, MI Map & Demographics
Galesburg Map
Galesburg Overview
$22,302
PER CAPITA INCOME
$52,279
AVG FAMILY INCOME
$45,385
AVG HOUSEHOLD INCOME
27.7%
WAGE / INCOME GAP [ % ]
72.3¢/ $1
WAGE / INCOME GAP [ $ ]
$6,117
FAMILY INCOME DEFICIT
0.39
INEQUALITY / GINI INDEX
2,069
TOTAL POPULATION
1,000
MALE POPULATION
1,069
FEMALE POPULATION
93.55
MALES / 100 FEMALES
106.90
FEMALES / 100 MALES
38.5
MEDIAN AGE
3.1
AVG FAMILY SIZE
2.5
AVG HOUSEHOLD SIZE
899
LABOR FORCE [ PEOPLE ]
54.7%
PERCENT IN LABOR FORCE
5.9%
UNEMPLOYMENT RATE
Galesburg Zip Codes
Galesburg Area Codes
Income in Galesburg
Income Overview in Galesburg
Per Capita Income in Galesburg is $22,302, while median incomes of families and households are $52,279 and $45,385 respectively.
| Characteristic | Number | Measure |
| Per Capita Income | 2,069 | $22,302 |
| Median Family Income | 499 | $52,279 |
| Mean Family Income | 499 | $64,162 |
| Median Household Income | 776 | $45,385 |
| Mean Household Income | 776 | $55,758 |
| Income Deficit | 499 | $6,117 |
| Wage / Income Gap (%) | 2,069 | 27.71% |
| Wage / Income Gap ($) | 2,069 | 72.29¢ per $1 |
| Gini / Inequality Index | 2,069 | 0.39 |
Earnings by Sex in Galesburg
Average Earnings in Galesburg are $32,606, $36,625 for men and $26,477 for women, a difference of 27.7%.
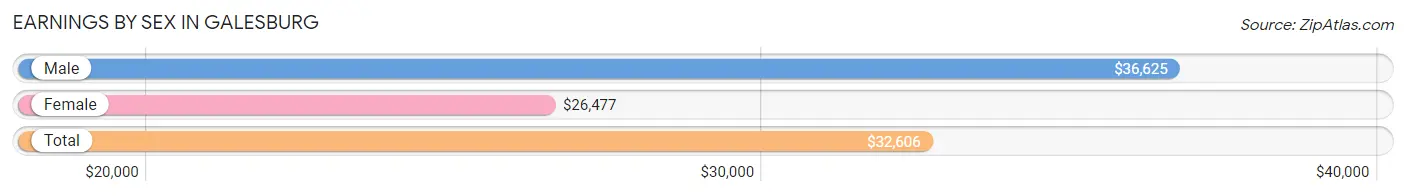
| Sex | Number | Average Earnings |
| Male | 499 (55.0%) | $36,625 |
| Female | 408 (45.0%) | $26,477 |
| Total | 907 (100.0%) | $32,606 |
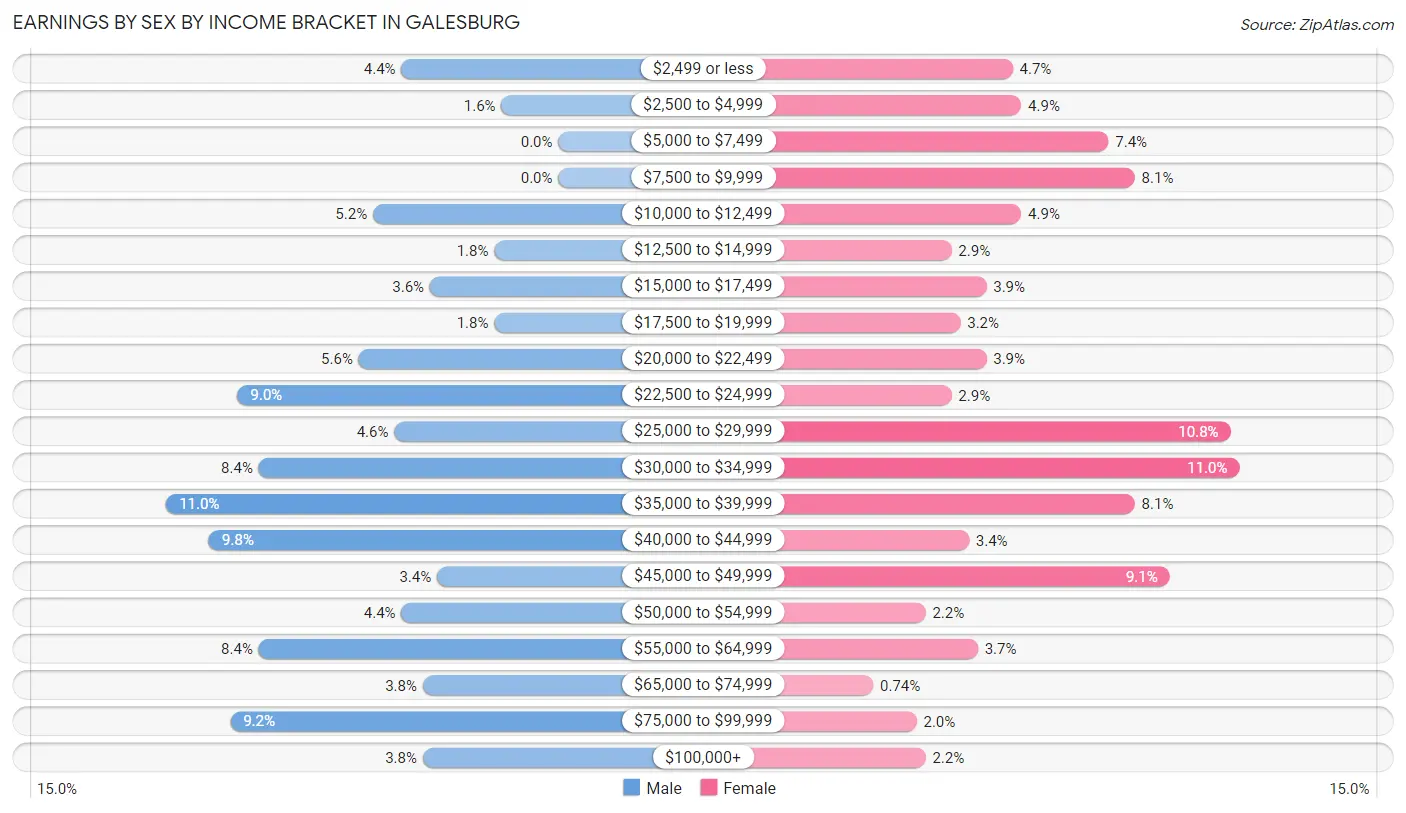
Earnings by Sex by Income Bracket in Galesburg
The most common earnings brackets in Galesburg are $35,000 to $39,999 for men (55 | 11.0%) and $30,000 to $34,999 for women (45 | 11.0%).
| Income | Male | Female |
| $2,499 or less | 22 (4.4%) | 19 (4.7%) |
| $2,500 to $4,999 | 8 (1.6%) | 20 (4.9%) |
| $5,000 to $7,499 | 0 (0.0%) | 30 (7.3%) |
| $7,500 to $9,999 | 0 (0.0%) | 33 (8.1%) |
| $10,000 to $12,499 | 26 (5.2%) | 20 (4.9%) |
| $12,500 to $14,999 | 9 (1.8%) | 12 (2.9%) |
| $15,000 to $17,499 | 18 (3.6%) | 16 (3.9%) |
| $17,500 to $19,999 | 9 (1.8%) | 13 (3.2%) |
| $20,000 to $22,499 | 28 (5.6%) | 16 (3.9%) |
| $22,500 to $24,999 | 45 (9.0%) | 12 (2.9%) |
| $25,000 to $29,999 | 23 (4.6%) | 44 (10.8%) |
| $30,000 to $34,999 | 42 (8.4%) | 45 (11.0%) |
| $35,000 to $39,999 | 55 (11.0%) | 33 (8.1%) |
| $40,000 to $44,999 | 49 (9.8%) | 14 (3.4%) |
| $45,000 to $49,999 | 17 (3.4%) | 37 (9.1%) |
| $50,000 to $54,999 | 22 (4.4%) | 9 (2.2%) |
| $55,000 to $64,999 | 42 (8.4%) | 15 (3.7%) |
| $65,000 to $74,999 | 19 (3.8%) | 3 (0.7%) |
| $75,000 to $99,999 | 46 (9.2%) | 8 (2.0%) |
| $100,000+ | 19 (3.8%) | 9 (2.2%) |
| Total | 499 (100.0%) | 408 (100.0%) |
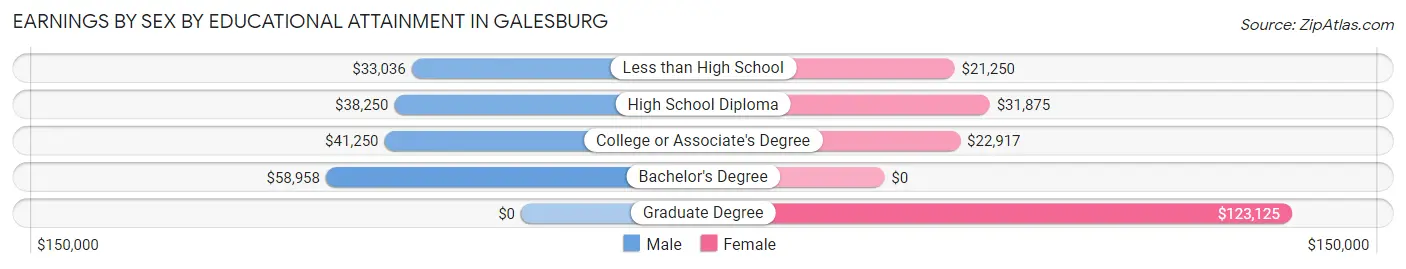
Earnings by Sex by Educational Attainment in Galesburg
Average earnings in Galesburg are $40,179 for men and $29,091 for women, a difference of 27.6%. Men with an educational attainment of bachelor's degree enjoy the highest average annual earnings of $58,958, while those with less than high school education earn the least with $33,036. Women with an educational attainment of graduate degree earn the most with the average annual earnings of $123,125, while those with less than high school education have the smallest earnings of $21,250.
| Educational Attainment | Male Income | Female Income |
| Less than High School | $33,036 | $21,250 |
| High School Diploma | $38,250 | $31,875 |
| College or Associate's Degree | $41,250 | $22,917 |
| Bachelor's Degree | $58,958 | $0 |
| Graduate Degree | - | - |
| Total | $40,179 | $29,091 |
Family Income in Galesburg
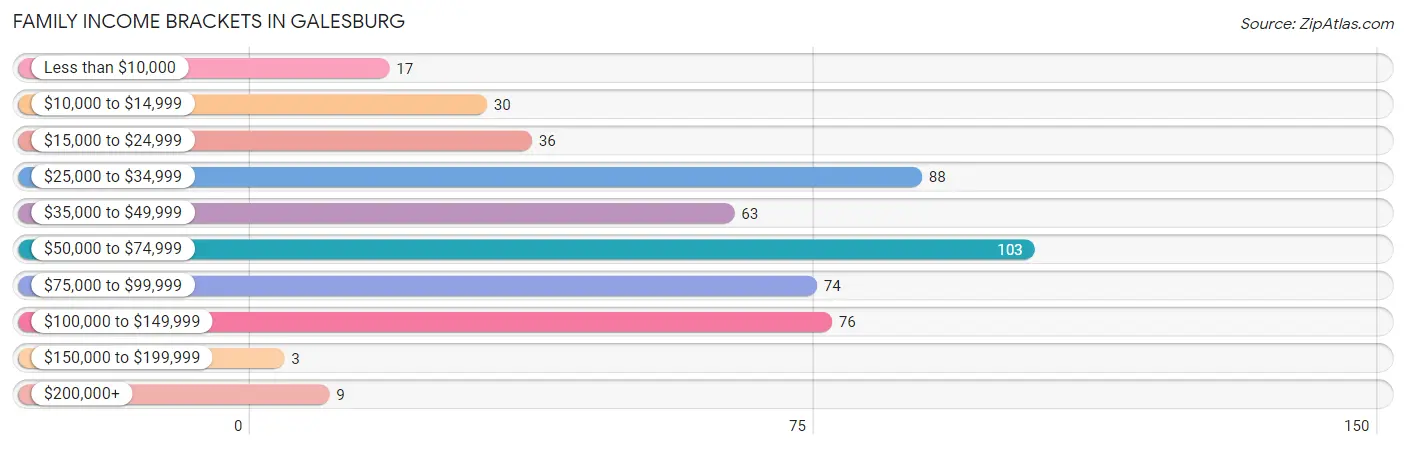
Family Income Brackets in Galesburg
According to the Galesburg family income data, there are 103 families falling into the $50,000 to $74,999 income range, which is the most common income bracket and makes up 20.6% of all families. Conversely, the $150,000 to $199,999 income bracket is the least frequent group with only 3 families (0.6%) belonging to this category.
| Income Bracket | # Families | % Families |
| Less than $10,000 | 17 | 3.4% |
| $10,000 to $14,999 | 30 | 6.0% |
| $15,000 to $24,999 | 36 | 7.2% |
| $25,000 to $34,999 | 88 | 17.6% |
| $35,000 to $49,999 | 63 | 12.6% |
| $50,000 to $74,999 | 103 | 20.6% |
| $75,000 to $99,999 | 74 | 14.8% |
| $100,000 to $149,999 | 76 | 15.2% |
| $150,000 to $199,999 | 3 | 0.6% |
| $200,000+ | 9 | 1.8% |
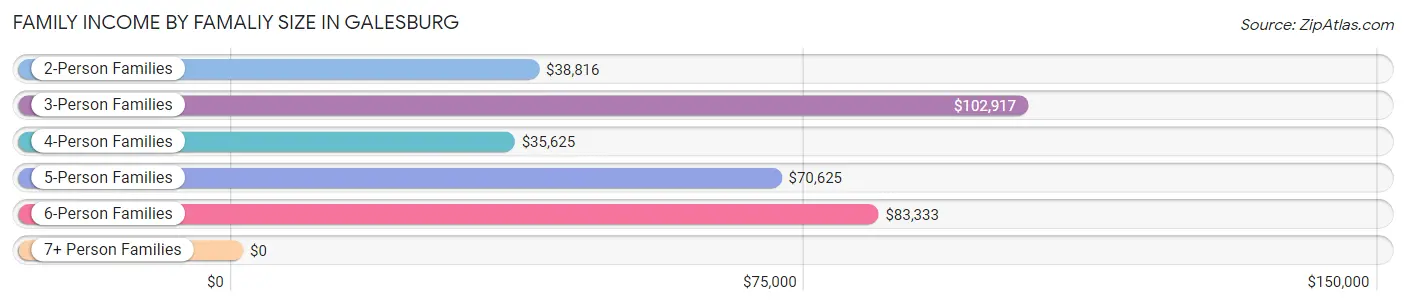
Family Income by Famaliy Size in Galesburg
3-person families (91 | 18.2%) account for the highest median family income in Galesburg with $102,917 per family, while 3-person families (91 | 18.2%) have the highest median income of $34,306 per family member.
| Income Bracket | # Families | Median Income |
| 2-Person Families | 260 (52.1%) | $38,816 |
| 3-Person Families | 91 (18.2%) | $102,917 |
| 4-Person Families | 85 (17.0%) | $35,625 |
| 5-Person Families | 47 (9.4%) | $70,625 |
| 6-Person Families | 10 (2.0%) | $83,333 |
| 7+ Person Families | 6 (1.2%) | $0 |
| Total | 499 (100.0%) | $52,279 |
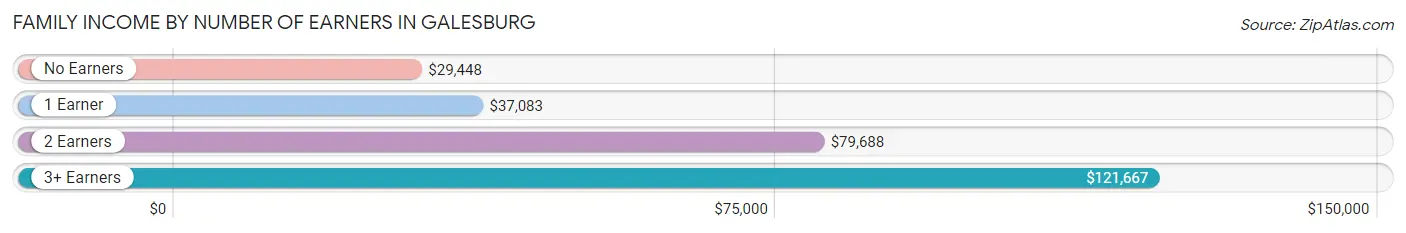
Family Income by Number of Earners in Galesburg
The median family income in Galesburg is $52,279, with families comprising 3+ earners (44) having the highest median family income of $121,667, while families with no earners (125) have the lowest median family income of $29,448, accounting for 8.8% and 25.1% of families, respectively.
| Number of Earners | # Families | Median Income |
| No Earners | 125 (25.1%) | $29,448 |
| 1 Earner | 163 (32.7%) | $37,083 |
| 2 Earners | 167 (33.5%) | $79,688 |
| 3+ Earners | 44 (8.8%) | $121,667 |
| Total | 499 (100.0%) | $52,279 |
Household Income in Galesburg
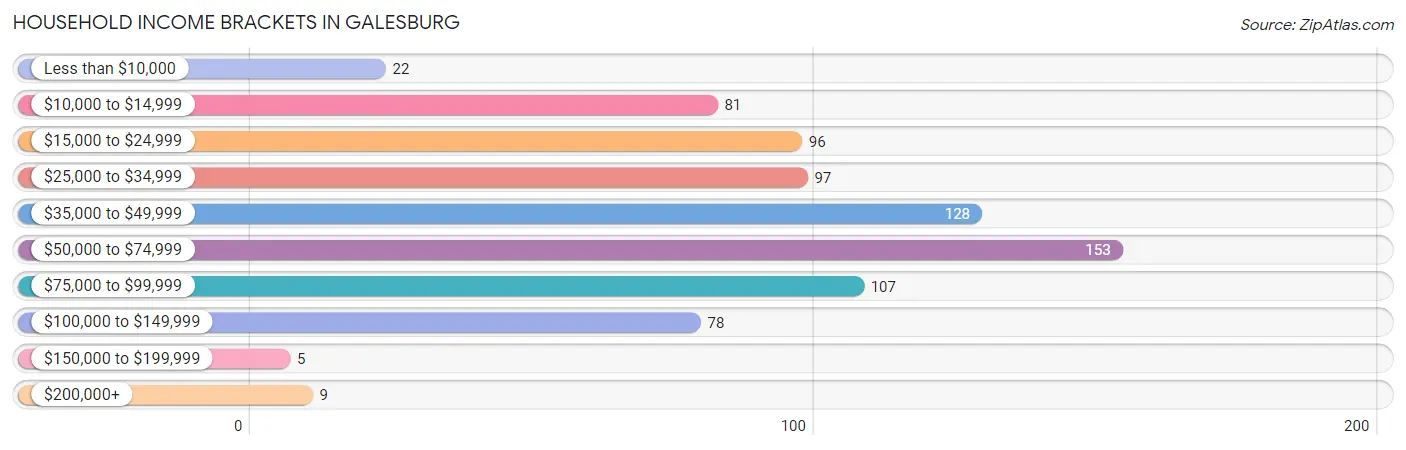
Household Income Brackets in Galesburg
With 153 households falling in the category, the $50,000 to $74,999 income range is the most frequent in Galesburg, accounting for 19.7% of all households. In contrast, only 5 households (0.6%) fall into the $150,000 to $199,999 income bracket, making it the least populous group.
| Income Bracket | # Households | % Households |
| Less than $10,000 | 22 | 2.8% |
| $10,000 to $14,999 | 81 | 10.4% |
| $15,000 to $24,999 | 96 | 12.4% |
| $25,000 to $34,999 | 97 | 12.5% |
| $35,000 to $49,999 | 128 | 16.5% |
| $50,000 to $74,999 | 153 | 19.7% |
| $75,000 to $99,999 | 107 | 13.8% |
| $100,000 to $149,999 | 78 | 10.1% |
| $150,000 to $199,999 | 5 | 0.6% |
| $200,000+ | 9 | 1.2% |
Household Income by Householder Age in Galesburg
The median household income in Galesburg is $45,385, with the highest median household income of $53,409 found in the 25 to 44 years age bracket for the primary householder. A total of 304 households (39.2%) fall into this category. Meanwhile, the 15 to 24 years age bracket for the primary householder has the lowest median household income of $19,167, with 26 households (3.4%) in this group.
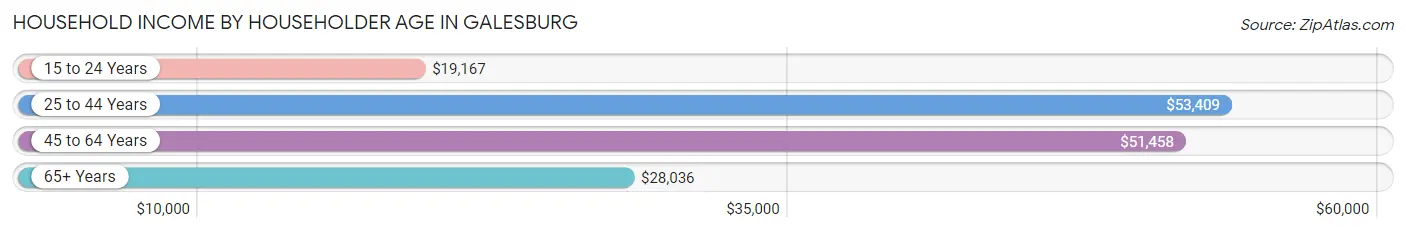
| Income Bracket | # Households | Median Income |
| 15 to 24 Years | 26 (3.4%) | $19,167 |
| 25 to 44 Years | 304 (39.2%) | $53,409 |
| 45 to 64 Years | 270 (34.8%) | $51,458 |
| 65+ Years | 176 (22.7%) | $28,036 |
| Total | 776 (100.0%) | $45,385 |
Poverty in Galesburg
Income Below Poverty by Sex and Age in Galesburg
With 18.1% poverty level for males and 24.4% for females among the residents of Galesburg, 25 to 34 year old males and 5 year old females are the most vulnerable to poverty, with 87 males (46.0%) and 22 females (78.6%) in their respective age groups living below the poverty level.
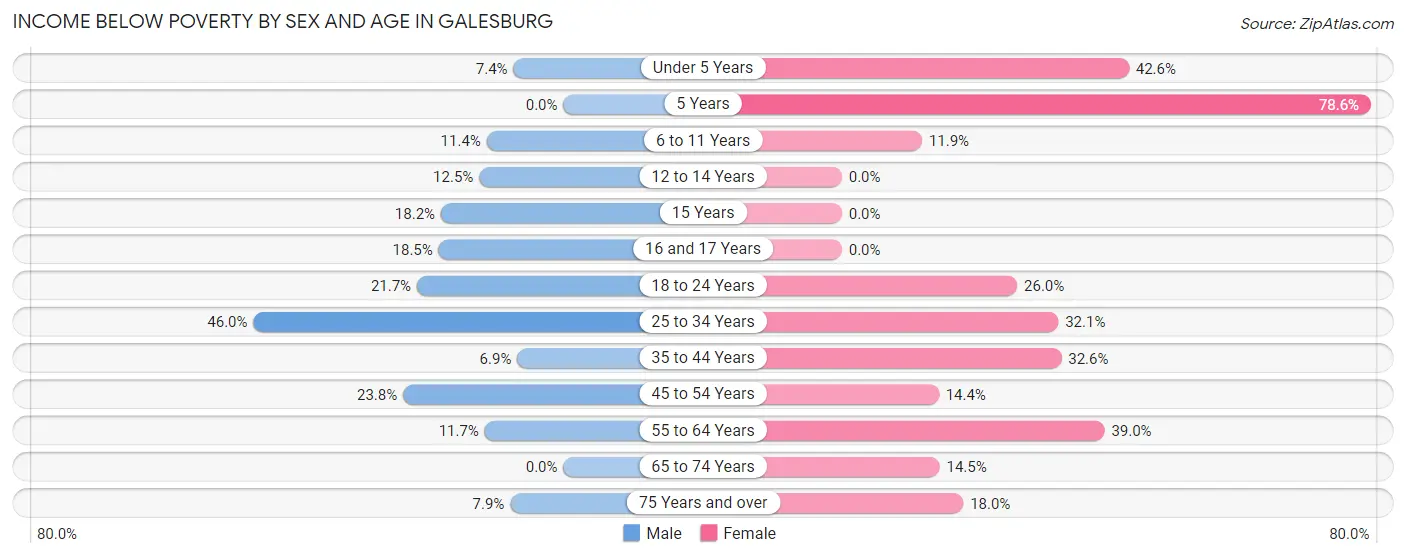
| Age Bracket | Male | Female |
| Under 5 Years | 4 (7.4%) | 26 (42.6%) |
| 5 Years | 0 (0.0%) | 22 (78.6%) |
| 6 to 11 Years | 9 (11.4%) | 10 (11.9%) |
| 12 to 14 Years | 4 (12.5%) | 0 (0.0%) |
| 15 Years | 2 (18.2%) | 0 (0.0%) |
| 16 and 17 Years | 5 (18.5%) | 0 (0.0%) |
| 18 to 24 Years | 20 (21.7%) | 19 (26.0%) |
| 25 to 34 Years | 87 (46.0%) | 36 (32.1%) |
| 35 to 44 Years | 10 (6.9%) | 44 (32.6%) |
| 45 to 54 Years | 15 (23.8%) | 20 (14.4%) |
| 55 to 64 Years | 16 (11.7%) | 39 (39.0%) |
| 65 to 74 Years | 0 (0.0%) | 18 (14.5%) |
| 75 Years and over | 3 (7.9%) | 11 (18.0%) |
| Total | 175 (18.1%) | 245 (24.4%) |
Income Above Poverty by Sex and Age in Galesburg
According to the poverty statistics in Galesburg, males aged 5 years and females aged 12 to 14 years are the age groups that are most secure financially, with 100.0% of males and 100.0% of females in these age groups living above the poverty line.
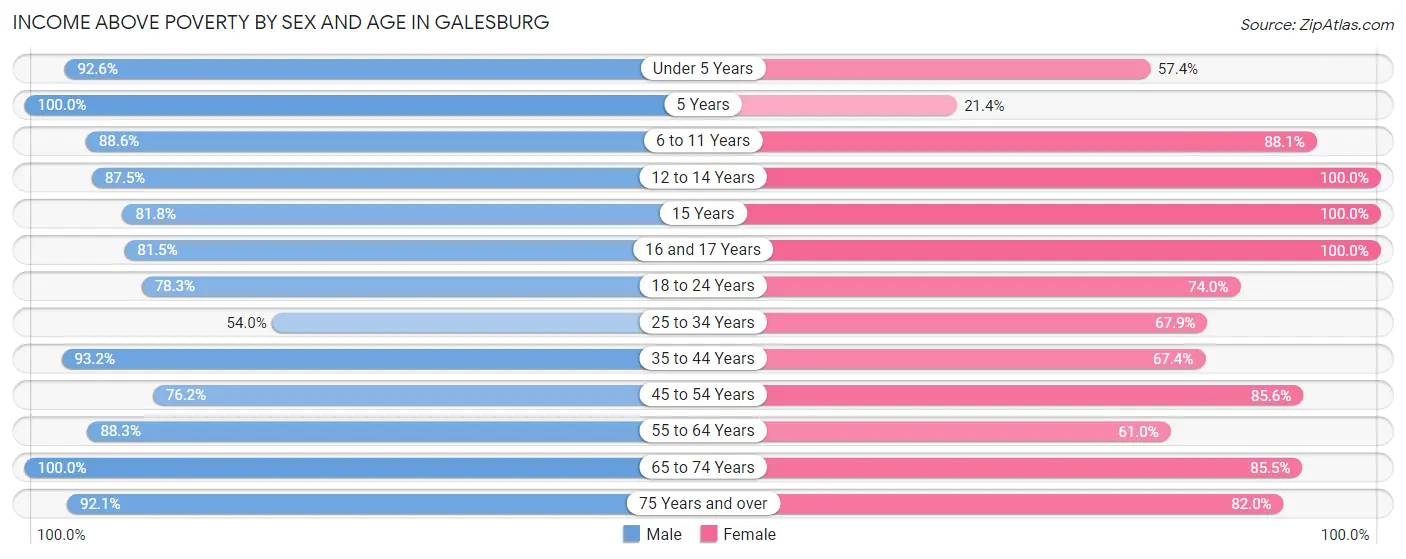
| Age Bracket | Male | Female |
| Under 5 Years | 50 (92.6%) | 35 (57.4%) |
| 5 Years | 6 (100.0%) | 6 (21.4%) |
| 6 to 11 Years | 70 (88.6%) | 74 (88.1%) |
| 12 to 14 Years | 28 (87.5%) | 43 (100.0%) |
| 15 Years | 9 (81.8%) | 16 (100.0%) |
| 16 and 17 Years | 22 (81.5%) | 27 (100.0%) |
| 18 to 24 Years | 72 (78.3%) | 54 (74.0%) |
| 25 to 34 Years | 102 (54.0%) | 76 (67.9%) |
| 35 to 44 Years | 136 (93.1%) | 91 (67.4%) |
| 45 to 54 Years | 48 (76.2%) | 119 (85.6%) |
| 55 to 64 Years | 121 (88.3%) | 61 (61.0%) |
| 65 to 74 Years | 93 (100.0%) | 106 (85.5%) |
| 75 Years and over | 35 (92.1%) | 50 (82.0%) |
| Total | 792 (81.9%) | 758 (75.6%) |
Income Below Poverty Among Married-Couple Families in Galesburg
The poverty statistics for married-couple families in Galesburg show that 8.4% or 26 of the total 309 families live below the poverty line. Families with 1 or 2 children have the highest poverty rate of 18.4%, comprising of 14 families. On the other hand, families with 3 or 4 children have the lowest poverty rate of 0.0%, which includes 0 families.
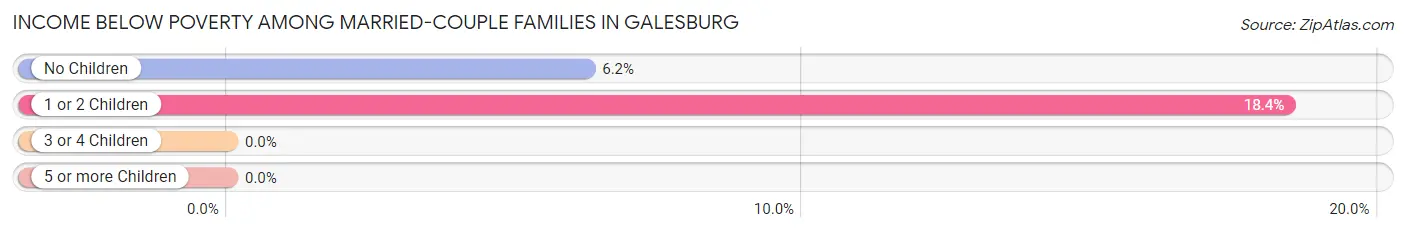
| Children | Above Poverty | Below Poverty |
| No Children | 181 (93.8%) | 12 (6.2%) |
| 1 or 2 Children | 62 (81.6%) | 14 (18.4%) |
| 3 or 4 Children | 40 (100.0%) | 0 (0.0%) |
| 5 or more Children | 0 (0.0%) | 0 (0.0%) |
| Total | 283 (91.6%) | 26 (8.4%) |
Income Below Poverty Among Single-Parent Households in Galesburg
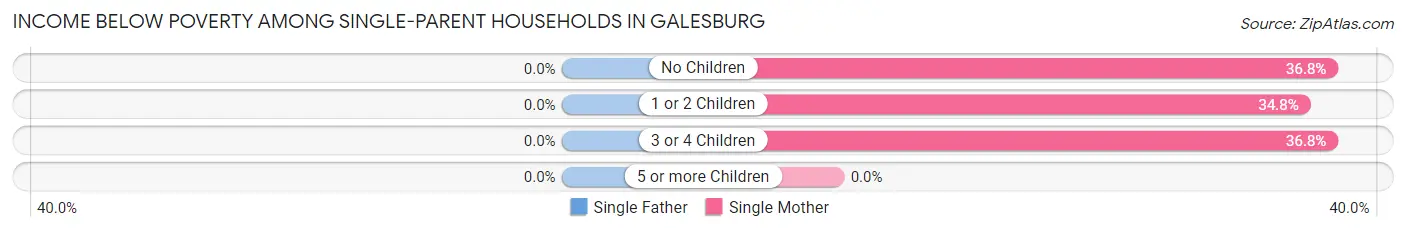
| Children | Single Father | Single Mother |
| No Children | 0 (0.0%) | 21 (36.8%) |
| 1 or 2 Children | 0 (0.0%) | 32 (34.8%) |
| 3 or 4 Children | 0 (0.0%) | 7 (36.8%) |
| 5 or more Children | 0 (0.0%) | 0 (0.0%) |
| Total | 0 (0.0%) | 60 (35.7%) |
Income Below Poverty Among Married-Couple vs Single-Parent Households in Galesburg
The poverty data for Galesburg shows that 26 of the married-couple family households (8.4%) and 60 of the single-parent households (31.6%) are living below the poverty level. Within the married-couple family households, those with 1 or 2 children have the highest poverty rate, with 14 households (18.4%) falling below the poverty line. Among the single-parent households, those with 3 or 4 children have the highest poverty rate, with 7 household (36.8%) living below poverty.
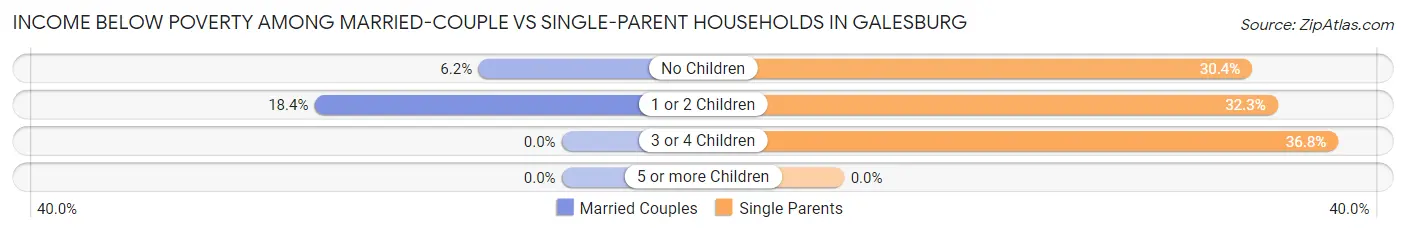
| Children | Married-Couple Families | Single-Parent Households |
| No Children | 12 (6.2%) | 21 (30.4%) |
| 1 or 2 Children | 14 (18.4%) | 32 (32.3%) |
| 3 or 4 Children | 0 (0.0%) | 7 (36.8%) |
| 5 or more Children | 0 (0.0%) | 0 (0.0%) |
| Total | 26 (8.4%) | 60 (31.6%) |
Race in Galesburg
The most populous races in Galesburg are White / Caucasian (1,721 | 83.2%), Two or more Races (181 | 8.7%), and Black / African American (154 | 7.4%).
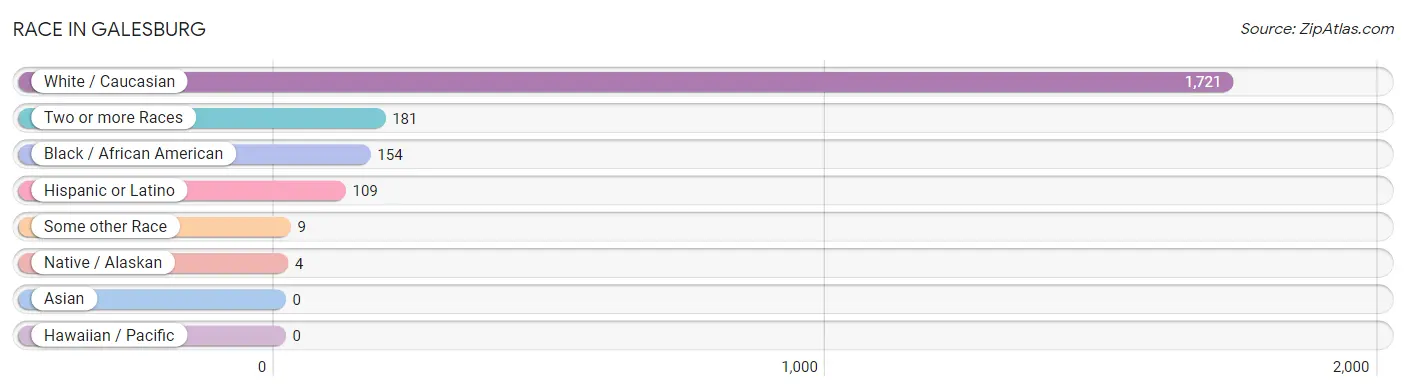
| Race | # Population | % Population |
| Asian | 0 | 0.0% |
| Black / African American | 154 | 7.4% |
| Hawaiian / Pacific | 0 | 0.0% |
| Hispanic or Latino | 109 | 5.3% |
| Native / Alaskan | 4 | 0.2% |
| White / Caucasian | 1,721 | 83.2% |
| Two or more Races | 181 | 8.7% |
| Some other Race | 9 | 0.4% |
| Total | 2,069 | 100.0% |
Ancestry in Galesburg
The most populous ancestries reported in Galesburg are Dutch (249 | 12.0%), English (235 | 11.4%), Irish (231 | 11.2%), German (206 | 10.0%), and American (169 | 8.2%), together accounting for 52.7% of all Galesburg residents.
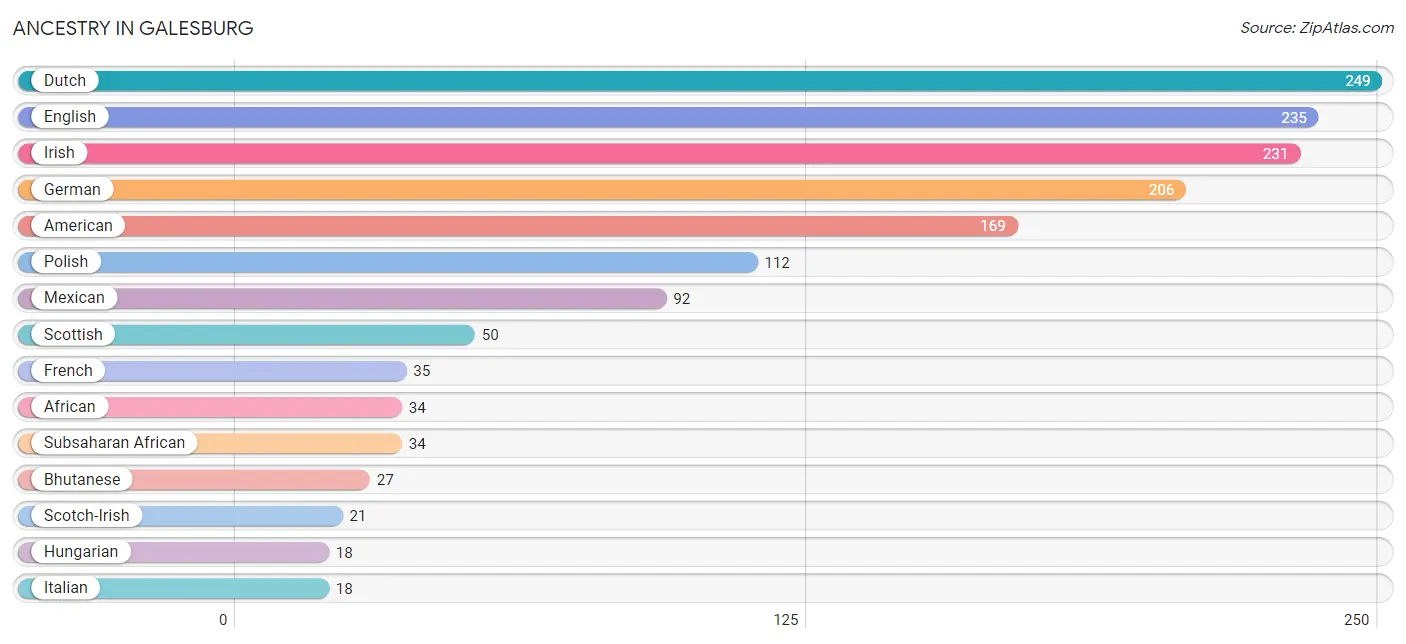
| Ancestry | # Population | % Population |
| African | 34 | 1.6% |
| American | 169 | 8.2% |
| Bhutanese | 27 | 1.3% |
| British | 2 | 0.1% |
| Canadian | 9 | 0.4% |
| Cherokee | 8 | 0.4% |
| Czech | 3 | 0.1% |
| Czechoslovakian | 14 | 0.7% |
| Dutch | 249 | 12.0% |
| English | 235 | 11.4% |
| European | 7 | 0.3% |
| French | 35 | 1.7% |
| German | 206 | 10.0% |
| Hungarian | 18 | 0.9% |
| Irish | 231 | 11.2% |
| Italian | 18 | 0.9% |
| Lithuanian | 3 | 0.1% |
| Mexican | 92 | 4.4% |
| Norwegian | 13 | 0.6% |
| Polish | 112 | 5.4% |
| Scandinavian | 7 | 0.3% |
| Scotch-Irish | 21 | 1.0% |
| Scottish | 50 | 2.4% |
| Shoshone | 4 | 0.2% |
| Slovak | 7 | 0.3% |
| Spaniard | 3 | 0.1% |
| Spanish | 14 | 0.7% |
| Subsaharan African | 34 | 1.6% |
| Swedish | 9 | 0.4% |
| Ukrainian | 17 | 0.8% | View All 30 Rows |
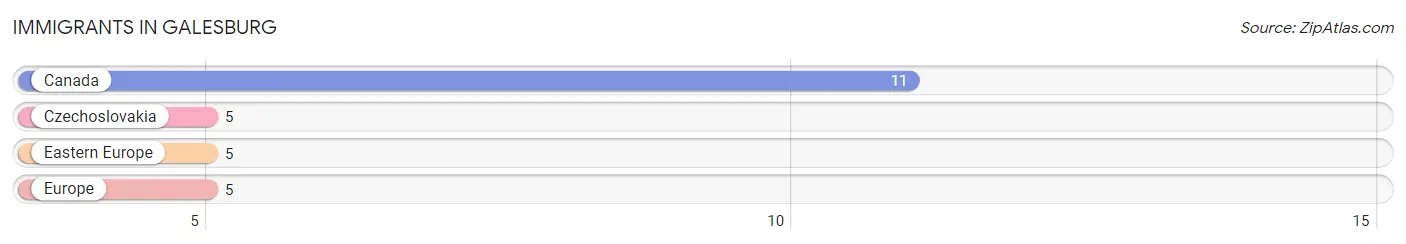
Immigrants in Galesburg
The most numerous immigrant groups reported in Galesburg came from Canada (11 | 0.5%), Czechoslovakia (5 | 0.2%), Eastern Europe (5 | 0.2%), and Europe (5 | 0.2%), together accounting for 1.2% of all Galesburg residents.
| Immigration Origin | # Population | % Population |
| Canada | 11 | 0.5% |
| Czechoslovakia | 5 | 0.2% |
| Eastern Europe | 5 | 0.2% |
| Europe | 5 | 0.2% | View All 4 Rows |
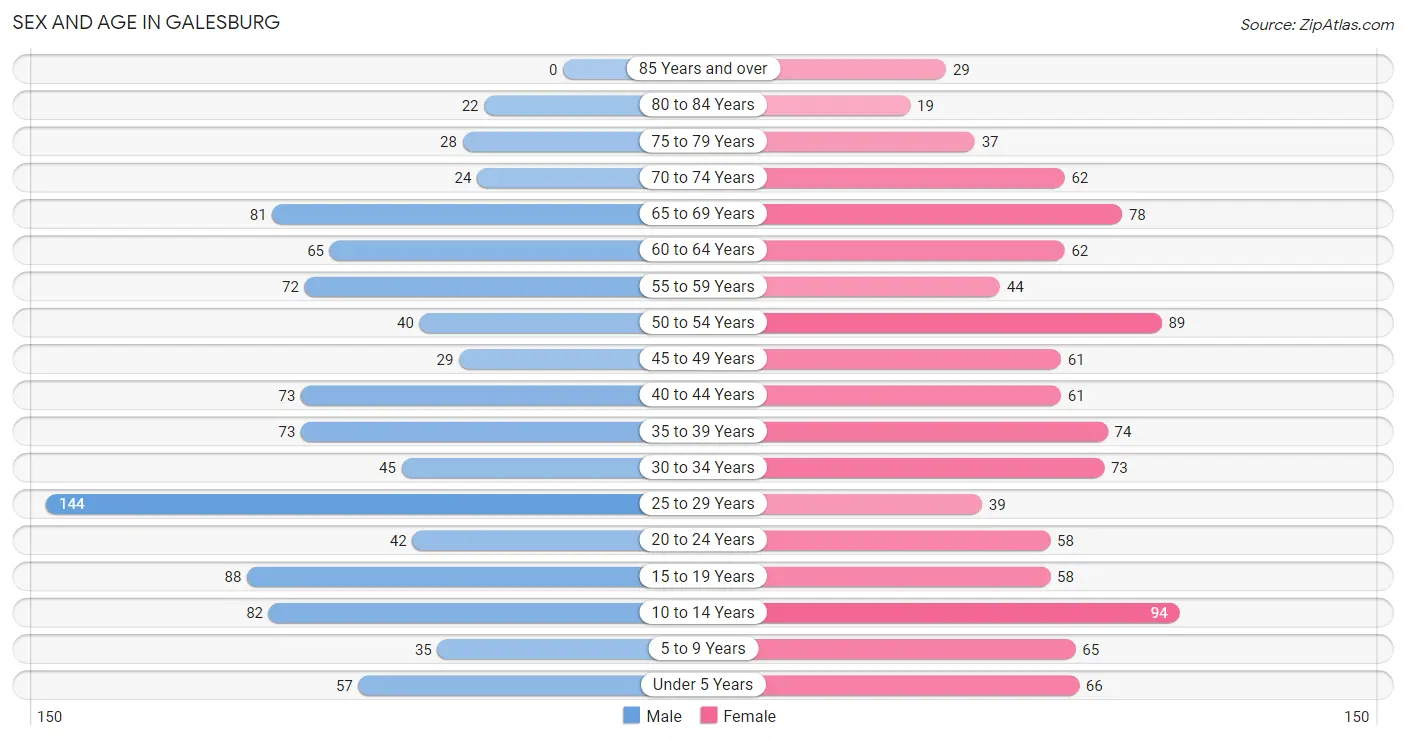
Sex and Age in Galesburg
Sex and Age in Galesburg
The most populous age groups in Galesburg are 25 to 29 Years (144 | 14.4%) for men and 10 to 14 Years (94 | 8.8%) for women.
| Age Bracket | Male | Female |
| Under 5 Years | 57 (5.7%) | 66 (6.2%) |
| 5 to 9 Years | 35 (3.5%) | 65 (6.1%) |
| 10 to 14 Years | 82 (8.2%) | 94 (8.8%) |
| 15 to 19 Years | 88 (8.8%) | 58 (5.4%) |
| 20 to 24 Years | 42 (4.2%) | 58 (5.4%) |
| 25 to 29 Years | 144 (14.4%) | 39 (3.6%) |
| 30 to 34 Years | 45 (4.5%) | 73 (6.8%) |
| 35 to 39 Years | 73 (7.3%) | 74 (6.9%) |
| 40 to 44 Years | 73 (7.3%) | 61 (5.7%) |
| 45 to 49 Years | 29 (2.9%) | 61 (5.7%) |
| 50 to 54 Years | 40 (4.0%) | 89 (8.3%) |
| 55 to 59 Years | 72 (7.2%) | 44 (4.1%) |
| 60 to 64 Years | 65 (6.5%) | 62 (5.8%) |
| 65 to 69 Years | 81 (8.1%) | 78 (7.3%) |
| 70 to 74 Years | 24 (2.4%) | 62 (5.8%) |
| 75 to 79 Years | 28 (2.8%) | 37 (3.5%) |
| 80 to 84 Years | 22 (2.2%) | 19 (1.8%) |
| 85 Years and over | 0 (0.0%) | 29 (2.7%) |
| Total | 1,000 (100.0%) | 1,069 (100.0%) |
Families and Households in Galesburg
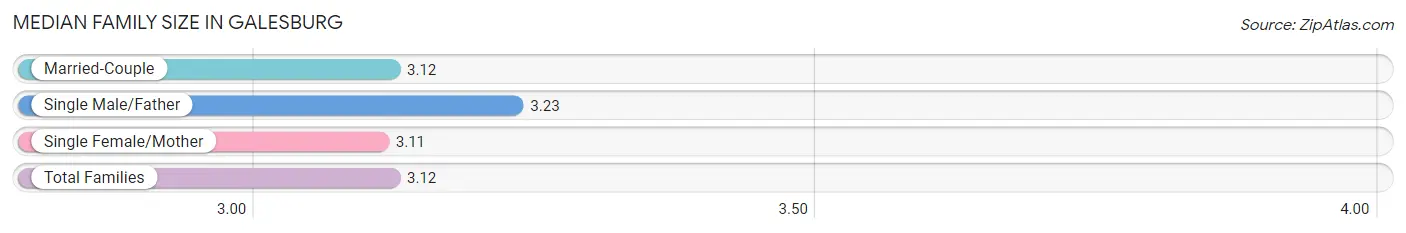
Median Family Size in Galesburg
The median family size in Galesburg is 3.12 persons per family, with single male/father families (22 | 4.4%) accounting for the largest median family size of 3.23 persons per family. On the other hand, single female/mother families (168 | 33.7%) represent the smallest median family size with 3.11 persons per family.
| Family Type | # Families | Family Size |
| Married-Couple | 309 (61.9%) | 3.12 |
| Single Male/Father | 22 (4.4%) | 3.23 |
| Single Female/Mother | 168 (33.7%) | 3.11 |
| Total Families | 499 (100.0%) | 3.12 |
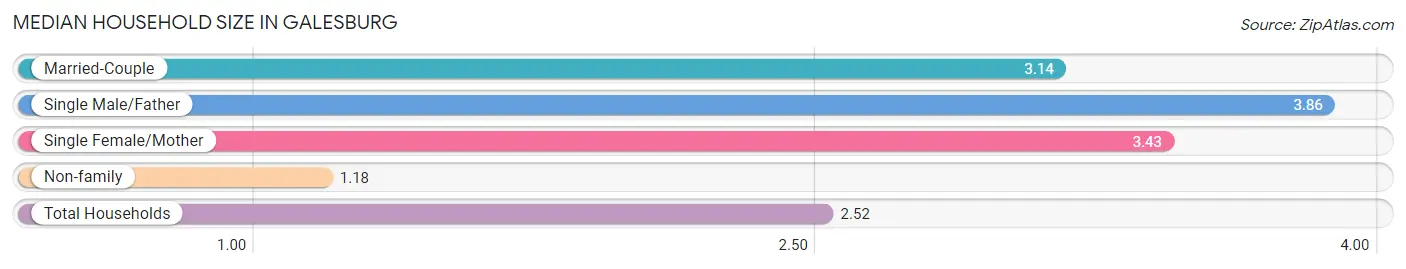
Median Household Size in Galesburg
The median household size in Galesburg is 2.52 persons per household, with single male/father households (22 | 2.8%) accounting for the largest median household size of 3.86 persons per household. non-family households (277 | 35.7%) represent the smallest median household size with 1.18 persons per household.
| Household Type | # Households | Household Size |
| Married-Couple | 309 (39.8%) | 3.14 |
| Single Male/Father | 22 (2.8%) | 3.86 |
| Single Female/Mother | 168 (21.6%) | 3.43 |
| Non-family | 277 (35.7%) | 1.18 |
| Total Households | 776 (100.0%) | 2.52 |
Household Size by Marriage Status in Galesburg
Out of a total of 776 households in Galesburg, 499 (64.3%) are family households, while 277 (35.7%) are nonfamily households. The most numerous type of family households are 2-person households, comprising 211, and the most common type of nonfamily households are 1-person households, comprising 241.
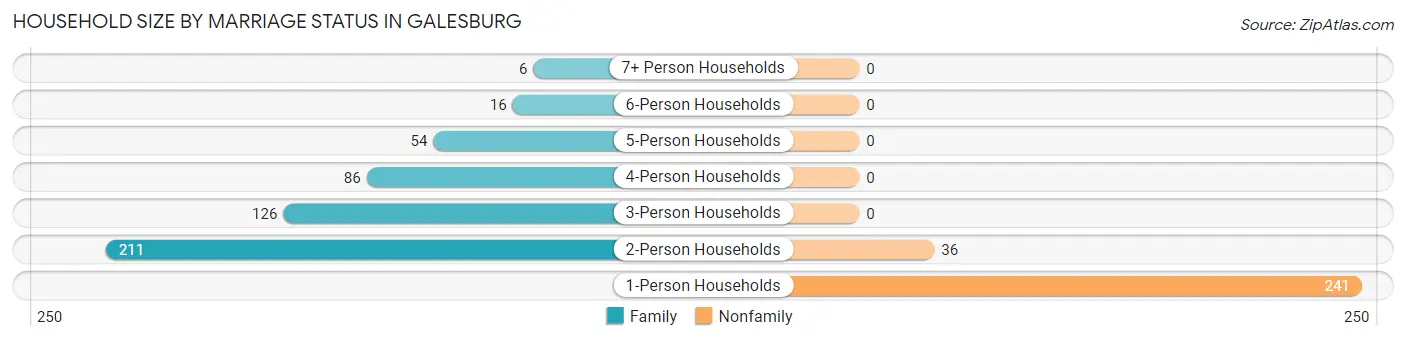
| Household Size | Family Households | Nonfamily Households |
| 1-Person Households | - | 241 (31.1%) |
| 2-Person Households | 211 (27.2%) | 36 (4.6%) |
| 3-Person Households | 126 (16.2%) | 0 (0.0%) |
| 4-Person Households | 86 (11.1%) | 0 (0.0%) |
| 5-Person Households | 54 (7.0%) | 0 (0.0%) |
| 6-Person Households | 16 (2.1%) | 0 (0.0%) |
| 7+ Person Households | 6 (0.8%) | 0 (0.0%) |
| Total | 499 (64.3%) | 277 (35.7%) |
Female Fertility in Galesburg
Fertility by Age in Galesburg
Average fertility rate in Galesburg is 36.0 births per 1,000 women. Women in the age bracket of 20 to 34 years have the highest fertility rate with 94.0 births per 1,000 women. Women in the age bracket of 20 to 34 years acount for 100.0% of all women with births.
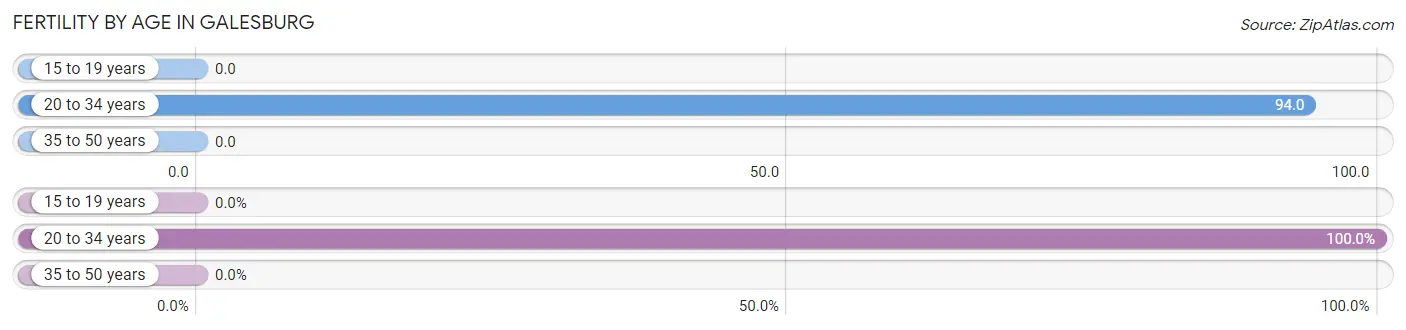
| Age Bracket | Women with Births | Births / 1,000 Women |
| 15 to 19 years | 0 (0.0%) | 0.0 |
| 20 to 34 years | 16 (100.0%) | 94.0 |
| 35 to 50 years | 0 (0.0%) | 0.0 |
| Total | 16 (100.0%) | 36.0 |
Fertility by Age by Marriage Status in Galesburg
81.2% of women with births (16) in Galesburg are married. The highest percentage of unmarried women with births falls into 20 to 34 years age bracket with 18.8% of them unmarried at the time of birth, while the lowest percentage of unmarried women with births belong to 20 to 34 years age bracket with 18.8% of them unmarried.
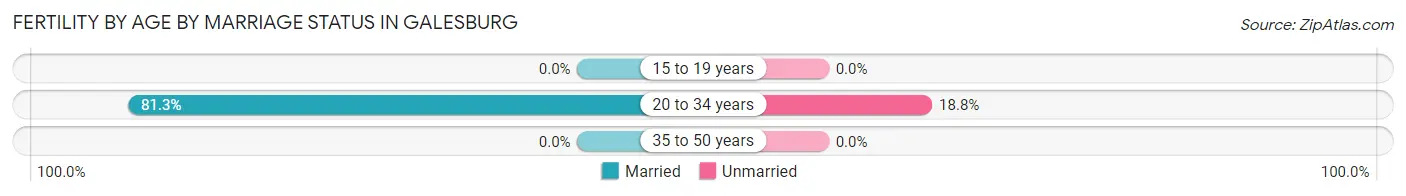
| Age Bracket | Married | Unmarried |
| 15 to 19 years | 0 (0.0%) | 0 (0.0%) |
| 20 to 34 years | 13 (81.2%) | 3 (18.8%) |
| 35 to 50 years | 0 (0.0%) | 0 (0.0%) |
| Total | 13 (81.2%) | 3 (18.8%) |
Fertility by Education in Galesburg
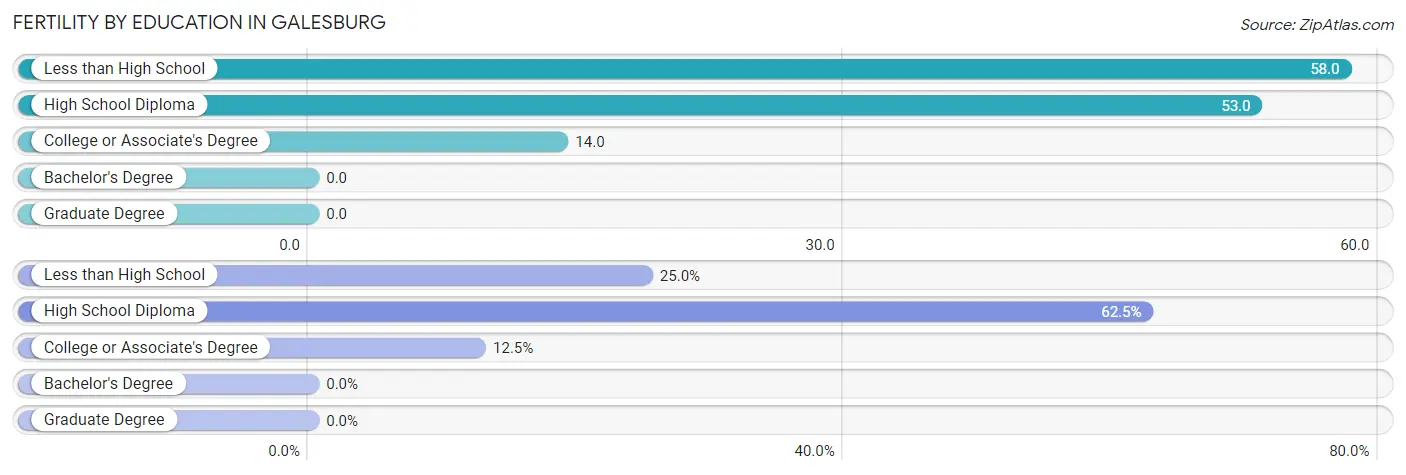
| Educational Attainment | Women with Births | Births / 1,000 Women |
| Less than High School | 4 (25.0%) | 58.0 |
| High School Diploma | 10 (62.5%) | 53.0 |
| College or Associate's Degree | 2 (12.5%) | 14.0 |
| Bachelor's Degree | 0 (0.0%) | 0.0 |
| Graduate Degree | 0 (0.0%) | 0.0 |
| Total | 16 (100.0%) | 36.0 |
Fertility by Education by Marriage Status in Galesburg
18.8% of women with births in Galesburg are unmarried. Women with the educational attainment of less than high school are most likely to be married with 100.0% of them married at childbirth, while women with the educational attainment of high school diploma are least likely to be married with 30.0% of them unmarried at childbirth.
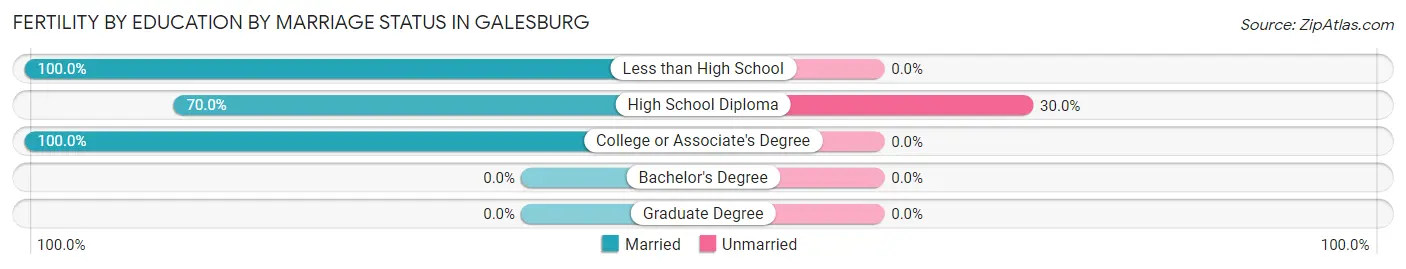
| Educational Attainment | Married | Unmarried |
| Less than High School | 4 (100.0%) | 0 (0.0%) |
| High School Diploma | 7 (70.0%) | 3 (30.0%) |
| College or Associate's Degree | 2 (100.0%) | 0 (0.0%) |
| Bachelor's Degree | 0 (0.0%) | 0 (0.0%) |
| Graduate Degree | 0 (0.0%) | 0 (0.0%) |
| Total | 13 (81.2%) | 3 (18.8%) |
Employment Characteristics in Galesburg
Employment by Class of Employer in Galesburg
Among the 822 employed individuals in Galesburg, private company employees (658 | 80.0%), not-for-profit organizations (60 | 7.3%), and local government employees (48 | 5.8%) make up the most common classes of employment.
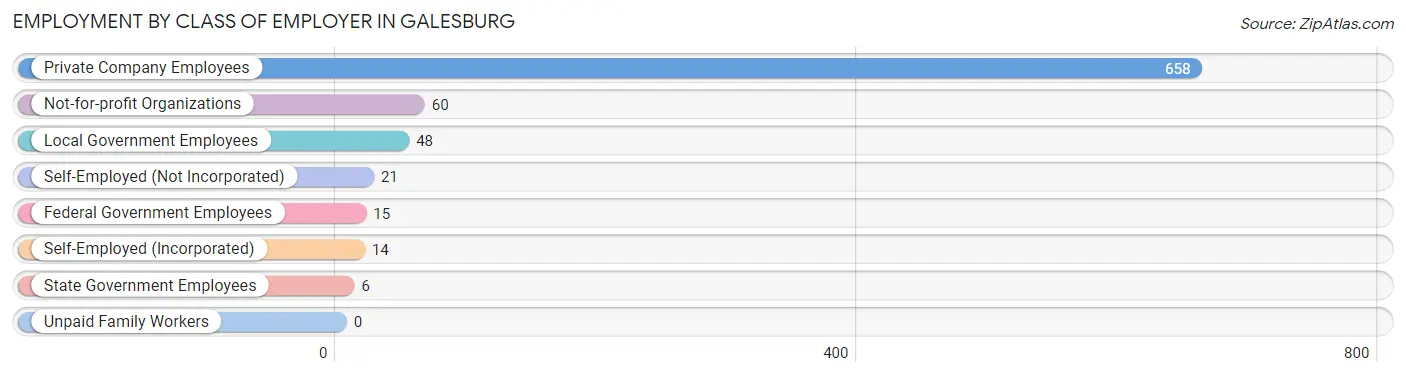
| Employer Class | # Employees | % Employees |
| Private Company Employees | 658 | 80.0% |
| Self-Employed (Incorporated) | 14 | 1.7% |
| Self-Employed (Not Incorporated) | 21 | 2.5% |
| Not-for-profit Organizations | 60 | 7.3% |
| Local Government Employees | 48 | 5.8% |
| State Government Employees | 6 | 0.7% |
| Federal Government Employees | 15 | 1.8% |
| Unpaid Family Workers | 0 | 0.0% |
| Total | 822 | 100.0% |
Employment Status by Age in Galesburg
According to the labor force statistics for Galesburg, out of the total population over 16 years of age (1,643), 54.7% or 899 individuals are in the labor force, with 5.9% or 53 of them unemployed. The age group with the highest labor force participation rate is 20 to 24 years, with 100.0% or 100 individuals in the labor force. Within the labor force, the 16 to 19 years age range has the highest percentage of unemployed individuals, with 25.4% or 16 of them being unemployed.
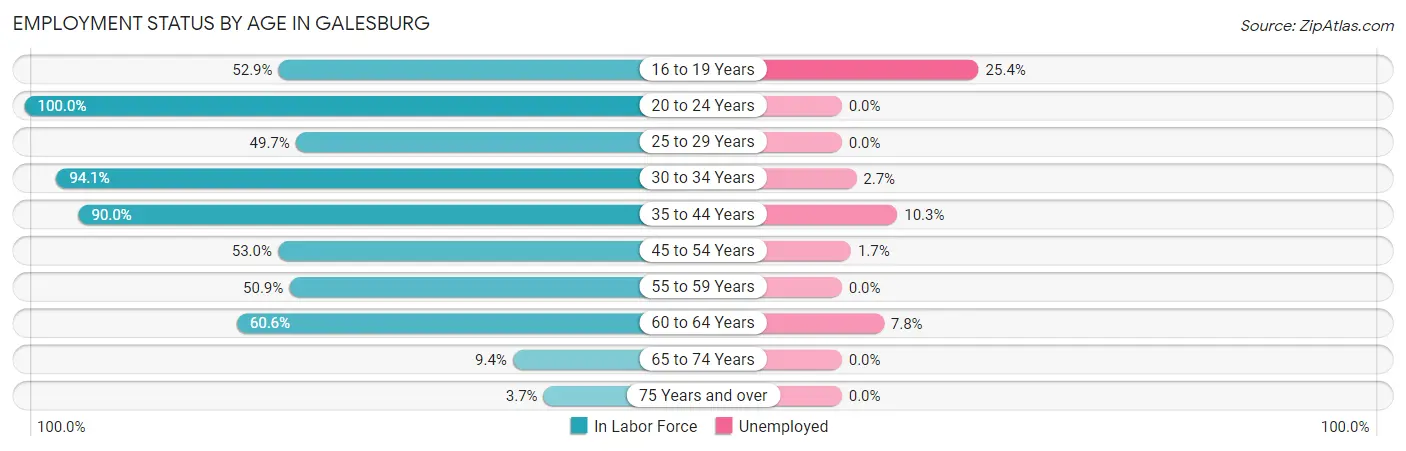
| Age Bracket | In Labor Force | Unemployed |
| 16 to 19 Years | 63 (52.9%) | 16 (25.4%) |
| 20 to 24 Years | 100 (100.0%) | 0 (0.0%) |
| 25 to 29 Years | 91 (49.7%) | 0 (0.0%) |
| 30 to 34 Years | 111 (94.1%) | 3 (2.7%) |
| 35 to 44 Years | 253 (90.0%) | 26 (10.3%) |
| 45 to 54 Years | 116 (53.0%) | 2 (1.7%) |
| 55 to 59 Years | 59 (50.9%) | 0 (0.0%) |
| 60 to 64 Years | 77 (60.6%) | 6 (7.8%) |
| 65 to 74 Years | 23 (9.4%) | 0 (0.0%) |
| 75 Years and over | 5 (3.7%) | 0 (0.0%) |
| Total | 899 (54.7%) | 53 (5.9%) |
Employment Status by Educational Attainment in Galesburg
According to labor force statistics for Galesburg, 67.7% of individuals (707) out of the total population between 25 and 64 years of age (1,044) are in the labor force, with 5.3% or 37 of them being unemployed. The group with the highest labor force participation rate are those with the educational attainment of bachelor's degree or higher, with 77.5% or 93 individuals in the labor force. Within the labor force, individuals with bachelor's degree or higher education have the highest percentage of unemployment, with 8.6% or 8 of them being unemployed.
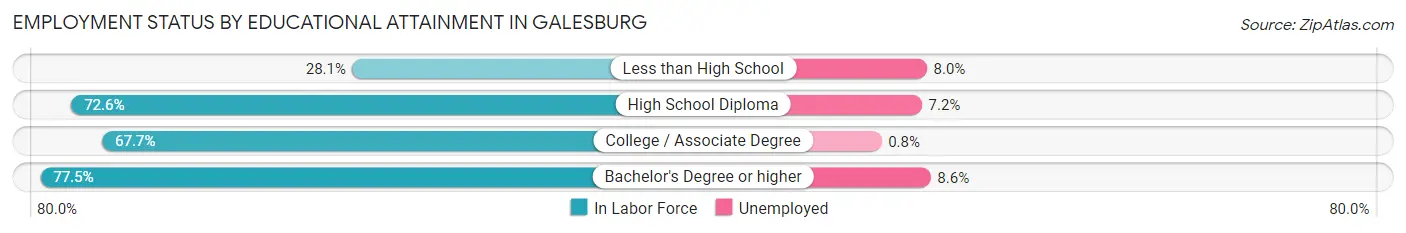
| Educational Attainment | In Labor Force | Unemployed |
| Less than High School | 25 (28.1%) | 7 (8.0%) |
| High School Diploma | 352 (72.6%) | 35 (7.2%) |
| College / Associate Degree | 237 (67.7%) | 3 (0.8%) |
| Bachelor's Degree or higher | 93 (77.5%) | 10 (8.6%) |
| Total | 707 (67.7%) | 55 (5.3%) |
Employment Occupations by Sex in Galesburg
Management, Business, Science and Arts Occupations
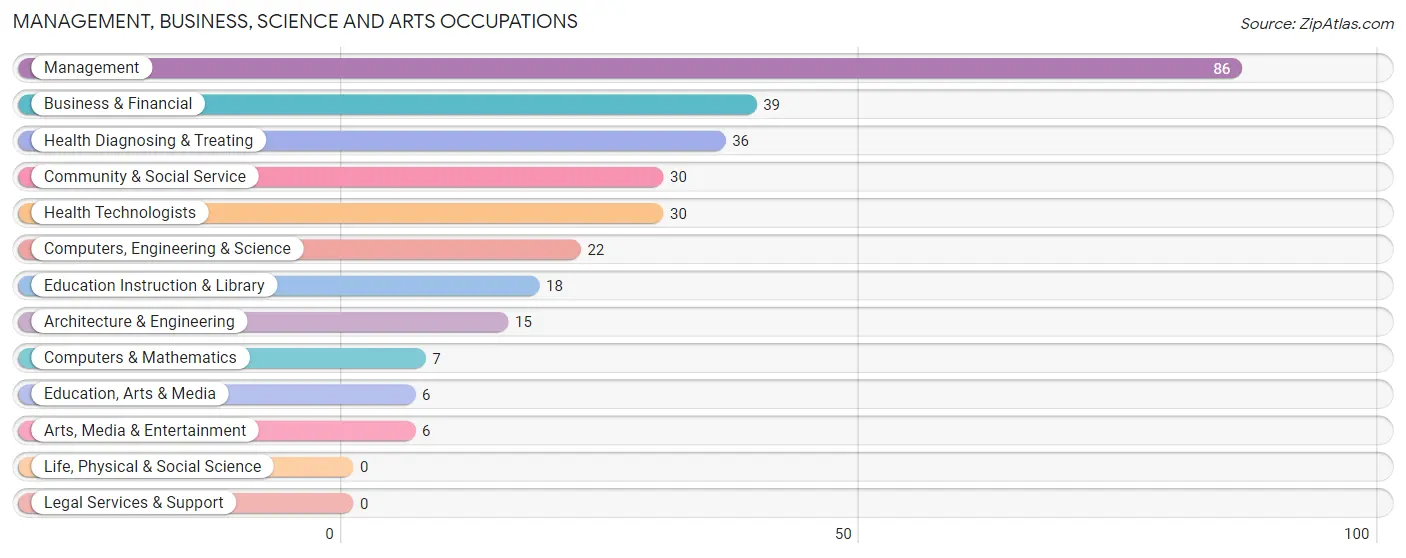
The most common Management, Business, Science and Arts occupations in Galesburg are Management (86 | 10.2%), Business & Financial (39 | 4.6%), Health Diagnosing & Treating (36 | 4.3%), Community & Social Service (30 | 3.6%), and Health Technologists (30 | 3.6%).
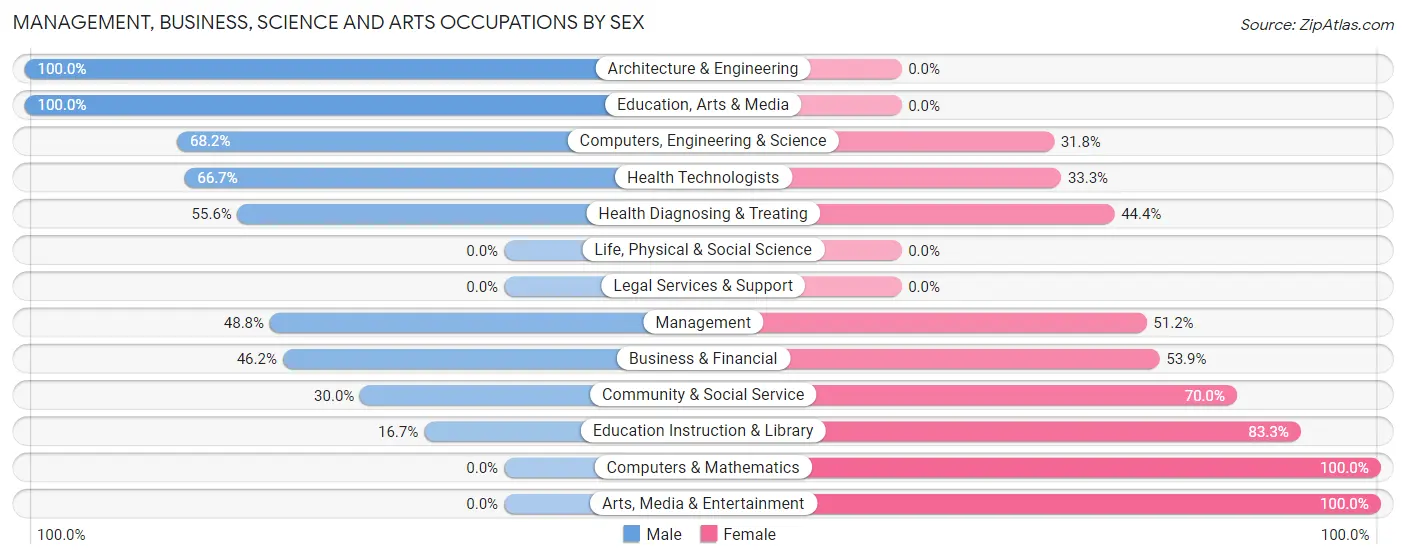
Management, Business, Science and Arts Occupations by Sex
Within the Management, Business, Science and Arts occupations in Galesburg, the most male-oriented occupations are Architecture & Engineering (100.0%), Education, Arts & Media (100.0%), and Computers, Engineering & Science (68.2%), while the most female-oriented occupations are Computers & Mathematics (100.0%), Arts, Media & Entertainment (100.0%), and Education Instruction & Library (83.3%).
| Occupation | Male | Female |
| Management | 42 (48.8%) | 44 (51.2%) |
| Business & Financial | 18 (46.2%) | 21 (53.8%) |
| Computers, Engineering & Science | 15 (68.2%) | 7 (31.8%) |
| Computers & Mathematics | 0 (0.0%) | 7 (100.0%) |
| Architecture & Engineering | 15 (100.0%) | 0 (0.0%) |
| Life, Physical & Social Science | 0 (0.0%) | 0 (0.0%) |
| Community & Social Service | 9 (30.0%) | 21 (70.0%) |
| Education, Arts & Media | 6 (100.0%) | 0 (0.0%) |
| Legal Services & Support | 0 (0.0%) | 0 (0.0%) |
| Education Instruction & Library | 3 (16.7%) | 15 (83.3%) |
| Arts, Media & Entertainment | 0 (0.0%) | 6 (100.0%) |
| Health Diagnosing & Treating | 20 (55.6%) | 16 (44.4%) |
| Health Technologists | 20 (66.7%) | 10 (33.3%) |
| Total (Category) | 104 (48.8%) | 109 (51.2%) |
| Total (Overall) | 457 (54.3%) | 385 (45.7%) |
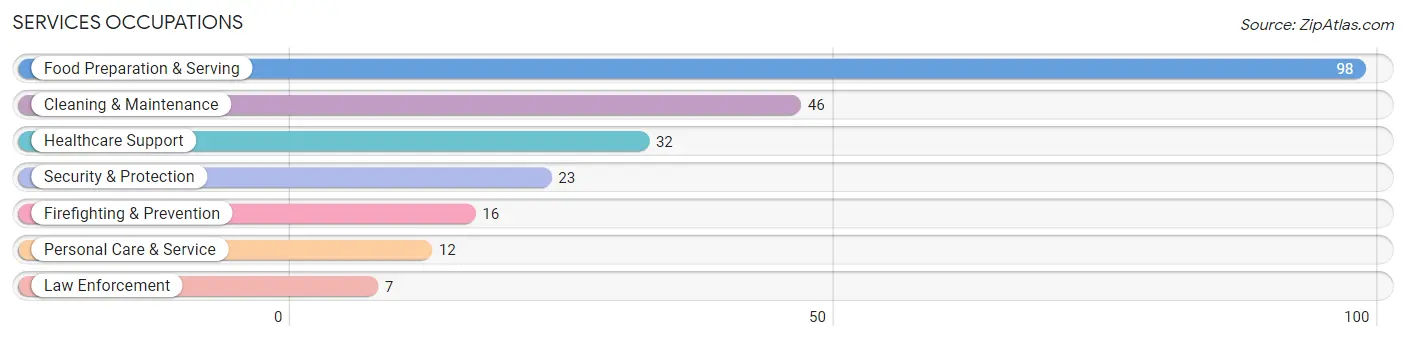
Services Occupations
The most common Services occupations in Galesburg are Food Preparation & Serving (98 | 11.6%), Cleaning & Maintenance (46 | 5.5%), Healthcare Support (32 | 3.8%), Security & Protection (23 | 2.7%), and Firefighting & Prevention (16 | 1.9%).
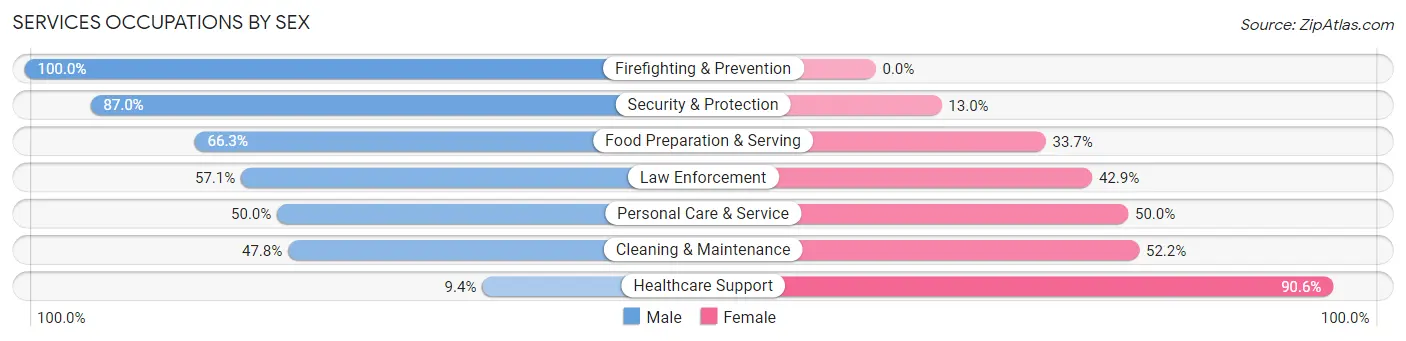
Services Occupations by Sex
Within the Services occupations in Galesburg, the most male-oriented occupations are Firefighting & Prevention (100.0%), Security & Protection (87.0%), and Food Preparation & Serving (66.3%), while the most female-oriented occupations are Healthcare Support (90.6%), Cleaning & Maintenance (52.2%), and Personal Care & Service (50.0%).
| Occupation | Male | Female |
| Healthcare Support | 3 (9.4%) | 29 (90.6%) |
| Security & Protection | 20 (87.0%) | 3 (13.0%) |
| Firefighting & Prevention | 16 (100.0%) | 0 (0.0%) |
| Law Enforcement | 4 (57.1%) | 3 (42.9%) |
| Food Preparation & Serving | 65 (66.3%) | 33 (33.7%) |
| Cleaning & Maintenance | 22 (47.8%) | 24 (52.2%) |
| Personal Care & Service | 6 (50.0%) | 6 (50.0%) |
| Total (Category) | 116 (55.0%) | 95 (45.0%) |
| Total (Overall) | 457 (54.3%) | 385 (45.7%) |
Sales and Office Occupations
The most common Sales and Office occupations in Galesburg are Office & Administration (87 | 10.3%), and Sales & Related (72 | 8.6%).
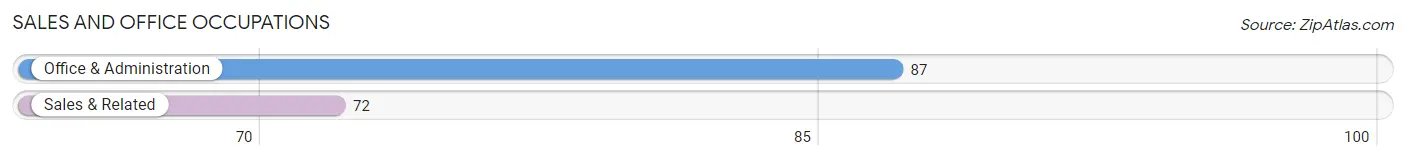
Sales and Office Occupations by Sex

| Occupation | Male | Female |
| Sales & Related | 14 (19.4%) | 58 (80.6%) |
| Office & Administration | 8 (9.2%) | 79 (90.8%) |
| Total (Category) | 22 (13.8%) | 137 (86.2%) |
| Total (Overall) | 457 (54.3%) | 385 (45.7%) |
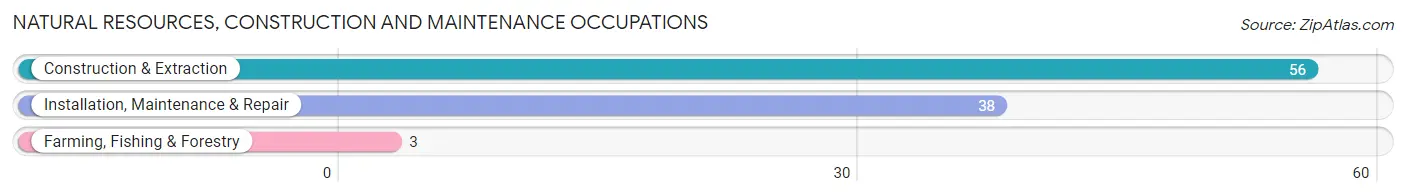
Natural Resources, Construction and Maintenance Occupations
The most common Natural Resources, Construction and Maintenance occupations in Galesburg are Construction & Extraction (56 | 6.7%), Installation, Maintenance & Repair (38 | 4.5%), and Farming, Fishing & Forestry (3 | 0.4%).
Natural Resources, Construction and Maintenance Occupations by Sex
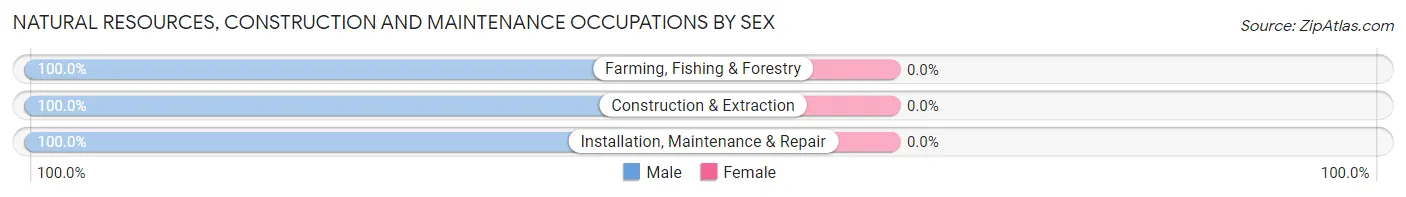
| Occupation | Male | Female |
| Farming, Fishing & Forestry | 3 (100.0%) | 0 (0.0%) |
| Construction & Extraction | 56 (100.0%) | 0 (0.0%) |
| Installation, Maintenance & Repair | 38 (100.0%) | 0 (0.0%) |
| Total (Category) | 97 (100.0%) | 0 (0.0%) |
| Total (Overall) | 457 (54.3%) | 385 (45.7%) |
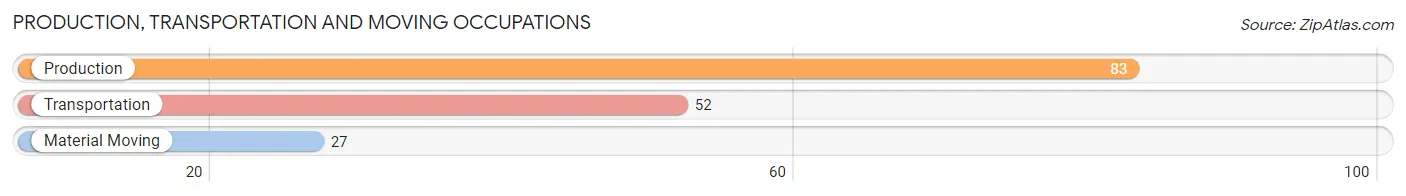
Production, Transportation and Moving Occupations
The most common Production, Transportation and Moving occupations in Galesburg are Production (83 | 9.9%), Transportation (52 | 6.2%), and Material Moving (27 | 3.2%).
Production, Transportation and Moving Occupations by Sex
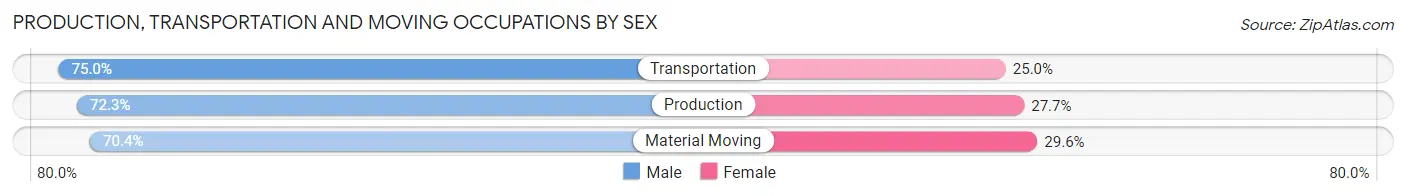
| Occupation | Male | Female |
| Production | 60 (72.3%) | 23 (27.7%) |
| Transportation | 39 (75.0%) | 13 (25.0%) |
| Material Moving | 19 (70.4%) | 8 (29.6%) |
| Total (Category) | 118 (72.8%) | 44 (27.2%) |
| Total (Overall) | 457 (54.3%) | 385 (45.7%) |
Employment Industries by Sex in Galesburg
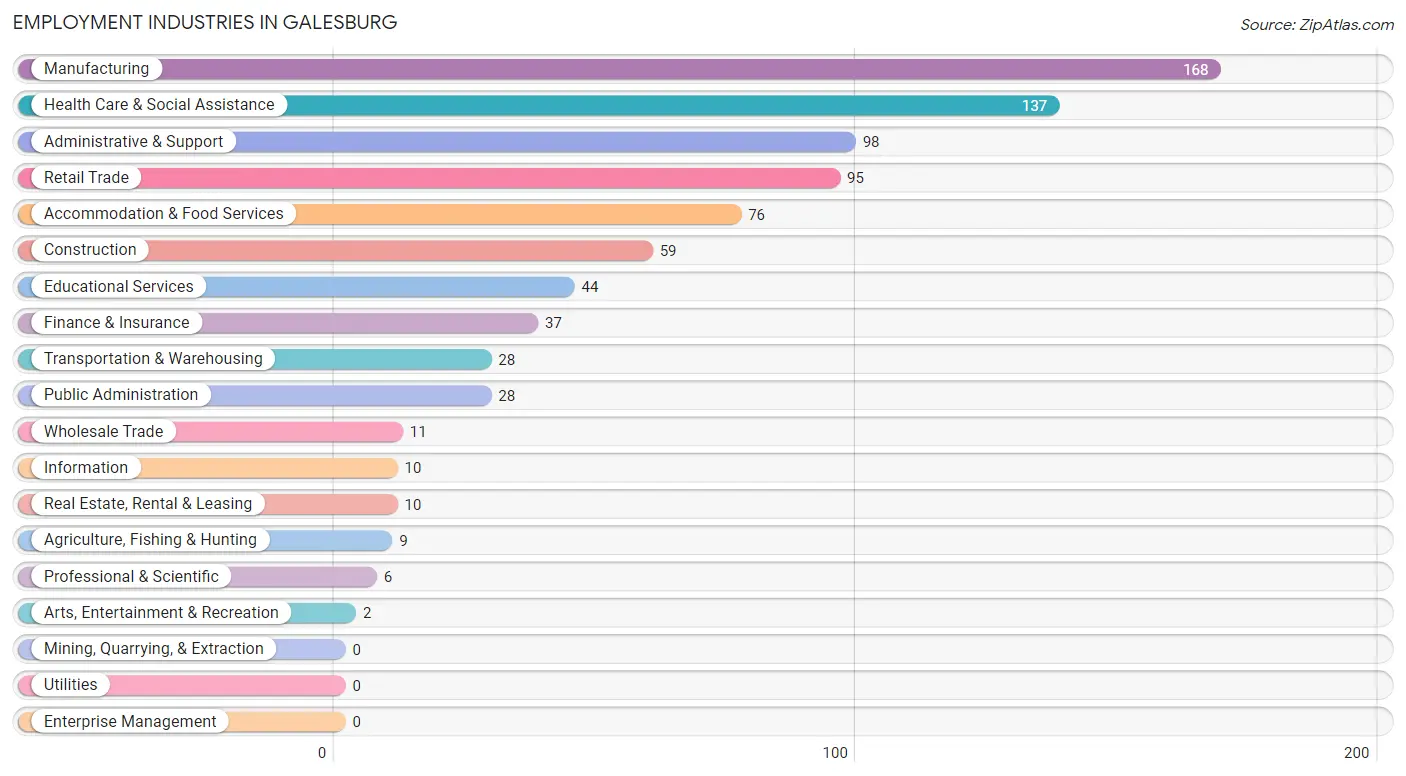
Employment Industries in Galesburg
The major employment industries in Galesburg include Manufacturing (168 | 20.0%), Health Care & Social Assistance (137 | 16.3%), Administrative & Support (98 | 11.6%), Retail Trade (95 | 11.3%), and Accommodation & Food Services (76 | 9.0%).
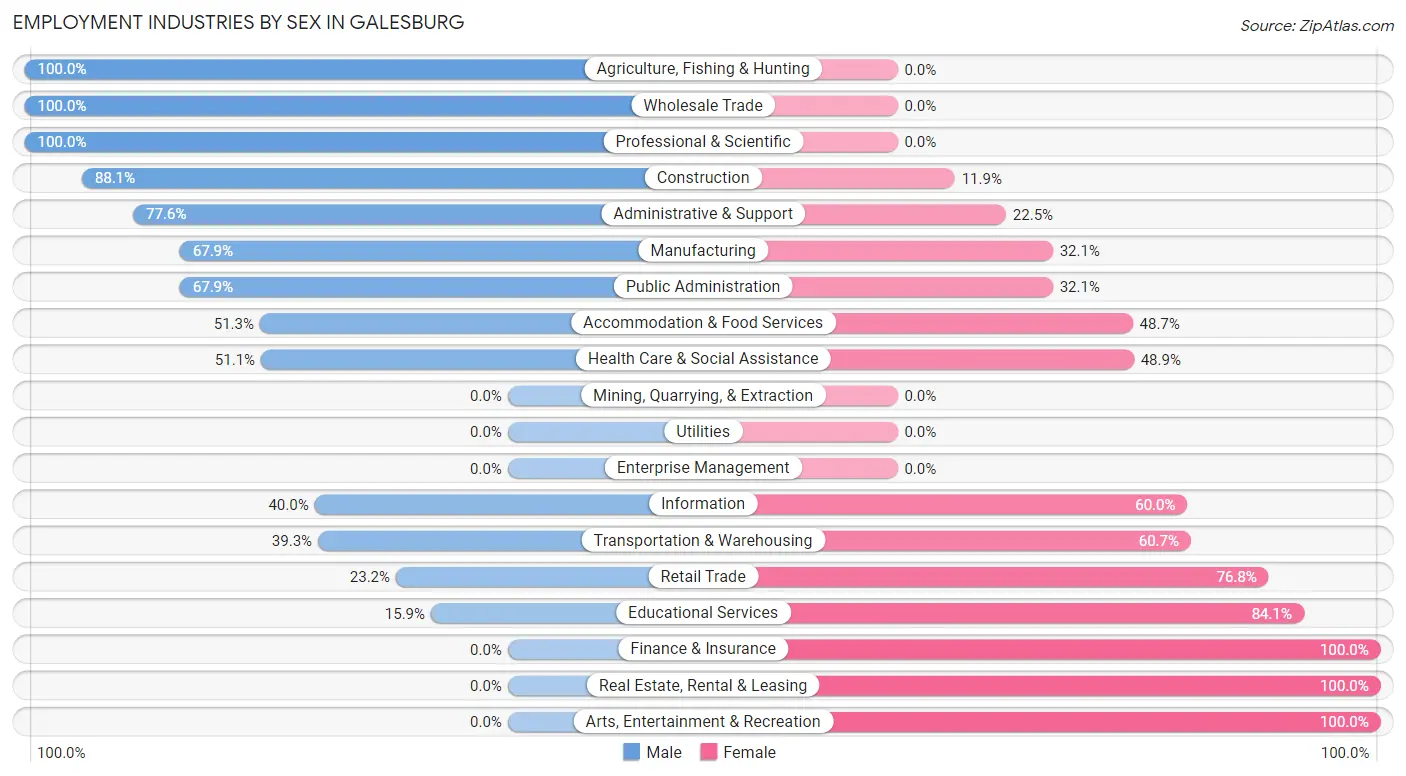
Employment Industries by Sex in Galesburg
The Galesburg industries that see more men than women are Agriculture, Fishing & Hunting (100.0%), Wholesale Trade (100.0%), and Professional & Scientific (100.0%), whereas the industries that tend to have a higher number of women are Finance & Insurance (100.0%), Real Estate, Rental & Leasing (100.0%), and Arts, Entertainment & Recreation (100.0%).
| Industry | Male | Female |
| Agriculture, Fishing & Hunting | 9 (100.0%) | 0 (0.0%) |
| Mining, Quarrying, & Extraction | 0 (0.0%) | 0 (0.0%) |
| Construction | 52 (88.1%) | 7 (11.9%) |
| Manufacturing | 114 (67.9%) | 54 (32.1%) |
| Wholesale Trade | 11 (100.0%) | 0 (0.0%) |
| Retail Trade | 22 (23.2%) | 73 (76.8%) |
| Transportation & Warehousing | 11 (39.3%) | 17 (60.7%) |
| Utilities | 0 (0.0%) | 0 (0.0%) |
| Information | 4 (40.0%) | 6 (60.0%) |
| Finance & Insurance | 0 (0.0%) | 37 (100.0%) |
| Real Estate, Rental & Leasing | 0 (0.0%) | 10 (100.0%) |
| Professional & Scientific | 6 (100.0%) | 0 (0.0%) |
| Enterprise Management | 0 (0.0%) | 0 (0.0%) |
| Administrative & Support | 76 (77.5%) | 22 (22.5%) |
| Educational Services | 7 (15.9%) | 37 (84.1%) |
| Health Care & Social Assistance | 70 (51.1%) | 67 (48.9%) |
| Arts, Entertainment & Recreation | 0 (0.0%) | 2 (100.0%) |
| Accommodation & Food Services | 39 (51.3%) | 37 (48.7%) |
| Public Administration | 19 (67.9%) | 9 (32.1%) |
| Total | 457 (54.3%) | 385 (45.7%) |
Education in Galesburg
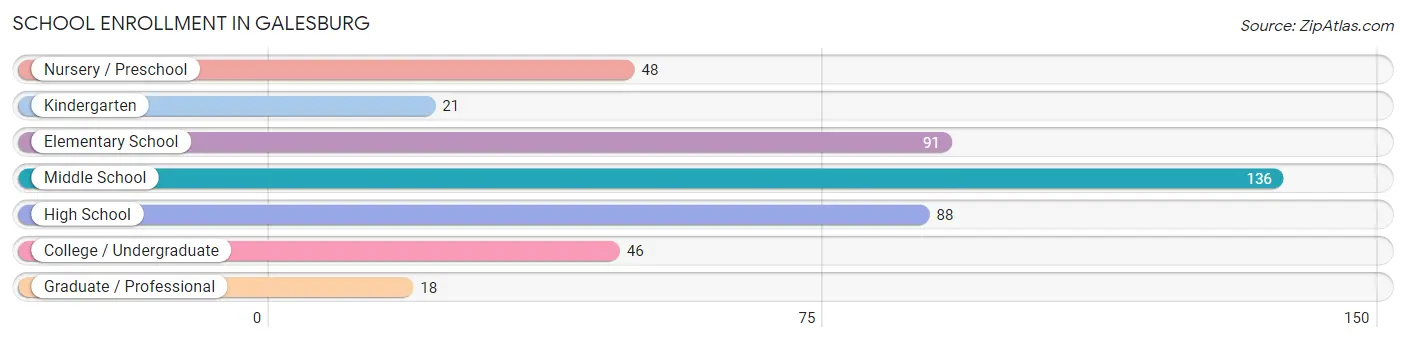
School Enrollment in Galesburg
The most common levels of schooling among the 448 students in Galesburg are middle school (136 | 30.4%), elementary school (91 | 20.3%), and high school (88 | 19.6%).
| School Level | # Students | % Students |
| Nursery / Preschool | 48 | 10.7% |
| Kindergarten | 21 | 4.7% |
| Elementary School | 91 | 20.3% |
| Middle School | 136 | 30.4% |
| High School | 88 | 19.6% |
| College / Undergraduate | 46 | 10.3% |
| Graduate / Professional | 18 | 4.0% |
| Total | 448 | 100.0% |
School Enrollment by Age by Funding Source in Galesburg
Out of a total of 448 students who are enrolled in schools in Galesburg, 49 (10.9%) attend a private institution, while the remaining 399 (89.1%) are enrolled in public schools. The age group of 25 to 34 year olds has the highest likelihood of being enrolled in private schools, with 10 (76.9% in the age bracket) enrolled. Conversely, the age group of 5 to 9 year old has the lowest likelihood of being enrolled in a private school, with 85 (100.0% in the age bracket) attending a public institution.
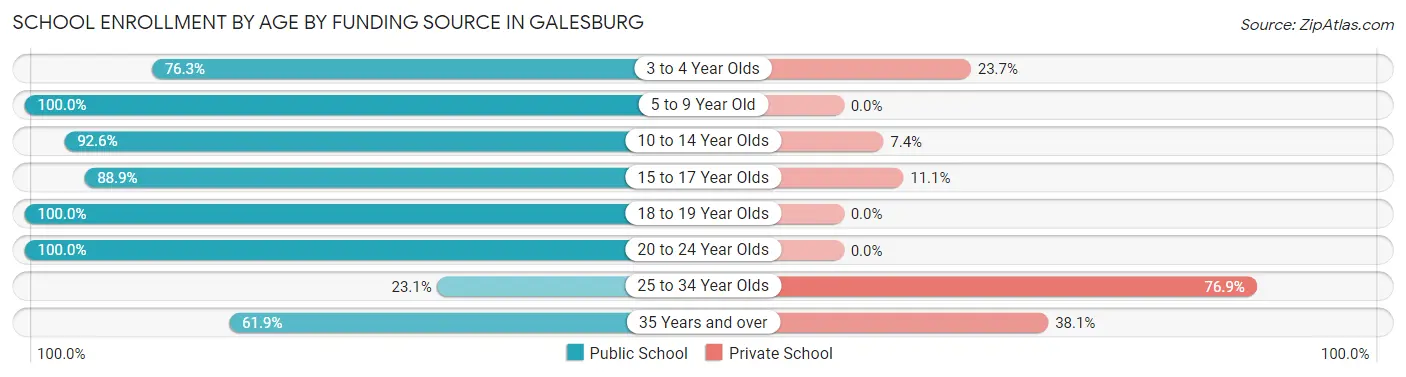
| Age Bracket | Public School | Private School |
| 3 to 4 Year Olds | 29 (76.3%) | 9 (23.7%) |
| 5 to 9 Year Old | 85 (100.0%) | 0 (0.0%) |
| 10 to 14 Year Olds | 163 (92.6%) | 13 (7.4%) |
| 15 to 17 Year Olds | 72 (88.9%) | 9 (11.1%) |
| 18 to 19 Year Olds | 6 (100.0%) | 0 (0.0%) |
| 20 to 24 Year Olds | 28 (100.0%) | 0 (0.0%) |
| 25 to 34 Year Olds | 3 (23.1%) | 10 (76.9%) |
| 35 Years and over | 13 (61.9%) | 8 (38.1%) |
| Total | 399 (89.1%) | 49 (10.9%) |
Educational Attainment by Field of Study in Galesburg
Business (30 | 21.3%), liberal arts & history (18 | 12.8%), engineering (17 | 12.1%), science & technology (17 | 12.1%), and visual & performing arts (17 | 12.1%) are the most common fields of study among 141 individuals in Galesburg who have obtained a bachelor's degree or higher.
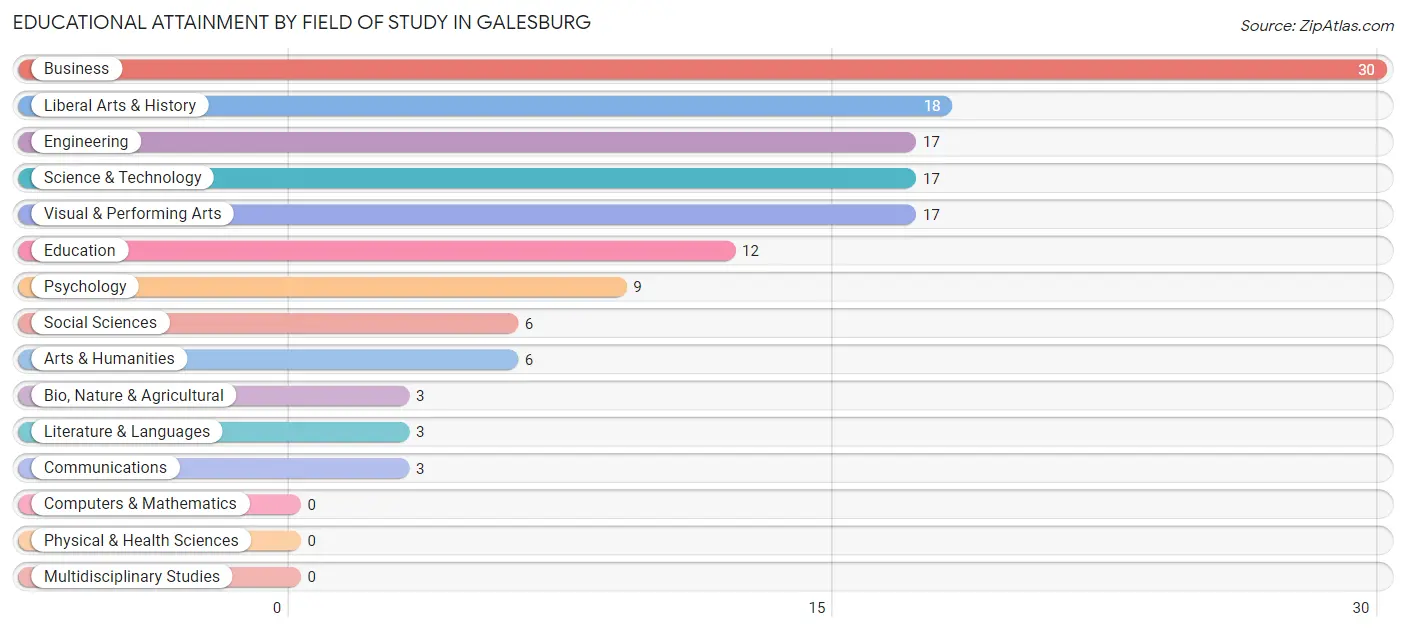
| Field of Study | # Graduates | % Graduates |
| Computers & Mathematics | 0 | 0.0% |
| Bio, Nature & Agricultural | 3 | 2.1% |
| Physical & Health Sciences | 0 | 0.0% |
| Psychology | 9 | 6.4% |
| Social Sciences | 6 | 4.3% |
| Engineering | 17 | 12.1% |
| Multidisciplinary Studies | 0 | 0.0% |
| Science & Technology | 17 | 12.1% |
| Business | 30 | 21.3% |
| Education | 12 | 8.5% |
| Literature & Languages | 3 | 2.1% |
| Liberal Arts & History | 18 | 12.8% |
| Visual & Performing Arts | 17 | 12.1% |
| Communications | 3 | 2.1% |
| Arts & Humanities | 6 | 4.3% |
| Total | 141 | 100.0% |
Transportation & Commute in Galesburg
Vehicle Availability by Sex in Galesburg
The most prevalent vehicle ownership categories in Galesburg are males with 2 vehicles (194, accounting for 42.2%) and females with 2 vehicles (175, making up 53.6%).
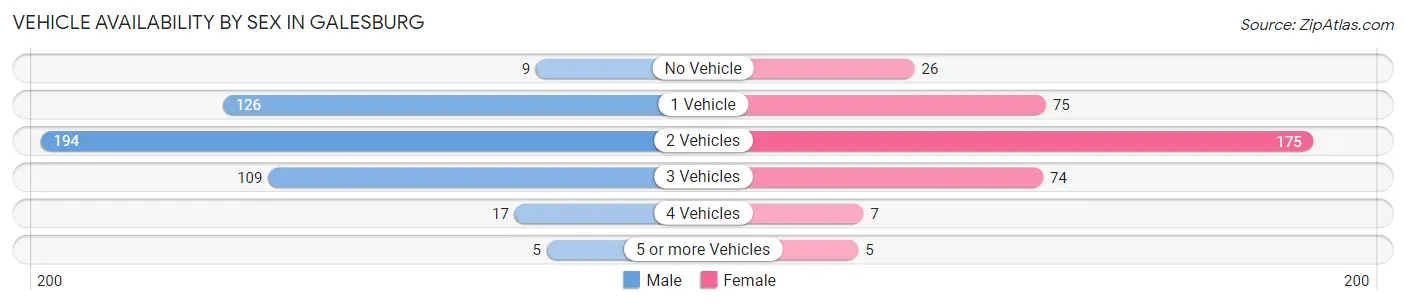
| Vehicles Available | Male | Female |
| No Vehicle | 9 (2.0%) | 26 (7.2%) |
| 1 Vehicle | 126 (27.4%) | 75 (20.7%) |
| 2 Vehicles | 194 (42.2%) | 175 (48.3%) |
| 3 Vehicles | 109 (23.7%) | 74 (20.4%) |
| 4 Vehicles | 17 (3.7%) | 7 (1.9%) |
| 5 or more Vehicles | 5 (1.1%) | 5 (1.4%) |
| Total | 460 (100.0%) | 362 (100.0%) |
Commute Time in Galesburg
The most frequently occuring commute durations in Galesburg are 20 to 24 minutes (313 commuters, 39.4%), 15 to 19 minutes (225 commuters, 28.3%), and 30 to 34 minutes (61 commuters, 7.7%).
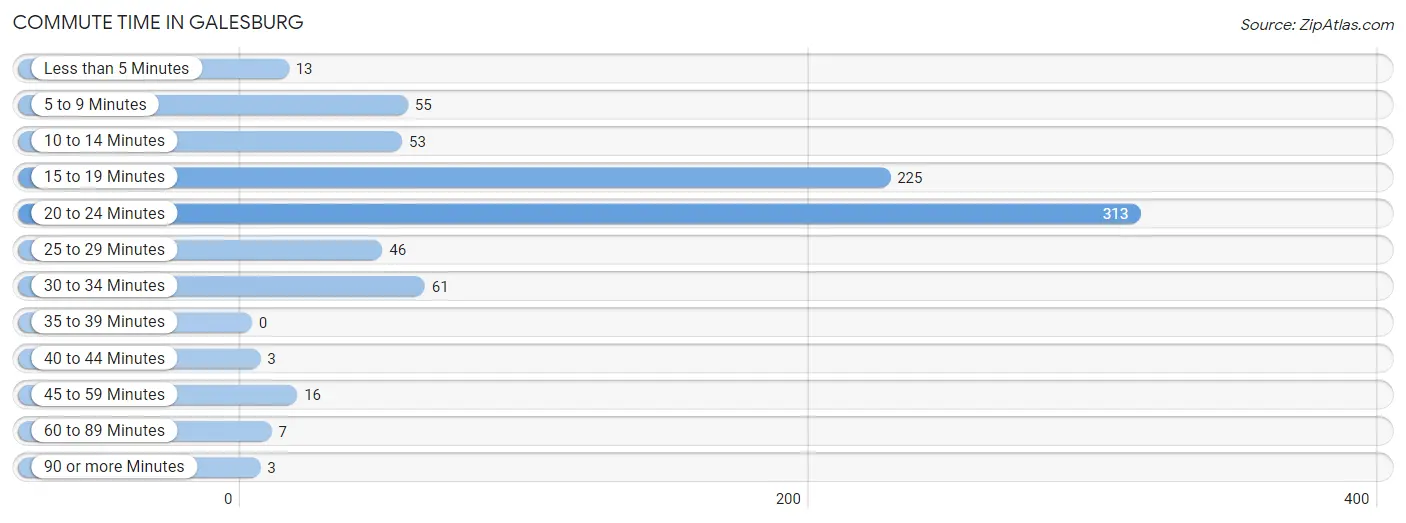
| Commute Time | # Commuters | % Commuters |
| Less than 5 Minutes | 13 | 1.6% |
| 5 to 9 Minutes | 55 | 6.9% |
| 10 to 14 Minutes | 53 | 6.7% |
| 15 to 19 Minutes | 225 | 28.3% |
| 20 to 24 Minutes | 313 | 39.4% |
| 25 to 29 Minutes | 46 | 5.8% |
| 30 to 34 Minutes | 61 | 7.7% |
| 35 to 39 Minutes | 0 | 0.0% |
| 40 to 44 Minutes | 3 | 0.4% |
| 45 to 59 Minutes | 16 | 2.0% |
| 60 to 89 Minutes | 7 | 0.9% |
| 90 or more Minutes | 3 | 0.4% |
Commute Time by Sex in Galesburg
The most common commute times in Galesburg are 20 to 24 minutes (207 commuters, 45.0%) for males and 20 to 24 minutes (106 commuters, 31.6%) for females.
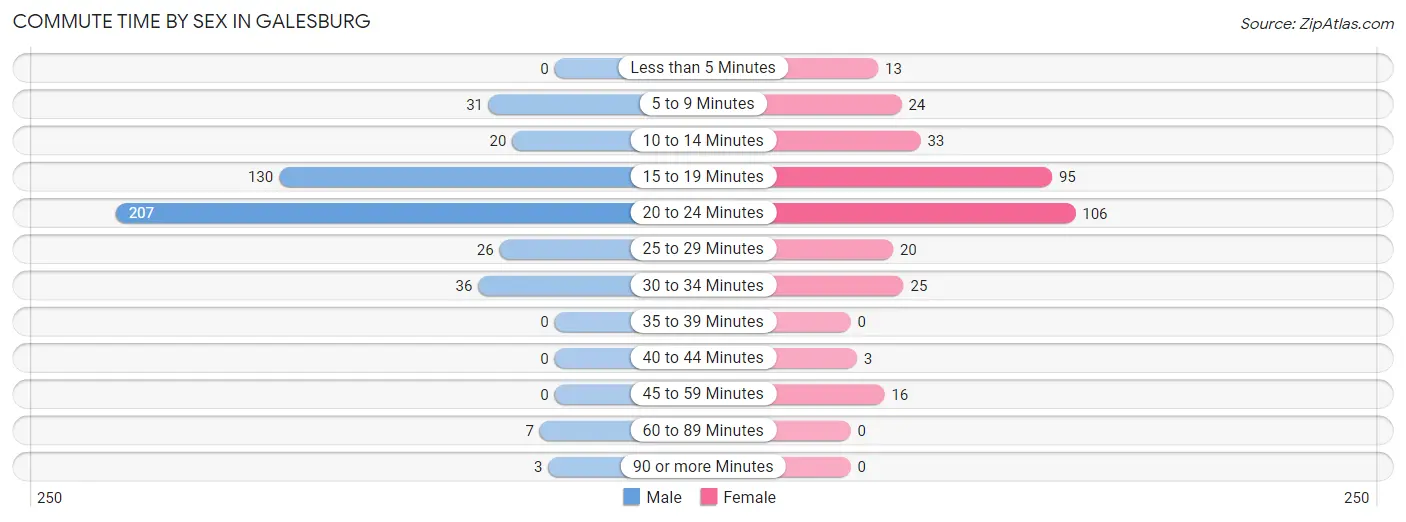
| Commute Time | Male | Female |
| Less than 5 Minutes | 0 (0.0%) | 13 (3.9%) |
| 5 to 9 Minutes | 31 (6.7%) | 24 (7.2%) |
| 10 to 14 Minutes | 20 (4.3%) | 33 (9.9%) |
| 15 to 19 Minutes | 130 (28.3%) | 95 (28.4%) |
| 20 to 24 Minutes | 207 (45.0%) | 106 (31.6%) |
| 25 to 29 Minutes | 26 (5.7%) | 20 (6.0%) |
| 30 to 34 Minutes | 36 (7.8%) | 25 (7.5%) |
| 35 to 39 Minutes | 0 (0.0%) | 0 (0.0%) |
| 40 to 44 Minutes | 0 (0.0%) | 3 (0.9%) |
| 45 to 59 Minutes | 0 (0.0%) | 16 (4.8%) |
| 60 to 89 Minutes | 7 (1.5%) | 0 (0.0%) |
| 90 or more Minutes | 3 (0.6%) | 0 (0.0%) |
Time of Departure to Work by Sex in Galesburg
The most frequent times of departure to work in Galesburg are 12:00 PM to 3:59 PM (70, 15.2%) for males and 6:30 AM to 6:59 AM (49, 14.6%) for females.
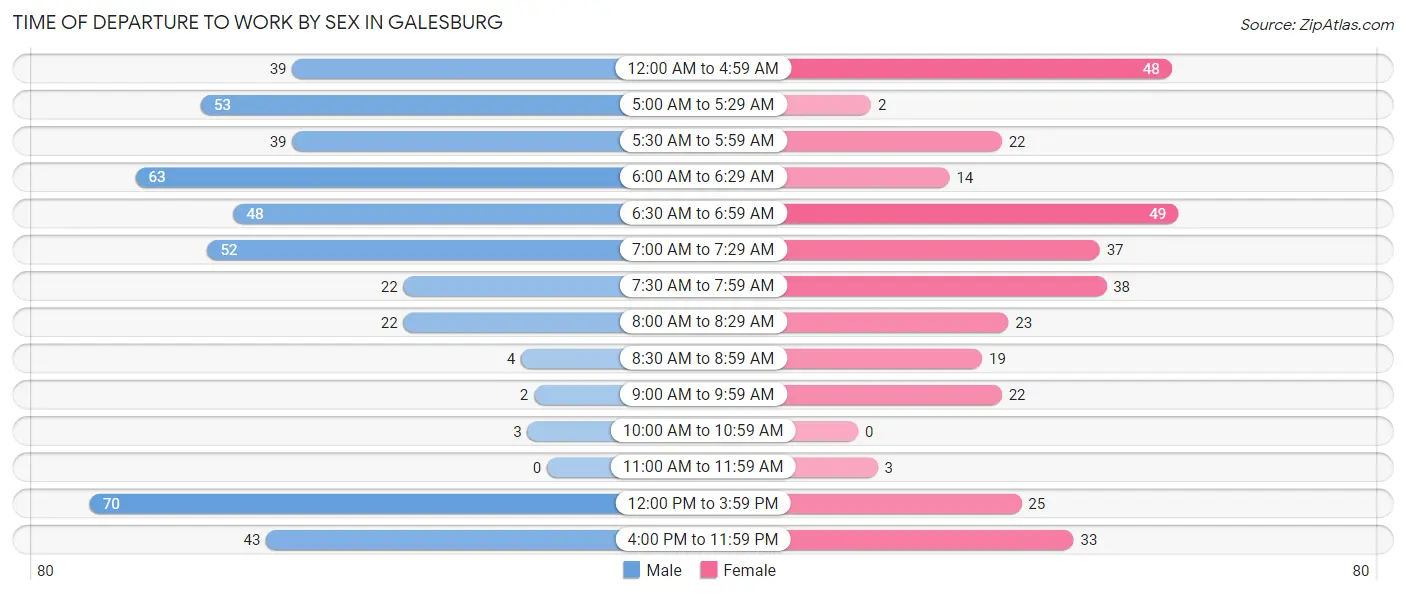
| Time of Departure | Male | Female |
| 12:00 AM to 4:59 AM | 39 (8.5%) | 48 (14.3%) |
| 5:00 AM to 5:29 AM | 53 (11.5%) | 2 (0.6%) |
| 5:30 AM to 5:59 AM | 39 (8.5%) | 22 (6.6%) |
| 6:00 AM to 6:29 AM | 63 (13.7%) | 14 (4.2%) |
| 6:30 AM to 6:59 AM | 48 (10.4%) | 49 (14.6%) |
| 7:00 AM to 7:29 AM | 52 (11.3%) | 37 (11.0%) |
| 7:30 AM to 7:59 AM | 22 (4.8%) | 38 (11.3%) |
| 8:00 AM to 8:29 AM | 22 (4.8%) | 23 (6.9%) |
| 8:30 AM to 8:59 AM | 4 (0.9%) | 19 (5.7%) |
| 9:00 AM to 9:59 AM | 2 (0.4%) | 22 (6.6%) |
| 10:00 AM to 10:59 AM | 3 (0.6%) | 0 (0.0%) |
| 11:00 AM to 11:59 AM | 0 (0.0%) | 3 (0.9%) |
| 12:00 PM to 3:59 PM | 70 (15.2%) | 25 (7.5%) |
| 4:00 PM to 11:59 PM | 43 (9.3%) | 33 (9.9%) |
| Total | 460 (100.0%) | 335 (100.0%) |
Housing Occupancy in Galesburg
Occupancy by Ownership in Galesburg
Of the total 776 dwellings in Galesburg, owner-occupied units account for 466 (60.1%), while renter-occupied units make up 310 (40.0%).
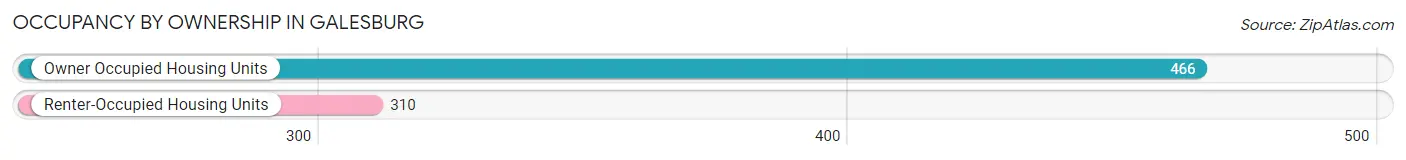
| Occupancy | # Housing Units | % Housing Units |
| Owner Occupied Housing Units | 466 | 60.1% |
| Renter-Occupied Housing Units | 310 | 40.0% |
| Total Occupied Housing Units | 776 | 100.0% |
Occupancy by Household Size in Galesburg
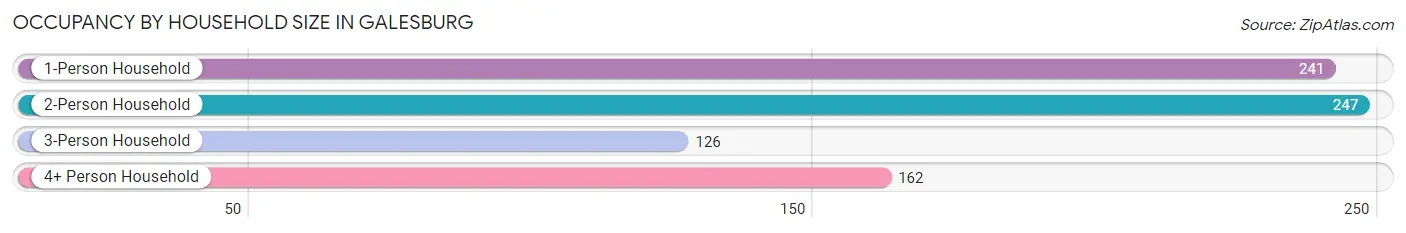
| Household Size | # Housing Units | % Housing Units |
| 1-Person Household | 241 | 31.1% |
| 2-Person Household | 247 | 31.8% |
| 3-Person Household | 126 | 16.2% |
| 4+ Person Household | 162 | 20.9% |
| Total Housing Units | 776 | 100.0% |
Occupancy by Ownership by Household Size in Galesburg
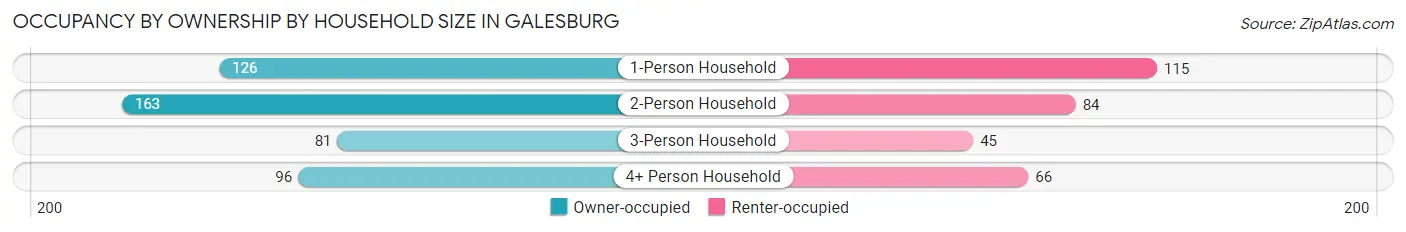
| Household Size | Owner-occupied | Renter-occupied |
| 1-Person Household | 126 (52.3%) | 115 (47.7%) |
| 2-Person Household | 163 (66.0%) | 84 (34.0%) |
| 3-Person Household | 81 (64.3%) | 45 (35.7%) |
| 4+ Person Household | 96 (59.3%) | 66 (40.7%) |
| Total Housing Units | 466 (60.1%) | 310 (40.0%) |
Occupancy by Educational Attainment in Galesburg
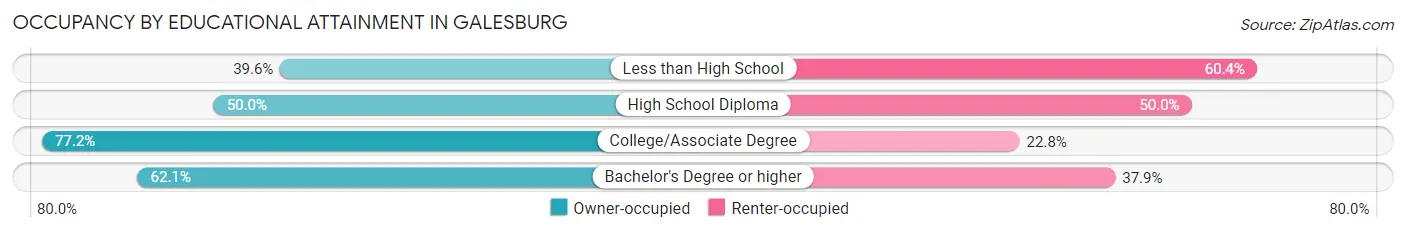
| Household Size | Owner-occupied | Renter-occupied |
| Less than High School | 21 (39.6%) | 32 (60.4%) |
| High School Diploma | 184 (50.0%) | 184 (50.0%) |
| College/Associate Degree | 207 (77.2%) | 61 (22.8%) |
| Bachelor's Degree or higher | 54 (62.1%) | 33 (37.9%) |
Occupancy by Age of Householder in Galesburg
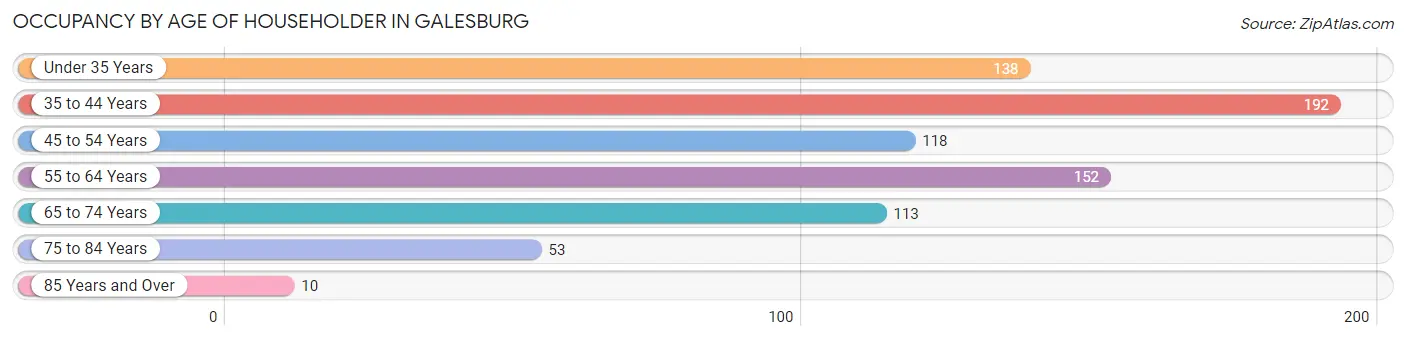
| Age Bracket | # Households | % Households |
| Under 35 Years | 138 | 17.8% |
| 35 to 44 Years | 192 | 24.7% |
| 45 to 54 Years | 118 | 15.2% |
| 55 to 64 Years | 152 | 19.6% |
| 65 to 74 Years | 113 | 14.6% |
| 75 to 84 Years | 53 | 6.8% |
| 85 Years and Over | 10 | 1.3% |
| Total | 776 | 100.0% |
Housing Finances in Galesburg
Median Income by Occupancy in Galesburg
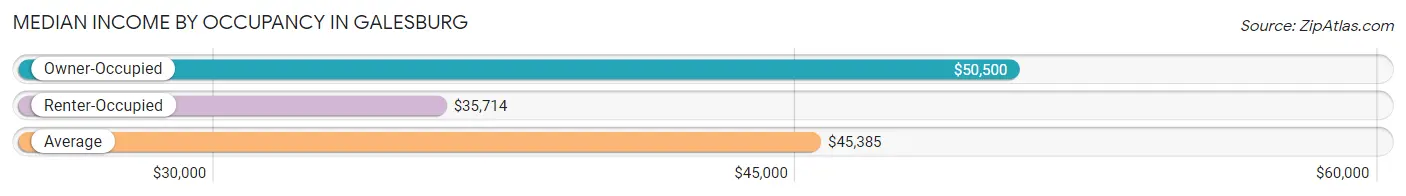
| Occupancy Type | # Households | Median Income |
| Owner-Occupied | 466 (60.1%) | $50,500 |
| Renter-Occupied | 310 (40.0%) | $35,714 |
| Average | 776 (100.0%) | $45,385 |
Occupancy by Householder Income Bracket in Galesburg
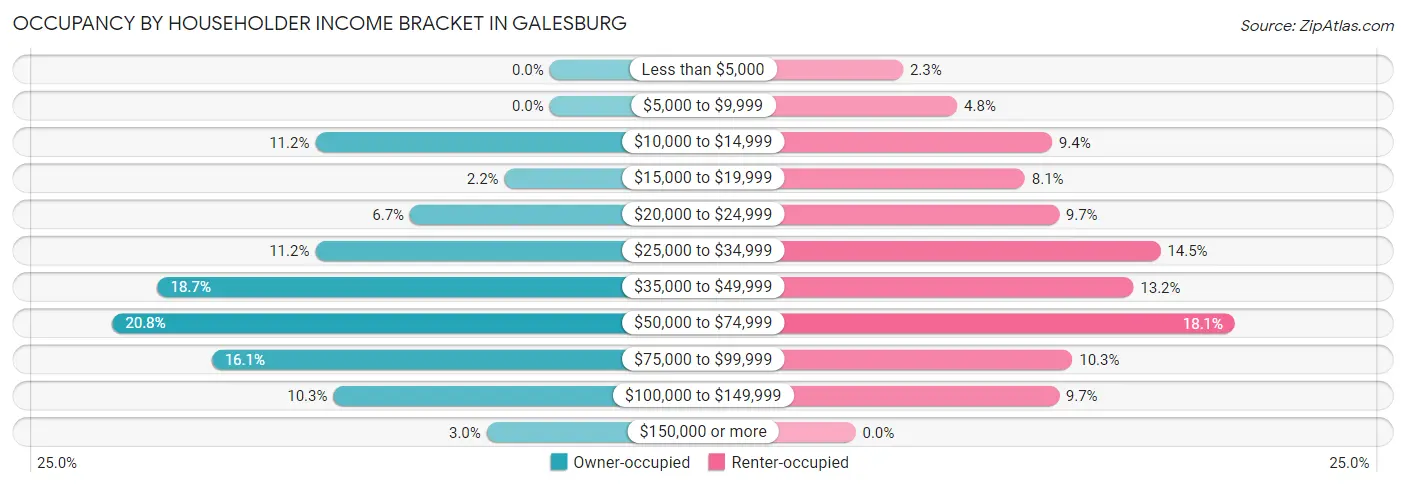
| Income Bracket | Owner-occupied | Renter-occupied |
| Less than $5,000 | 0 (0.0%) | 7 (2.3%) |
| $5,000 to $9,999 | 0 (0.0%) | 15 (4.8%) |
| $10,000 to $14,999 | 52 (11.2%) | 29 (9.3%) |
| $15,000 to $19,999 | 10 (2.1%) | 25 (8.1%) |
| $20,000 to $24,999 | 31 (6.7%) | 30 (9.7%) |
| $25,000 to $34,999 | 52 (11.2%) | 45 (14.5%) |
| $35,000 to $49,999 | 87 (18.7%) | 41 (13.2%) |
| $50,000 to $74,999 | 97 (20.8%) | 56 (18.1%) |
| $75,000 to $99,999 | 75 (16.1%) | 32 (10.3%) |
| $100,000 to $149,999 | 48 (10.3%) | 30 (9.7%) |
| $150,000 or more | 14 (3.0%) | 0 (0.0%) |
| Total | 466 (100.0%) | 310 (100.0%) |
Monthly Housing Cost Tiers in Galesburg
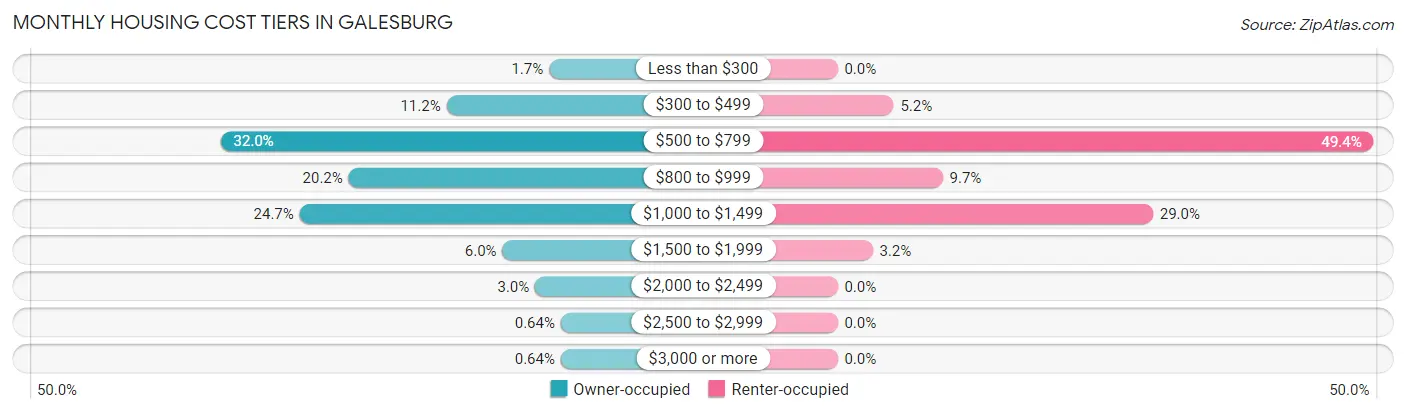
| Monthly Cost | Owner-occupied | Renter-occupied |
| Less than $300 | 8 (1.7%) | 0 (0.0%) |
| $300 to $499 | 52 (11.2%) | 16 (5.2%) |
| $500 to $799 | 149 (32.0%) | 153 (49.3%) |
| $800 to $999 | 94 (20.2%) | 30 (9.7%) |
| $1,000 to $1,499 | 115 (24.7%) | 90 (29.0%) |
| $1,500 to $1,999 | 28 (6.0%) | 10 (3.2%) |
| $2,000 to $2,499 | 14 (3.0%) | 0 (0.0%) |
| $2,500 to $2,999 | 3 (0.6%) | 0 (0.0%) |
| $3,000 or more | 3 (0.6%) | 0 (0.0%) |
| Total | 466 (100.0%) | 310 (100.0%) |
Physical Housing Characteristics in Galesburg
Housing Structures in Galesburg
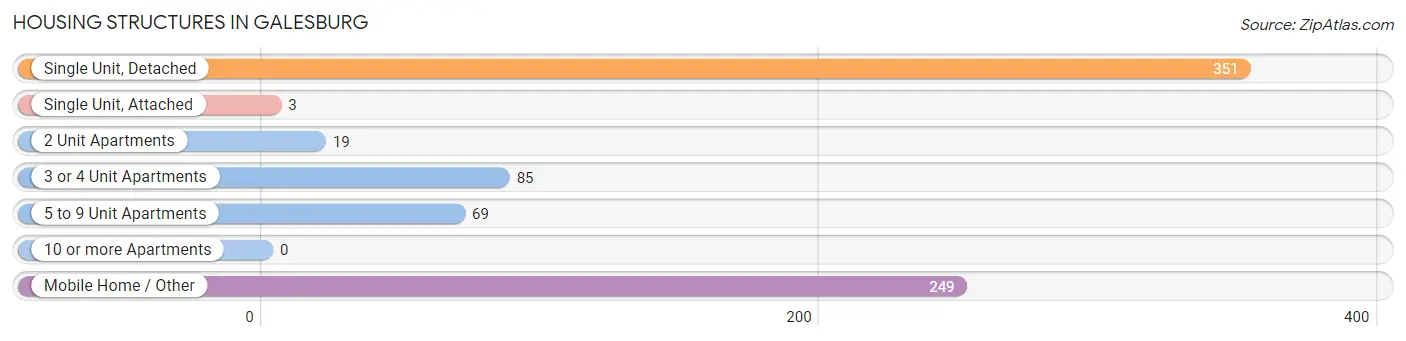
| Structure Type | # Housing Units | % Housing Units |
| Single Unit, Detached | 351 | 45.2% |
| Single Unit, Attached | 3 | 0.4% |
| 2 Unit Apartments | 19 | 2.5% |
| 3 or 4 Unit Apartments | 85 | 11.0% |
| 5 to 9 Unit Apartments | 69 | 8.9% |
| 10 or more Apartments | 0 | 0.0% |
| Mobile Home / Other | 249 | 32.1% |
| Total | 776 | 100.0% |
Housing Structures by Occupancy in Galesburg
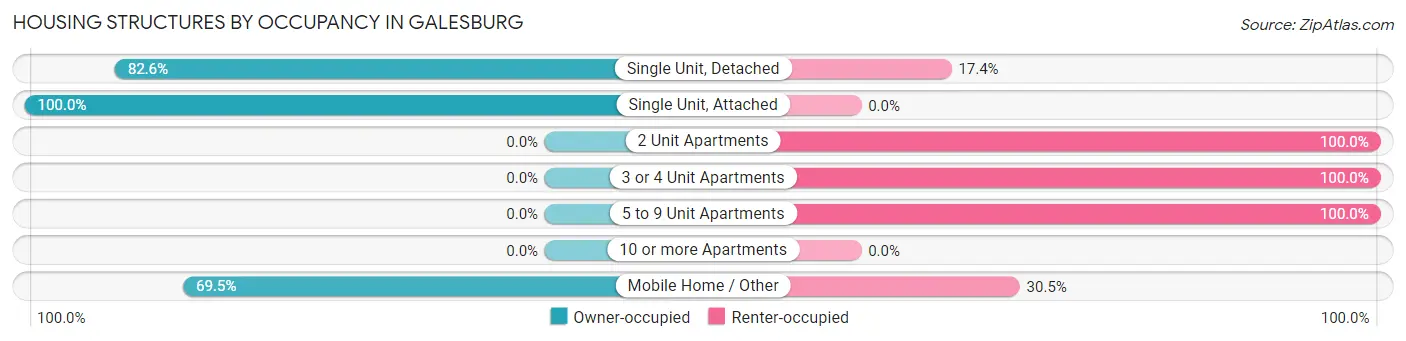
| Structure Type | Owner-occupied | Renter-occupied |
| Single Unit, Detached | 290 (82.6%) | 61 (17.4%) |
| Single Unit, Attached | 3 (100.0%) | 0 (0.0%) |
| 2 Unit Apartments | 0 (0.0%) | 19 (100.0%) |
| 3 or 4 Unit Apartments | 0 (0.0%) | 85 (100.0%) |
| 5 to 9 Unit Apartments | 0 (0.0%) | 69 (100.0%) |
| 10 or more Apartments | 0 (0.0%) | 0 (0.0%) |
| Mobile Home / Other | 173 (69.5%) | 76 (30.5%) |
| Total | 466 (60.1%) | 310 (40.0%) |
Housing Structures by Number of Rooms in Galesburg
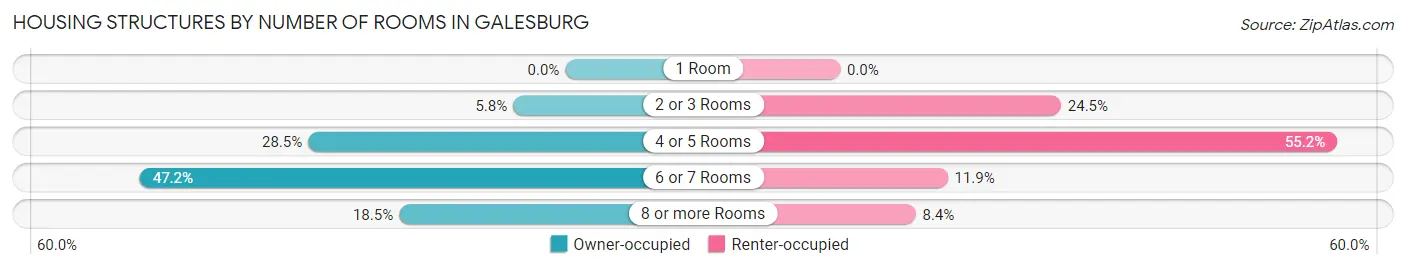
| Number of Rooms | Owner-occupied | Renter-occupied |
| 1 Room | 0 (0.0%) | 0 (0.0%) |
| 2 or 3 Rooms | 27 (5.8%) | 76 (24.5%) |
| 4 or 5 Rooms | 133 (28.5%) | 171 (55.2%) |
| 6 or 7 Rooms | 220 (47.2%) | 37 (11.9%) |
| 8 or more Rooms | 86 (18.4%) | 26 (8.4%) |
| Total | 466 (100.0%) | 310 (100.0%) |
Housing Structure by Heating Type in Galesburg
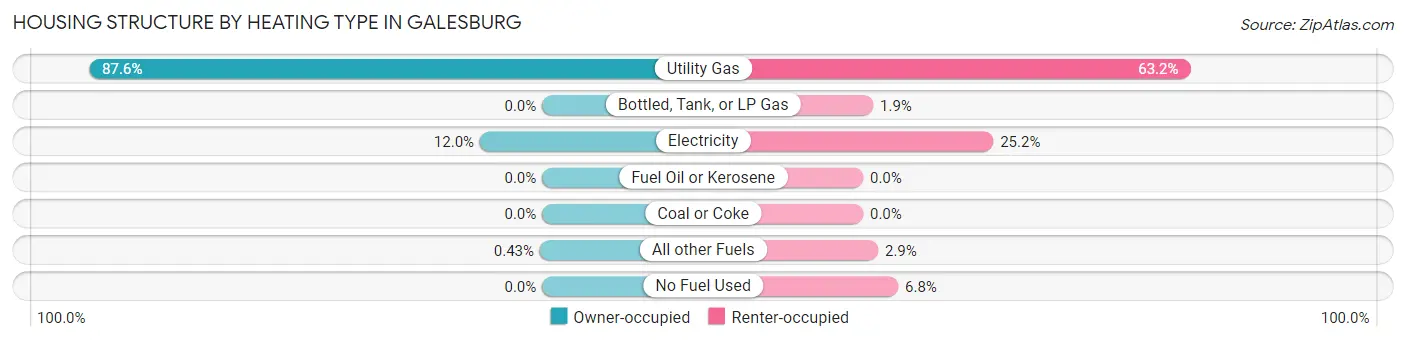
| Heating Type | Owner-occupied | Renter-occupied |
| Utility Gas | 408 (87.5%) | 196 (63.2%) |
| Bottled, Tank, or LP Gas | 0 (0.0%) | 6 (1.9%) |
| Electricity | 56 (12.0%) | 78 (25.2%) |
| Fuel Oil or Kerosene | 0 (0.0%) | 0 (0.0%) |
| Coal or Coke | 0 (0.0%) | 0 (0.0%) |
| All other Fuels | 2 (0.4%) | 9 (2.9%) |
| No Fuel Used | 0 (0.0%) | 21 (6.8%) |
| Total | 466 (100.0%) | 310 (100.0%) |
Household Vehicle Usage in Galesburg
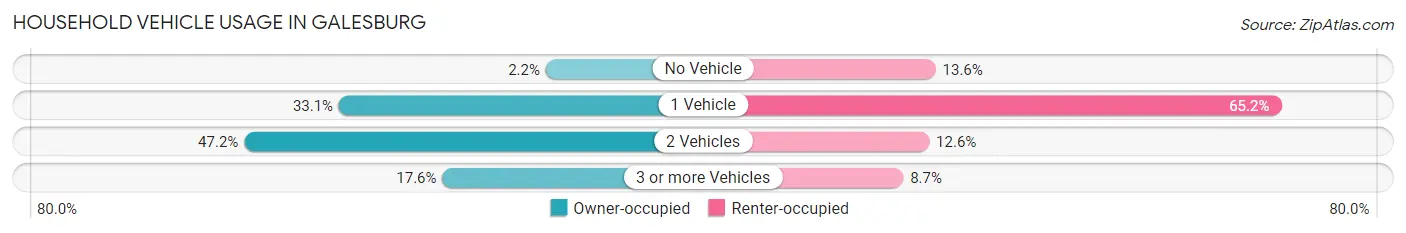
| Vehicles per Household | Owner-occupied | Renter-occupied |
| No Vehicle | 10 (2.1%) | 42 (13.6%) |
| 1 Vehicle | 154 (33.1%) | 202 (65.2%) |
| 2 Vehicles | 220 (47.2%) | 39 (12.6%) |
| 3 or more Vehicles | 82 (17.6%) | 27 (8.7%) |
| Total | 466 (100.0%) | 310 (100.0%) |
Real Estate & Mortgages in Galesburg
Real Estate and Mortgage Overview in Galesburg
| Characteristic | Without Mortgage | With Mortgage |
| Housing Units | 250 | 216 |
| Median Property Value | - | - |
| Median Household Income | $42,000 | $6 |
| Monthly Housing Costs | $674 | $3 |
| Real Estate Taxes | $1,817 | $26 |
Property Value by Mortgage Status in Galesburg
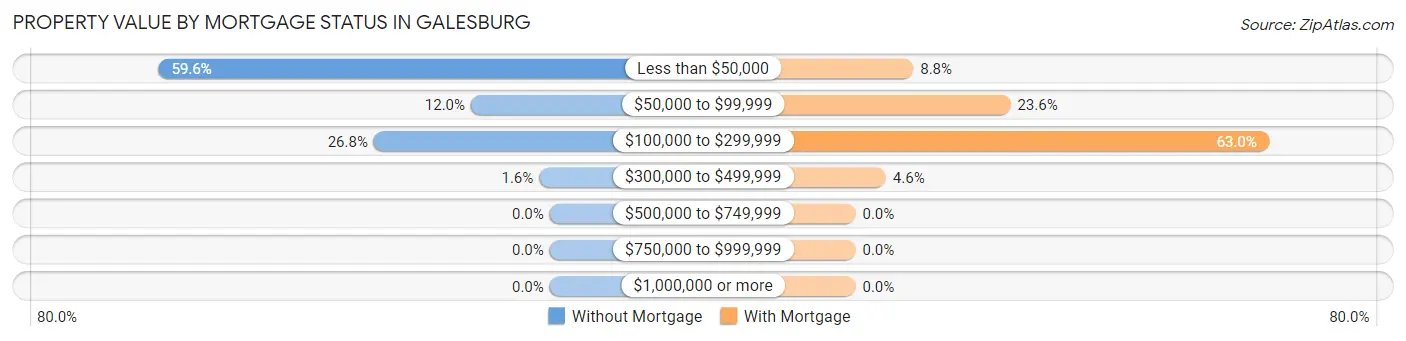
| Property Value | Without Mortgage | With Mortgage |
| Less than $50,000 | 149 (59.6%) | 19 (8.8%) |
| $50,000 to $99,999 | 30 (12.0%) | 51 (23.6%) |
| $100,000 to $299,999 | 67 (26.8%) | 136 (63.0%) |
| $300,000 to $499,999 | 4 (1.6%) | 10 (4.6%) |
| $500,000 to $749,999 | 0 (0.0%) | 0 (0.0%) |
| $750,000 to $999,999 | 0 (0.0%) | 0 (0.0%) |
| $1,000,000 or more | 0 (0.0%) | 0 (0.0%) |
| Total | 250 (100.0%) | 216 (100.0%) |
Household Income by Mortgage Status in Galesburg
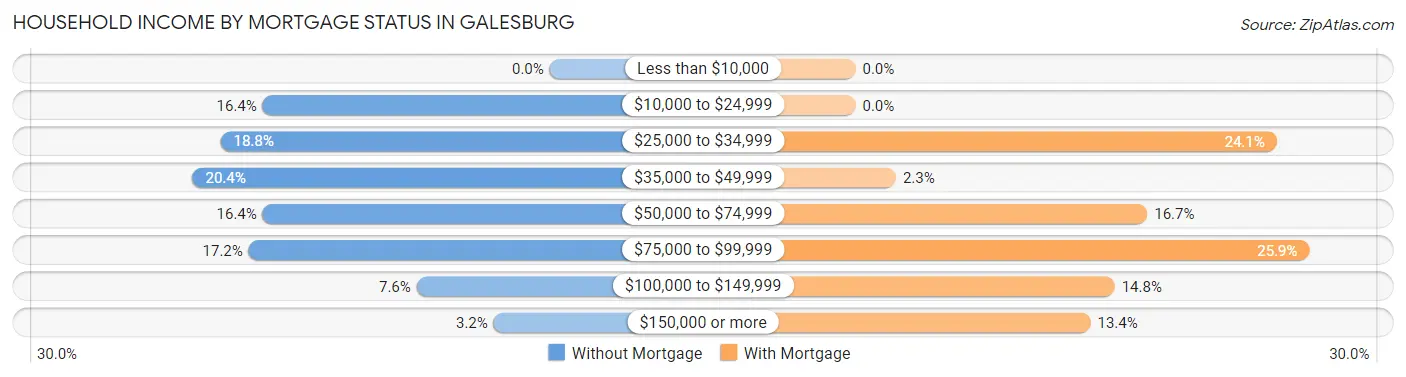
| Household Income | Without Mortgage | With Mortgage |
| Less than $10,000 | 0 (0.0%) | 0 (0.0%) |
| $10,000 to $24,999 | 41 (16.4%) | 0 (0.0%) |
| $25,000 to $34,999 | 47 (18.8%) | 52 (24.1%) |
| $35,000 to $49,999 | 51 (20.4%) | 5 (2.3%) |
| $50,000 to $74,999 | 41 (16.4%) | 36 (16.7%) |
| $75,000 to $99,999 | 43 (17.2%) | 56 (25.9%) |
| $100,000 to $149,999 | 19 (7.6%) | 32 (14.8%) |
| $150,000 or more | 8 (3.2%) | 29 (13.4%) |
| Total | 250 (100.0%) | 216 (100.0%) |
Property Value to Household Income Ratio in Galesburg
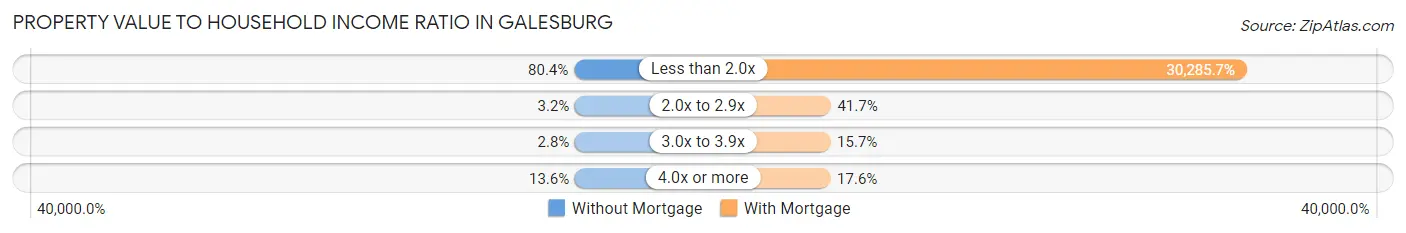
| Value-to-Income Ratio | Without Mortgage | With Mortgage |
| Less than 2.0x | 201 (80.4%) | 65,417 (30,285.6%) |
| 2.0x to 2.9x | 8 (3.2%) | 90 (41.7%) |
| 3.0x to 3.9x | 7 (2.8%) | 34 (15.7%) |
| 4.0x or more | 34 (13.6%) | 38 (17.6%) |
| Total | 250 (100.0%) | 216 (100.0%) |
Real Estate Taxes by Mortgage Status in Galesburg
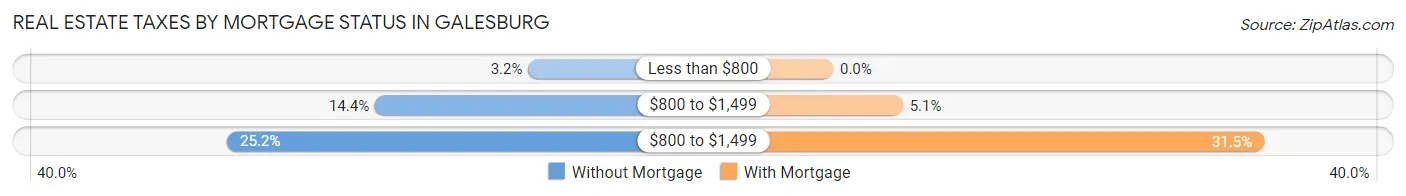
| Property Taxes | Without Mortgage | With Mortgage |
| Less than $800 | 8 (3.2%) | 0 (0.0%) |
| $800 to $1,499 | 36 (14.4%) | 11 (5.1%) |
| $800 to $1,499 | 63 (25.2%) | 68 (31.5%) |
| Total | 250 (100.0%) | 216 (100.0%) |
Health & Disability in Galesburg
Health Insurance Coverage by Age in Galesburg
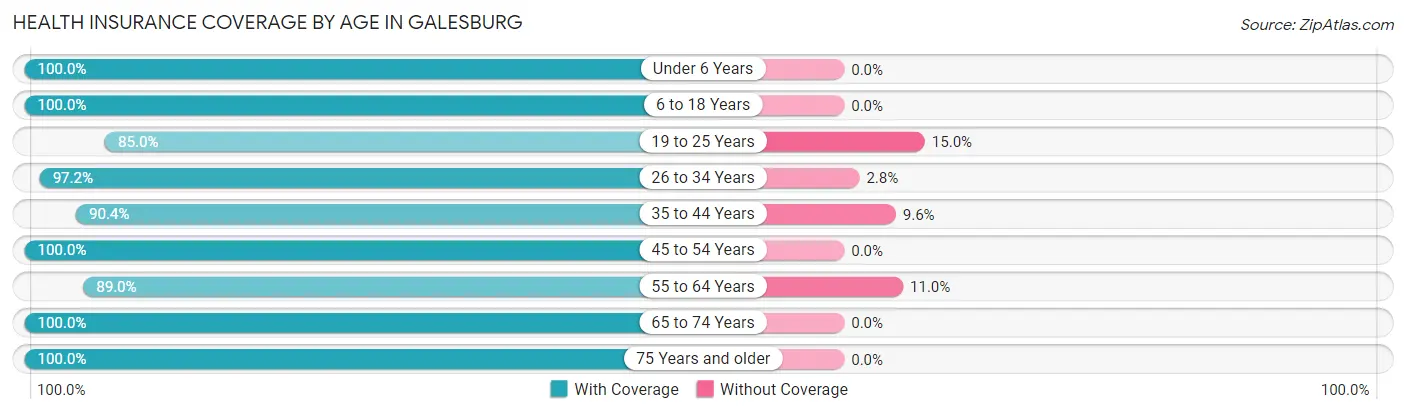
| Age Bracket | With Coverage | Without Coverage |
| Under 6 Years | 157 (100.0%) | 0 (0.0%) |
| 6 to 18 Years | 330 (100.0%) | 0 (0.0%) |
| 19 to 25 Years | 147 (85.0%) | 26 (15.0%) |
| 26 to 34 Years | 275 (97.2%) | 8 (2.8%) |
| 35 to 44 Years | 254 (90.4%) | 27 (9.6%) |
| 45 to 54 Years | 202 (100.0%) | 0 (0.0%) |
| 55 to 64 Years | 211 (89.0%) | 26 (11.0%) |
| 65 to 74 Years | 217 (100.0%) | 0 (0.0%) |
| 75 Years and older | 99 (100.0%) | 0 (0.0%) |
| Total | 1,892 (95.6%) | 87 (4.4%) |
Health Insurance Coverage by Citizenship Status in Galesburg
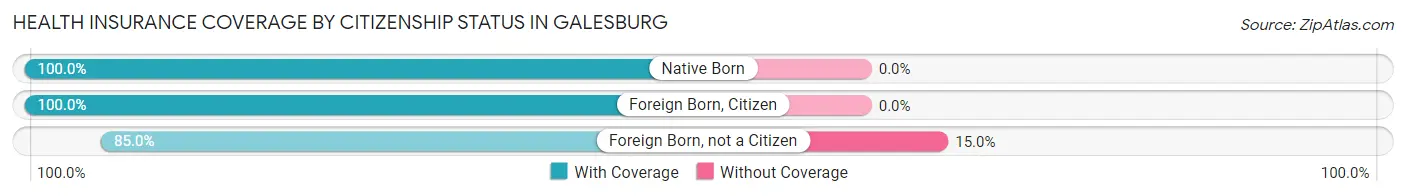
| Citizenship Status | With Coverage | Without Coverage |
| Native Born | 157 (100.0%) | 0 (0.0%) |
| Foreign Born, Citizen | 330 (100.0%) | 0 (0.0%) |
| Foreign Born, not a Citizen | 147 (85.0%) | 26 (15.0%) |
Health Insurance Coverage by Household Income in Galesburg
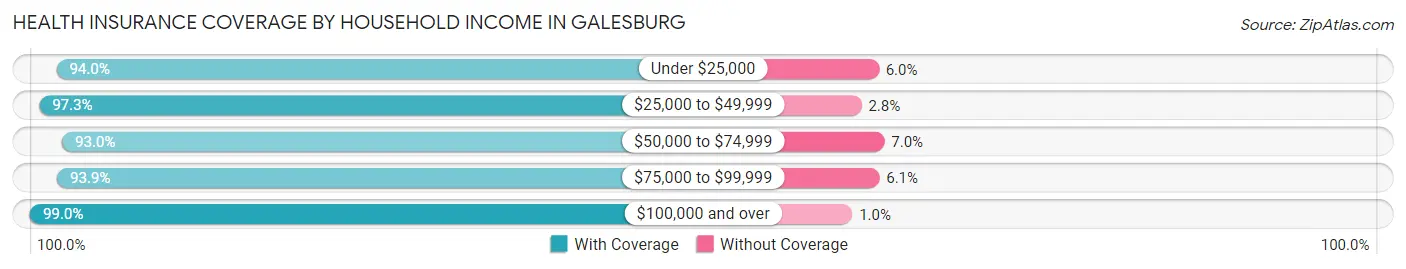
| Household Income | With Coverage | Without Coverage |
| Under $25,000 | 283 (94.0%) | 18 (6.0%) |
| $25,000 to $49,999 | 602 (97.3%) | 17 (2.8%) |
| $50,000 to $74,999 | 396 (93.0%) | 30 (7.0%) |
| $75,000 to $99,999 | 293 (93.9%) | 19 (6.1%) |
| $100,000 and over | 294 (99.0%) | 3 (1.0%) |
Public vs Private Health Insurance Coverage by Age in Galesburg
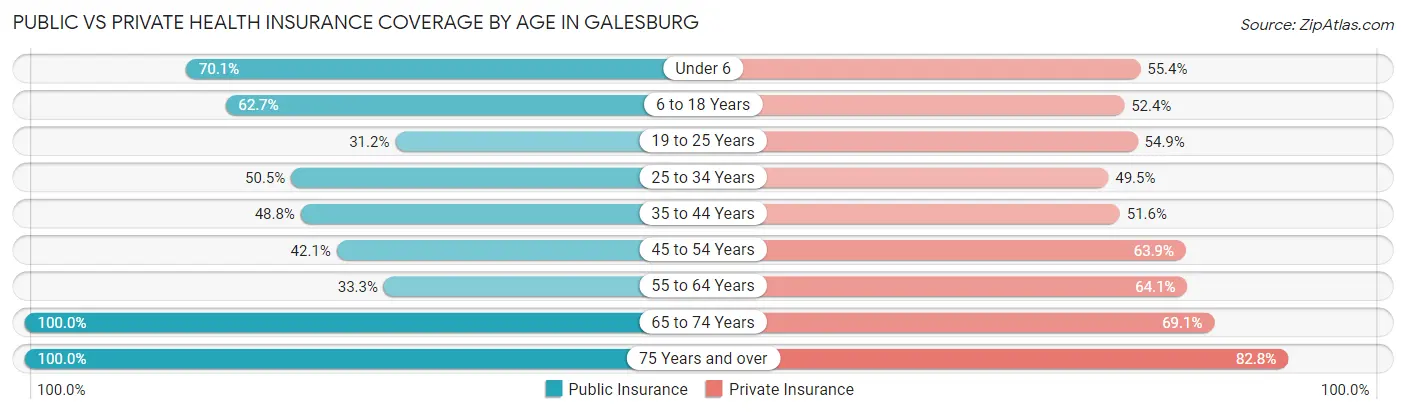
| Age Bracket | Public Insurance | Private Insurance |
| Under 6 | 110 (70.1%) | 87 (55.4%) |
| 6 to 18 Years | 207 (62.7%) | 173 (52.4%) |
| 19 to 25 Years | 54 (31.2%) | 95 (54.9%) |
| 25 to 34 Years | 143 (50.5%) | 140 (49.5%) |
| 35 to 44 Years | 137 (48.7%) | 145 (51.6%) |
| 45 to 54 Years | 85 (42.1%) | 129 (63.9%) |
| 55 to 64 Years | 79 (33.3%) | 152 (64.1%) |
| 65 to 74 Years | 217 (100.0%) | 150 (69.1%) |
| 75 Years and over | 99 (100.0%) | 82 (82.8%) |
| Total | 1,131 (57.2%) | 1,153 (58.3%) |
Disability Status by Sex by Age in Galesburg
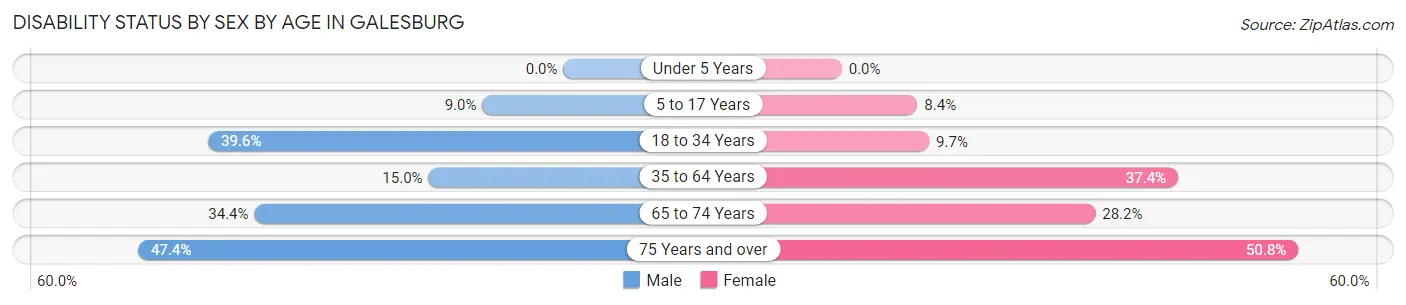
| Age Bracket | Male | Female |
| Under 5 Years | 0 (0.0%) | 0 (0.0%) |
| 5 to 17 Years | 14 (9.0%) | 17 (8.4%) |
| 18 to 34 Years | 110 (39.6%) | 18 (9.7%) |
| 35 to 64 Years | 52 (15.0%) | 140 (37.4%) |
| 65 to 74 Years | 32 (34.4%) | 35 (28.2%) |
| 75 Years and over | 18 (47.4%) | 31 (50.8%) |
Disability Class by Sex by Age in Galesburg
Disability Class: Hearing Difficulty
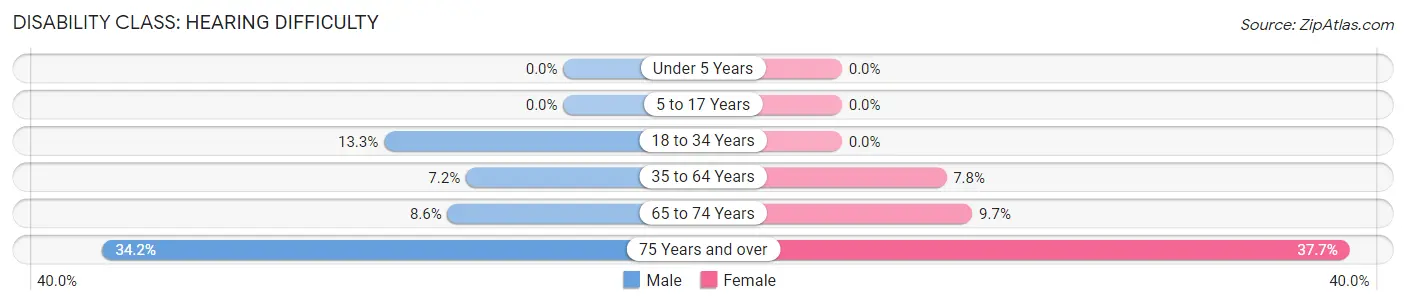
| Age Bracket | Male | Female |
| Under 5 Years | 0 (0.0%) | 0 (0.0%) |
| 5 to 17 Years | 0 (0.0%) | 0 (0.0%) |
| 18 to 34 Years | 37 (13.3%) | 0 (0.0%) |
| 35 to 64 Years | 25 (7.2%) | 29 (7.7%) |
| 65 to 74 Years | 8 (8.6%) | 12 (9.7%) |
| 75 Years and over | 13 (34.2%) | 23 (37.7%) |
Disability Class: Vision Difficulty
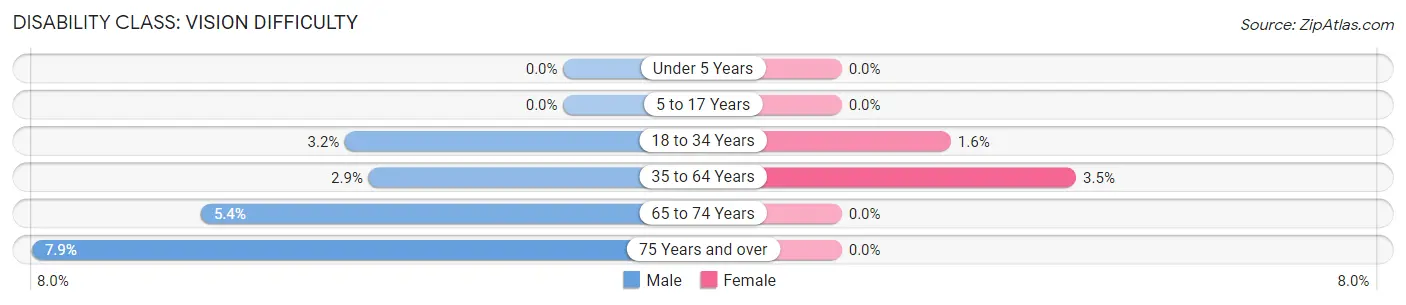
| Age Bracket | Male | Female |
| Under 5 Years | 0 (0.0%) | 0 (0.0%) |
| 5 to 17 Years | 0 (0.0%) | 0 (0.0%) |
| 18 to 34 Years | 9 (3.2%) | 3 (1.6%) |
| 35 to 64 Years | 10 (2.9%) | 13 (3.5%) |
| 65 to 74 Years | 5 (5.4%) | 0 (0.0%) |
| 75 Years and over | 3 (7.9%) | 0 (0.0%) |
Disability Class: Cognitive Difficulty
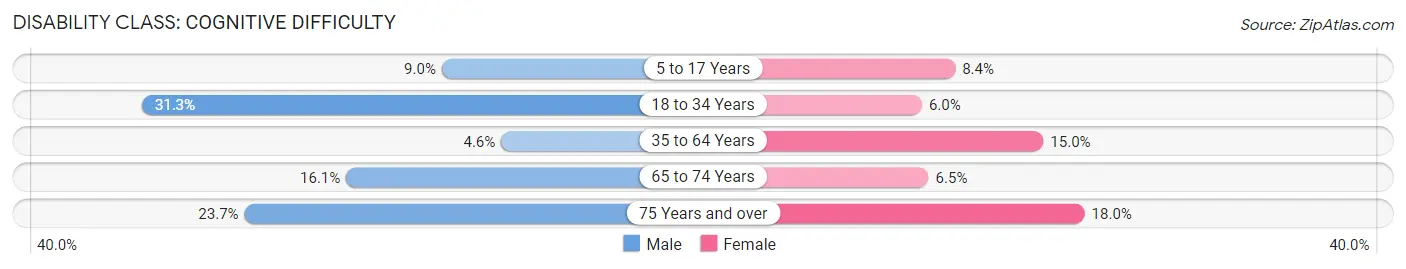
| Age Bracket | Male | Female |
| 5 to 17 Years | 14 (9.0%) | 17 (8.4%) |
| 18 to 34 Years | 87 (31.3%) | 11 (5.9%) |
| 35 to 64 Years | 16 (4.6%) | 56 (15.0%) |
| 65 to 74 Years | 15 (16.1%) | 8 (6.5%) |
| 75 Years and over | 9 (23.7%) | 11 (18.0%) |
Disability Class: Ambulatory Difficulty
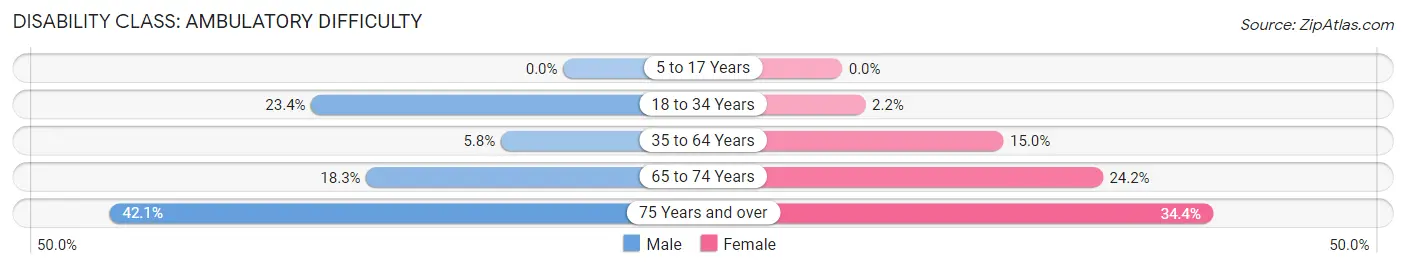
| Age Bracket | Male | Female |
| 5 to 17 Years | 0 (0.0%) | 0 (0.0%) |
| 18 to 34 Years | 65 (23.4%) | 4 (2.2%) |
| 35 to 64 Years | 20 (5.8%) | 56 (15.0%) |
| 65 to 74 Years | 17 (18.3%) | 30 (24.2%) |
| 75 Years and over | 16 (42.1%) | 21 (34.4%) |
Disability Class: Self-Care Difficulty
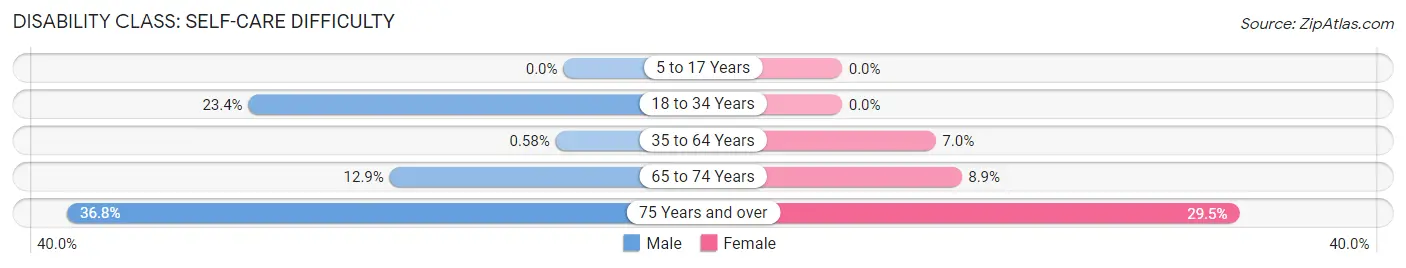
| Age Bracket | Male | Female |
| 5 to 17 Years | 0 (0.0%) | 0 (0.0%) |
| 18 to 34 Years | 65 (23.4%) | 0 (0.0%) |
| 35 to 64 Years | 2 (0.6%) | 26 (7.0%) |
| 65 to 74 Years | 12 (12.9%) | 11 (8.9%) |
| 75 Years and over | 14 (36.8%) | 18 (29.5%) |
Technology Access in Galesburg
Computing Device Access in Galesburg
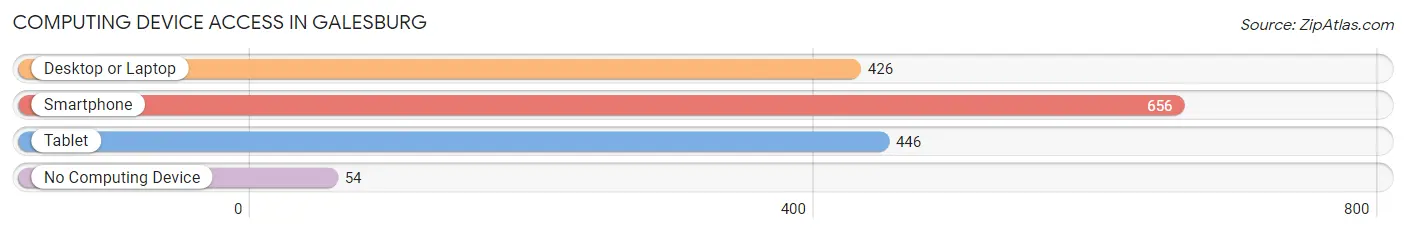
| Device Type | # Households | % Households |
| Desktop or Laptop | 426 | 54.9% |
| Smartphone | 656 | 84.5% |
| Tablet | 446 | 57.5% |
| No Computing Device | 54 | 7.0% |
| Total | 776 | 100.0% |
Internet Access in Galesburg
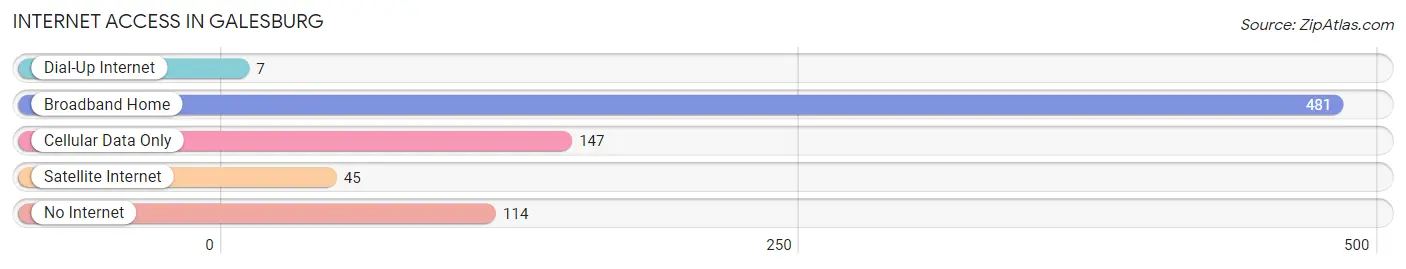
| Internet Type | # Households | % Households |
| Dial-Up Internet | 7 | 0.9% |
| Broadband Home | 481 | 62.0% |
| Cellular Data Only | 147 | 18.9% |
| Satellite Internet | 45 | 5.8% |
| No Internet | 114 | 14.7% |
| Total | 776 | 100.0% |
Galesburg Summary
Galesburg is a small city located in Kalamazoo County, Michigan. It is situated on the Kalamazoo River, about 10 miles south of Kalamazoo. The city has a population of approximately 3,500 people and is part of the Kalamazoo-Portage Metropolitan Statistical Area.
History
Galesburg was founded in 1831 by a group of settlers from New York. The settlers were led by William Gales, who named the town after himself. The town was originally a farming community, but it soon developed into a manufacturing center. In 1845, the first railroad line was built through Galesburg, connecting it to Kalamazoo. This allowed the town to become a major shipping hub for the region.
In the late 19th century, Galesburg became a major center for the lumber industry. The town was home to several sawmills and lumber yards, and the lumber industry provided many jobs for the town’s residents.
In the early 20th century, Galesburg began to decline as the lumber industry moved away from the area. The town’s population decreased and many of the businesses closed. In the 1950s, the town began to experience a resurgence as new businesses moved into the area.
Geography
Galesburg is located in southwestern Michigan, about 10 miles south of Kalamazoo. The city is situated on the Kalamazoo River, which flows through the city. The city is surrounded by farmland and is located near several small lakes.
The city has a total area of 2.2 square miles, all of which is land. The city has a humid continental climate, with hot summers and cold winters.
Economy
Galesburg’s economy is largely based on manufacturing and agriculture. The city is home to several manufacturing companies, including a paper mill, a plastics factory, and a metal fabrication plant. The city is also home to several agricultural businesses, including a dairy farm and a vegetable farm.
The city is also home to several retail businesses, including several restaurants, a grocery store, and a hardware store.
Demographics
As of the 2010 census, Galesburg had a population of 3,521 people. The racial makeup of the city was 94.3% White, 1.2% African American, 0.3% Native American, 0.7% Asian, 0.1% Pacific Islander, 1.2% from other races, and 2.3% from two or more races. Hispanic or Latino of any race were 3.2% of the population.
The median household income in Galesburg was $41,944, and the median family income was $50,917. The per capita income for the city was $20,845. About 11.2% of families and 14.2% of the population were below the poverty line, including 19.2% of those under age 18 and 8.2% of those age 65 or over.
Common Questions
What is Per Capita Income in Galesburg?
Per Capita income in Galesburg is $22,302.
What is the Median Family Income in Galesburg?
Median Family Income in Galesburg is $52,279.
What is the Median Household income in Galesburg?
Median Household Income in Galesburg is $45,385.
What is Income or Wage Gap in Galesburg?
Income or Wage Gap in Galesburg is 27.7%.
Women in Galesburg earn 72.3 cents for every dollar earned by a man.
What is Family Income Deficit in Galesburg?
Family Income Deficit in Galesburg is $6,117.
Families that are below poverty line in Galesburg earn $6,117 less on average than the poverty threshold level.
What is Inequality or Gini Index in Galesburg?
Inequality or Gini Index in Galesburg is 0.39.
What is the Total Population of Galesburg?
Total Population of Galesburg is 2,069.
What is the Total Male Population of Galesburg?
Total Male Population of Galesburg is 1,000.
What is the Total Female Population of Galesburg?
Total Female Population of Galesburg is 1,069.
What is the Ratio of Males per 100 Females in Galesburg?
There are 93.55 Males per 100 Females in Galesburg.
What is the Ratio of Females per 100 Males in Galesburg?
There are 106.90 Females per 100 Males in Galesburg.
What is the Median Population Age in Galesburg?
Median Population Age in Galesburg is 38.5 Years.
What is the Average Family Size in Galesburg
Average Family Size in Galesburg is 3.1 People.
What is the Average Household Size in Galesburg
Average Household Size in Galesburg is 2.5 People.
How Large is the Labor Force in Galesburg?
There are 899 People in the Labor Forcein in Galesburg.
What is the Percentage of People in the Labor Force in Galesburg?
54.7% of People are in the Labor Force in Galesburg.
What is the Unemployment Rate in Galesburg?
Unemployment Rate in Galesburg is 5.9%.