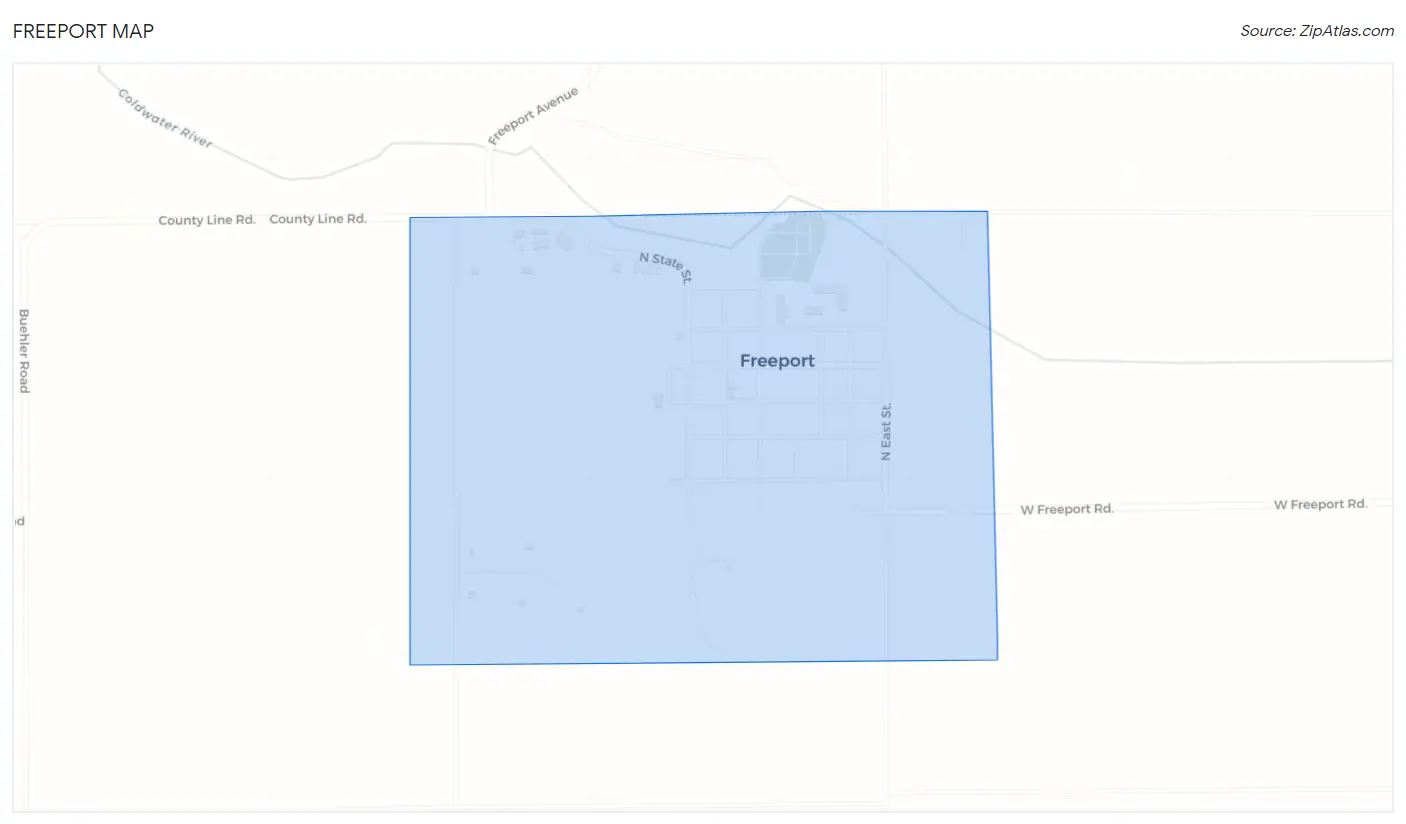
Freeport, MI Map & Demographics
Freeport Map
Freeport Overview
$25,401
PER CAPITA INCOME
$73,000
AVG FAMILY INCOME
$64,861
AVG HOUSEHOLD INCOME
55.0%
WAGE / INCOME GAP [ % ]
45.0¢/ $1
WAGE / INCOME GAP [ $ ]
0.35
INEQUALITY / GINI INDEX
713
TOTAL POPULATION
331
MALE POPULATION
382
FEMALE POPULATION
86.65
MALES / 100 FEMALES
115.41
FEMALES / 100 MALES
27.6
MEDIAN AGE
3.3
AVG FAMILY SIZE
2.9
AVG HOUSEHOLD SIZE
353
LABOR FORCE [ PEOPLE ]
67.9%
PERCENT IN LABOR FORCE
3.7%
UNEMPLOYMENT RATE
Freeport Zip Codes
Freeport Area Codes
Income in Freeport
Income Overview in Freeport
Per Capita Income in Freeport is $25,401, while median incomes of families and households are $73,000 and $64,861 respectively.
| Characteristic | Number | Measure |
| Per Capita Income | 713 | $25,401 |
| Median Family Income | 170 | $73,000 |
| Mean Family Income | 170 | $77,156 |
| Median Household Income | 245 | $64,861 |
| Mean Household Income | 245 | $73,055 |
| Income Deficit | 170 | $0 |
| Wage / Income Gap (%) | 713 | 55.04% |
| Wage / Income Gap ($) | 713 | 44.96¢ per $1 |
| Gini / Inequality Index | 713 | 0.35 |
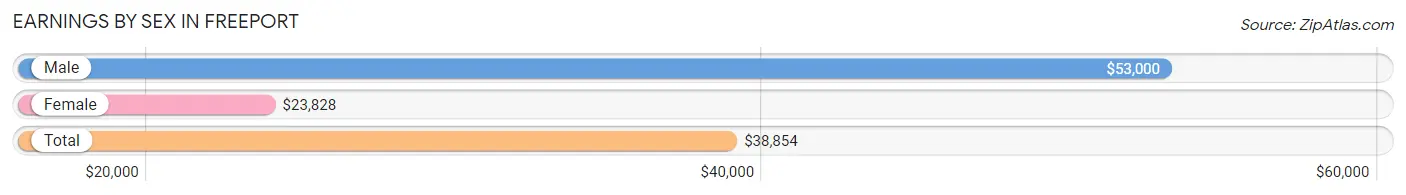
Earnings by Sex in Freeport
Average Earnings in Freeport are $38,854, $53,000 for men and $23,828 for women, a difference of 55.0%.
| Sex | Number | Average Earnings |
| Male | 178 (48.2%) | $53,000 |
| Female | 191 (51.8%) | $23,828 |
| Total | 369 (100.0%) | $38,854 |
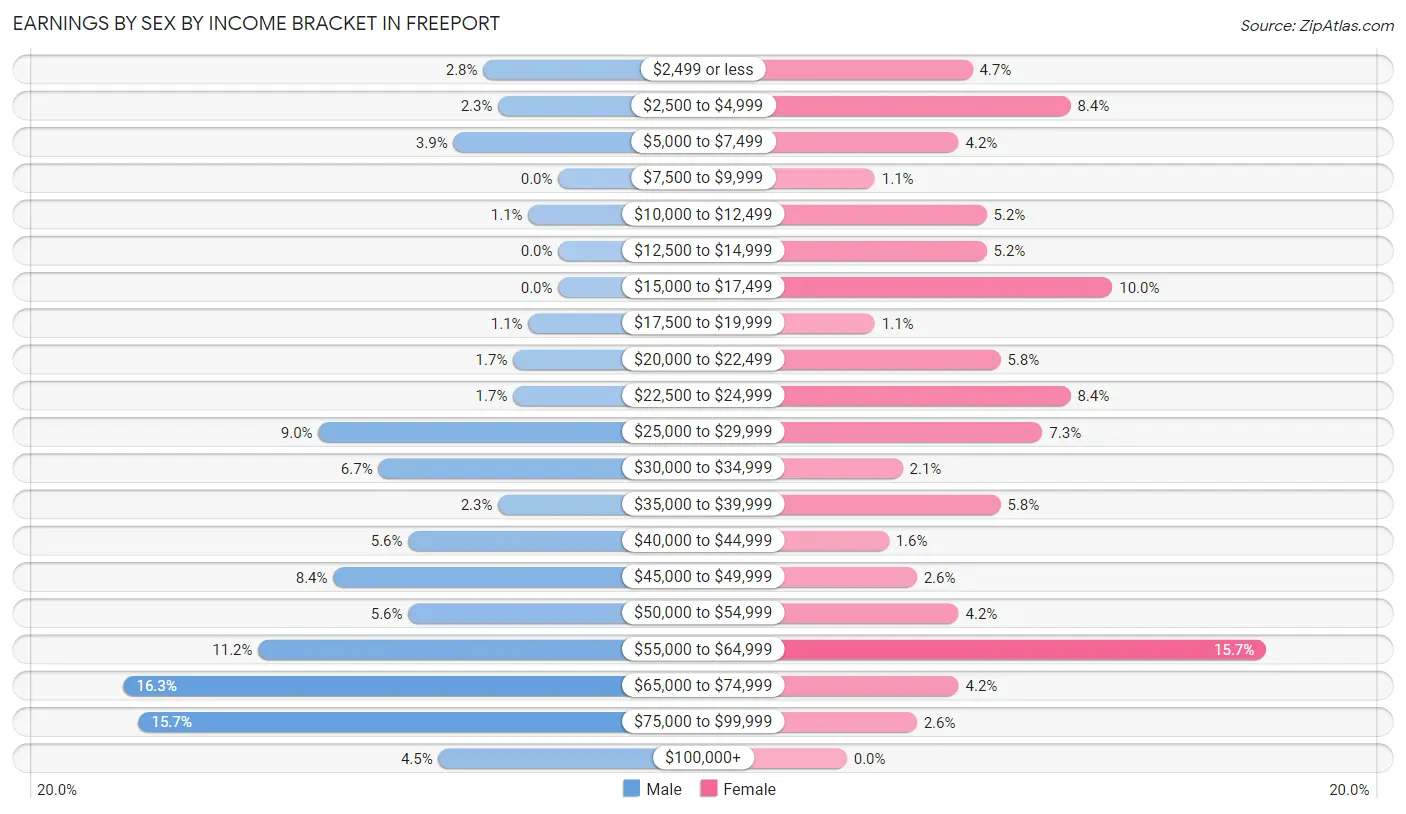
Earnings by Sex by Income Bracket in Freeport
The most common earnings brackets in Freeport are $65,000 to $74,999 for men (29 | 16.3%) and $55,000 to $64,999 for women (30 | 15.7%).
| Income | Male | Female |
| $2,499 or less | 5 (2.8%) | 9 (4.7%) |
| $2,500 to $4,999 | 4 (2.2%) | 16 (8.4%) |
| $5,000 to $7,499 | 7 (3.9%) | 8 (4.2%) |
| $7,500 to $9,999 | 0 (0.0%) | 2 (1.1%) |
| $10,000 to $12,499 | 2 (1.1%) | 10 (5.2%) |
| $12,500 to $14,999 | 0 (0.0%) | 10 (5.2%) |
| $15,000 to $17,499 | 0 (0.0%) | 19 (10.0%) |
| $17,500 to $19,999 | 2 (1.1%) | 2 (1.1%) |
| $20,000 to $22,499 | 3 (1.7%) | 11 (5.8%) |
| $22,500 to $24,999 | 3 (1.7%) | 16 (8.4%) |
| $25,000 to $29,999 | 16 (9.0%) | 14 (7.3%) |
| $30,000 to $34,999 | 12 (6.7%) | 4 (2.1%) |
| $35,000 to $39,999 | 4 (2.2%) | 11 (5.8%) |
| $40,000 to $44,999 | 10 (5.6%) | 3 (1.6%) |
| $45,000 to $49,999 | 15 (8.4%) | 5 (2.6%) |
| $50,000 to $54,999 | 10 (5.6%) | 8 (4.2%) |
| $55,000 to $64,999 | 20 (11.2%) | 30 (15.7%) |
| $65,000 to $74,999 | 29 (16.3%) | 8 (4.2%) |
| $75,000 to $99,999 | 28 (15.7%) | 5 (2.6%) |
| $100,000+ | 8 (4.5%) | 0 (0.0%) |
| Total | 178 (100.0%) | 191 (100.0%) |
Earnings by Sex by Educational Attainment in Freeport
Average earnings in Freeport are $57,083 for men and $35,833 for women, a difference of 37.2%. Men with an educational attainment of bachelor's degree enjoy the highest average annual earnings of $68,438, while those with less than high school education earn the least with $53,000. Women with an educational attainment of bachelor's degree earn the most with the average annual earnings of $55,446, while those with college or associate's degree education have the smallest earnings of $25,000.
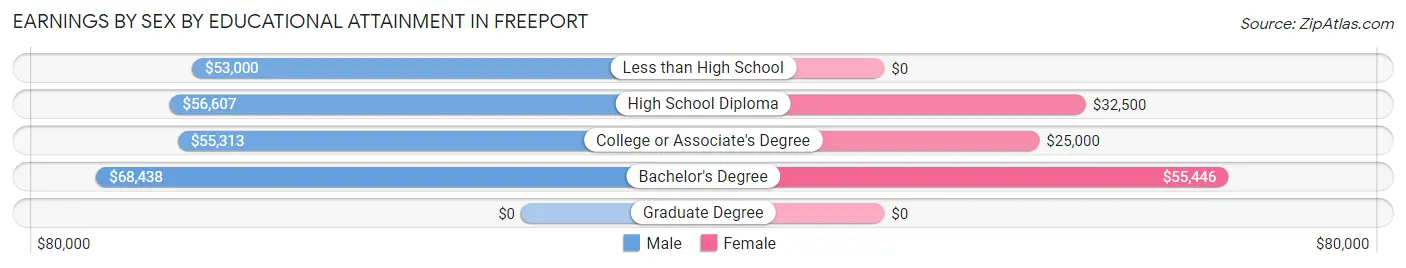
| Educational Attainment | Male Income | Female Income |
| Less than High School | $53,000 | $0 |
| High School Diploma | $56,607 | $32,500 |
| College or Associate's Degree | $55,313 | $25,000 |
| Bachelor's Degree | $68,438 | $55,446 |
| Graduate Degree | - | - |
| Total | $57,083 | $35,833 |
Family Income in Freeport
Family Income Brackets in Freeport
According to the Freeport family income data, there are 37 families falling into the $75,000 to $99,999 income range, which is the most common income bracket and makes up 21.8% of all families. Conversely, the $200,000+ income bracket is the least frequent group with only 4 families (2.4%) belonging to this category.
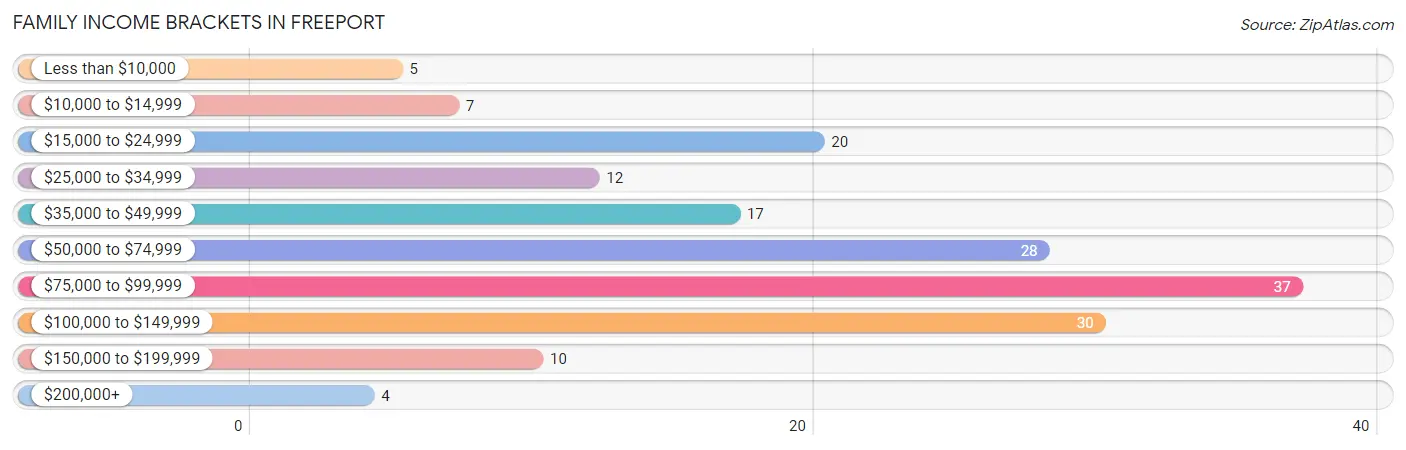
| Income Bracket | # Families | % Families |
| Less than $10,000 | 5 | 2.9% |
| $10,000 to $14,999 | 7 | 4.1% |
| $15,000 to $24,999 | 20 | 11.8% |
| $25,000 to $34,999 | 12 | 7.1% |
| $35,000 to $49,999 | 17 | 10.0% |
| $50,000 to $74,999 | 28 | 16.5% |
| $75,000 to $99,999 | 37 | 21.8% |
| $100,000 to $149,999 | 30 | 17.6% |
| $150,000 to $199,999 | 10 | 5.9% |
| $200,000+ | 4 | 2.4% |
Family Income by Famaliy Size in Freeport
6-person families (20 | 11.8%) account for the highest median family income in Freeport with $128,438 per family, while 2-person families (66 | 38.8%) have the highest median income of $27,916 per family member.
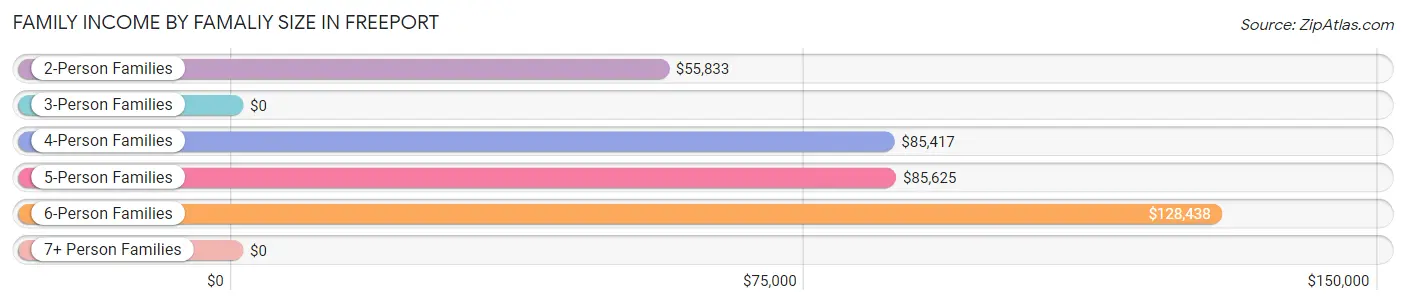
| Income Bracket | # Families | Median Income |
| 2-Person Families | 66 (38.8%) | $55,833 |
| 3-Person Families | 33 (19.4%) | $0 |
| 4-Person Families | 31 (18.2%) | $85,417 |
| 5-Person Families | 19 (11.2%) | $85,625 |
| 6-Person Families | 20 (11.8%) | $128,438 |
| 7+ Person Families | 1 (0.6%) | $0 |
| Total | 170 (100.0%) | $73,000 |
Family Income by Number of Earners in Freeport
The median family income in Freeport is $73,000, with families comprising 3+ earners (38) having the highest median family income of $128,438, while families with no earners (19) have the lowest median family income of $31,250, accounting for 22.4% and 11.2% of families, respectively.
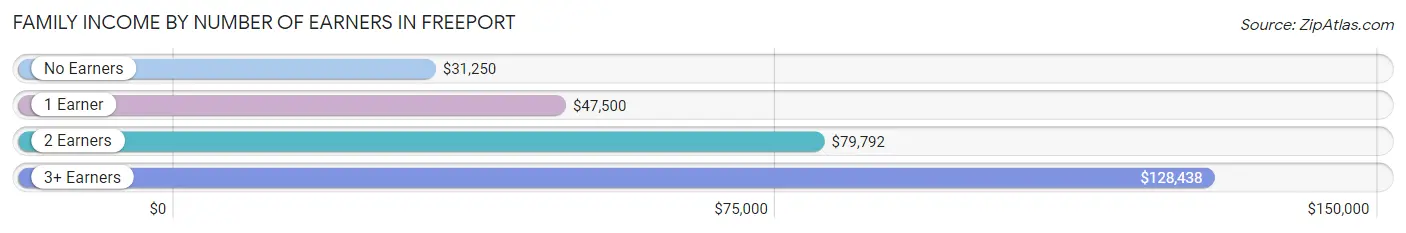
| Number of Earners | # Families | Median Income |
| No Earners | 19 (11.2%) | $31,250 |
| 1 Earner | 74 (43.5%) | $47,500 |
| 2 Earners | 39 (22.9%) | $79,792 |
| 3+ Earners | 38 (22.4%) | $128,438 |
| Total | 170 (100.0%) | $73,000 |
Household Income in Freeport
Household Income Brackets in Freeport
With 60 households falling in the category, the $50,000 to $74,999 income range is the most frequent in Freeport, accounting for 24.5% of all households. In contrast, only 5 households (2.0%) fall into the $200,000+ income bracket, making it the least populous group.
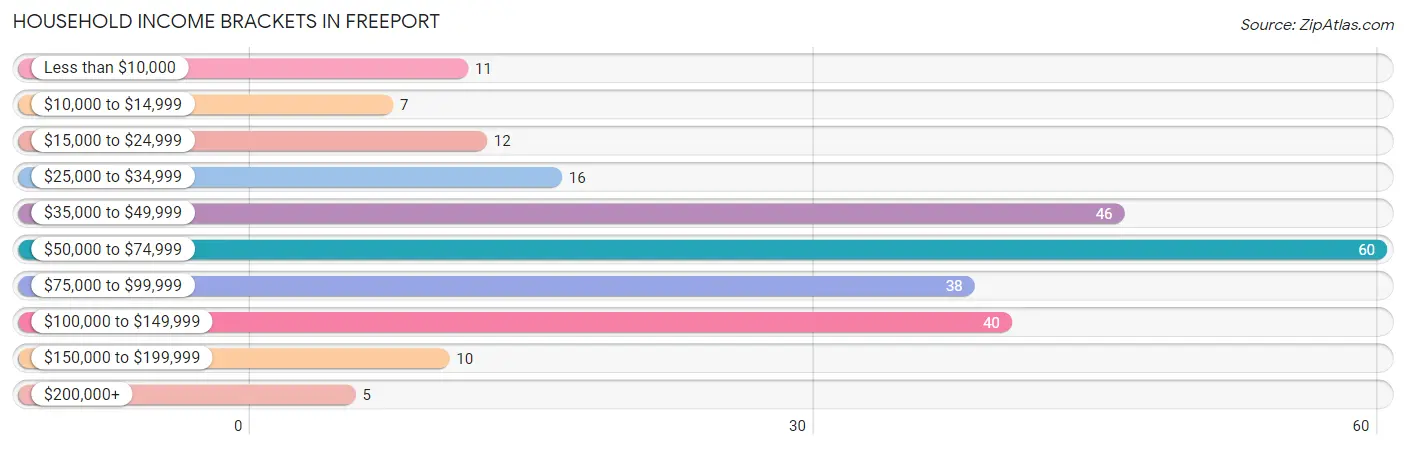
| Income Bracket | # Households | % Households |
| Less than $10,000 | 11 | 4.5% |
| $10,000 to $14,999 | 7 | 2.9% |
| $15,000 to $24,999 | 12 | 4.9% |
| $25,000 to $34,999 | 16 | 6.5% |
| $35,000 to $49,999 | 46 | 18.8% |
| $50,000 to $74,999 | 60 | 24.5% |
| $75,000 to $99,999 | 38 | 15.5% |
| $100,000 to $149,999 | 40 | 16.3% |
| $150,000 to $199,999 | 10 | 4.1% |
| $200,000+ | 5 | 2.0% |
Household Income by Householder Age in Freeport
The median household income in Freeport is $64,861, with the highest median household income of $68,417 found in the 15 to 24 years age bracket for the primary householder. A total of 23 households (9.4%) fall into this category. Meanwhile, the 65+ years age bracket for the primary householder has the lowest median household income of $46,458, with 37 households (15.1%) in this group.
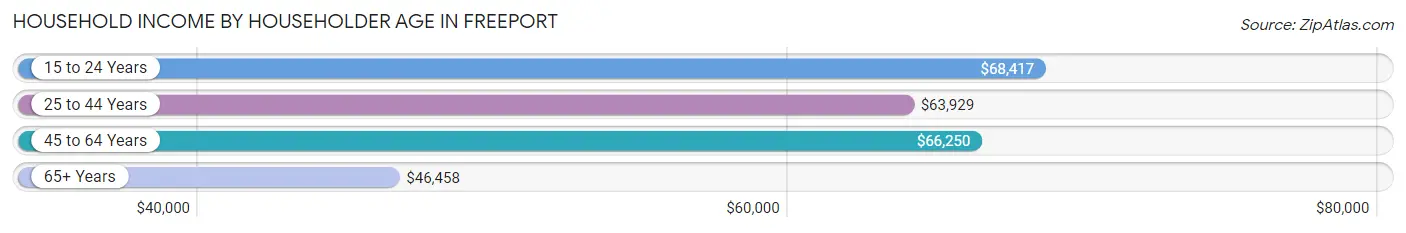
| Income Bracket | # Households | Median Income |
| 15 to 24 Years | 23 (9.4%) | $68,417 |
| 25 to 44 Years | 74 (30.2%) | $63,929 |
| 45 to 64 Years | 111 (45.3%) | $66,250 |
| 65+ Years | 37 (15.1%) | $46,458 |
| Total | 245 (100.0%) | $64,861 |
Poverty in Freeport
Income Below Poverty by Sex and Age in Freeport
With 8.0% poverty level for males and 19.1% for females among the residents of Freeport, 5 year old males and 45 to 54 year old females are the most vulnerable to poverty, with 4 males (66.7%) and 10 females (37.0%) in their respective age groups living below the poverty level.
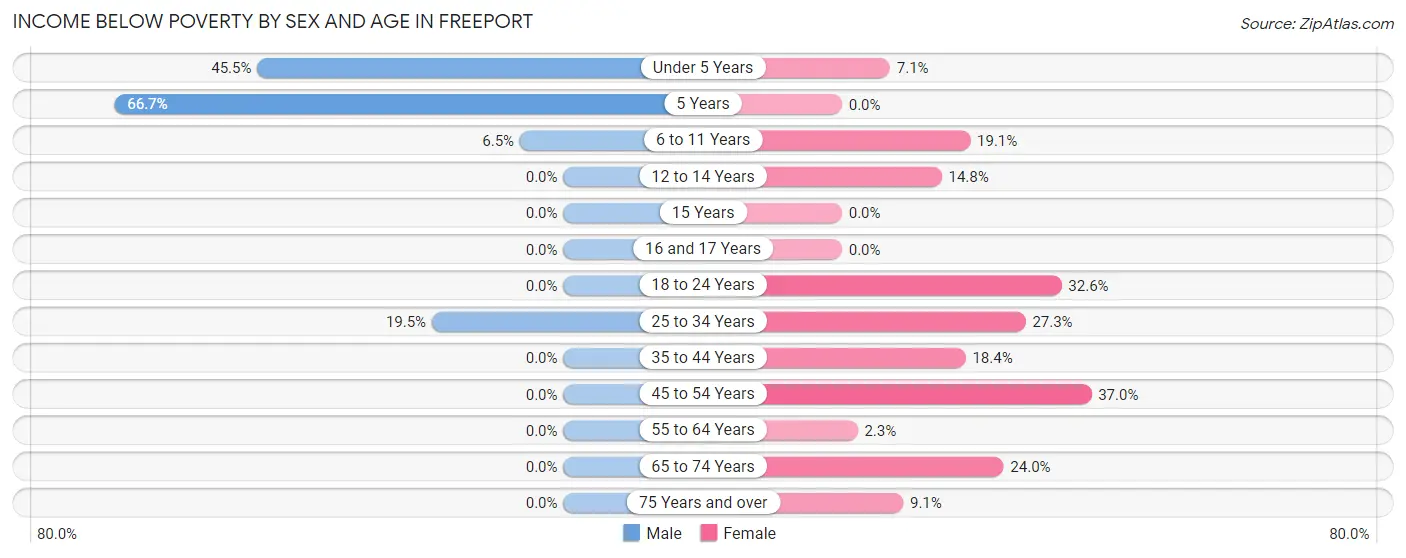
| Age Bracket | Male | Female |
| Under 5 Years | 10 (45.5%) | 1 (7.1%) |
| 5 Years | 4 (66.7%) | 0 (0.0%) |
| 6 to 11 Years | 4 (6.5%) | 4 (19.1%) |
| 12 to 14 Years | 0 (0.0%) | 4 (14.8%) |
| 15 Years | 0 (0.0%) | 0 (0.0%) |
| 16 and 17 Years | 0 (0.0%) | 0 (0.0%) |
| 18 to 24 Years | 0 (0.0%) | 15 (32.6%) |
| 25 to 34 Years | 8 (19.5%) | 18 (27.3%) |
| 35 to 44 Years | 0 (0.0%) | 9 (18.4%) |
| 45 to 54 Years | 0 (0.0%) | 10 (37.0%) |
| 55 to 64 Years | 0 (0.0%) | 1 (2.3%) |
| 65 to 74 Years | 0 (0.0%) | 6 (24.0%) |
| 75 Years and over | 0 (0.0%) | 1 (9.1%) |
| Total | 26 (8.0%) | 69 (19.1%) |
Income Above Poverty by Sex and Age in Freeport
According to the poverty statistics in Freeport, males aged 12 to 14 years and females aged 5 years are the age groups that are most secure financially, with 100.0% of males and 100.0% of females in these age groups living above the poverty line.
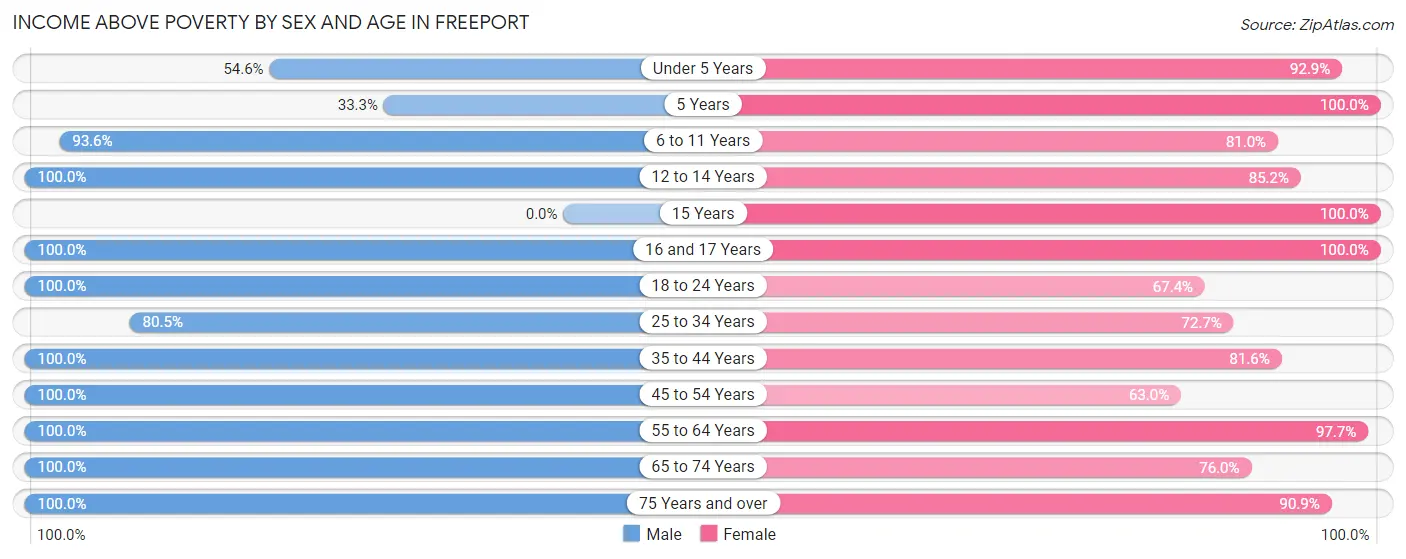
| Age Bracket | Male | Female |
| Under 5 Years | 12 (54.5%) | 13 (92.9%) |
| 5 Years | 2 (33.3%) | 7 (100.0%) |
| 6 to 11 Years | 58 (93.5%) | 17 (80.9%) |
| 12 to 14 Years | 5 (100.0%) | 23 (85.2%) |
| 15 Years | 0 (0.0%) | 3 (100.0%) |
| 16 and 17 Years | 9 (100.0%) | 23 (100.0%) |
| 18 to 24 Years | 34 (100.0%) | 31 (67.4%) |
| 25 to 34 Years | 33 (80.5%) | 48 (72.7%) |
| 35 to 44 Years | 27 (100.0%) | 40 (81.6%) |
| 45 to 54 Years | 35 (100.0%) | 17 (63.0%) |
| 55 to 64 Years | 62 (100.0%) | 42 (97.7%) |
| 65 to 74 Years | 13 (100.0%) | 19 (76.0%) |
| 75 Years and over | 9 (100.0%) | 10 (90.9%) |
| Total | 299 (92.0%) | 293 (80.9%) |
Income Below Poverty Among Married-Couple Families in Freeport
The poverty statistics for married-couple families in Freeport show that 1.9% or 2 of the total 105 families live below the poverty line. Families with 5 or more children have the highest poverty rate of 100.0%, comprising of 1 families. On the other hand, families with no children have the lowest poverty rate of 0.0%, which includes 0 families.
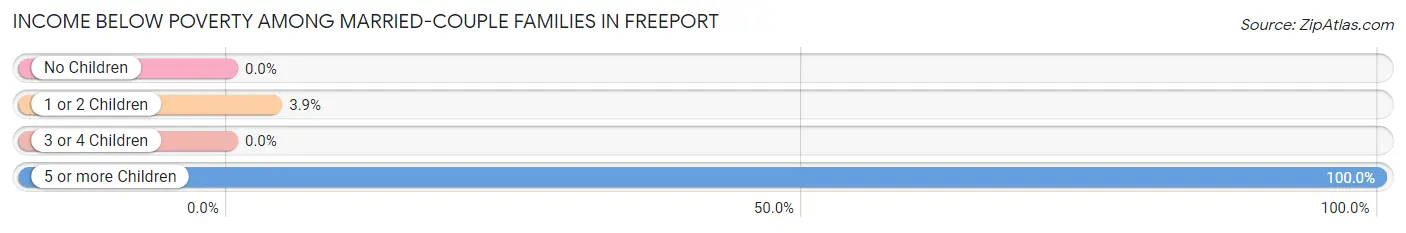
| Children | Above Poverty | Below Poverty |
| No Children | 47 (100.0%) | 0 (0.0%) |
| 1 or 2 Children | 25 (96.2%) | 1 (3.8%) |
| 3 or 4 Children | 31 (100.0%) | 0 (0.0%) |
| 5 or more Children | 0 (0.0%) | 1 (100.0%) |
| Total | 103 (98.1%) | 2 (1.9%) |
Income Below Poverty Among Single-Parent Households in Freeport
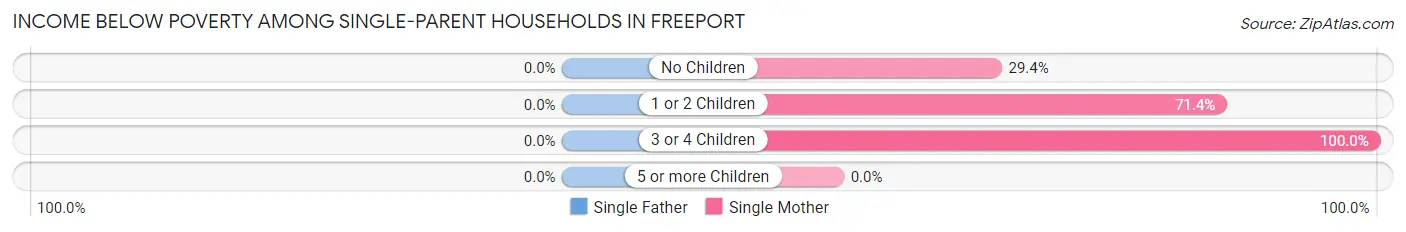
| Children | Single Father | Single Mother |
| No Children | 0 (0.0%) | 5 (29.4%) |
| 1 or 2 Children | 0 (0.0%) | 20 (71.4%) |
| 3 or 4 Children | 0 (0.0%) | 2 (100.0%) |
| 5 or more Children | 0 (0.0%) | 0 (0.0%) |
| Total | 0 (0.0%) | 27 (57.5%) |
Income Below Poverty Among Married-Couple vs Single-Parent Households in Freeport
The poverty data for Freeport shows that 2 of the married-couple family households (1.9%) and 27 of the single-parent households (41.5%) are living below the poverty level. Within the married-couple family households, those with 5 or more children have the highest poverty rate, with 1 households (100.0%) falling below the poverty line. Among the single-parent households, those with 1 or 2 children have the highest poverty rate, with 20 household (50.0%) living below poverty.
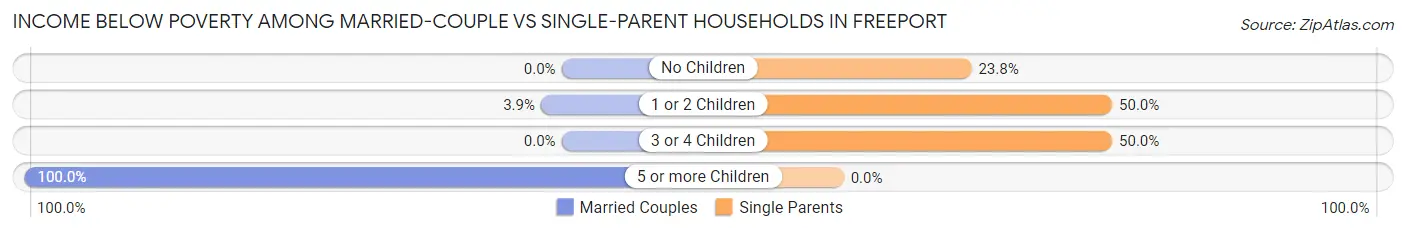
| Children | Married-Couple Families | Single-Parent Households |
| No Children | 0 (0.0%) | 5 (23.8%) |
| 1 or 2 Children | 1 (3.8%) | 20 (50.0%) |
| 3 or 4 Children | 0 (0.0%) | 2 (50.0%) |
| 5 or more Children | 1 (100.0%) | 0 (0.0%) |
| Total | 2 (1.9%) | 27 (41.5%) |
Race in Freeport
The most populous races in Freeport are White / Caucasian (698 | 97.9%), Hispanic or Latino (62 | 8.7%), and Two or more Races (15 | 2.1%).
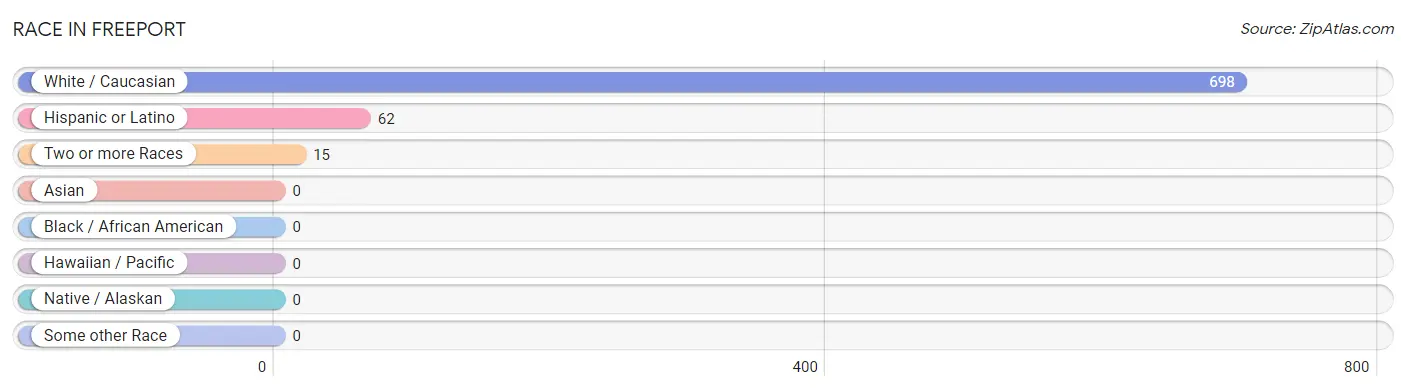
| Race | # Population | % Population |
| Asian | 0 | 0.0% |
| Black / African American | 0 | 0.0% |
| Hawaiian / Pacific | 0 | 0.0% |
| Hispanic or Latino | 62 | 8.7% |
| Native / Alaskan | 0 | 0.0% |
| White / Caucasian | 698 | 97.9% |
| Two or more Races | 15 | 2.1% |
| Some other Race | 0 | 0.0% |
| Total | 713 | 100.0% |
Ancestry in Freeport
The most populous ancestries reported in Freeport are English (102 | 14.3%), German (89 | 12.5%), Mexican (55 | 7.7%), American (54 | 7.6%), and Irish (52 | 7.3%), together accounting for 49.4% of all Freeport residents.
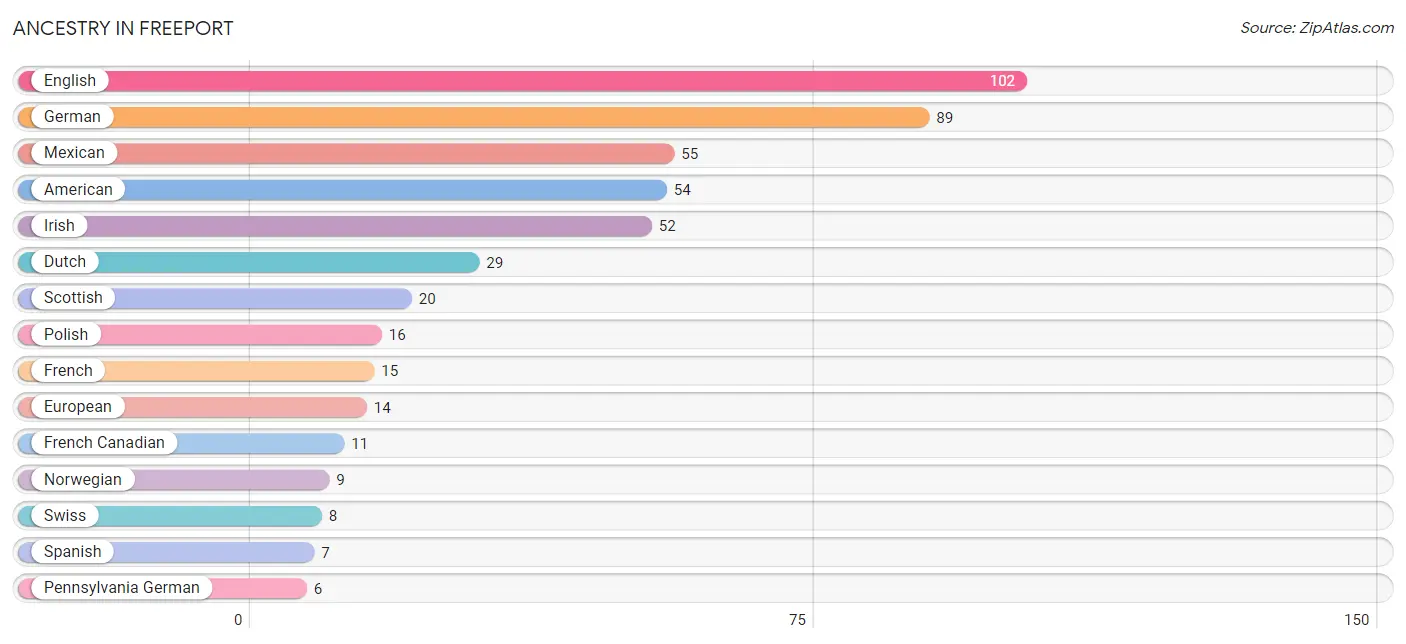
| Ancestry | # Population | % Population |
| American | 54 | 7.6% |
| Armenian | 2 | 0.3% |
| Danish | 4 | 0.6% |
| Dutch | 29 | 4.1% |
| Eastern European | 2 | 0.3% |
| English | 102 | 14.3% |
| European | 14 | 2.0% |
| French | 15 | 2.1% |
| French Canadian | 11 | 1.5% |
| German | 89 | 12.5% |
| Irish | 52 | 7.3% |
| Italian | 3 | 0.4% |
| Mexican | 55 | 7.7% |
| Northern European | 1 | 0.1% |
| Norwegian | 9 | 1.3% |
| Pennsylvania German | 6 | 0.8% |
| Polish | 16 | 2.2% |
| Scandinavian | 1 | 0.1% |
| Scotch-Irish | 1 | 0.1% |
| Scottish | 20 | 2.8% |
| Sioux | 5 | 0.7% |
| Slovak | 5 | 0.7% |
| Spanish | 7 | 1.0% |
| Swiss | 8 | 1.1% |
| Welsh | 2 | 0.3% | View All 25 Rows |
Immigrants in Freeport
The most numerous immigrant groups reported in Freeport came from Europe (2 | 0.3%), Germany (2 | 0.3%), and Western Europe (2 | 0.3%), together accounting for 0.8% of all Freeport residents.
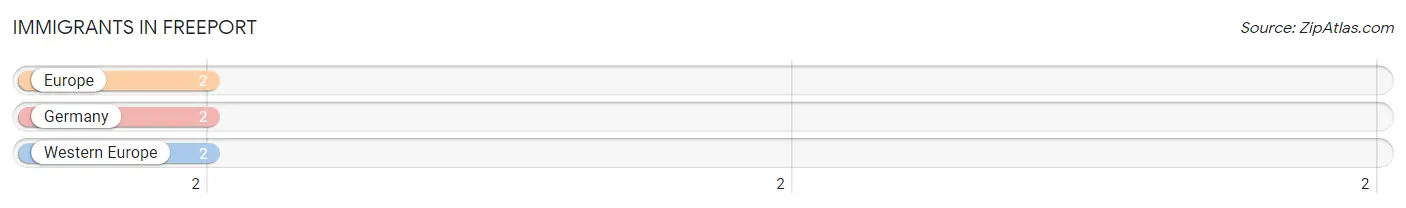
| Immigration Origin | # Population | % Population |
| Europe | 2 | 0.3% |
| Germany | 2 | 0.3% |
| Western Europe | 2 | 0.3% | View All 3 Rows |
Sex and Age in Freeport
Sex and Age in Freeport
The most populous age groups in Freeport are 55 to 59 Years (48 | 14.5%) for men and 25 to 29 Years (45 | 11.8%) for women.
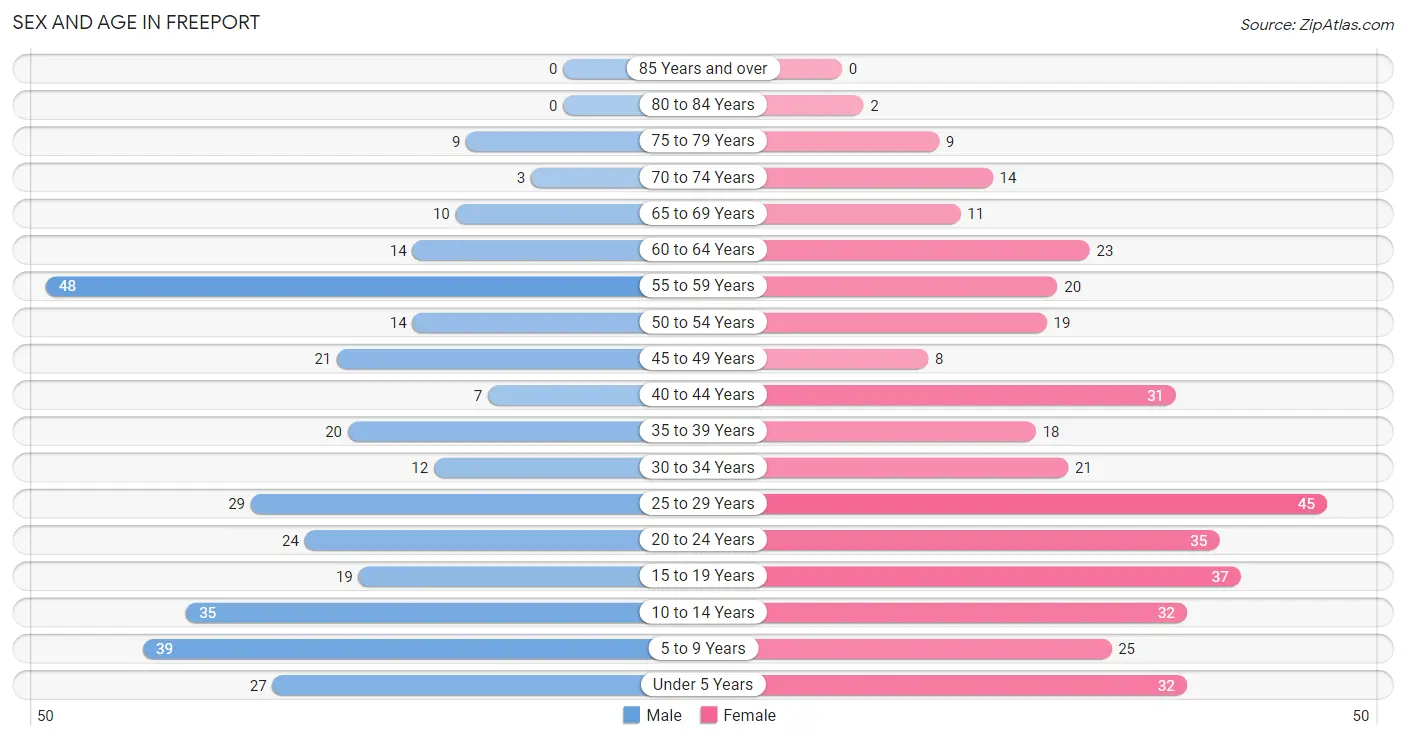
| Age Bracket | Male | Female |
| Under 5 Years | 27 (8.2%) | 32 (8.4%) |
| 5 to 9 Years | 39 (11.8%) | 25 (6.5%) |
| 10 to 14 Years | 35 (10.6%) | 32 (8.4%) |
| 15 to 19 Years | 19 (5.7%) | 37 (9.7%) |
| 20 to 24 Years | 24 (7.2%) | 35 (9.2%) |
| 25 to 29 Years | 29 (8.8%) | 45 (11.8%) |
| 30 to 34 Years | 12 (3.6%) | 21 (5.5%) |
| 35 to 39 Years | 20 (6.0%) | 18 (4.7%) |
| 40 to 44 Years | 7 (2.1%) | 31 (8.1%) |
| 45 to 49 Years | 21 (6.3%) | 8 (2.1%) |
| 50 to 54 Years | 14 (4.2%) | 19 (5.0%) |
| 55 to 59 Years | 48 (14.5%) | 20 (5.2%) |
| 60 to 64 Years | 14 (4.2%) | 23 (6.0%) |
| 65 to 69 Years | 10 (3.0%) | 11 (2.9%) |
| 70 to 74 Years | 3 (0.9%) | 14 (3.7%) |
| 75 to 79 Years | 9 (2.7%) | 9 (2.4%) |
| 80 to 84 Years | 0 (0.0%) | 2 (0.5%) |
| 85 Years and over | 0 (0.0%) | 0 (0.0%) |
| Total | 331 (100.0%) | 382 (100.0%) |
Families and Households in Freeport
Median Family Size in Freeport
The median family size in Freeport is 3.32 persons per family, with married-couple families (105 | 61.8%) accounting for the largest median family size of 3.76 persons per family. On the other hand, single female/mother families (47 | 27.7%) represent the smallest median family size with 2.36 persons per family.
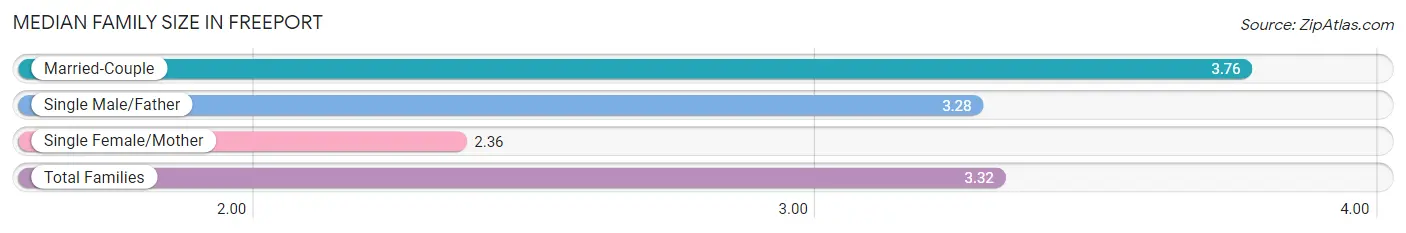
| Family Type | # Families | Family Size |
| Married-Couple | 105 (61.8%) | 3.76 |
| Single Male/Father | 18 (10.6%) | 3.28 |
| Single Female/Mother | 47 (27.7%) | 2.36 |
| Total Families | 170 (100.0%) | 3.32 |
Median Household Size in Freeport
The median household size in Freeport is 2.91 persons per household, with single male/father households (18 | 7.3%) accounting for the largest median household size of 3.94 persons per household. non-family households (75 | 30.6%) represent the smallest median household size with 1.15 persons per household.
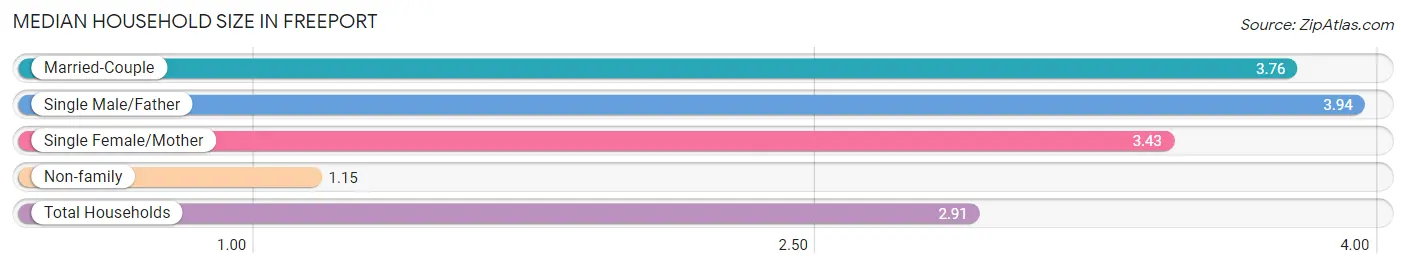
| Household Type | # Households | Household Size |
| Married-Couple | 105 (42.9%) | 3.76 |
| Single Male/Father | 18 (7.3%) | 3.94 |
| Single Female/Mother | 47 (19.2%) | 3.43 |
| Non-family | 75 (30.6%) | 1.15 |
| Total Households | 245 (100.0%) | 2.91 |
Household Size by Marriage Status in Freeport
Out of a total of 245 households in Freeport, 170 (69.4%) are family households, while 75 (30.6%) are nonfamily households. The most numerous type of family households are 2-person households, comprising 55, and the most common type of nonfamily households are 1-person households, comprising 66.
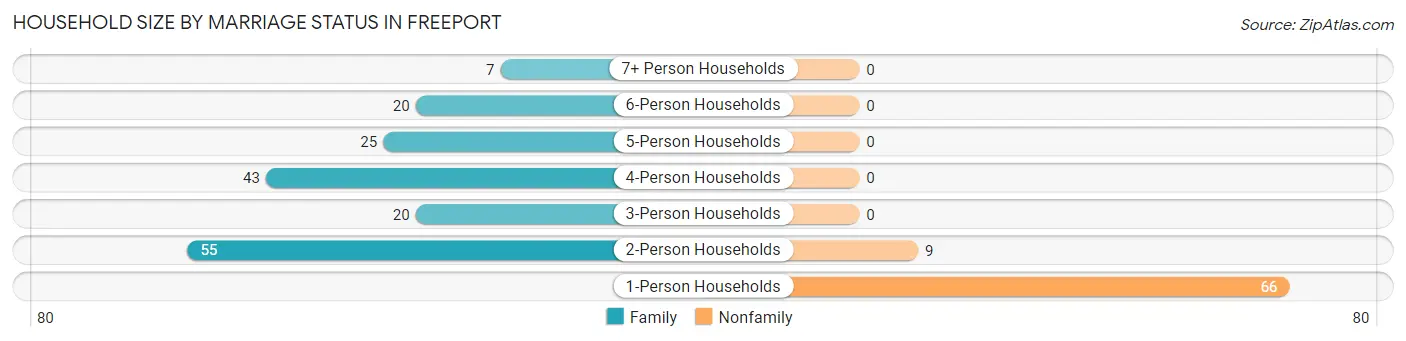
| Household Size | Family Households | Nonfamily Households |
| 1-Person Households | - | 66 (26.9%) |
| 2-Person Households | 55 (22.5%) | 9 (3.7%) |
| 3-Person Households | 20 (8.2%) | 0 (0.0%) |
| 4-Person Households | 43 (17.5%) | 0 (0.0%) |
| 5-Person Households | 25 (10.2%) | 0 (0.0%) |
| 6-Person Households | 20 (8.2%) | 0 (0.0%) |
| 7+ Person Households | 7 (2.9%) | 0 (0.0%) |
| Total | 170 (69.4%) | 75 (30.6%) |
Female Fertility in Freeport
Fertility by Age in Freeport
Average fertility rate in Freeport is 15.0 births per 1,000 women. Women in the age bracket of 20 to 34 years have the highest fertility rate with 30.0 births per 1,000 women. Women in the age bracket of 20 to 34 years acount for 100.0% of all women with births.
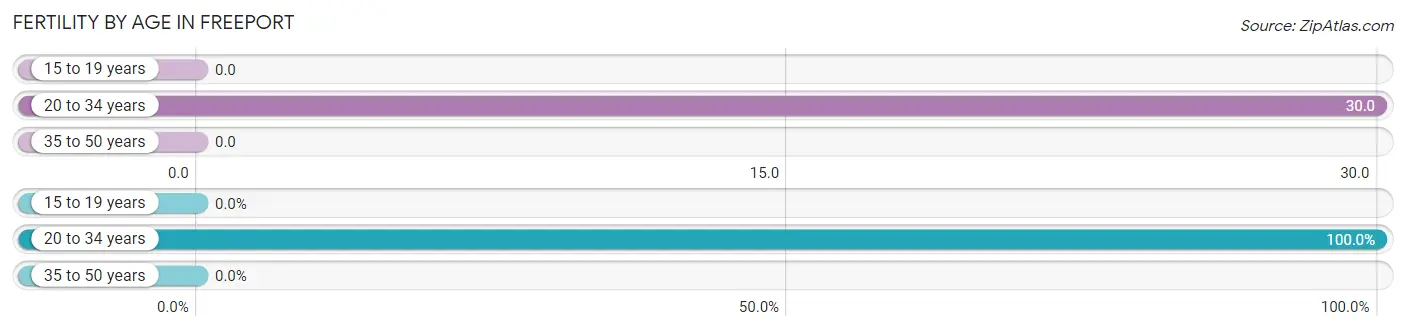
| Age Bracket | Women with Births | Births / 1,000 Women |
| 15 to 19 years | 0 (0.0%) | 0.0 |
| 20 to 34 years | 3 (100.0%) | 30.0 |
| 35 to 50 years | 0 (0.0%) | 0.0 |
| Total | 3 (100.0%) | 15.0 |
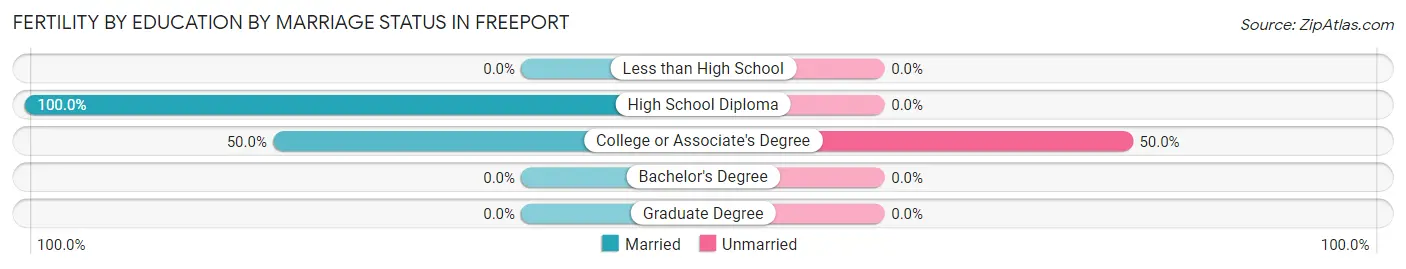
Fertility by Age by Marriage Status in Freeport
66.7% of women with births (3) in Freeport are married. The highest percentage of unmarried women with births falls into 20 to 34 years age bracket with 33.3% of them unmarried at the time of birth, while the lowest percentage of unmarried women with births belong to 20 to 34 years age bracket with 33.3% of them unmarried.
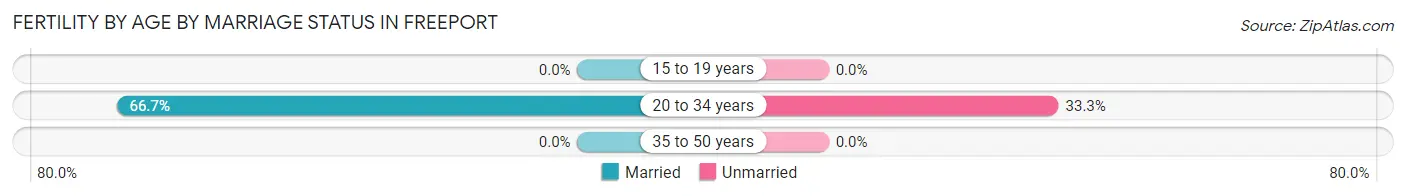
| Age Bracket | Married | Unmarried |
| 15 to 19 years | 0 (0.0%) | 0 (0.0%) |
| 20 to 34 years | 2 (66.7%) | 1 (33.3%) |
| 35 to 50 years | 0 (0.0%) | 0 (0.0%) |
| Total | 2 (66.7%) | 1 (33.3%) |
Fertility by Education in Freeport
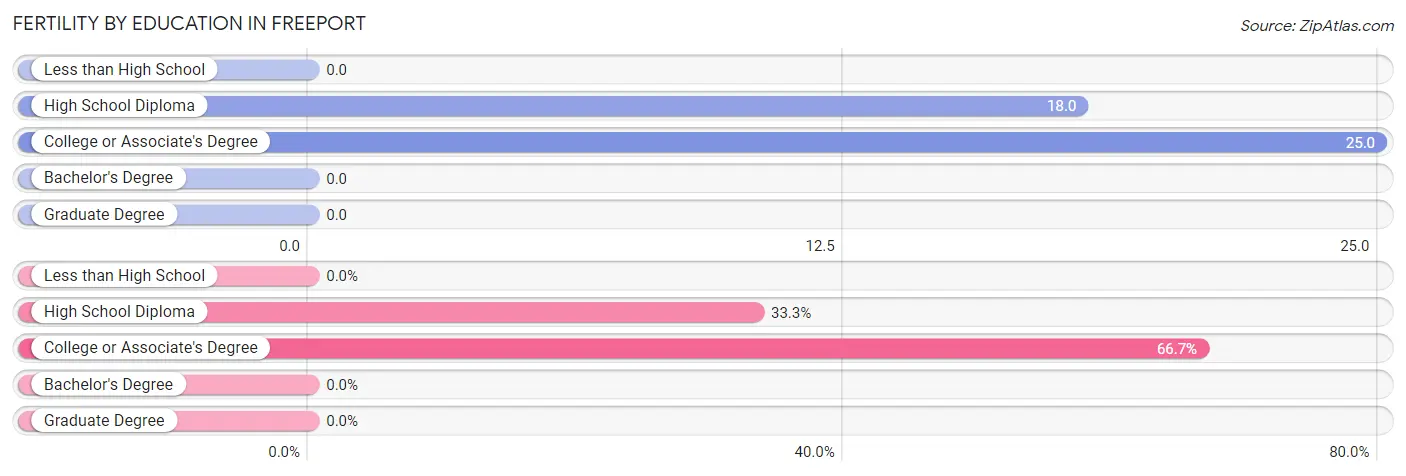
| Educational Attainment | Women with Births | Births / 1,000 Women |
| Less than High School | 0 (0.0%) | 0.0 |
| High School Diploma | 1 (33.3%) | 18.0 |
| College or Associate's Degree | 2 (66.7%) | 25.0 |
| Bachelor's Degree | 0 (0.0%) | 0.0 |
| Graduate Degree | 0 (0.0%) | 0.0 |
| Total | 3 (100.0%) | 15.0 |
Fertility by Education by Marriage Status in Freeport
33.3% of women with births in Freeport are unmarried. Women with the educational attainment of high school diploma are most likely to be married with 100.0% of them married at childbirth, while women with the educational attainment of college or associate's degree are least likely to be married with 50.0% of them unmarried at childbirth.
| Educational Attainment | Married | Unmarried |
| Less than High School | 0 (0.0%) | 0 (0.0%) |
| High School Diploma | 1 (100.0%) | 0 (0.0%) |
| College or Associate's Degree | 1 (50.0%) | 1 (50.0%) |
| Bachelor's Degree | 0 (0.0%) | 0 (0.0%) |
| Graduate Degree | 0 (0.0%) | 0 (0.0%) |
| Total | 2 (66.7%) | 1 (33.3%) |
Employment Characteristics in Freeport
Employment by Class of Employer in Freeport
Among the 338 employed individuals in Freeport, private company employees (237 | 70.1%), not-for-profit organizations (39 | 11.5%), and local government employees (27 | 8.0%) make up the most common classes of employment.
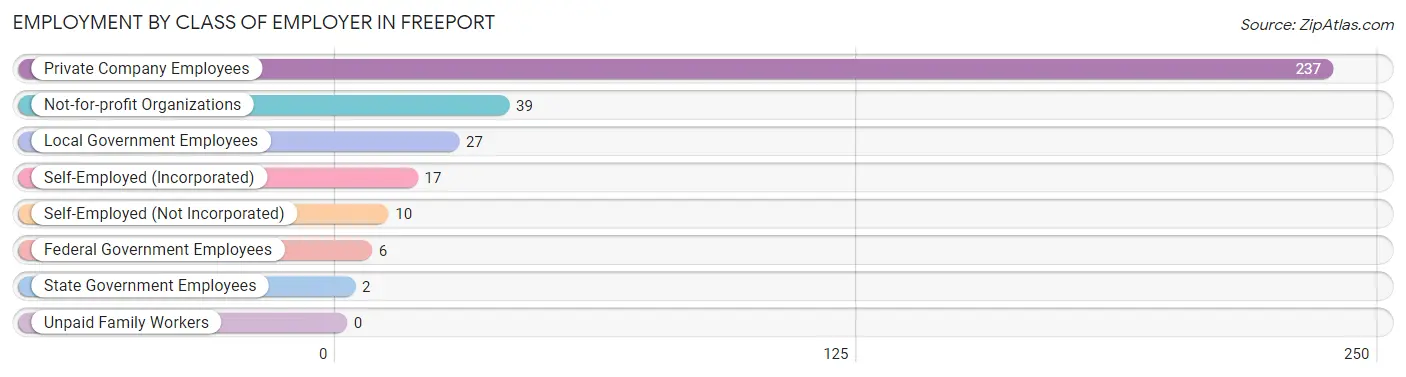
| Employer Class | # Employees | % Employees |
| Private Company Employees | 237 | 70.1% |
| Self-Employed (Incorporated) | 17 | 5.0% |
| Self-Employed (Not Incorporated) | 10 | 3.0% |
| Not-for-profit Organizations | 39 | 11.5% |
| Local Government Employees | 27 | 8.0% |
| State Government Employees | 2 | 0.6% |
| Federal Government Employees | 6 | 1.8% |
| Unpaid Family Workers | 0 | 0.0% |
| Total | 338 | 100.0% |
Employment Status by Age in Freeport
According to the labor force statistics for Freeport, out of the total population over 16 years of age (520), 67.9% or 353 individuals are in the labor force, with 3.7% or 13 of them unemployed. The age group with the highest labor force participation rate is 20 to 24 years, with 91.5% or 54 individuals in the labor force. Within the labor force, the 45 to 54 years age range has the highest percentage of unemployed individuals, with 10.2% or 5 of them being unemployed.
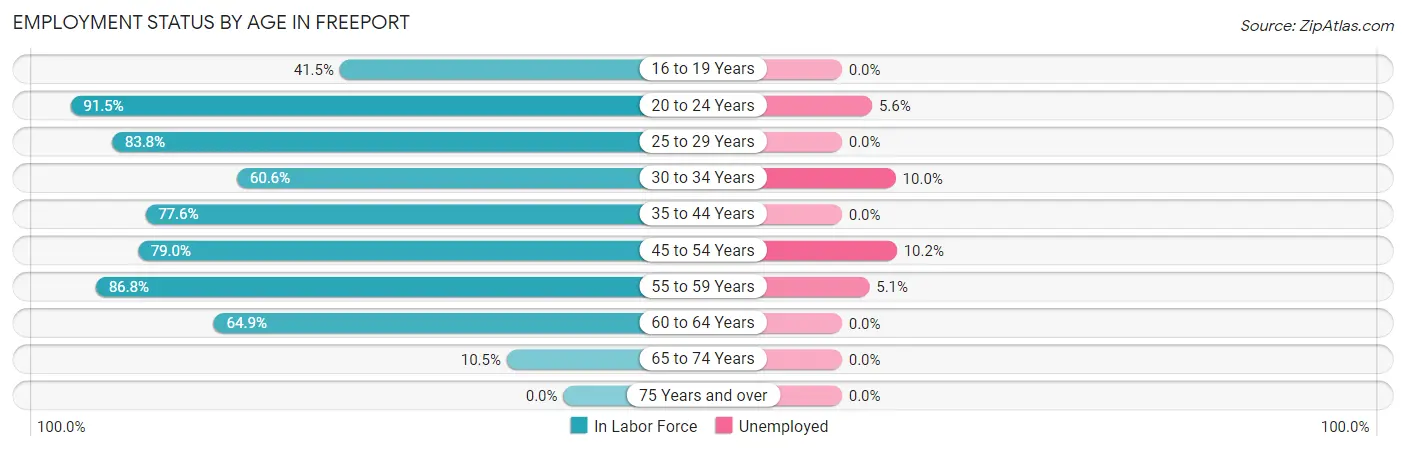
| Age Bracket | In Labor Force | Unemployed |
| 16 to 19 Years | 22 (41.5%) | 0 (0.0%) |
| 20 to 24 Years | 54 (91.5%) | 3 (5.6%) |
| 25 to 29 Years | 62 (83.8%) | 0 (0.0%) |
| 30 to 34 Years | 20 (60.6%) | 2 (10.0%) |
| 35 to 44 Years | 59 (77.6%) | 0 (0.0%) |
| 45 to 54 Years | 49 (79.0%) | 5 (10.2%) |
| 55 to 59 Years | 59 (86.8%) | 3 (5.1%) |
| 60 to 64 Years | 24 (64.9%) | 0 (0.0%) |
| 65 to 74 Years | 4 (10.5%) | 0 (0.0%) |
| 75 Years and over | 0 (0.0%) | 0 (0.0%) |
| Total | 353 (67.9%) | 13 (3.7%) |
Employment Status by Educational Attainment in Freeport
According to labor force statistics for Freeport, 78.0% of individuals (273) out of the total population between 25 and 64 years of age (350) are in the labor force, with 3.7% or 10 of them being unemployed. The group with the highest labor force participation rate are those with the educational attainment of bachelor's degree or higher, with 96.4% or 54 individuals in the labor force. Within the labor force, individuals with high school diploma education have the highest percentage of unemployment, with 7.9% or 7 of them being unemployed.
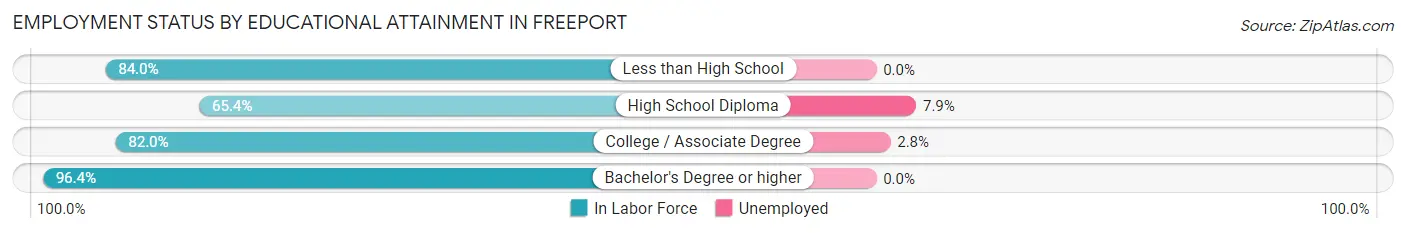
| Educational Attainment | In Labor Force | Unemployed |
| Less than High School | 21 (84.0%) | 0 (0.0%) |
| High School Diploma | 89 (65.4%) | 11 (7.9%) |
| College / Associate Degree | 109 (82.0%) | 4 (2.8%) |
| Bachelor's Degree or higher | 54 (96.4%) | 0 (0.0%) |
| Total | 273 (78.0%) | 13 (3.7%) |
Employment Occupations by Sex in Freeport
Management, Business, Science and Arts Occupations
The most common Management, Business, Science and Arts occupations in Freeport are Management (38 | 11.2%), Health Diagnosing & Treating (27 | 8.0%), Community & Social Service (13 | 3.8%), Health Technologists (12 | 3.5%), and Education Instruction & Library (7 | 2.1%).
Management, Business, Science and Arts Occupations by Sex
Within the Management, Business, Science and Arts occupations in Freeport, the most male-oriented occupations are Computers, Engineering & Science (100.0%), Computers & Mathematics (100.0%), and Architecture & Engineering (100.0%), while the most female-oriented occupations are Business & Financial (100.0%), Education Instruction & Library (100.0%), and Health Technologists (100.0%).
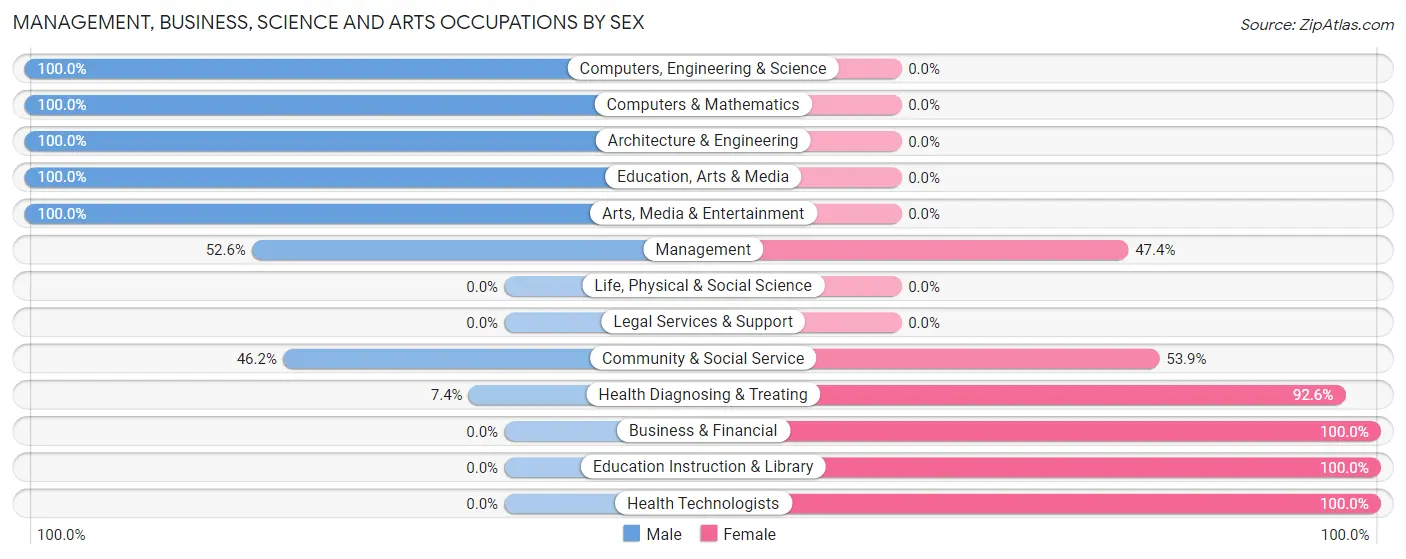
| Occupation | Male | Female |
| Management | 20 (52.6%) | 18 (47.4%) |
| Business & Financial | 0 (0.0%) | 3 (100.0%) |
| Computers, Engineering & Science | 3 (100.0%) | 0 (0.0%) |
| Computers & Mathematics | 2 (100.0%) | 0 (0.0%) |
| Architecture & Engineering | 1 (100.0%) | 0 (0.0%) |
| Life, Physical & Social Science | 0 (0.0%) | 0 (0.0%) |
| Community & Social Service | 6 (46.2%) | 7 (53.8%) |
| Education, Arts & Media | 3 (100.0%) | 0 (0.0%) |
| Legal Services & Support | 0 (0.0%) | 0 (0.0%) |
| Education Instruction & Library | 0 (0.0%) | 7 (100.0%) |
| Arts, Media & Entertainment | 3 (100.0%) | 0 (0.0%) |
| Health Diagnosing & Treating | 2 (7.4%) | 25 (92.6%) |
| Health Technologists | 0 (0.0%) | 12 (100.0%) |
| Total (Category) | 31 (36.9%) | 53 (63.1%) |
| Total (Overall) | 158 (46.6%) | 181 (53.4%) |
Services Occupations
The most common Services occupations in Freeport are Healthcare Support (30 | 8.8%), Food Preparation & Serving (29 | 8.6%), Personal Care & Service (12 | 3.5%), Cleaning & Maintenance (7 | 2.1%), and Security & Protection (3 | 0.9%).
Services Occupations by Sex
Within the Services occupations in Freeport, the most male-oriented occupations are Security & Protection (100.0%), Firefighting & Prevention (100.0%), and Law Enforcement (100.0%), while the most female-oriented occupations are Healthcare Support (100.0%), Personal Care & Service (83.3%), and Food Preparation & Serving (82.8%).
| Occupation | Male | Female |
| Healthcare Support | 0 (0.0%) | 30 (100.0%) |
| Security & Protection | 3 (100.0%) | 0 (0.0%) |
| Firefighting & Prevention | 1 (100.0%) | 0 (0.0%) |
| Law Enforcement | 2 (100.0%) | 0 (0.0%) |
| Food Preparation & Serving | 5 (17.2%) | 24 (82.8%) |
| Cleaning & Maintenance | 5 (71.4%) | 2 (28.6%) |
| Personal Care & Service | 2 (16.7%) | 10 (83.3%) |
| Total (Category) | 15 (18.5%) | 66 (81.5%) |
| Total (Overall) | 158 (46.6%) | 181 (53.4%) |
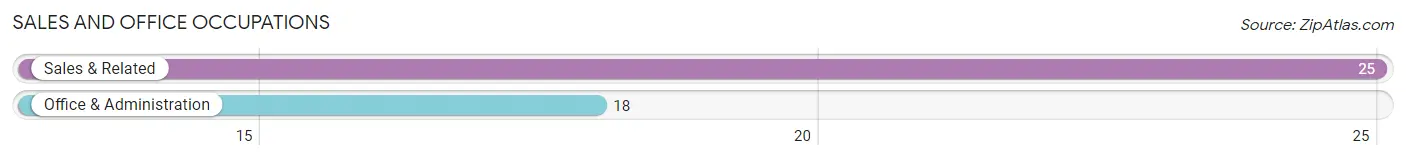
Sales and Office Occupations
The most common Sales and Office occupations in Freeport are Sales & Related (25 | 7.4%), and Office & Administration (18 | 5.3%).
Sales and Office Occupations by Sex
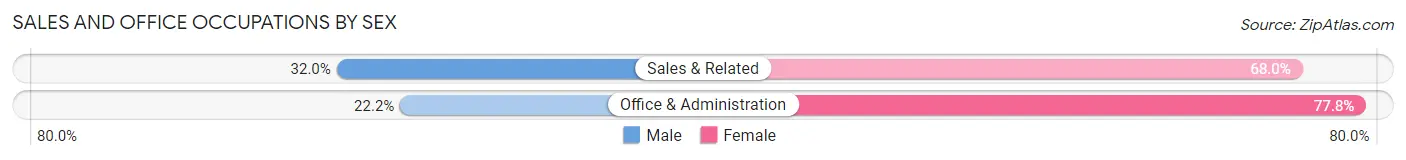
| Occupation | Male | Female |
| Sales & Related | 8 (32.0%) | 17 (68.0%) |
| Office & Administration | 4 (22.2%) | 14 (77.8%) |
| Total (Category) | 12 (27.9%) | 31 (72.1%) |
| Total (Overall) | 158 (46.6%) | 181 (53.4%) |
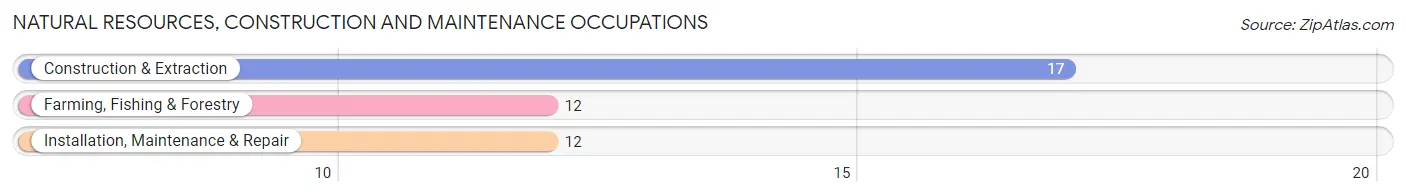
Natural Resources, Construction and Maintenance Occupations
The most common Natural Resources, Construction and Maintenance occupations in Freeport are Construction & Extraction (17 | 5.0%), Farming, Fishing & Forestry (12 | 3.5%), and Installation, Maintenance & Repair (12 | 3.5%).
Natural Resources, Construction and Maintenance Occupations by Sex
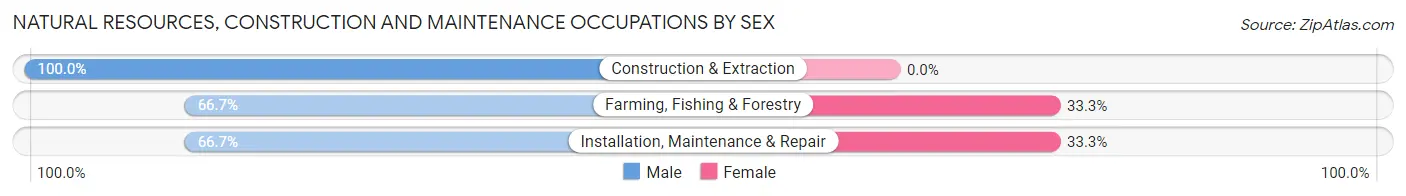
| Occupation | Male | Female |
| Farming, Fishing & Forestry | 8 (66.7%) | 4 (33.3%) |
| Construction & Extraction | 17 (100.0%) | 0 (0.0%) |
| Installation, Maintenance & Repair | 8 (66.7%) | 4 (33.3%) |
| Total (Category) | 33 (80.5%) | 8 (19.5%) |
| Total (Overall) | 158 (46.6%) | 181 (53.4%) |
Production, Transportation and Moving Occupations
The most common Production, Transportation and Moving occupations in Freeport are Production (60 | 17.7%), Material Moving (23 | 6.8%), and Transportation (7 | 2.1%).
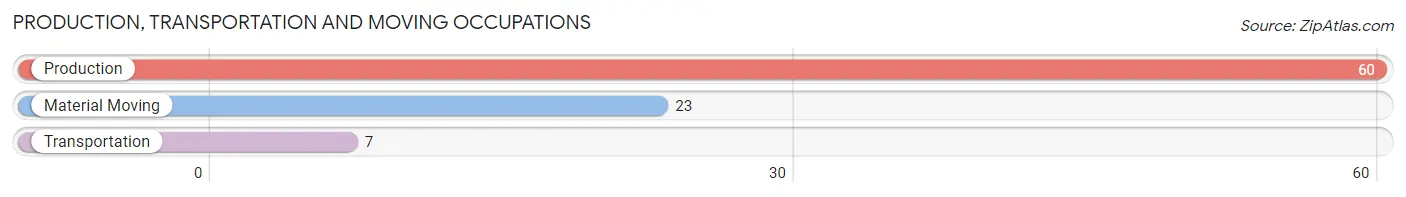
Production, Transportation and Moving Occupations by Sex
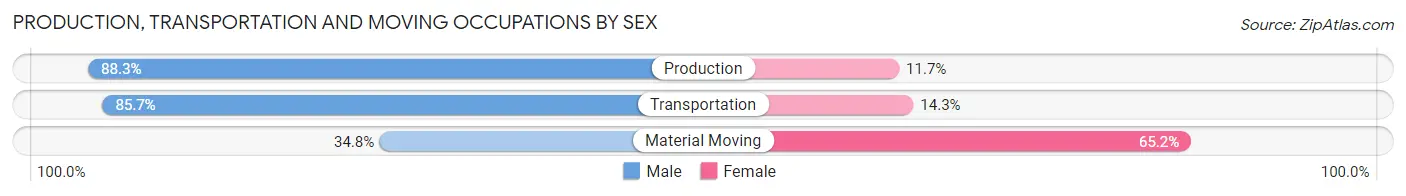
| Occupation | Male | Female |
| Production | 53 (88.3%) | 7 (11.7%) |
| Transportation | 6 (85.7%) | 1 (14.3%) |
| Material Moving | 8 (34.8%) | 15 (65.2%) |
| Total (Category) | 67 (74.4%) | 23 (25.6%) |
| Total (Overall) | 158 (46.6%) | 181 (53.4%) |
Employment Industries by Sex in Freeport
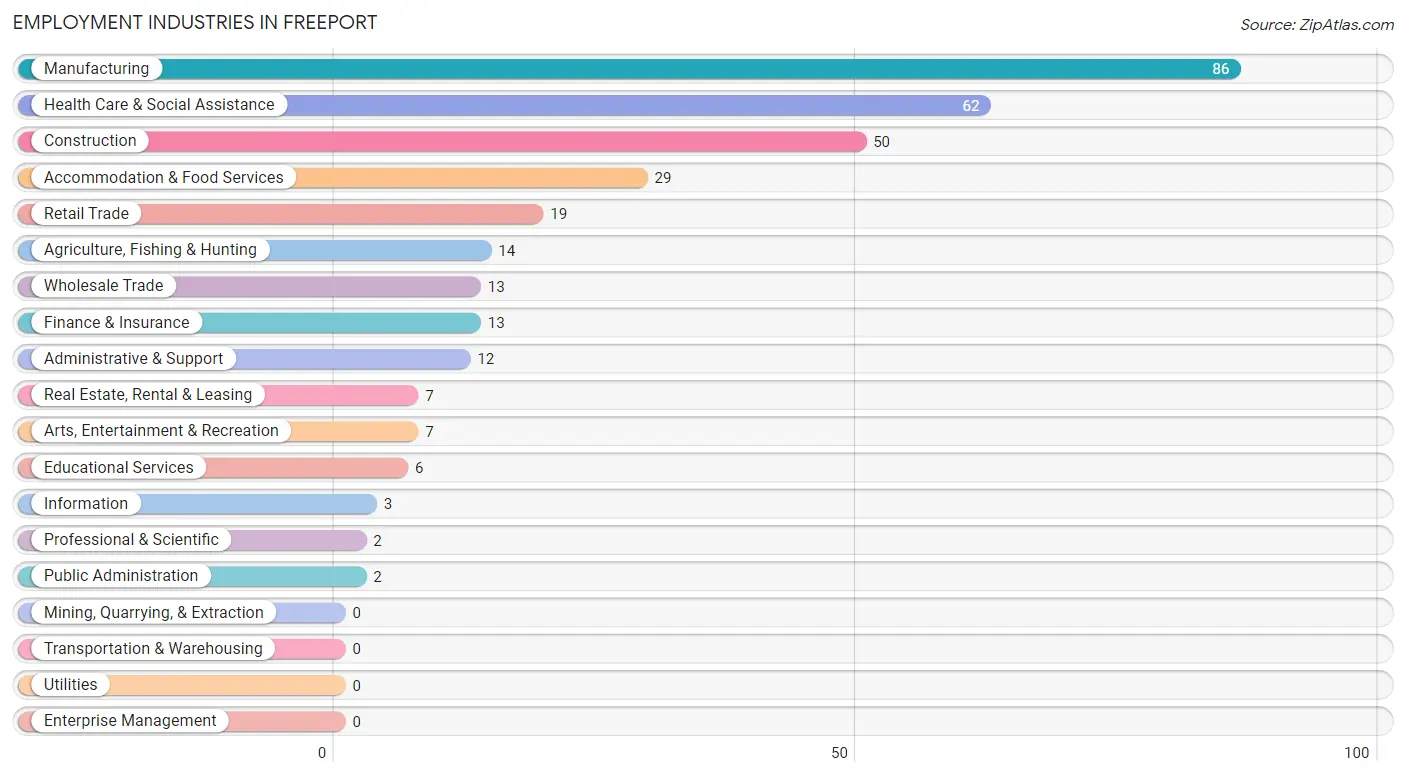
Employment Industries in Freeport
The major employment industries in Freeport include Manufacturing (86 | 25.4%), Health Care & Social Assistance (62 | 18.3%), Construction (50 | 14.7%), Accommodation & Food Services (29 | 8.6%), and Retail Trade (19 | 5.6%).
Employment Industries by Sex in Freeport
The Freeport industries that see more men than women are Public Administration (100.0%), Construction (94.0%), and Agriculture, Fishing & Hunting (71.4%), whereas the industries that tend to have a higher number of women are Information (100.0%), Real Estate, Rental & Leasing (100.0%), and Professional & Scientific (100.0%).
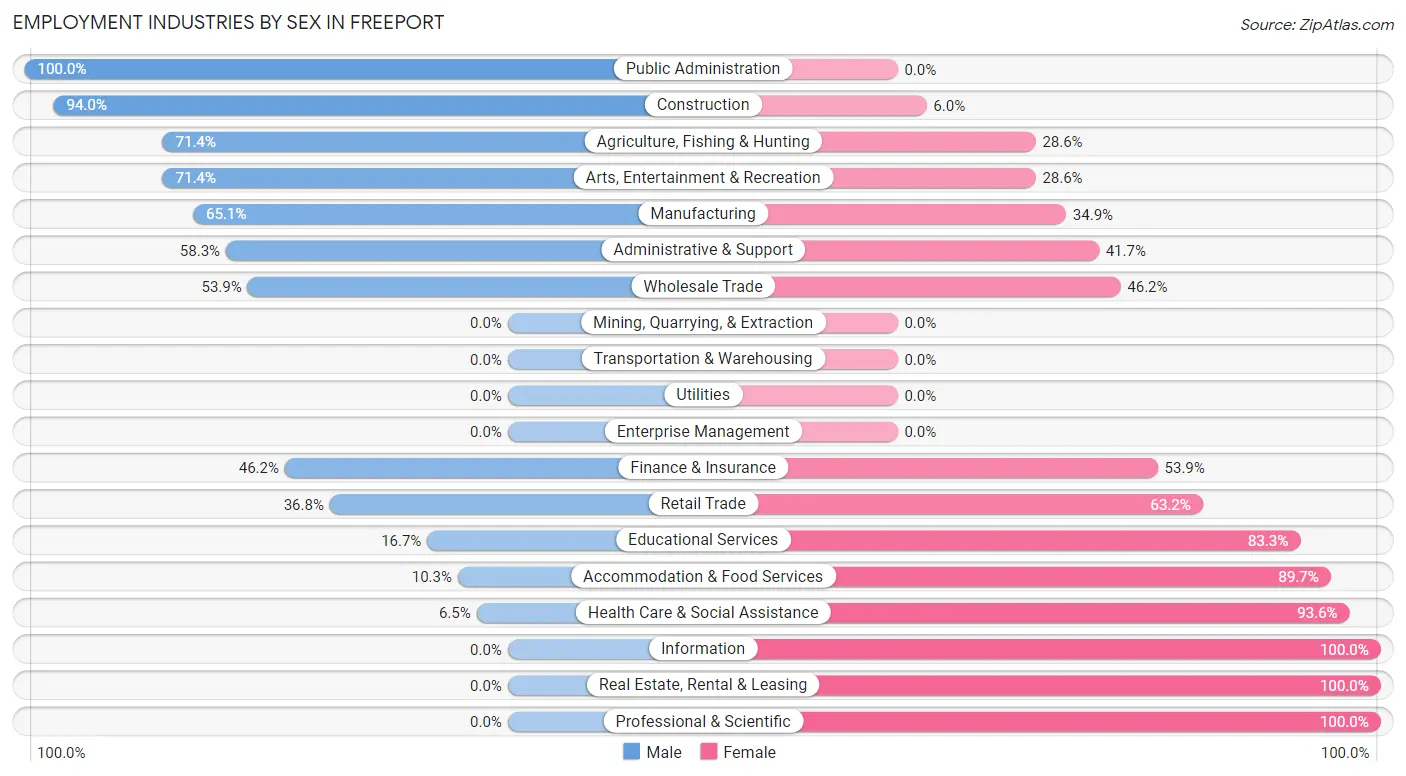
| Industry | Male | Female |
| Agriculture, Fishing & Hunting | 10 (71.4%) | 4 (28.6%) |
| Mining, Quarrying, & Extraction | 0 (0.0%) | 0 (0.0%) |
| Construction | 47 (94.0%) | 3 (6.0%) |
| Manufacturing | 56 (65.1%) | 30 (34.9%) |
| Wholesale Trade | 7 (53.8%) | 6 (46.2%) |
| Retail Trade | 7 (36.8%) | 12 (63.2%) |
| Transportation & Warehousing | 0 (0.0%) | 0 (0.0%) |
| Utilities | 0 (0.0%) | 0 (0.0%) |
| Information | 0 (0.0%) | 3 (100.0%) |
| Finance & Insurance | 6 (46.2%) | 7 (53.8%) |
| Real Estate, Rental & Leasing | 0 (0.0%) | 7 (100.0%) |
| Professional & Scientific | 0 (0.0%) | 2 (100.0%) |
| Enterprise Management | 0 (0.0%) | 0 (0.0%) |
| Administrative & Support | 7 (58.3%) | 5 (41.7%) |
| Educational Services | 1 (16.7%) | 5 (83.3%) |
| Health Care & Social Assistance | 4 (6.5%) | 58 (93.5%) |
| Arts, Entertainment & Recreation | 5 (71.4%) | 2 (28.6%) |
| Accommodation & Food Services | 3 (10.3%) | 26 (89.7%) |
| Public Administration | 2 (100.0%) | 0 (0.0%) |
| Total | 158 (46.6%) | 181 (53.4%) |
Education in Freeport
School Enrollment in Freeport
The most common levels of schooling among the 200 students in Freeport are elementary school (60 | 30.0%), high school (55 | 27.5%), and middle school (31 | 15.5%).
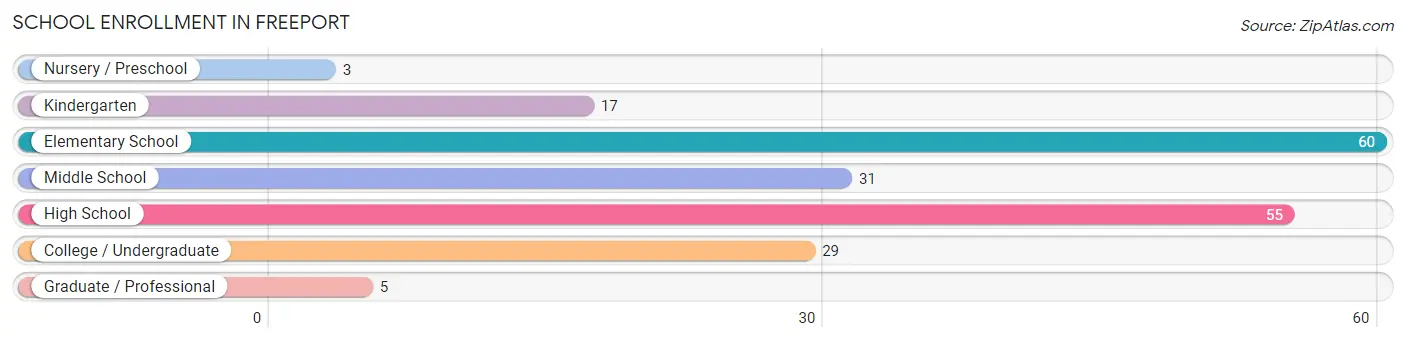
| School Level | # Students | % Students |
| Nursery / Preschool | 3 | 1.5% |
| Kindergarten | 17 | 8.5% |
| Elementary School | 60 | 30.0% |
| Middle School | 31 | 15.5% |
| High School | 55 | 27.5% |
| College / Undergraduate | 29 | 14.5% |
| Graduate / Professional | 5 | 2.5% |
| Total | 200 | 100.0% |
School Enrollment by Age by Funding Source in Freeport
Out of a total of 200 students who are enrolled in schools in Freeport, 3 (1.5%) attend a private institution, while the remaining 197 (98.5%) are enrolled in public schools. The age group of 3 to 4 year olds has the highest likelihood of being enrolled in private schools, with 1 (100.0% in the age bracket) enrolled. Conversely, the age group of 10 to 14 year olds has the lowest likelihood of being enrolled in a private school, with 67 (100.0% in the age bracket) attending a public institution.
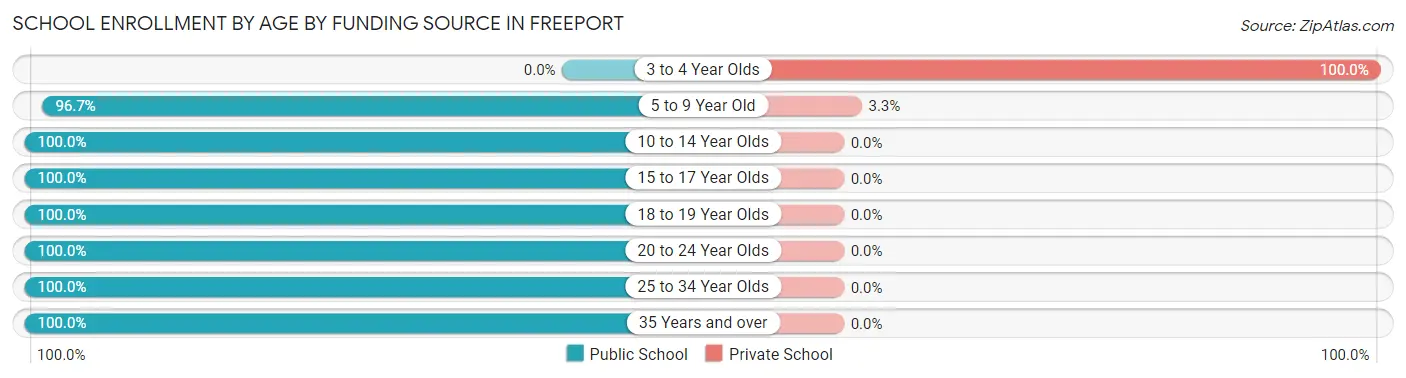
| Age Bracket | Public School | Private School |
| 3 to 4 Year Olds | 0 (0.0%) | 1 (100.0%) |
| 5 to 9 Year Old | 58 (96.7%) | 2 (3.3%) |
| 10 to 14 Year Olds | 67 (100.0%) | 0 (0.0%) |
| 15 to 17 Year Olds | 35 (100.0%) | 0 (0.0%) |
| 18 to 19 Year Olds | 7 (100.0%) | 0 (0.0%) |
| 20 to 24 Year Olds | 23 (100.0%) | 0 (0.0%) |
| 25 to 34 Year Olds | 5 (100.0%) | 0 (0.0%) |
| 35 Years and over | 2 (100.0%) | 0 (0.0%) |
| Total | 197 (98.5%) | 3 (1.5%) |
Educational Attainment by Field of Study in Freeport
Science & technology (33 | 45.8%), business (14 | 19.4%), arts & humanities (10 | 13.9%), visual & performing arts (6 | 8.3%), and liberal arts & history (5 | 6.9%) are the most common fields of study among 72 individuals in Freeport who have obtained a bachelor's degree or higher.
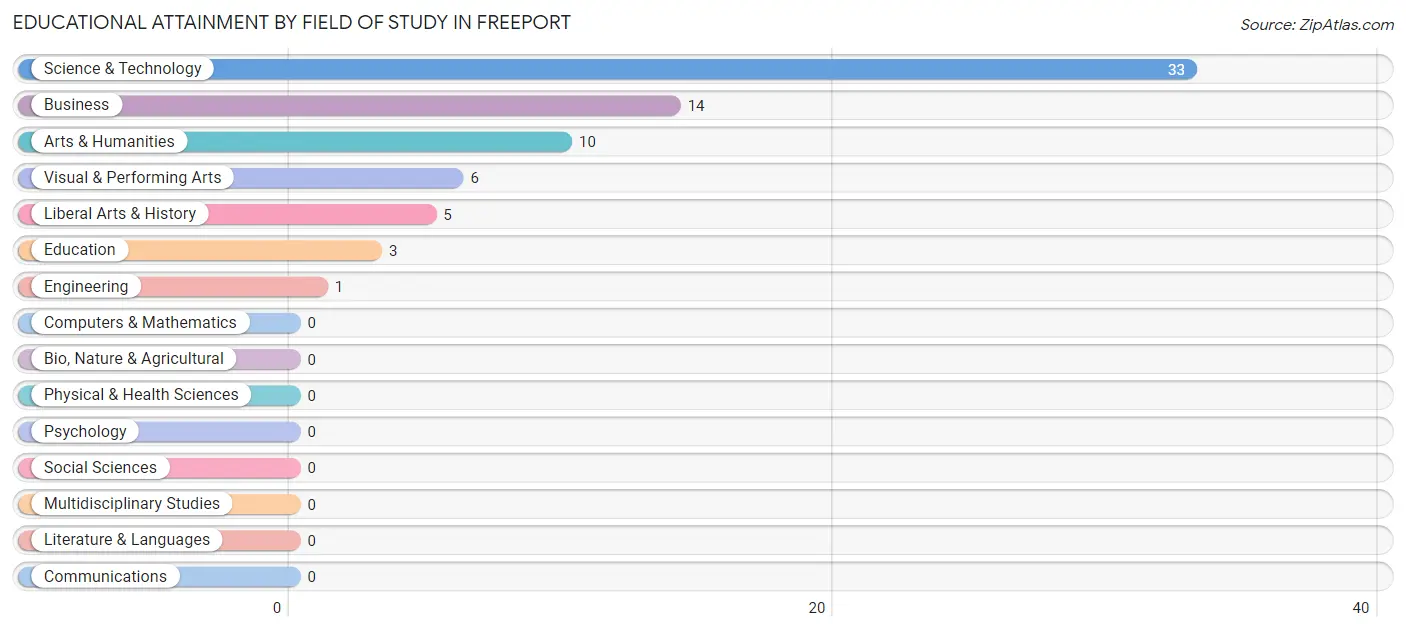
| Field of Study | # Graduates | % Graduates |
| Computers & Mathematics | 0 | 0.0% |
| Bio, Nature & Agricultural | 0 | 0.0% |
| Physical & Health Sciences | 0 | 0.0% |
| Psychology | 0 | 0.0% |
| Social Sciences | 0 | 0.0% |
| Engineering | 1 | 1.4% |
| Multidisciplinary Studies | 0 | 0.0% |
| Science & Technology | 33 | 45.8% |
| Business | 14 | 19.4% |
| Education | 3 | 4.2% |
| Literature & Languages | 0 | 0.0% |
| Liberal Arts & History | 5 | 6.9% |
| Visual & Performing Arts | 6 | 8.3% |
| Communications | 0 | 0.0% |
| Arts & Humanities | 10 | 13.9% |
| Total | 72 | 100.0% |
Transportation & Commute in Freeport
Vehicle Availability by Sex in Freeport
The most prevalent vehicle ownership categories in Freeport are males with 2 vehicles (70, accounting for 44.6%) and females with 2 vehicles (73, making up 38.7%).
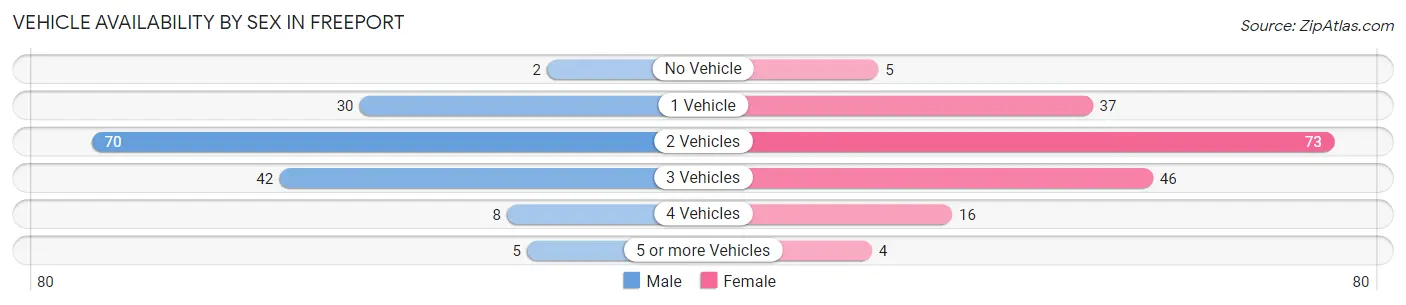
| Vehicles Available | Male | Female |
| No Vehicle | 2 (1.3%) | 5 (2.8%) |
| 1 Vehicle | 30 (19.1%) | 37 (20.4%) |
| 2 Vehicles | 70 (44.6%) | 73 (40.3%) |
| 3 Vehicles | 42 (26.8%) | 46 (25.4%) |
| 4 Vehicles | 8 (5.1%) | 16 (8.8%) |
| 5 or more Vehicles | 5 (3.2%) | 4 (2.2%) |
| Total | 157 (100.0%) | 181 (100.0%) |
Commute Time in Freeport
The most frequently occuring commute durations in Freeport are 25 to 29 minutes (52 commuters, 16.0%), 15 to 19 minutes (49 commuters, 15.0%), and 45 to 59 minutes (40 commuters, 12.3%).
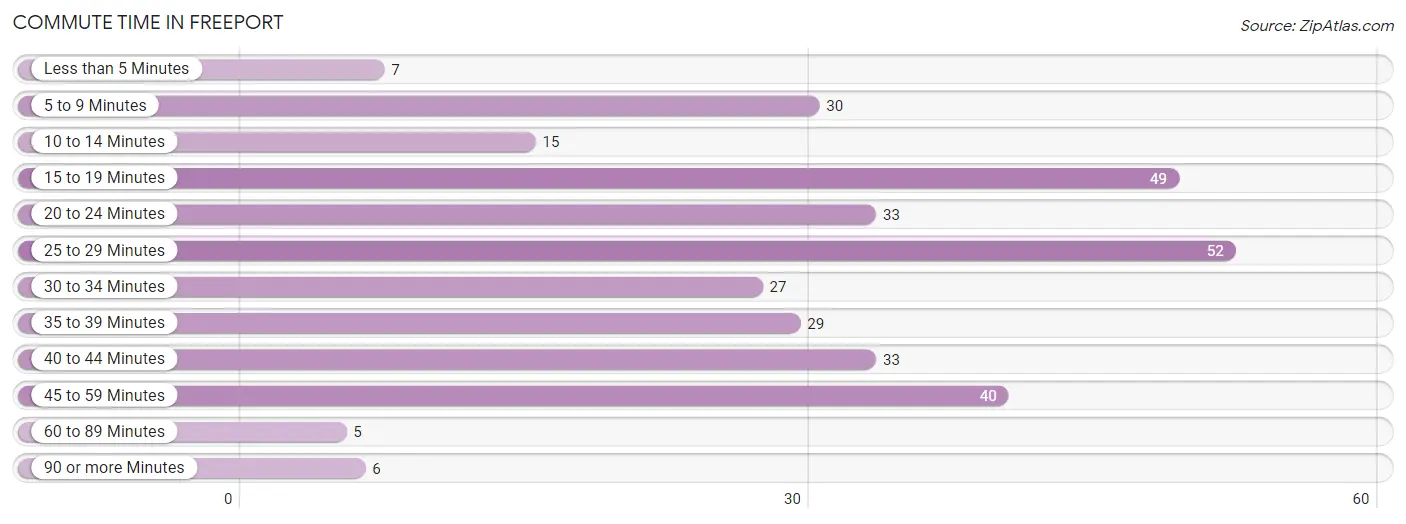
| Commute Time | # Commuters | % Commuters |
| Less than 5 Minutes | 7 | 2.1% |
| 5 to 9 Minutes | 30 | 9.2% |
| 10 to 14 Minutes | 15 | 4.6% |
| 15 to 19 Minutes | 49 | 15.0% |
| 20 to 24 Minutes | 33 | 10.1% |
| 25 to 29 Minutes | 52 | 16.0% |
| 30 to 34 Minutes | 27 | 8.3% |
| 35 to 39 Minutes | 29 | 8.9% |
| 40 to 44 Minutes | 33 | 10.1% |
| 45 to 59 Minutes | 40 | 12.3% |
| 60 to 89 Minutes | 5 | 1.5% |
| 90 or more Minutes | 6 | 1.8% |
Commute Time by Sex in Freeport
The most common commute times in Freeport are 45 to 59 minutes (30 commuters, 19.5%) for males and 25 to 29 minutes (33 commuters, 19.2%) for females.
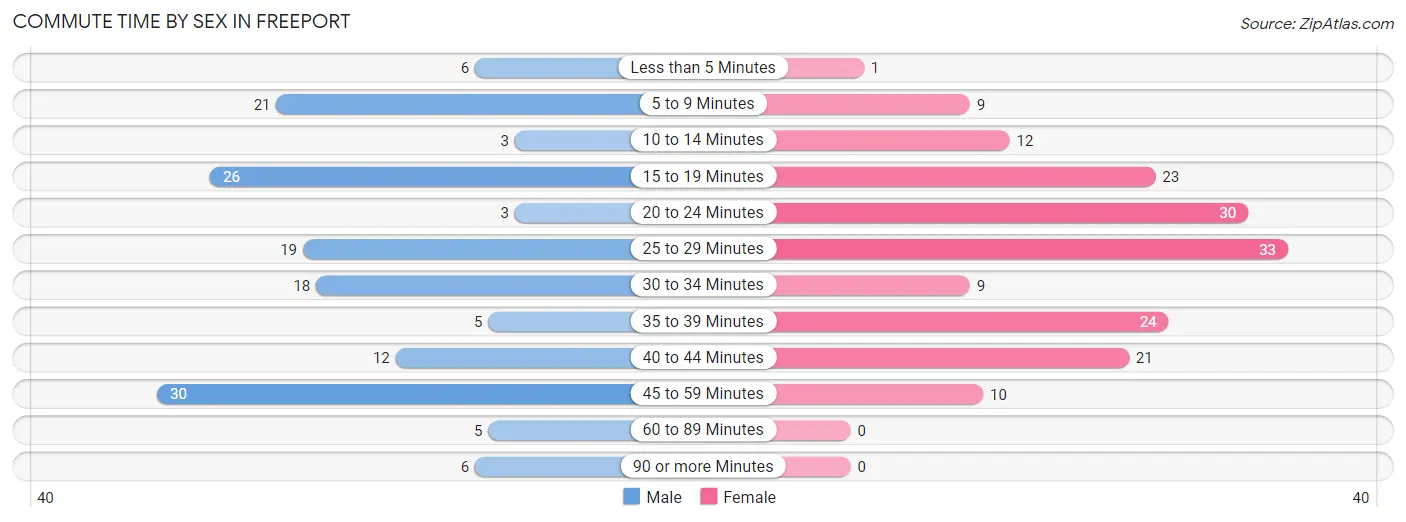
| Commute Time | Male | Female |
| Less than 5 Minutes | 6 (3.9%) | 1 (0.6%) |
| 5 to 9 Minutes | 21 (13.6%) | 9 (5.2%) |
| 10 to 14 Minutes | 3 (1.9%) | 12 (7.0%) |
| 15 to 19 Minutes | 26 (16.9%) | 23 (13.4%) |
| 20 to 24 Minutes | 3 (1.9%) | 30 (17.4%) |
| 25 to 29 Minutes | 19 (12.3%) | 33 (19.2%) |
| 30 to 34 Minutes | 18 (11.7%) | 9 (5.2%) |
| 35 to 39 Minutes | 5 (3.3%) | 24 (14.0%) |
| 40 to 44 Minutes | 12 (7.8%) | 21 (12.2%) |
| 45 to 59 Minutes | 30 (19.5%) | 10 (5.8%) |
| 60 to 89 Minutes | 5 (3.3%) | 0 (0.0%) |
| 90 or more Minutes | 6 (3.9%) | 0 (0.0%) |
Time of Departure to Work by Sex in Freeport
The most frequent times of departure to work in Freeport are 5:00 AM to 5:29 AM (32, 20.8%) for males and 6:00 AM to 6:29 AM (41, 23.8%) for females.
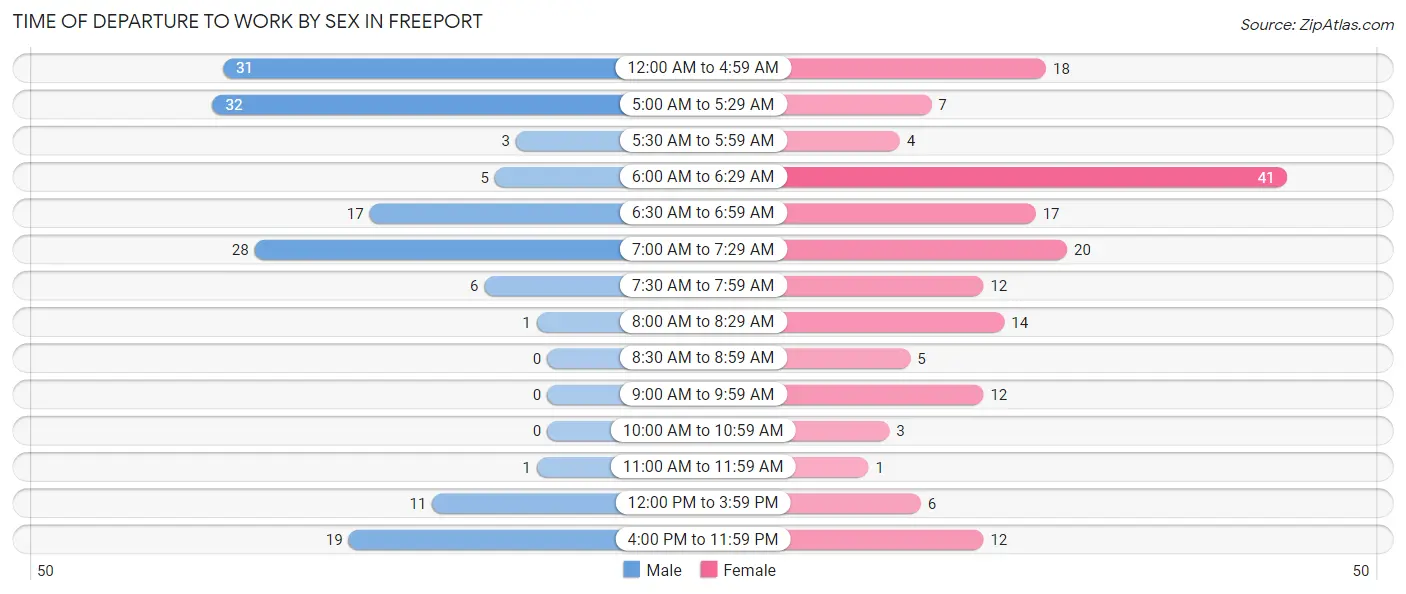
| Time of Departure | Male | Female |
| 12:00 AM to 4:59 AM | 31 (20.1%) | 18 (10.5%) |
| 5:00 AM to 5:29 AM | 32 (20.8%) | 7 (4.1%) |
| 5:30 AM to 5:59 AM | 3 (1.9%) | 4 (2.3%) |
| 6:00 AM to 6:29 AM | 5 (3.3%) | 41 (23.8%) |
| 6:30 AM to 6:59 AM | 17 (11.0%) | 17 (9.9%) |
| 7:00 AM to 7:29 AM | 28 (18.2%) | 20 (11.6%) |
| 7:30 AM to 7:59 AM | 6 (3.9%) | 12 (7.0%) |
| 8:00 AM to 8:29 AM | 1 (0.6%) | 14 (8.1%) |
| 8:30 AM to 8:59 AM | 0 (0.0%) | 5 (2.9%) |
| 9:00 AM to 9:59 AM | 0 (0.0%) | 12 (7.0%) |
| 10:00 AM to 10:59 AM | 0 (0.0%) | 3 (1.7%) |
| 11:00 AM to 11:59 AM | 1 (0.6%) | 1 (0.6%) |
| 12:00 PM to 3:59 PM | 11 (7.1%) | 6 (3.5%) |
| 4:00 PM to 11:59 PM | 19 (12.3%) | 12 (7.0%) |
| Total | 154 (100.0%) | 172 (100.0%) |
Housing Occupancy in Freeport
Occupancy by Ownership in Freeport
Of the total 245 dwellings in Freeport, owner-occupied units account for 188 (76.7%), while renter-occupied units make up 57 (23.3%).
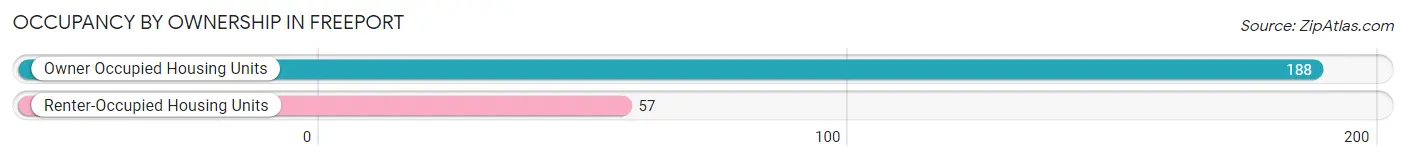
| Occupancy | # Housing Units | % Housing Units |
| Owner Occupied Housing Units | 188 | 76.7% |
| Renter-Occupied Housing Units | 57 | 23.3% |
| Total Occupied Housing Units | 245 | 100.0% |
Occupancy by Household Size in Freeport
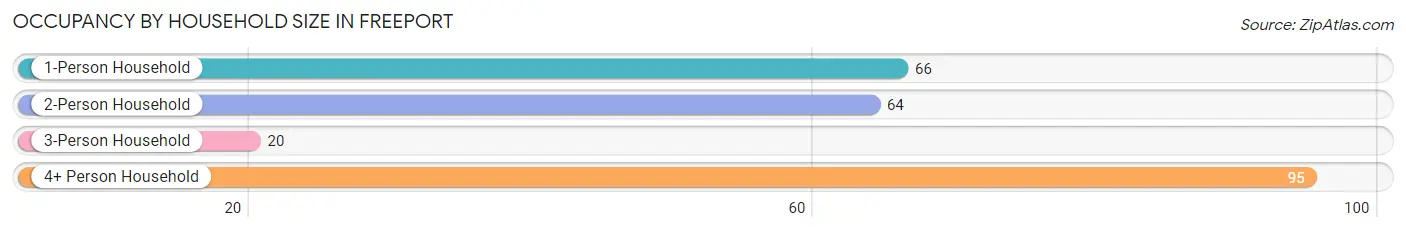
| Household Size | # Housing Units | % Housing Units |
| 1-Person Household | 66 | 26.9% |
| 2-Person Household | 64 | 26.1% |
| 3-Person Household | 20 | 8.2% |
| 4+ Person Household | 95 | 38.8% |
| Total Housing Units | 245 | 100.0% |
Occupancy by Ownership by Household Size in Freeport
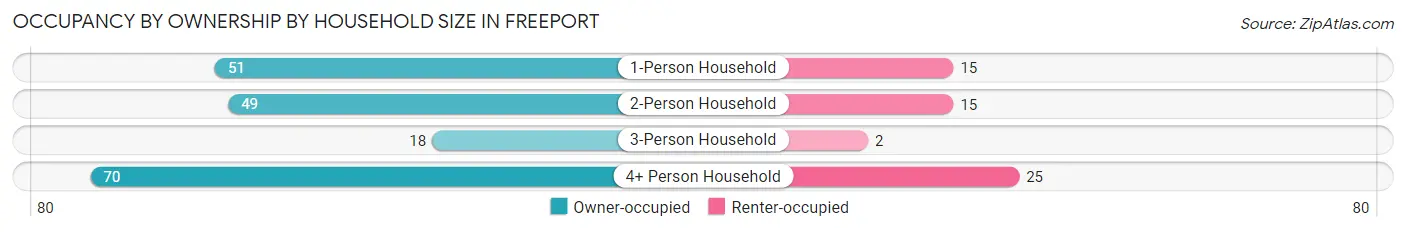
| Household Size | Owner-occupied | Renter-occupied |
| 1-Person Household | 51 (77.3%) | 15 (22.7%) |
| 2-Person Household | 49 (76.6%) | 15 (23.4%) |
| 3-Person Household | 18 (90.0%) | 2 (10.0%) |
| 4+ Person Household | 70 (73.7%) | 25 (26.3%) |
| Total Housing Units | 188 (76.7%) | 57 (23.3%) |
Occupancy by Educational Attainment in Freeport
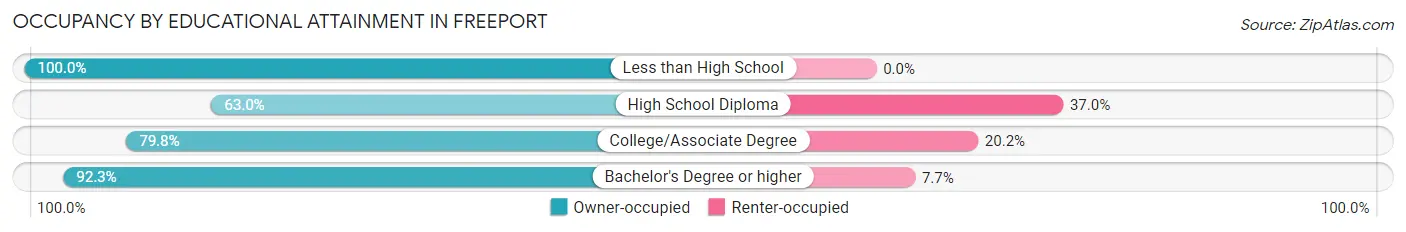
| Household Size | Owner-occupied | Renter-occupied |
| Less than High School | 6 (100.0%) | 0 (0.0%) |
| High School Diploma | 51 (63.0%) | 30 (37.0%) |
| College/Associate Degree | 95 (79.8%) | 24 (20.2%) |
| Bachelor's Degree or higher | 36 (92.3%) | 3 (7.7%) |
Occupancy by Age of Householder in Freeport
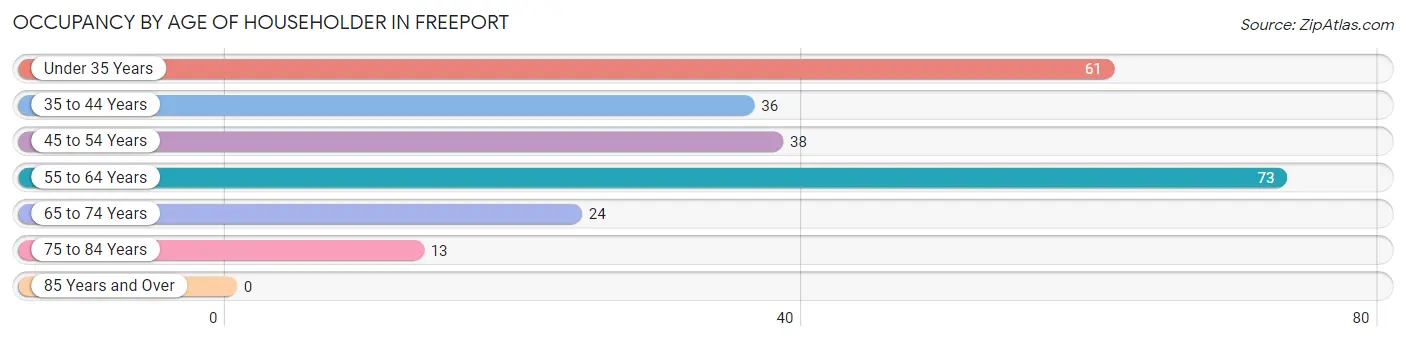
| Age Bracket | # Households | % Households |
| Under 35 Years | 61 | 24.9% |
| 35 to 44 Years | 36 | 14.7% |
| 45 to 54 Years | 38 | 15.5% |
| 55 to 64 Years | 73 | 29.8% |
| 65 to 74 Years | 24 | 9.8% |
| 75 to 84 Years | 13 | 5.3% |
| 85 Years and Over | 0 | 0.0% |
| Total | 245 | 100.0% |
Housing Finances in Freeport
Median Income by Occupancy in Freeport
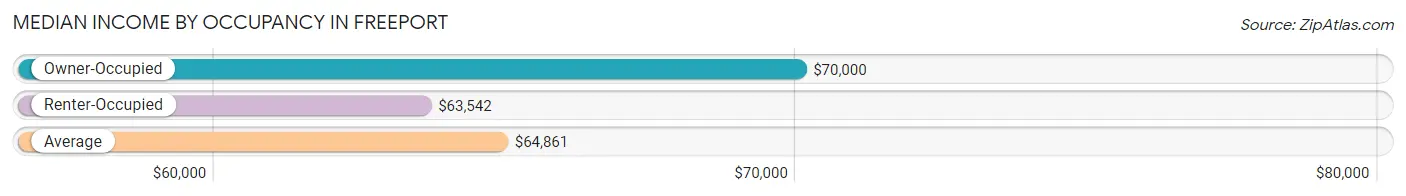
| Occupancy Type | # Households | Median Income |
| Owner-Occupied | 188 (76.7%) | $70,000 |
| Renter-Occupied | 57 (23.3%) | $63,542 |
| Average | 245 (100.0%) | $64,861 |
Occupancy by Householder Income Bracket in Freeport
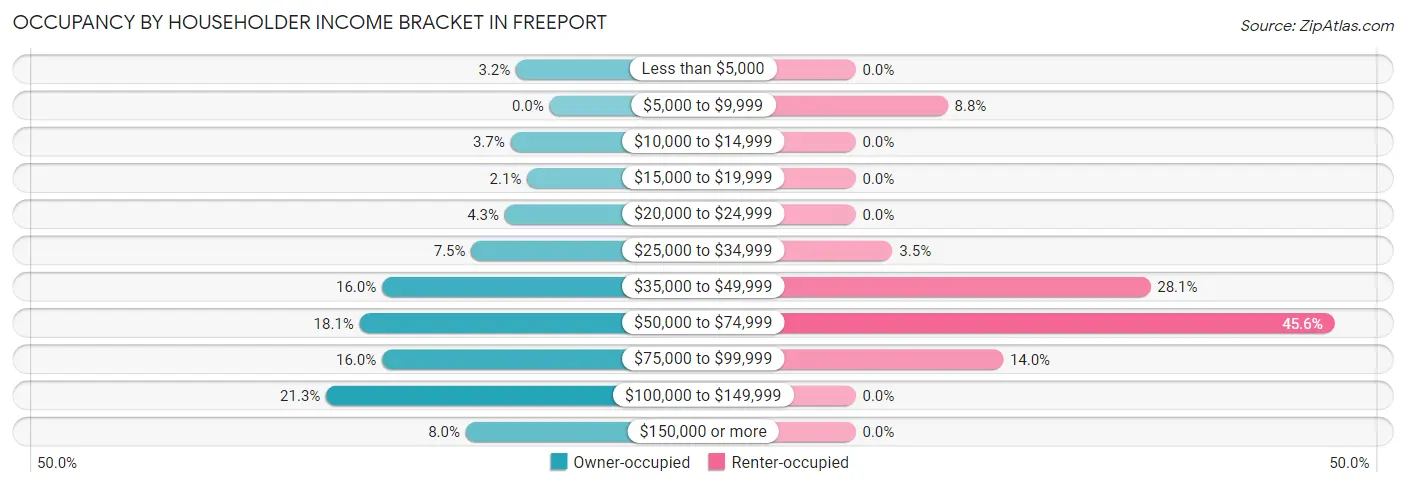
| Income Bracket | Owner-occupied | Renter-occupied |
| Less than $5,000 | 6 (3.2%) | 0 (0.0%) |
| $5,000 to $9,999 | 0 (0.0%) | 5 (8.8%) |
| $10,000 to $14,999 | 7 (3.7%) | 0 (0.0%) |
| $15,000 to $19,999 | 4 (2.1%) | 0 (0.0%) |
| $20,000 to $24,999 | 8 (4.3%) | 0 (0.0%) |
| $25,000 to $34,999 | 14 (7.4%) | 2 (3.5%) |
| $35,000 to $49,999 | 30 (16.0%) | 16 (28.1%) |
| $50,000 to $74,999 | 34 (18.1%) | 26 (45.6%) |
| $75,000 to $99,999 | 30 (16.0%) | 8 (14.0%) |
| $100,000 to $149,999 | 40 (21.3%) | 0 (0.0%) |
| $150,000 or more | 15 (8.0%) | 0 (0.0%) |
| Total | 188 (100.0%) | 57 (100.0%) |
Monthly Housing Cost Tiers in Freeport
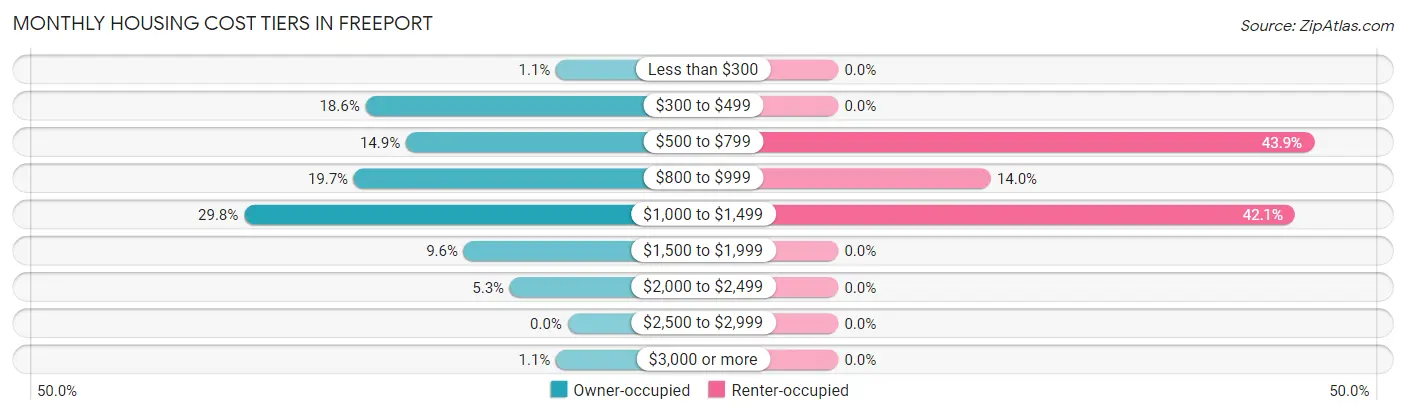
| Monthly Cost | Owner-occupied | Renter-occupied |
| Less than $300 | 2 (1.1%) | 0 (0.0%) |
| $300 to $499 | 35 (18.6%) | 0 (0.0%) |
| $500 to $799 | 28 (14.9%) | 25 (43.9%) |
| $800 to $999 | 37 (19.7%) | 8 (14.0%) |
| $1,000 to $1,499 | 56 (29.8%) | 24 (42.1%) |
| $1,500 to $1,999 | 18 (9.6%) | 0 (0.0%) |
| $2,000 to $2,499 | 10 (5.3%) | 0 (0.0%) |
| $2,500 to $2,999 | 0 (0.0%) | 0 (0.0%) |
| $3,000 or more | 2 (1.1%) | 0 (0.0%) |
| Total | 188 (100.0%) | 57 (100.0%) |
Physical Housing Characteristics in Freeport
Housing Structures in Freeport
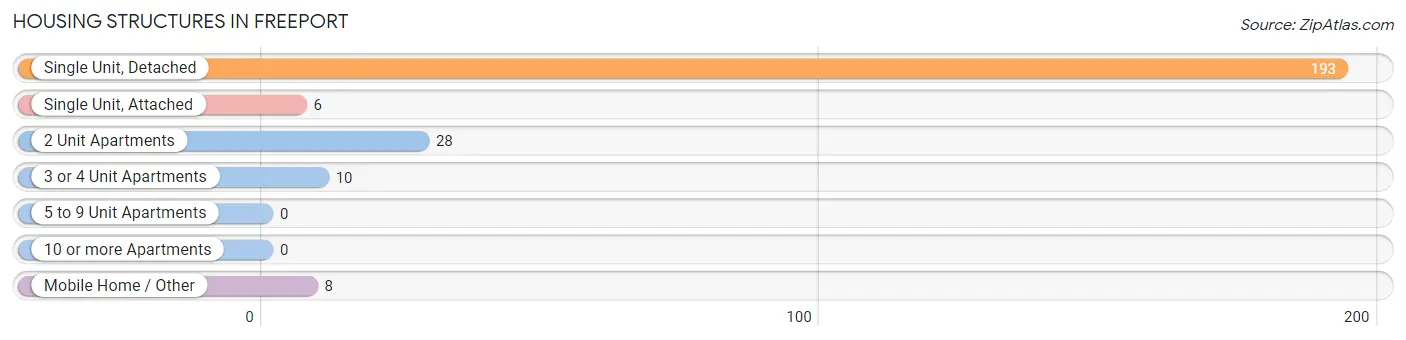
| Structure Type | # Housing Units | % Housing Units |
| Single Unit, Detached | 193 | 78.8% |
| Single Unit, Attached | 6 | 2.5% |
| 2 Unit Apartments | 28 | 11.4% |
| 3 or 4 Unit Apartments | 10 | 4.1% |
| 5 to 9 Unit Apartments | 0 | 0.0% |
| 10 or more Apartments | 0 | 0.0% |
| Mobile Home / Other | 8 | 3.3% |
| Total | 245 | 100.0% |
Housing Structures by Occupancy in Freeport
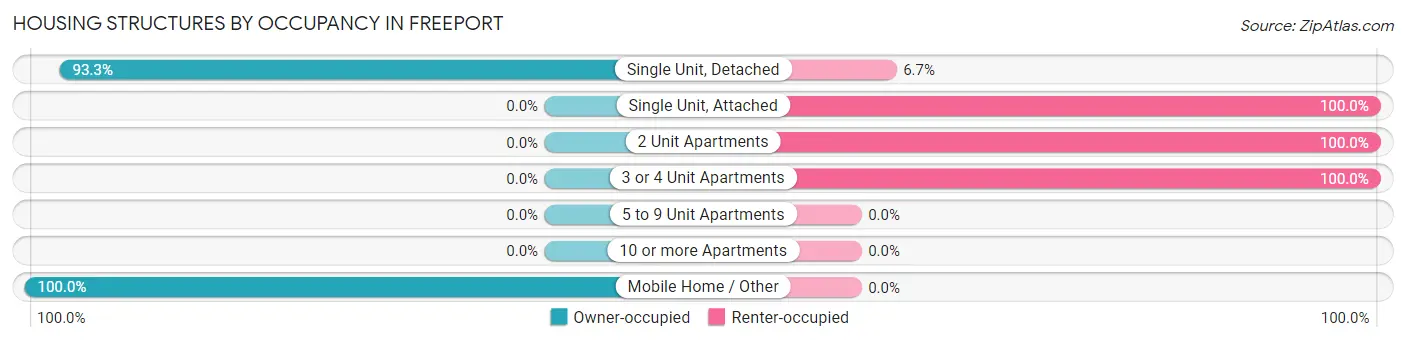
| Structure Type | Owner-occupied | Renter-occupied |
| Single Unit, Detached | 180 (93.3%) | 13 (6.7%) |
| Single Unit, Attached | 0 (0.0%) | 6 (100.0%) |
| 2 Unit Apartments | 0 (0.0%) | 28 (100.0%) |
| 3 or 4 Unit Apartments | 0 (0.0%) | 10 (100.0%) |
| 5 to 9 Unit Apartments | 0 (0.0%) | 0 (0.0%) |
| 10 or more Apartments | 0 (0.0%) | 0 (0.0%) |
| Mobile Home / Other | 8 (100.0%) | 0 (0.0%) |
| Total | 188 (76.7%) | 57 (23.3%) |
Housing Structures by Number of Rooms in Freeport
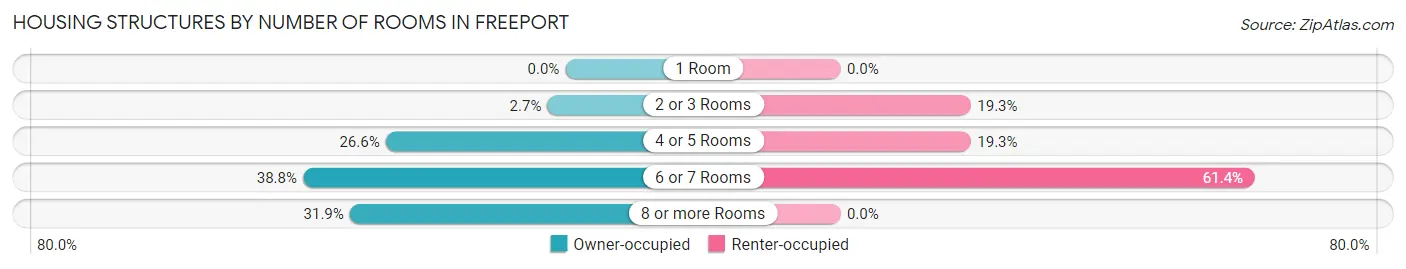
| Number of Rooms | Owner-occupied | Renter-occupied |
| 1 Room | 0 (0.0%) | 0 (0.0%) |
| 2 or 3 Rooms | 5 (2.7%) | 11 (19.3%) |
| 4 or 5 Rooms | 50 (26.6%) | 11 (19.3%) |
| 6 or 7 Rooms | 73 (38.8%) | 35 (61.4%) |
| 8 or more Rooms | 60 (31.9%) | 0 (0.0%) |
| Total | 188 (100.0%) | 57 (100.0%) |
Housing Structure by Heating Type in Freeport
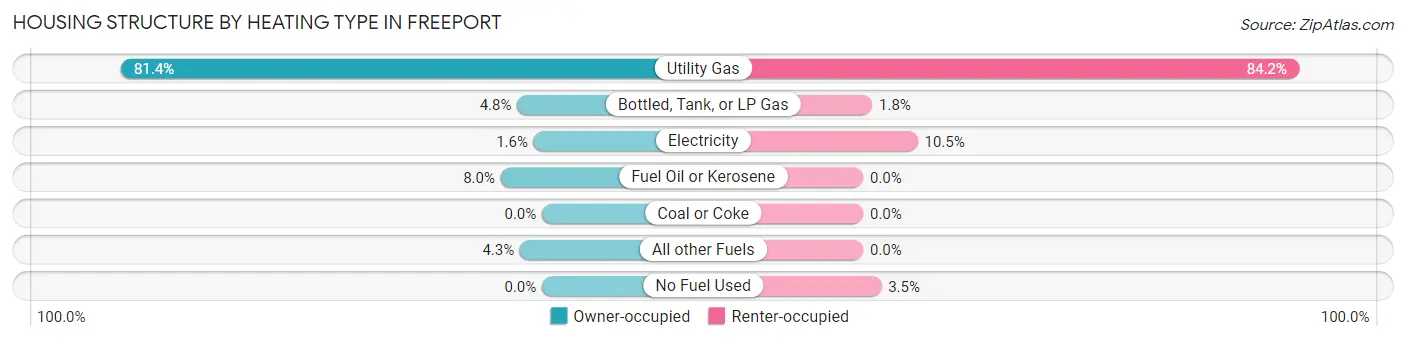
| Heating Type | Owner-occupied | Renter-occupied |
| Utility Gas | 153 (81.4%) | 48 (84.2%) |
| Bottled, Tank, or LP Gas | 9 (4.8%) | 1 (1.8%) |
| Electricity | 3 (1.6%) | 6 (10.5%) |
| Fuel Oil or Kerosene | 15 (8.0%) | 0 (0.0%) |
| Coal or Coke | 0 (0.0%) | 0 (0.0%) |
| All other Fuels | 8 (4.3%) | 0 (0.0%) |
| No Fuel Used | 0 (0.0%) | 2 (3.5%) |
| Total | 188 (100.0%) | 57 (100.0%) |
Household Vehicle Usage in Freeport
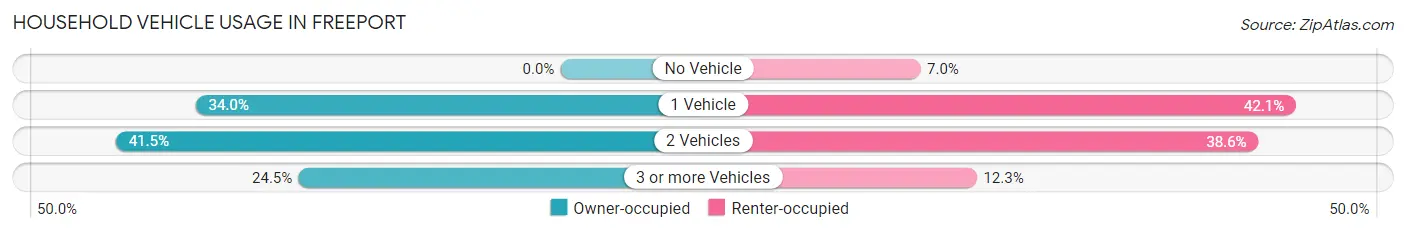
| Vehicles per Household | Owner-occupied | Renter-occupied |
| No Vehicle | 0 (0.0%) | 4 (7.0%) |
| 1 Vehicle | 64 (34.0%) | 24 (42.1%) |
| 2 Vehicles | 78 (41.5%) | 22 (38.6%) |
| 3 or more Vehicles | 46 (24.5%) | 7 (12.3%) |
| Total | 188 (100.0%) | 57 (100.0%) |
Real Estate & Mortgages in Freeport
Real Estate and Mortgage Overview in Freeport
| Characteristic | Without Mortgage | With Mortgage |
| Housing Units | 70 | 118 |
| Median Property Value | $122,200 | $145,600 |
| Median Household Income | $50,357 | $10 |
| Monthly Housing Costs | $490 | $2 |
| Real Estate Taxes | $2,095 | $1 |
Property Value by Mortgage Status in Freeport
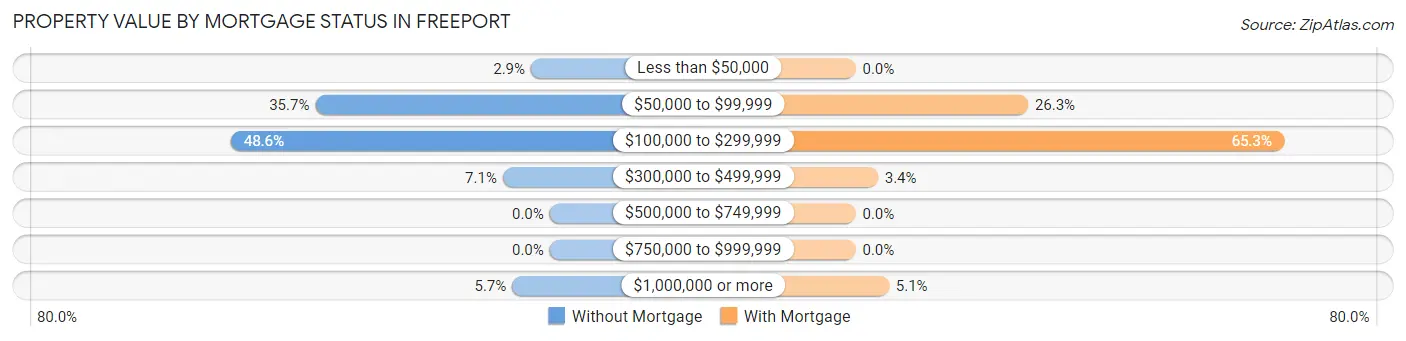
| Property Value | Without Mortgage | With Mortgage |
| Less than $50,000 | 2 (2.9%) | 0 (0.0%) |
| $50,000 to $99,999 | 25 (35.7%) | 31 (26.3%) |
| $100,000 to $299,999 | 34 (48.6%) | 77 (65.2%) |
| $300,000 to $499,999 | 5 (7.1%) | 4 (3.4%) |
| $500,000 to $749,999 | 0 (0.0%) | 0 (0.0%) |
| $750,000 to $999,999 | 0 (0.0%) | 0 (0.0%) |
| $1,000,000 or more | 4 (5.7%) | 6 (5.1%) |
| Total | 70 (100.0%) | 118 (100.0%) |
Household Income by Mortgage Status in Freeport
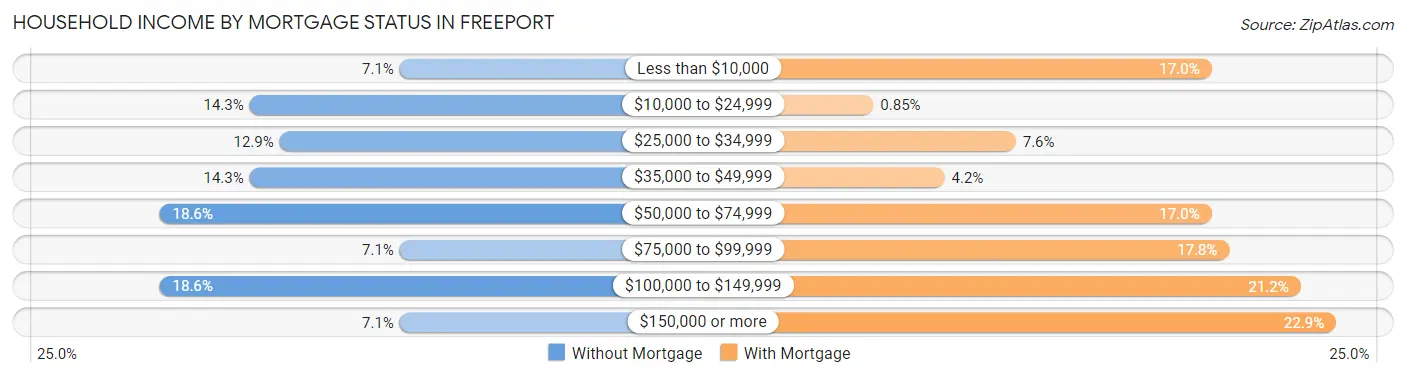
| Household Income | Without Mortgage | With Mortgage |
| Less than $10,000 | 5 (7.1%) | 20 (17.0%) |
| $10,000 to $24,999 | 10 (14.3%) | 1 (0.9%) |
| $25,000 to $34,999 | 9 (12.9%) | 9 (7.6%) |
| $35,000 to $49,999 | 10 (14.3%) | 5 (4.2%) |
| $50,000 to $74,999 | 13 (18.6%) | 20 (17.0%) |
| $75,000 to $99,999 | 5 (7.1%) | 21 (17.8%) |
| $100,000 to $149,999 | 13 (18.6%) | 25 (21.2%) |
| $150,000 or more | 5 (7.1%) | 27 (22.9%) |
| Total | 70 (100.0%) | 118 (100.0%) |
Property Value to Household Income Ratio in Freeport
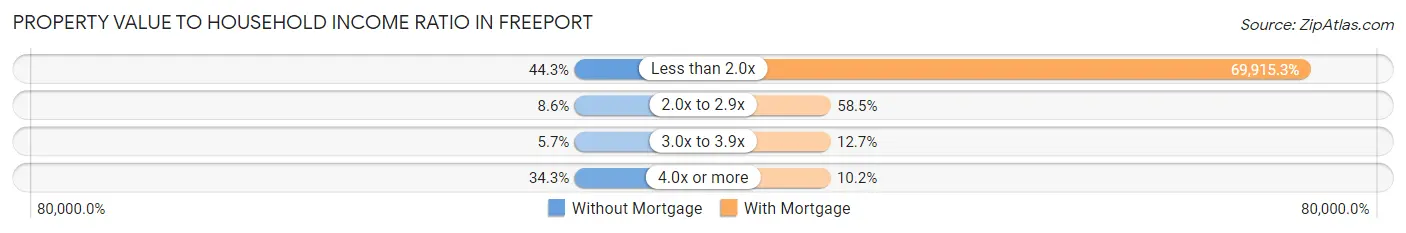
| Value-to-Income Ratio | Without Mortgage | With Mortgage |
| Less than 2.0x | 31 (44.3%) | 82,500 (69,915.3%) |
| 2.0x to 2.9x | 6 (8.6%) | 69 (58.5%) |
| 3.0x to 3.9x | 4 (5.7%) | 15 (12.7%) |
| 4.0x or more | 24 (34.3%) | 12 (10.2%) |
| Total | 70 (100.0%) | 118 (100.0%) |
Real Estate Taxes by Mortgage Status in Freeport
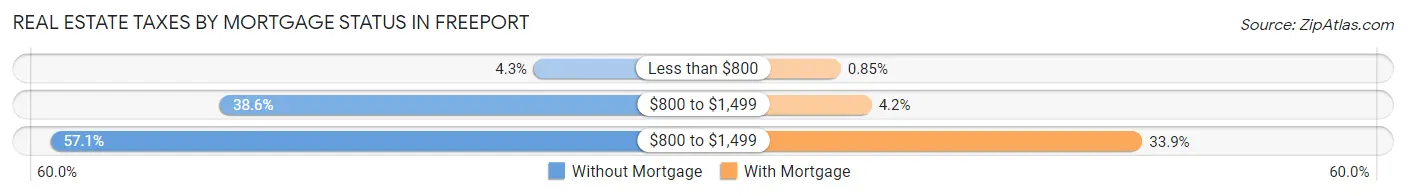
| Property Taxes | Without Mortgage | With Mortgage |
| Less than $800 | 3 (4.3%) | 1 (0.9%) |
| $800 to $1,499 | 27 (38.6%) | 5 (4.2%) |
| $800 to $1,499 | 40 (57.1%) | 40 (33.9%) |
| Total | 70 (100.0%) | 118 (100.0%) |
Health & Disability in Freeport
Health Insurance Coverage by Age in Freeport
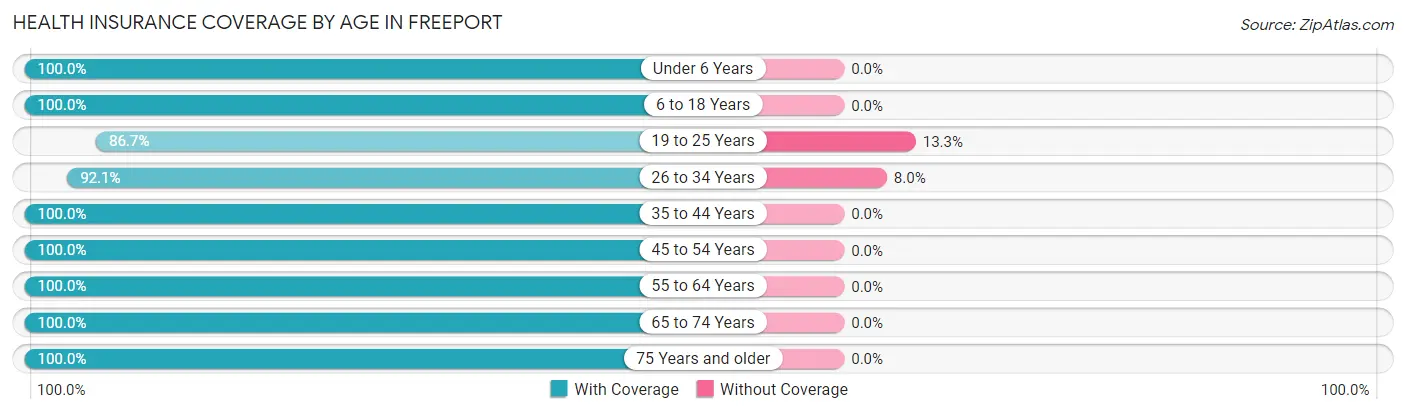
| Age Bracket | With Coverage | Without Coverage |
| Under 6 Years | 72 (100.0%) | 0 (0.0%) |
| 6 to 18 Years | 162 (100.0%) | 0 (0.0%) |
| 19 to 25 Years | 78 (86.7%) | 12 (13.3%) |
| 26 to 34 Years | 81 (92.0%) | 7 (8.0%) |
| 35 to 44 Years | 75 (100.0%) | 0 (0.0%) |
| 45 to 54 Years | 62 (100.0%) | 0 (0.0%) |
| 55 to 64 Years | 105 (100.0%) | 0 (0.0%) |
| 65 to 74 Years | 38 (100.0%) | 0 (0.0%) |
| 75 Years and older | 20 (100.0%) | 0 (0.0%) |
| Total | 693 (97.3%) | 19 (2.7%) |
Health Insurance Coverage by Citizenship Status in Freeport
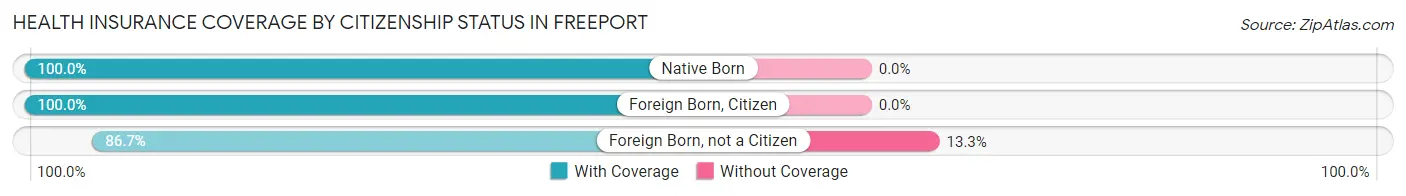
| Citizenship Status | With Coverage | Without Coverage |
| Native Born | 72 (100.0%) | 0 (0.0%) |
| Foreign Born, Citizen | 162 (100.0%) | 0 (0.0%) |
| Foreign Born, not a Citizen | 78 (86.7%) | 12 (13.3%) |
Health Insurance Coverage by Household Income in Freeport
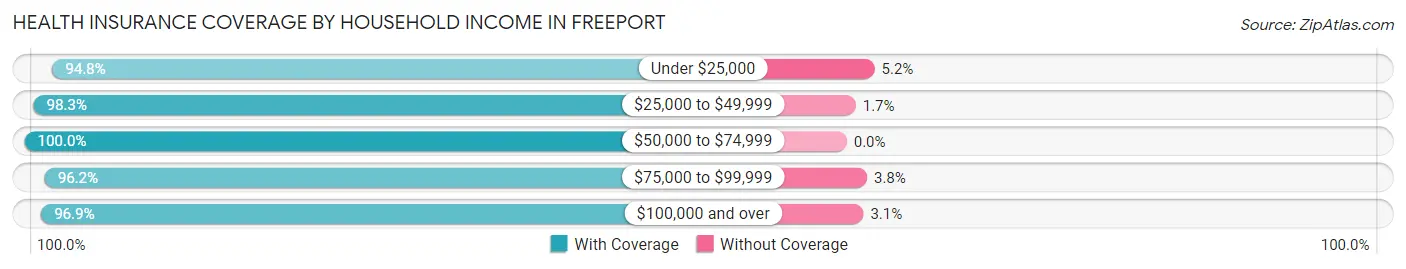
| Household Income | With Coverage | Without Coverage |
| Under $25,000 | 91 (94.8%) | 5 (5.2%) |
| $25,000 to $49,999 | 117 (98.3%) | 2 (1.7%) |
| $50,000 to $74,999 | 141 (100.0%) | 0 (0.0%) |
| $75,000 to $99,999 | 127 (96.2%) | 5 (3.8%) |
| $100,000 and over | 217 (96.9%) | 7 (3.1%) |
Public vs Private Health Insurance Coverage by Age in Freeport
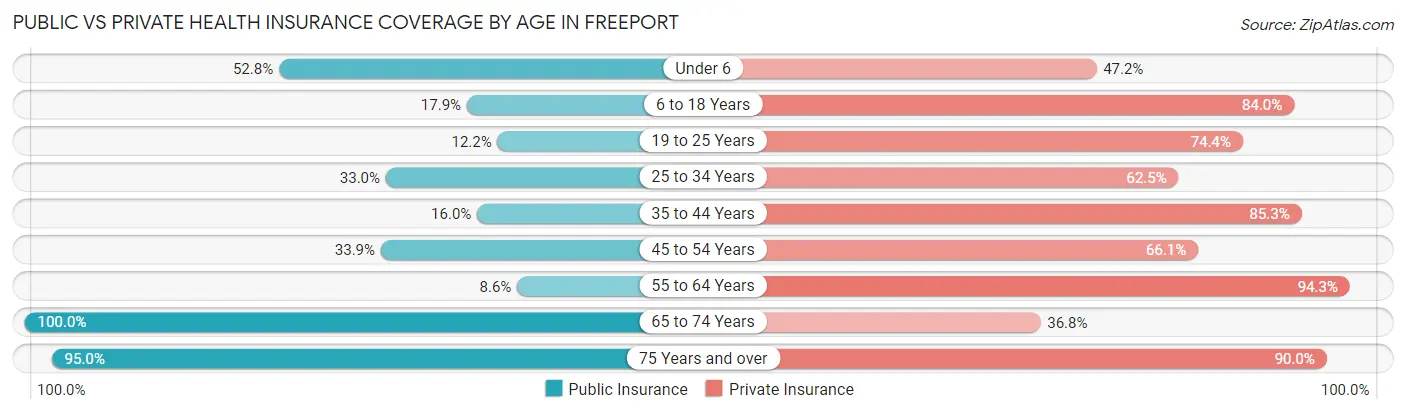
| Age Bracket | Public Insurance | Private Insurance |
| Under 6 | 38 (52.8%) | 34 (47.2%) |
| 6 to 18 Years | 29 (17.9%) | 136 (84.0%) |
| 19 to 25 Years | 11 (12.2%) | 67 (74.4%) |
| 25 to 34 Years | 29 (33.0%) | 55 (62.5%) |
| 35 to 44 Years | 12 (16.0%) | 64 (85.3%) |
| 45 to 54 Years | 21 (33.9%) | 41 (66.1%) |
| 55 to 64 Years | 9 (8.6%) | 99 (94.3%) |
| 65 to 74 Years | 38 (100.0%) | 14 (36.8%) |
| 75 Years and over | 19 (95.0%) | 18 (90.0%) |
| Total | 206 (28.9%) | 528 (74.2%) |
Disability Status by Sex by Age in Freeport
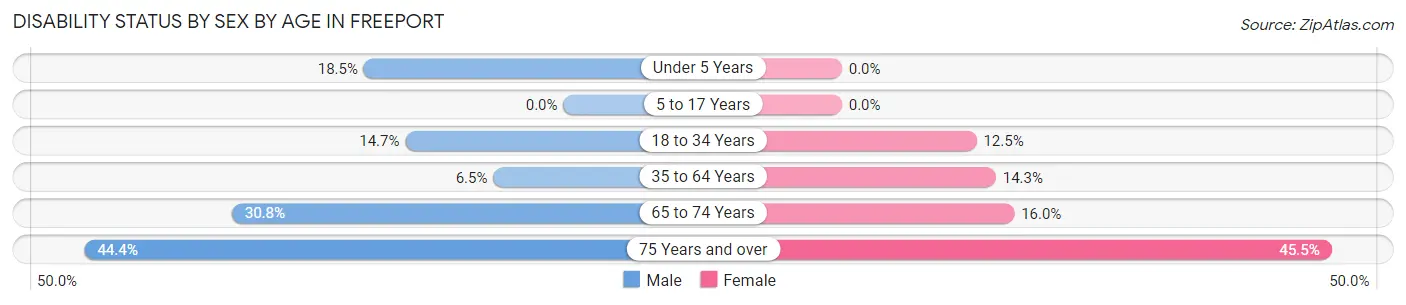
| Age Bracket | Male | Female |
| Under 5 Years | 5 (18.5%) | 0 (0.0%) |
| 5 to 17 Years | 0 (0.0%) | 0 (0.0%) |
| 18 to 34 Years | 11 (14.7%) | 14 (12.5%) |
| 35 to 64 Years | 8 (6.5%) | 17 (14.3%) |
| 65 to 74 Years | 4 (30.8%) | 4 (16.0%) |
| 75 Years and over | 4 (44.4%) | 5 (45.5%) |
Disability Class by Sex by Age in Freeport
Disability Class: Hearing Difficulty
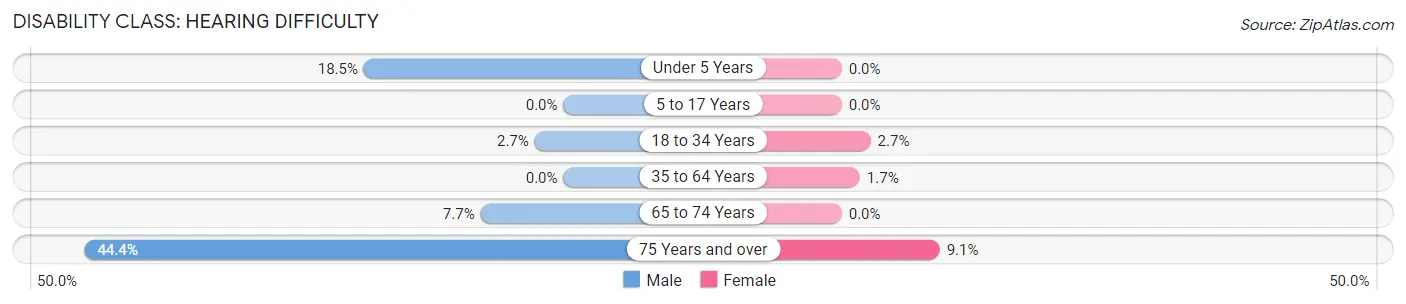
| Age Bracket | Male | Female |
| Under 5 Years | 5 (18.5%) | 0 (0.0%) |
| 5 to 17 Years | 0 (0.0%) | 0 (0.0%) |
| 18 to 34 Years | 2 (2.7%) | 3 (2.7%) |
| 35 to 64 Years | 0 (0.0%) | 2 (1.7%) |
| 65 to 74 Years | 1 (7.7%) | 0 (0.0%) |
| 75 Years and over | 4 (44.4%) | 1 (9.1%) |
Disability Class: Vision Difficulty
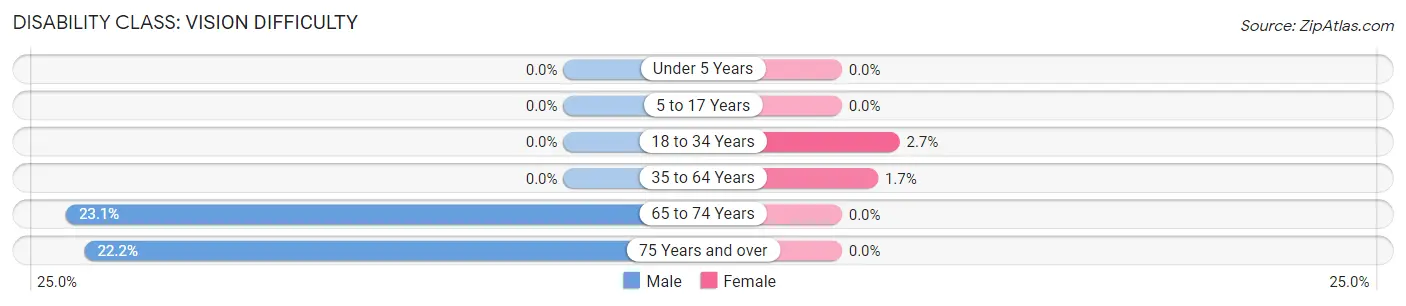
| Age Bracket | Male | Female |
| Under 5 Years | 0 (0.0%) | 0 (0.0%) |
| 5 to 17 Years | 0 (0.0%) | 0 (0.0%) |
| 18 to 34 Years | 0 (0.0%) | 3 (2.7%) |
| 35 to 64 Years | 0 (0.0%) | 2 (1.7%) |
| 65 to 74 Years | 3 (23.1%) | 0 (0.0%) |
| 75 Years and over | 2 (22.2%) | 0 (0.0%) |
Disability Class: Cognitive Difficulty
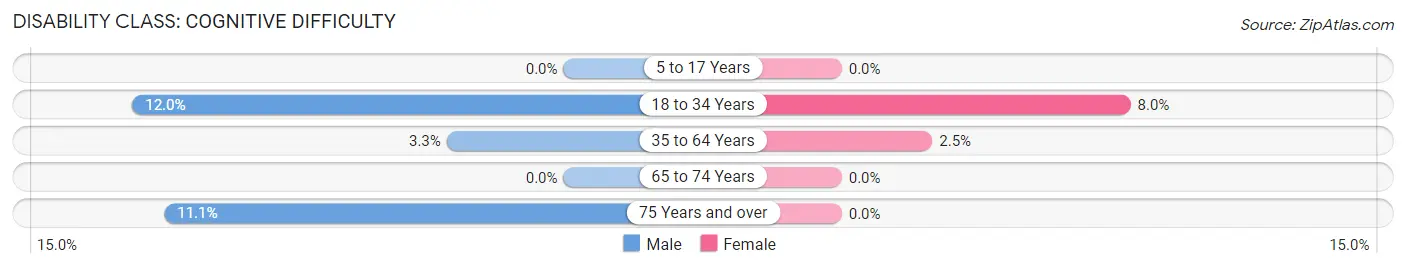
| Age Bracket | Male | Female |
| 5 to 17 Years | 0 (0.0%) | 0 (0.0%) |
| 18 to 34 Years | 9 (12.0%) | 9 (8.0%) |
| 35 to 64 Years | 4 (3.3%) | 3 (2.5%) |
| 65 to 74 Years | 0 (0.0%) | 0 (0.0%) |
| 75 Years and over | 1 (11.1%) | 0 (0.0%) |
Disability Class: Ambulatory Difficulty
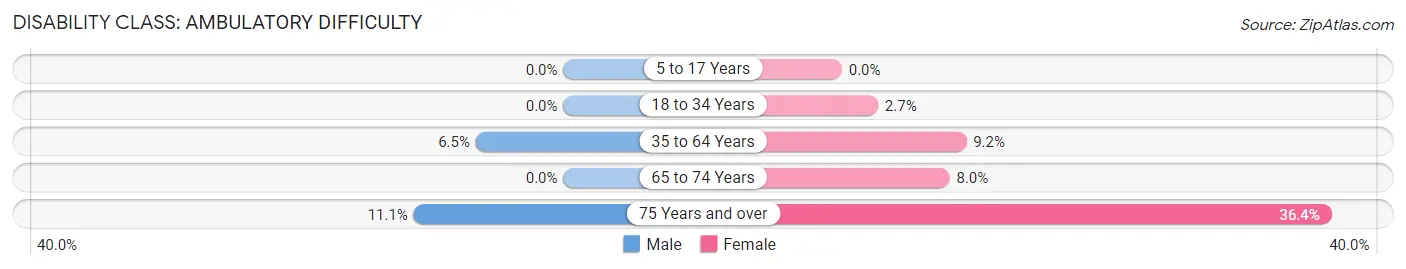
| Age Bracket | Male | Female |
| 5 to 17 Years | 0 (0.0%) | 0 (0.0%) |
| 18 to 34 Years | 0 (0.0%) | 3 (2.7%) |
| 35 to 64 Years | 8 (6.5%) | 11 (9.2%) |
| 65 to 74 Years | 0 (0.0%) | 2 (8.0%) |
| 75 Years and over | 1 (11.1%) | 4 (36.4%) |
Disability Class: Self-Care Difficulty
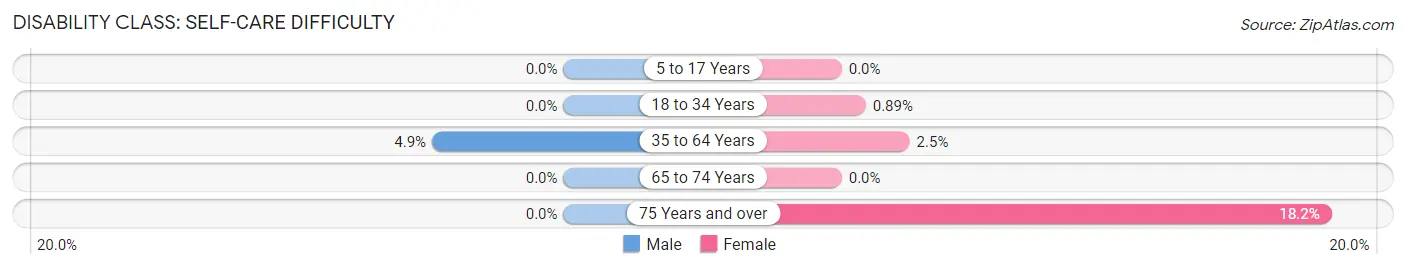
| Age Bracket | Male | Female |
| 5 to 17 Years | 0 (0.0%) | 0 (0.0%) |
| 18 to 34 Years | 0 (0.0%) | 1 (0.9%) |
| 35 to 64 Years | 6 (4.9%) | 3 (2.5%) |
| 65 to 74 Years | 0 (0.0%) | 0 (0.0%) |
| 75 Years and over | 0 (0.0%) | 2 (18.2%) |
Technology Access in Freeport
Computing Device Access in Freeport
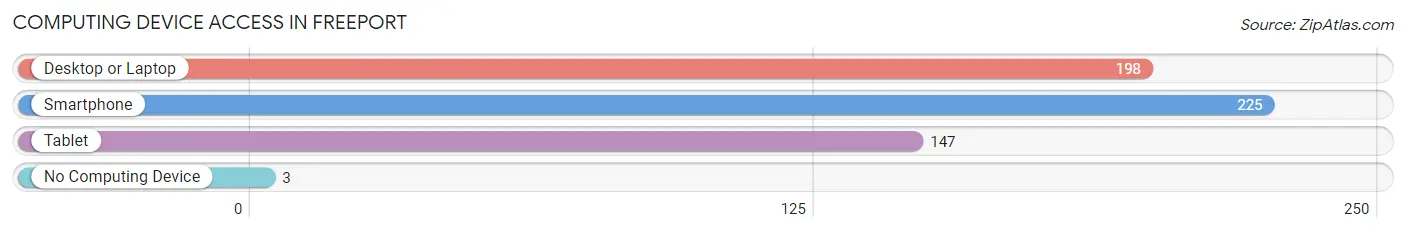
| Device Type | # Households | % Households |
| Desktop or Laptop | 198 | 80.8% |
| Smartphone | 225 | 91.8% |
| Tablet | 147 | 60.0% |
| No Computing Device | 3 | 1.2% |
| Total | 245 | 100.0% |
Internet Access in Freeport
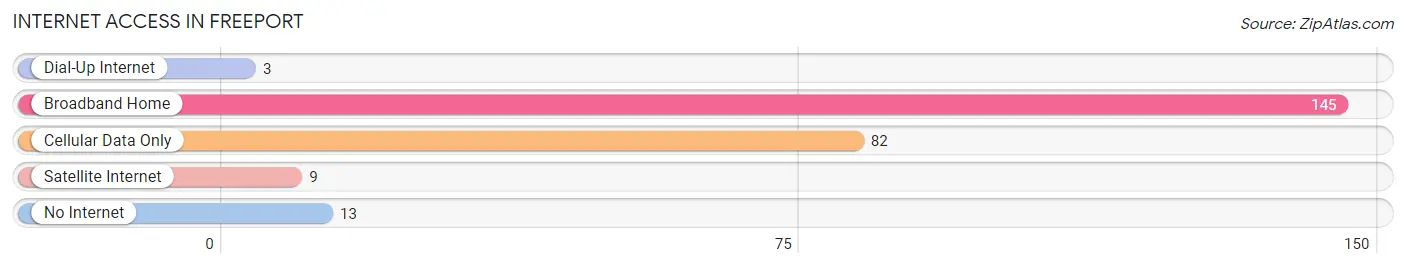
| Internet Type | # Households | % Households |
| Dial-Up Internet | 3 | 1.2% |
| Broadband Home | 145 | 59.2% |
| Cellular Data Only | 82 | 33.5% |
| Satellite Internet | 9 | 3.7% |
| No Internet | 13 | 5.3% |
| Total | 245 | 100.0% |
Freeport Summary
Freeport, Michigan is a small village located in the northwest corner of Barry County, Michigan. It is situated on the banks of the Thornapple River, and is surrounded by rolling hills and farmland. The village has a population of approximately 1,000 people, and is a popular destination for outdoor recreation and relaxation.
History
Freeport was first settled in 1837 by a group of settlers from New York. The village was originally known as “Freeport Station”, and was a stop on the Grand Rapids and Indiana Railroad. The village was officially incorporated in 1867, and the name was changed to Freeport.
The village grew slowly over the years, and by the early 1900s, it had become a popular destination for tourists and vacationers. The village was known for its beautiful scenery, and was a popular spot for fishing, hunting, and other outdoor activities.
In the 1950s, Freeport began to experience a period of growth and development. The village was connected to the nearby city of Grand Rapids by a new highway, and the population began to increase. The village also began to attract new businesses, and the economy began to diversify.
Geography
Freeport is located in the northwest corner of Barry County, Michigan. It is situated on the banks of the Thornapple River, and is surrounded by rolling hills and farmland. The village is located approximately 25 miles from the city of Grand Rapids, and is easily accessible by highway.
The village has a total area of 1.2 square miles, and is home to a variety of wildlife, including deer, foxes, and other small animals. The village is also home to a variety of birds, including bald eagles, hawks, and owls.
Economy
The economy of Freeport is largely based on agriculture and tourism. The village is home to several farms, and the surrounding area is known for its production of apples, cherries, and other fruits and vegetables. The village is also home to several wineries, and is a popular destination for wine tasting and other activities.
The village is also home to several small businesses, including restaurants, shops, and other services. The village is also home to a variety of recreational activities, including fishing, hunting, and camping.
Demographics
As of the 2010 census, the population of Freeport was 1,000 people. The village is predominantly white, with approximately 95% of the population being Caucasian. The median household income is $45,000, and the median age is 44 years old.
Conclusion
Freeport, Michigan is a small village located in the northwest corner of Barry County, Michigan. It is situated on the banks of the Thornapple River, and is surrounded by rolling hills and farmland. The village has a population of approximately 1,000 people, and is a popular destination for outdoor recreation and relaxation. The economy of Freeport is largely based on agriculture and tourism, and the village is home to several small businesses. The village is predominantly white, with approximately 95% of the population being Caucasian.
Common Questions
What is Per Capita Income in Freeport?
Per Capita income in Freeport is $25,401.
What is the Median Family Income in Freeport?
Median Family Income in Freeport is $73,000.
What is the Median Household income in Freeport?
Median Household Income in Freeport is $64,861.
What is Income or Wage Gap in Freeport?
Income or Wage Gap in Freeport is 55.0%.
Women in Freeport earn 45.0 cents for every dollar earned by a man.
What is Inequality or Gini Index in Freeport?
Inequality or Gini Index in Freeport is 0.35.
What is the Total Population of Freeport?
Total Population of Freeport is 713.
What is the Total Male Population of Freeport?
Total Male Population of Freeport is 331.
What is the Total Female Population of Freeport?
Total Female Population of Freeport is 382.
What is the Ratio of Males per 100 Females in Freeport?
There are 86.65 Males per 100 Females in Freeport.
What is the Ratio of Females per 100 Males in Freeport?
There are 115.41 Females per 100 Males in Freeport.
What is the Median Population Age in Freeport?
Median Population Age in Freeport is 27.6 Years.
What is the Average Family Size in Freeport
Average Family Size in Freeport is 3.3 People.
What is the Average Household Size in Freeport
Average Household Size in Freeport is 2.9 People.
How Large is the Labor Force in Freeport?
There are 353 People in the Labor Forcein in Freeport.
What is the Percentage of People in the Labor Force in Freeport?
67.9% of People are in the Labor Force in Freeport.
What is the Unemployment Rate in Freeport?
Unemployment Rate in Freeport is 3.7%.