Fostoria, MI Map & Demographics
Fostoria Map
Fostoria Overview
$35,115
PER CAPITA INCOME
$91,447
AVG FAMILY INCOME
$91,217
AVG HOUSEHOLD INCOME
26.2%
WAGE / INCOME GAP [ % ]
73.8¢/ $1
WAGE / INCOME GAP [ $ ]
0.36
INEQUALITY / GINI INDEX
1,023
TOTAL POPULATION
503
MALE POPULATION
520
FEMALE POPULATION
96.73
MALES / 100 FEMALES
103.38
FEMALES / 100 MALES
37.0
MEDIAN AGE
3.5
AVG FAMILY SIZE
3.0
AVG HOUSEHOLD SIZE
571
LABOR FORCE [ PEOPLE ]
67.7%
PERCENT IN LABOR FORCE
7.2%
UNEMPLOYMENT RATE
Fostoria Zip Codes
Fostoria Area Codes
Income in Fostoria
Income Overview in Fostoria
Per Capita Income in Fostoria is $35,115, while median incomes of families and households are $91,447 and $91,217 respectively.
| Characteristic | Number | Measure |
| Per Capita Income | 1,023 | $35,115 |
| Median Family Income | 266 | $91,447 |
| Mean Family Income | 266 | $90,044 |
| Median Household Income | 338 | $91,217 |
| Mean Household Income | 338 | $102,504 |
| Income Deficit | 266 | $0 |
| Wage / Income Gap (%) | 1,023 | 26.17% |
| Wage / Income Gap ($) | 1,023 | 73.83¢ per $1 |
| Gini / Inequality Index | 1,023 | 0.36 |
Earnings by Sex in Fostoria
Average Earnings in Fostoria are $29,043, $38,714 for men and $28,583 for women, a difference of 26.2%.
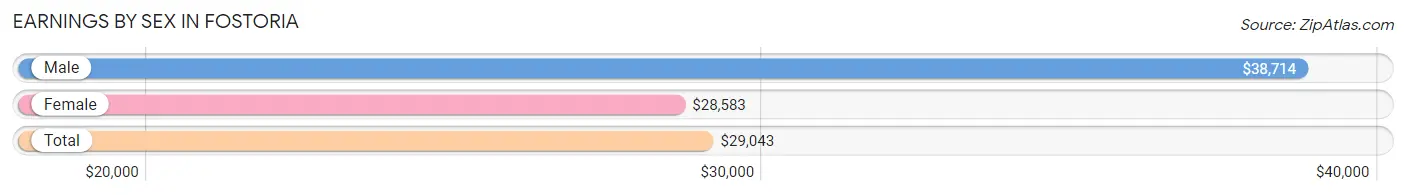
| Sex | Number | Average Earnings |
| Male | 254 (42.4%) | $38,714 |
| Female | 345 (57.6%) | $28,583 |
| Total | 599 (100.0%) | $29,043 |
Earnings by Sex by Income Bracket in Fostoria
The most common earnings brackets in Fostoria are $75,000 to $99,999 for men (47 | 18.5%) and $25,000 to $29,999 for women (122 | 35.4%).
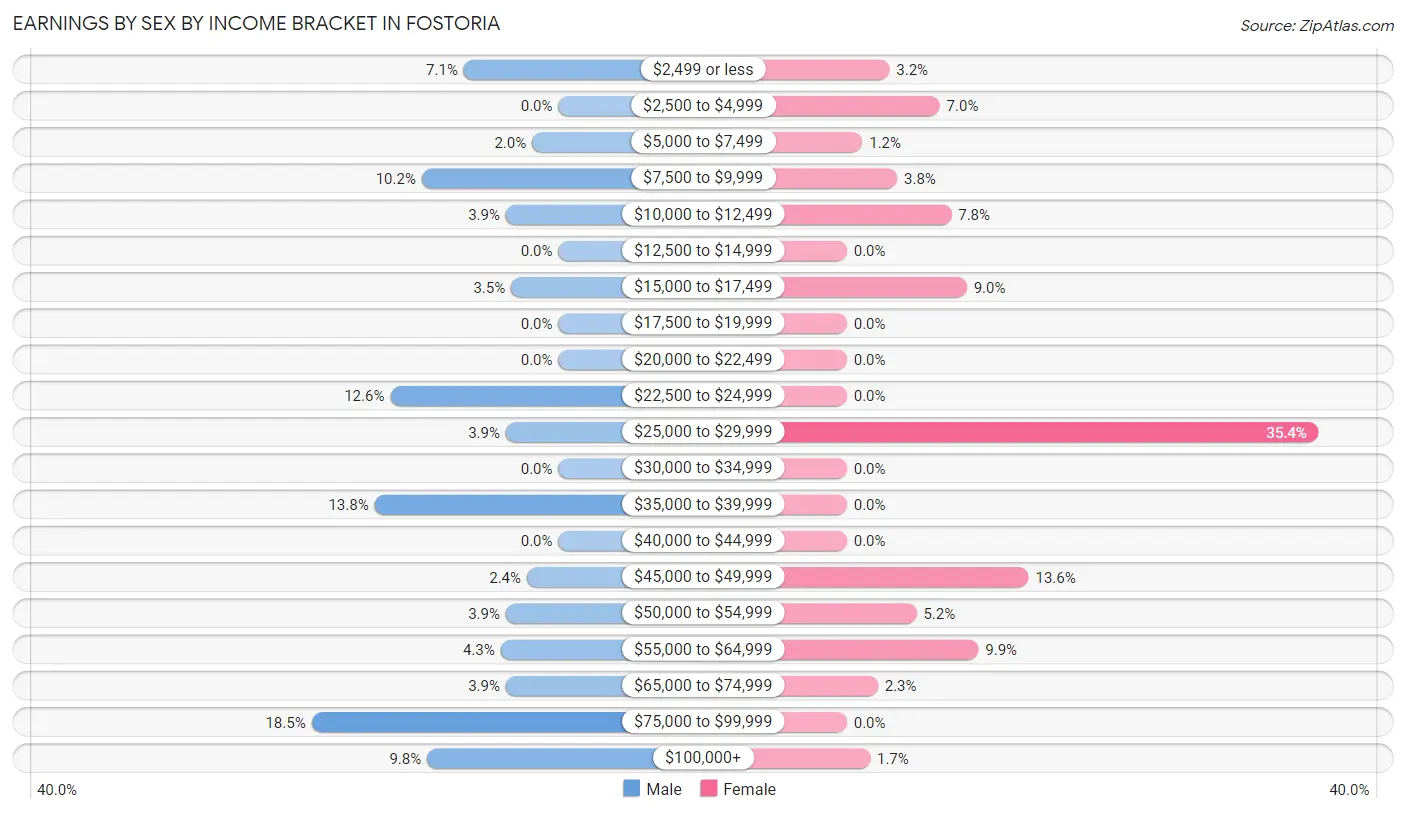
| Income | Male | Female |
| $2,499 or less | 18 (7.1%) | 11 (3.2%) |
| $2,500 to $4,999 | 0 (0.0%) | 24 (7.0%) |
| $5,000 to $7,499 | 5 (2.0%) | 4 (1.2%) |
| $7,500 to $9,999 | 26 (10.2%) | 13 (3.8%) |
| $10,000 to $12,499 | 10 (3.9%) | 27 (7.8%) |
| $12,500 to $14,999 | 0 (0.0%) | 0 (0.0%) |
| $15,000 to $17,499 | 9 (3.5%) | 31 (9.0%) |
| $17,500 to $19,999 | 0 (0.0%) | 0 (0.0%) |
| $20,000 to $22,499 | 0 (0.0%) | 0 (0.0%) |
| $22,500 to $24,999 | 32 (12.6%) | 0 (0.0%) |
| $25,000 to $29,999 | 10 (3.9%) | 122 (35.4%) |
| $30,000 to $34,999 | 0 (0.0%) | 0 (0.0%) |
| $35,000 to $39,999 | 35 (13.8%) | 0 (0.0%) |
| $40,000 to $44,999 | 0 (0.0%) | 0 (0.0%) |
| $45,000 to $49,999 | 6 (2.4%) | 47 (13.6%) |
| $50,000 to $54,999 | 10 (3.9%) | 18 (5.2%) |
| $55,000 to $64,999 | 11 (4.3%) | 34 (9.9%) |
| $65,000 to $74,999 | 10 (3.9%) | 8 (2.3%) |
| $75,000 to $99,999 | 47 (18.5%) | 0 (0.0%) |
| $100,000+ | 25 (9.8%) | 6 (1.7%) |
| Total | 254 (100.0%) | 345 (100.0%) |
Earnings by Sex by Educational Attainment in Fostoria
Average earnings in Fostoria are $55,625 for men and $29,060 for women, a difference of 47.8%. Men with an educational attainment of bachelor's degree enjoy the highest average annual earnings of $85,721, while those with high school diploma education earn the least with $38,679. Women with an educational attainment of high school diploma earn the most with the average annual earnings of $28,988, while those with high school diploma education have the smallest earnings of $28,988.
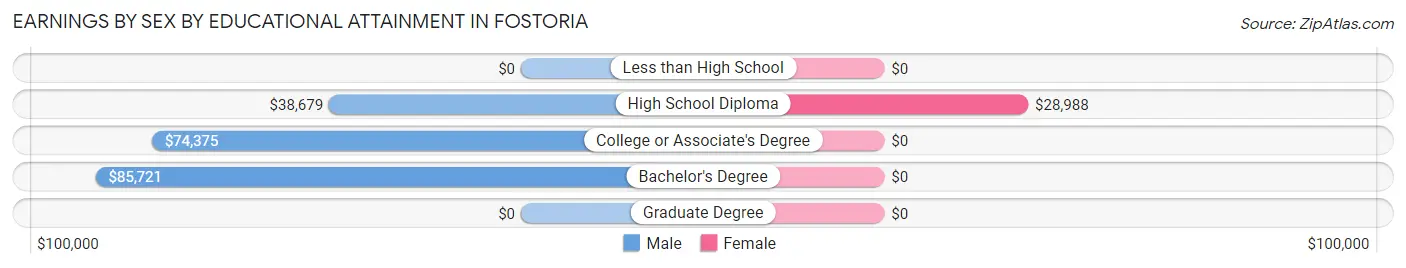
| Educational Attainment | Male Income | Female Income |
| Less than High School | - | - |
| High School Diploma | $38,679 | $28,988 |
| College or Associate's Degree | $74,375 | $0 |
| Bachelor's Degree | $85,721 | $0 |
| Graduate Degree | - | - |
| Total | $55,625 | $29,060 |
Family Income in Fostoria
Family Income Brackets in Fostoria
According to the Fostoria family income data, there are 107 families falling into the $75,000 to $99,999 income range, which is the most common income bracket and makes up 40.2% of all families.
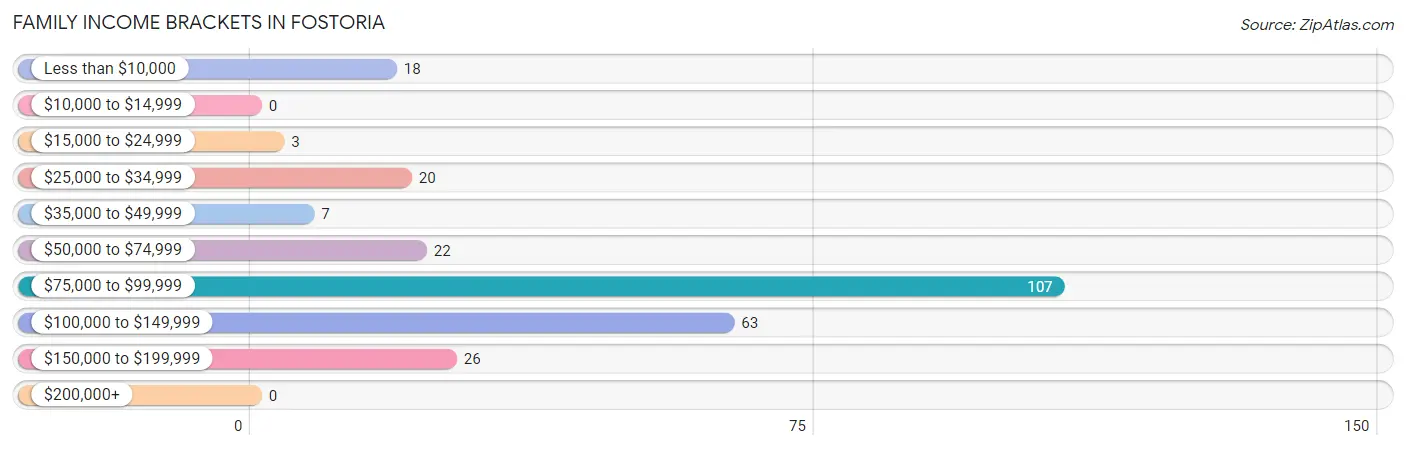
| Income Bracket | # Families | % Families |
| Less than $10,000 | 18 | 6.8% |
| $10,000 to $14,999 | 0 | 0.0% |
| $15,000 to $24,999 | 3 | 1.1% |
| $25,000 to $34,999 | 20 | 7.5% |
| $35,000 to $49,999 | 7 | 2.6% |
| $50,000 to $74,999 | 22 | 8.3% |
| $75,000 to $99,999 | 107 | 40.2% |
| $100,000 to $149,999 | 63 | 23.7% |
| $150,000 to $199,999 | 26 | 9.8% |
| $200,000+ | 0 | 0.0% |
Family Income by Famaliy Size in Fostoria
5-person families (28 | 10.5%) account for the highest median family income in Fostoria with $98,000 per family, while 3-person families (154 | 57.9%) have the highest median income of $30,428 per family member.
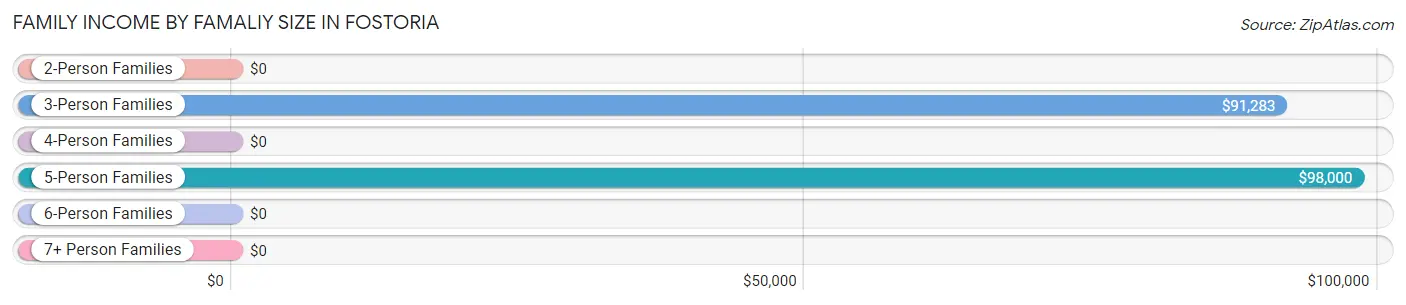
| Income Bracket | # Families | Median Income |
| 2-Person Families | 40 (15.0%) | $0 |
| 3-Person Families | 154 (57.9%) | $91,283 |
| 4-Person Families | 29 (10.9%) | $0 |
| 5-Person Families | 28 (10.5%) | $98,000 |
| 6-Person Families | 15 (5.6%) | $0 |
| 7+ Person Families | 0 (0.0%) | $0 |
| Total | 266 (100.0%) | $91,447 |
Family Income by Number of Earners in Fostoria
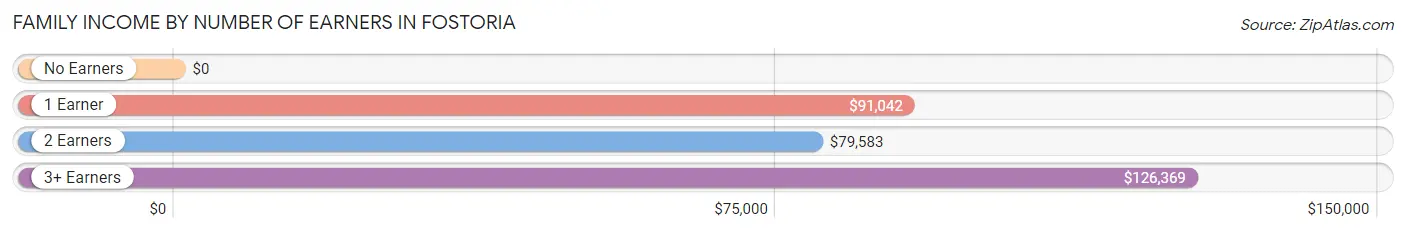
| Number of Earners | # Families | Median Income |
| No Earners | 18 (6.8%) | $0 |
| 1 Earner | 112 (42.1%) | $91,042 |
| 2 Earners | 65 (24.4%) | $79,583 |
| 3+ Earners | 71 (26.7%) | $126,369 |
| Total | 266 (100.0%) | $91,447 |
Household Income in Fostoria
Household Income Brackets in Fostoria
With 122 households falling in the category, the $75,000 to $99,999 income range is the most frequent in Fostoria, accounting for 36.1% of all households.
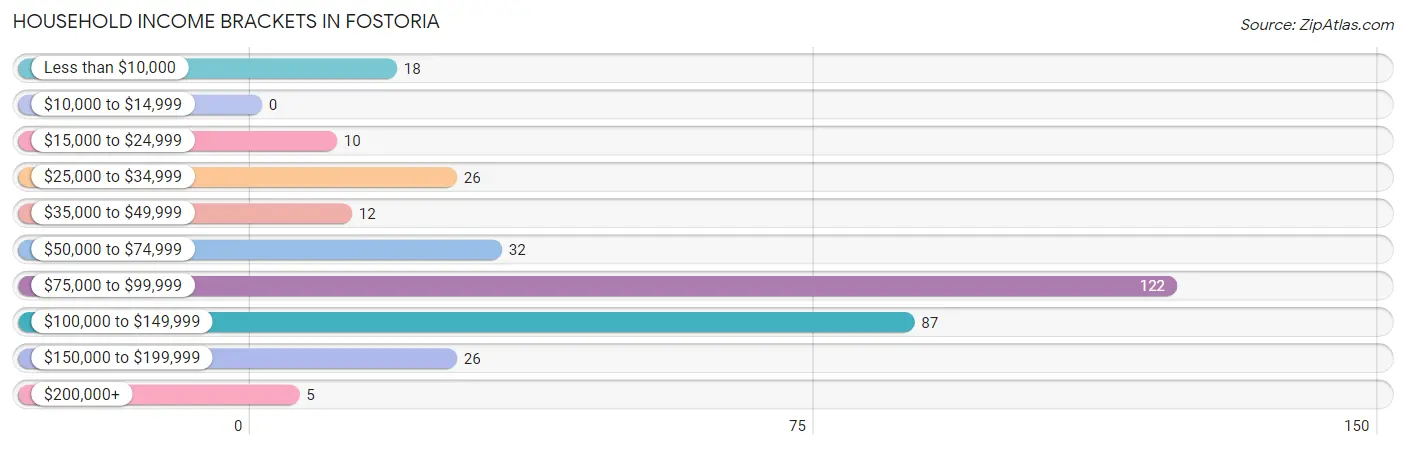
| Income Bracket | # Households | % Households |
| Less than $10,000 | 18 | 5.3% |
| $10,000 to $14,999 | 0 | 0.0% |
| $15,000 to $24,999 | 10 | 3.0% |
| $25,000 to $34,999 | 26 | 7.7% |
| $35,000 to $49,999 | 12 | 3.6% |
| $50,000 to $74,999 | 32 | 9.5% |
| $75,000 to $99,999 | 122 | 36.1% |
| $100,000 to $149,999 | 87 | 25.7% |
| $150,000 to $199,999 | 26 | 7.7% |
| $200,000+ | 5 | 1.5% |
Household Income by Householder Age in Fostoria
The median household income in Fostoria is $91,217, with the highest median household income of $114,375 found in the 45 to 64 years age bracket for the primary householder. A total of 144 households (42.6%) fall into this category.
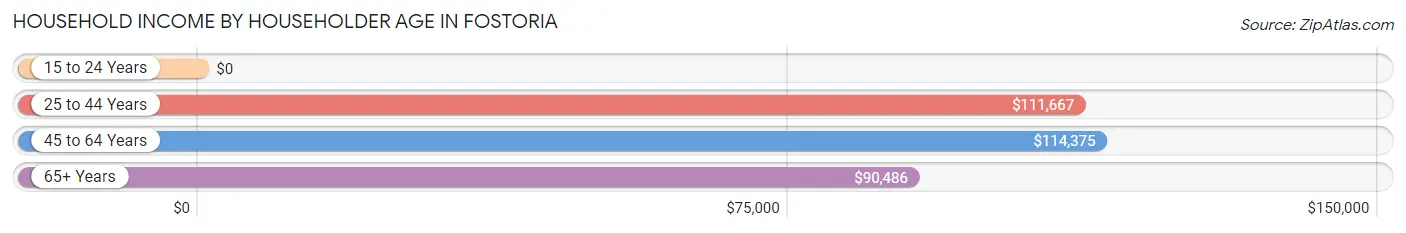
| Income Bracket | # Households | Median Income |
| 15 to 24 Years | 0 (0.0%) | $0 |
| 25 to 44 Years | 62 (18.3%) | $111,667 |
| 45 to 64 Years | 144 (42.6%) | $114,375 |
| 65+ Years | 132 (39.1%) | $90,486 |
| Total | 338 (100.0%) | $91,217 |
Poverty in Fostoria
Income Below Poverty by Sex and Age in Fostoria
With 7.7% poverty level for males and 5.8% for females among the residents of Fostoria, 45 to 54 year old males and 12 to 14 year old females are the most vulnerable to poverty, with 14 males (34.2%) and 3 females (50.0%) in their respective age groups living below the poverty level.
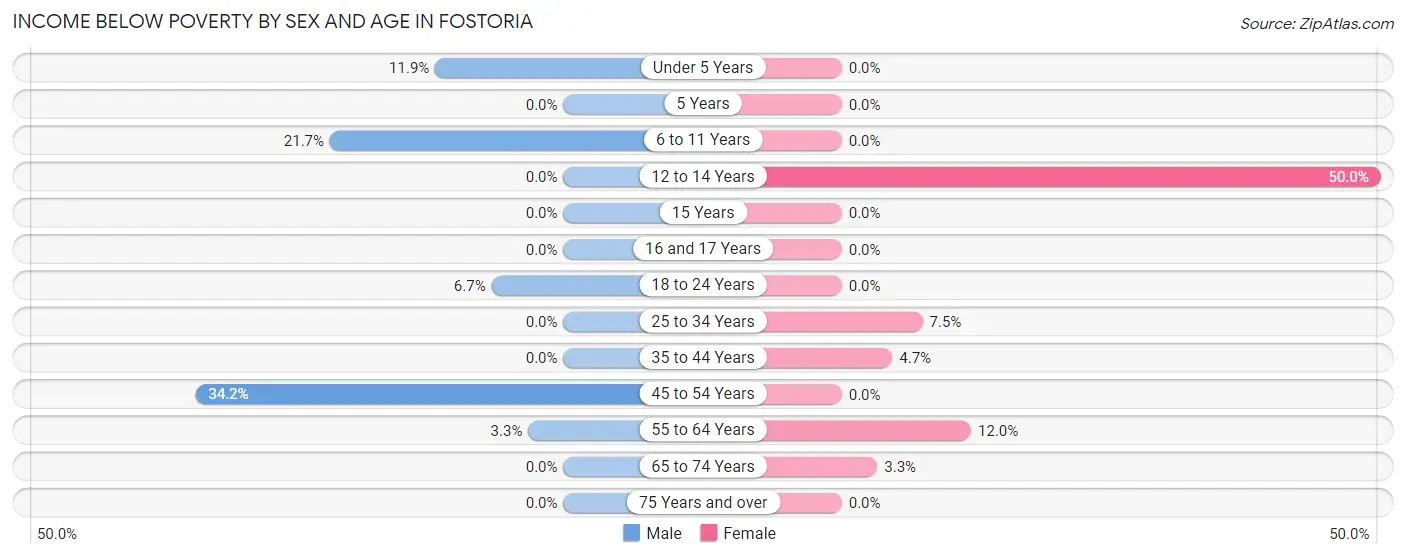
| Age Bracket | Male | Female |
| Under 5 Years | 5 (11.9%) | 0 (0.0%) |
| 5 Years | 0 (0.0%) | 0 (0.0%) |
| 6 to 11 Years | 13 (21.7%) | 0 (0.0%) |
| 12 to 14 Years | 0 (0.0%) | 3 (50.0%) |
| 15 Years | 0 (0.0%) | 0 (0.0%) |
| 16 and 17 Years | 0 (0.0%) | 0 (0.0%) |
| 18 to 24 Years | 4 (6.7%) | 0 (0.0%) |
| 25 to 34 Years | 0 (0.0%) | 6 (7.5%) |
| 35 to 44 Years | 0 (0.0%) | 6 (4.7%) |
| 45 to 54 Years | 14 (34.2%) | 0 (0.0%) |
| 55 to 64 Years | 3 (3.3%) | 12 (12.0%) |
| 65 to 74 Years | 0 (0.0%) | 3 (3.3%) |
| 75 Years and over | 0 (0.0%) | 0 (0.0%) |
| Total | 39 (7.7%) | 30 (5.8%) |
Income Above Poverty by Sex and Age in Fostoria
According to the poverty statistics in Fostoria, males aged 5 years and females aged under 5 years are the age groups that are most secure financially, with 100.0% of males and 100.0% of females in these age groups living above the poverty line.
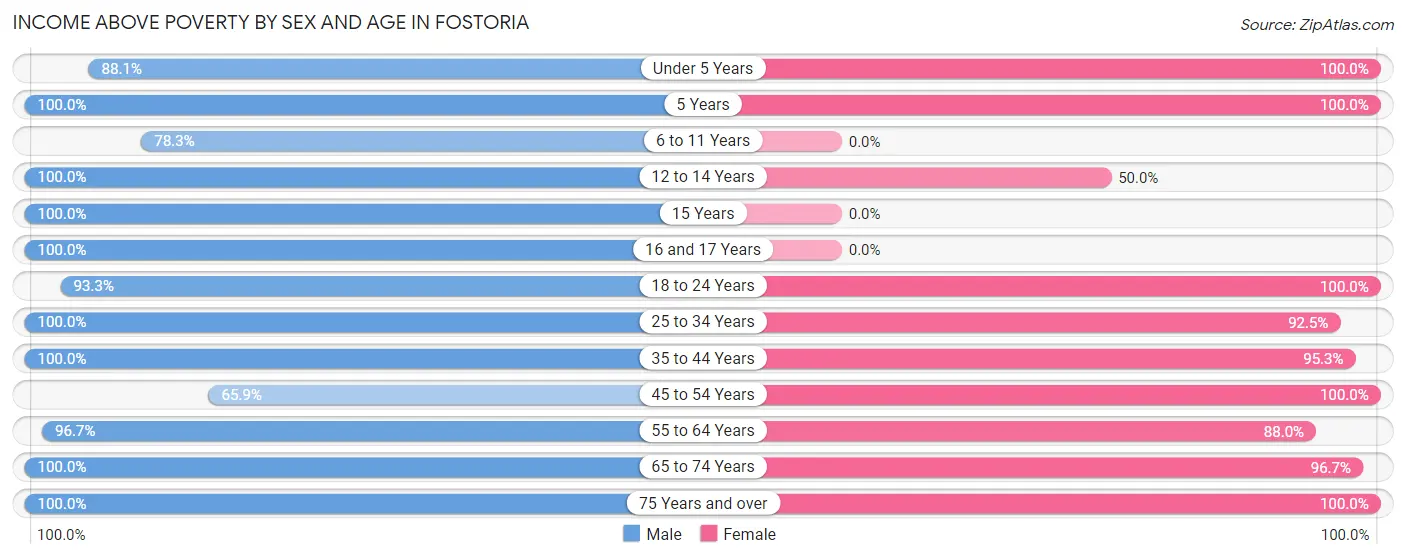
| Age Bracket | Male | Female |
| Under 5 Years | 37 (88.1%) | 36 (100.0%) |
| 5 Years | 5 (100.0%) | 6 (100.0%) |
| 6 to 11 Years | 47 (78.3%) | 0 (0.0%) |
| 12 to 14 Years | 15 (100.0%) | 3 (50.0%) |
| 15 Years | 10 (100.0%) | 0 (0.0%) |
| 16 and 17 Years | 15 (100.0%) | 0 (0.0%) |
| 18 to 24 Years | 56 (93.3%) | 40 (100.0%) |
| 25 to 34 Years | 22 (100.0%) | 74 (92.5%) |
| 35 to 44 Years | 27 (100.0%) | 122 (95.3%) |
| 45 to 54 Years | 27 (65.8%) | 23 (100.0%) |
| 55 to 64 Years | 89 (96.7%) | 88 (88.0%) |
| 65 to 74 Years | 108 (100.0%) | 88 (96.7%) |
| 75 Years and over | 6 (100.0%) | 10 (100.0%) |
| Total | 464 (92.2%) | 490 (94.2%) |
Income Below Poverty Among Married-Couple Families in Fostoria
The poverty statistics for married-couple families in Fostoria show that 1.7% or 4 of the total 233 families live below the poverty line. Families with 1 or 2 children have the highest poverty rate of 22.2%, comprising of 4 families. On the other hand, families with no children have the lowest poverty rate of 0.0%, which includes 0 families.
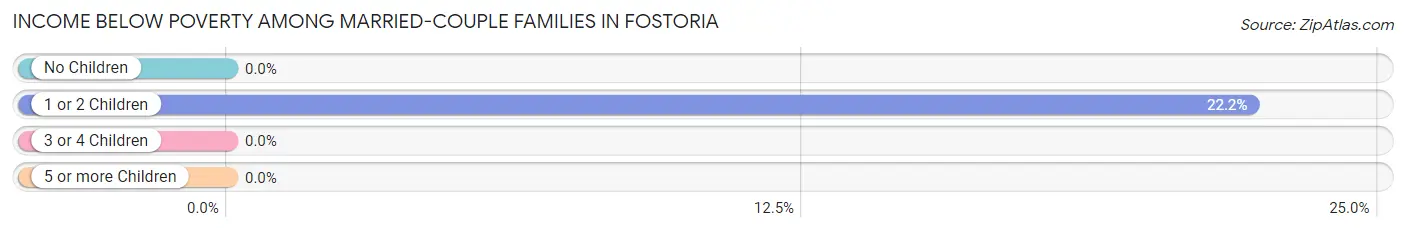
| Children | Above Poverty | Below Poverty |
| No Children | 178 (100.0%) | 0 (0.0%) |
| 1 or 2 Children | 14 (77.8%) | 4 (22.2%) |
| 3 or 4 Children | 37 (100.0%) | 0 (0.0%) |
| 5 or more Children | 0 (0.0%) | 0 (0.0%) |
| Total | 229 (98.3%) | 4 (1.7%) |
Income Below Poverty Among Single-Parent Households in Fostoria
According to the poverty data in Fostoria, 70.0% or 14 single-father households and 23.1% or 3 single-mother households are living below the poverty line. Among single-father households, those with 1 or 2 children have the highest poverty rate, with 14 households (70.0%) experiencing poverty. Likewise, among single-mother households, those with 1 or 2 children have the highest poverty rate, with 3 households (23.1%) falling below the poverty line.
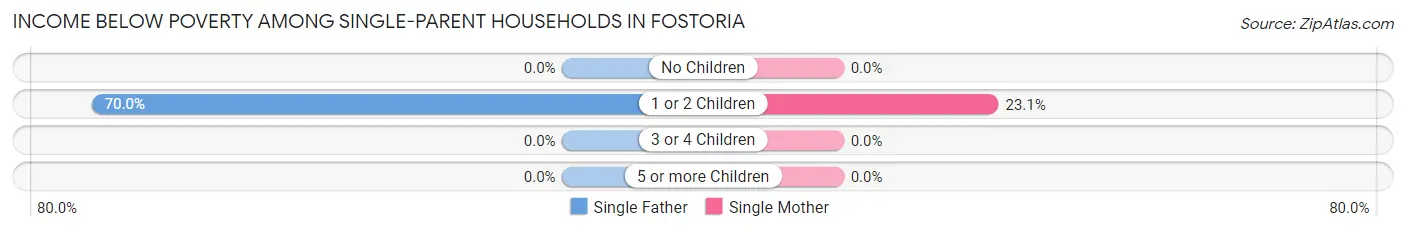
| Children | Single Father | Single Mother |
| No Children | 0 (0.0%) | 0 (0.0%) |
| 1 or 2 Children | 14 (70.0%) | 3 (23.1%) |
| 3 or 4 Children | 0 (0.0%) | 0 (0.0%) |
| 5 or more Children | 0 (0.0%) | 0 (0.0%) |
| Total | 14 (70.0%) | 3 (23.1%) |
Income Below Poverty Among Married-Couple vs Single-Parent Households in Fostoria
The poverty data for Fostoria shows that 4 of the married-couple family households (1.7%) and 17 of the single-parent households (51.5%) are living below the poverty level. Within the married-couple family households, those with 1 or 2 children have the highest poverty rate, with 4 households (22.2%) falling below the poverty line. Among the single-parent households, those with 1 or 2 children have the highest poverty rate, with 17 household (51.5%) living below poverty.
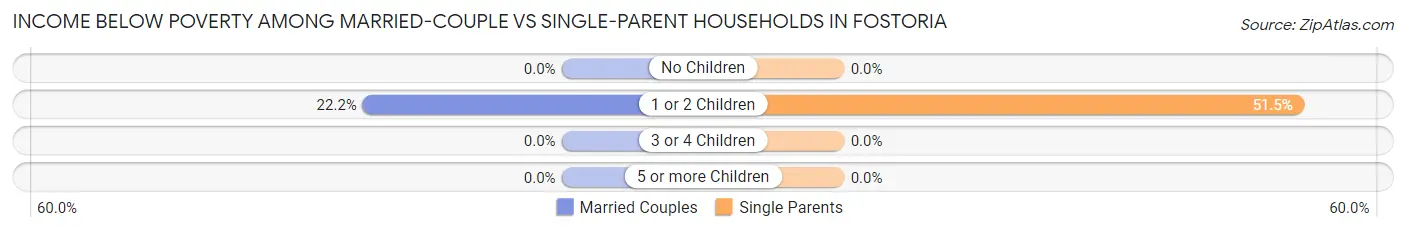
| Children | Married-Couple Families | Single-Parent Households |
| No Children | 0 (0.0%) | 0 (0.0%) |
| 1 or 2 Children | 4 (22.2%) | 17 (51.5%) |
| 3 or 4 Children | 0 (0.0%) | 0 (0.0%) |
| 5 or more Children | 0 (0.0%) | 0 (0.0%) |
| Total | 4 (1.7%) | 17 (51.5%) |
Race in Fostoria
The most populous races in Fostoria are White / Caucasian (976 | 95.4%), Two or more Races (47 | 4.6%), and Hispanic or Latino (16 | 1.6%).
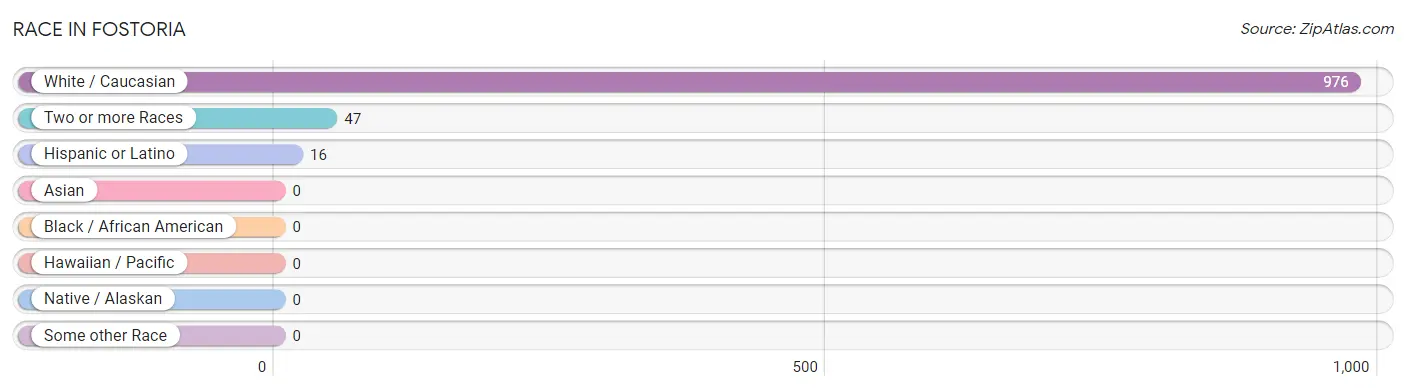
| Race | # Population | % Population |
| Asian | 0 | 0.0% |
| Black / African American | 0 | 0.0% |
| Hawaiian / Pacific | 0 | 0.0% |
| Hispanic or Latino | 16 | 1.6% |
| Native / Alaskan | 0 | 0.0% |
| White / Caucasian | 976 | 95.4% |
| Two or more Races | 47 | 4.6% |
| Some other Race | 0 | 0.0% |
| Total | 1,023 | 100.0% |
Ancestry in Fostoria
The most populous ancestries reported in Fostoria are German (247 | 24.1%), Irish (98 | 9.6%), Finnish (94 | 9.2%), Swedish (94 | 9.2%), and American (87 | 8.5%), together accounting for 60.6% of all Fostoria residents.
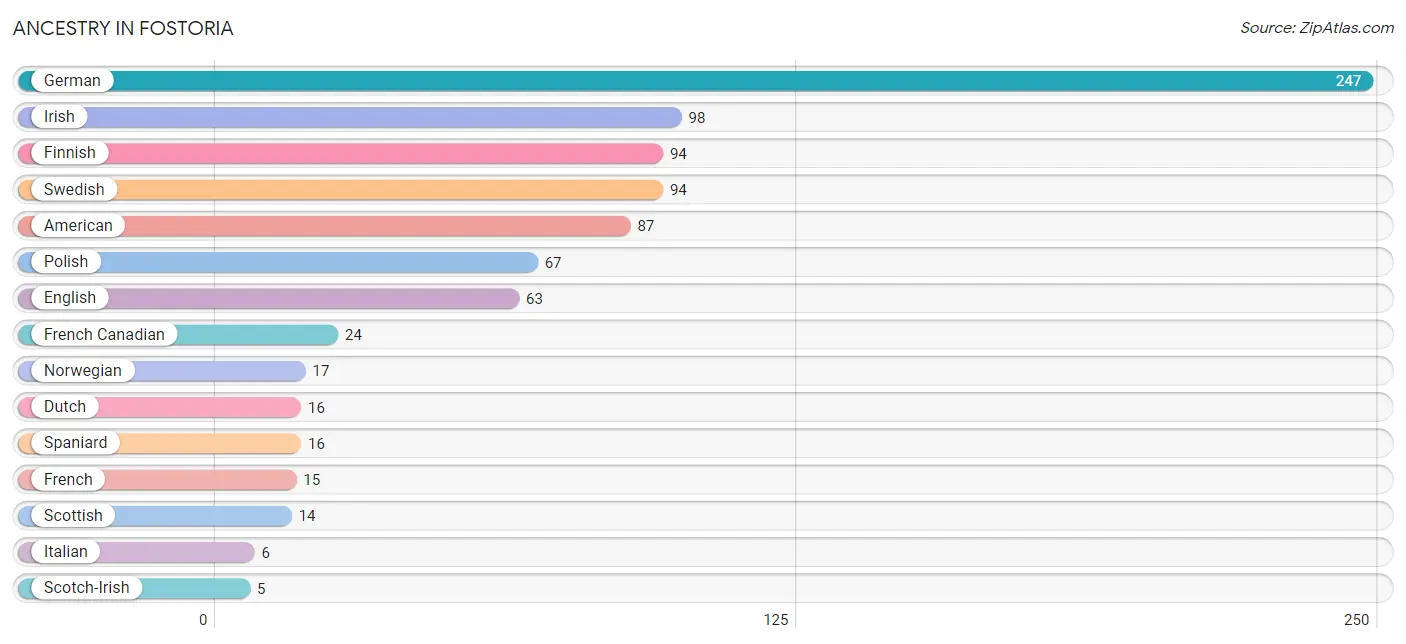
| Ancestry | # Population | % Population |
| American | 87 | 8.5% |
| Canadian | 3 | 0.3% |
| Dutch | 16 | 1.6% |
| English | 63 | 6.2% |
| Finnish | 94 | 9.2% |
| French | 15 | 1.5% |
| French Canadian | 24 | 2.4% |
| German | 247 | 24.1% |
| Irish | 98 | 9.6% |
| Italian | 6 | 0.6% |
| Norwegian | 17 | 1.7% |
| Polish | 67 | 6.6% |
| Scotch-Irish | 5 | 0.5% |
| Scottish | 14 | 1.4% |
| Spaniard | 16 | 1.6% |
| Swedish | 94 | 9.2% | View All 16 Rows |
Immigrants in Fostoria
The most numerous immigrant groups reported in Fostoria came from Europe (4 | 0.4%), Southern Europe (4 | 0.4%), and Spain (4 | 0.4%), together accounting for 1.2% of all Fostoria residents.
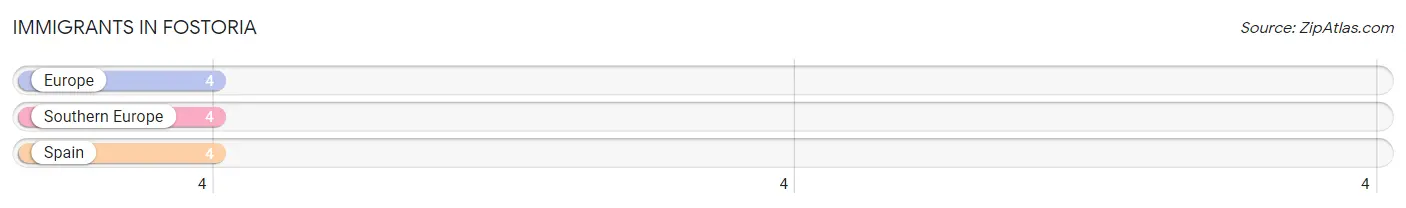
| Immigration Origin | # Population | % Population |
| Europe | 4 | 0.4% |
| Southern Europe | 4 | 0.4% |
| Spain | 4 | 0.4% | View All 3 Rows |
Sex and Age in Fostoria
Sex and Age in Fostoria
The most populous age groups in Fostoria are 70 to 74 Years (93 | 18.5%) for men and 35 to 39 Years (124 | 23.8%) for women.
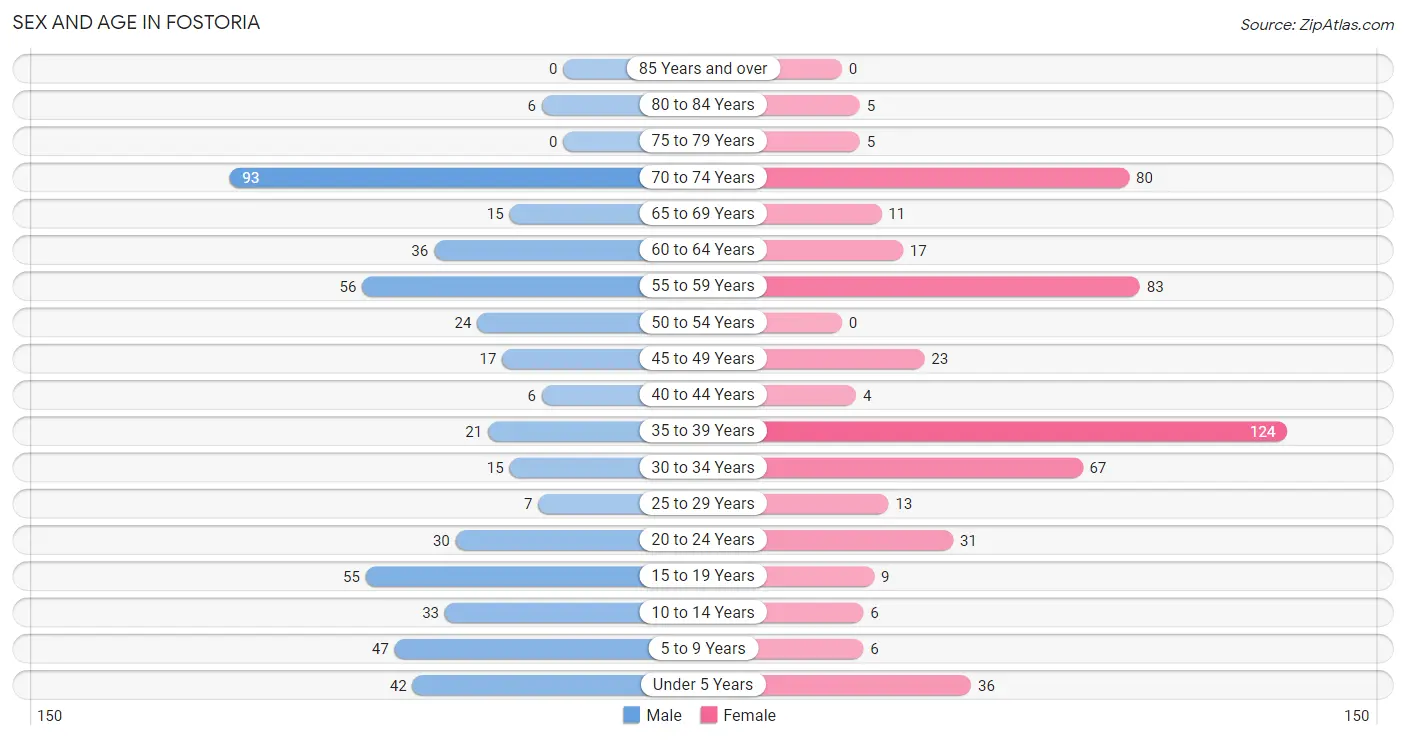
| Age Bracket | Male | Female |
| Under 5 Years | 42 (8.4%) | 36 (6.9%) |
| 5 to 9 Years | 47 (9.3%) | 6 (1.1%) |
| 10 to 14 Years | 33 (6.6%) | 6 (1.1%) |
| 15 to 19 Years | 55 (10.9%) | 9 (1.7%) |
| 20 to 24 Years | 30 (6.0%) | 31 (6.0%) |
| 25 to 29 Years | 7 (1.4%) | 13 (2.5%) |
| 30 to 34 Years | 15 (3.0%) | 67 (12.9%) |
| 35 to 39 Years | 21 (4.2%) | 124 (23.8%) |
| 40 to 44 Years | 6 (1.2%) | 4 (0.8%) |
| 45 to 49 Years | 17 (3.4%) | 23 (4.4%) |
| 50 to 54 Years | 24 (4.8%) | 0 (0.0%) |
| 55 to 59 Years | 56 (11.1%) | 83 (16.0%) |
| 60 to 64 Years | 36 (7.2%) | 17 (3.3%) |
| 65 to 69 Years | 15 (3.0%) | 11 (2.1%) |
| 70 to 74 Years | 93 (18.5%) | 80 (15.4%) |
| 75 to 79 Years | 0 (0.0%) | 5 (1.0%) |
| 80 to 84 Years | 6 (1.2%) | 5 (1.0%) |
| 85 Years and over | 0 (0.0%) | 0 (0.0%) |
| Total | 503 (100.0%) | 520 (100.0%) |
Families and Households in Fostoria
Median Family Size in Fostoria
The median family size in Fostoria is 3.45 persons per family, with married-couple families (233 | 87.6%) accounting for the largest median family size of 3.57 persons per family. On the other hand, single male/father families (20 | 7.5%) represent the smallest median family size with 2.25 persons per family.
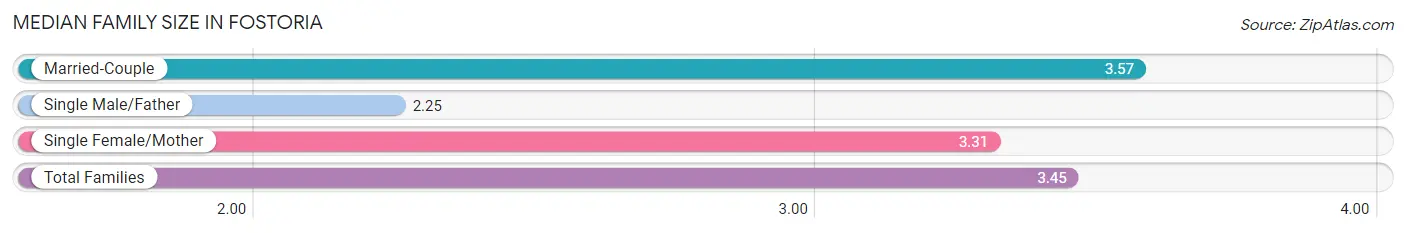
| Family Type | # Families | Family Size |
| Married-Couple | 233 (87.6%) | 3.57 |
| Single Male/Father | 20 (7.5%) | 2.25 |
| Single Female/Mother | 13 (4.9%) | 3.31 |
| Total Families | 266 (100.0%) | 3.45 |
Median Household Size in Fostoria
The median household size in Fostoria is 3.03 persons per household, with single female/mother households (13 | 3.8%) accounting for the largest median household size of 4.23 persons per household. non-family households (72 | 21.3%) represent the smallest median household size with 1.08 persons per household.
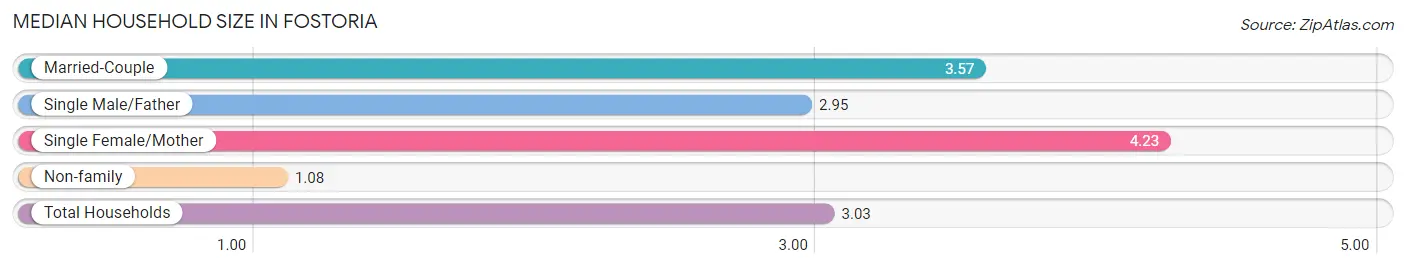
| Household Type | # Households | Household Size |
| Married-Couple | 233 (68.9%) | 3.57 |
| Single Male/Father | 20 (5.9%) | 2.95 |
| Single Female/Mother | 13 (3.8%) | 4.23 |
| Non-family | 72 (21.3%) | 1.08 |
| Total Households | 338 (100.0%) | 3.03 |
Household Size by Marriage Status in Fostoria
Out of a total of 338 households in Fostoria, 266 (78.7%) are family households, while 72 (21.3%) are nonfamily households. The most numerous type of family households are 3-person households, comprising 145, and the most common type of nonfamily households are 1-person households, comprising 66.
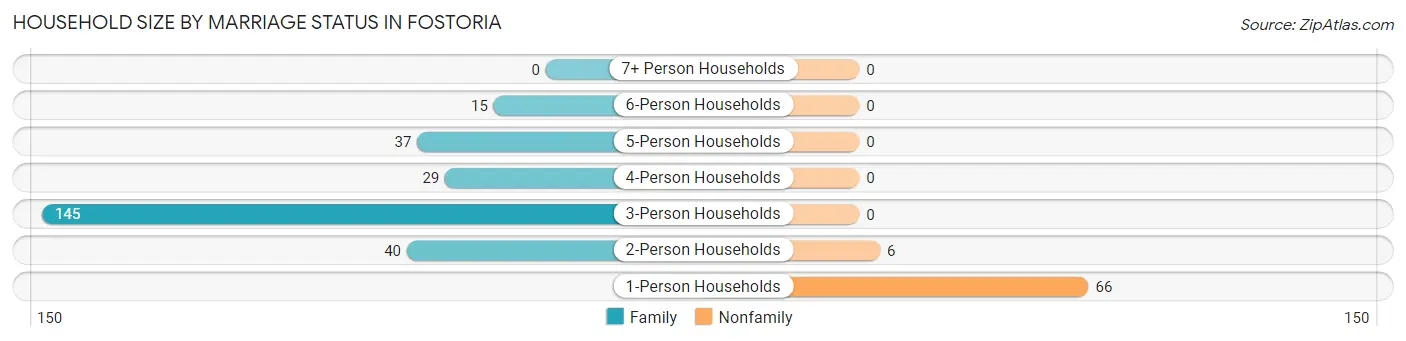
| Household Size | Family Households | Nonfamily Households |
| 1-Person Households | - | 66 (19.5%) |
| 2-Person Households | 40 (11.8%) | 6 (1.8%) |
| 3-Person Households | 145 (42.9%) | 0 (0.0%) |
| 4-Person Households | 29 (8.6%) | 0 (0.0%) |
| 5-Person Households | 37 (11.0%) | 0 (0.0%) |
| 6-Person Households | 15 (4.4%) | 0 (0.0%) |
| 7+ Person Households | 0 (0.0%) | 0 (0.0%) |
| Total | 266 (78.7%) | 72 (21.3%) |
Female Fertility in Fostoria
Fertility by Age in Fostoria
Average fertility rate in Fostoria is 70.0 births per 1,000 women. Women in the age bracket of 20 to 34 years have the highest fertility rate with 171.0 births per 1,000 women. Women in the age bracket of 20 to 34 years acount for 100.0% of all women with births.
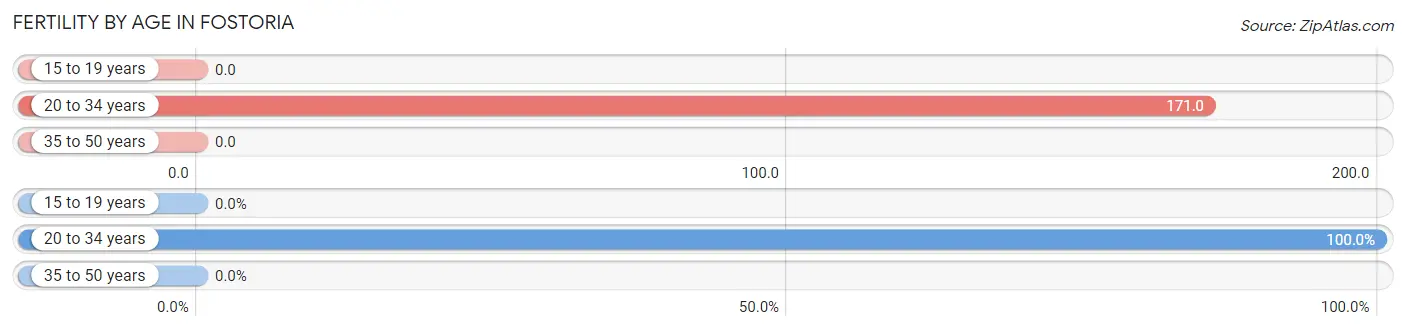
| Age Bracket | Women with Births | Births / 1,000 Women |
| 15 to 19 years | 0 (0.0%) | 0.0 |
| 20 to 34 years | 19 (100.0%) | 171.0 |
| 35 to 50 years | 0 (0.0%) | 0.0 |
| Total | 19 (100.0%) | 70.0 |
Fertility by Age by Marriage Status in Fostoria
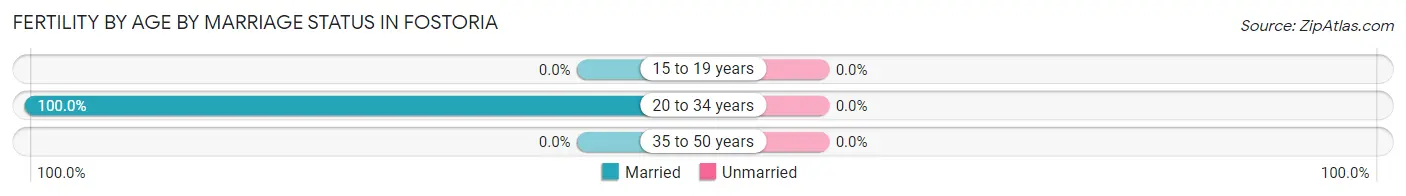
| Age Bracket | Married | Unmarried |
| 15 to 19 years | 0 (0.0%) | 0 (0.0%) |
| 20 to 34 years | 19 (100.0%) | 0 (0.0%) |
| 35 to 50 years | 0 (0.0%) | 0 (0.0%) |
| Total | 19 (100.0%) | 0 (0.0%) |
Fertility by Education in Fostoria
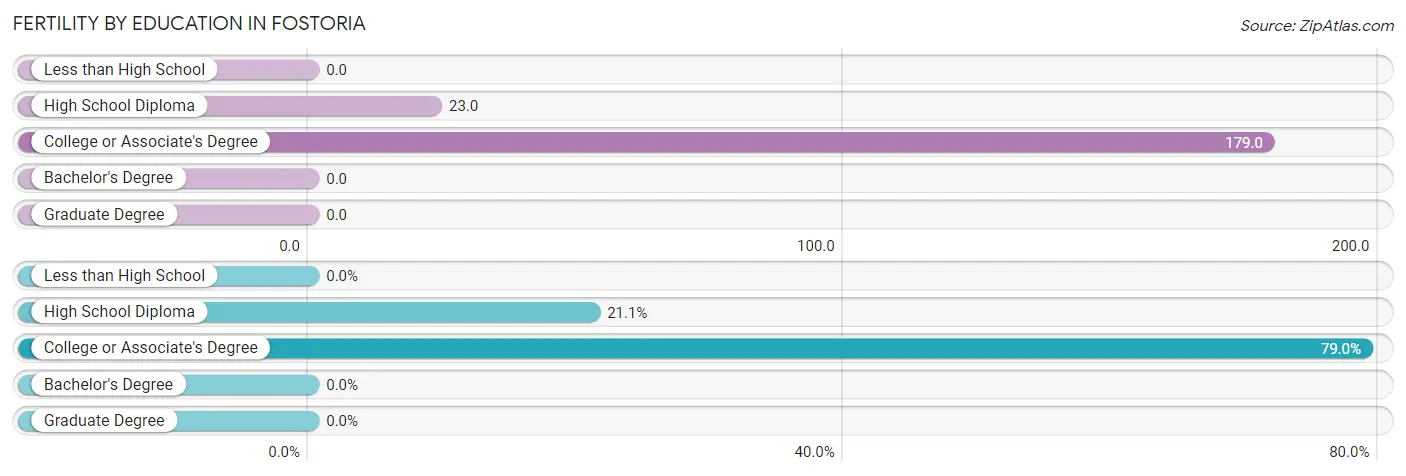
| Educational Attainment | Women with Births | Births / 1,000 Women |
| Less than High School | 0 (0.0%) | 0.0 |
| High School Diploma | 4 (21.0%) | 23.0 |
| College or Associate's Degree | 15 (78.9%) | 179.0 |
| Bachelor's Degree | 0 (0.0%) | 0.0 |
| Graduate Degree | 0 (0.0%) | 0.0 |
| Total | 19 (100.0%) | 70.0 |
Fertility by Education by Marriage Status in Fostoria
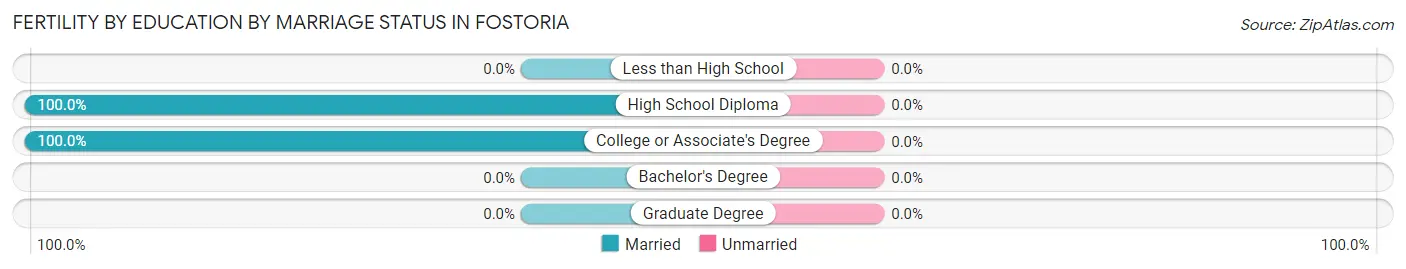
| Educational Attainment | Married | Unmarried |
| Less than High School | 0 (0.0%) | 0 (0.0%) |
| High School Diploma | 4 (100.0%) | 0 (0.0%) |
| College or Associate's Degree | 15 (100.0%) | 0 (0.0%) |
| Bachelor's Degree | 0 (0.0%) | 0 (0.0%) |
| Graduate Degree | 0 (0.0%) | 0 (0.0%) |
| Total | 19 (100.0%) | 0 (0.0%) |
Employment Characteristics in Fostoria
Employment by Class of Employer in Fostoria
Among the 519 employed individuals in Fostoria, private company employees (343 | 66.1%), self-employed (not incorporated) (63 | 12.1%), and not-for-profit organizations (41 | 7.9%) make up the most common classes of employment.
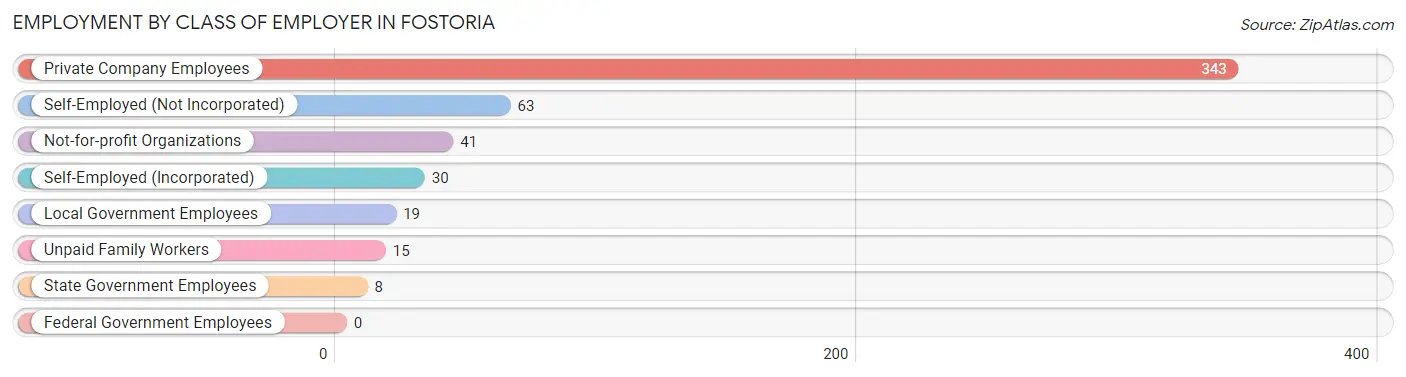
| Employer Class | # Employees | % Employees |
| Private Company Employees | 343 | 66.1% |
| Self-Employed (Incorporated) | 30 | 5.8% |
| Self-Employed (Not Incorporated) | 63 | 12.1% |
| Not-for-profit Organizations | 41 | 7.9% |
| Local Government Employees | 19 | 3.7% |
| State Government Employees | 8 | 1.5% |
| Federal Government Employees | 0 | 0.0% |
| Unpaid Family Workers | 15 | 2.9% |
| Total | 519 | 100.0% |
Employment Status by Age in Fostoria
According to the labor force statistics for Fostoria, out of the total population over 16 years of age (843), 67.7% or 571 individuals are in the labor force, with 7.2% or 41 of them unemployed. The age group with the highest labor force participation rate is 16 to 19 years, with 100.0% or 54 individuals in the labor force. Within the labor force, the 20 to 24 years age range has the highest percentage of unemployed individuals, with 42.6% or 26 of them being unemployed.
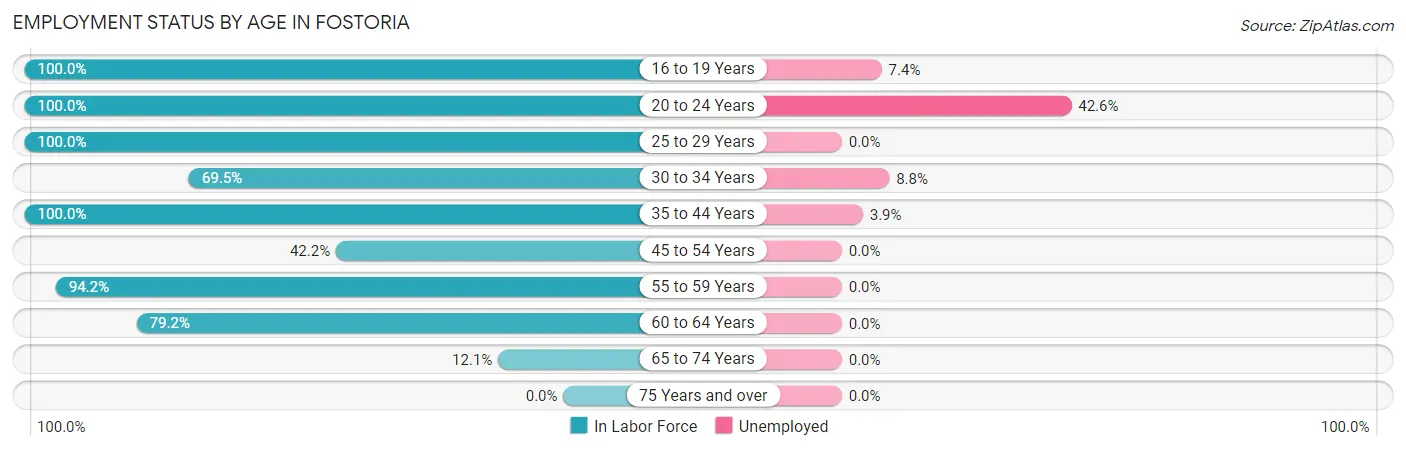
| Age Bracket | In Labor Force | Unemployed |
| 16 to 19 Years | 54 (100.0%) | 4 (7.4%) |
| 20 to 24 Years | 61 (100.0%) | 26 (42.6%) |
| 25 to 29 Years | 20 (100.0%) | 0 (0.0%) |
| 30 to 34 Years | 57 (69.5%) | 5 (8.8%) |
| 35 to 44 Years | 155 (100.0%) | 6 (3.9%) |
| 45 to 54 Years | 27 (42.2%) | 0 (0.0%) |
| 55 to 59 Years | 131 (94.2%) | 0 (0.0%) |
| 60 to 64 Years | 42 (79.2%) | 0 (0.0%) |
| 65 to 74 Years | 24 (12.1%) | 0 (0.0%) |
| 75 Years and over | 0 (0.0%) | 0 (0.0%) |
| Total | 571 (67.7%) | 41 (7.2%) |
Employment Status by Educational Attainment in Fostoria
According to labor force statistics for Fostoria, 84.2% of individuals (432) out of the total population between 25 and 64 years of age (513) are in the labor force, with 2.5% or 11 of them being unemployed. The group with the highest labor force participation rate are those with the educational attainment of bachelor's degree or higher, with 100.0% or 55 individuals in the labor force. Within the labor force, individuals with bachelor's degree or higher education have the highest percentage of unemployment, with 20.0% or 11 of them being unemployed.
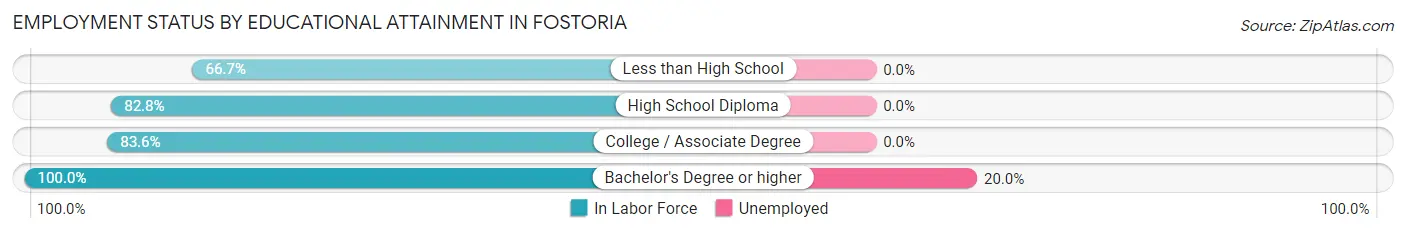
| Educational Attainment | In Labor Force | Unemployed |
| Less than High School | 14 (66.7%) | 0 (0.0%) |
| High School Diploma | 256 (82.8%) | 0 (0.0%) |
| College / Associate Degree | 107 (83.6%) | 0 (0.0%) |
| Bachelor's Degree or higher | 55 (100.0%) | 11 (20.0%) |
| Total | 432 (84.2%) | 13 (2.5%) |
Employment Occupations by Sex in Fostoria
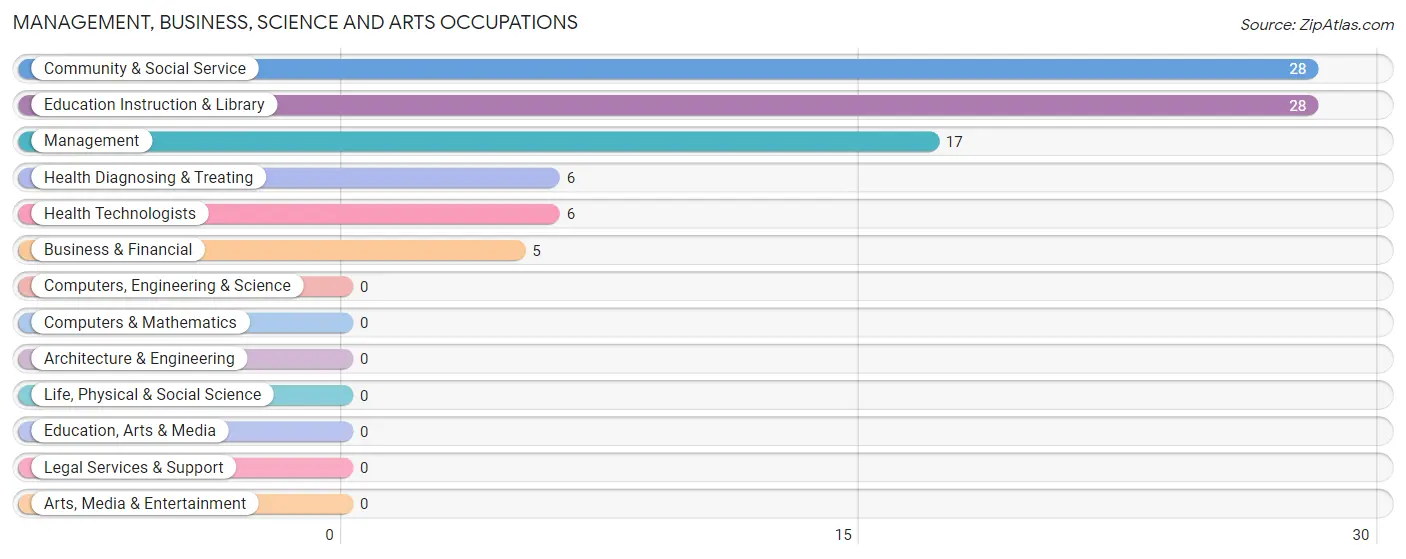
Management, Business, Science and Arts Occupations
The most common Management, Business, Science and Arts occupations in Fostoria are Community & Social Service (28 | 5.3%), Education Instruction & Library (28 | 5.3%), Management (17 | 3.2%), Health Diagnosing & Treating (6 | 1.1%), and Health Technologists (6 | 1.1%).
Management, Business, Science and Arts Occupations by Sex
Within the Management, Business, Science and Arts occupations in Fostoria, the most male-oriented occupations are Business & Financial (100.0%), Health Diagnosing & Treating (100.0%), and Health Technologists (100.0%), while the most female-oriented occupations are Community & Social Service (78.6%), Education Instruction & Library (78.6%), and Management (76.5%).
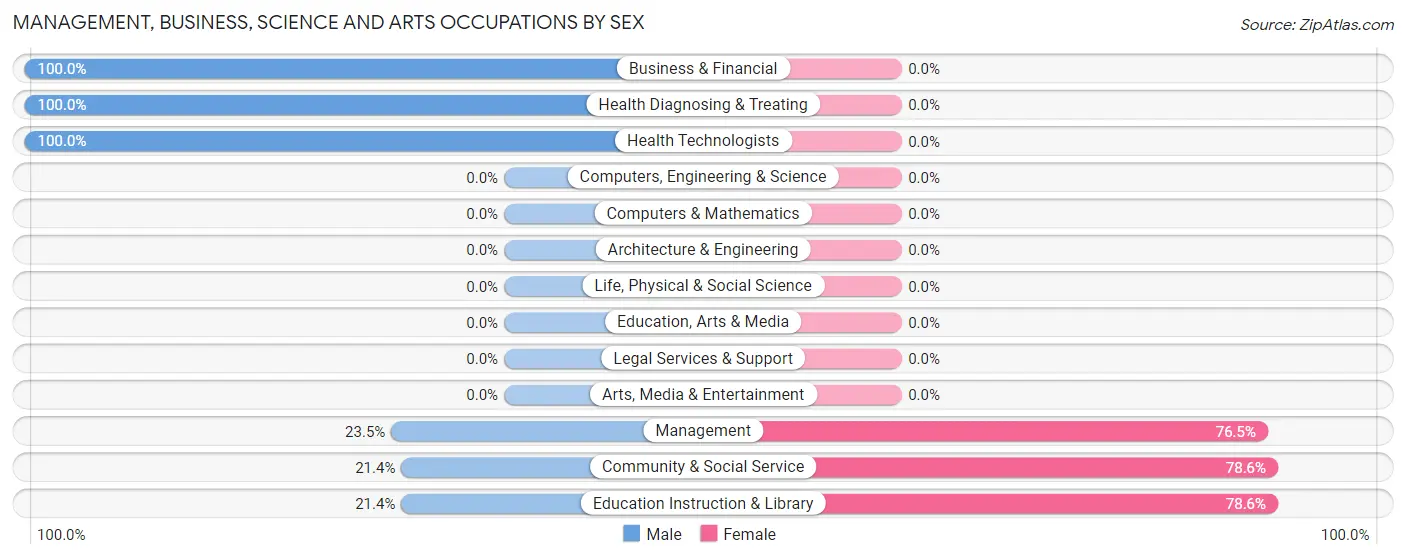
| Occupation | Male | Female |
| Management | 4 (23.5%) | 13 (76.5%) |
| Business & Financial | 5 (100.0%) | 0 (0.0%) |
| Computers, Engineering & Science | 0 (0.0%) | 0 (0.0%) |
| Computers & Mathematics | 0 (0.0%) | 0 (0.0%) |
| Architecture & Engineering | 0 (0.0%) | 0 (0.0%) |
| Life, Physical & Social Science | 0 (0.0%) | 0 (0.0%) |
| Community & Social Service | 6 (21.4%) | 22 (78.6%) |
| Education, Arts & Media | 0 (0.0%) | 0 (0.0%) |
| Legal Services & Support | 0 (0.0%) | 0 (0.0%) |
| Education Instruction & Library | 6 (21.4%) | 22 (78.6%) |
| Arts, Media & Entertainment | 0 (0.0%) | 0 (0.0%) |
| Health Diagnosing & Treating | 6 (100.0%) | 0 (0.0%) |
| Health Technologists | 6 (100.0%) | 0 (0.0%) |
| Total (Category) | 21 (37.5%) | 35 (62.5%) |
| Total (Overall) | 210 (39.6%) | 320 (60.4%) |
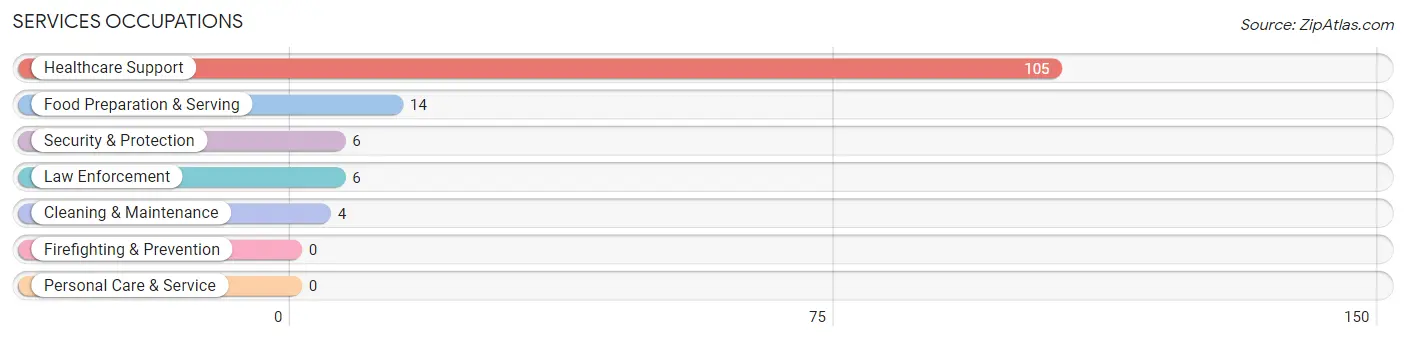
Services Occupations
The most common Services occupations in Fostoria are Healthcare Support (105 | 19.8%), Food Preparation & Serving (14 | 2.6%), Security & Protection (6 | 1.1%), Law Enforcement (6 | 1.1%), and Cleaning & Maintenance (4 | 0.7%).
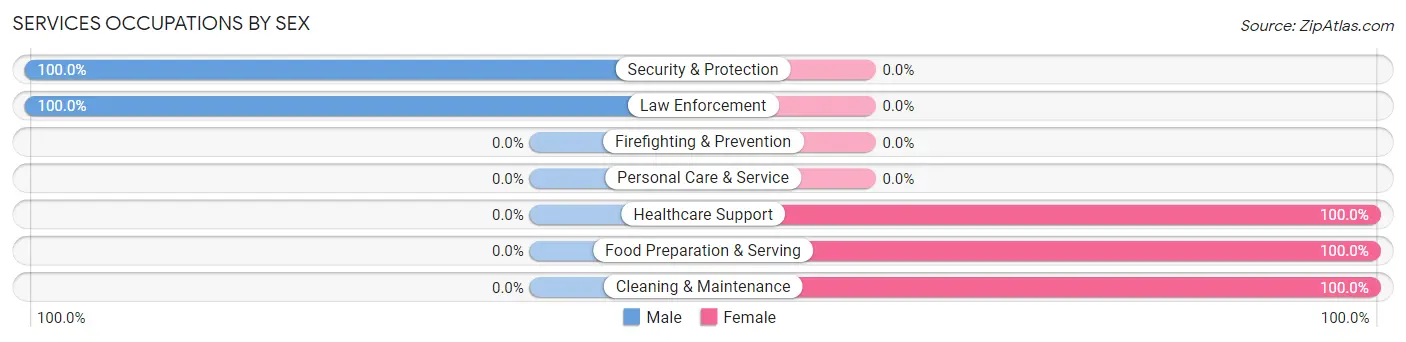
Services Occupations by Sex
Within the Services occupations in Fostoria, the most male-oriented occupations are Security & Protection (100.0%), and Law Enforcement (100.0%), while the most female-oriented occupations are Healthcare Support (100.0%), Food Preparation & Serving (100.0%), and Cleaning & Maintenance (100.0%).
| Occupation | Male | Female |
| Healthcare Support | 0 (0.0%) | 105 (100.0%) |
| Security & Protection | 6 (100.0%) | 0 (0.0%) |
| Firefighting & Prevention | 0 (0.0%) | 0 (0.0%) |
| Law Enforcement | 6 (100.0%) | 0 (0.0%) |
| Food Preparation & Serving | 0 (0.0%) | 14 (100.0%) |
| Cleaning & Maintenance | 0 (0.0%) | 4 (100.0%) |
| Personal Care & Service | 0 (0.0%) | 0 (0.0%) |
| Total (Category) | 6 (4.6%) | 123 (95.4%) |
| Total (Overall) | 210 (39.6%) | 320 (60.4%) |
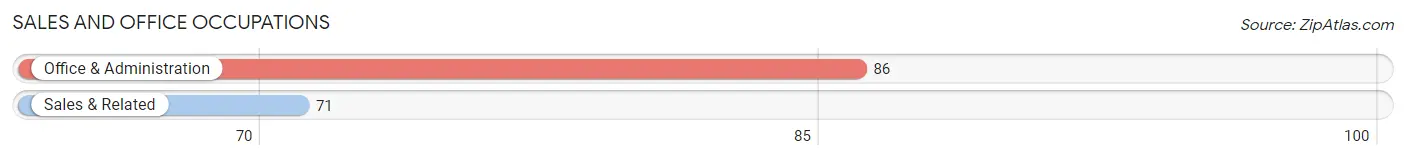
Sales and Office Occupations
The most common Sales and Office occupations in Fostoria are Office & Administration (86 | 16.2%), and Sales & Related (71 | 13.4%).
Sales and Office Occupations by Sex
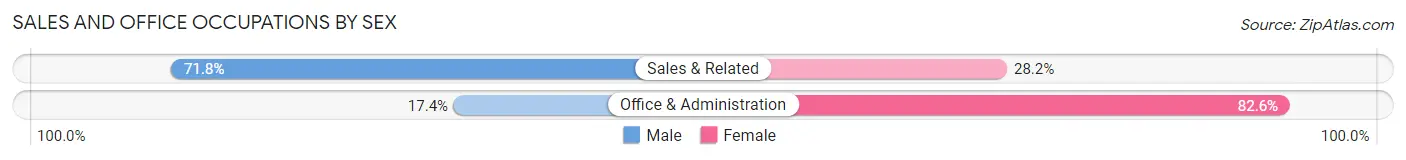
| Occupation | Male | Female |
| Sales & Related | 51 (71.8%) | 20 (28.2%) |
| Office & Administration | 15 (17.4%) | 71 (82.6%) |
| Total (Category) | 66 (42.0%) | 91 (58.0%) |
| Total (Overall) | 210 (39.6%) | 320 (60.4%) |
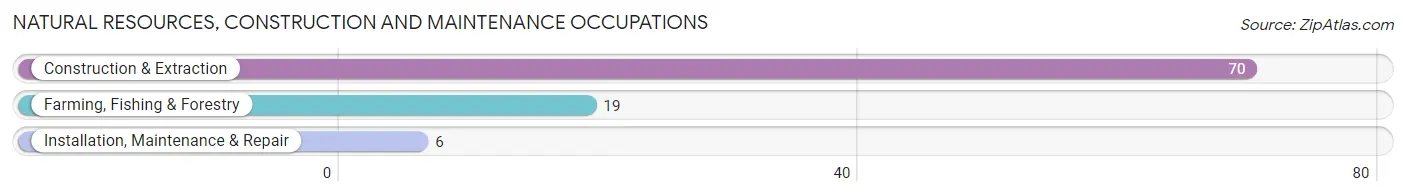
Natural Resources, Construction and Maintenance Occupations
The most common Natural Resources, Construction and Maintenance occupations in Fostoria are Construction & Extraction (70 | 13.2%), Farming, Fishing & Forestry (19 | 3.6%), and Installation, Maintenance & Repair (6 | 1.1%).
Natural Resources, Construction and Maintenance Occupations by Sex
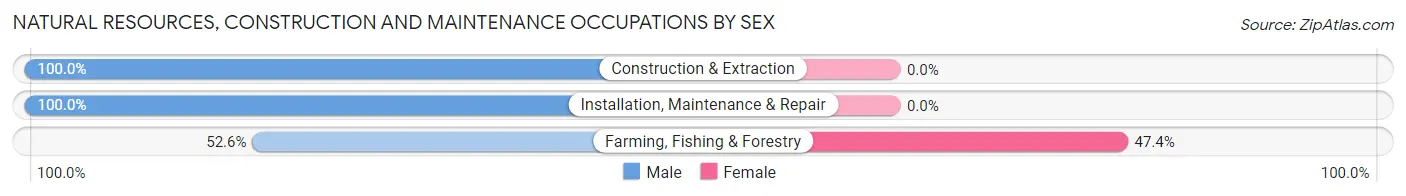
| Occupation | Male | Female |
| Farming, Fishing & Forestry | 10 (52.6%) | 9 (47.4%) |
| Construction & Extraction | 70 (100.0%) | 0 (0.0%) |
| Installation, Maintenance & Repair | 6 (100.0%) | 0 (0.0%) |
| Total (Category) | 86 (90.5%) | 9 (9.5%) |
| Total (Overall) | 210 (39.6%) | 320 (60.4%) |
Production, Transportation and Moving Occupations
The most common Production, Transportation and Moving occupations in Fostoria are Production (58 | 10.9%), Material Moving (25 | 4.7%), and Transportation (10 | 1.9%).
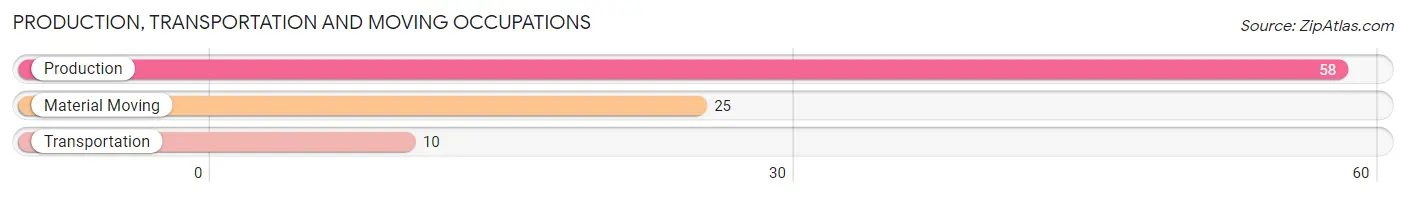
Production, Transportation and Moving Occupations by Sex
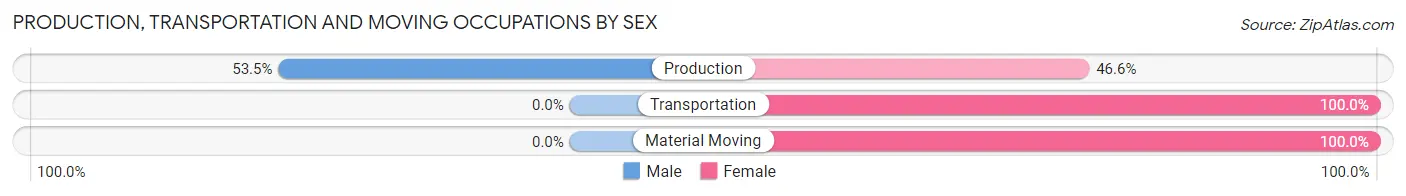
| Occupation | Male | Female |
| Production | 31 (53.4%) | 27 (46.6%) |
| Transportation | 0 (0.0%) | 10 (100.0%) |
| Material Moving | 0 (0.0%) | 25 (100.0%) |
| Total (Category) | 31 (33.3%) | 62 (66.7%) |
| Total (Overall) | 210 (39.6%) | 320 (60.4%) |
Employment Industries by Sex in Fostoria
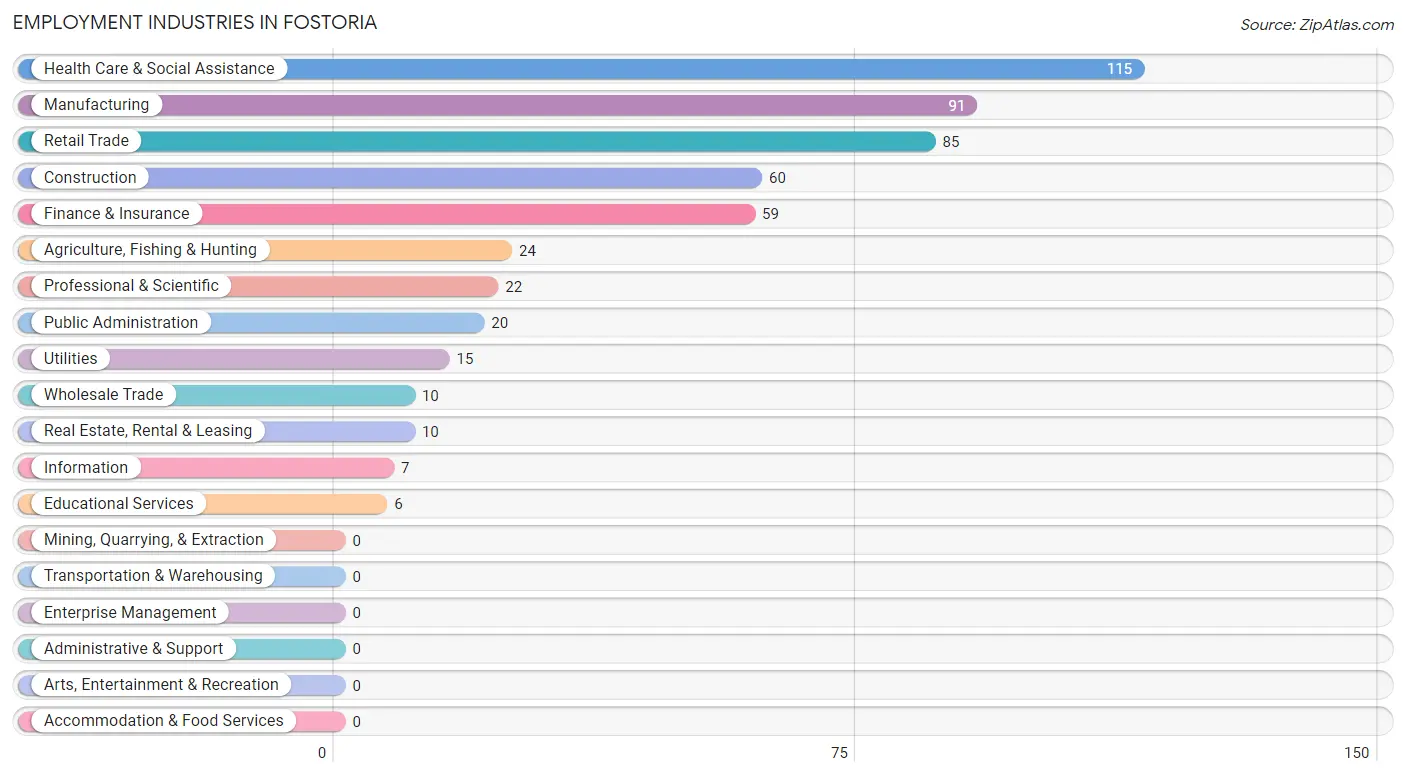
Employment Industries in Fostoria
The major employment industries in Fostoria include Health Care & Social Assistance (115 | 21.7%), Manufacturing (91 | 17.2%), Retail Trade (85 | 16.0%), Construction (60 | 11.3%), and Finance & Insurance (59 | 11.1%).
Employment Industries by Sex in Fostoria
The Fostoria industries that see more men than women are Construction (100.0%), Educational Services (100.0%), and Professional & Scientific (68.2%), whereas the industries that tend to have a higher number of women are Wholesale Trade (100.0%), Utilities (100.0%), and Information (100.0%).
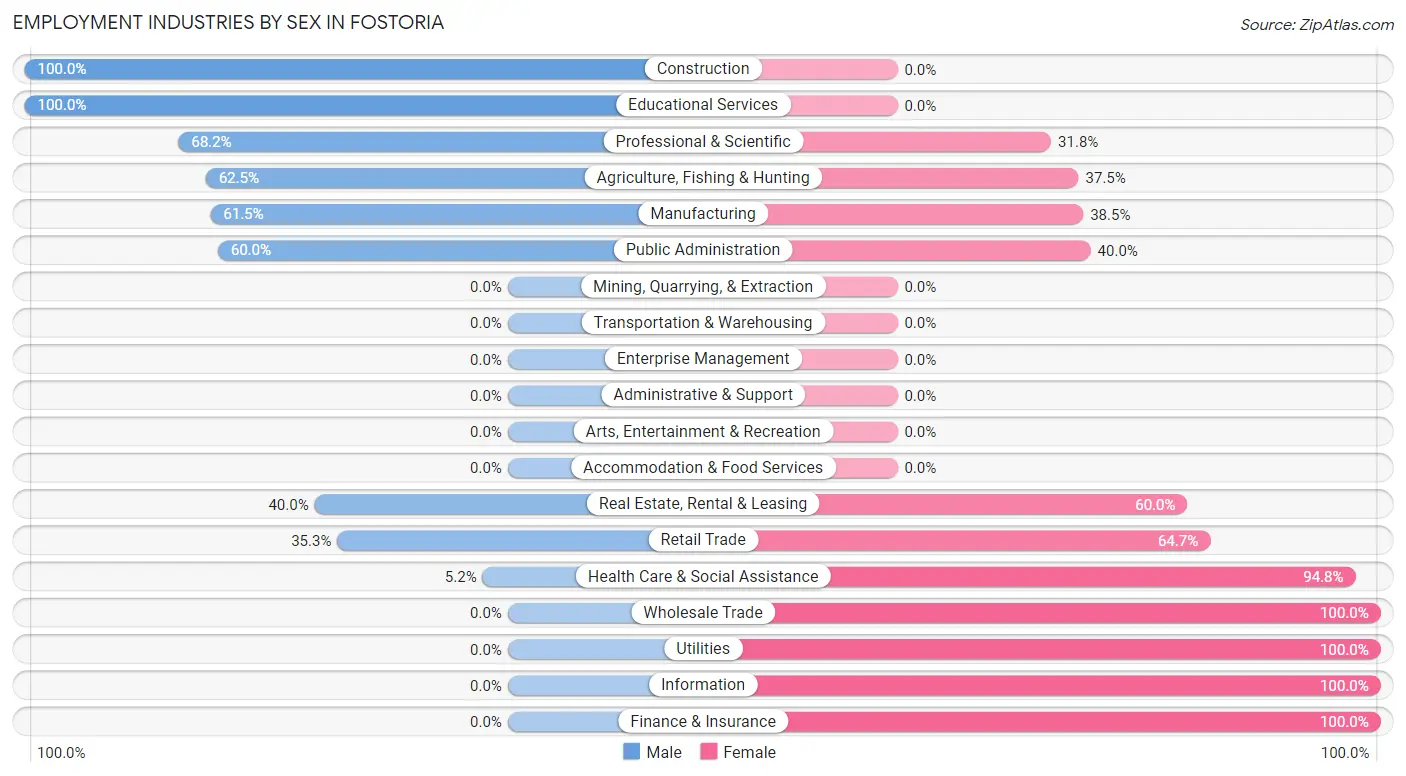
| Industry | Male | Female |
| Agriculture, Fishing & Hunting | 15 (62.5%) | 9 (37.5%) |
| Mining, Quarrying, & Extraction | 0 (0.0%) | 0 (0.0%) |
| Construction | 60 (100.0%) | 0 (0.0%) |
| Manufacturing | 56 (61.5%) | 35 (38.5%) |
| Wholesale Trade | 0 (0.0%) | 10 (100.0%) |
| Retail Trade | 30 (35.3%) | 55 (64.7%) |
| Transportation & Warehousing | 0 (0.0%) | 0 (0.0%) |
| Utilities | 0 (0.0%) | 15 (100.0%) |
| Information | 0 (0.0%) | 7 (100.0%) |
| Finance & Insurance | 0 (0.0%) | 59 (100.0%) |
| Real Estate, Rental & Leasing | 4 (40.0%) | 6 (60.0%) |
| Professional & Scientific | 15 (68.2%) | 7 (31.8%) |
| Enterprise Management | 0 (0.0%) | 0 (0.0%) |
| Administrative & Support | 0 (0.0%) | 0 (0.0%) |
| Educational Services | 6 (100.0%) | 0 (0.0%) |
| Health Care & Social Assistance | 6 (5.2%) | 109 (94.8%) |
| Arts, Entertainment & Recreation | 0 (0.0%) | 0 (0.0%) |
| Accommodation & Food Services | 0 (0.0%) | 0 (0.0%) |
| Public Administration | 12 (60.0%) | 8 (40.0%) |
| Total | 210 (39.6%) | 320 (60.4%) |
Education in Fostoria
School Enrollment in Fostoria
The most common levels of schooling among the 234 students in Fostoria are college / undergraduate (72 | 30.8%), high school (48 | 20.5%), and elementary school (42 | 17.9%).
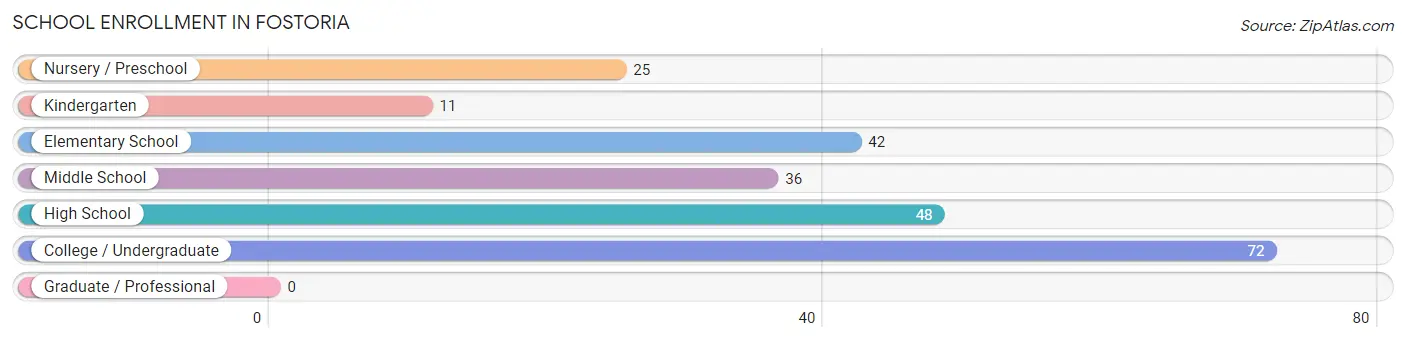
| School Level | # Students | % Students |
| Nursery / Preschool | 25 | 10.7% |
| Kindergarten | 11 | 4.7% |
| Elementary School | 42 | 17.9% |
| Middle School | 36 | 15.4% |
| High School | 48 | 20.5% |
| College / Undergraduate | 72 | 30.8% |
| Graduate / Professional | 0 | 0.0% |
| Total | 234 | 100.0% |
School Enrollment by Age by Funding Source in Fostoria
Out of a total of 234 students who are enrolled in schools in Fostoria, 27 (11.5%) attend a private institution, while the remaining 207 (88.5%) are enrolled in public schools. The age group of 3 to 4 year olds has the highest likelihood of being enrolled in private schools, with 16 (64.0% in the age bracket) enrolled. Conversely, the age group of 5 to 9 year old has the lowest likelihood of being enrolled in a private school, with 53 (100.0% in the age bracket) attending a public institution.
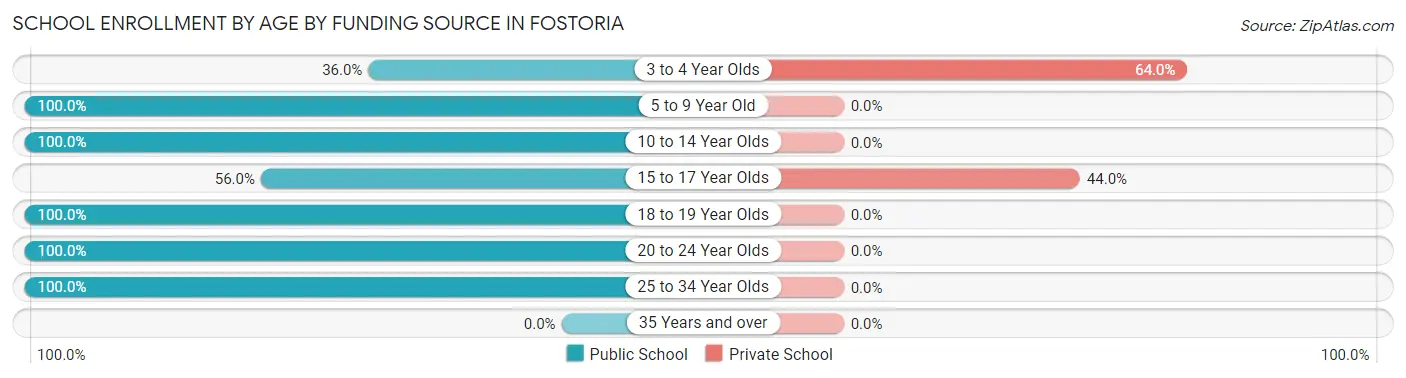
| Age Bracket | Public School | Private School |
| 3 to 4 Year Olds | 9 (36.0%) | 16 (64.0%) |
| 5 to 9 Year Old | 53 (100.0%) | 0 (0.0%) |
| 10 to 14 Year Olds | 39 (100.0%) | 0 (0.0%) |
| 15 to 17 Year Olds | 14 (56.0%) | 11 (44.0%) |
| 18 to 19 Year Olds | 20 (100.0%) | 0 (0.0%) |
| 20 to 24 Year Olds | 57 (100.0%) | 0 (0.0%) |
| 25 to 34 Year Olds | 15 (100.0%) | 0 (0.0%) |
| 35 Years and over | 0 (0.0%) | 0 (0.0%) |
| Total | 207 (88.5%) | 27 (11.5%) |
Educational Attainment by Field of Study in Fostoria
Arts & humanities (32 | 39.5%), business (26 | 32.1%), education (11 | 13.6%), psychology (7 | 8.6%), and computers & mathematics (5 | 6.2%) are the most common fields of study among 81 individuals in Fostoria who have obtained a bachelor's degree or higher.
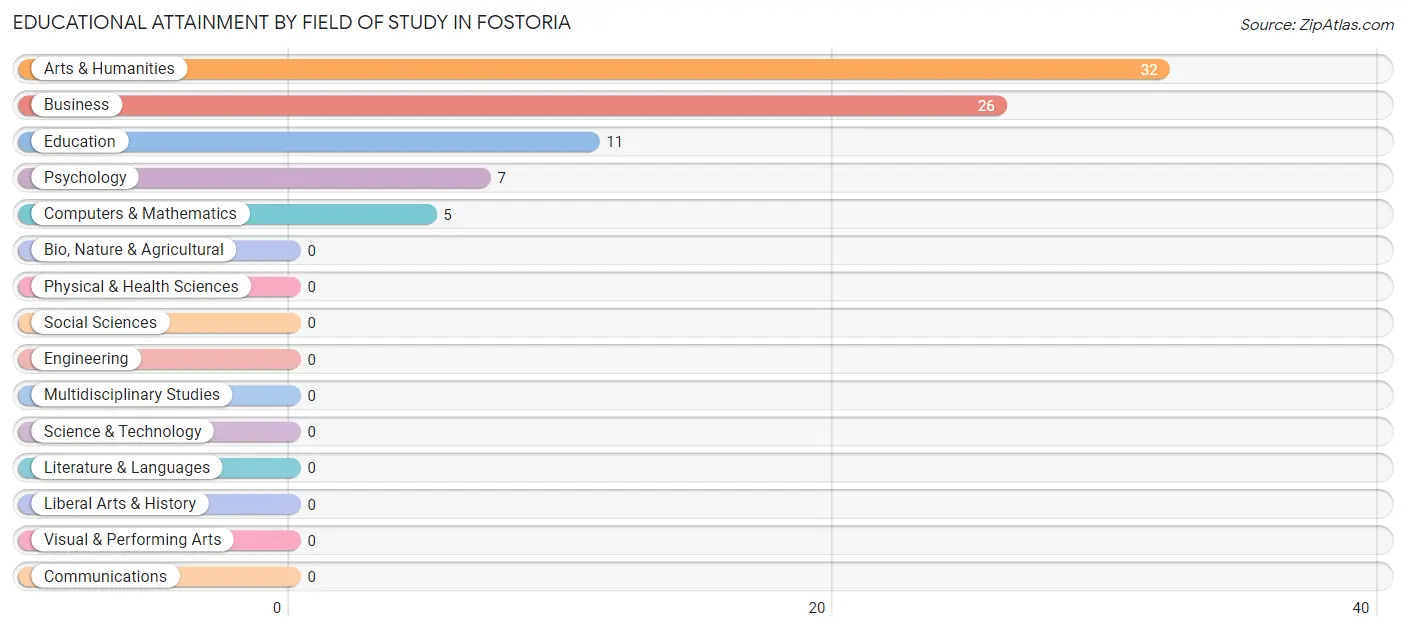
| Field of Study | # Graduates | % Graduates |
| Computers & Mathematics | 5 | 6.2% |
| Bio, Nature & Agricultural | 0 | 0.0% |
| Physical & Health Sciences | 0 | 0.0% |
| Psychology | 7 | 8.6% |
| Social Sciences | 0 | 0.0% |
| Engineering | 0 | 0.0% |
| Multidisciplinary Studies | 0 | 0.0% |
| Science & Technology | 0 | 0.0% |
| Business | 26 | 32.1% |
| Education | 11 | 13.6% |
| Literature & Languages | 0 | 0.0% |
| Liberal Arts & History | 0 | 0.0% |
| Visual & Performing Arts | 0 | 0.0% |
| Communications | 0 | 0.0% |
| Arts & Humanities | 32 | 39.5% |
| Total | 81 | 100.0% |
Transportation & Commute in Fostoria
Vehicle Availability by Sex in Fostoria
The most prevalent vehicle ownership categories in Fostoria are males with 3 vehicles (71, accounting for 35.7%) and females with 3 vehicles (164, making up 22.2%).
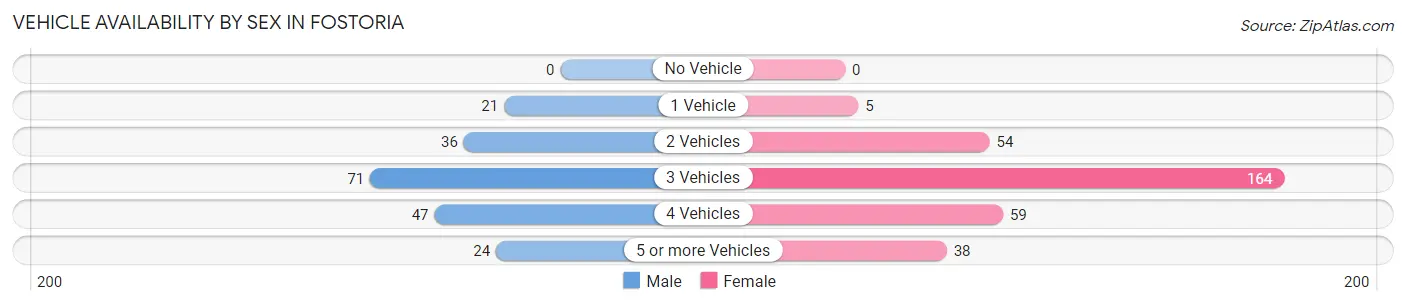
| Vehicles Available | Male | Female |
| No Vehicle | 0 (0.0%) | 0 (0.0%) |
| 1 Vehicle | 21 (10.5%) | 5 (1.6%) |
| 2 Vehicles | 36 (18.1%) | 54 (16.9%) |
| 3 Vehicles | 71 (35.7%) | 164 (51.2%) |
| 4 Vehicles | 47 (23.6%) | 59 (18.4%) |
| 5 or more Vehicles | 24 (12.1%) | 38 (11.9%) |
| Total | 199 (100.0%) | 320 (100.0%) |
Commute Time in Fostoria
The most frequently occuring commute durations in Fostoria are 15 to 19 minutes (155 commuters, 30.4%), 30 to 34 minutes (98 commuters, 19.2%), and 25 to 29 minutes (62 commuters, 12.2%).
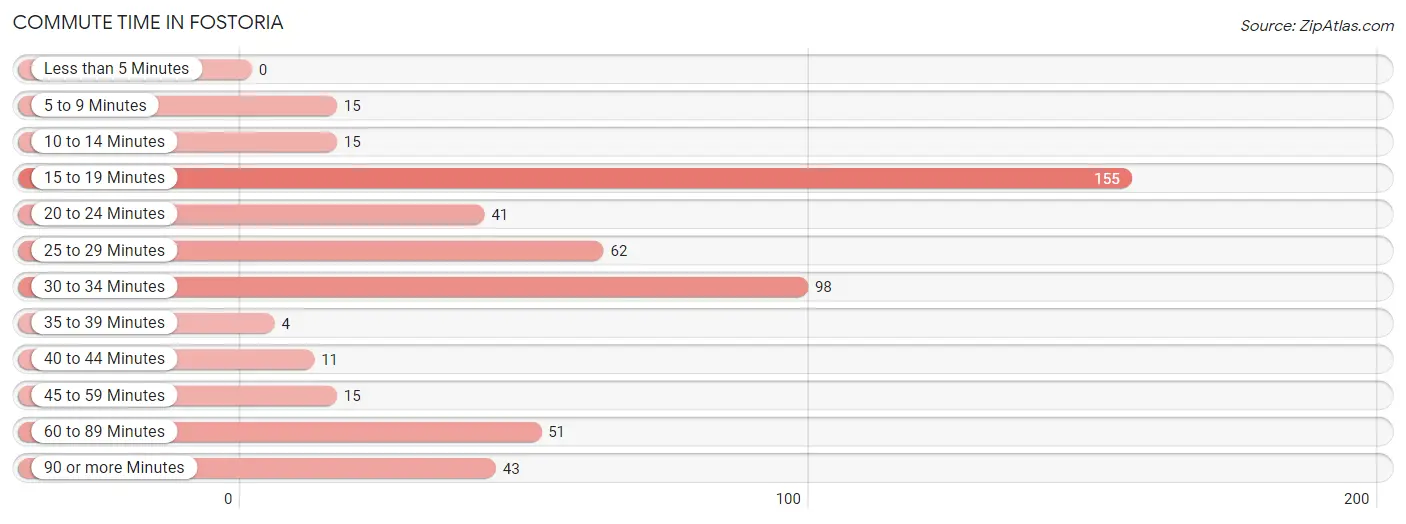
| Commute Time | # Commuters | % Commuters |
| Less than 5 Minutes | 0 | 0.0% |
| 5 to 9 Minutes | 15 | 2.9% |
| 10 to 14 Minutes | 15 | 2.9% |
| 15 to 19 Minutes | 155 | 30.4% |
| 20 to 24 Minutes | 41 | 8.0% |
| 25 to 29 Minutes | 62 | 12.2% |
| 30 to 34 Minutes | 98 | 19.2% |
| 35 to 39 Minutes | 4 | 0.8% |
| 40 to 44 Minutes | 11 | 2.2% |
| 45 to 59 Minutes | 15 | 2.9% |
| 60 to 89 Minutes | 51 | 10.0% |
| 90 or more Minutes | 43 | 8.4% |
Commute Time by Sex in Fostoria
The most common commute times in Fostoria are 90 or more minutes (43 commuters, 22.2%) for males and 15 to 19 minutes (155 commuters, 49.0%) for females.
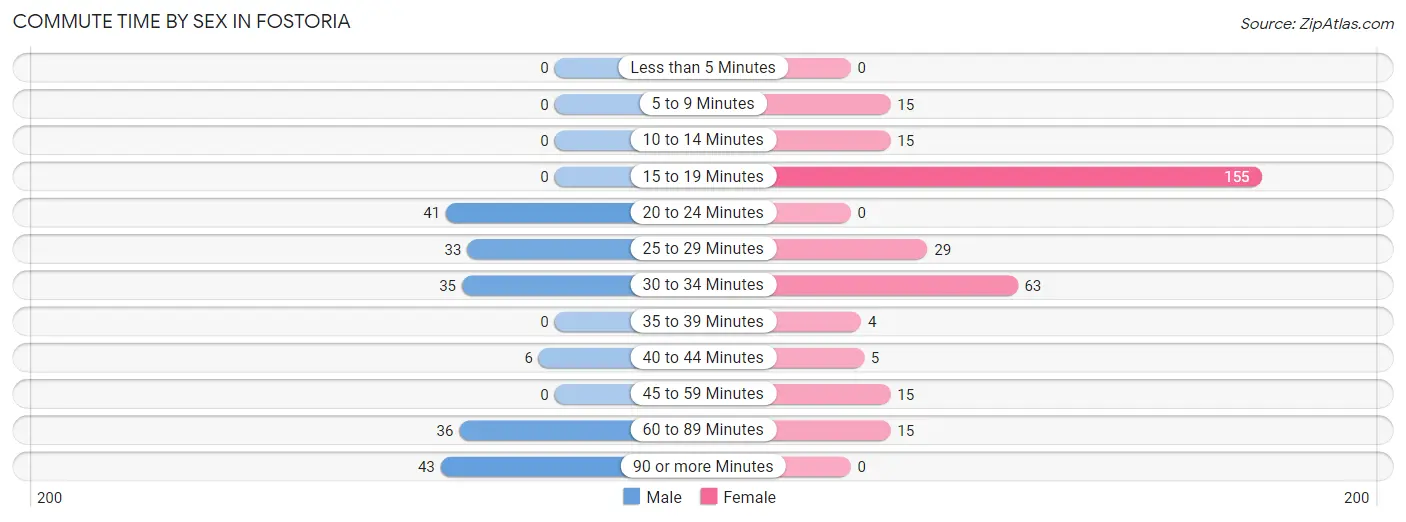
| Commute Time | Male | Female |
| Less than 5 Minutes | 0 (0.0%) | 0 (0.0%) |
| 5 to 9 Minutes | 0 (0.0%) | 15 (4.8%) |
| 10 to 14 Minutes | 0 (0.0%) | 15 (4.8%) |
| 15 to 19 Minutes | 0 (0.0%) | 155 (49.0%) |
| 20 to 24 Minutes | 41 (21.1%) | 0 (0.0%) |
| 25 to 29 Minutes | 33 (17.0%) | 29 (9.2%) |
| 30 to 34 Minutes | 35 (18.0%) | 63 (19.9%) |
| 35 to 39 Minutes | 0 (0.0%) | 4 (1.3%) |
| 40 to 44 Minutes | 6 (3.1%) | 5 (1.6%) |
| 45 to 59 Minutes | 0 (0.0%) | 15 (4.8%) |
| 60 to 89 Minutes | 36 (18.6%) | 15 (4.8%) |
| 90 or more Minutes | 43 (22.2%) | 0 (0.0%) |
Time of Departure to Work by Sex in Fostoria
The most frequent times of departure to work in Fostoria are 8:00 AM to 8:29 AM (57, 29.4%) for males and 4:00 PM to 11:59 PM (114, 36.1%) for females.
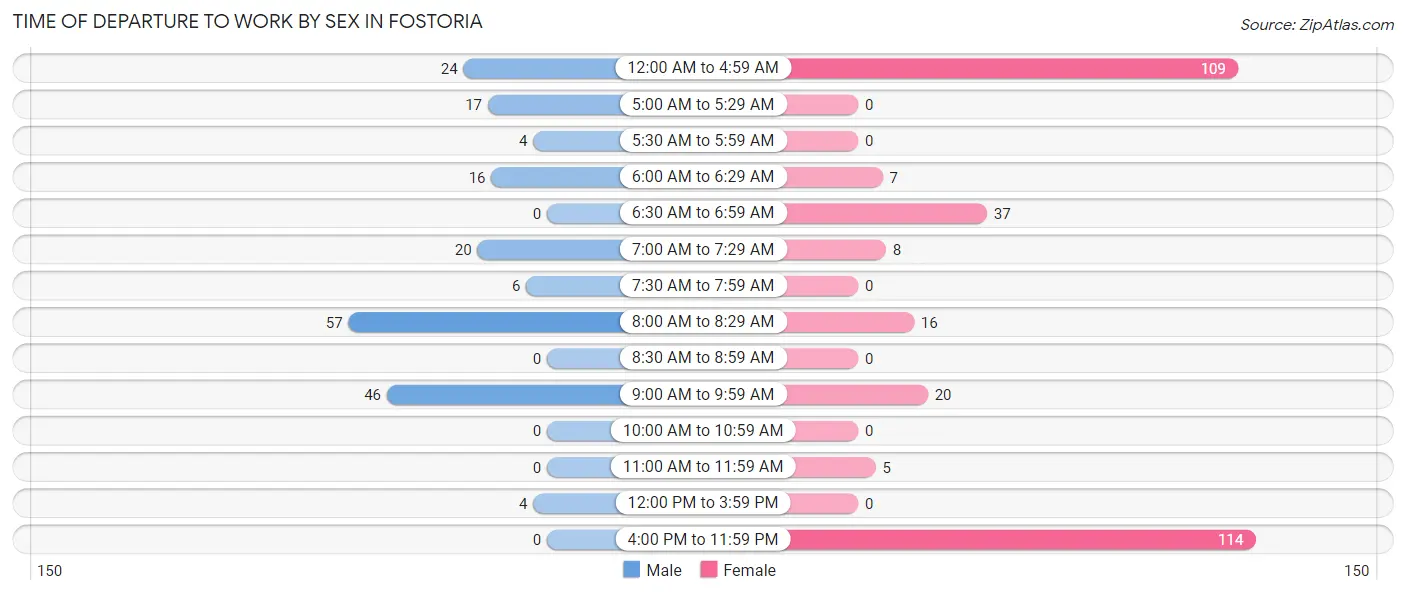
| Time of Departure | Male | Female |
| 12:00 AM to 4:59 AM | 24 (12.4%) | 109 (34.5%) |
| 5:00 AM to 5:29 AM | 17 (8.8%) | 0 (0.0%) |
| 5:30 AM to 5:59 AM | 4 (2.1%) | 0 (0.0%) |
| 6:00 AM to 6:29 AM | 16 (8.3%) | 7 (2.2%) |
| 6:30 AM to 6:59 AM | 0 (0.0%) | 37 (11.7%) |
| 7:00 AM to 7:29 AM | 20 (10.3%) | 8 (2.5%) |
| 7:30 AM to 7:59 AM | 6 (3.1%) | 0 (0.0%) |
| 8:00 AM to 8:29 AM | 57 (29.4%) | 16 (5.1%) |
| 8:30 AM to 8:59 AM | 0 (0.0%) | 0 (0.0%) |
| 9:00 AM to 9:59 AM | 46 (23.7%) | 20 (6.3%) |
| 10:00 AM to 10:59 AM | 0 (0.0%) | 0 (0.0%) |
| 11:00 AM to 11:59 AM | 0 (0.0%) | 5 (1.6%) |
| 12:00 PM to 3:59 PM | 4 (2.1%) | 0 (0.0%) |
| 4:00 PM to 11:59 PM | 0 (0.0%) | 114 (36.1%) |
| Total | 194 (100.0%) | 316 (100.0%) |
Housing Occupancy in Fostoria
Occupancy by Ownership in Fostoria
Of the total 338 dwellings in Fostoria, owner-occupied units account for 309 (91.4%), while renter-occupied units make up 29 (8.6%).
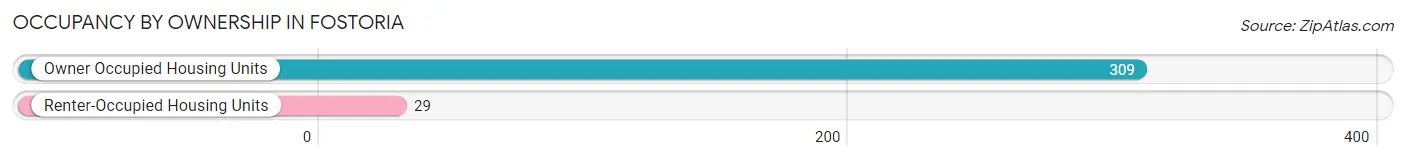
| Occupancy | # Housing Units | % Housing Units |
| Owner Occupied Housing Units | 309 | 91.4% |
| Renter-Occupied Housing Units | 29 | 8.6% |
| Total Occupied Housing Units | 338 | 100.0% |
Occupancy by Household Size in Fostoria
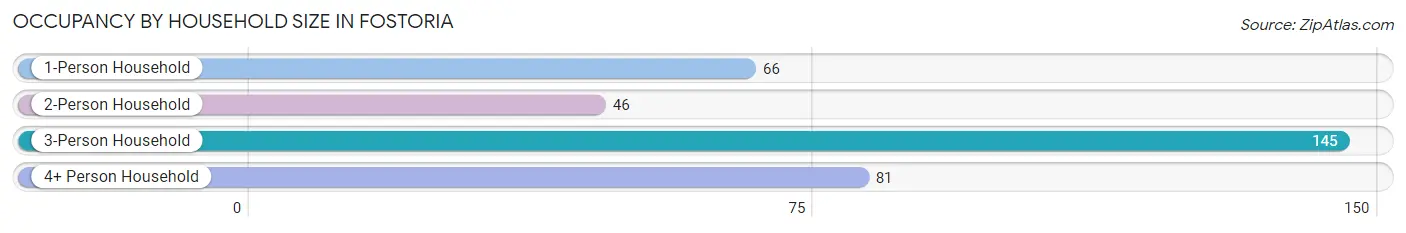
| Household Size | # Housing Units | % Housing Units |
| 1-Person Household | 66 | 19.5% |
| 2-Person Household | 46 | 13.6% |
| 3-Person Household | 145 | 42.9% |
| 4+ Person Household | 81 | 24.0% |
| Total Housing Units | 338 | 100.0% |
Occupancy by Ownership by Household Size in Fostoria
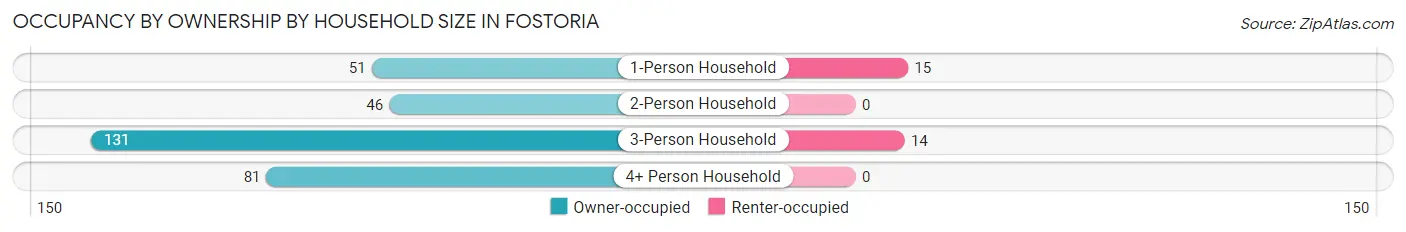
| Household Size | Owner-occupied | Renter-occupied |
| 1-Person Household | 51 (77.3%) | 15 (22.7%) |
| 2-Person Household | 46 (100.0%) | 0 (0.0%) |
| 3-Person Household | 131 (90.3%) | 14 (9.7%) |
| 4+ Person Household | 81 (100.0%) | 0 (0.0%) |
| Total Housing Units | 309 (91.4%) | 29 (8.6%) |
Occupancy by Educational Attainment in Fostoria
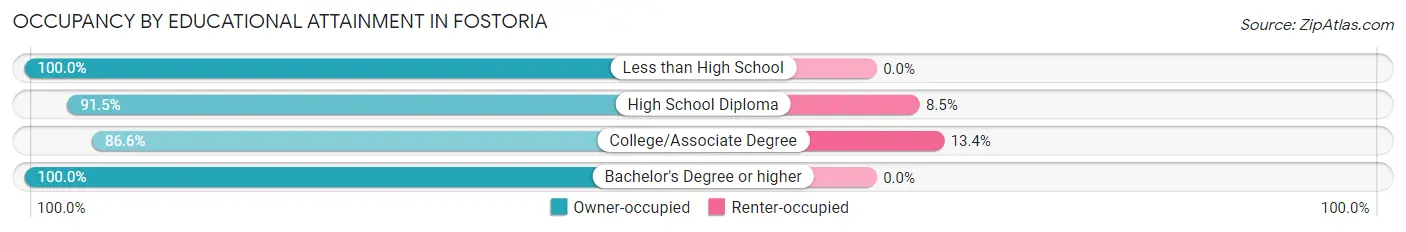
| Household Size | Owner-occupied | Renter-occupied |
| Less than High School | 19 (100.0%) | 0 (0.0%) |
| High School Diploma | 151 (91.5%) | 14 (8.5%) |
| College/Associate Degree | 97 (86.6%) | 15 (13.4%) |
| Bachelor's Degree or higher | 42 (100.0%) | 0 (0.0%) |
Occupancy by Age of Householder in Fostoria
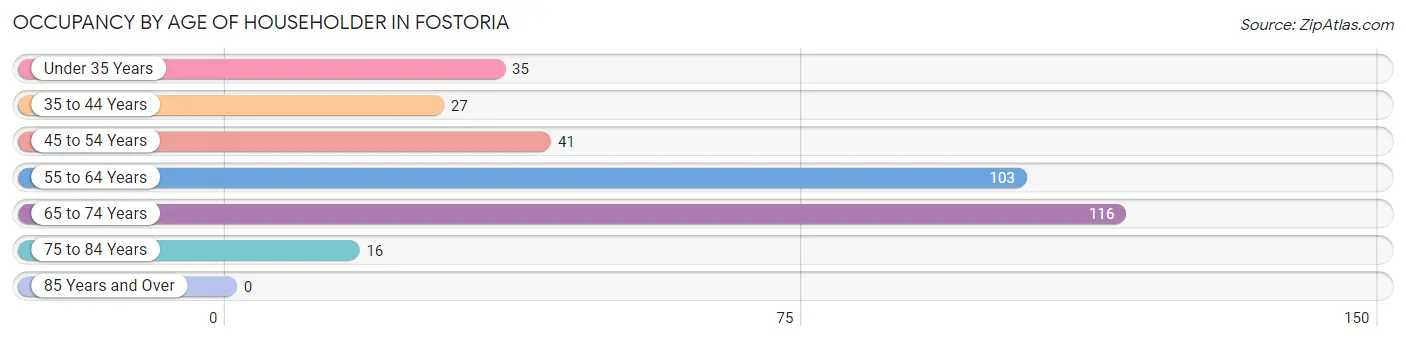
| Age Bracket | # Households | % Households |
| Under 35 Years | 35 | 10.4% |
| 35 to 44 Years | 27 | 8.0% |
| 45 to 54 Years | 41 | 12.1% |
| 55 to 64 Years | 103 | 30.5% |
| 65 to 74 Years | 116 | 34.3% |
| 75 to 84 Years | 16 | 4.7% |
| 85 Years and Over | 0 | 0.0% |
| Total | 338 | 100.0% |
Housing Finances in Fostoria
Median Income by Occupancy in Fostoria
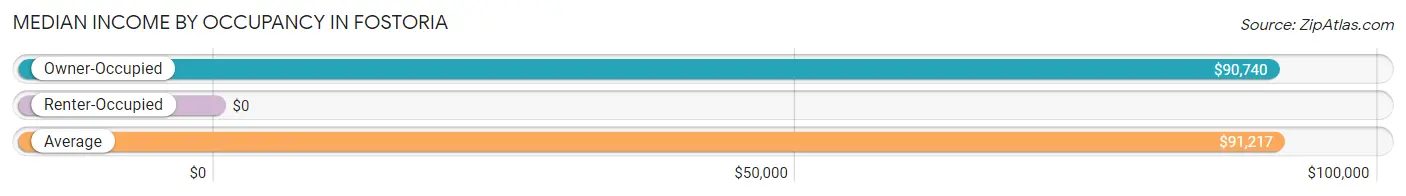
| Occupancy Type | # Households | Median Income |
| Owner-Occupied | 309 (91.4%) | $90,740 |
| Renter-Occupied | 29 (8.6%) | $0 |
| Average | 338 (100.0%) | $91,217 |
Occupancy by Householder Income Bracket in Fostoria
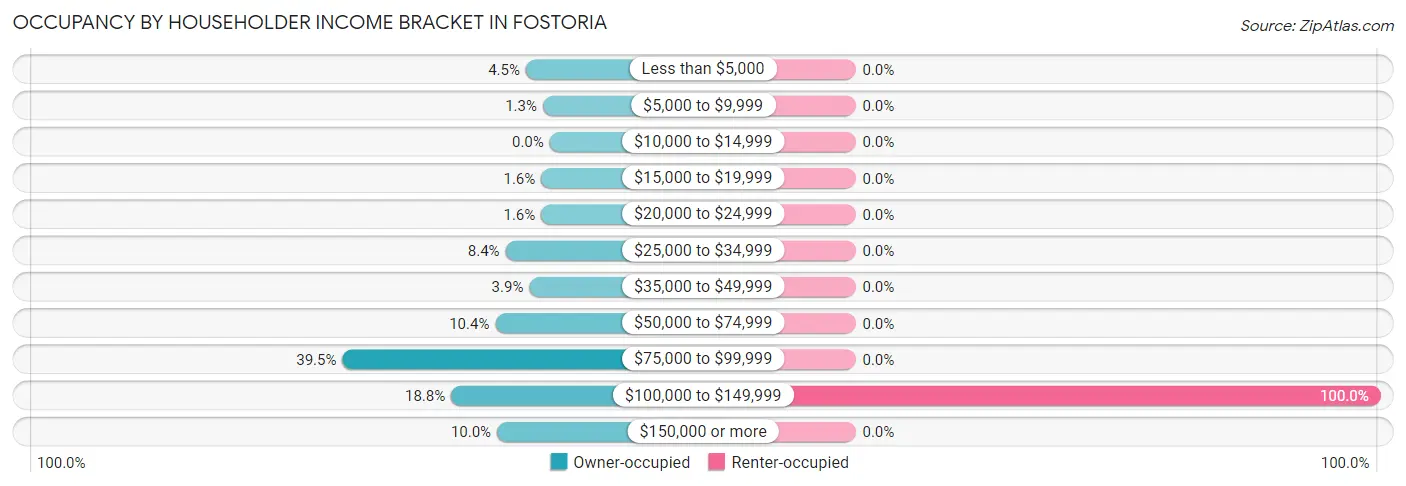
| Income Bracket | Owner-occupied | Renter-occupied |
| Less than $5,000 | 14 (4.5%) | 0 (0.0%) |
| $5,000 to $9,999 | 4 (1.3%) | 0 (0.0%) |
| $10,000 to $14,999 | 0 (0.0%) | 0 (0.0%) |
| $15,000 to $19,999 | 5 (1.6%) | 0 (0.0%) |
| $20,000 to $24,999 | 5 (1.6%) | 0 (0.0%) |
| $25,000 to $34,999 | 26 (8.4%) | 0 (0.0%) |
| $35,000 to $49,999 | 12 (3.9%) | 0 (0.0%) |
| $50,000 to $74,999 | 32 (10.4%) | 0 (0.0%) |
| $75,000 to $99,999 | 122 (39.5%) | 0 (0.0%) |
| $100,000 to $149,999 | 58 (18.8%) | 29 (100.0%) |
| $150,000 or more | 31 (10.0%) | 0 (0.0%) |
| Total | 309 (100.0%) | 29 (100.0%) |
Monthly Housing Cost Tiers in Fostoria
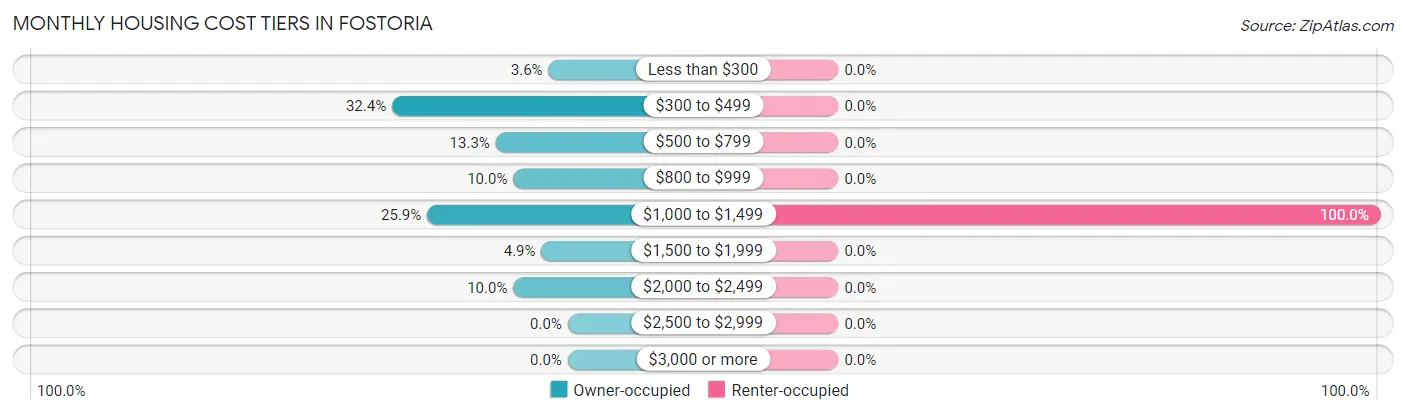
| Monthly Cost | Owner-occupied | Renter-occupied |
| Less than $300 | 11 (3.6%) | 0 (0.0%) |
| $300 to $499 | 100 (32.4%) | 0 (0.0%) |
| $500 to $799 | 41 (13.3%) | 0 (0.0%) |
| $800 to $999 | 31 (10.0%) | 0 (0.0%) |
| $1,000 to $1,499 | 80 (25.9%) | 29 (100.0%) |
| $1,500 to $1,999 | 15 (4.9%) | 0 (0.0%) |
| $2,000 to $2,499 | 31 (10.0%) | 0 (0.0%) |
| $2,500 to $2,999 | 0 (0.0%) | 0 (0.0%) |
| $3,000 or more | 0 (0.0%) | 0 (0.0%) |
| Total | 309 (100.0%) | 29 (100.0%) |
Physical Housing Characteristics in Fostoria
Housing Structures in Fostoria
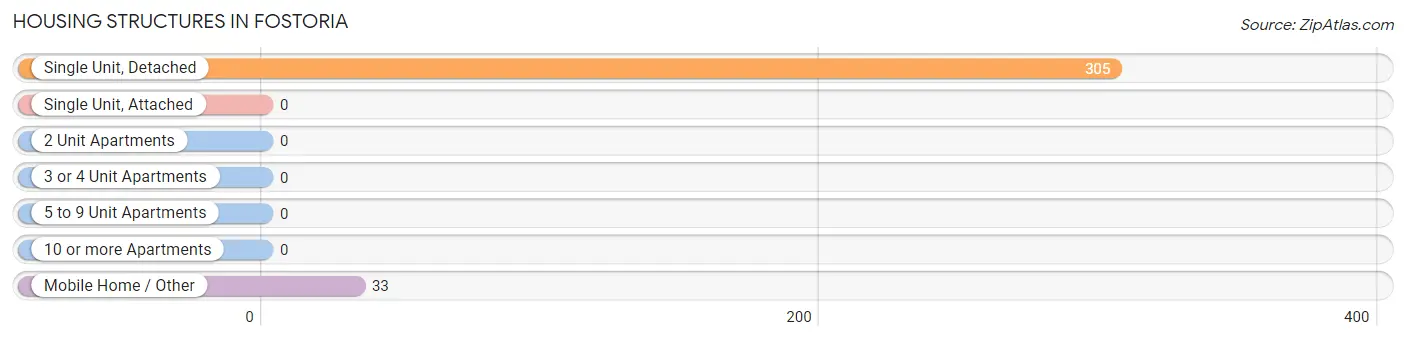
| Structure Type | # Housing Units | % Housing Units |
| Single Unit, Detached | 305 | 90.2% |
| Single Unit, Attached | 0 | 0.0% |
| 2 Unit Apartments | 0 | 0.0% |
| 3 or 4 Unit Apartments | 0 | 0.0% |
| 5 to 9 Unit Apartments | 0 | 0.0% |
| 10 or more Apartments | 0 | 0.0% |
| Mobile Home / Other | 33 | 9.8% |
| Total | 338 | 100.0% |
Housing Structures by Occupancy in Fostoria
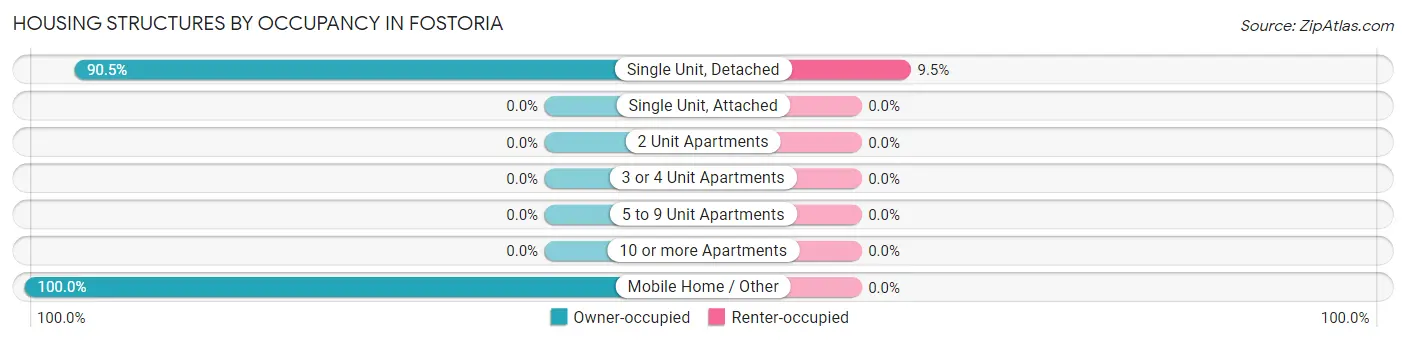
| Structure Type | Owner-occupied | Renter-occupied |
| Single Unit, Detached | 276 (90.5%) | 29 (9.5%) |
| Single Unit, Attached | 0 (0.0%) | 0 (0.0%) |
| 2 Unit Apartments | 0 (0.0%) | 0 (0.0%) |
| 3 or 4 Unit Apartments | 0 (0.0%) | 0 (0.0%) |
| 5 to 9 Unit Apartments | 0 (0.0%) | 0 (0.0%) |
| 10 or more Apartments | 0 (0.0%) | 0 (0.0%) |
| Mobile Home / Other | 33 (100.0%) | 0 (0.0%) |
| Total | 309 (91.4%) | 29 (8.6%) |
Housing Structures by Number of Rooms in Fostoria
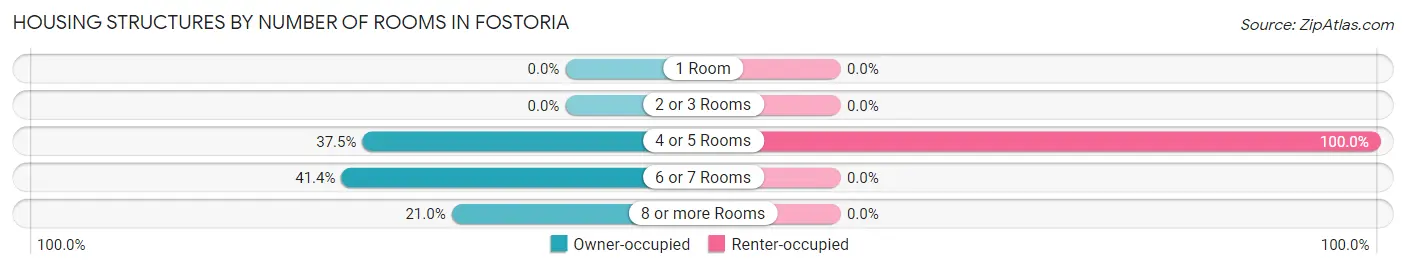
| Number of Rooms | Owner-occupied | Renter-occupied |
| 1 Room | 0 (0.0%) | 0 (0.0%) |
| 2 or 3 Rooms | 0 (0.0%) | 0 (0.0%) |
| 4 or 5 Rooms | 116 (37.5%) | 29 (100.0%) |
| 6 or 7 Rooms | 128 (41.4%) | 0 (0.0%) |
| 8 or more Rooms | 65 (21.0%) | 0 (0.0%) |
| Total | 309 (100.0%) | 29 (100.0%) |
Housing Structure by Heating Type in Fostoria
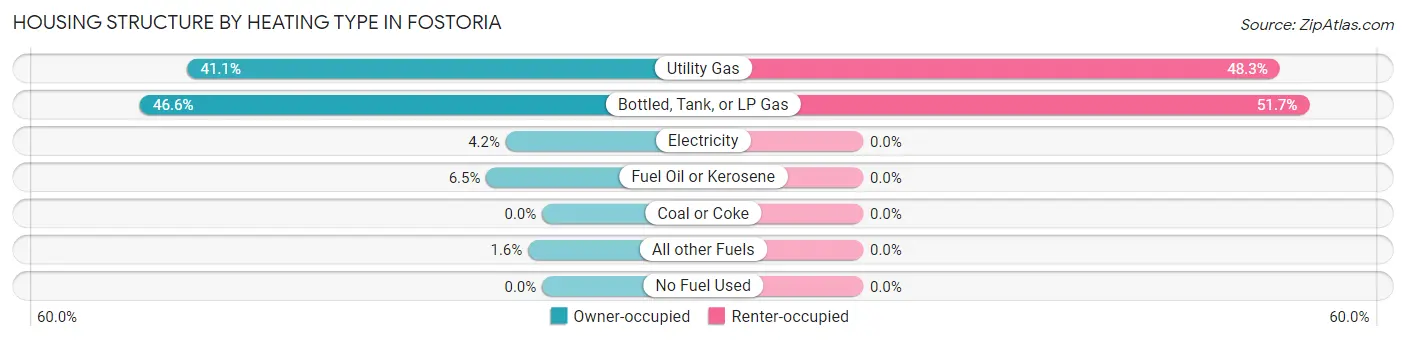
| Heating Type | Owner-occupied | Renter-occupied |
| Utility Gas | 127 (41.1%) | 14 (48.3%) |
| Bottled, Tank, or LP Gas | 144 (46.6%) | 15 (51.7%) |
| Electricity | 13 (4.2%) | 0 (0.0%) |
| Fuel Oil or Kerosene | 20 (6.5%) | 0 (0.0%) |
| Coal or Coke | 0 (0.0%) | 0 (0.0%) |
| All other Fuels | 5 (1.6%) | 0 (0.0%) |
| No Fuel Used | 0 (0.0%) | 0 (0.0%) |
| Total | 309 (100.0%) | 29 (100.0%) |
Household Vehicle Usage in Fostoria
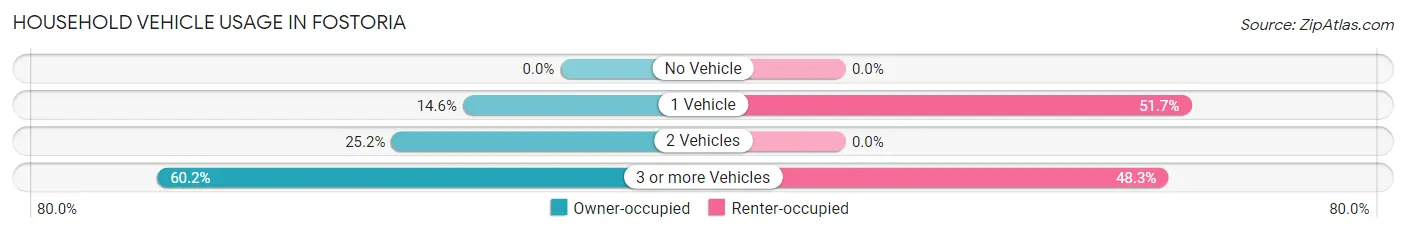
| Vehicles per Household | Owner-occupied | Renter-occupied |
| No Vehicle | 0 (0.0%) | 0 (0.0%) |
| 1 Vehicle | 45 (14.6%) | 15 (51.7%) |
| 2 Vehicles | 78 (25.2%) | 0 (0.0%) |
| 3 or more Vehicles | 186 (60.2%) | 14 (48.3%) |
| Total | 309 (100.0%) | 29 (100.0%) |
Real Estate & Mortgages in Fostoria
Real Estate and Mortgage Overview in Fostoria
| Characteristic | Without Mortgage | With Mortgage |
| Housing Units | 165 | 144 |
| Median Property Value | $119,300 | $160,300 |
| Median Household Income | $91,302 | $26 |
| Monthly Housing Costs | $467 | $0 |
| Real Estate Taxes | $1,342 | $0 |
Property Value by Mortgage Status in Fostoria
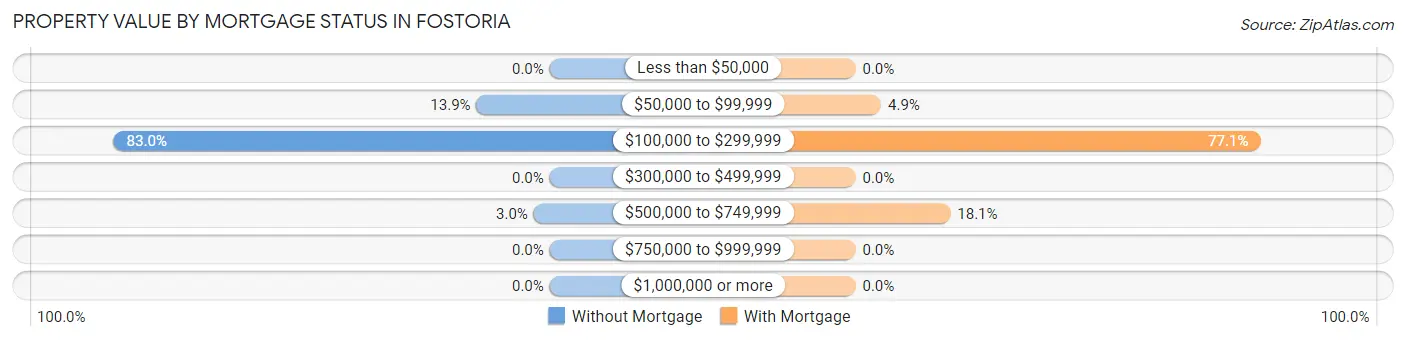
| Property Value | Without Mortgage | With Mortgage |
| Less than $50,000 | 0 (0.0%) | 0 (0.0%) |
| $50,000 to $99,999 | 23 (13.9%) | 7 (4.9%) |
| $100,000 to $299,999 | 137 (83.0%) | 111 (77.1%) |
| $300,000 to $499,999 | 0 (0.0%) | 0 (0.0%) |
| $500,000 to $749,999 | 5 (3.0%) | 26 (18.1%) |
| $750,000 to $999,999 | 0 (0.0%) | 0 (0.0%) |
| $1,000,000 or more | 0 (0.0%) | 0 (0.0%) |
| Total | 165 (100.0%) | 144 (100.0%) |
Household Income by Mortgage Status in Fostoria
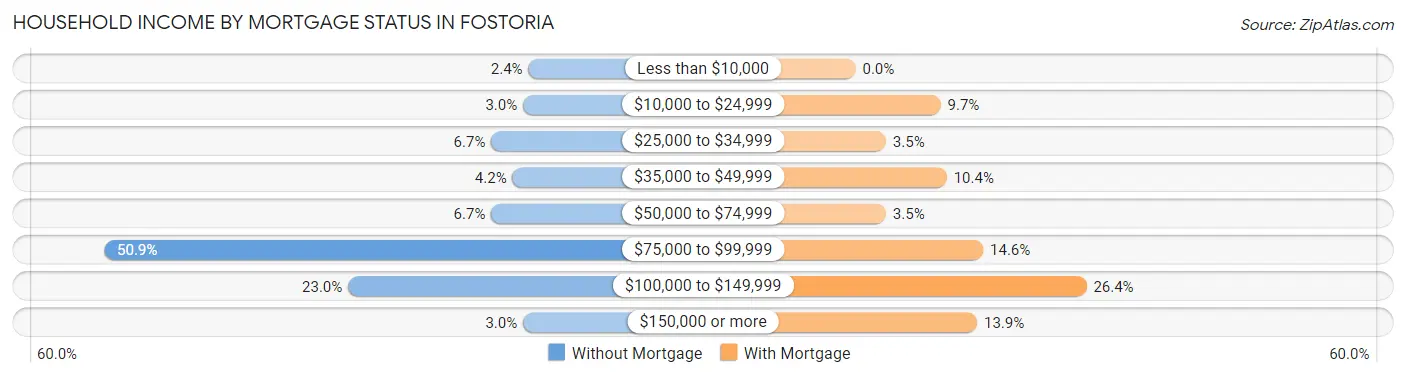
| Household Income | Without Mortgage | With Mortgage |
| Less than $10,000 | 4 (2.4%) | 0 (0.0%) |
| $10,000 to $24,999 | 5 (3.0%) | 14 (9.7%) |
| $25,000 to $34,999 | 11 (6.7%) | 5 (3.5%) |
| $35,000 to $49,999 | 7 (4.2%) | 15 (10.4%) |
| $50,000 to $74,999 | 11 (6.7%) | 5 (3.5%) |
| $75,000 to $99,999 | 84 (50.9%) | 21 (14.6%) |
| $100,000 to $149,999 | 38 (23.0%) | 38 (26.4%) |
| $150,000 or more | 5 (3.0%) | 20 (13.9%) |
| Total | 165 (100.0%) | 144 (100.0%) |
Property Value to Household Income Ratio in Fostoria
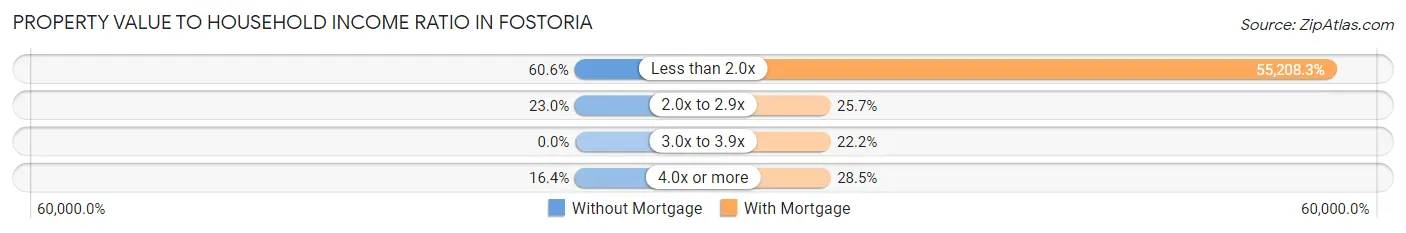
| Value-to-Income Ratio | Without Mortgage | With Mortgage |
| Less than 2.0x | 100 (60.6%) | 79,500 (55,208.3%) |
| 2.0x to 2.9x | 38 (23.0%) | 37 (25.7%) |
| 3.0x to 3.9x | 0 (0.0%) | 32 (22.2%) |
| 4.0x or more | 27 (16.4%) | 41 (28.5%) |
| Total | 165 (100.0%) | 144 (100.0%) |
Real Estate Taxes by Mortgage Status in Fostoria
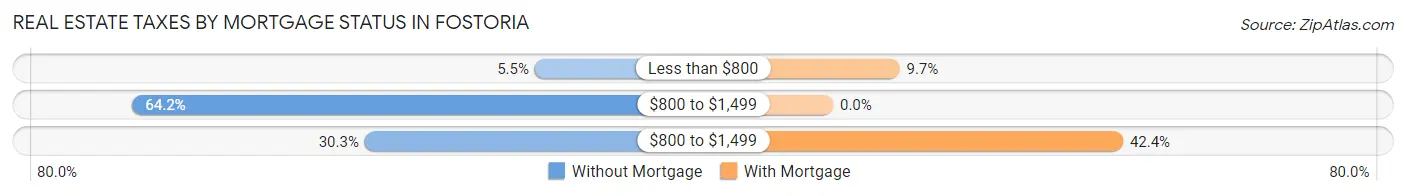
| Property Taxes | Without Mortgage | With Mortgage |
| Less than $800 | 9 (5.4%) | 14 (9.7%) |
| $800 to $1,499 | 106 (64.2%) | 0 (0.0%) |
| $800 to $1,499 | 50 (30.3%) | 61 (42.4%) |
| Total | 165 (100.0%) | 144 (100.0%) |
Health & Disability in Fostoria
Health Insurance Coverage by Age in Fostoria
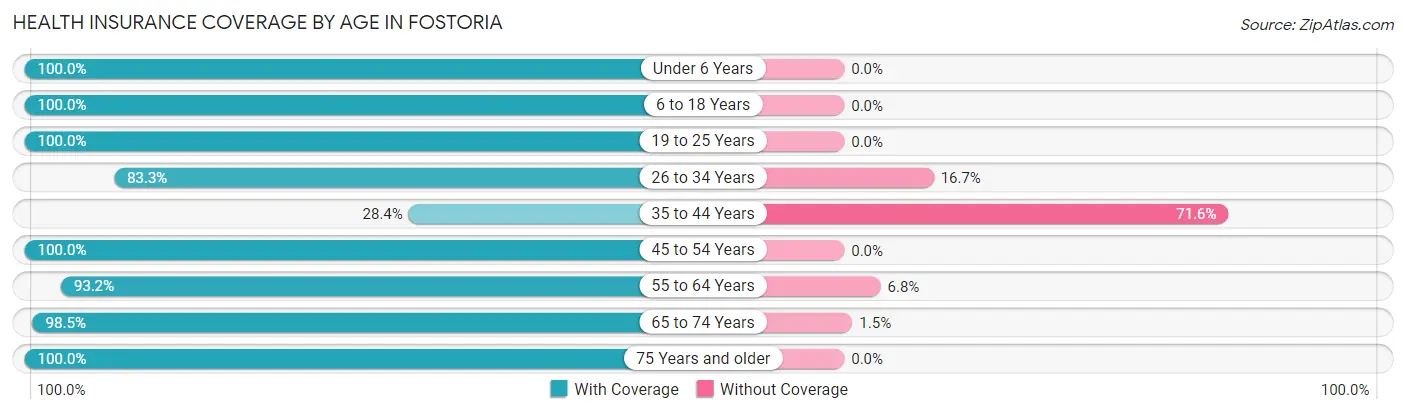
| Age Bracket | With Coverage | Without Coverage |
| Under 6 Years | 89 (100.0%) | 0 (0.0%) |
| 6 to 18 Years | 126 (100.0%) | 0 (0.0%) |
| 19 to 25 Years | 80 (100.0%) | 0 (0.0%) |
| 26 to 34 Years | 85 (83.3%) | 17 (16.7%) |
| 35 to 44 Years | 44 (28.4%) | 111 (71.6%) |
| 45 to 54 Years | 64 (100.0%) | 0 (0.0%) |
| 55 to 64 Years | 179 (93.2%) | 13 (6.8%) |
| 65 to 74 Years | 196 (98.5%) | 3 (1.5%) |
| 75 Years and older | 16 (100.0%) | 0 (0.0%) |
| Total | 879 (85.9%) | 144 (14.1%) |
Health Insurance Coverage by Citizenship Status in Fostoria
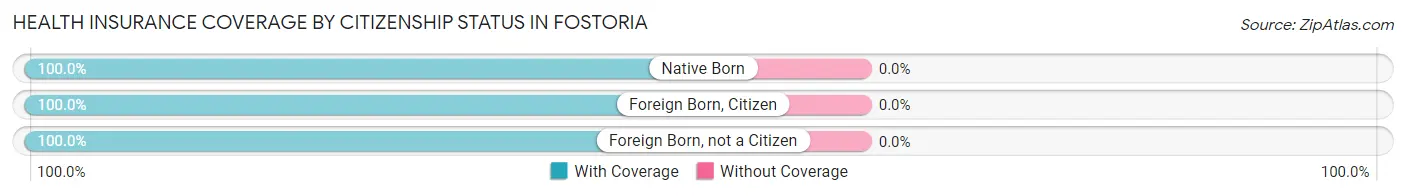
| Citizenship Status | With Coverage | Without Coverage |
| Native Born | 89 (100.0%) | 0 (0.0%) |
| Foreign Born, Citizen | 126 (100.0%) | 0 (0.0%) |
| Foreign Born, not a Citizen | 80 (100.0%) | 0 (0.0%) |
Health Insurance Coverage by Household Income in Fostoria
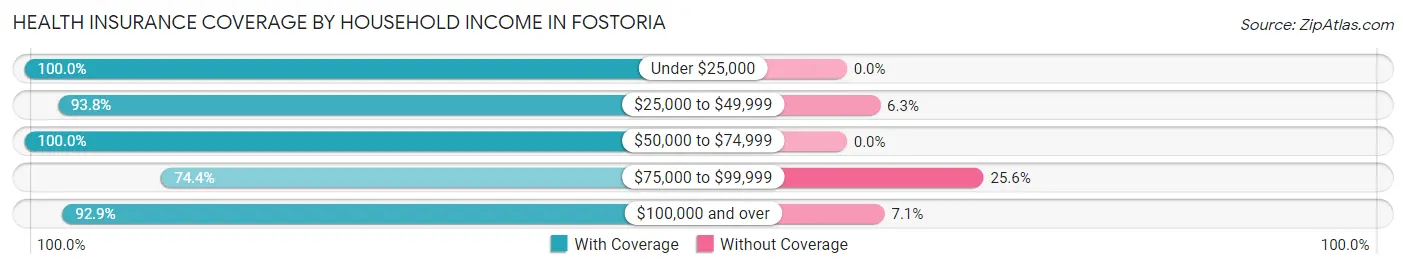
| Household Income | With Coverage | Without Coverage |
| Under $25,000 | 47 (100.0%) | 0 (0.0%) |
| $25,000 to $49,999 | 75 (93.8%) | 5 (6.2%) |
| $50,000 to $74,999 | 87 (100.0%) | 0 (0.0%) |
| $75,000 to $99,999 | 328 (74.4%) | 113 (25.6%) |
| $100,000 and over | 342 (92.9%) | 26 (7.1%) |
Public vs Private Health Insurance Coverage by Age in Fostoria
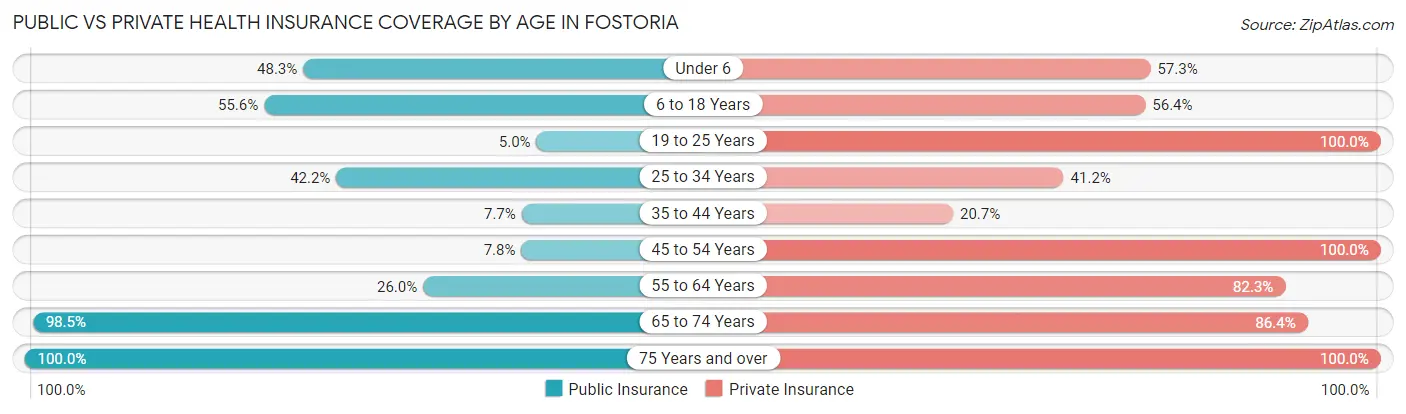
| Age Bracket | Public Insurance | Private Insurance |
| Under 6 | 43 (48.3%) | 51 (57.3%) |
| 6 to 18 Years | 70 (55.6%) | 71 (56.4%) |
| 19 to 25 Years | 4 (5.0%) | 80 (100.0%) |
| 25 to 34 Years | 43 (42.2%) | 42 (41.2%) |
| 35 to 44 Years | 12 (7.7%) | 32 (20.6%) |
| 45 to 54 Years | 5 (7.8%) | 64 (100.0%) |
| 55 to 64 Years | 50 (26.0%) | 158 (82.3%) |
| 65 to 74 Years | 196 (98.5%) | 172 (86.4%) |
| 75 Years and over | 16 (100.0%) | 16 (100.0%) |
| Total | 439 (42.9%) | 686 (67.1%) |
Disability Status by Sex by Age in Fostoria
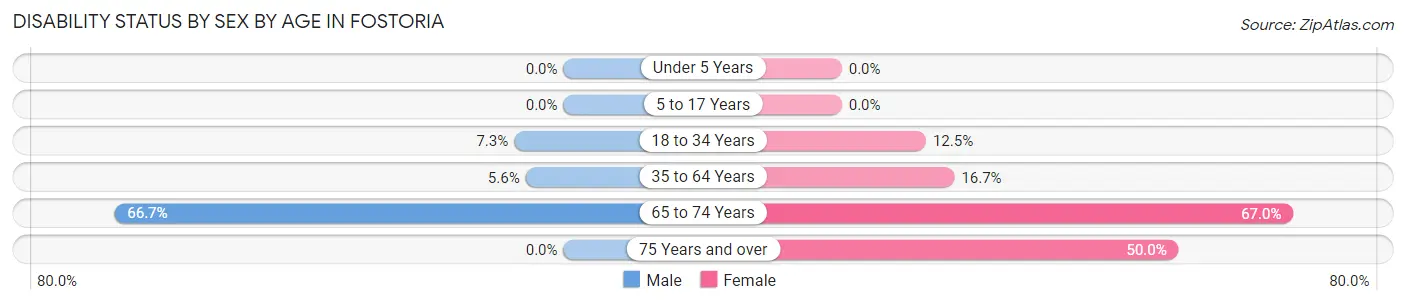
| Age Bracket | Male | Female |
| Under 5 Years | 0 (0.0%) | 0 (0.0%) |
| 5 to 17 Years | 0 (0.0%) | 0 (0.0%) |
| 18 to 34 Years | 6 (7.3%) | 15 (12.5%) |
| 35 to 64 Years | 9 (5.6%) | 42 (16.7%) |
| 65 to 74 Years | 72 (66.7%) | 61 (67.0%) |
| 75 Years and over | 0 (0.0%) | 5 (50.0%) |
Disability Class by Sex by Age in Fostoria
Disability Class: Hearing Difficulty
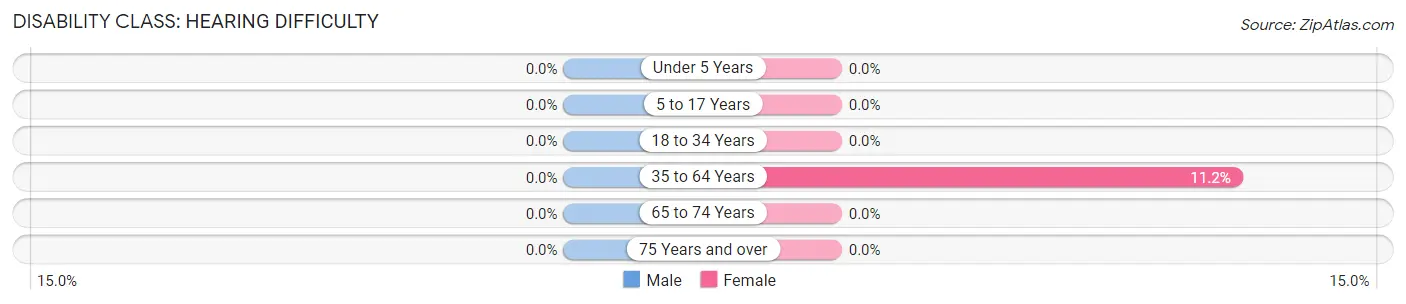
| Age Bracket | Male | Female |
| Under 5 Years | 0 (0.0%) | 0 (0.0%) |
| 5 to 17 Years | 0 (0.0%) | 0 (0.0%) |
| 18 to 34 Years | 0 (0.0%) | 0 (0.0%) |
| 35 to 64 Years | 0 (0.0%) | 28 (11.2%) |
| 65 to 74 Years | 0 (0.0%) | 0 (0.0%) |
| 75 Years and over | 0 (0.0%) | 0 (0.0%) |
Disability Class: Vision Difficulty
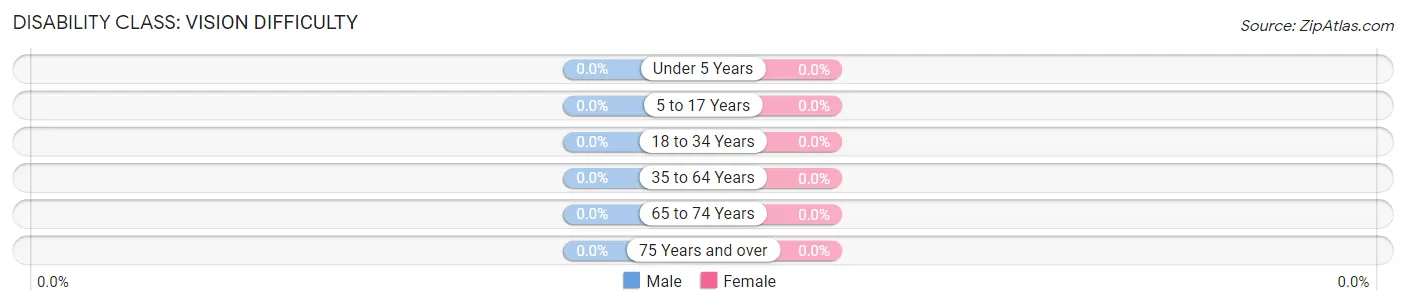
| Age Bracket | Male | Female |
| Under 5 Years | 0 (0.0%) | 0 (0.0%) |
| 5 to 17 Years | 0 (0.0%) | 0 (0.0%) |
| 18 to 34 Years | 0 (0.0%) | 0 (0.0%) |
| 35 to 64 Years | 0 (0.0%) | 0 (0.0%) |
| 65 to 74 Years | 0 (0.0%) | 0 (0.0%) |
| 75 Years and over | 0 (0.0%) | 0 (0.0%) |
Disability Class: Cognitive Difficulty
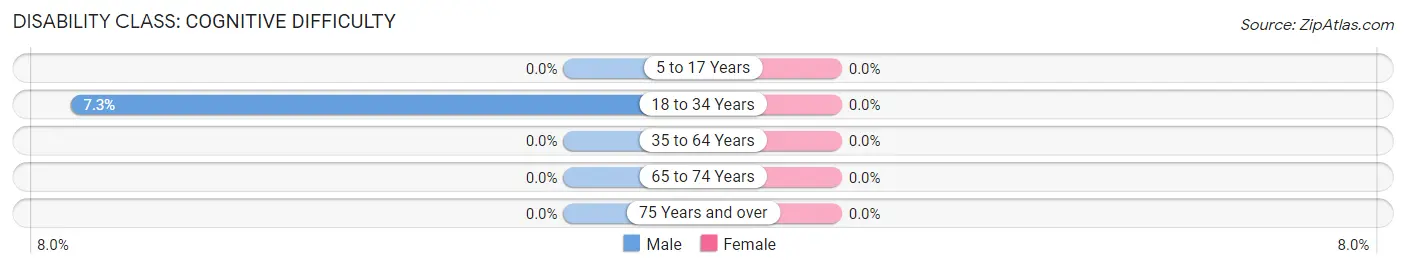
| Age Bracket | Male | Female |
| 5 to 17 Years | 0 (0.0%) | 0 (0.0%) |
| 18 to 34 Years | 6 (7.3%) | 0 (0.0%) |
| 35 to 64 Years | 0 (0.0%) | 0 (0.0%) |
| 65 to 74 Years | 0 (0.0%) | 0 (0.0%) |
| 75 Years and over | 0 (0.0%) | 0 (0.0%) |
Disability Class: Ambulatory Difficulty
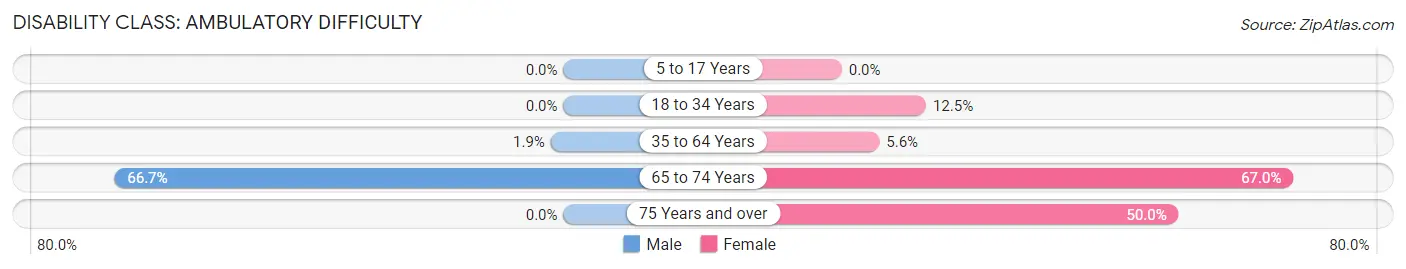
| Age Bracket | Male | Female |
| 5 to 17 Years | 0 (0.0%) | 0 (0.0%) |
| 18 to 34 Years | 0 (0.0%) | 15 (12.5%) |
| 35 to 64 Years | 3 (1.9%) | 14 (5.6%) |
| 65 to 74 Years | 72 (66.7%) | 61 (67.0%) |
| 75 Years and over | 0 (0.0%) | 5 (50.0%) |
Disability Class: Self-Care Difficulty
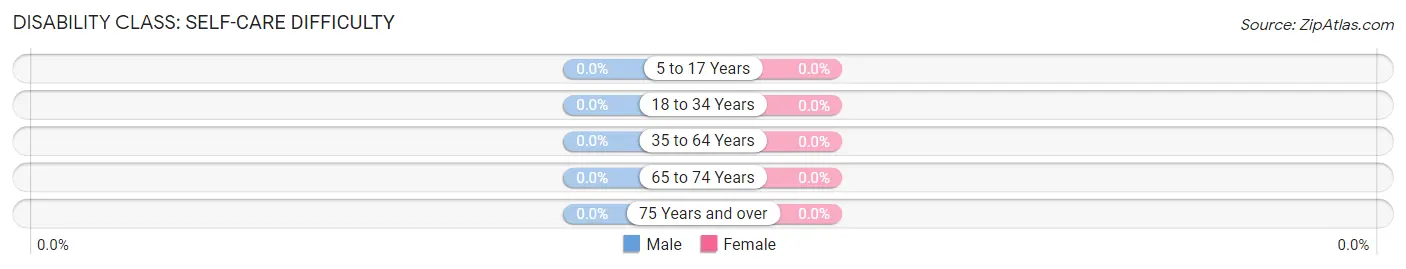
| Age Bracket | Male | Female |
| 5 to 17 Years | 0 (0.0%) | 0 (0.0%) |
| 18 to 34 Years | 0 (0.0%) | 0 (0.0%) |
| 35 to 64 Years | 0 (0.0%) | 0 (0.0%) |
| 65 to 74 Years | 0 (0.0%) | 0 (0.0%) |
| 75 Years and over | 0 (0.0%) | 0 (0.0%) |
Technology Access in Fostoria
Computing Device Access in Fostoria
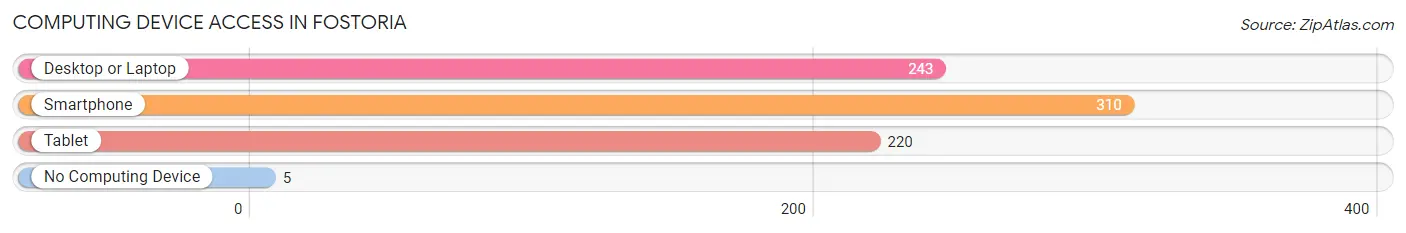
| Device Type | # Households | % Households |
| Desktop or Laptop | 243 | 71.9% |
| Smartphone | 310 | 91.7% |
| Tablet | 220 | 65.1% |
| No Computing Device | 5 | 1.5% |
| Total | 338 | 100.0% |
Internet Access in Fostoria
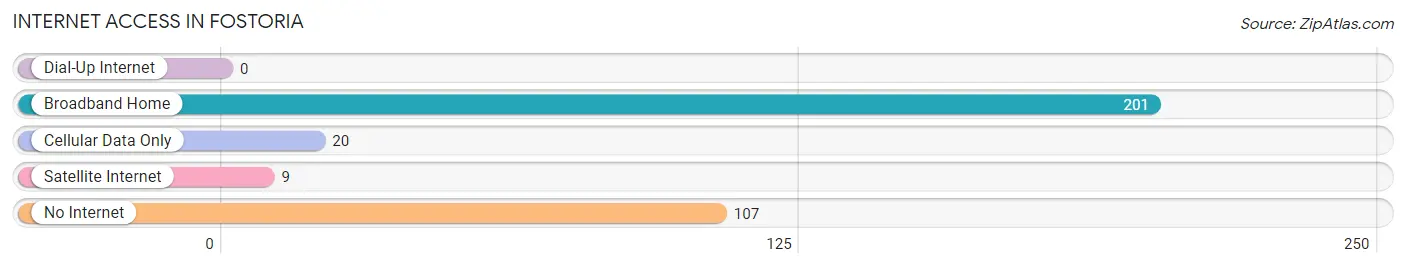
| Internet Type | # Households | % Households |
| Dial-Up Internet | 0 | 0.0% |
| Broadband Home | 201 | 59.5% |
| Cellular Data Only | 20 | 5.9% |
| Satellite Internet | 9 | 2.7% |
| No Internet | 107 | 31.7% |
| Total | 338 | 100.0% |
Fostoria Summary
Fostoria is a small city located in the state of Michigan, in the United States. It is situated in the southeastern corner of the state, in the county of Tuscola. The city has a population of approximately 1,500 people, and is part of the Thumb region of Michigan.
History
Fostoria was founded in 1871 by a group of settlers from Ohio. The city was named after the founder, John Fostoria, who was a prominent businessman in the area. The city was originally a farming community, but soon developed into a small industrial center. The city was incorporated in 1887, and the first mayor was elected in 1888.
In the early 1900s, Fostoria was a thriving industrial center, with several factories and businesses located in the city. The city was home to a number of different industries, including a flour mill, a sawmill, a brickyard, and a furniture factory. The city also had a number of stores and shops, as well as a hotel and a bank.
In the 1950s, the city began to decline as the factories and businesses began to close. The city was hit hard by the Great Depression, and many of the businesses and factories closed their doors. The city was also affected by the decline of the auto industry in the area, as many of the factories that had been located in the city had been related to the auto industry.
Geography
Fostoria is located in the southeastern corner of the state of Michigan, in the county of Tuscola. The city is situated on the banks of the Cass River, and is surrounded by rolling hills and farmland. The city is located approximately 30 miles north of Detroit, and is part of the Thumb region of Michigan.
The city has a total area of 1.2 square miles, all of which is land. The city has a humid continental climate, with cold winters and hot summers. The average temperature in the city is around 40 degrees Fahrenheit in the winter, and around 70 degrees Fahrenheit in the summer.
Economy
Fostoria’s economy is largely based on agriculture and manufacturing. The city is home to a number of different farms, which produce a variety of crops, including corn, soybeans, wheat, and hay. The city is also home to a number of different manufacturing companies, which produce a variety of products, including furniture, auto parts, and plastics.
The city also has a number of different retail stores and restaurants, as well as a number of different services, such as banks and medical facilities. The city is also home to a number of different educational institutions, including a community college and a vocational school.
Demographics
As of the 2010 census, the population of Fostoria was 1,500 people. The city has a population density of 1,200 people per square mile. The racial makeup of the city is 97.3% White, 0.7% African American, 0.3% Native American, 0.3% Asian, and 1.3% from other races.
The median household income in the city is $37,500, and the median family income is $45,000. The per capita income in the city is $19,000. The city has a poverty rate of 16.3%, and the unemployment rate is 8.3%.
Conclusion
Fostoria is a small city located in the southeastern corner of the state of Michigan. The city has a population of approximately 1,500 people, and is part of the Thumb region of Michigan. The city has a largely agricultural and manufacturing-based economy, and is home to a number of different farms, factories, and retail stores. The city has a population that is predominantly White, with a median household income of $37,500 and a poverty rate of 16.3%.
Common Questions
What is Per Capita Income in Fostoria?
Per Capita income in Fostoria is $35,115.
What is the Median Family Income in Fostoria?
Median Family Income in Fostoria is $91,447.
What is the Median Household income in Fostoria?
Median Household Income in Fostoria is $91,217.
What is Income or Wage Gap in Fostoria?
Income or Wage Gap in Fostoria is 26.2%.
Women in Fostoria earn 73.8 cents for every dollar earned by a man.
What is Inequality or Gini Index in Fostoria?
Inequality or Gini Index in Fostoria is 0.36.
What is the Total Population of Fostoria?
Total Population of Fostoria is 1,023.
What is the Total Male Population of Fostoria?
Total Male Population of Fostoria is 503.
What is the Total Female Population of Fostoria?
Total Female Population of Fostoria is 520.
What is the Ratio of Males per 100 Females in Fostoria?
There are 96.73 Males per 100 Females in Fostoria.
What is the Ratio of Females per 100 Males in Fostoria?
There are 103.38 Females per 100 Males in Fostoria.
What is the Median Population Age in Fostoria?
Median Population Age in Fostoria is 37.0 Years.
What is the Average Family Size in Fostoria
Average Family Size in Fostoria is 3.5 People.
What is the Average Household Size in Fostoria
Average Household Size in Fostoria is 3.0 People.
How Large is the Labor Force in Fostoria?
There are 571 People in the Labor Forcein in Fostoria.
What is the Percentage of People in the Labor Force in Fostoria?
67.7% of People are in the Labor Force in Fostoria.
What is the Unemployment Rate in Fostoria?
Unemployment Rate in Fostoria is 7.2%.