Flushing, MI Map & Demographics
Flushing Map
Flushing Overview
$37,752
PER CAPITA INCOME
$87,283
AVG FAMILY INCOME
$75,813
AVG HOUSEHOLD INCOME
42.7%
WAGE / INCOME GAP [ % ]
57.3¢/ $1
WAGE / INCOME GAP [ $ ]
0.38
INEQUALITY / GINI INDEX
8,349
TOTAL POPULATION
4,011
MALE POPULATION
4,338
FEMALE POPULATION
92.46
MALES / 100 FEMALES
108.15
FEMALES / 100 MALES
39.4
MEDIAN AGE
3.1
AVG FAMILY SIZE
2.4
AVG HOUSEHOLD SIZE
3,932
LABOR FORCE [ PEOPLE ]
58.3%
PERCENT IN LABOR FORCE
6.6%
UNEMPLOYMENT RATE
Flushing Zip Codes
Flushing Area Codes
Income in Flushing
Income Overview in Flushing
Per Capita Income in Flushing is $37,752, while median incomes of families and households are $87,283 and $75,813 respectively.
| Characteristic | Number | Measure |
| Per Capita Income | 8,349 | $37,752 |
| Median Family Income | 2,038 | $87,283 |
| Mean Family Income | 2,038 | $106,143 |
| Median Household Income | 3,432 | $75,813 |
| Mean Household Income | 3,432 | $89,671 |
| Income Deficit | 2,038 | $0 |
| Wage / Income Gap (%) | 8,349 | 42.72% |
| Wage / Income Gap ($) | 8,349 | 57.28¢ per $1 |
| Gini / Inequality Index | 8,349 | 0.38 |
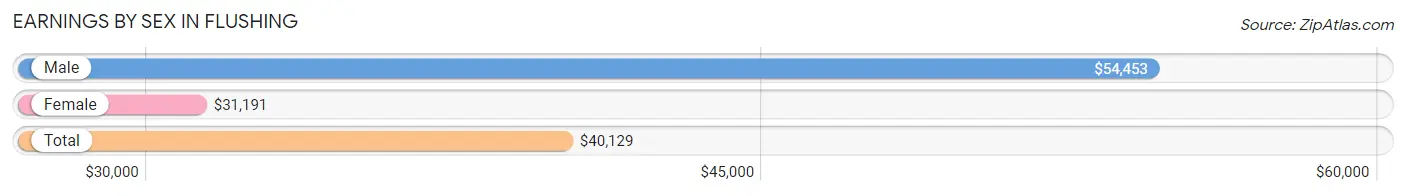
Earnings by Sex in Flushing
Average Earnings in Flushing are $40,129, $54,453 for men and $31,191 for women, a difference of 42.7%.
| Sex | Number | Average Earnings |
| Male | 2,140 (51.1%) | $54,453 |
| Female | 2,046 (48.9%) | $31,191 |
| Total | 4,186 (100.0%) | $40,129 |
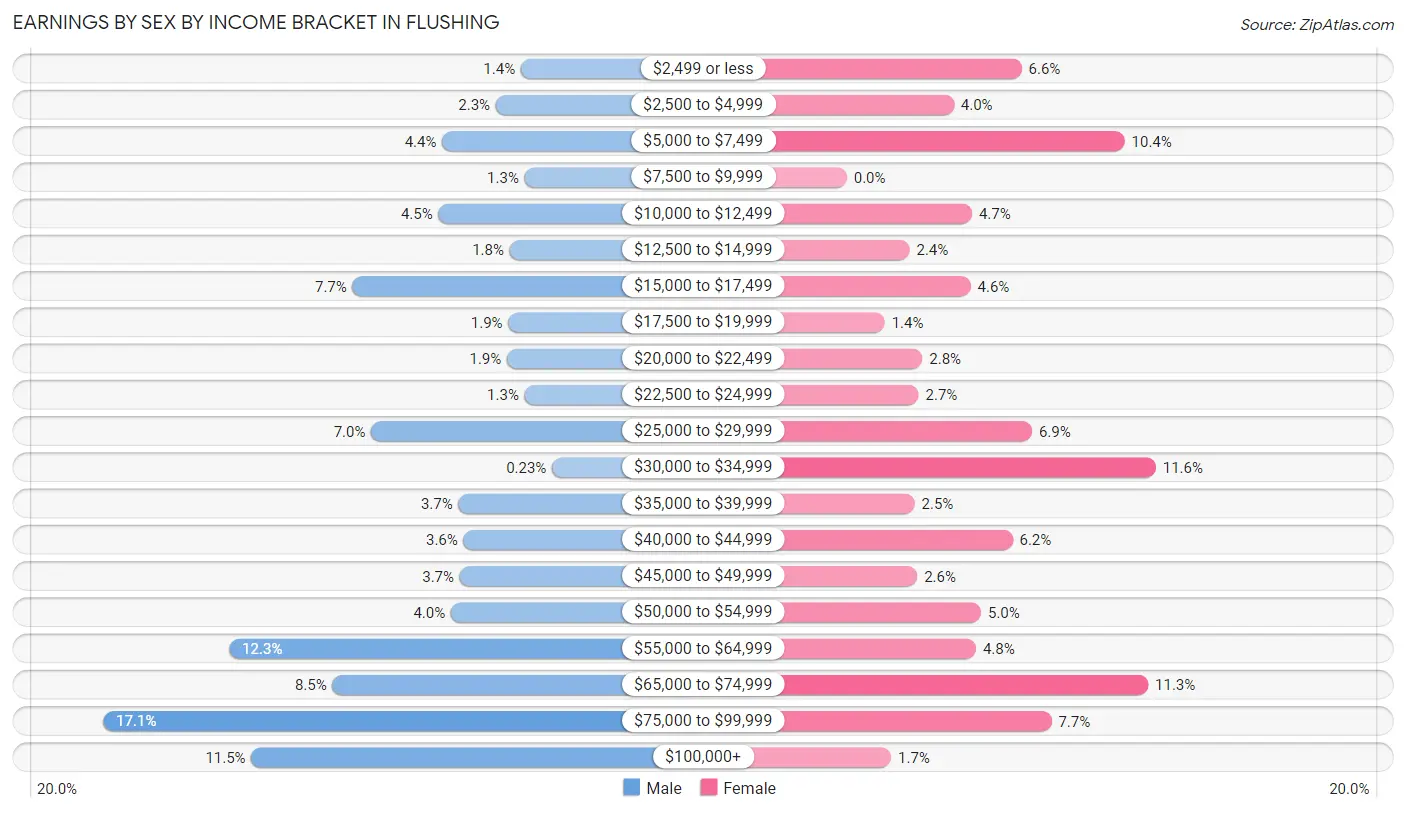
Earnings by Sex by Income Bracket in Flushing
The most common earnings brackets in Flushing are $75,000 to $99,999 for men (365 | 17.1%) and $30,000 to $34,999 for women (237 | 11.6%).
| Income | Male | Female |
| $2,499 or less | 30 (1.4%) | 134 (6.6%) |
| $2,500 to $4,999 | 50 (2.3%) | 82 (4.0%) |
| $5,000 to $7,499 | 93 (4.3%) | 213 (10.4%) |
| $7,500 to $9,999 | 27 (1.3%) | 0 (0.0%) |
| $10,000 to $12,499 | 96 (4.5%) | 96 (4.7%) |
| $12,500 to $14,999 | 39 (1.8%) | 48 (2.4%) |
| $15,000 to $17,499 | 165 (7.7%) | 95 (4.6%) |
| $17,500 to $19,999 | 40 (1.9%) | 29 (1.4%) |
| $20,000 to $22,499 | 41 (1.9%) | 58 (2.8%) |
| $22,500 to $24,999 | 27 (1.3%) | 55 (2.7%) |
| $25,000 to $29,999 | 150 (7.0%) | 142 (6.9%) |
| $30,000 to $34,999 | 5 (0.2%) | 237 (11.6%) |
| $35,000 to $39,999 | 80 (3.7%) | 52 (2.5%) |
| $40,000 to $44,999 | 76 (3.5%) | 127 (6.2%) |
| $45,000 to $49,999 | 79 (3.7%) | 54 (2.6%) |
| $50,000 to $54,999 | 86 (4.0%) | 103 (5.0%) |
| $55,000 to $64,999 | 264 (12.3%) | 99 (4.8%) |
| $65,000 to $74,999 | 181 (8.5%) | 231 (11.3%) |
| $75,000 to $99,999 | 365 (17.1%) | 157 (7.7%) |
| $100,000+ | 246 (11.5%) | 34 (1.7%) |
| Total | 2,140 (100.0%) | 2,046 (100.0%) |
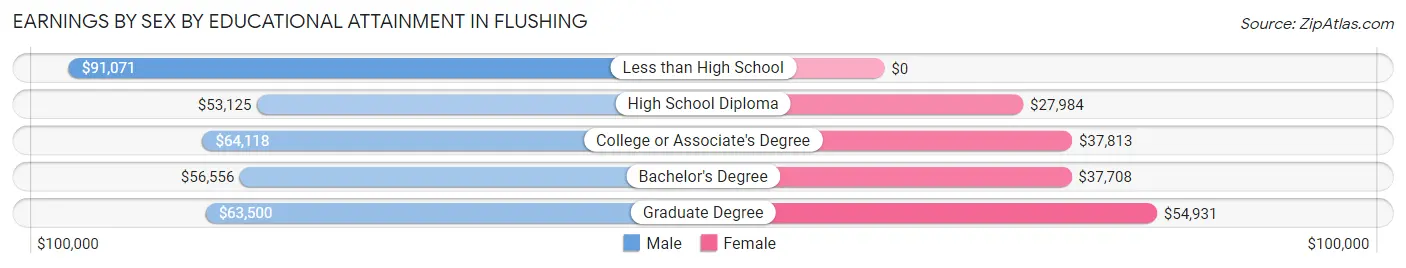
Earnings by Sex by Educational Attainment in Flushing
Average earnings in Flushing are $58,926 for men and $38,011 for women, a difference of 35.5%. Men with an educational attainment of less than high school enjoy the highest average annual earnings of $91,071, while those with high school diploma education earn the least with $53,125. Women with an educational attainment of graduate degree earn the most with the average annual earnings of $54,931, while those with high school diploma education have the smallest earnings of $27,984.
| Educational Attainment | Male Income | Female Income |
| Less than High School | $91,071 | $0 |
| High School Diploma | $53,125 | $27,984 |
| College or Associate's Degree | $64,118 | $37,813 |
| Bachelor's Degree | $56,556 | $37,708 |
| Graduate Degree | $63,500 | $54,931 |
| Total | $58,926 | $38,011 |
Family Income in Flushing
Family Income Brackets in Flushing
According to the Flushing family income data, there are 579 families falling into the $100,000 to $149,999 income range, which is the most common income bracket and makes up 28.4% of all families. Conversely, the less than $10,000 income bracket is the least frequent group with only 8 families (0.4%) belonging to this category.
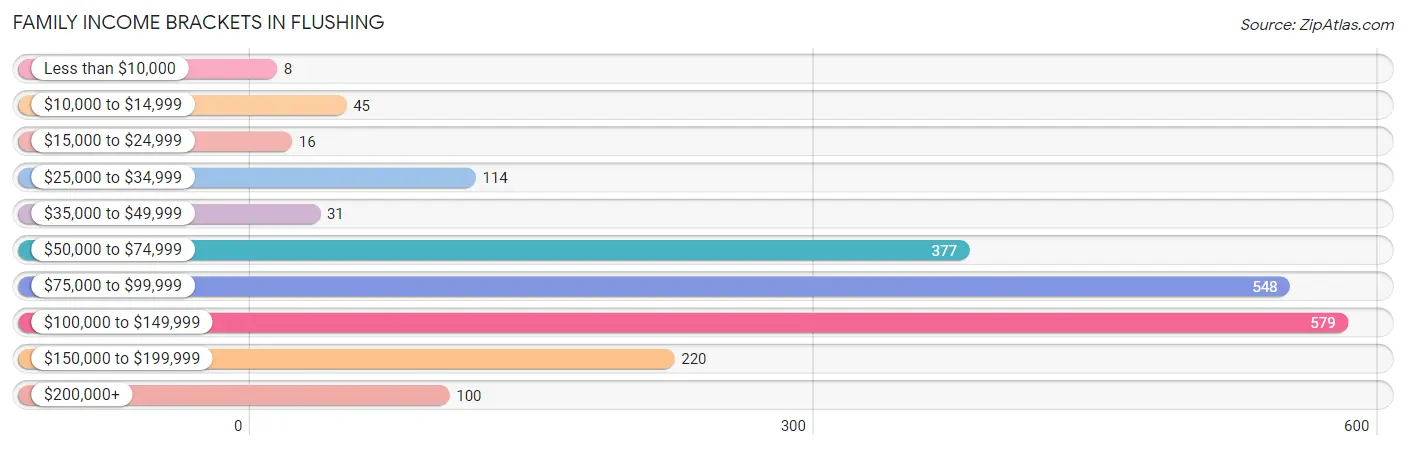
| Income Bracket | # Families | % Families |
| Less than $10,000 | 8 | 0.4% |
| $10,000 to $14,999 | 45 | 2.2% |
| $15,000 to $24,999 | 16 | 0.8% |
| $25,000 to $34,999 | 114 | 5.6% |
| $35,000 to $49,999 | 31 | 1.5% |
| $50,000 to $74,999 | 377 | 18.5% |
| $75,000 to $99,999 | 548 | 26.9% |
| $100,000 to $149,999 | 579 | 28.4% |
| $150,000 to $199,999 | 220 | 10.8% |
| $200,000+ | 100 | 4.9% |
Family Income by Famaliy Size in Flushing
5-person families (194 | 9.5%) account for the highest median family income in Flushing with $133,044 per family, while 2-person families (944 | 46.3%) have the highest median income of $40,364 per family member.
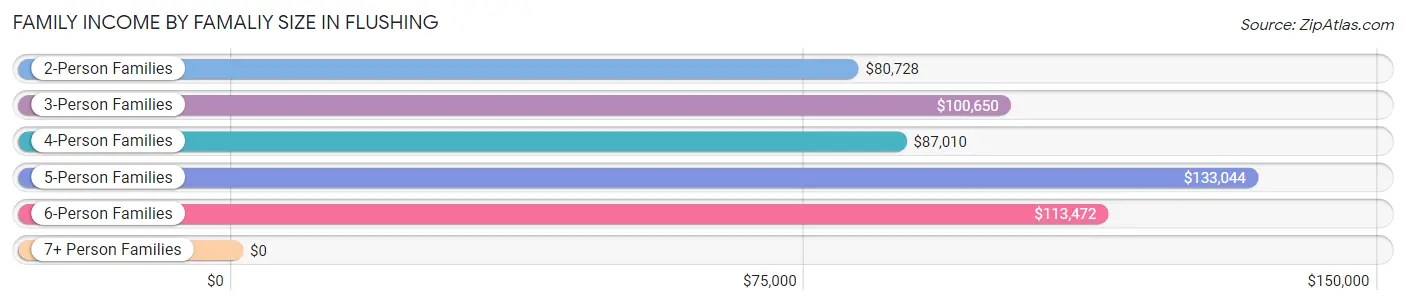
| Income Bracket | # Families | Median Income |
| 2-Person Families | 944 (46.3%) | $80,728 |
| 3-Person Families | 412 (20.2%) | $100,650 |
| 4-Person Families | 404 (19.8%) | $87,010 |
| 5-Person Families | 194 (9.5%) | $133,044 |
| 6-Person Families | 56 (2.8%) | $113,472 |
| 7+ Person Families | 28 (1.4%) | $0 |
| Total | 2,038 (100.0%) | $87,283 |
Family Income by Number of Earners in Flushing
The median family income in Flushing is $87,283, with families comprising 3+ earners (231) having the highest median family income of $143,661, while families with no earners (471) have the lowest median family income of $78,083, accounting for 11.3% and 23.1% of families, respectively.
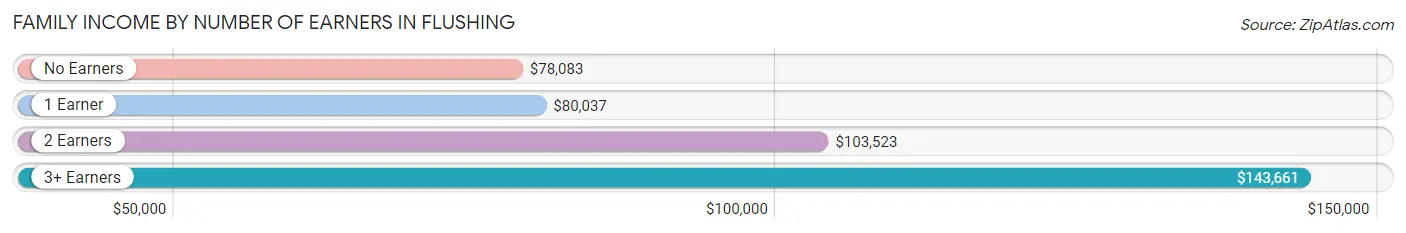
| Number of Earners | # Families | Median Income |
| No Earners | 471 (23.1%) | $78,083 |
| 1 Earner | 403 (19.8%) | $80,037 |
| 2 Earners | 933 (45.8%) | $103,523 |
| 3+ Earners | 231 (11.3%) | $143,661 |
| Total | 2,038 (100.0%) | $87,283 |
Household Income in Flushing
Household Income Brackets in Flushing
With 786 households falling in the category, the $50,000 to $74,999 income range is the most frequent in Flushing, accounting for 22.9% of all households. In contrast, only 86 households (2.5%) fall into the $15,000 to $24,999 income bracket, making it the least populous group.
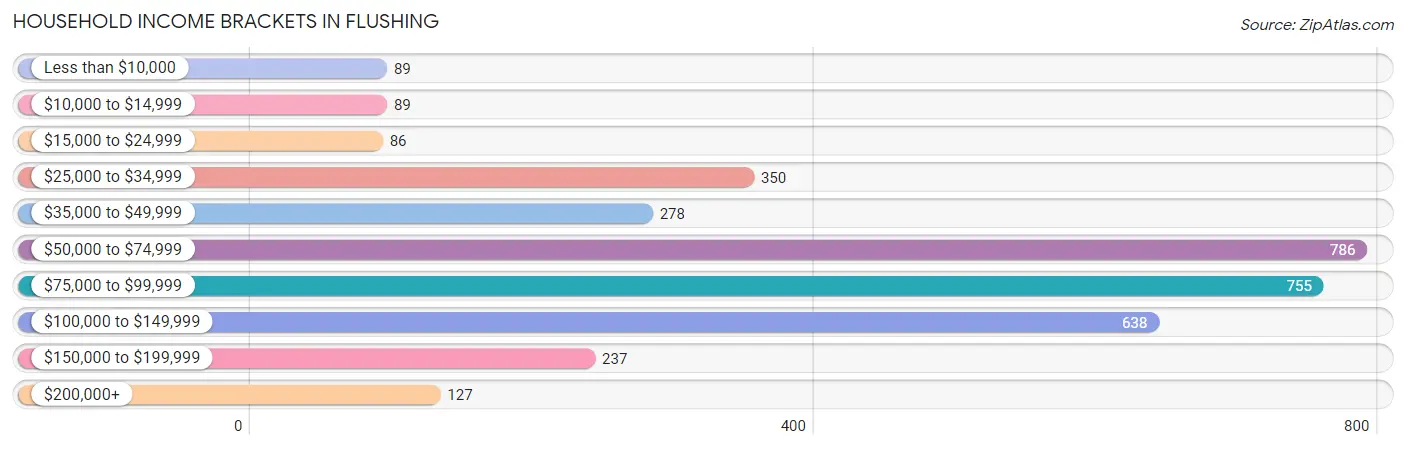
| Income Bracket | # Households | % Households |
| Less than $10,000 | 89 | 2.6% |
| $10,000 to $14,999 | 89 | 2.6% |
| $15,000 to $24,999 | 86 | 2.5% |
| $25,000 to $34,999 | 350 | 10.2% |
| $35,000 to $49,999 | 278 | 8.1% |
| $50,000 to $74,999 | 786 | 22.9% |
| $75,000 to $99,999 | 755 | 22.0% |
| $100,000 to $149,999 | 638 | 18.6% |
| $150,000 to $199,999 | 237 | 6.9% |
| $200,000+ | 127 | 3.7% |
Household Income by Householder Age in Flushing
The median household income in Flushing is $75,813, with the highest median household income of $93,086 found in the 45 to 64 years age bracket for the primary householder. A total of 1,013 households (29.5%) fall into this category. Meanwhile, the 15 to 24 years age bracket for the primary householder has the lowest median household income of $38,500, with 104 households (3.0%) in this group.
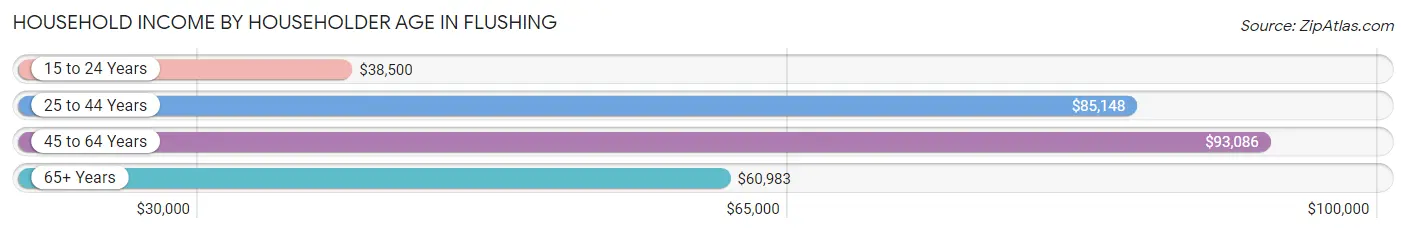
| Income Bracket | # Households | Median Income |
| 15 to 24 Years | 104 (3.0%) | $38,500 |
| 25 to 44 Years | 977 (28.5%) | $85,148 |
| 45 to 64 Years | 1,013 (29.5%) | $93,086 |
| 65+ Years | 1,338 (39.0%) | $60,983 |
| Total | 3,432 (100.0%) | $75,813 |
Poverty in Flushing
Income Below Poverty by Sex and Age in Flushing
With 3.1% poverty level for males and 10.4% for females among the residents of Flushing, 12 to 14 year old males and 18 to 24 year old females are the most vulnerable to poverty, with 16 males (9.6%) and 113 females (25.5%) in their respective age groups living below the poverty level.
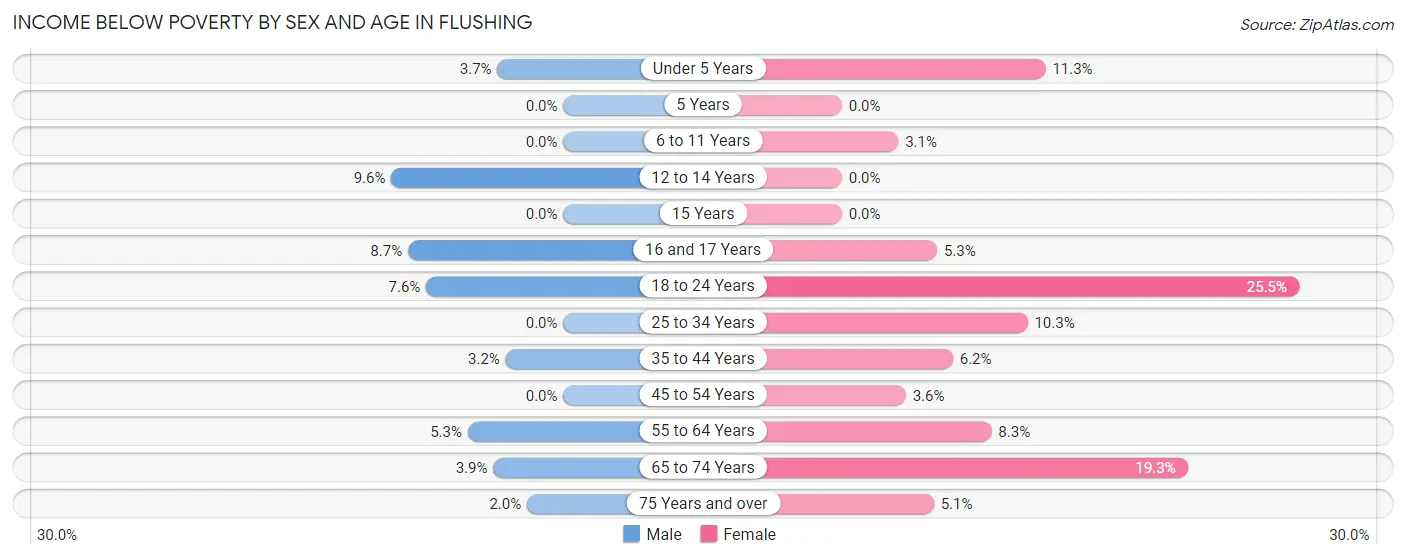
| Age Bracket | Male | Female |
| Under 5 Years | 9 (3.7%) | 22 (11.3%) |
| 5 Years | 0 (0.0%) | 0 (0.0%) |
| 6 to 11 Years | 0 (0.0%) | 9 (3.1%) |
| 12 to 14 Years | 16 (9.6%) | 0 (0.0%) |
| 15 Years | 0 (0.0%) | 0 (0.0%) |
| 16 and 17 Years | 16 (8.6%) | 8 (5.3%) |
| 18 to 24 Years | 12 (7.6%) | 113 (25.5%) |
| 25 to 34 Years | 0 (0.0%) | 43 (10.3%) |
| 35 to 44 Years | 19 (3.2%) | 26 (6.2%) |
| 45 to 54 Years | 0 (0.0%) | 18 (3.6%) |
| 55 to 64 Years | 23 (5.3%) | 40 (8.3%) |
| 65 to 74 Years | 22 (3.9%) | 139 (19.3%) |
| 75 Years and over | 4 (2.0%) | 24 (5.1%) |
| Total | 121 (3.1%) | 442 (10.4%) |
Income Above Poverty by Sex and Age in Flushing
According to the poverty statistics in Flushing, males aged 5 years and females aged 12 to 14 years are the age groups that are most secure financially, with 100.0% of males and 100.0% of females in these age groups living above the poverty line.
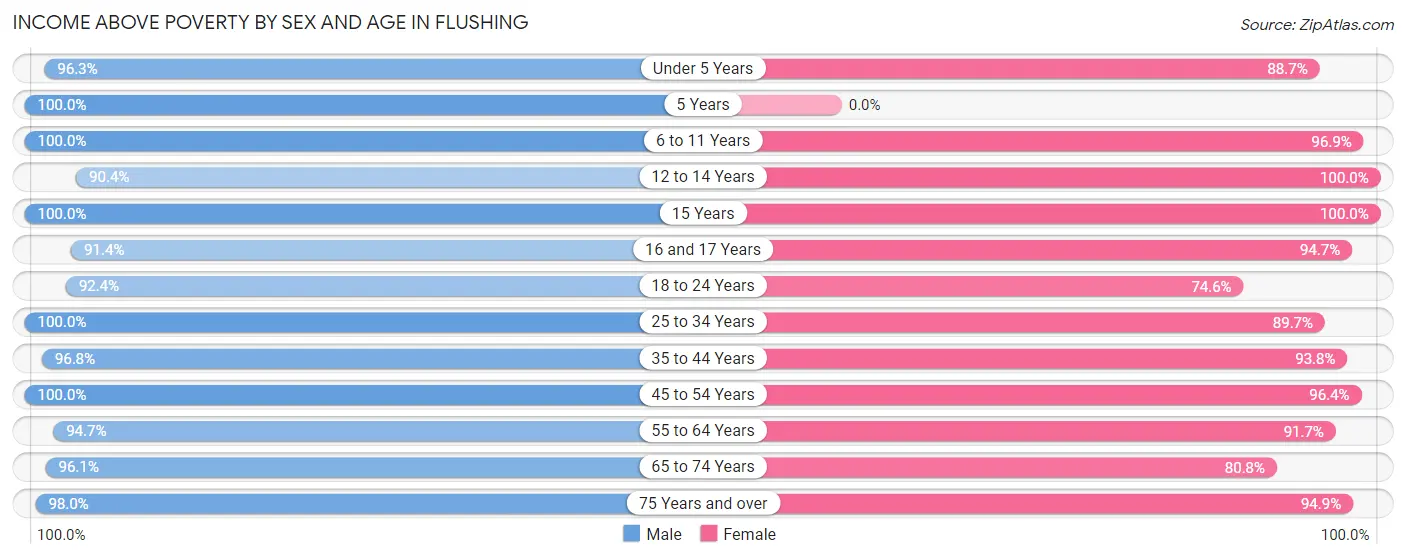
| Age Bracket | Male | Female |
| Under 5 Years | 236 (96.3%) | 172 (88.7%) |
| 5 Years | 67 (100.0%) | 0 (0.0%) |
| 6 to 11 Years | 430 (100.0%) | 278 (96.9%) |
| 12 to 14 Years | 151 (90.4%) | 146 (100.0%) |
| 15 Years | 39 (100.0%) | 30 (100.0%) |
| 16 and 17 Years | 169 (91.3%) | 143 (94.7%) |
| 18 to 24 Years | 145 (92.4%) | 331 (74.6%) |
| 25 to 34 Years | 519 (100.0%) | 373 (89.7%) |
| 35 to 44 Years | 572 (96.8%) | 395 (93.8%) |
| 45 to 54 Years | 338 (100.0%) | 488 (96.4%) |
| 55 to 64 Years | 409 (94.7%) | 440 (91.7%) |
| 65 to 74 Years | 542 (96.1%) | 583 (80.7%) |
| 75 Years and over | 194 (98.0%) | 445 (94.9%) |
| Total | 3,811 (96.9%) | 3,824 (89.6%) |
Income Below Poverty Among Married-Couple Families in Flushing
The poverty statistics for married-couple families in Flushing show that 2.4% or 40 of the total 1,658 families live below the poverty line. Families with 1 or 2 children have the highest poverty rate of 3.1%, comprising of 18 families. On the other hand, families with 3 or 4 children have the lowest poverty rate of 0.0%, which includes 0 families.
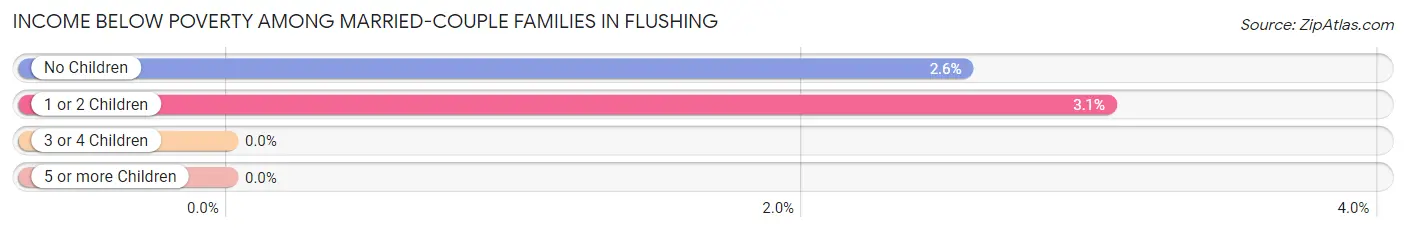
| Children | Above Poverty | Below Poverty |
| No Children | 836 (97.4%) | 22 (2.6%) |
| 1 or 2 Children | 570 (96.9%) | 18 (3.1%) |
| 3 or 4 Children | 207 (100.0%) | 0 (0.0%) |
| 5 or more Children | 5 (100.0%) | 0 (0.0%) |
| Total | 1,618 (97.6%) | 40 (2.4%) |
Income Below Poverty Among Single-Parent Households in Flushing
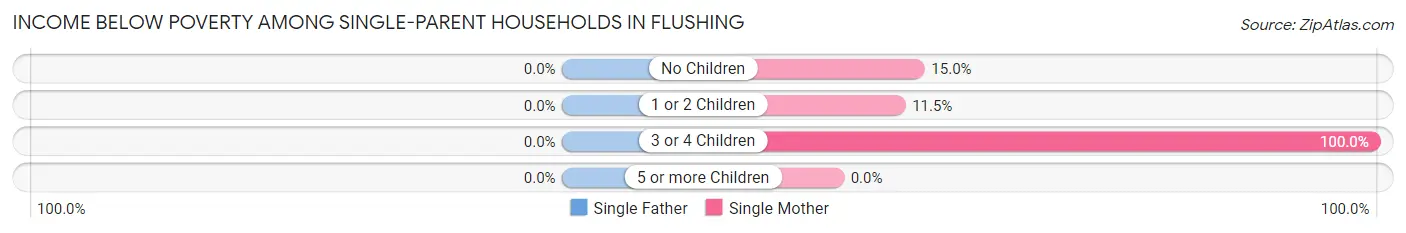
| Children | Single Father | Single Mother |
| No Children | 0 (0.0%) | 17 (15.0%) |
| 1 or 2 Children | 0 (0.0%) | 22 (11.5%) |
| 3 or 4 Children | 0 (0.0%) | 9 (100.0%) |
| 5 or more Children | 0 (0.0%) | 0 (0.0%) |
| Total | 0 (0.0%) | 48 (15.3%) |
Income Below Poverty Among Married-Couple vs Single-Parent Households in Flushing
The poverty data for Flushing shows that 40 of the married-couple family households (2.4%) and 48 of the single-parent households (12.6%) are living below the poverty level. Within the married-couple family households, those with 1 or 2 children have the highest poverty rate, with 18 households (3.1%) falling below the poverty line. Among the single-parent households, those with 3 or 4 children have the highest poverty rate, with 9 household (100.0%) living below poverty.
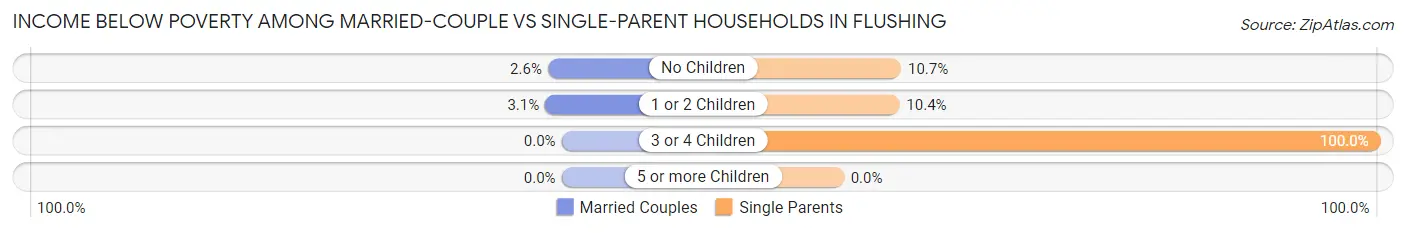
| Children | Married-Couple Families | Single-Parent Households |
| No Children | 22 (2.6%) | 17 (10.7%) |
| 1 or 2 Children | 18 (3.1%) | 22 (10.4%) |
| 3 or 4 Children | 0 (0.0%) | 9 (100.0%) |
| 5 or more Children | 0 (0.0%) | 0 (0.0%) |
| Total | 40 (2.4%) | 48 (12.6%) |
Race in Flushing
The most populous races in Flushing are White / Caucasian (7,423 | 88.9%), Two or more Races (592 | 7.1%), and Hispanic or Latino (250 | 3.0%).
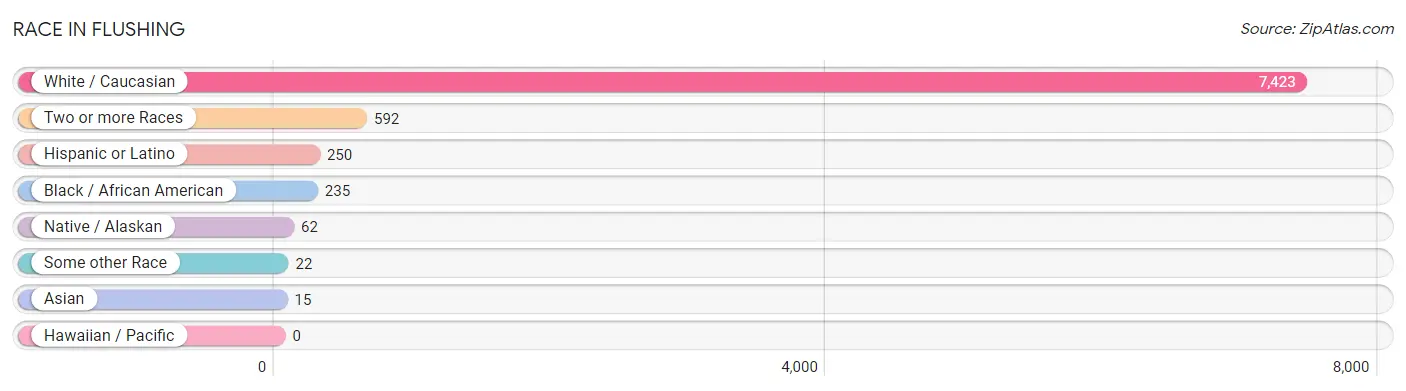
| Race | # Population | % Population |
| Asian | 15 | 0.2% |
| Black / African American | 235 | 2.8% |
| Hawaiian / Pacific | 0 | 0.0% |
| Hispanic or Latino | 250 | 3.0% |
| Native / Alaskan | 62 | 0.7% |
| White / Caucasian | 7,423 | 88.9% |
| Two or more Races | 592 | 7.1% |
| Some other Race | 22 | 0.3% |
| Total | 8,349 | 100.0% |
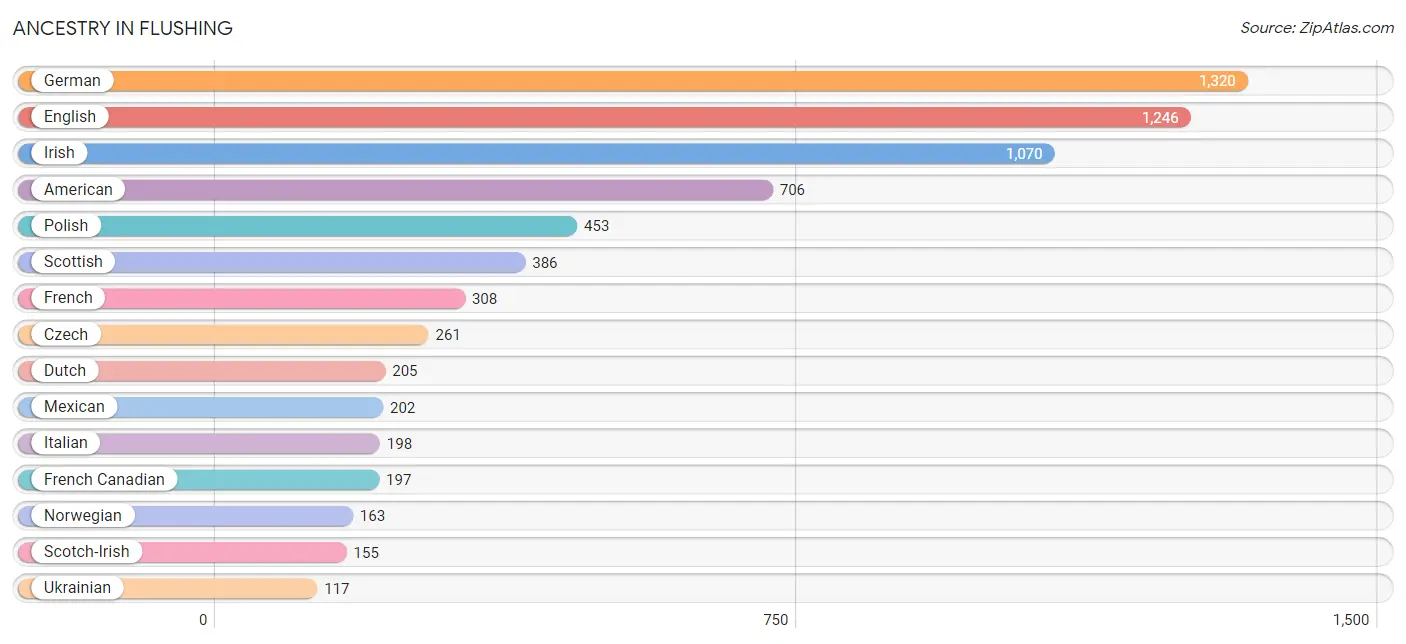
Ancestry in Flushing
The most populous ancestries reported in Flushing are German (1,320 | 15.8%), English (1,246 | 14.9%), Irish (1,070 | 12.8%), American (706 | 8.5%), and Polish (453 | 5.4%), together accounting for 57.4% of all Flushing residents.
| Ancestry | # Population | % Population |
| American | 706 | 8.5% |
| Apache | 22 | 0.3% |
| Arab | 108 | 1.3% |
| Assyrian / Chaldean / Syriac | 38 | 0.5% |
| Austrian | 13 | 0.2% |
| Belgian | 24 | 0.3% |
| British | 103 | 1.2% |
| Canadian | 47 | 0.6% |
| Chippewa | 90 | 1.1% |
| Croatian | 14 | 0.2% |
| Cuban | 47 | 0.6% |
| Czech | 261 | 3.1% |
| Czechoslovakian | 100 | 1.2% |
| Dutch | 205 | 2.5% |
| English | 1,246 | 14.9% |
| European | 76 | 0.9% |
| Finnish | 18 | 0.2% |
| French | 308 | 3.7% |
| French Canadian | 197 | 2.4% |
| German | 1,320 | 15.8% |
| Hungarian | 84 | 1.0% |
| Indian (Asian) | 5 | 0.1% |
| Irish | 1,070 | 12.8% |
| Italian | 198 | 2.4% |
| Jordanian | 9 | 0.1% |
| Korean | 10 | 0.1% |
| Lebanese | 41 | 0.5% |
| Lithuanian | 25 | 0.3% |
| Maltese | 6 | 0.1% |
| Mexican | 202 | 2.4% |
| Northern European | 12 | 0.1% |
| Norwegian | 163 | 1.9% |
| Polish | 453 | 5.4% |
| Potawatomi | 4 | 0.1% |
| Russian | 59 | 0.7% |
| Scandinavian | 7 | 0.1% |
| Scotch-Irish | 155 | 1.9% |
| Scottish | 386 | 4.6% |
| Slavic | 57 | 0.7% |
| Slovak | 75 | 0.9% |
| Swedish | 80 | 1.0% |
| Swiss | 98 | 1.2% |
| Ukrainian | 117 | 1.4% |
| Welsh | 44 | 0.5% | View All 44 Rows |
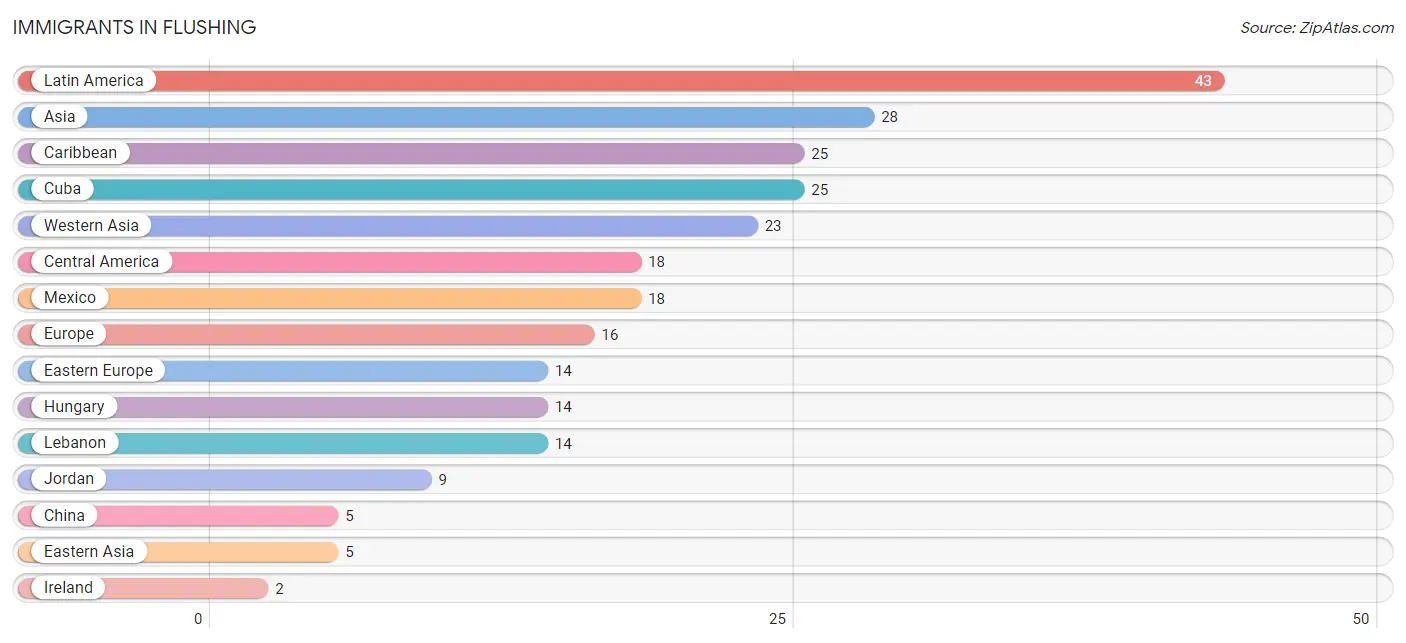
Immigrants in Flushing
The most numerous immigrant groups reported in Flushing came from Latin America (43 | 0.5%), Asia (28 | 0.3%), Caribbean (25 | 0.3%), Cuba (25 | 0.3%), and Western Asia (23 | 0.3%), together accounting for 1.7% of all Flushing residents.
| Immigration Origin | # Population | % Population |
| Asia | 28 | 0.3% |
| Caribbean | 25 | 0.3% |
| Central America | 18 | 0.2% |
| China | 5 | 0.1% |
| Cuba | 25 | 0.3% |
| Eastern Asia | 5 | 0.1% |
| Eastern Europe | 14 | 0.2% |
| Europe | 16 | 0.2% |
| Hungary | 14 | 0.2% |
| Ireland | 2 | 0.0% |
| Jordan | 9 | 0.1% |
| Latin America | 43 | 0.5% |
| Lebanon | 14 | 0.2% |
| Mexico | 18 | 0.2% |
| Northern Europe | 2 | 0.0% |
| Western Asia | 23 | 0.3% | View All 16 Rows |
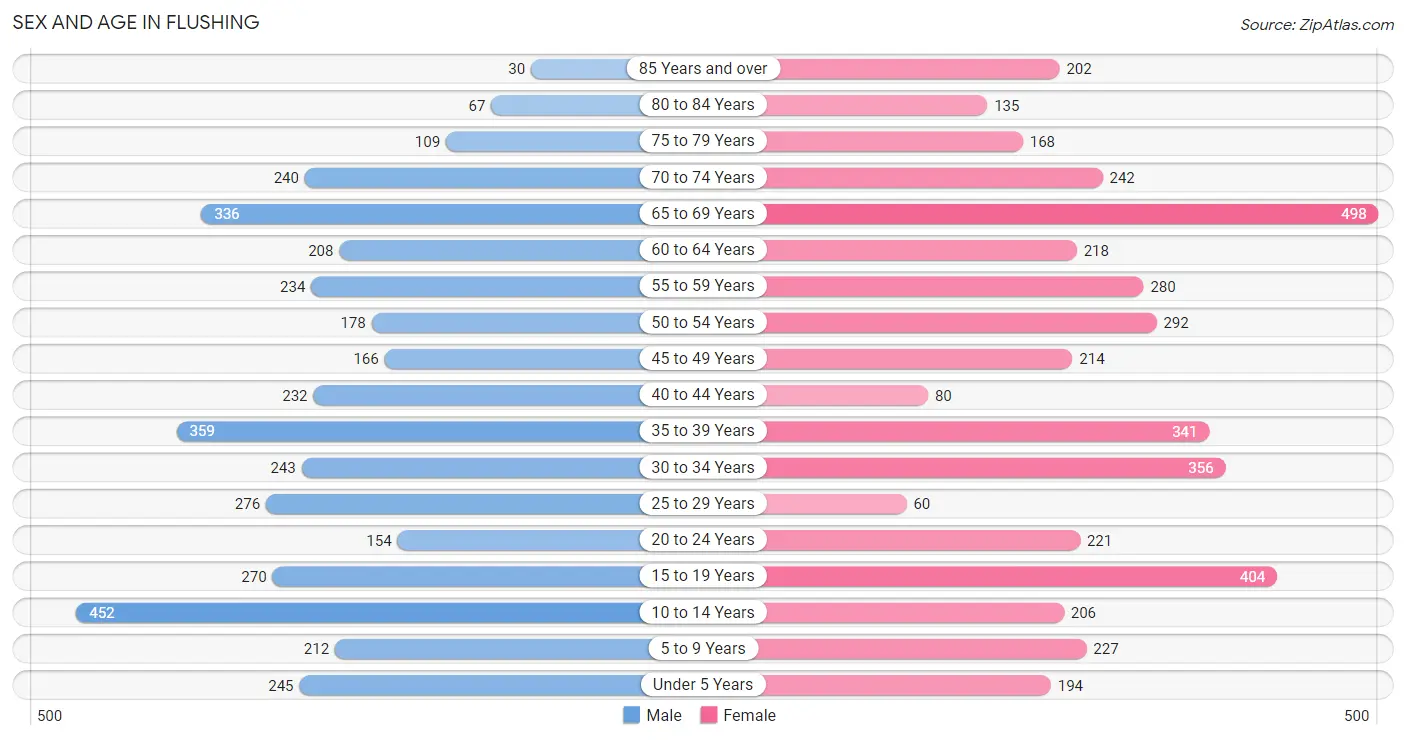
Sex and Age in Flushing
Sex and Age in Flushing
The most populous age groups in Flushing are 10 to 14 Years (452 | 11.3%) for men and 65 to 69 Years (498 | 11.5%) for women.
| Age Bracket | Male | Female |
| Under 5 Years | 245 (6.1%) | 194 (4.5%) |
| 5 to 9 Years | 212 (5.3%) | 227 (5.2%) |
| 10 to 14 Years | 452 (11.3%) | 206 (4.8%) |
| 15 to 19 Years | 270 (6.7%) | 404 (9.3%) |
| 20 to 24 Years | 154 (3.8%) | 221 (5.1%) |
| 25 to 29 Years | 276 (6.9%) | 60 (1.4%) |
| 30 to 34 Years | 243 (6.1%) | 356 (8.2%) |
| 35 to 39 Years | 359 (8.9%) | 341 (7.9%) |
| 40 to 44 Years | 232 (5.8%) | 80 (1.8%) |
| 45 to 49 Years | 166 (4.1%) | 214 (4.9%) |
| 50 to 54 Years | 178 (4.4%) | 292 (6.7%) |
| 55 to 59 Years | 234 (5.8%) | 280 (6.5%) |
| 60 to 64 Years | 208 (5.2%) | 218 (5.0%) |
| 65 to 69 Years | 336 (8.4%) | 498 (11.5%) |
| 70 to 74 Years | 240 (6.0%) | 242 (5.6%) |
| 75 to 79 Years | 109 (2.7%) | 168 (3.9%) |
| 80 to 84 Years | 67 (1.7%) | 135 (3.1%) |
| 85 Years and over | 30 (0.7%) | 202 (4.7%) |
| Total | 4,011 (100.0%) | 4,338 (100.0%) |
Families and Households in Flushing
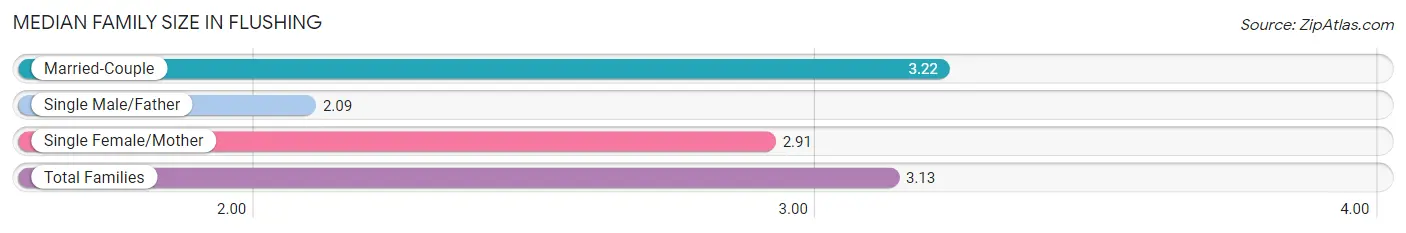
Median Family Size in Flushing
The median family size in Flushing is 3.13 persons per family, with married-couple families (1,658 | 81.4%) accounting for the largest median family size of 3.22 persons per family. On the other hand, single male/father families (66 | 3.2%) represent the smallest median family size with 2.09 persons per family.
| Family Type | # Families | Family Size |
| Married-Couple | 1,658 (81.4%) | 3.22 |
| Single Male/Father | 66 (3.2%) | 2.09 |
| Single Female/Mother | 314 (15.4%) | 2.91 |
| Total Families | 2,038 (100.0%) | 3.13 |
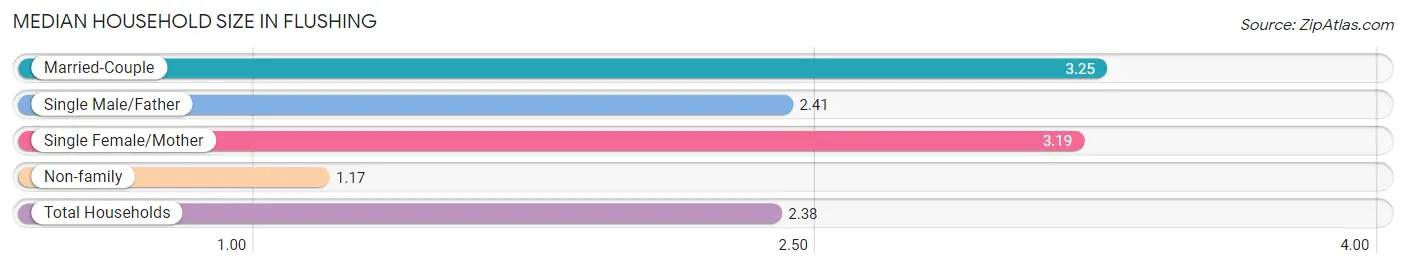
Median Household Size in Flushing
The median household size in Flushing is 2.38 persons per household, with married-couple households (1,658 | 48.3%) accounting for the largest median household size of 3.25 persons per household. non-family households (1,394 | 40.6%) represent the smallest median household size with 1.17 persons per household.
| Household Type | # Households | Household Size |
| Married-Couple | 1,658 (48.3%) | 3.25 |
| Single Male/Father | 66 (1.9%) | 2.41 |
| Single Female/Mother | 314 (9.1%) | 3.19 |
| Non-family | 1,394 (40.6%) | 1.17 |
| Total Households | 3,432 (100.0%) | 2.38 |
Household Size by Marriage Status in Flushing
Out of a total of 3,432 households in Flushing, 2,038 (59.4%) are family households, while 1,394 (40.6%) are nonfamily households. The most numerous type of family households are 2-person households, comprising 862, and the most common type of nonfamily households are 1-person households, comprising 1,209.
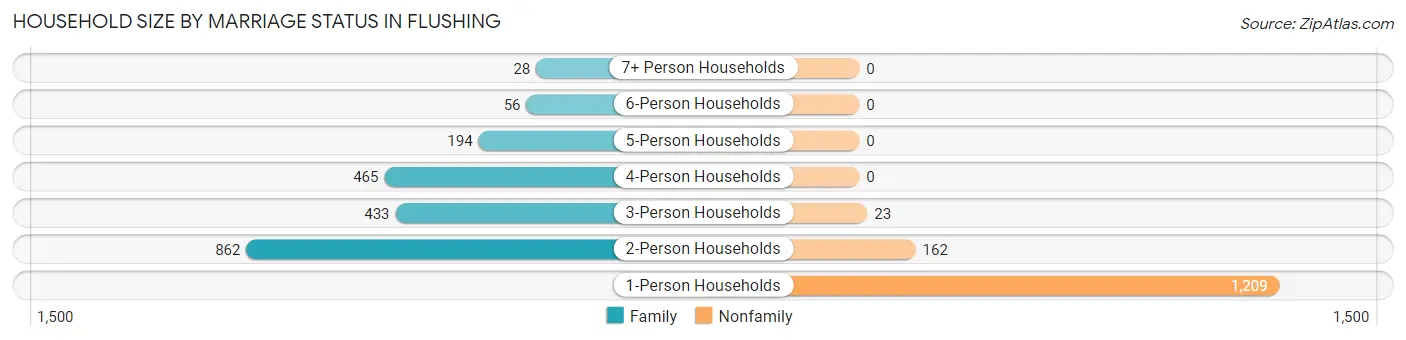
| Household Size | Family Households | Nonfamily Households |
| 1-Person Households | - | 1,209 (35.2%) |
| 2-Person Households | 862 (25.1%) | 162 (4.7%) |
| 3-Person Households | 433 (12.6%) | 23 (0.7%) |
| 4-Person Households | 465 (13.6%) | 0 (0.0%) |
| 5-Person Households | 194 (5.7%) | 0 (0.0%) |
| 6-Person Households | 56 (1.6%) | 0 (0.0%) |
| 7+ Person Households | 28 (0.8%) | 0 (0.0%) |
| Total | 2,038 (59.4%) | 1,394 (40.6%) |
Female Fertility in Flushing
Fertility by Age in Flushing
Average fertility rate in Flushing is 28.0 births per 1,000 women. Women in the age bracket of 20 to 34 years have the highest fertility rate with 53.0 births per 1,000 women. Women in the age bracket of 20 to 34 years acount for 70.8% of all women with births.
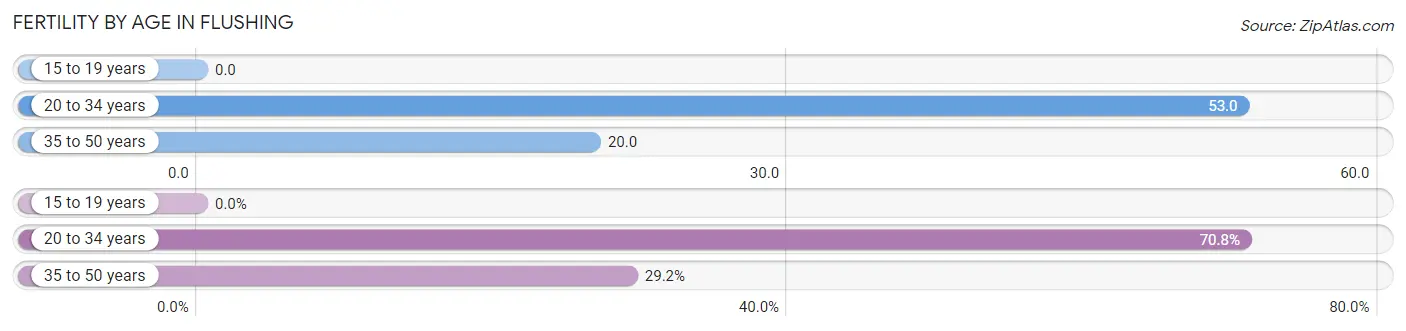
| Age Bracket | Women with Births | Births / 1,000 Women |
| 15 to 19 years | 0 (0.0%) | 0.0 |
| 20 to 34 years | 34 (70.8%) | 53.0 |
| 35 to 50 years | 14 (29.2%) | 20.0 |
| Total | 48 (100.0%) | 28.0 |
Fertility by Age by Marriage Status in Flushing
72.9% of women with births (48) in Flushing are married. The highest percentage of unmarried women with births falls into 35 to 50 years age bracket with 64.3% of them unmarried at the time of birth, while the lowest percentage of unmarried women with births belong to 20 to 34 years age bracket with 11.8% of them unmarried.
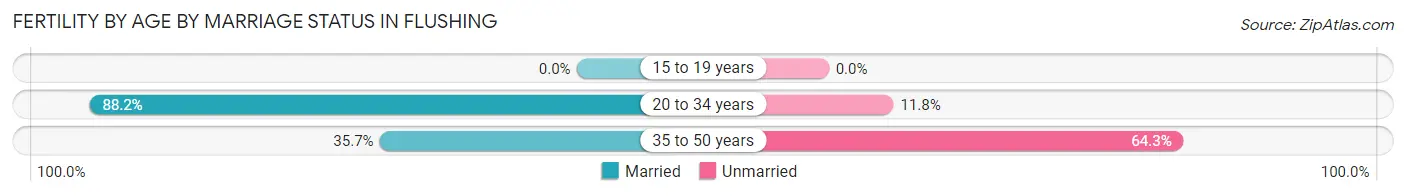
| Age Bracket | Married | Unmarried |
| 15 to 19 years | 0 (0.0%) | 0 (0.0%) |
| 20 to 34 years | 30 (88.2%) | 4 (11.8%) |
| 35 to 50 years | 5 (35.7%) | 9 (64.3%) |
| Total | 35 (72.9%) | 13 (27.1%) |
Fertility by Education in Flushing
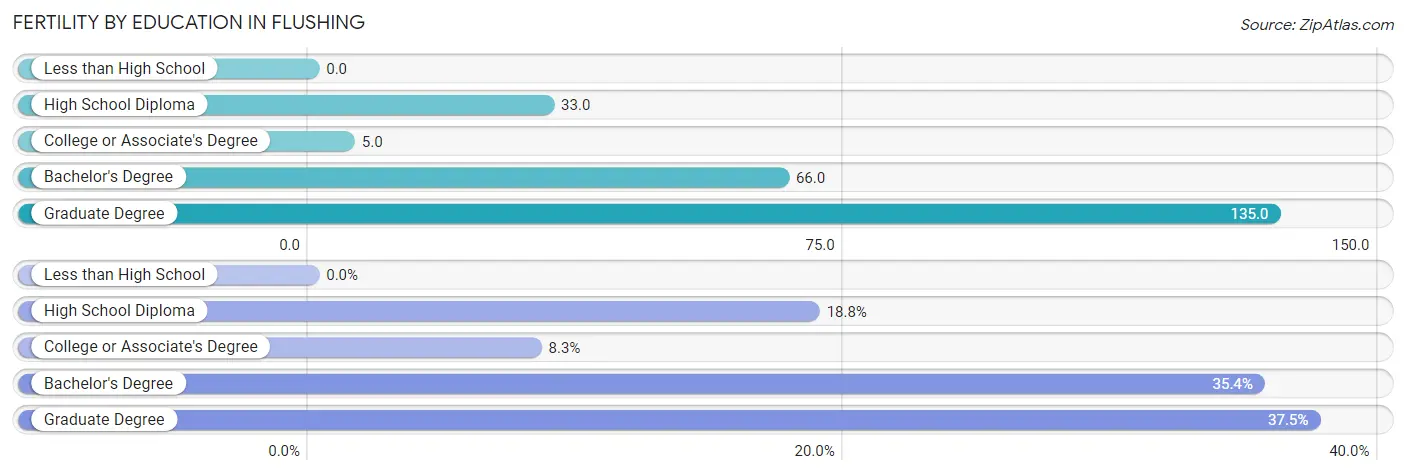
| Educational Attainment | Women with Births | Births / 1,000 Women |
| Less than High School | 0 (0.0%) | 0.0 |
| High School Diploma | 9 (18.8%) | 33.0 |
| College or Associate's Degree | 4 (8.3%) | 5.0 |
| Bachelor's Degree | 17 (35.4%) | 66.0 |
| Graduate Degree | 18 (37.5%) | 135.0 |
| Total | 48 (100.0%) | 28.0 |
Fertility by Education by Marriage Status in Flushing
27.1% of women with births in Flushing are unmarried. Women with the educational attainment of bachelor's degree are most likely to be married with 100.0% of them married at childbirth, while women with the educational attainment of high school diploma are least likely to be married with 100.0% of them unmarried at childbirth.
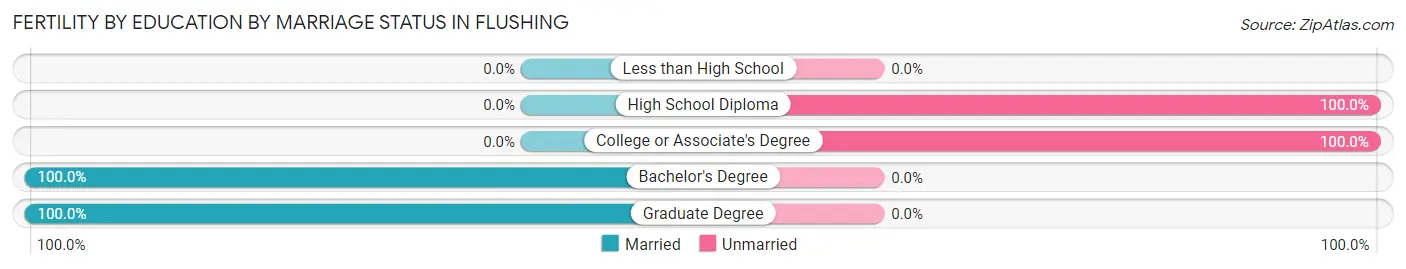
| Educational Attainment | Married | Unmarried |
| Less than High School | 0 (0.0%) | 0 (0.0%) |
| High School Diploma | 0 (0.0%) | 9 (100.0%) |
| College or Associate's Degree | 0 (0.0%) | 4 (100.0%) |
| Bachelor's Degree | 17 (100.0%) | 0 (0.0%) |
| Graduate Degree | 18 (100.0%) | 0 (0.0%) |
| Total | 35 (72.9%) | 13 (27.1%) |
Employment Characteristics in Flushing
Employment by Class of Employer in Flushing
Among the 3,627 employed individuals in Flushing, private company employees (2,424 | 66.8%), not-for-profit organizations (532 | 14.7%), and local government employees (257 | 7.1%) make up the most common classes of employment.
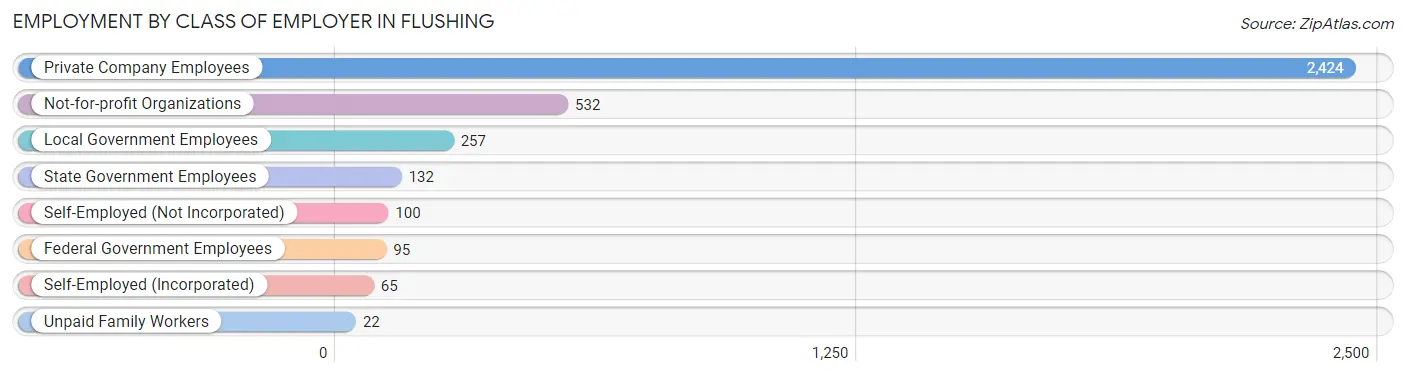
| Employer Class | # Employees | % Employees |
| Private Company Employees | 2,424 | 66.8% |
| Self-Employed (Incorporated) | 65 | 1.8% |
| Self-Employed (Not Incorporated) | 100 | 2.8% |
| Not-for-profit Organizations | 532 | 14.7% |
| Local Government Employees | 257 | 7.1% |
| State Government Employees | 132 | 3.6% |
| Federal Government Employees | 95 | 2.6% |
| Unpaid Family Workers | 22 | 0.6% |
| Total | 3,627 | 100.0% |
Employment Status by Age in Flushing
According to the labor force statistics for Flushing, out of the total population over 16 years of age (6,744), 58.3% or 3,932 individuals are in the labor force, with 6.6% or 260 of them unemployed. The age group with the highest labor force participation rate is 30 to 34 years, with 96.3% or 577 individuals in the labor force. Within the labor force, the 30 to 34 years age range has the highest percentage of unemployed individuals, with 20.3% or 117 of them being unemployed.
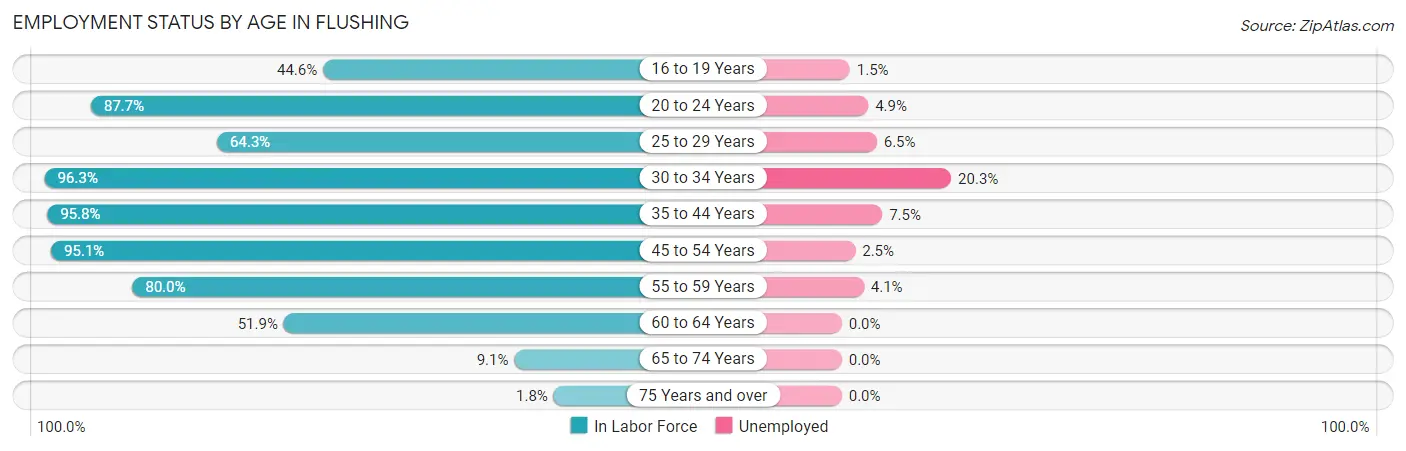
| Age Bracket | In Labor Force | Unemployed |
| 16 to 19 Years | 270 (44.6%) | 4 (1.5%) |
| 20 to 24 Years | 329 (87.7%) | 16 (4.9%) |
| 25 to 29 Years | 216 (64.3%) | 14 (6.5%) |
| 30 to 34 Years | 577 (96.3%) | 117 (20.3%) |
| 35 to 44 Years | 969 (95.8%) | 73 (7.5%) |
| 45 to 54 Years | 808 (95.1%) | 20 (2.5%) |
| 55 to 59 Years | 411 (80.0%) | 17 (4.1%) |
| 60 to 64 Years | 221 (51.9%) | 0 (0.0%) |
| 65 to 74 Years | 120 (9.1%) | 0 (0.0%) |
| 75 Years and over | 13 (1.8%) | 0 (0.0%) |
| Total | 3,932 (58.3%) | 260 (6.6%) |
Employment Status by Educational Attainment in Flushing
According to labor force statistics for Flushing, 85.7% of individuals (3,203) out of the total population between 25 and 64 years of age (3,737) are in the labor force, with 7.5% or 240 of them being unemployed. The group with the highest labor force participation rate are those with the educational attainment of bachelor's degree or higher, with 94.4% or 930 individuals in the labor force. Within the labor force, individuals with college / associate degree education have the highest percentage of unemployment, with 10.5% or 155 of them being unemployed.
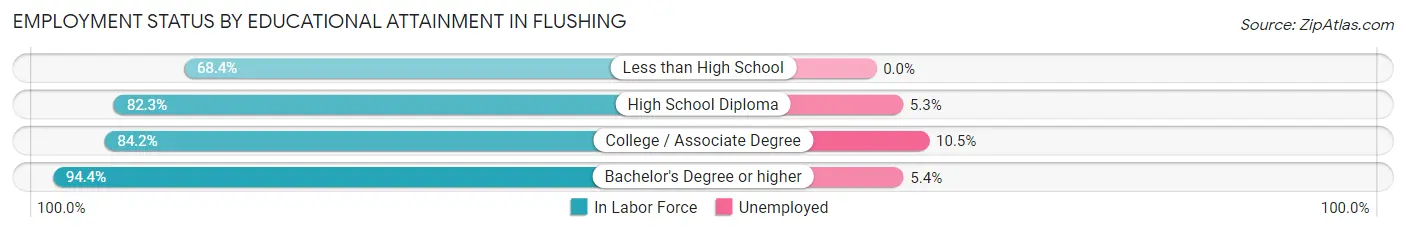
| Educational Attainment | In Labor Force | Unemployed |
| Less than High School | 132 (68.4%) | 0 (0.0%) |
| High School Diploma | 659 (82.3%) | 42 (5.3%) |
| College / Associate Degree | 1,480 (84.2%) | 185 (10.5%) |
| Bachelor's Degree or higher | 930 (94.4%) | 53 (5.4%) |
| Total | 3,203 (85.7%) | 280 (7.5%) |
Employment Occupations by Sex in Flushing
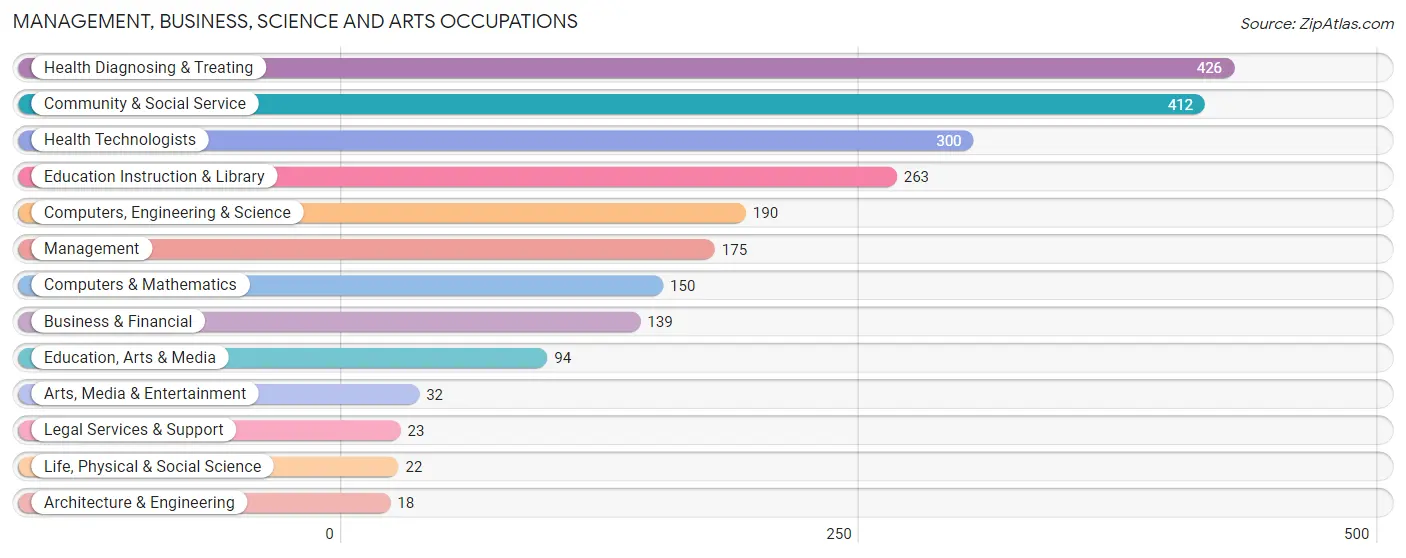
Management, Business, Science and Arts Occupations
The most common Management, Business, Science and Arts occupations in Flushing are Health Diagnosing & Treating (426 | 11.6%), Community & Social Service (412 | 11.2%), Health Technologists (300 | 8.2%), Education Instruction & Library (263 | 7.2%), and Computers, Engineering & Science (190 | 5.2%).
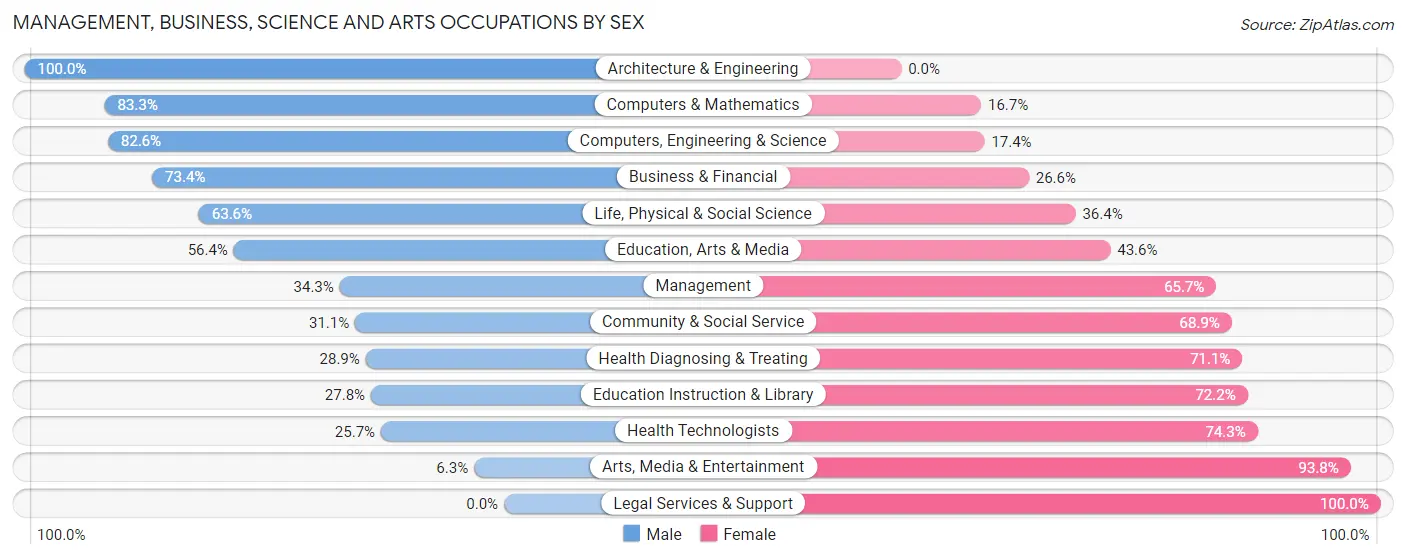
Management, Business, Science and Arts Occupations by Sex
Within the Management, Business, Science and Arts occupations in Flushing, the most male-oriented occupations are Architecture & Engineering (100.0%), Computers & Mathematics (83.3%), and Computers, Engineering & Science (82.6%), while the most female-oriented occupations are Legal Services & Support (100.0%), Arts, Media & Entertainment (93.8%), and Health Technologists (74.3%).
| Occupation | Male | Female |
| Management | 60 (34.3%) | 115 (65.7%) |
| Business & Financial | 102 (73.4%) | 37 (26.6%) |
| Computers, Engineering & Science | 157 (82.6%) | 33 (17.4%) |
| Computers & Mathematics | 125 (83.3%) | 25 (16.7%) |
| Architecture & Engineering | 18 (100.0%) | 0 (0.0%) |
| Life, Physical & Social Science | 14 (63.6%) | 8 (36.4%) |
| Community & Social Service | 128 (31.1%) | 284 (68.9%) |
| Education, Arts & Media | 53 (56.4%) | 41 (43.6%) |
| Legal Services & Support | 0 (0.0%) | 23 (100.0%) |
| Education Instruction & Library | 73 (27.8%) | 190 (72.2%) |
| Arts, Media & Entertainment | 2 (6.2%) | 30 (93.8%) |
| Health Diagnosing & Treating | 123 (28.9%) | 303 (71.1%) |
| Health Technologists | 77 (25.7%) | 223 (74.3%) |
| Total (Category) | 570 (42.5%) | 772 (57.5%) |
| Total (Overall) | 1,834 (49.9%) | 1,839 (50.1%) |
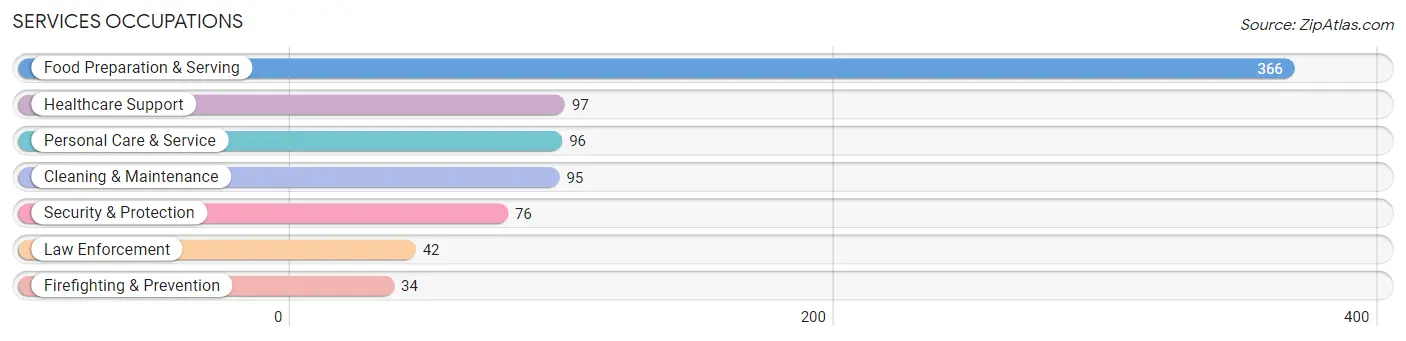
Services Occupations
The most common Services occupations in Flushing are Food Preparation & Serving (366 | 10.0%), Healthcare Support (97 | 2.6%), Personal Care & Service (96 | 2.6%), Cleaning & Maintenance (95 | 2.6%), and Security & Protection (76 | 2.1%).
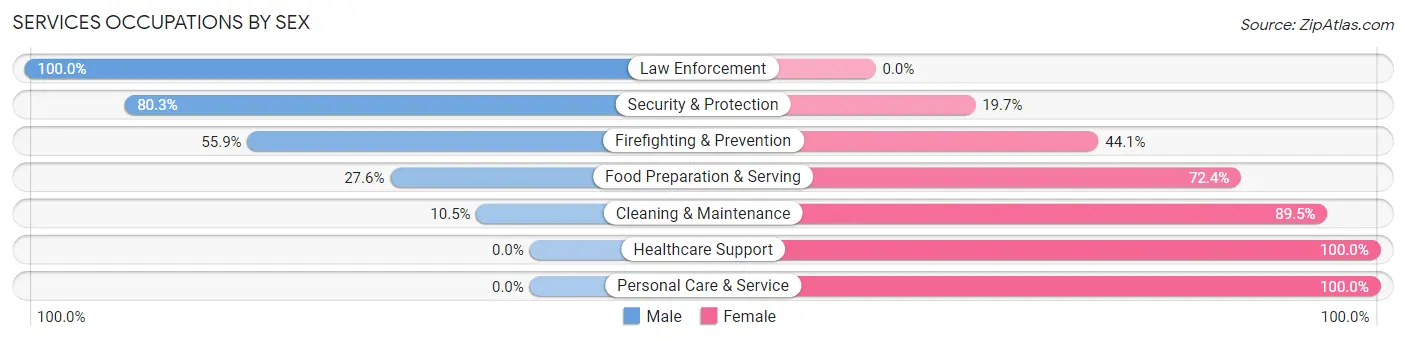
Services Occupations by Sex
Within the Services occupations in Flushing, the most male-oriented occupations are Law Enforcement (100.0%), Security & Protection (80.3%), and Firefighting & Prevention (55.9%), while the most female-oriented occupations are Healthcare Support (100.0%), Personal Care & Service (100.0%), and Cleaning & Maintenance (89.5%).
| Occupation | Male | Female |
| Healthcare Support | 0 (0.0%) | 97 (100.0%) |
| Security & Protection | 61 (80.3%) | 15 (19.7%) |
| Firefighting & Prevention | 19 (55.9%) | 15 (44.1%) |
| Law Enforcement | 42 (100.0%) | 0 (0.0%) |
| Food Preparation & Serving | 101 (27.6%) | 265 (72.4%) |
| Cleaning & Maintenance | 10 (10.5%) | 85 (89.5%) |
| Personal Care & Service | 0 (0.0%) | 96 (100.0%) |
| Total (Category) | 172 (23.6%) | 558 (76.4%) |
| Total (Overall) | 1,834 (49.9%) | 1,839 (50.1%) |
Sales and Office Occupations
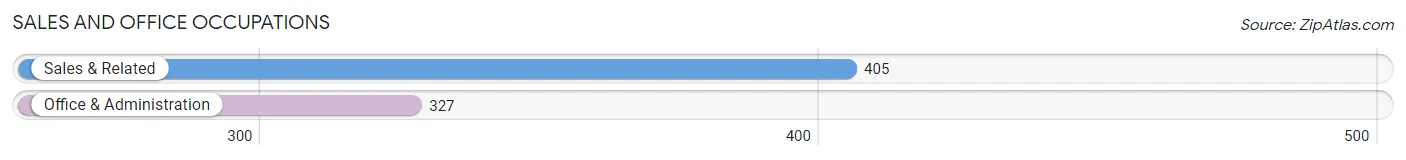
The most common Sales and Office occupations in Flushing are Sales & Related (405 | 11.0%), and Office & Administration (327 | 8.9%).
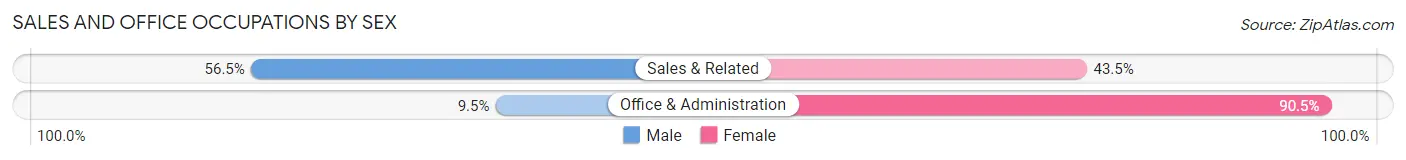
Sales and Office Occupations by Sex
| Occupation | Male | Female |
| Sales & Related | 229 (56.5%) | 176 (43.5%) |
| Office & Administration | 31 (9.5%) | 296 (90.5%) |
| Total (Category) | 260 (35.5%) | 472 (64.5%) |
| Total (Overall) | 1,834 (49.9%) | 1,839 (50.1%) |
Natural Resources, Construction and Maintenance Occupations
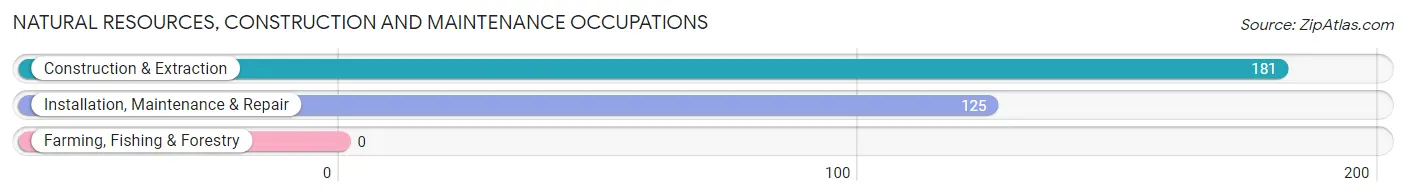
The most common Natural Resources, Construction and Maintenance occupations in Flushing are Construction & Extraction (181 | 4.9%), and Installation, Maintenance & Repair (125 | 3.4%).
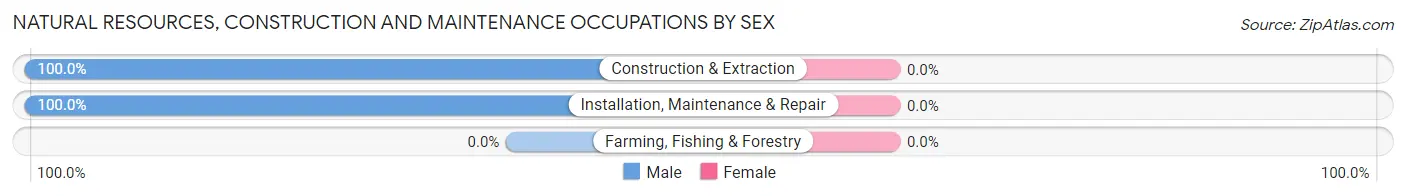
Natural Resources, Construction and Maintenance Occupations by Sex
| Occupation | Male | Female |
| Farming, Fishing & Forestry | 0 (0.0%) | 0 (0.0%) |
| Construction & Extraction | 181 (100.0%) | 0 (0.0%) |
| Installation, Maintenance & Repair | 125 (100.0%) | 0 (0.0%) |
| Total (Category) | 306 (100.0%) | 0 (0.0%) |
| Total (Overall) | 1,834 (49.9%) | 1,839 (50.1%) |
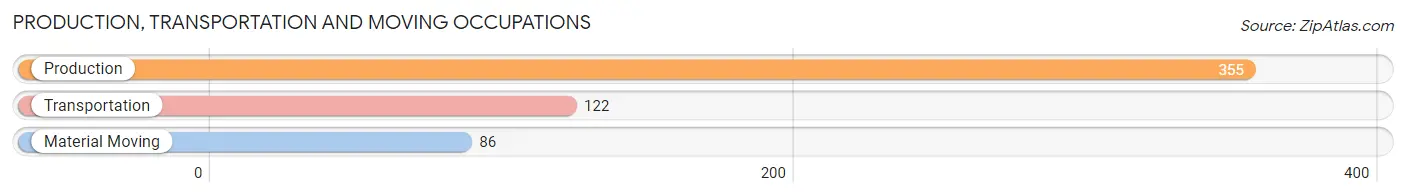
Production, Transportation and Moving Occupations
The most common Production, Transportation and Moving occupations in Flushing are Production (355 | 9.7%), Transportation (122 | 3.3%), and Material Moving (86 | 2.3%).
Production, Transportation and Moving Occupations by Sex
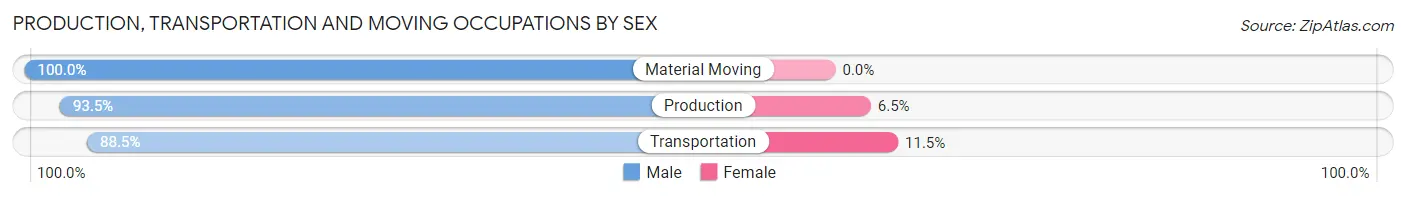
| Occupation | Male | Female |
| Production | 332 (93.5%) | 23 (6.5%) |
| Transportation | 108 (88.5%) | 14 (11.5%) |
| Material Moving | 86 (100.0%) | 0 (0.0%) |
| Total (Category) | 526 (93.4%) | 37 (6.6%) |
| Total (Overall) | 1,834 (49.9%) | 1,839 (50.1%) |
Employment Industries by Sex in Flushing
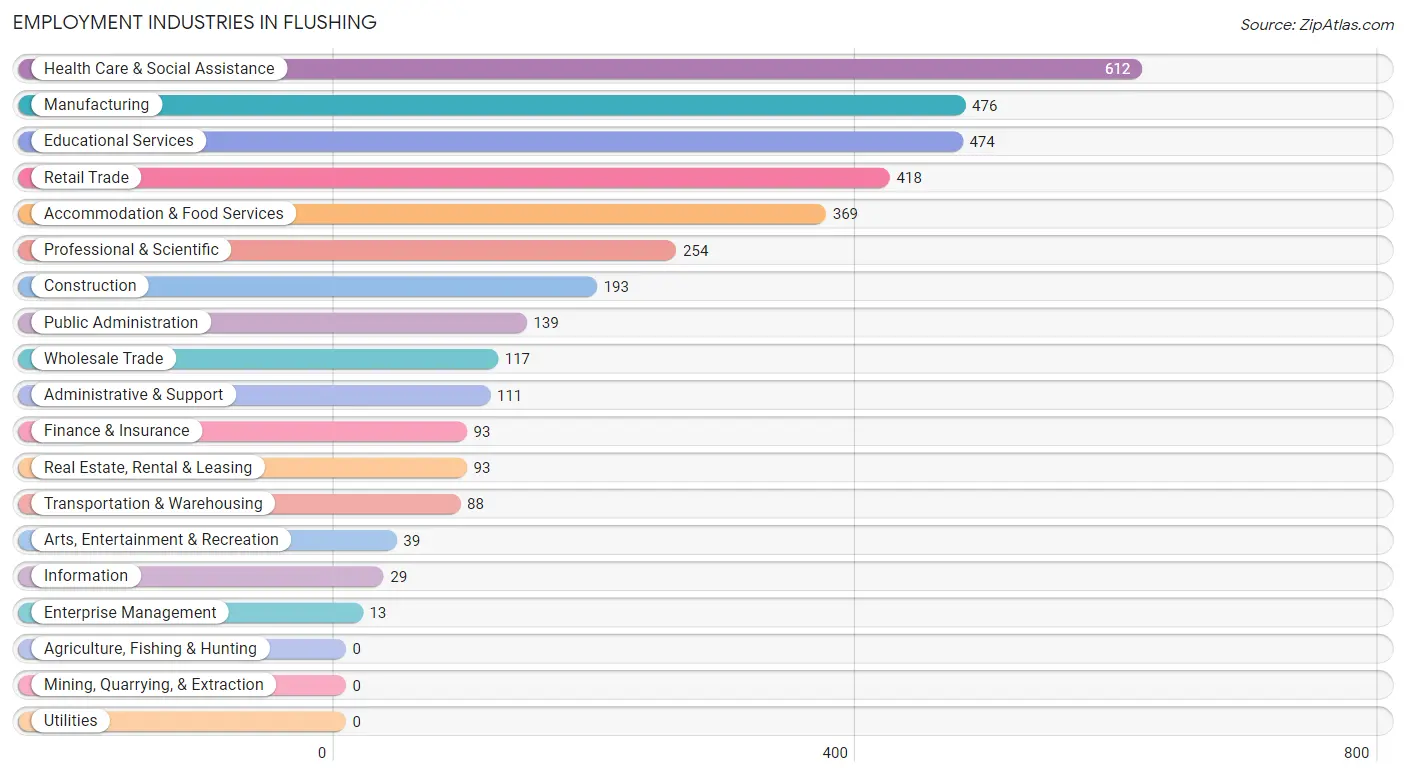
Employment Industries in Flushing
The major employment industries in Flushing include Health Care & Social Assistance (612 | 16.7%), Manufacturing (476 | 13.0%), Educational Services (474 | 12.9%), Retail Trade (418 | 11.4%), and Accommodation & Food Services (369 | 10.1%).
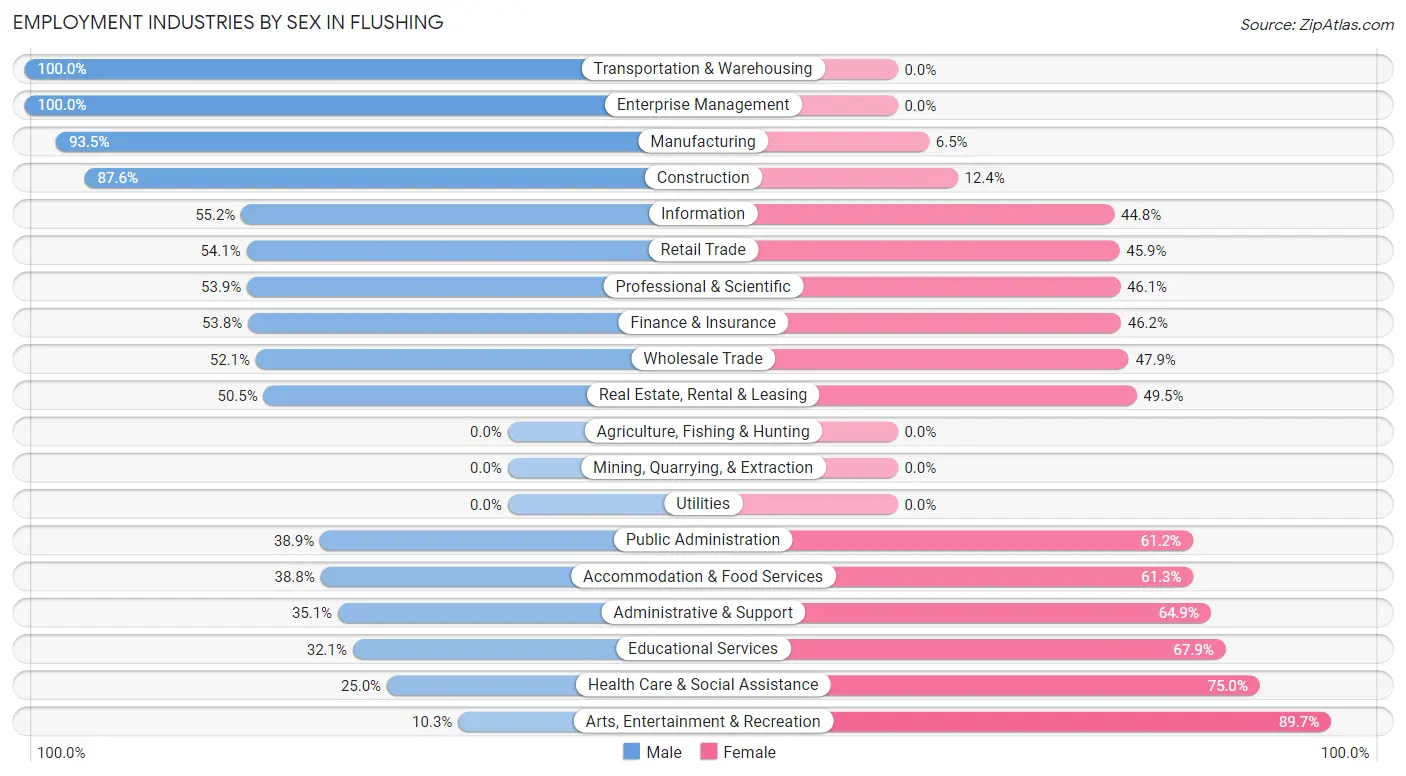
Employment Industries by Sex in Flushing
The Flushing industries that see more men than women are Transportation & Warehousing (100.0%), Enterprise Management (100.0%), and Manufacturing (93.5%), whereas the industries that tend to have a higher number of women are Arts, Entertainment & Recreation (89.7%), Health Care & Social Assistance (75.0%), and Educational Services (67.9%).
| Industry | Male | Female |
| Agriculture, Fishing & Hunting | 0 (0.0%) | 0 (0.0%) |
| Mining, Quarrying, & Extraction | 0 (0.0%) | 0 (0.0%) |
| Construction | 169 (87.6%) | 24 (12.4%) |
| Manufacturing | 445 (93.5%) | 31 (6.5%) |
| Wholesale Trade | 61 (52.1%) | 56 (47.9%) |
| Retail Trade | 226 (54.1%) | 192 (45.9%) |
| Transportation & Warehousing | 88 (100.0%) | 0 (0.0%) |
| Utilities | 0 (0.0%) | 0 (0.0%) |
| Information | 16 (55.2%) | 13 (44.8%) |
| Finance & Insurance | 50 (53.8%) | 43 (46.2%) |
| Real Estate, Rental & Leasing | 47 (50.5%) | 46 (49.5%) |
| Professional & Scientific | 137 (53.9%) | 117 (46.1%) |
| Enterprise Management | 13 (100.0%) | 0 (0.0%) |
| Administrative & Support | 39 (35.1%) | 72 (64.9%) |
| Educational Services | 152 (32.1%) | 322 (67.9%) |
| Health Care & Social Assistance | 153 (25.0%) | 459 (75.0%) |
| Arts, Entertainment & Recreation | 4 (10.3%) | 35 (89.7%) |
| Accommodation & Food Services | 143 (38.8%) | 226 (61.3%) |
| Public Administration | 54 (38.9%) | 85 (61.2%) |
| Total | 1,834 (49.9%) | 1,839 (50.1%) |
Education in Flushing
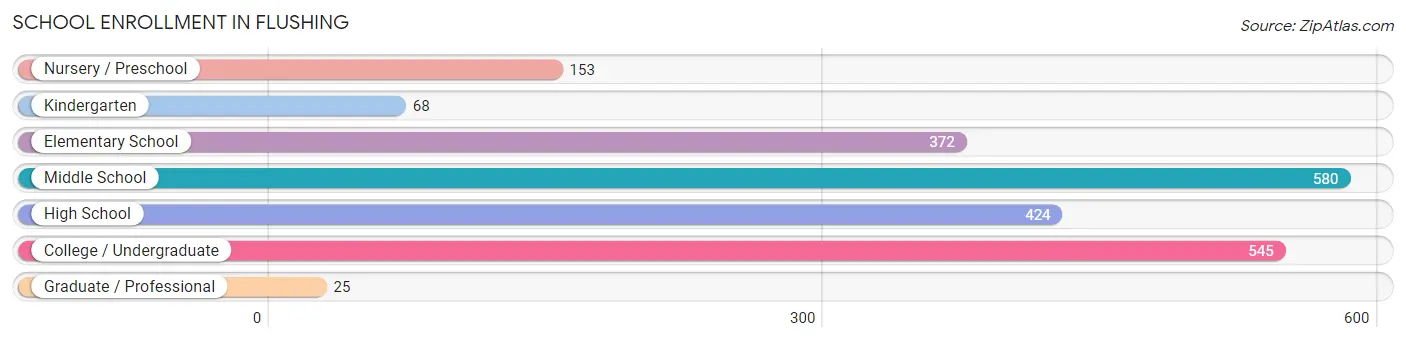
School Enrollment in Flushing
The most common levels of schooling among the 2,167 students in Flushing are middle school (580 | 26.8%), college / undergraduate (545 | 25.2%), and high school (424 | 19.6%).
| School Level | # Students | % Students |
| Nursery / Preschool | 153 | 7.1% |
| Kindergarten | 68 | 3.1% |
| Elementary School | 372 | 17.2% |
| Middle School | 580 | 26.8% |
| High School | 424 | 19.6% |
| College / Undergraduate | 545 | 25.2% |
| Graduate / Professional | 25 | 1.1% |
| Total | 2,167 | 100.0% |
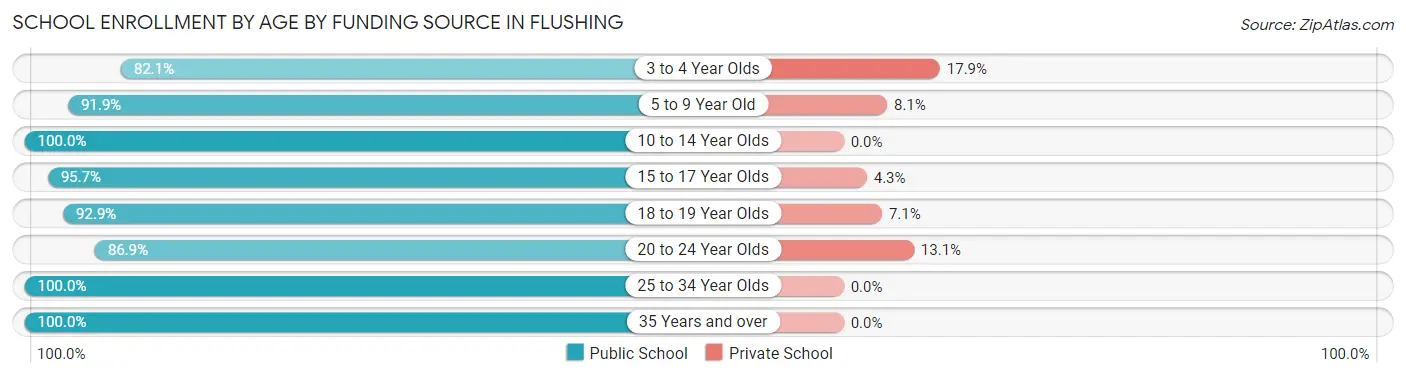
School Enrollment by Age by Funding Source in Flushing
Out of a total of 2,167 students who are enrolled in schools in Flushing, 102 (4.7%) attend a private institution, while the remaining 2,065 (95.3%) are enrolled in public schools. The age group of 3 to 4 year olds has the highest likelihood of being enrolled in private schools, with 19 (17.9% in the age bracket) enrolled. Conversely, the age group of 10 to 14 year olds has the lowest likelihood of being enrolled in a private school, with 651 (100.0% in the age bracket) attending a public institution.
| Age Bracket | Public School | Private School |
| 3 to 4 Year Olds | 87 (82.1%) | 19 (17.9%) |
| 5 to 9 Year Old | 398 (91.9%) | 35 (8.1%) |
| 10 to 14 Year Olds | 651 (100.0%) | 0 (0.0%) |
| 15 to 17 Year Olds | 377 (95.7%) | 17 (4.3%) |
| 18 to 19 Year Olds | 182 (92.9%) | 14 (7.1%) |
| 20 to 24 Year Olds | 113 (86.9%) | 17 (13.1%) |
| 25 to 34 Year Olds | 67 (100.0%) | 0 (0.0%) |
| 35 Years and over | 190 (100.0%) | 0 (0.0%) |
| Total | 2,065 (95.3%) | 102 (4.7%) |
Educational Attainment by Field of Study in Flushing
Education (561 | 30.0%), business (298 | 15.9%), science & technology (217 | 11.6%), psychology (145 | 7.7%), and social sciences (142 | 7.6%) are the most common fields of study among 1,871 individuals in Flushing who have obtained a bachelor's degree or higher.
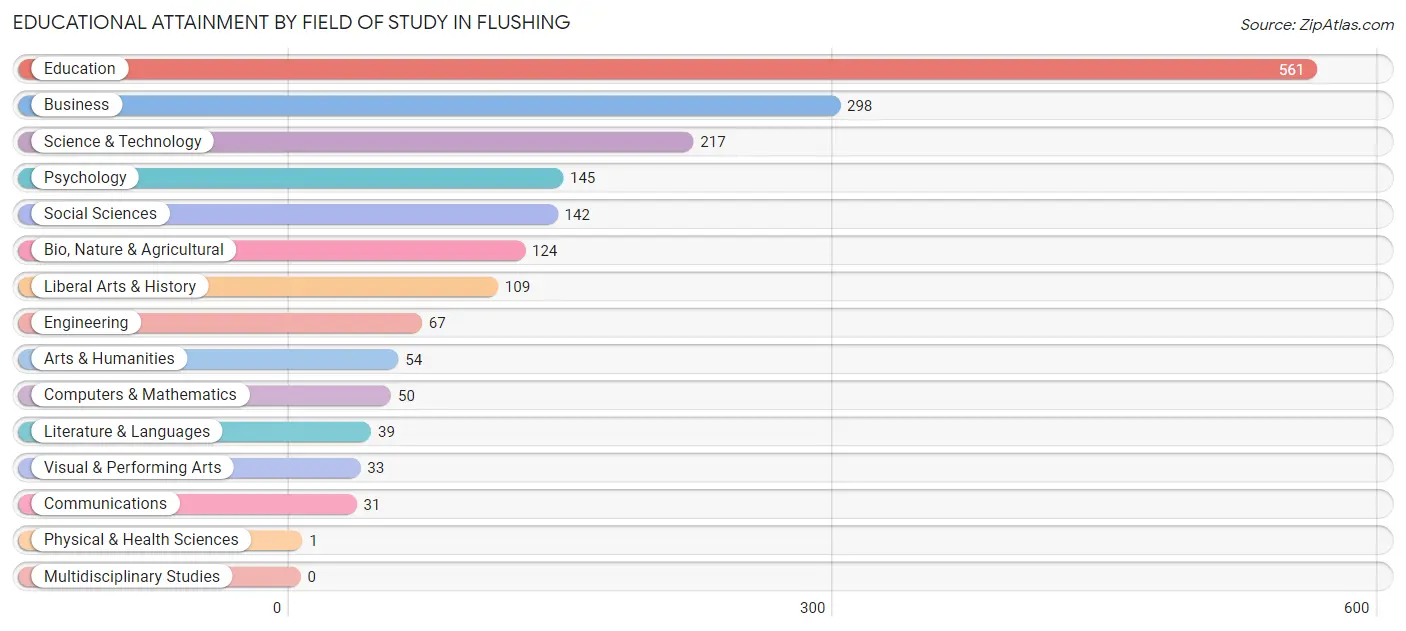
| Field of Study | # Graduates | % Graduates |
| Computers & Mathematics | 50 | 2.7% |
| Bio, Nature & Agricultural | 124 | 6.6% |
| Physical & Health Sciences | 1 | 0.1% |
| Psychology | 145 | 7.7% |
| Social Sciences | 142 | 7.6% |
| Engineering | 67 | 3.6% |
| Multidisciplinary Studies | 0 | 0.0% |
| Science & Technology | 217 | 11.6% |
| Business | 298 | 15.9% |
| Education | 561 | 30.0% |
| Literature & Languages | 39 | 2.1% |
| Liberal Arts & History | 109 | 5.8% |
| Visual & Performing Arts | 33 | 1.8% |
| Communications | 31 | 1.7% |
| Arts & Humanities | 54 | 2.9% |
| Total | 1,871 | 100.0% |
Transportation & Commute in Flushing
Vehicle Availability by Sex in Flushing
The most prevalent vehicle ownership categories in Flushing are males with 2 vehicles (838, accounting for 47.0%) and females with 2 vehicles (836, making up 45.9%).
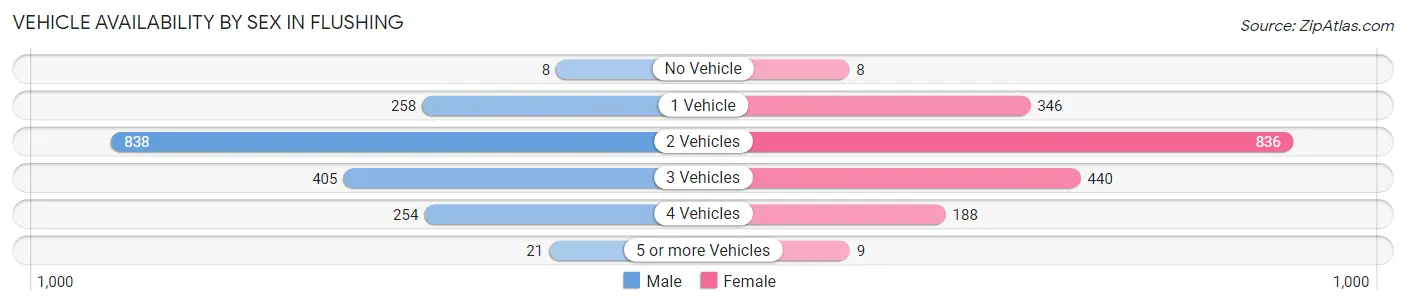
| Vehicles Available | Male | Female |
| No Vehicle | 8 (0.4%) | 8 (0.4%) |
| 1 Vehicle | 258 (14.5%) | 346 (18.9%) |
| 2 Vehicles | 838 (47.0%) | 836 (45.8%) |
| 3 Vehicles | 405 (22.7%) | 440 (24.1%) |
| 4 Vehicles | 254 (14.2%) | 188 (10.3%) |
| 5 or more Vehicles | 21 (1.2%) | 9 (0.5%) |
| Total | 1,784 (100.0%) | 1,827 (100.0%) |
Commute Time in Flushing
The most frequently occuring commute durations in Flushing are 20 to 24 minutes (744 commuters, 23.0%), 15 to 19 minutes (392 commuters, 12.1%), and 25 to 29 minutes (351 commuters, 10.9%).
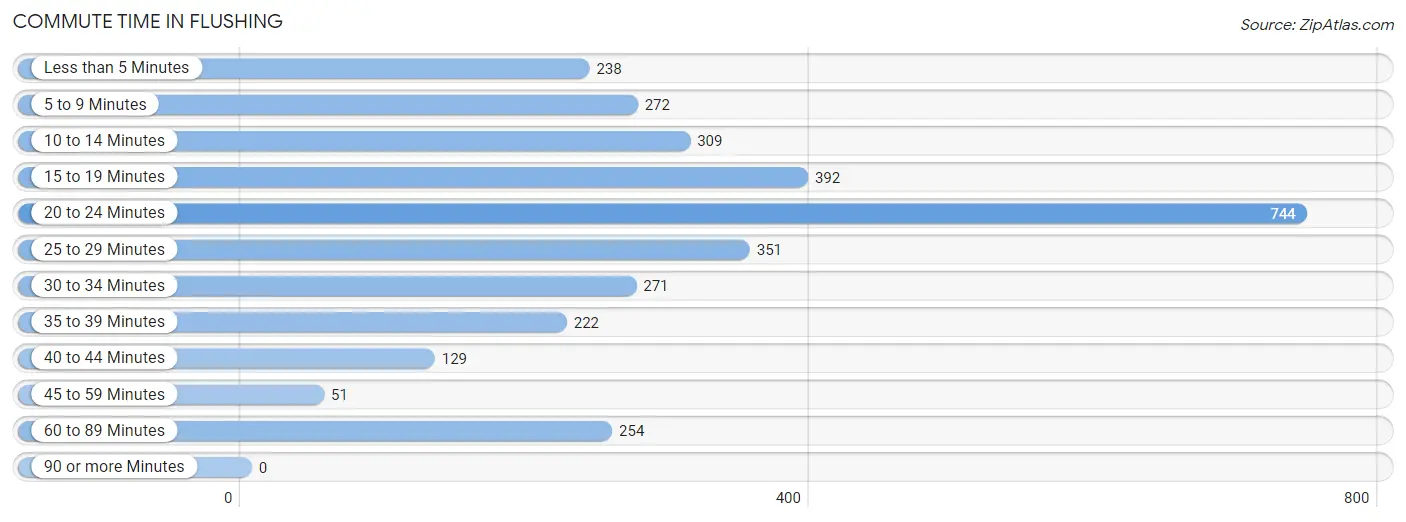
| Commute Time | # Commuters | % Commuters |
| Less than 5 Minutes | 238 | 7.4% |
| 5 to 9 Minutes | 272 | 8.4% |
| 10 to 14 Minutes | 309 | 9.6% |
| 15 to 19 Minutes | 392 | 12.1% |
| 20 to 24 Minutes | 744 | 23.0% |
| 25 to 29 Minutes | 351 | 10.9% |
| 30 to 34 Minutes | 271 | 8.4% |
| 35 to 39 Minutes | 222 | 6.9% |
| 40 to 44 Minutes | 129 | 4.0% |
| 45 to 59 Minutes | 51 | 1.6% |
| 60 to 89 Minutes | 254 | 7.9% |
| 90 or more Minutes | 0 | 0.0% |
Commute Time by Sex in Flushing
The most common commute times in Flushing are 20 to 24 minutes (379 commuters, 23.7%) for males and 20 to 24 minutes (365 commuters, 22.4%) for females.
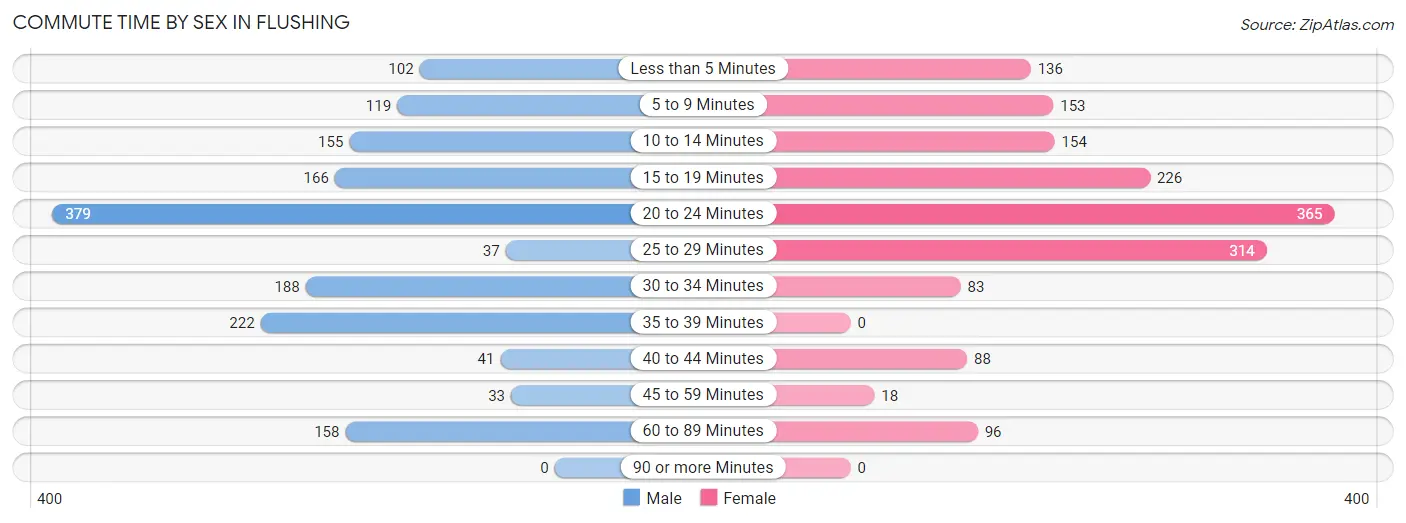
| Commute Time | Male | Female |
| Less than 5 Minutes | 102 (6.4%) | 136 (8.3%) |
| 5 to 9 Minutes | 119 (7.4%) | 153 (9.4%) |
| 10 to 14 Minutes | 155 (9.7%) | 154 (9.4%) |
| 15 to 19 Minutes | 166 (10.4%) | 226 (13.8%) |
| 20 to 24 Minutes | 379 (23.7%) | 365 (22.4%) |
| 25 to 29 Minutes | 37 (2.3%) | 314 (19.2%) |
| 30 to 34 Minutes | 188 (11.7%) | 83 (5.1%) |
| 35 to 39 Minutes | 222 (13.9%) | 0 (0.0%) |
| 40 to 44 Minutes | 41 (2.6%) | 88 (5.4%) |
| 45 to 59 Minutes | 33 (2.1%) | 18 (1.1%) |
| 60 to 89 Minutes | 158 (9.9%) | 96 (5.9%) |
| 90 or more Minutes | 0 (0.0%) | 0 (0.0%) |
Time of Departure to Work by Sex in Flushing
The most frequent times of departure to work in Flushing are 7:00 AM to 7:29 AM (219, 13.7%) for males and 7:30 AM to 7:59 AM (316, 19.4%) for females.
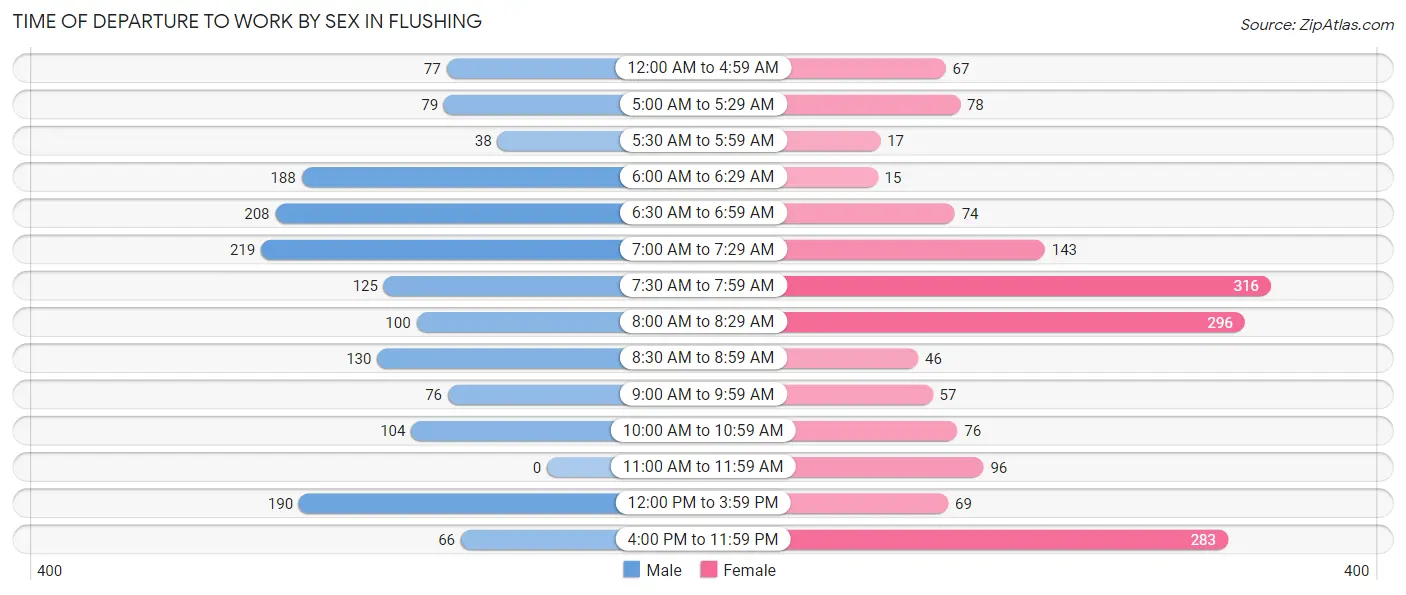
| Time of Departure | Male | Female |
| 12:00 AM to 4:59 AM | 77 (4.8%) | 67 (4.1%) |
| 5:00 AM to 5:29 AM | 79 (4.9%) | 78 (4.8%) |
| 5:30 AM to 5:59 AM | 38 (2.4%) | 17 (1.0%) |
| 6:00 AM to 6:29 AM | 188 (11.7%) | 15 (0.9%) |
| 6:30 AM to 6:59 AM | 208 (13.0%) | 74 (4.5%) |
| 7:00 AM to 7:29 AM | 219 (13.7%) | 143 (8.8%) |
| 7:30 AM to 7:59 AM | 125 (7.8%) | 316 (19.4%) |
| 8:00 AM to 8:29 AM | 100 (6.2%) | 296 (18.1%) |
| 8:30 AM to 8:59 AM | 130 (8.1%) | 46 (2.8%) |
| 9:00 AM to 9:59 AM | 76 (4.8%) | 57 (3.5%) |
| 10:00 AM to 10:59 AM | 104 (6.5%) | 76 (4.6%) |
| 11:00 AM to 11:59 AM | 0 (0.0%) | 96 (5.9%) |
| 12:00 PM to 3:59 PM | 190 (11.9%) | 69 (4.2%) |
| 4:00 PM to 11:59 PM | 66 (4.1%) | 283 (17.3%) |
| Total | 1,600 (100.0%) | 1,633 (100.0%) |
Housing Occupancy in Flushing
Occupancy by Ownership in Flushing
Of the total 3,432 dwellings in Flushing, owner-occupied units account for 2,494 (72.7%), while renter-occupied units make up 938 (27.3%).
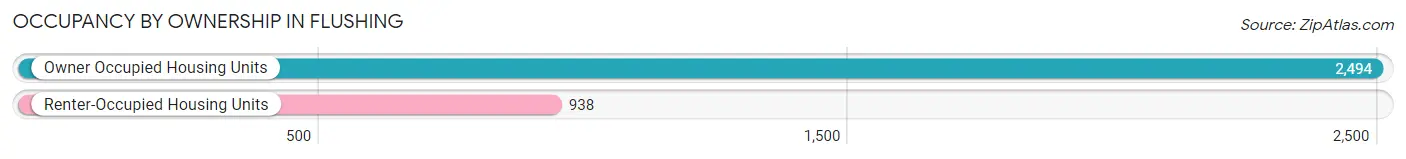
| Occupancy | # Housing Units | % Housing Units |
| Owner Occupied Housing Units | 2,494 | 72.7% |
| Renter-Occupied Housing Units | 938 | 27.3% |
| Total Occupied Housing Units | 3,432 | 100.0% |
Occupancy by Household Size in Flushing
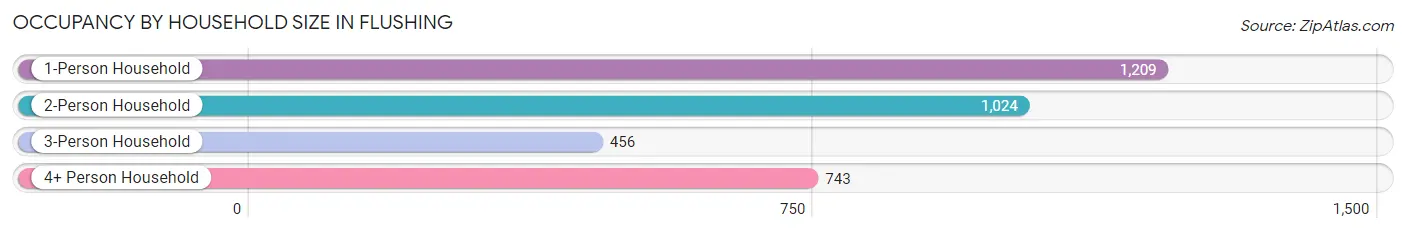
| Household Size | # Housing Units | % Housing Units |
| 1-Person Household | 1,209 | 35.2% |
| 2-Person Household | 1,024 | 29.8% |
| 3-Person Household | 456 | 13.3% |
| 4+ Person Household | 743 | 21.6% |
| Total Housing Units | 3,432 | 100.0% |
Occupancy by Ownership by Household Size in Flushing
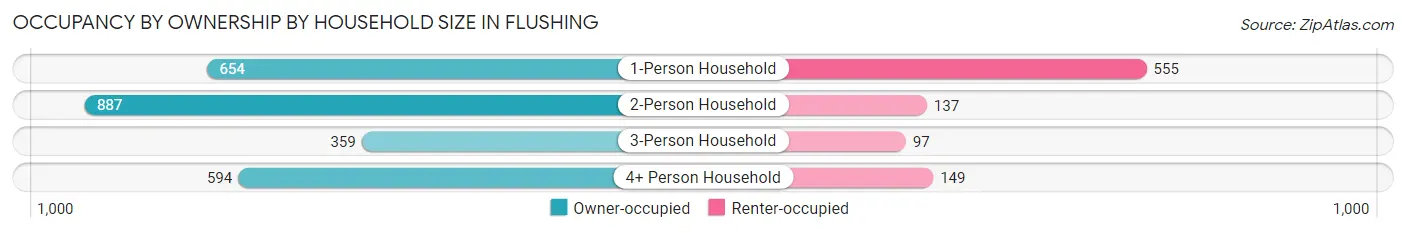
| Household Size | Owner-occupied | Renter-occupied |
| 1-Person Household | 654 (54.1%) | 555 (45.9%) |
| 2-Person Household | 887 (86.6%) | 137 (13.4%) |
| 3-Person Household | 359 (78.7%) | 97 (21.3%) |
| 4+ Person Household | 594 (79.9%) | 149 (20.1%) |
| Total Housing Units | 2,494 (72.7%) | 938 (27.3%) |
Occupancy by Educational Attainment in Flushing
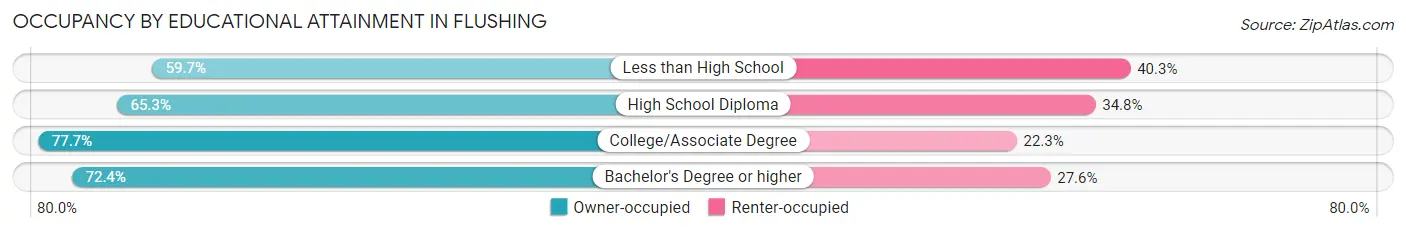
| Household Size | Owner-occupied | Renter-occupied |
| Less than High School | 40 (59.7%) | 27 (40.3%) |
| High School Diploma | 522 (65.2%) | 278 (34.7%) |
| College/Associate Degree | 1,096 (77.7%) | 314 (22.3%) |
| Bachelor's Degree or higher | 836 (72.4%) | 319 (27.6%) |
Occupancy by Age of Householder in Flushing
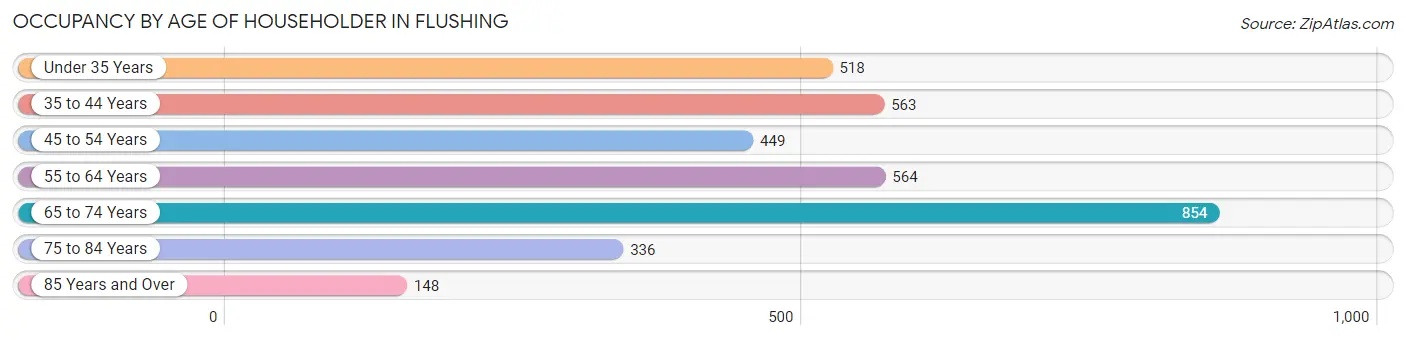
| Age Bracket | # Households | % Households |
| Under 35 Years | 518 | 15.1% |
| 35 to 44 Years | 563 | 16.4% |
| 45 to 54 Years | 449 | 13.1% |
| 55 to 64 Years | 564 | 16.4% |
| 65 to 74 Years | 854 | 24.9% |
| 75 to 84 Years | 336 | 9.8% |
| 85 Years and Over | 148 | 4.3% |
| Total | 3,432 | 100.0% |
Housing Finances in Flushing
Median Income by Occupancy in Flushing
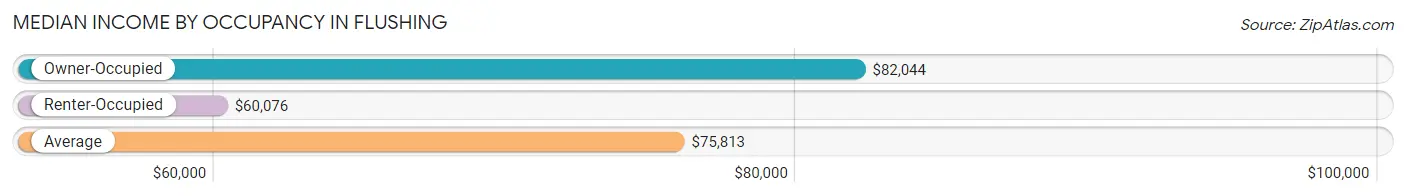
| Occupancy Type | # Households | Median Income |
| Owner-Occupied | 2,494 (72.7%) | $82,044 |
| Renter-Occupied | 938 (27.3%) | $60,076 |
| Average | 3,432 (100.0%) | $75,813 |
Occupancy by Householder Income Bracket in Flushing
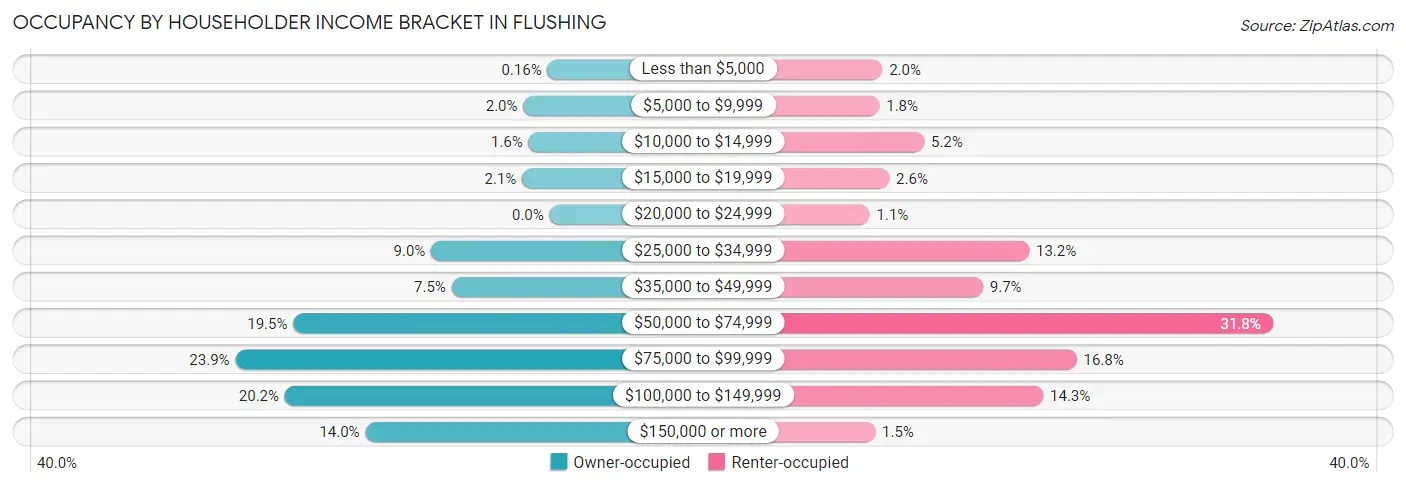
| Income Bracket | Owner-occupied | Renter-occupied |
| Less than $5,000 | 4 (0.2%) | 19 (2.0%) |
| $5,000 to $9,999 | 50 (2.0%) | 17 (1.8%) |
| $10,000 to $14,999 | 40 (1.6%) | 49 (5.2%) |
| $15,000 to $19,999 | 52 (2.1%) | 24 (2.6%) |
| $20,000 to $24,999 | 0 (0.0%) | 10 (1.1%) |
| $25,000 to $34,999 | 225 (9.0%) | 124 (13.2%) |
| $35,000 to $49,999 | 186 (7.5%) | 91 (9.7%) |
| $50,000 to $74,999 | 487 (19.5%) | 298 (31.8%) |
| $75,000 to $99,999 | 597 (23.9%) | 158 (16.8%) |
| $100,000 to $149,999 | 503 (20.2%) | 134 (14.3%) |
| $150,000 or more | 350 (14.0%) | 14 (1.5%) |
| Total | 2,494 (100.0%) | 938 (100.0%) |
Monthly Housing Cost Tiers in Flushing
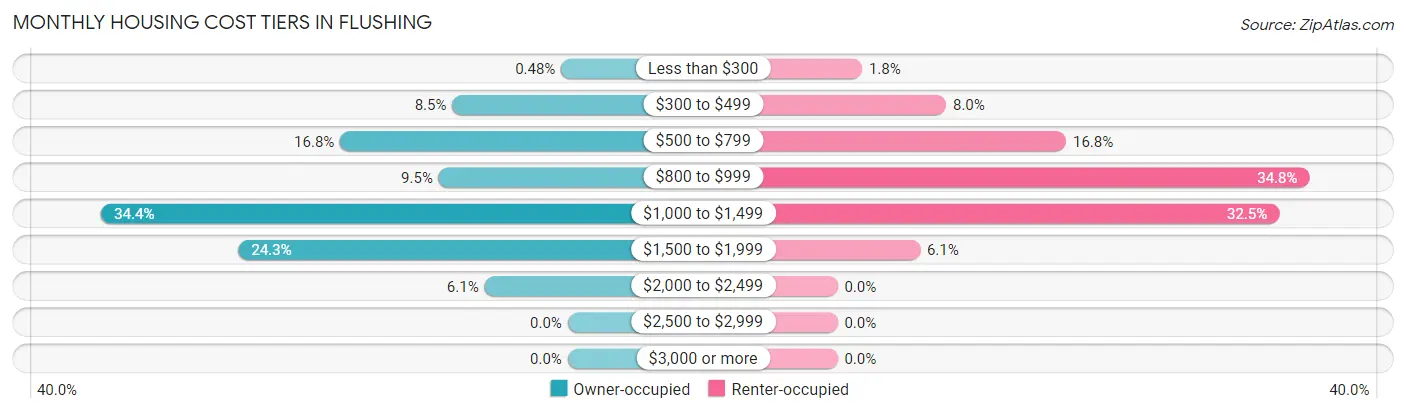
| Monthly Cost | Owner-occupied | Renter-occupied |
| Less than $300 | 12 (0.5%) | 17 (1.8%) |
| $300 to $499 | 212 (8.5%) | 75 (8.0%) |
| $500 to $799 | 418 (16.8%) | 158 (16.8%) |
| $800 to $999 | 237 (9.5%) | 326 (34.7%) |
| $1,000 to $1,499 | 857 (34.4%) | 305 (32.5%) |
| $1,500 to $1,999 | 605 (24.3%) | 57 (6.1%) |
| $2,000 to $2,499 | 153 (6.1%) | 0 (0.0%) |
| $2,500 to $2,999 | 0 (0.0%) | 0 (0.0%) |
| $3,000 or more | 0 (0.0%) | 0 (0.0%) |
| Total | 2,494 (100.0%) | 938 (100.0%) |
Physical Housing Characteristics in Flushing
Housing Structures in Flushing
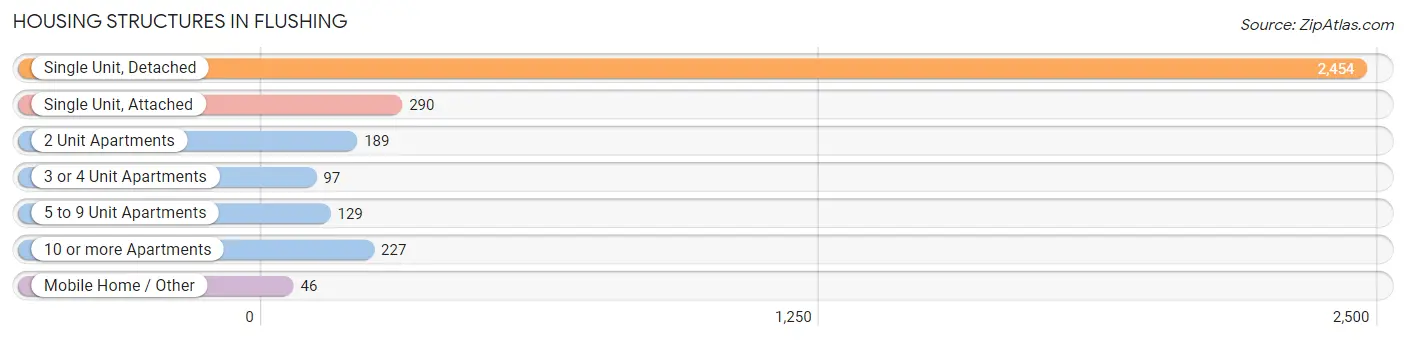
| Structure Type | # Housing Units | % Housing Units |
| Single Unit, Detached | 2,454 | 71.5% |
| Single Unit, Attached | 290 | 8.5% |
| 2 Unit Apartments | 189 | 5.5% |
| 3 or 4 Unit Apartments | 97 | 2.8% |
| 5 to 9 Unit Apartments | 129 | 3.8% |
| 10 or more Apartments | 227 | 6.6% |
| Mobile Home / Other | 46 | 1.3% |
| Total | 3,432 | 100.0% |
Housing Structures by Occupancy in Flushing
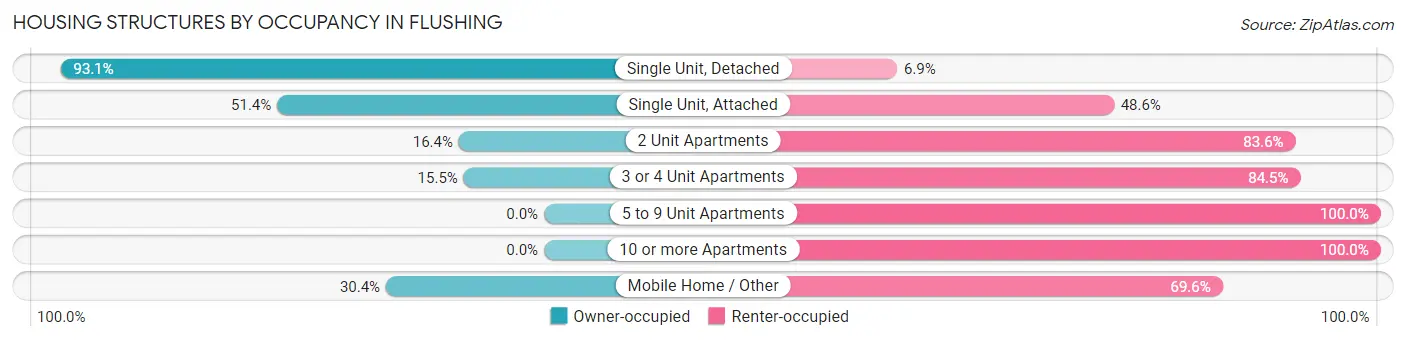
| Structure Type | Owner-occupied | Renter-occupied |
| Single Unit, Detached | 2,285 (93.1%) | 169 (6.9%) |
| Single Unit, Attached | 149 (51.4%) | 141 (48.6%) |
| 2 Unit Apartments | 31 (16.4%) | 158 (83.6%) |
| 3 or 4 Unit Apartments | 15 (15.5%) | 82 (84.5%) |
| 5 to 9 Unit Apartments | 0 (0.0%) | 129 (100.0%) |
| 10 or more Apartments | 0 (0.0%) | 227 (100.0%) |
| Mobile Home / Other | 14 (30.4%) | 32 (69.6%) |
| Total | 2,494 (72.7%) | 938 (27.3%) |
Housing Structures by Number of Rooms in Flushing
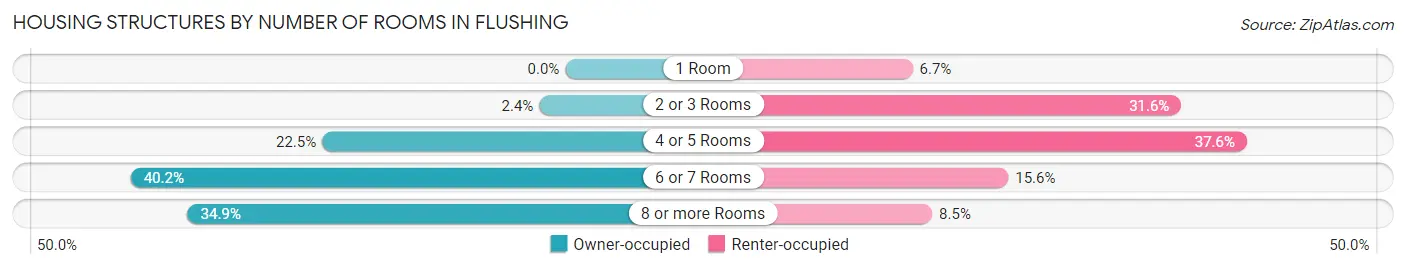
| Number of Rooms | Owner-occupied | Renter-occupied |
| 1 Room | 0 (0.0%) | 63 (6.7%) |
| 2 or 3 Rooms | 60 (2.4%) | 296 (31.6%) |
| 4 or 5 Rooms | 561 (22.5%) | 353 (37.6%) |
| 6 or 7 Rooms | 1,002 (40.2%) | 146 (15.6%) |
| 8 or more Rooms | 871 (34.9%) | 80 (8.5%) |
| Total | 2,494 (100.0%) | 938 (100.0%) |
Housing Structure by Heating Type in Flushing
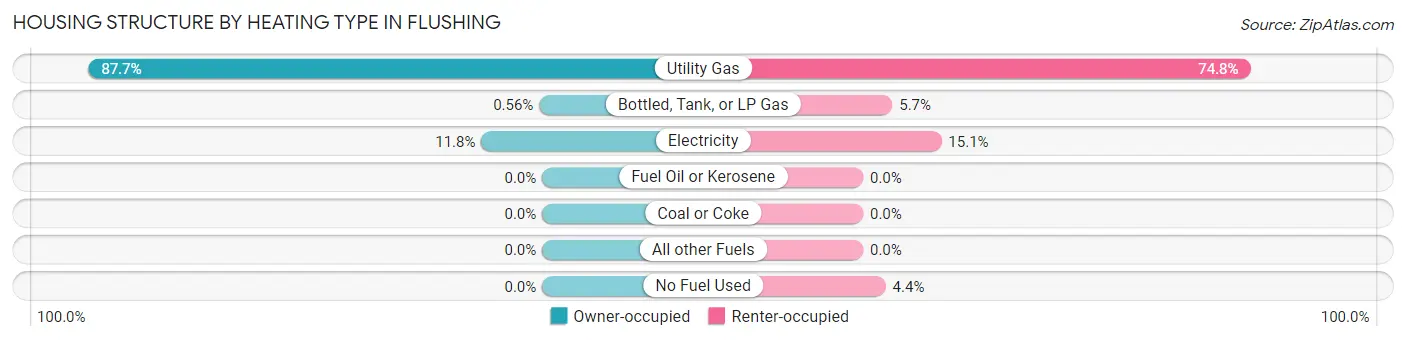
| Heating Type | Owner-occupied | Renter-occupied |
| Utility Gas | 2,187 (87.7%) | 702 (74.8%) |
| Bottled, Tank, or LP Gas | 14 (0.6%) | 53 (5.7%) |
| Electricity | 293 (11.7%) | 142 (15.1%) |
| Fuel Oil or Kerosene | 0 (0.0%) | 0 (0.0%) |
| Coal or Coke | 0 (0.0%) | 0 (0.0%) |
| All other Fuels | 0 (0.0%) | 0 (0.0%) |
| No Fuel Used | 0 (0.0%) | 41 (4.4%) |
| Total | 2,494 (100.0%) | 938 (100.0%) |
Household Vehicle Usage in Flushing
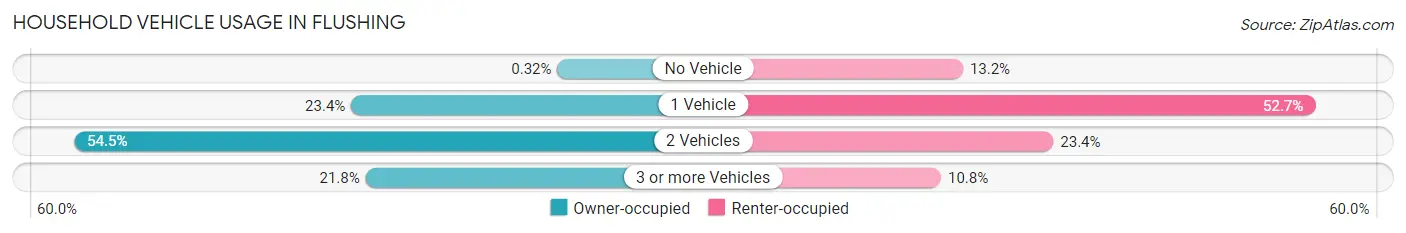
| Vehicles per Household | Owner-occupied | Renter-occupied |
| No Vehicle | 8 (0.3%) | 124 (13.2%) |
| 1 Vehicle | 584 (23.4%) | 494 (52.7%) |
| 2 Vehicles | 1,358 (54.4%) | 219 (23.4%) |
| 3 or more Vehicles | 544 (21.8%) | 101 (10.8%) |
| Total | 2,494 (100.0%) | 938 (100.0%) |
Real Estate & Mortgages in Flushing
Real Estate and Mortgage Overview in Flushing
| Characteristic | Without Mortgage | With Mortgage |
| Housing Units | 724 | 1,770 |
| Median Property Value | $154,400 | $181,700 |
| Median Household Income | $75,988 | $253 |
| Monthly Housing Costs | $593 | $0 |
| Real Estate Taxes | $2,478 | $87 |
Property Value by Mortgage Status in Flushing
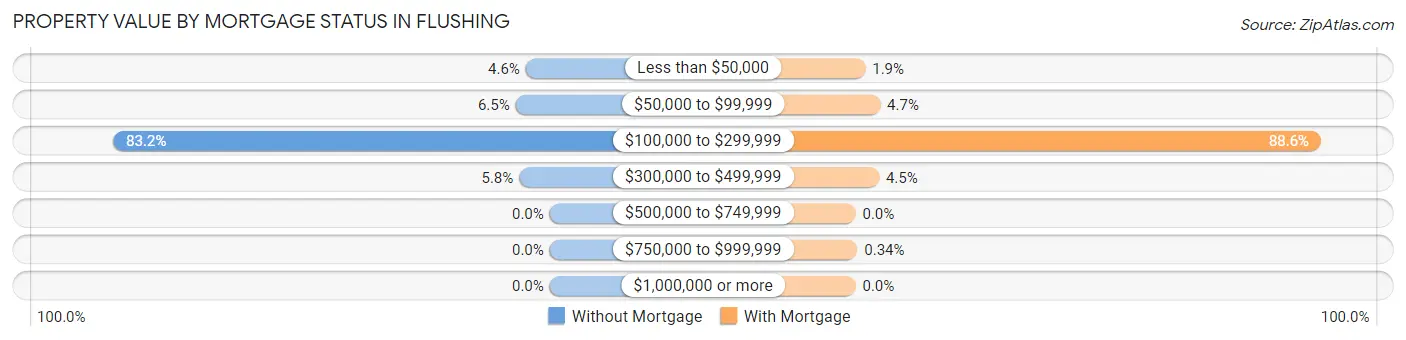
| Property Value | Without Mortgage | With Mortgage |
| Less than $50,000 | 33 (4.6%) | 33 (1.9%) |
| $50,000 to $99,999 | 47 (6.5%) | 83 (4.7%) |
| $100,000 to $299,999 | 602 (83.2%) | 1,569 (88.6%) |
| $300,000 to $499,999 | 42 (5.8%) | 79 (4.5%) |
| $500,000 to $749,999 | 0 (0.0%) | 0 (0.0%) |
| $750,000 to $999,999 | 0 (0.0%) | 6 (0.3%) |
| $1,000,000 or more | 0 (0.0%) | 0 (0.0%) |
| Total | 724 (100.0%) | 1,770 (100.0%) |
Household Income by Mortgage Status in Flushing
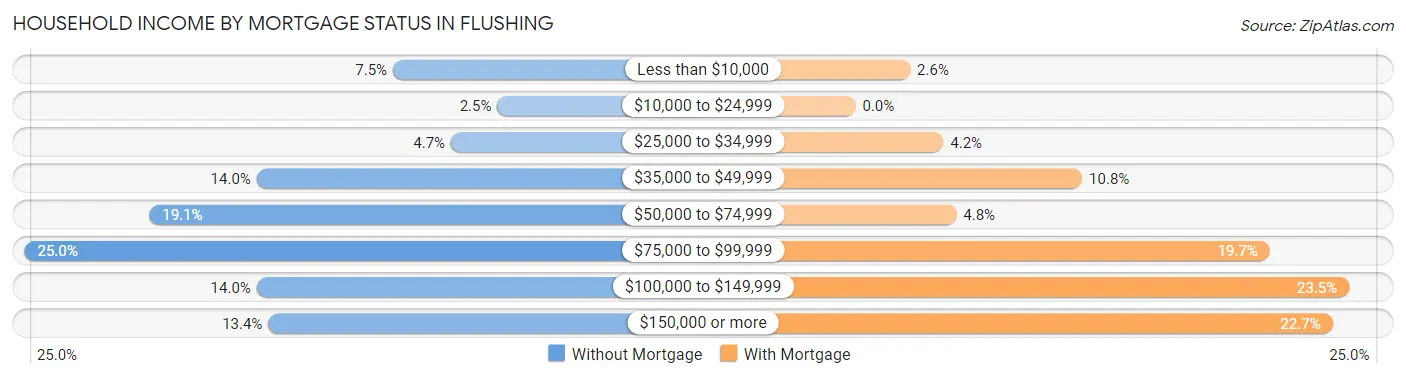
| Household Income | Without Mortgage | With Mortgage |
| Less than $10,000 | 54 (7.5%) | 46 (2.6%) |
| $10,000 to $24,999 | 18 (2.5%) | 0 (0.0%) |
| $25,000 to $34,999 | 34 (4.7%) | 74 (4.2%) |
| $35,000 to $49,999 | 101 (14.0%) | 191 (10.8%) |
| $50,000 to $74,999 | 138 (19.1%) | 85 (4.8%) |
| $75,000 to $99,999 | 181 (25.0%) | 349 (19.7%) |
| $100,000 to $149,999 | 101 (14.0%) | 416 (23.5%) |
| $150,000 or more | 97 (13.4%) | 402 (22.7%) |
| Total | 724 (100.0%) | 1,770 (100.0%) |
Property Value to Household Income Ratio in Flushing
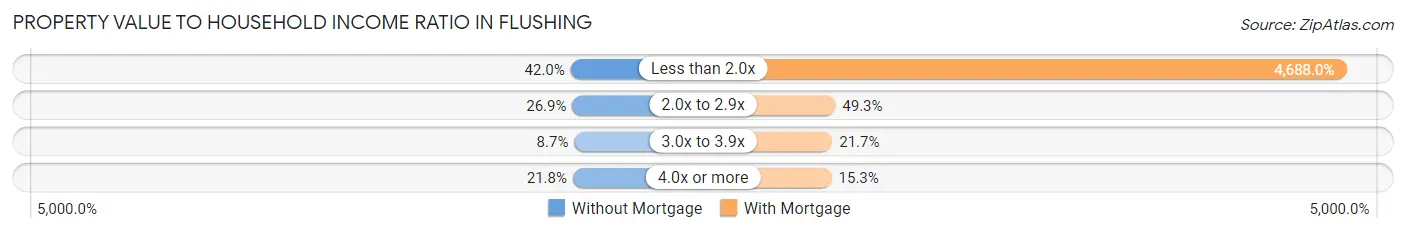
| Value-to-Income Ratio | Without Mortgage | With Mortgage |
| Less than 2.0x | 304 (42.0%) | 82,978 (4,688.0%) |
| 2.0x to 2.9x | 195 (26.9%) | 872 (49.3%) |
| 3.0x to 3.9x | 63 (8.7%) | 384 (21.7%) |
| 4.0x or more | 158 (21.8%) | 270 (15.2%) |
| Total | 724 (100.0%) | 1,770 (100.0%) |
Real Estate Taxes by Mortgage Status in Flushing
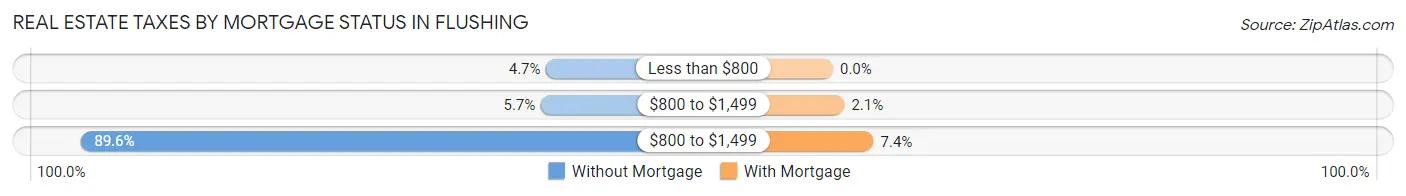
| Property Taxes | Without Mortgage | With Mortgage |
| Less than $800 | 34 (4.7%) | 0 (0.0%) |
| $800 to $1,499 | 41 (5.7%) | 37 (2.1%) |
| $800 to $1,499 | 649 (89.6%) | 131 (7.4%) |
| Total | 724 (100.0%) | 1,770 (100.0%) |
Health & Disability in Flushing
Health Insurance Coverage by Age in Flushing
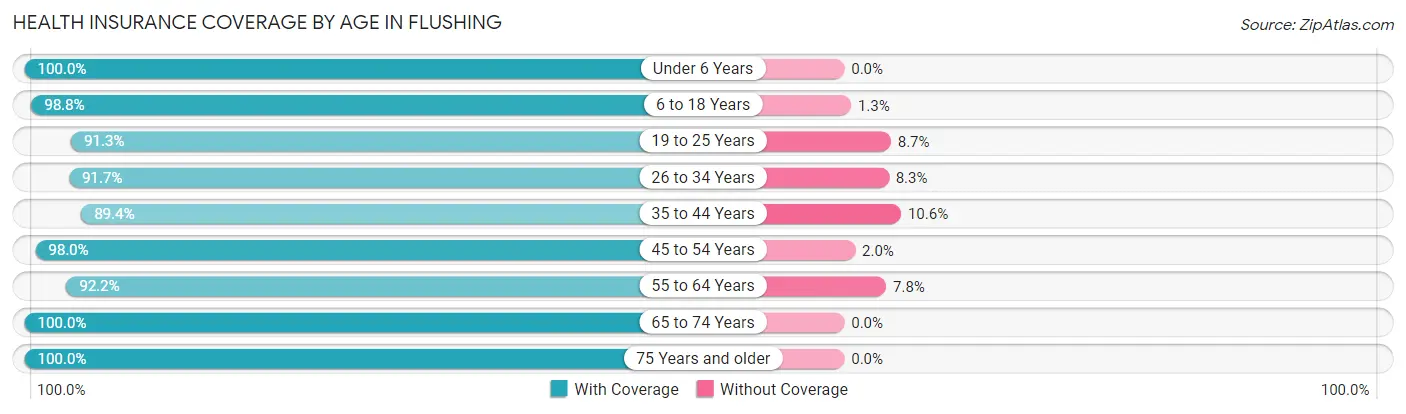
| Age Bracket | With Coverage | Without Coverage |
| Under 6 Years | 506 (100.0%) | 0 (0.0%) |
| 6 to 18 Years | 1,505 (98.8%) | 19 (1.3%) |
| 19 to 25 Years | 611 (91.3%) | 58 (8.7%) |
| 26 to 34 Years | 753 (91.7%) | 68 (8.3%) |
| 35 to 44 Years | 905 (89.4%) | 107 (10.6%) |
| 45 to 54 Years | 827 (98.0%) | 17 (2.0%) |
| 55 to 64 Years | 841 (92.2%) | 71 (7.8%) |
| 65 to 74 Years | 1,286 (100.0%) | 0 (0.0%) |
| 75 Years and older | 667 (100.0%) | 0 (0.0%) |
| Total | 7,901 (95.9%) | 340 (4.1%) |
Health Insurance Coverage by Citizenship Status in Flushing
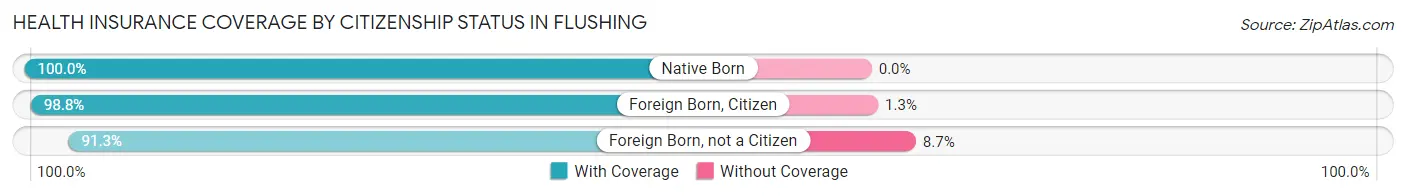
| Citizenship Status | With Coverage | Without Coverage |
| Native Born | 506 (100.0%) | 0 (0.0%) |
| Foreign Born, Citizen | 1,505 (98.8%) | 19 (1.3%) |
| Foreign Born, not a Citizen | 611 (91.3%) | 58 (8.7%) |
Health Insurance Coverage by Household Income in Flushing
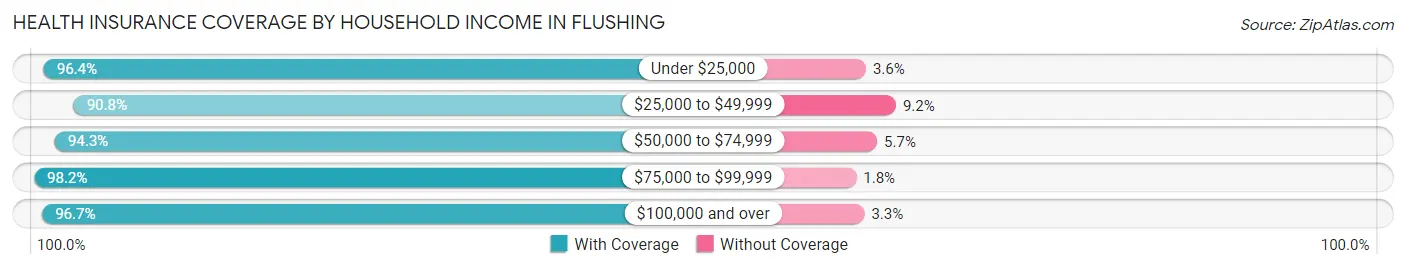
| Household Income | With Coverage | Without Coverage |
| Under $25,000 | 321 (96.4%) | 12 (3.6%) |
| $25,000 to $49,999 | 907 (90.8%) | 92 (9.2%) |
| $50,000 to $74,999 | 1,458 (94.3%) | 88 (5.7%) |
| $75,000 to $99,999 | 1,759 (98.2%) | 32 (1.8%) |
| $100,000 and over | 3,386 (96.7%) | 116 (3.3%) |
Public vs Private Health Insurance Coverage by Age in Flushing
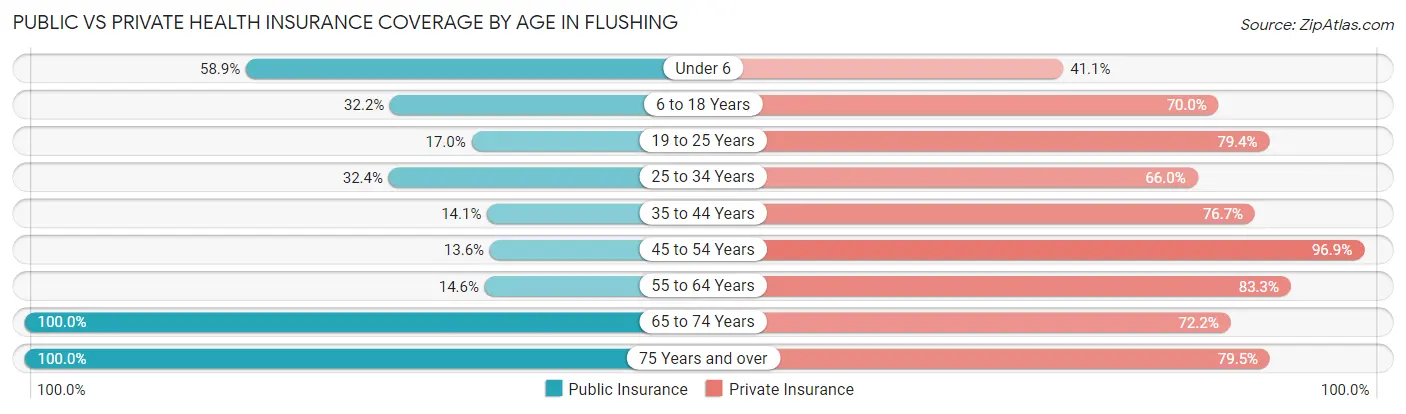
| Age Bracket | Public Insurance | Private Insurance |
| Under 6 | 298 (58.9%) | 208 (41.1%) |
| 6 to 18 Years | 490 (32.2%) | 1,066 (70.0%) |
| 19 to 25 Years | 114 (17.0%) | 531 (79.4%) |
| 25 to 34 Years | 266 (32.4%) | 542 (66.0%) |
| 35 to 44 Years | 143 (14.1%) | 776 (76.7%) |
| 45 to 54 Years | 115 (13.6%) | 818 (96.9%) |
| 55 to 64 Years | 133 (14.6%) | 760 (83.3%) |
| 65 to 74 Years | 1,286 (100.0%) | 928 (72.2%) |
| 75 Years and over | 667 (100.0%) | 530 (79.5%) |
| Total | 3,512 (42.6%) | 6,159 (74.7%) |
Disability Status by Sex by Age in Flushing
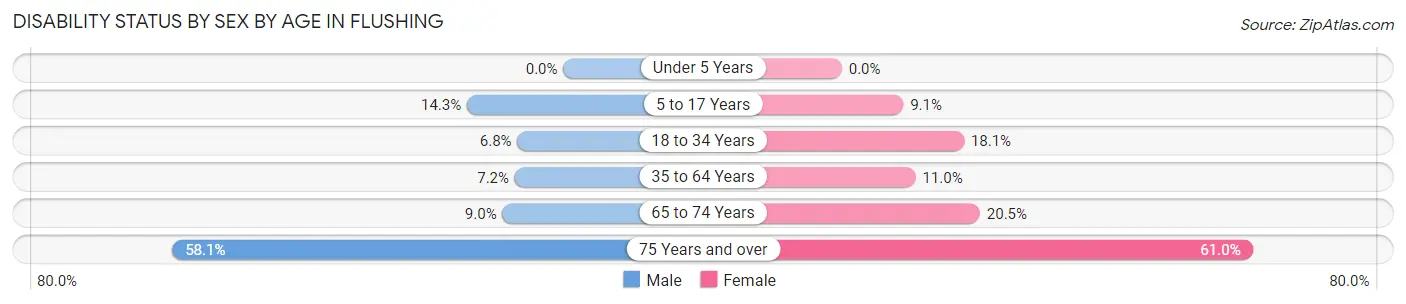
| Age Bracket | Male | Female |
| Under 5 Years | 0 (0.0%) | 0 (0.0%) |
| 5 to 17 Years | 127 (14.3%) | 56 (9.1%) |
| 18 to 34 Years | 49 (6.8%) | 156 (18.1%) |
| 35 to 64 Years | 98 (7.2%) | 154 (11.0%) |
| 65 to 74 Years | 51 (9.0%) | 148 (20.5%) |
| 75 Years and over | 115 (58.1%) | 286 (61.0%) |
Disability Class by Sex by Age in Flushing
Disability Class: Hearing Difficulty
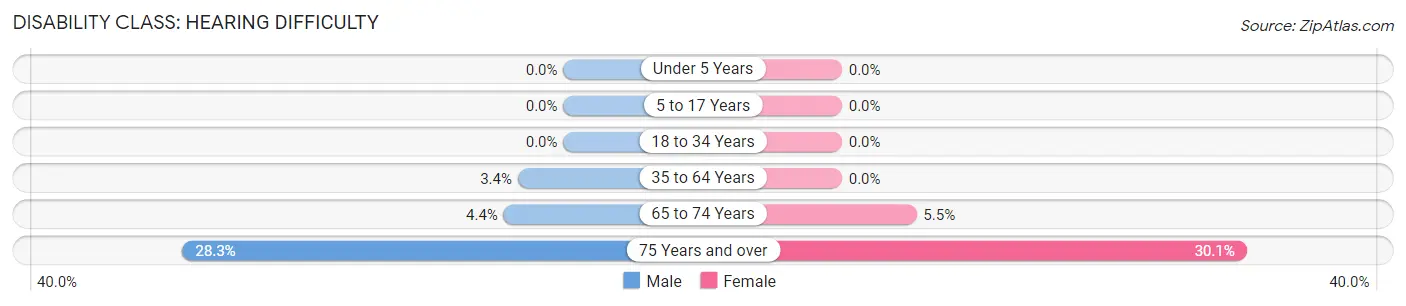
| Age Bracket | Male | Female |
| Under 5 Years | 0 (0.0%) | 0 (0.0%) |
| 5 to 17 Years | 0 (0.0%) | 0 (0.0%) |
| 18 to 34 Years | 0 (0.0%) | 0 (0.0%) |
| 35 to 64 Years | 46 (3.4%) | 0 (0.0%) |
| 65 to 74 Years | 25 (4.4%) | 40 (5.5%) |
| 75 Years and over | 56 (28.3%) | 141 (30.1%) |
Disability Class: Vision Difficulty
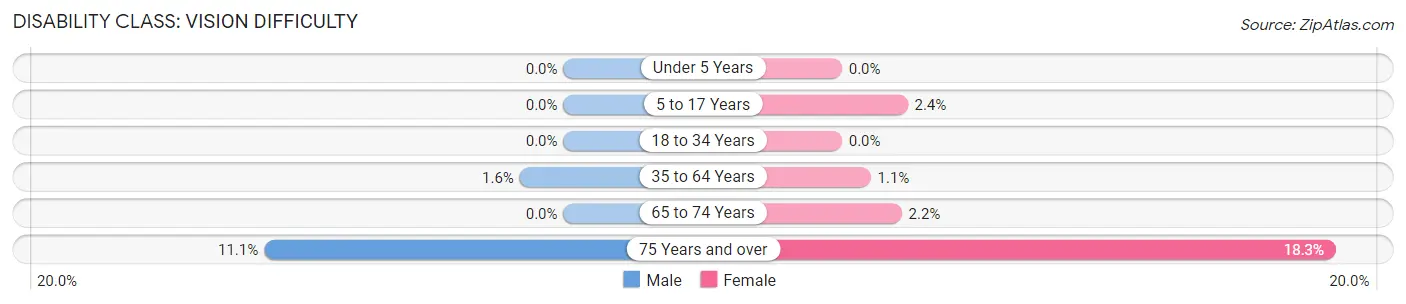
| Age Bracket | Male | Female |
| Under 5 Years | 0 (0.0%) | 0 (0.0%) |
| 5 to 17 Years | 0 (0.0%) | 15 (2.4%) |
| 18 to 34 Years | 0 (0.0%) | 0 (0.0%) |
| 35 to 64 Years | 22 (1.6%) | 15 (1.1%) |
| 65 to 74 Years | 0 (0.0%) | 16 (2.2%) |
| 75 Years and over | 22 (11.1%) | 86 (18.3%) |
Disability Class: Cognitive Difficulty
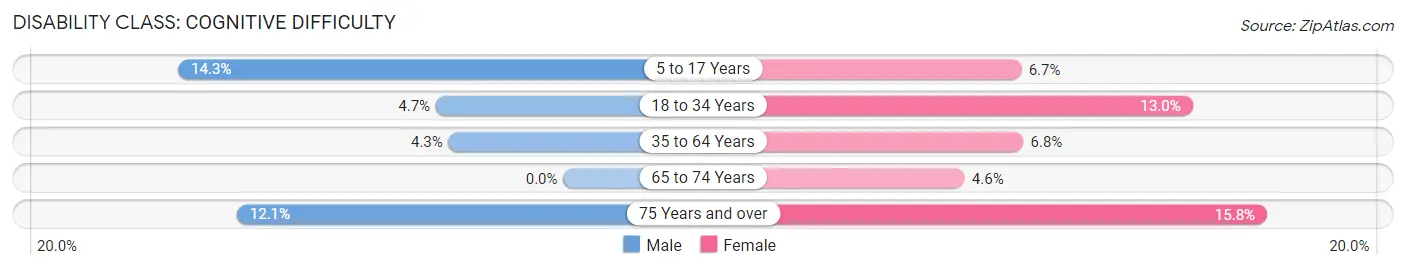
| Age Bracket | Male | Female |
| 5 to 17 Years | 127 (14.3%) | 41 (6.7%) |
| 18 to 34 Years | 34 (4.7%) | 112 (13.0%) |
| 35 to 64 Years | 58 (4.3%) | 95 (6.8%) |
| 65 to 74 Years | 0 (0.0%) | 33 (4.6%) |
| 75 Years and over | 24 (12.1%) | 74 (15.8%) |
Disability Class: Ambulatory Difficulty
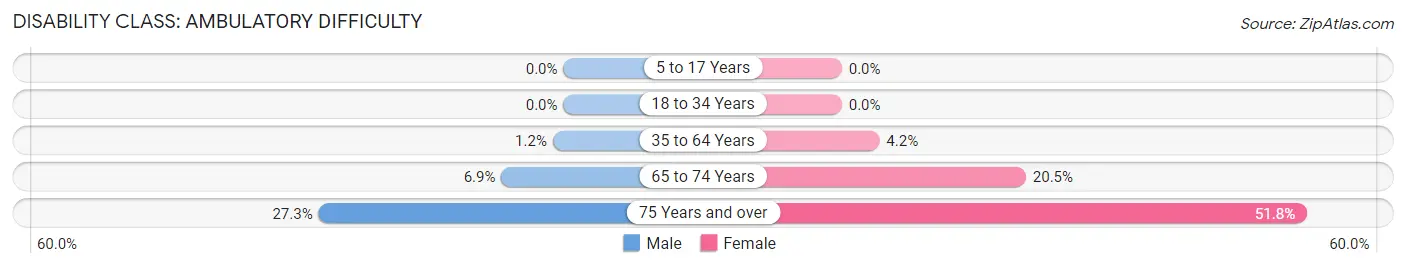
| Age Bracket | Male | Female |
| 5 to 17 Years | 0 (0.0%) | 0 (0.0%) |
| 18 to 34 Years | 0 (0.0%) | 0 (0.0%) |
| 35 to 64 Years | 16 (1.2%) | 59 (4.2%) |
| 65 to 74 Years | 39 (6.9%) | 148 (20.5%) |
| 75 Years and over | 54 (27.3%) | 243 (51.8%) |
Disability Class: Self-Care Difficulty
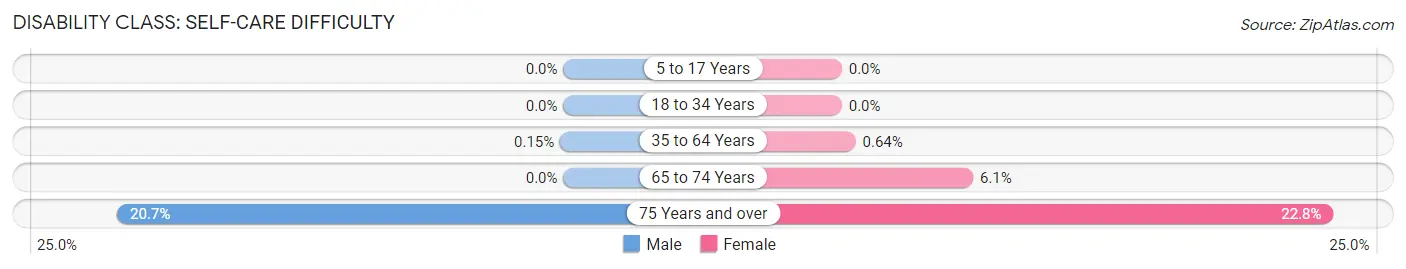
| Age Bracket | Male | Female |
| 5 to 17 Years | 0 (0.0%) | 0 (0.0%) |
| 18 to 34 Years | 0 (0.0%) | 0 (0.0%) |
| 35 to 64 Years | 2 (0.2%) | 9 (0.6%) |
| 65 to 74 Years | 0 (0.0%) | 44 (6.1%) |
| 75 Years and over | 41 (20.7%) | 107 (22.8%) |
Technology Access in Flushing
Computing Device Access in Flushing
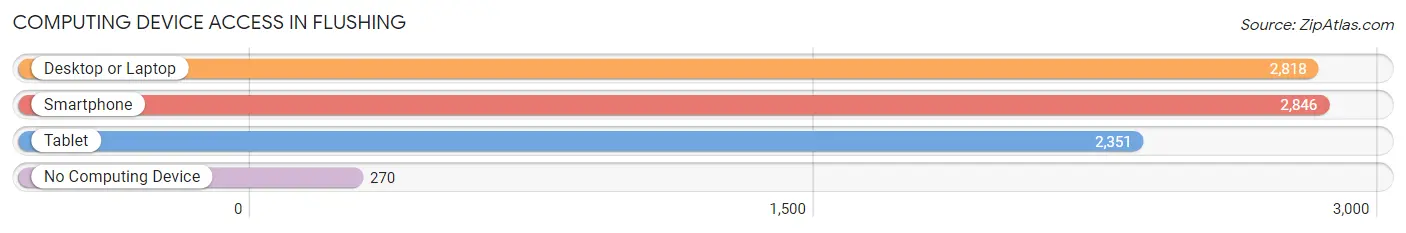
| Device Type | # Households | % Households |
| Desktop or Laptop | 2,818 | 82.1% |
| Smartphone | 2,846 | 82.9% |
| Tablet | 2,351 | 68.5% |
| No Computing Device | 270 | 7.9% |
| Total | 3,432 | 100.0% |
Internet Access in Flushing
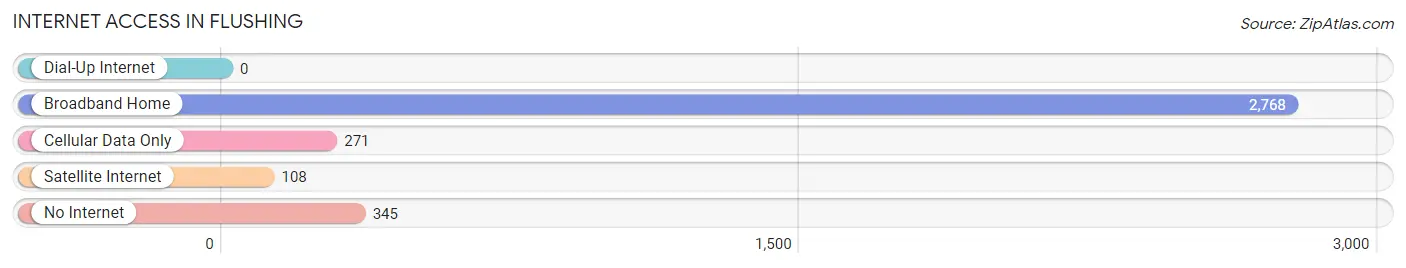
| Internet Type | # Households | % Households |
| Dial-Up Internet | 0 | 0.0% |
| Broadband Home | 2,768 | 80.6% |
| Cellular Data Only | 271 | 7.9% |
| Satellite Internet | 108 | 3.2% |
| No Internet | 345 | 10.1% |
| Total | 3,432 | 100.0% |
Flushing Summary
Flushing, Michigan is a small city located in Genesee County, Michigan. It is situated on the Flint River, approximately 10 miles north of Flint. The city has a population of 8,389 as of the 2010 census, making it the second largest city in Genesee County.
History
Flushing was first settled in 1836 by a group of settlers from New York. The city was named after the city of Flushing, New York, which was the hometown of many of the settlers. The city was incorporated in 1855 and has since grown to become the second largest city in Genesee County.
Geography
Flushing is located in the Flint River Valley, approximately 10 miles north of Flint. The city is situated on the banks of the Flint River, which is a major tributary of the Saginaw River. The city is surrounded by rolling hills and farmland, and is located in the heart of the Great Lakes region.
Economy
Flushing’s economy is largely based on manufacturing and agriculture. The city is home to several large manufacturing companies, including General Motors, Delphi Automotive, and Lear Corporation. The city also has a strong agricultural sector, with many local farms producing corn, soybeans, and other crops.
Demographics
As of the 2010 census, Flushing had a population of 8,389. The racial makeup of the city was 87.3% White, 8.2% African American, 0.5% Native American, 0.7% Asian, 0.1% Pacific Islander, 1.2% from other races, and 2.0% from two or more races. Hispanic or Latino of any race were 3.2% of the population.
The median income for a household in Flushing was $45,945, and the median income for a family was $54,945. The per capita income for the city was $21,945. About 8.2% of families and 10.2% of the population were below the poverty line, including 14.2% of those under age 18 and 6.2% of those age 65 or over.
Flushing is a small city with a rich history and a diverse population. The city’s economy is largely based on manufacturing and agriculture, and the city is home to several large companies. The city has a median income that is slightly higher than the national average, and the poverty rate is lower than the national average. Flushing is a great place to live and work, and is a great example of a small city with a lot to offer.
Common Questions
What is Per Capita Income in Flushing?
Per Capita income in Flushing is $37,752.
What is the Median Family Income in Flushing?
Median Family Income in Flushing is $87,283.
What is the Median Household income in Flushing?
Median Household Income in Flushing is $75,813.
What is Income or Wage Gap in Flushing?
Income or Wage Gap in Flushing is 42.7%.
Women in Flushing earn 57.3 cents for every dollar earned by a man.
What is Inequality or Gini Index in Flushing?
Inequality or Gini Index in Flushing is 0.38.
What is the Total Population of Flushing?
Total Population of Flushing is 8,349.
What is the Total Male Population of Flushing?
Total Male Population of Flushing is 4,011.
What is the Total Female Population of Flushing?
Total Female Population of Flushing is 4,338.
What is the Ratio of Males per 100 Females in Flushing?
There are 92.46 Males per 100 Females in Flushing.
What is the Ratio of Females per 100 Males in Flushing?
There are 108.15 Females per 100 Males in Flushing.
What is the Median Population Age in Flushing?
Median Population Age in Flushing is 39.4 Years.
What is the Average Family Size in Flushing
Average Family Size in Flushing is 3.1 People.
What is the Average Household Size in Flushing
Average Household Size in Flushing is 2.4 People.
How Large is the Labor Force in Flushing?
There are 3,932 People in the Labor Forcein in Flushing.
What is the Percentage of People in the Labor Force in Flushing?
58.3% of People are in the Labor Force in Flushing.
What is the Unemployment Rate in Flushing?
Unemployment Rate in Flushing is 6.6%.