Fairgrove, MI Map & Demographics
Fairgrove Map
Fairgrove Overview
$20,902
PER CAPITA INCOME
$59,318
AVG FAMILY INCOME
$34,583
AVG HOUSEHOLD INCOME
21.8%
WAGE / INCOME GAP [ % ]
78.2¢/ $1
WAGE / INCOME GAP [ $ ]
0.44
INEQUALITY / GINI INDEX
501
TOTAL POPULATION
214
MALE POPULATION
287
FEMALE POPULATION
74.56
MALES / 100 FEMALES
134.11
FEMALES / 100 MALES
42.4
MEDIAN AGE
3.5
AVG FAMILY SIZE
2.4
AVG HOUSEHOLD SIZE
185
LABOR FORCE [ PEOPLE ]
46.6%
PERCENT IN LABOR FORCE
2.7%
UNEMPLOYMENT RATE
Fairgrove Zip Codes
Fairgrove Area Codes
Income in Fairgrove
Income Overview in Fairgrove
Per Capita Income in Fairgrove is $20,902, while median incomes of families and households are $59,318 and $34,583 respectively.
| Characteristic | Number | Measure |
| Per Capita Income | 501 | $20,902 |
| Median Family Income | 100 | $59,318 |
| Mean Family Income | 100 | $71,395 |
| Median Household Income | 205 | $34,583 |
| Mean Household Income | 205 | $47,501 |
| Income Deficit | 100 | $0 |
| Wage / Income Gap (%) | 501 | 21.77% |
| Wage / Income Gap ($) | 501 | 78.23¢ per $1 |
| Gini / Inequality Index | 501 | 0.44 |
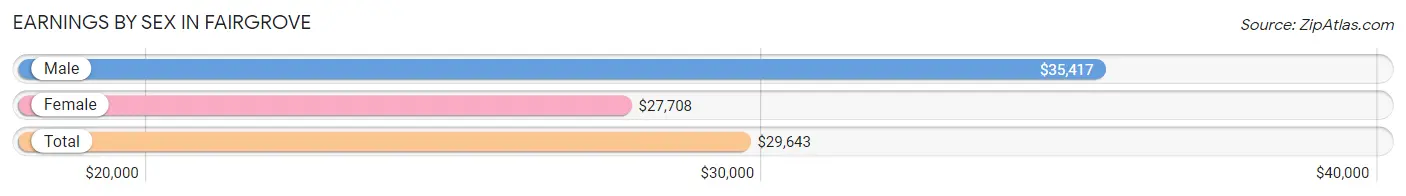
Earnings by Sex in Fairgrove
Average Earnings in Fairgrove are $29,643, $35,417 for men and $27,708 for women, a difference of 21.8%.
| Sex | Number | Average Earnings |
| Male | 85 (43.8%) | $35,417 |
| Female | 109 (56.2%) | $27,708 |
| Total | 194 (100.0%) | $29,643 |
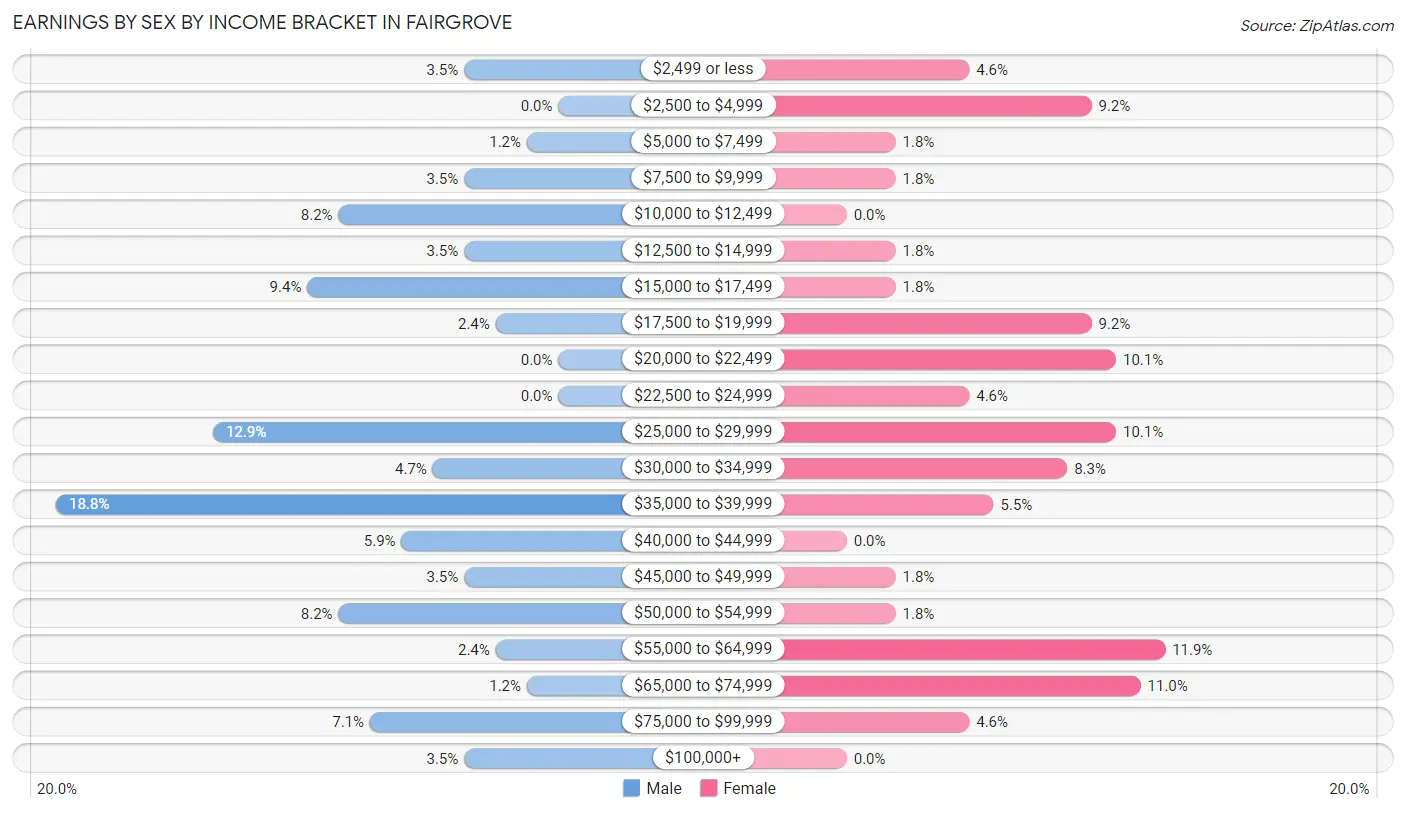
Earnings by Sex by Income Bracket in Fairgrove
The most common earnings brackets in Fairgrove are $35,000 to $39,999 for men (16 | 18.8%) and $55,000 to $64,999 for women (13 | 11.9%).
| Income | Male | Female |
| $2,499 or less | 3 (3.5%) | 5 (4.6%) |
| $2,500 to $4,999 | 0 (0.0%) | 10 (9.2%) |
| $5,000 to $7,499 | 1 (1.2%) | 2 (1.8%) |
| $7,500 to $9,999 | 3 (3.5%) | 2 (1.8%) |
| $10,000 to $12,499 | 7 (8.2%) | 0 (0.0%) |
| $12,500 to $14,999 | 3 (3.5%) | 2 (1.8%) |
| $15,000 to $17,499 | 8 (9.4%) | 2 (1.8%) |
| $17,500 to $19,999 | 2 (2.4%) | 10 (9.2%) |
| $20,000 to $22,499 | 0 (0.0%) | 11 (10.1%) |
| $22,500 to $24,999 | 0 (0.0%) | 5 (4.6%) |
| $25,000 to $29,999 | 11 (12.9%) | 11 (10.1%) |
| $30,000 to $34,999 | 4 (4.7%) | 9 (8.3%) |
| $35,000 to $39,999 | 16 (18.8%) | 6 (5.5%) |
| $40,000 to $44,999 | 5 (5.9%) | 0 (0.0%) |
| $45,000 to $49,999 | 3 (3.5%) | 2 (1.8%) |
| $50,000 to $54,999 | 7 (8.2%) | 2 (1.8%) |
| $55,000 to $64,999 | 2 (2.4%) | 13 (11.9%) |
| $65,000 to $74,999 | 1 (1.2%) | 12 (11.0%) |
| $75,000 to $99,999 | 6 (7.1%) | 5 (4.6%) |
| $100,000+ | 3 (3.5%) | 0 (0.0%) |
| Total | 85 (100.0%) | 109 (100.0%) |
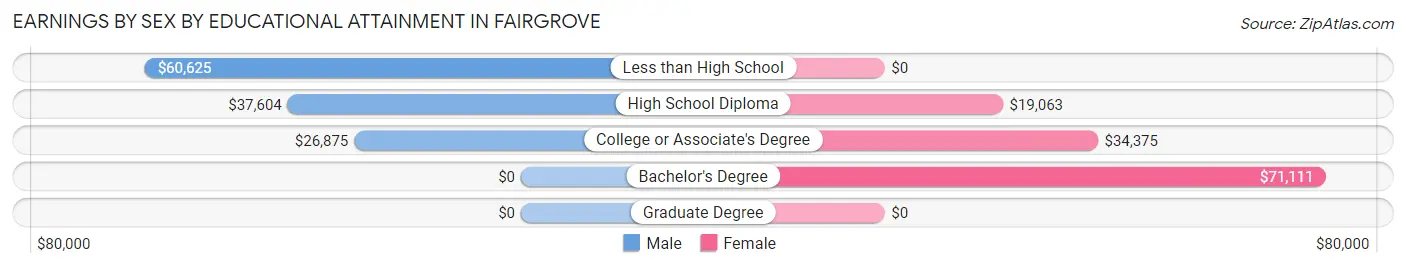
Earnings by Sex by Educational Attainment in Fairgrove
Average earnings in Fairgrove are $37,788 for men and $28,958 for women, a difference of 23.4%. Men with an educational attainment of less than high school enjoy the highest average annual earnings of $60,625, while those with college or associate's degree education earn the least with $26,875. Women with an educational attainment of bachelor's degree earn the most with the average annual earnings of $71,111, while those with high school diploma education have the smallest earnings of $19,063.
| Educational Attainment | Male Income | Female Income |
| Less than High School | $60,625 | $0 |
| High School Diploma | $37,604 | $19,063 |
| College or Associate's Degree | $26,875 | $34,375 |
| Bachelor's Degree | - | - |
| Graduate Degree | - | - |
| Total | $37,788 | $28,958 |
Family Income in Fairgrove
Family Income Brackets in Fairgrove
According to the Fairgrove family income data, there are 38 families falling into the $50,000 to $74,999 income range, which is the most common income bracket and makes up 38.0% of all families.
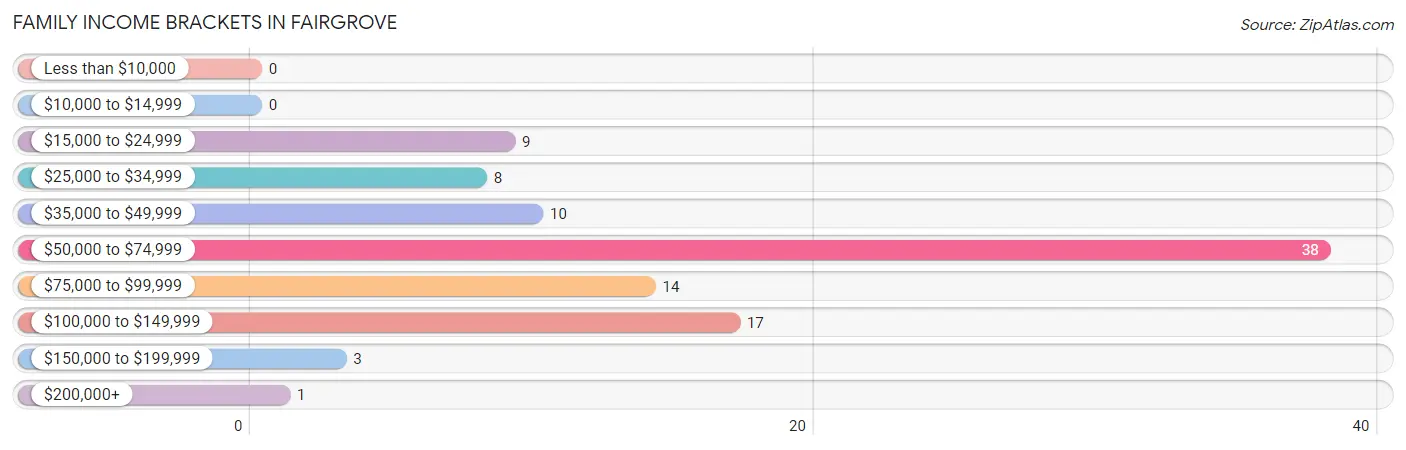
| Income Bracket | # Families | % Families |
| Less than $10,000 | 0 | 0.0% |
| $10,000 to $14,999 | 0 | 0.0% |
| $15,000 to $24,999 | 9 | 9.0% |
| $25,000 to $34,999 | 8 | 8.0% |
| $35,000 to $49,999 | 10 | 10.0% |
| $50,000 to $74,999 | 38 | 38.0% |
| $75,000 to $99,999 | 14 | 14.0% |
| $100,000 to $149,999 | 17 | 17.0% |
| $150,000 to $199,999 | 3 | 3.0% |
| $200,000+ | 1 | 1.0% |
Family Income by Famaliy Size in Fairgrove
5-person families (9 | 9.0%) account for the highest median family income in Fairgrove with $138,125 per family, while 5-person families (9 | 9.0%) have the highest median income of $27,625 per family member.
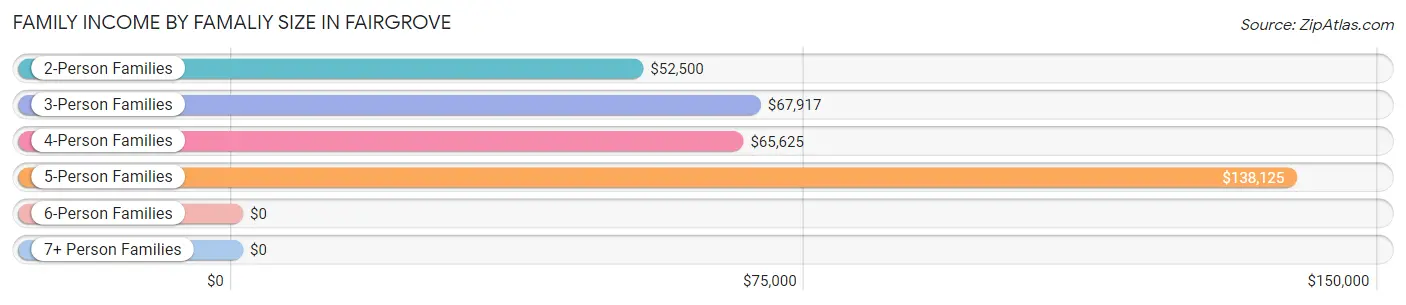
| Income Bracket | # Families | Median Income |
| 2-Person Families | 38 (38.0%) | $52,500 |
| 3-Person Families | 29 (29.0%) | $67,917 |
| 4-Person Families | 19 (19.0%) | $65,625 |
| 5-Person Families | 9 (9.0%) | $138,125 |
| 6-Person Families | 0 (0.0%) | $0 |
| 7+ Person Families | 5 (5.0%) | $0 |
| Total | 100 (100.0%) | $59,318 |
Family Income by Number of Earners in Fairgrove
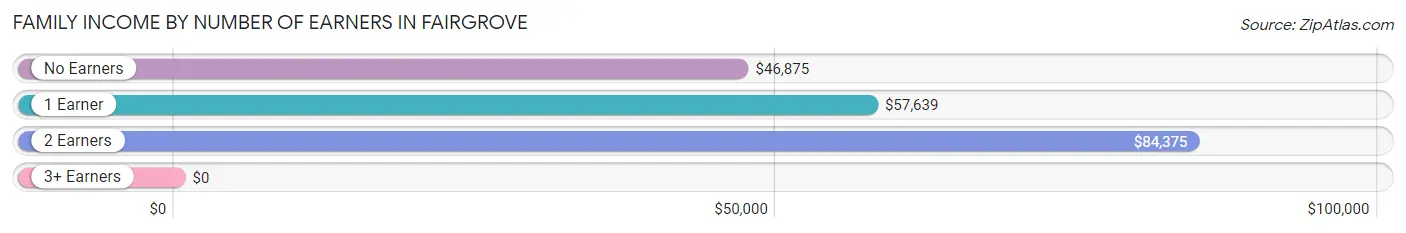
| Number of Earners | # Families | Median Income |
| No Earners | 17 (17.0%) | $46,875 |
| 1 Earner | 35 (35.0%) | $57,639 |
| 2 Earners | 45 (45.0%) | $84,375 |
| 3+ Earners | 3 (3.0%) | $0 |
| Total | 100 (100.0%) | $59,318 |
Household Income in Fairgrove
Household Income Brackets in Fairgrove
With 53 households falling in the category, the $15,000 to $24,999 income range is the most frequent in Fairgrove, accounting for 25.9% of all households. In contrast, only 1 households (0.5%) fall into the $200,000+ income bracket, making it the least populous group.
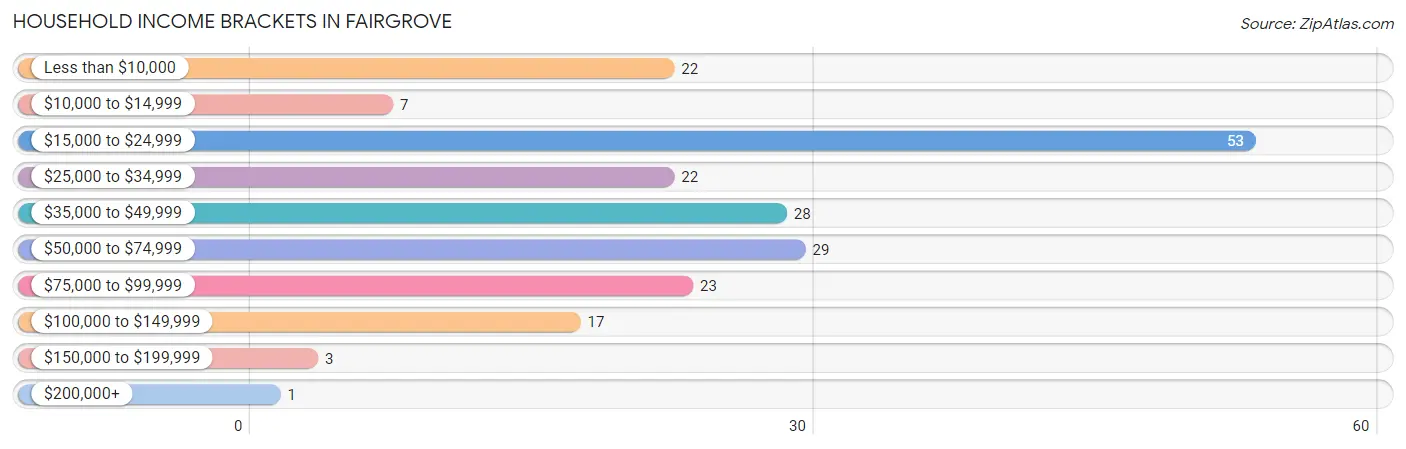
| Income Bracket | # Households | % Households |
| Less than $10,000 | 22 | 10.7% |
| $10,000 to $14,999 | 7 | 3.4% |
| $15,000 to $24,999 | 53 | 25.9% |
| $25,000 to $34,999 | 22 | 10.7% |
| $35,000 to $49,999 | 28 | 13.7% |
| $50,000 to $74,999 | 29 | 14.1% |
| $75,000 to $99,999 | 23 | 11.2% |
| $100,000 to $149,999 | 17 | 8.3% |
| $150,000 to $199,999 | 3 | 1.5% |
| $200,000+ | 1 | 0.5% |
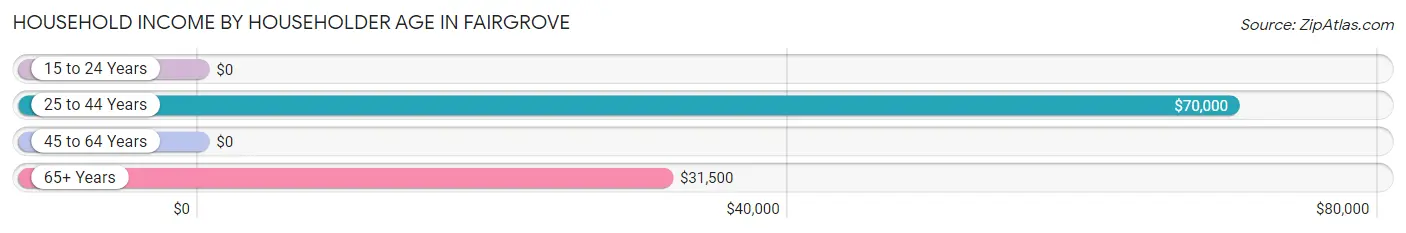
Household Income by Householder Age in Fairgrove
The median household income in Fairgrove is $34,583, with the highest median household income of $70,000 found in the 25 to 44 years age bracket for the primary householder. A total of 54 households (26.3%) fall into this category.
| Income Bracket | # Households | Median Income |
| 15 to 24 Years | 0 (0.0%) | $0 |
| 25 to 44 Years | 54 (26.3%) | $70,000 |
| 45 to 64 Years | 95 (46.3%) | $0 |
| 65+ Years | 56 (27.3%) | $31,500 |
| Total | 205 (100.0%) | $34,583 |
Poverty in Fairgrove
Income Below Poverty by Sex and Age in Fairgrove
With 23.8% poverty level for males and 18.1% for females among the residents of Fairgrove, 5 year old males and under 5 year old females are the most vulnerable to poverty, with 5 males (62.5%) and 5 females (55.6%) in their respective age groups living below the poverty level.
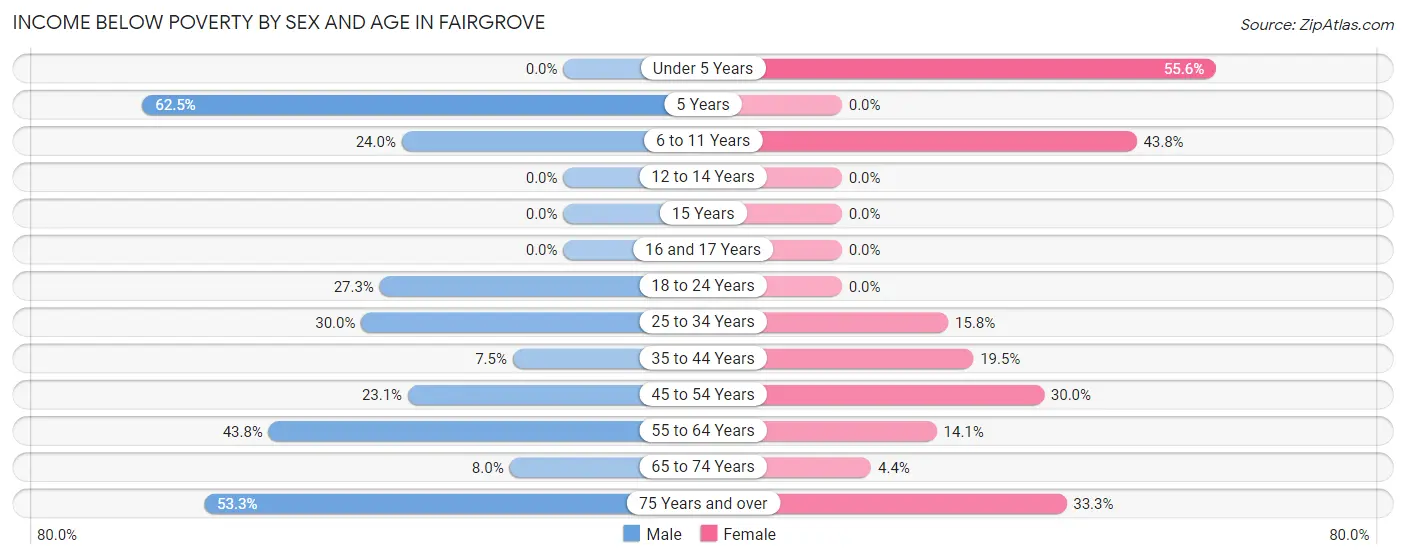
| Age Bracket | Male | Female |
| Under 5 Years | 0 (0.0%) | 5 (55.6%) |
| 5 Years | 5 (62.5%) | 0 (0.0%) |
| 6 to 11 Years | 6 (24.0%) | 7 (43.8%) |
| 12 to 14 Years | 0 (0.0%) | 0 (0.0%) |
| 15 Years | 0 (0.0%) | 0 (0.0%) |
| 16 and 17 Years | 0 (0.0%) | 0 (0.0%) |
| 18 to 24 Years | 3 (27.3%) | 0 (0.0%) |
| 25 to 34 Years | 6 (30.0%) | 6 (15.8%) |
| 35 to 44 Years | 3 (7.5%) | 8 (19.5%) |
| 45 to 54 Years | 3 (23.1%) | 12 (30.0%) |
| 55 to 64 Years | 7 (43.8%) | 10 (14.1%) |
| 65 to 74 Years | 2 (8.0%) | 1 (4.3%) |
| 75 Years and over | 16 (53.3%) | 2 (33.3%) |
| Total | 51 (23.8%) | 51 (18.1%) |
Income Above Poverty by Sex and Age in Fairgrove
According to the poverty statistics in Fairgrove, males aged under 5 years and females aged 12 to 14 years are the age groups that are most secure financially, with 100.0% of males and 100.0% of females in these age groups living above the poverty line.
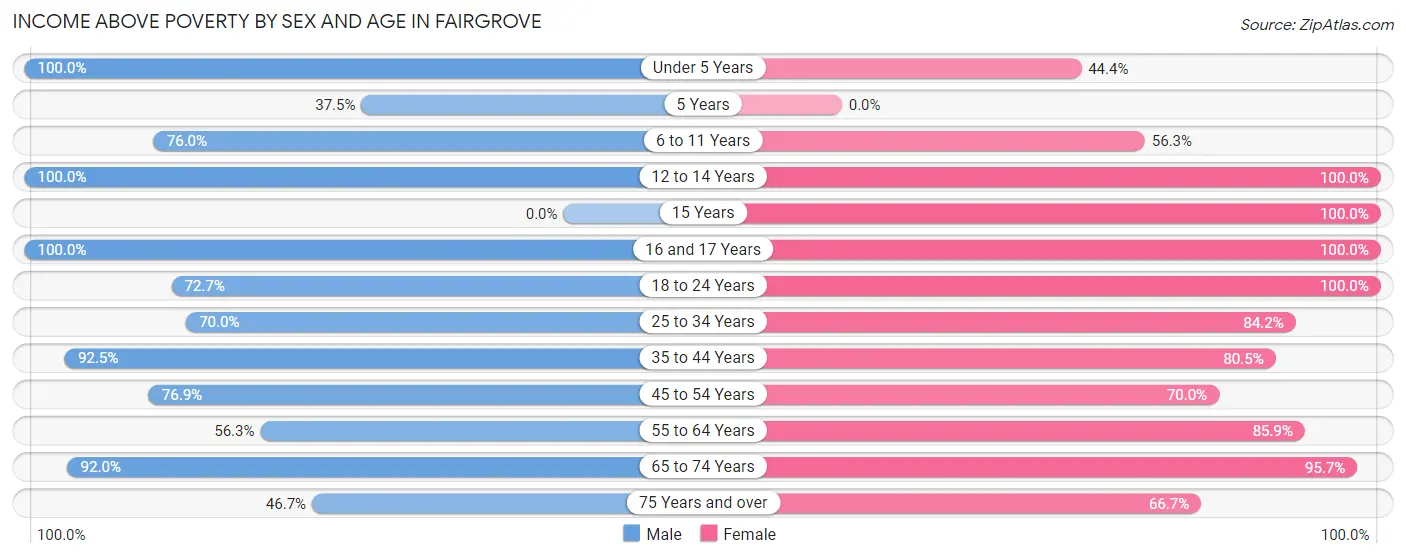
| Age Bracket | Male | Female |
| Under 5 Years | 16 (100.0%) | 4 (44.4%) |
| 5 Years | 3 (37.5%) | 0 (0.0%) |
| 6 to 11 Years | 19 (76.0%) | 9 (56.2%) |
| 12 to 14 Years | 6 (100.0%) | 17 (100.0%) |
| 15 Years | 0 (0.0%) | 2 (100.0%) |
| 16 and 17 Years | 4 (100.0%) | 8 (100.0%) |
| 18 to 24 Years | 8 (72.7%) | 11 (100.0%) |
| 25 to 34 Years | 14 (70.0%) | 32 (84.2%) |
| 35 to 44 Years | 37 (92.5%) | 33 (80.5%) |
| 45 to 54 Years | 10 (76.9%) | 28 (70.0%) |
| 55 to 64 Years | 9 (56.2%) | 61 (85.9%) |
| 65 to 74 Years | 23 (92.0%) | 22 (95.7%) |
| 75 Years and over | 14 (46.7%) | 4 (66.7%) |
| Total | 163 (76.2%) | 231 (81.9%) |
Income Below Poverty Among Married-Couple Families in Fairgrove
The poverty statistics for married-couple families in Fairgrove show that 9.2% or 6 of the total 65 families live below the poverty line. Families with 3 or 4 children have the highest poverty rate of 45.5%, comprising of 5 families. On the other hand, families with no children have the lowest poverty rate of 0.0%, which includes 0 families.
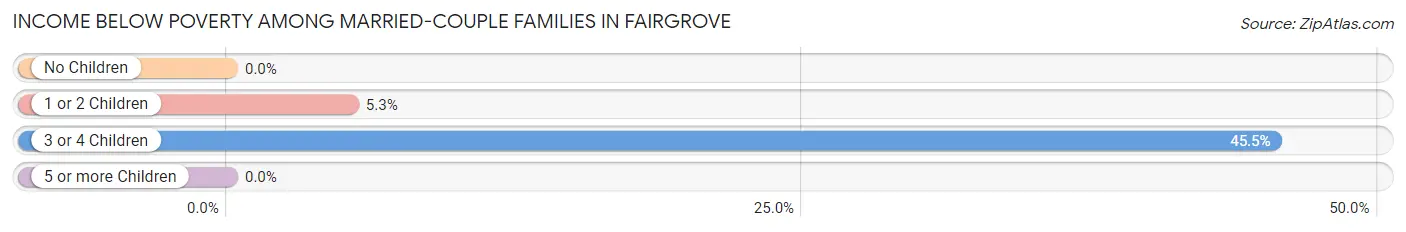
| Children | Above Poverty | Below Poverty |
| No Children | 35 (100.0%) | 0 (0.0%) |
| 1 or 2 Children | 18 (94.7%) | 1 (5.3%) |
| 3 or 4 Children | 6 (54.5%) | 5 (45.5%) |
| 5 or more Children | 0 (0.0%) | 0 (0.0%) |
| Total | 59 (90.8%) | 6 (9.2%) |
Income Below Poverty Among Single-Parent Households in Fairgrove
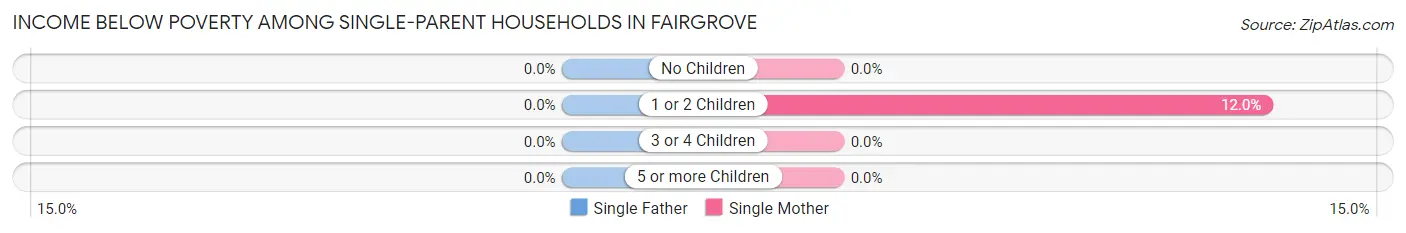
| Children | Single Father | Single Mother |
| No Children | 0 (0.0%) | 0 (0.0%) |
| 1 or 2 Children | 0 (0.0%) | 3 (12.0%) |
| 3 or 4 Children | 0 (0.0%) | 0 (0.0%) |
| 5 or more Children | 0 (0.0%) | 0 (0.0%) |
| Total | 0 (0.0%) | 3 (9.1%) |
Income Below Poverty Among Married-Couple vs Single-Parent Households in Fairgrove
The poverty data for Fairgrove shows that 6 of the married-couple family households (9.2%) and 3 of the single-parent households (8.6%) are living below the poverty level. Within the married-couple family households, those with 3 or 4 children have the highest poverty rate, with 5 households (45.5%) falling below the poverty line. Among the single-parent households, those with 1 or 2 children have the highest poverty rate, with 3 household (12.0%) living below poverty.
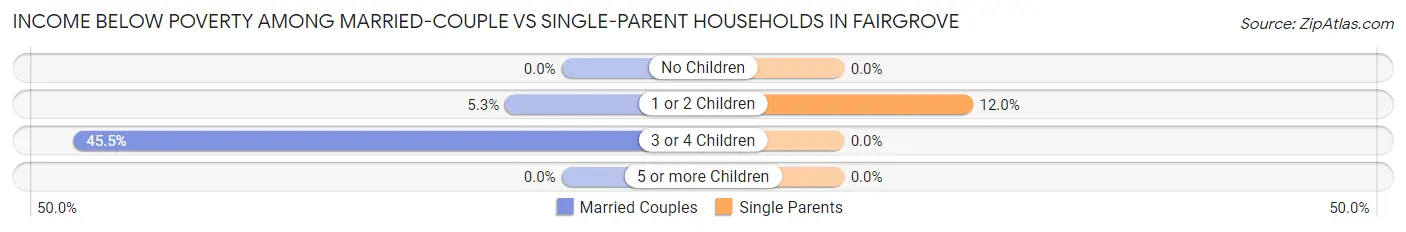
| Children | Married-Couple Families | Single-Parent Households |
| No Children | 0 (0.0%) | 0 (0.0%) |
| 1 or 2 Children | 1 (5.3%) | 3 (12.0%) |
| 3 or 4 Children | 5 (45.5%) | 0 (0.0%) |
| 5 or more Children | 0 (0.0%) | 0 (0.0%) |
| Total | 6 (9.2%) | 3 (8.6%) |
Race in Fairgrove
The most populous races in Fairgrove are White / Caucasian (449 | 89.6%), Black / African American (28 | 5.6%), and Hispanic or Latino (27 | 5.4%).
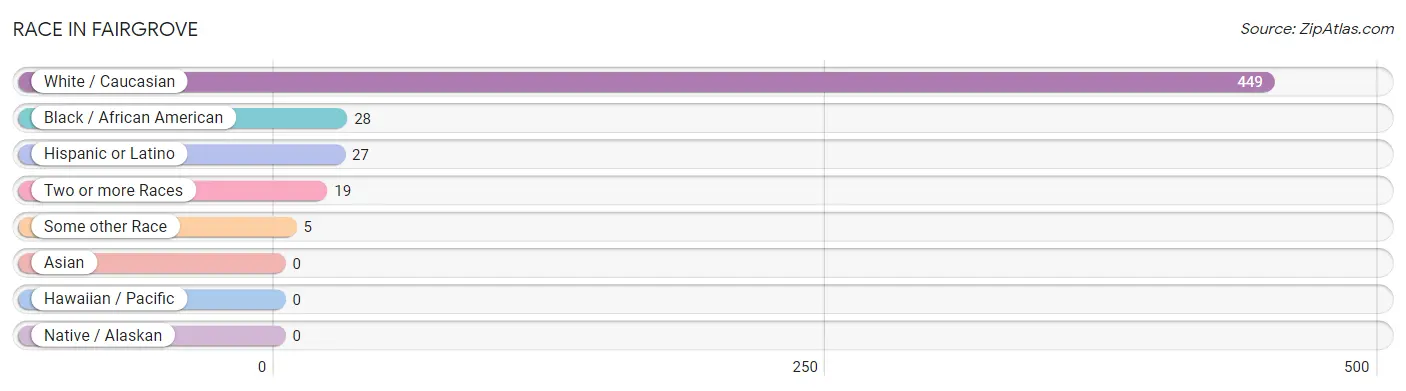
| Race | # Population | % Population |
| Asian | 0 | 0.0% |
| Black / African American | 28 | 5.6% |
| Hawaiian / Pacific | 0 | 0.0% |
| Hispanic or Latino | 27 | 5.4% |
| Native / Alaskan | 0 | 0.0% |
| White / Caucasian | 449 | 89.6% |
| Two or more Races | 19 | 3.8% |
| Some other Race | 5 | 1.0% |
| Total | 501 | 100.0% |
Ancestry in Fairgrove
The most populous ancestries reported in Fairgrove are German (170 | 33.9%), English (79 | 15.8%), Irish (46 | 9.2%), American (33 | 6.6%), and Polish (28 | 5.6%), together accounting for 71.1% of all Fairgrove residents.
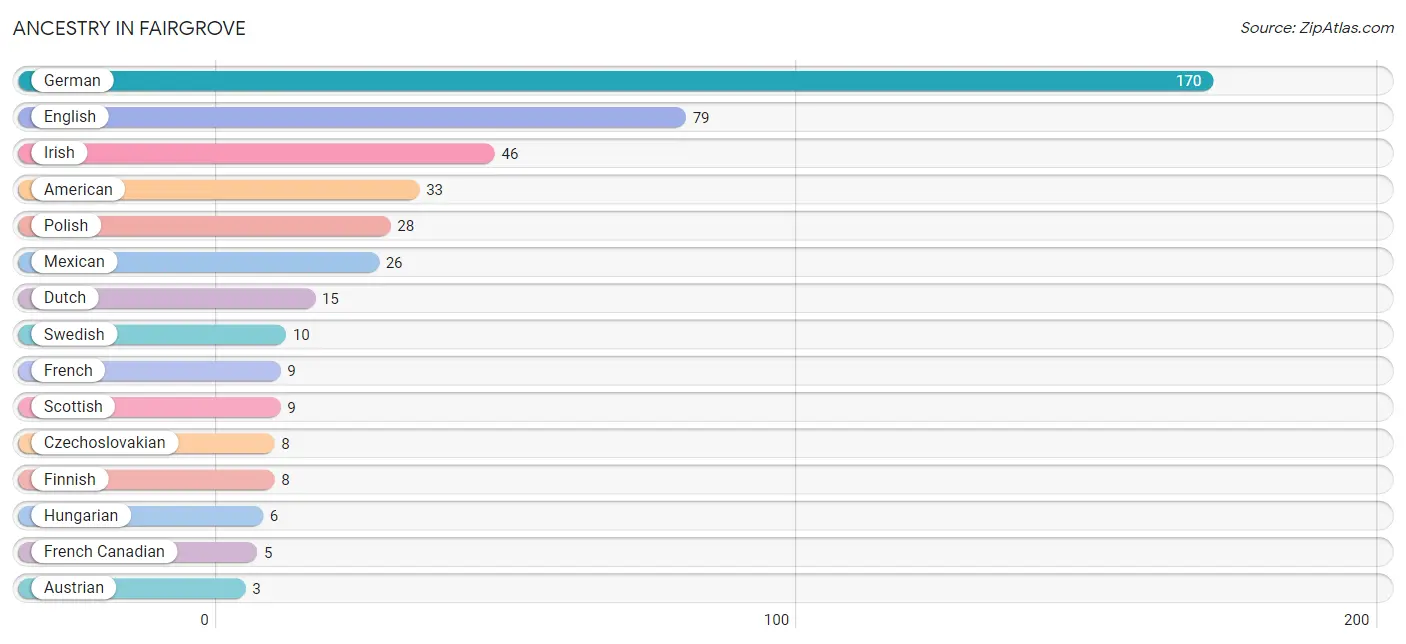
| Ancestry | # Population | % Population |
| American | 33 | 6.6% |
| Austrian | 3 | 0.6% |
| Cuban | 1 | 0.2% |
| Czechoslovakian | 8 | 1.6% |
| Dutch | 15 | 3.0% |
| English | 79 | 15.8% |
| European | 2 | 0.4% |
| Finnish | 8 | 1.6% |
| French | 9 | 1.8% |
| French Canadian | 5 | 1.0% |
| German | 170 | 33.9% |
| Ghanaian | 3 | 0.6% |
| Hungarian | 6 | 1.2% |
| Irish | 46 | 9.2% |
| Lithuanian | 2 | 0.4% |
| Mexican | 26 | 5.2% |
| Norwegian | 2 | 0.4% |
| Polish | 28 | 5.6% |
| Russian | 2 | 0.4% |
| Scotch-Irish | 1 | 0.2% |
| Scottish | 9 | 1.8% |
| Subsaharan African | 3 | 0.6% |
| Swedish | 10 | 2.0% | View All 23 Rows |
Immigrants in Fairgrove
The most numerous immigrant groups reported in Fairgrove came from Africa (3 | 0.6%), Ghana (3 | 0.6%), Western Africa (3 | 0.6%), Caribbean (1 | 0.2%), and Cuba (1 | 0.2%), together accounting for 2.2% of all Fairgrove residents.
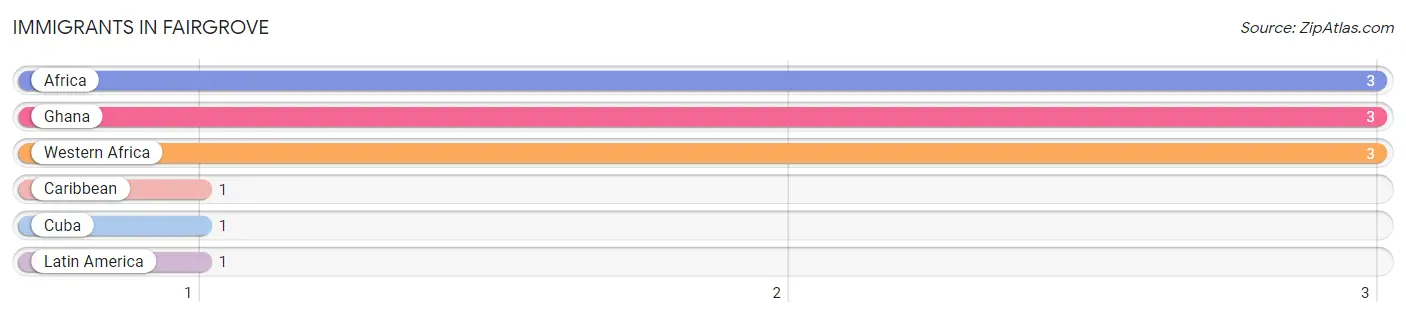
| Immigration Origin | # Population | % Population |
| Africa | 3 | 0.6% |
| Caribbean | 1 | 0.2% |
| Cuba | 1 | 0.2% |
| Ghana | 3 | 0.6% |
| Latin America | 1 | 0.2% |
| Western Africa | 3 | 0.6% | View All 6 Rows |
Sex and Age in Fairgrove
Sex and Age in Fairgrove
The most populous age groups in Fairgrove are 40 to 44 Years (24 | 11.2%) for men and 60 to 64 Years (54 | 18.8%) for women.
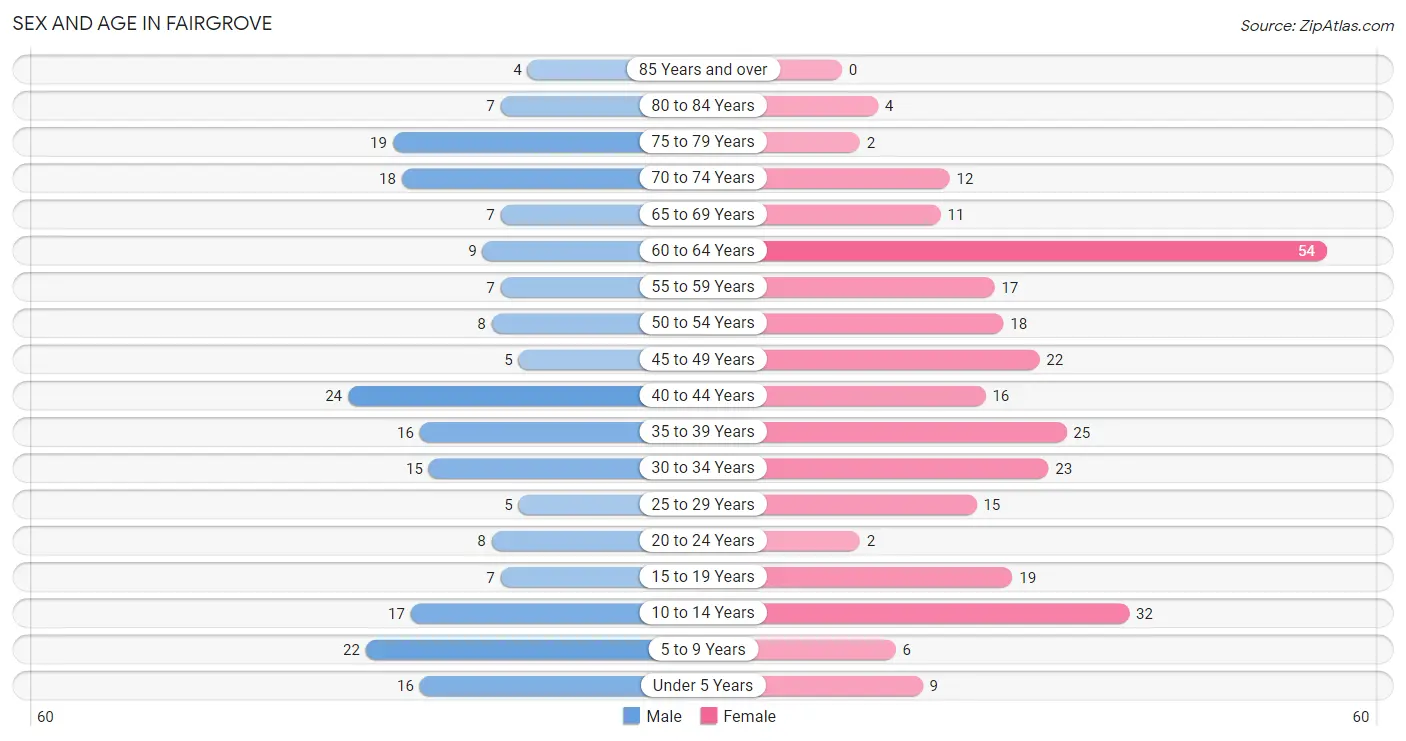
| Age Bracket | Male | Female |
| Under 5 Years | 16 (7.5%) | 9 (3.1%) |
| 5 to 9 Years | 22 (10.3%) | 6 (2.1%) |
| 10 to 14 Years | 17 (7.9%) | 32 (11.2%) |
| 15 to 19 Years | 7 (3.3%) | 19 (6.6%) |
| 20 to 24 Years | 8 (3.7%) | 2 (0.7%) |
| 25 to 29 Years | 5 (2.3%) | 15 (5.2%) |
| 30 to 34 Years | 15 (7.0%) | 23 (8.0%) |
| 35 to 39 Years | 16 (7.5%) | 25 (8.7%) |
| 40 to 44 Years | 24 (11.2%) | 16 (5.6%) |
| 45 to 49 Years | 5 (2.3%) | 22 (7.7%) |
| 50 to 54 Years | 8 (3.7%) | 18 (6.3%) |
| 55 to 59 Years | 7 (3.3%) | 17 (5.9%) |
| 60 to 64 Years | 9 (4.2%) | 54 (18.8%) |
| 65 to 69 Years | 7 (3.3%) | 11 (3.8%) |
| 70 to 74 Years | 18 (8.4%) | 12 (4.2%) |
| 75 to 79 Years | 19 (8.9%) | 2 (0.7%) |
| 80 to 84 Years | 7 (3.3%) | 4 (1.4%) |
| 85 Years and over | 4 (1.9%) | 0 (0.0%) |
| Total | 214 (100.0%) | 287 (100.0%) |
Families and Households in Fairgrove
Median Family Size in Fairgrove
The median family size in Fairgrove is 3.52 persons per family, with single female/mother families (33 | 33.0%) accounting for the largest median family size of 3.82 persons per family. On the other hand, single male/father families (2 | 2.0%) represent the smallest median family size with 2.00 persons per family.
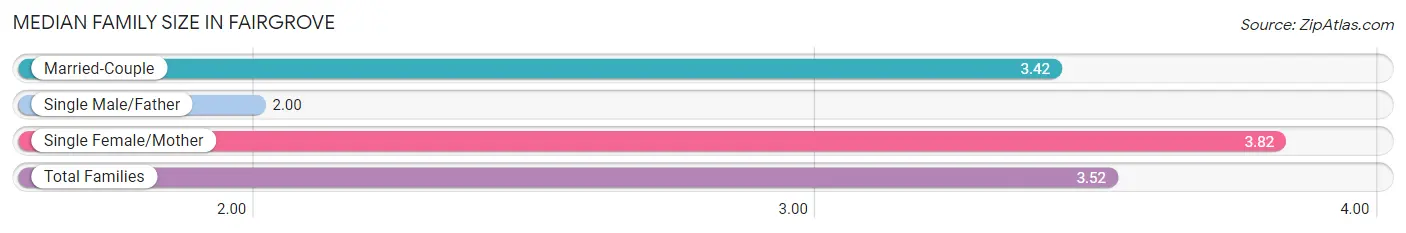
| Family Type | # Families | Family Size |
| Married-Couple | 65 (65.0%) | 3.42 |
| Single Male/Father | 2 (2.0%) | 2.00 |
| Single Female/Mother | 33 (33.0%) | 3.82 |
| Total Families | 100 (100.0%) | 3.52 |
Median Household Size in Fairgrove
The median household size in Fairgrove is 2.42 persons per household, with single female/mother households (33 | 16.1%) accounting for the largest median household size of 4.18 persons per household. non-family households (105 | 51.2%) represent the smallest median household size with 1.10 persons per household.
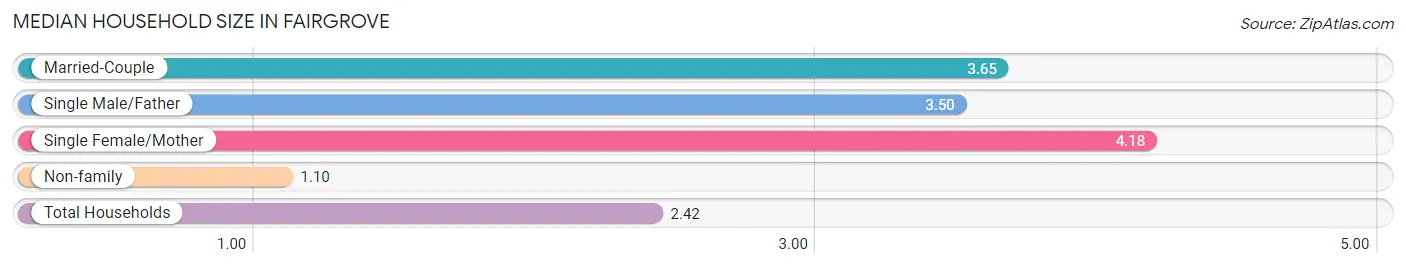
| Household Type | # Households | Household Size |
| Married-Couple | 65 (31.7%) | 3.65 |
| Single Male/Father | 2 (1.0%) | 3.50 |
| Single Female/Mother | 33 (16.1%) | 4.18 |
| Non-family | 105 (51.2%) | 1.10 |
| Total Households | 205 (100.0%) | 2.42 |
Household Size by Marriage Status in Fairgrove
Out of a total of 205 households in Fairgrove, 100 (48.8%) are family households, while 105 (51.2%) are nonfamily households. The most numerous type of family households are 2-person households, comprising 36, and the most common type of nonfamily households are 1-person households, comprising 97.
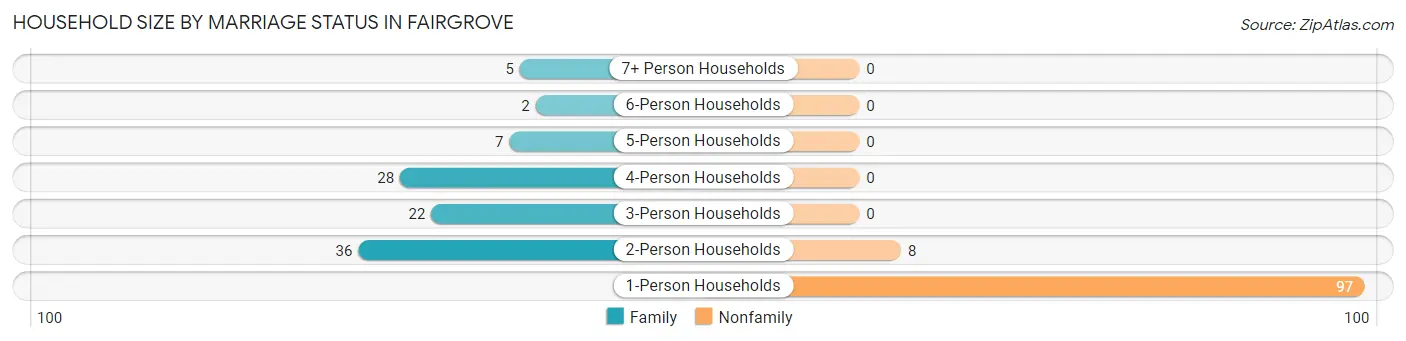
| Household Size | Family Households | Nonfamily Households |
| 1-Person Households | - | 97 (47.3%) |
| 2-Person Households | 36 (17.6%) | 8 (3.9%) |
| 3-Person Households | 22 (10.7%) | 0 (0.0%) |
| 4-Person Households | 28 (13.7%) | 0 (0.0%) |
| 5-Person Households | 7 (3.4%) | 0 (0.0%) |
| 6-Person Households | 2 (1.0%) | 0 (0.0%) |
| 7+ Person Households | 5 (2.4%) | 0 (0.0%) |
| Total | 100 (48.8%) | 105 (51.2%) |
Female Fertility in Fairgrove
Fertility by Age in Fairgrove
| Age Bracket | Women with Births | Births / 1,000 Women |
| 15 to 19 years | 0 (0.0%) | 0.0 |
| 20 to 34 years | 0 (0.0%) | 0.0 |
| 35 to 50 years | 0 (0.0%) | 0.0 |
| Total | 0 (0.0%) | 0.0 |
Fertility by Age by Marriage Status in Fairgrove
| Age Bracket | Married | Unmarried |
| 15 to 19 years | 0 (0.0%) | 0 (0.0%) |
| 20 to 34 years | 0 (0.0%) | 0 (0.0%) |
| 35 to 50 years | 0 (0.0%) | 0 (0.0%) |
| Total | 0 (0.0%) | 0 (0.0%) |
Fertility by Education in Fairgrove
| Educational Attainment | Women with Births | Births / 1,000 Women |
| Less than High School | 0 (0.0%) | 0.0 |
| High School Diploma | 0 (0.0%) | 0.0 |
| College or Associate's Degree | 0 (0.0%) | 0.0 |
| Bachelor's Degree | 0 (0.0%) | 0.0 |
| Graduate Degree | 0 (0.0%) | 0.0 |
| Total | 0 (0.0%) | 0.0 |
Fertility by Education by Marriage Status in Fairgrove
| Educational Attainment | Married | Unmarried |
| Less than High School | 0 (0.0%) | 0 (0.0%) |
| High School Diploma | 0 (0.0%) | 0 (0.0%) |
| College or Associate's Degree | 0 (0.0%) | 0 (0.0%) |
| Bachelor's Degree | 0 (0.0%) | 0 (0.0%) |
| Graduate Degree | 0 (0.0%) | 0 (0.0%) |
| Total | 0 (0.0%) | 0 (0.0%) |
Employment Characteristics in Fairgrove
Employment by Class of Employer in Fairgrove
Among the 172 employed individuals in Fairgrove, private company employees (134 | 77.9%), local government employees (15 | 8.7%), and self-employed (not incorporated) (7 | 4.1%) make up the most common classes of employment.
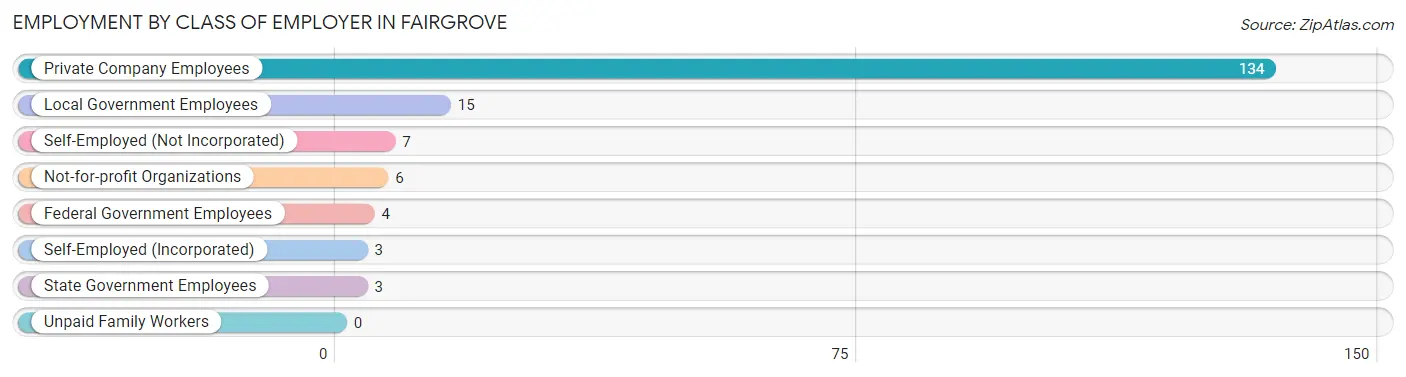
| Employer Class | # Employees | % Employees |
| Private Company Employees | 134 | 77.9% |
| Self-Employed (Incorporated) | 3 | 1.7% |
| Self-Employed (Not Incorporated) | 7 | 4.1% |
| Not-for-profit Organizations | 6 | 3.5% |
| Local Government Employees | 15 | 8.7% |
| State Government Employees | 3 | 1.7% |
| Federal Government Employees | 4 | 2.3% |
| Unpaid Family Workers | 0 | 0.0% |
| Total | 172 | 100.0% |
Employment Status by Age in Fairgrove
According to the labor force statistics for Fairgrove, out of the total population over 16 years of age (397), 46.6% or 185 individuals are in the labor force, with 2.7% or 5 of them unemployed. The age group with the highest labor force participation rate is 35 to 44 years, with 84.0% or 68 individuals in the labor force. Within the labor force, the 16 to 19 years age range has the highest percentage of unemployed individuals, with 28.6% or 2 of them being unemployed.
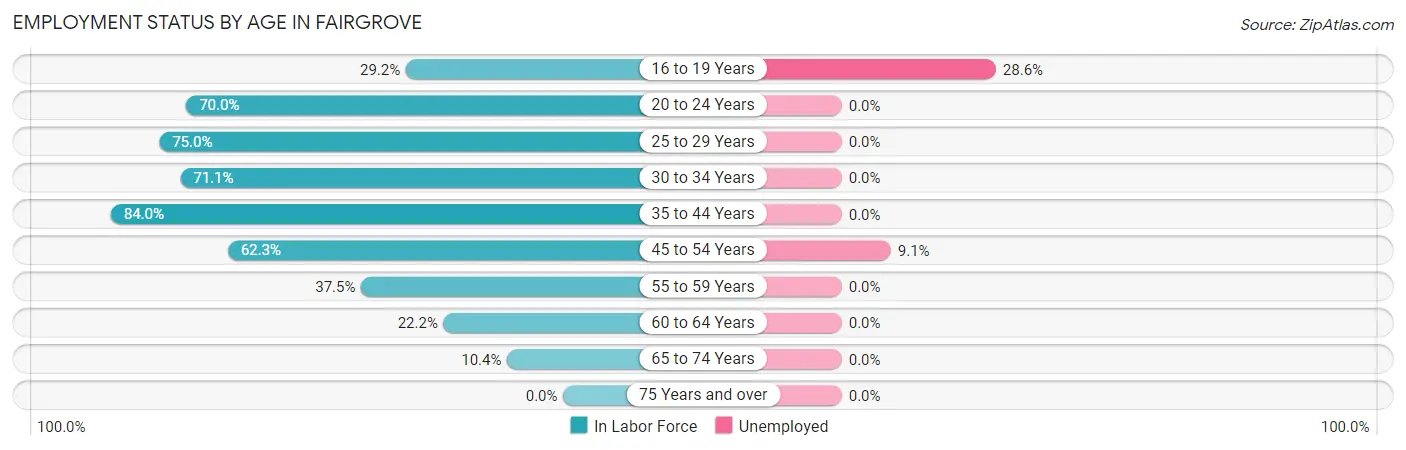
| Age Bracket | In Labor Force | Unemployed |
| 16 to 19 Years | 7 (29.2%) | 2 (28.6%) |
| 20 to 24 Years | 7 (70.0%) | 0 (0.0%) |
| 25 to 29 Years | 15 (75.0%) | 0 (0.0%) |
| 30 to 34 Years | 27 (71.1%) | 0 (0.0%) |
| 35 to 44 Years | 68 (84.0%) | 0 (0.0%) |
| 45 to 54 Years | 33 (62.3%) | 3 (9.1%) |
| 55 to 59 Years | 9 (37.5%) | 0 (0.0%) |
| 60 to 64 Years | 14 (22.2%) | 0 (0.0%) |
| 65 to 74 Years | 5 (10.4%) | 0 (0.0%) |
| 75 Years and over | 0 (0.0%) | 0 (0.0%) |
| Total | 185 (46.6%) | 5 (2.7%) |
Employment Status by Educational Attainment in Fairgrove
According to labor force statistics for Fairgrove, 59.5% of individuals (166) out of the total population between 25 and 64 years of age (279) are in the labor force, with 1.8% or 3 of them being unemployed. The group with the highest labor force participation rate are those with the educational attainment of bachelor's degree or higher, with 89.7% or 26 individuals in the labor force. Within the labor force, individuals with high school diploma education have the highest percentage of unemployment, with 3.8% or 3 of them being unemployed.
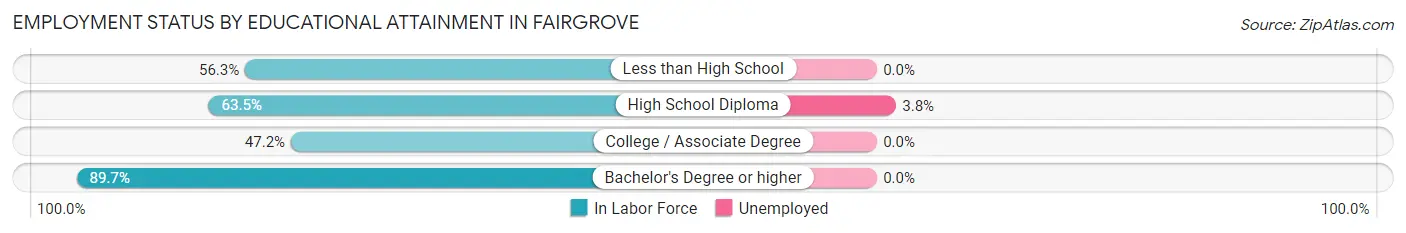
| Educational Attainment | In Labor Force | Unemployed |
| Less than High School | 9 (56.3%) | 0 (0.0%) |
| High School Diploma | 80 (63.5%) | 5 (3.8%) |
| College / Associate Degree | 51 (47.2%) | 0 (0.0%) |
| Bachelor's Degree or higher | 26 (89.7%) | 0 (0.0%) |
| Total | 166 (59.5%) | 5 (1.8%) |
Employment Occupations by Sex in Fairgrove
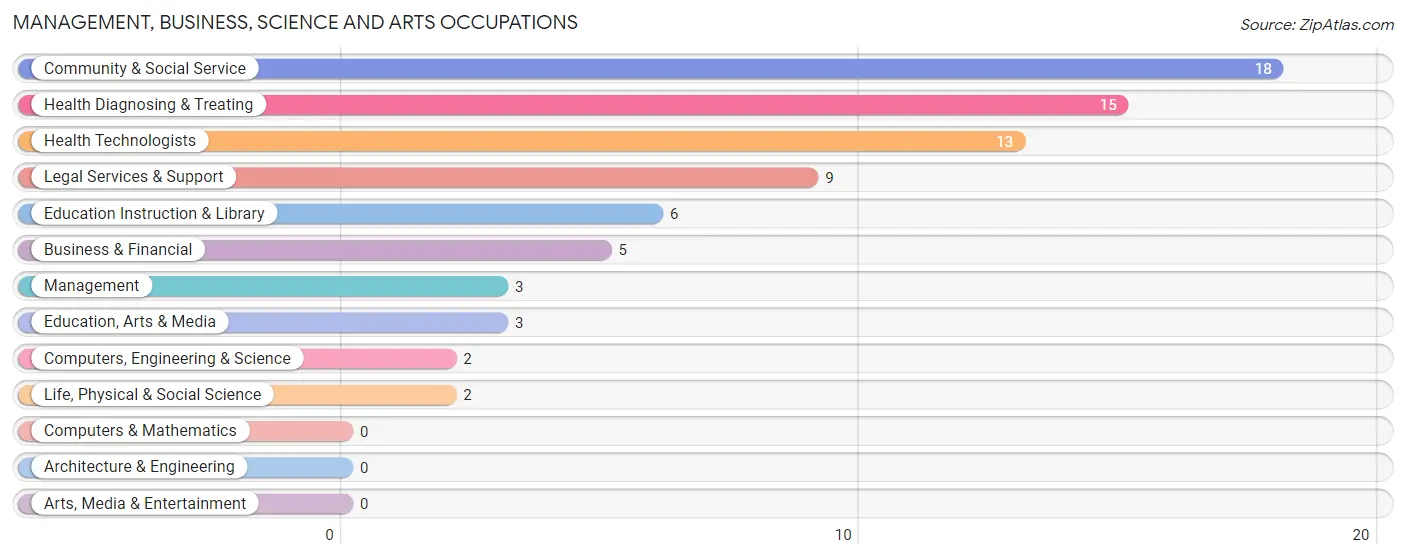
Management, Business, Science and Arts Occupations
The most common Management, Business, Science and Arts occupations in Fairgrove are Community & Social Service (18 | 10.0%), Health Diagnosing & Treating (15 | 8.3%), Health Technologists (13 | 7.2%), Legal Services & Support (9 | 5.0%), and Education Instruction & Library (6 | 3.3%).
Management, Business, Science and Arts Occupations by Sex
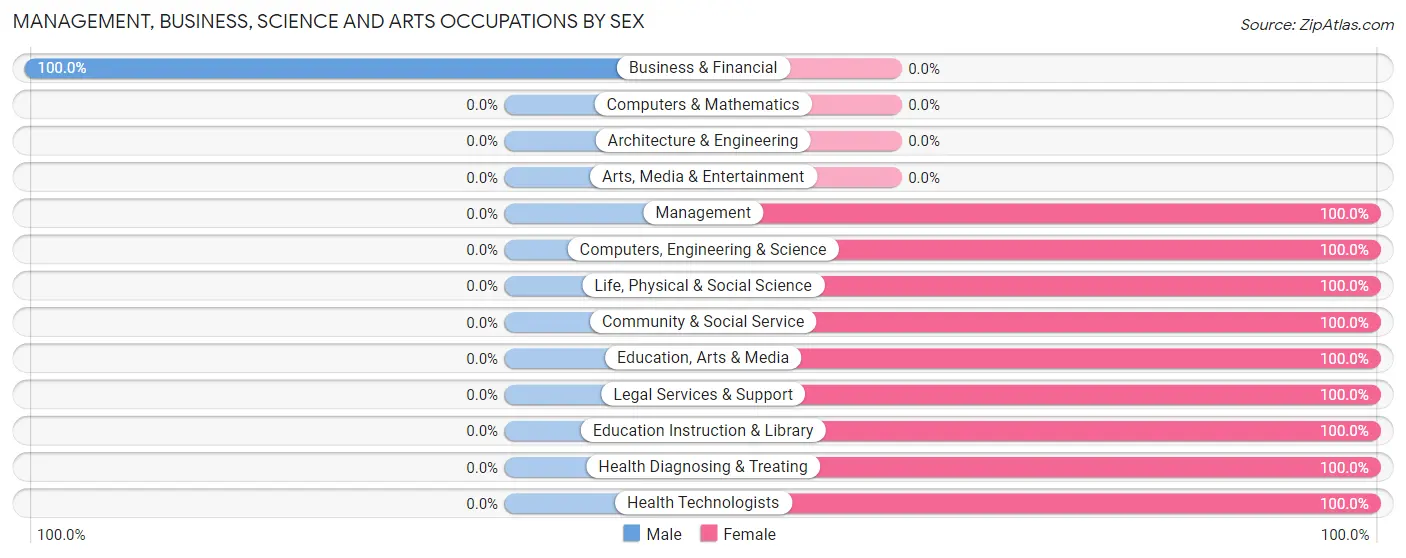
| Occupation | Male | Female |
| Management | 0 (0.0%) | 3 (100.0%) |
| Business & Financial | 5 (100.0%) | 0 (0.0%) |
| Computers, Engineering & Science | 0 (0.0%) | 2 (100.0%) |
| Computers & Mathematics | 0 (0.0%) | 0 (0.0%) |
| Architecture & Engineering | 0 (0.0%) | 0 (0.0%) |
| Life, Physical & Social Science | 0 (0.0%) | 2 (100.0%) |
| Community & Social Service | 0 (0.0%) | 18 (100.0%) |
| Education, Arts & Media | 0 (0.0%) | 3 (100.0%) |
| Legal Services & Support | 0 (0.0%) | 9 (100.0%) |
| Education Instruction & Library | 0 (0.0%) | 6 (100.0%) |
| Arts, Media & Entertainment | 0 (0.0%) | 0 (0.0%) |
| Health Diagnosing & Treating | 0 (0.0%) | 15 (100.0%) |
| Health Technologists | 0 (0.0%) | 13 (100.0%) |
| Total (Category) | 5 (11.6%) | 38 (88.4%) |
| Total (Overall) | 79 (43.9%) | 101 (56.1%) |
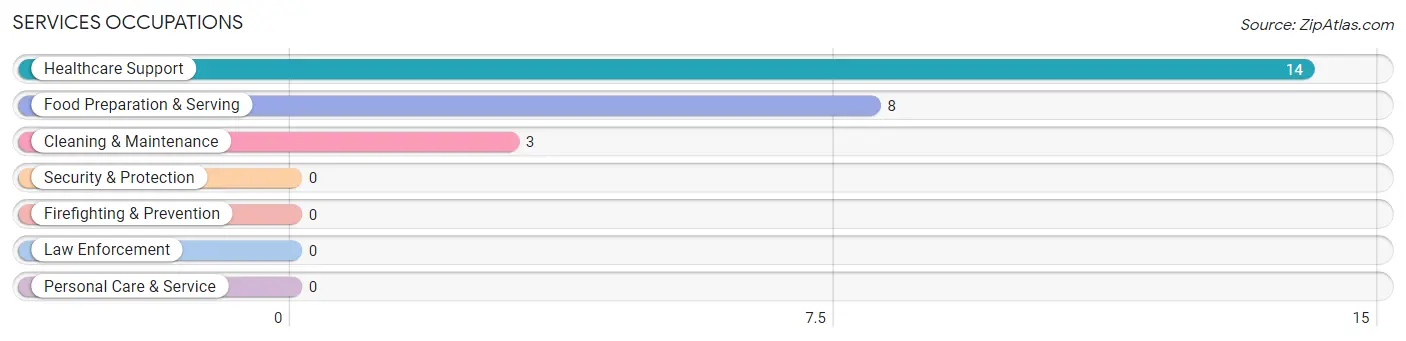
Services Occupations
The most common Services occupations in Fairgrove are Healthcare Support (14 | 7.8%), Food Preparation & Serving (8 | 4.4%), and Cleaning & Maintenance (3 | 1.7%).
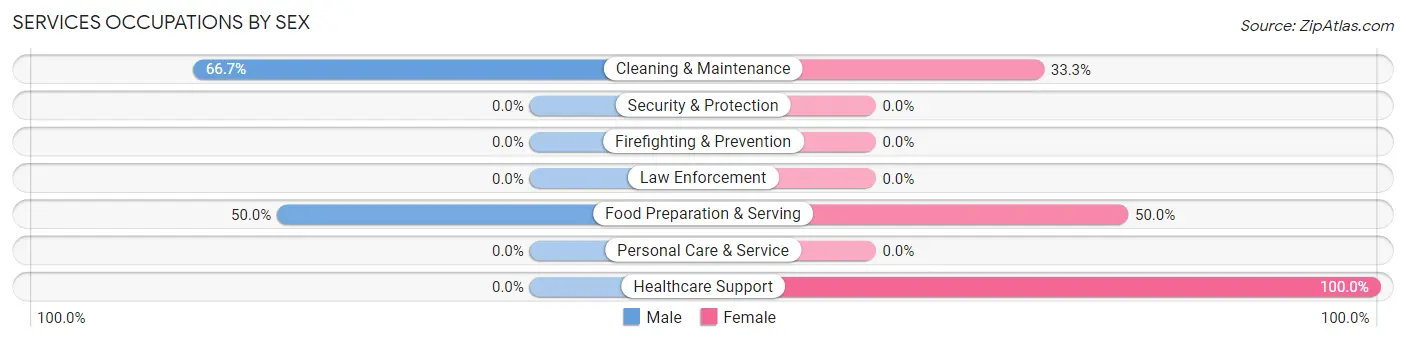
Services Occupations by Sex
Within the Services occupations in Fairgrove, the most male-oriented occupations are Cleaning & Maintenance (66.7%), and Food Preparation & Serving (50.0%), while the most female-oriented occupations are Healthcare Support (100.0%), Food Preparation & Serving (50.0%), and Cleaning & Maintenance (33.3%).
| Occupation | Male | Female |
| Healthcare Support | 0 (0.0%) | 14 (100.0%) |
| Security & Protection | 0 (0.0%) | 0 (0.0%) |
| Firefighting & Prevention | 0 (0.0%) | 0 (0.0%) |
| Law Enforcement | 0 (0.0%) | 0 (0.0%) |
| Food Preparation & Serving | 4 (50.0%) | 4 (50.0%) |
| Cleaning & Maintenance | 2 (66.7%) | 1 (33.3%) |
| Personal Care & Service | 0 (0.0%) | 0 (0.0%) |
| Total (Category) | 6 (24.0%) | 19 (76.0%) |
| Total (Overall) | 79 (43.9%) | 101 (56.1%) |
Sales and Office Occupations
The most common Sales and Office occupations in Fairgrove are Office & Administration (30 | 16.7%), and Sales & Related (13 | 7.2%).
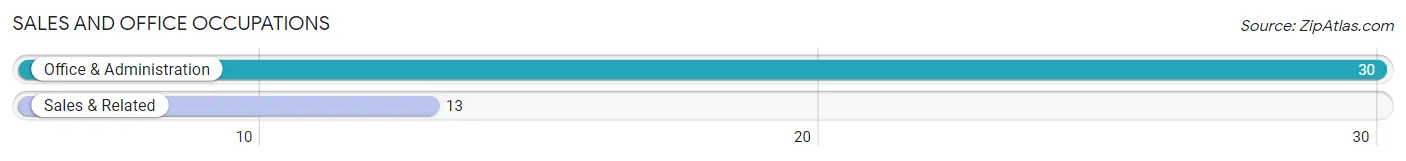
Sales and Office Occupations by Sex

| Occupation | Male | Female |
| Sales & Related | 3 (23.1%) | 10 (76.9%) |
| Office & Administration | 1 (3.3%) | 29 (96.7%) |
| Total (Category) | 4 (9.3%) | 39 (90.7%) |
| Total (Overall) | 79 (43.9%) | 101 (56.1%) |
Natural Resources, Construction and Maintenance Occupations
The most common Natural Resources, Construction and Maintenance occupations in Fairgrove are Installation, Maintenance & Repair (11 | 6.1%), and Construction & Extraction (10 | 5.6%).
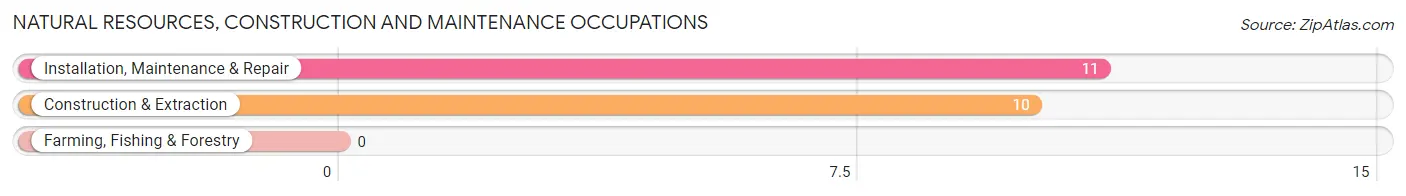
Natural Resources, Construction and Maintenance Occupations by Sex
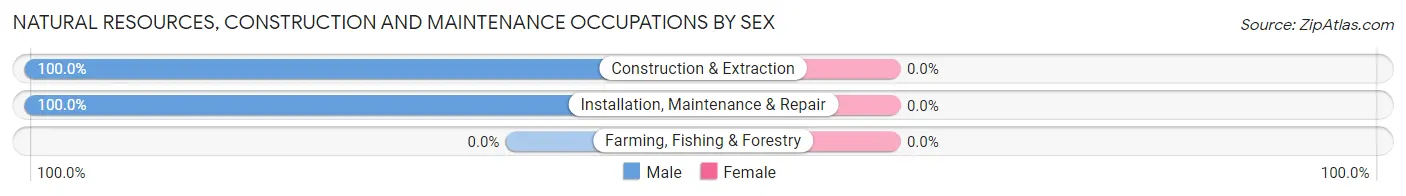
| Occupation | Male | Female |
| Farming, Fishing & Forestry | 0 (0.0%) | 0 (0.0%) |
| Construction & Extraction | 10 (100.0%) | 0 (0.0%) |
| Installation, Maintenance & Repair | 11 (100.0%) | 0 (0.0%) |
| Total (Category) | 21 (100.0%) | 0 (0.0%) |
| Total (Overall) | 79 (43.9%) | 101 (56.1%) |
Production, Transportation and Moving Occupations
The most common Production, Transportation and Moving occupations in Fairgrove are Transportation (17 | 9.4%), Material Moving (17 | 9.4%), and Production (14 | 7.8%).
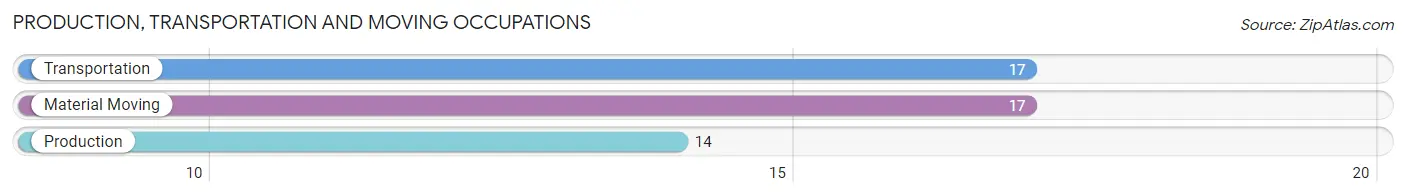
Production, Transportation and Moving Occupations by Sex
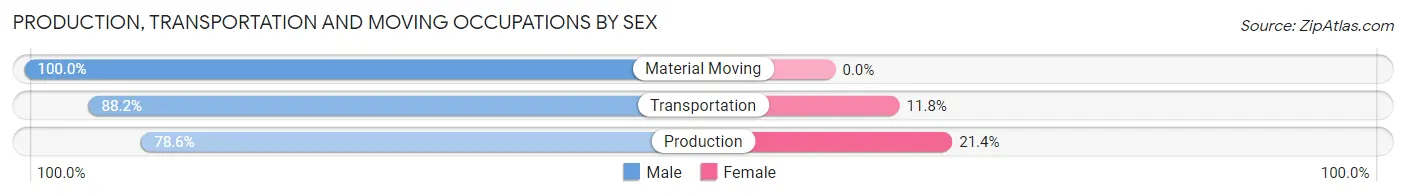
| Occupation | Male | Female |
| Production | 11 (78.6%) | 3 (21.4%) |
| Transportation | 15 (88.2%) | 2 (11.8%) |
| Material Moving | 17 (100.0%) | 0 (0.0%) |
| Total (Category) | 43 (89.6%) | 5 (10.4%) |
| Total (Overall) | 79 (43.9%) | 101 (56.1%) |
Employment Industries by Sex in Fairgrove
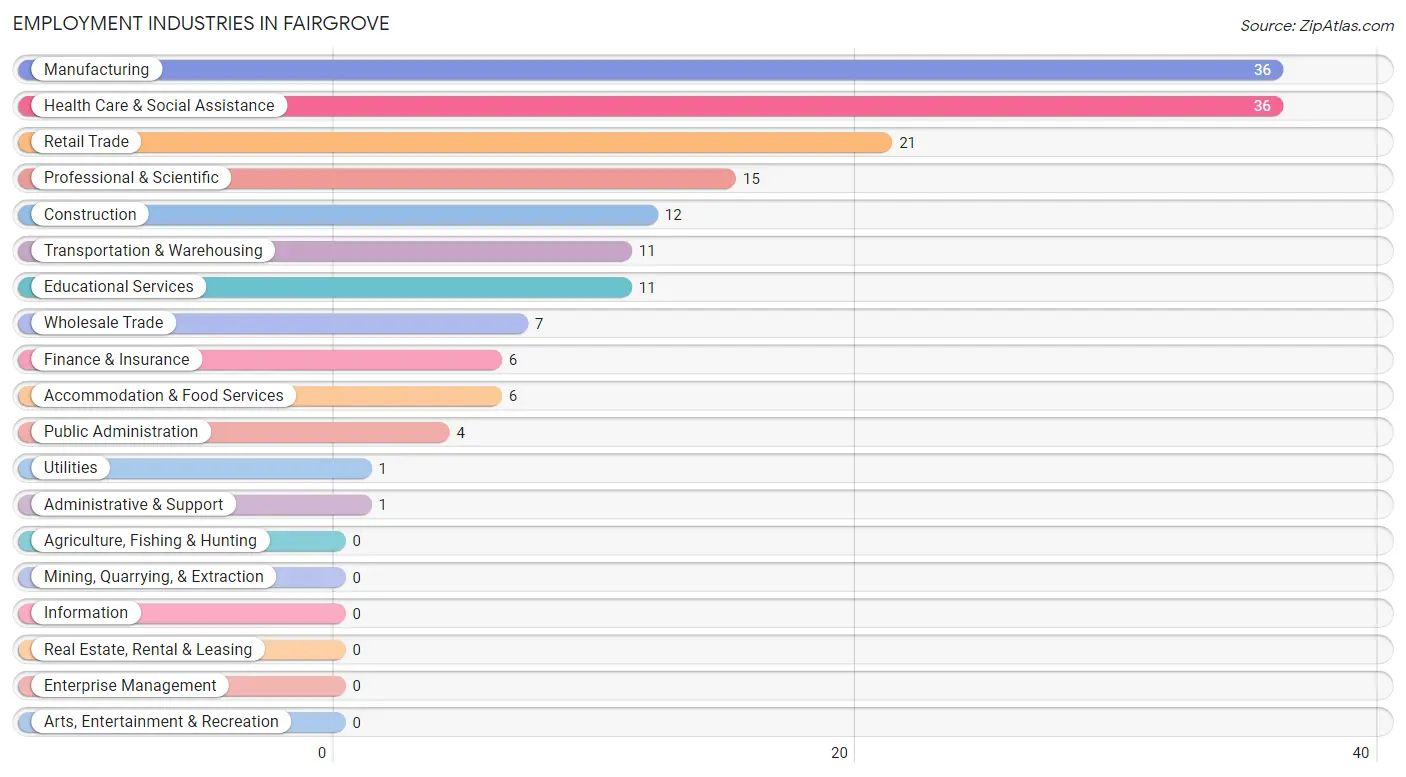
Employment Industries in Fairgrove
The major employment industries in Fairgrove include Manufacturing (36 | 20.0%), Health Care & Social Assistance (36 | 20.0%), Retail Trade (21 | 11.7%), Professional & Scientific (15 | 8.3%), and Construction (12 | 6.7%).
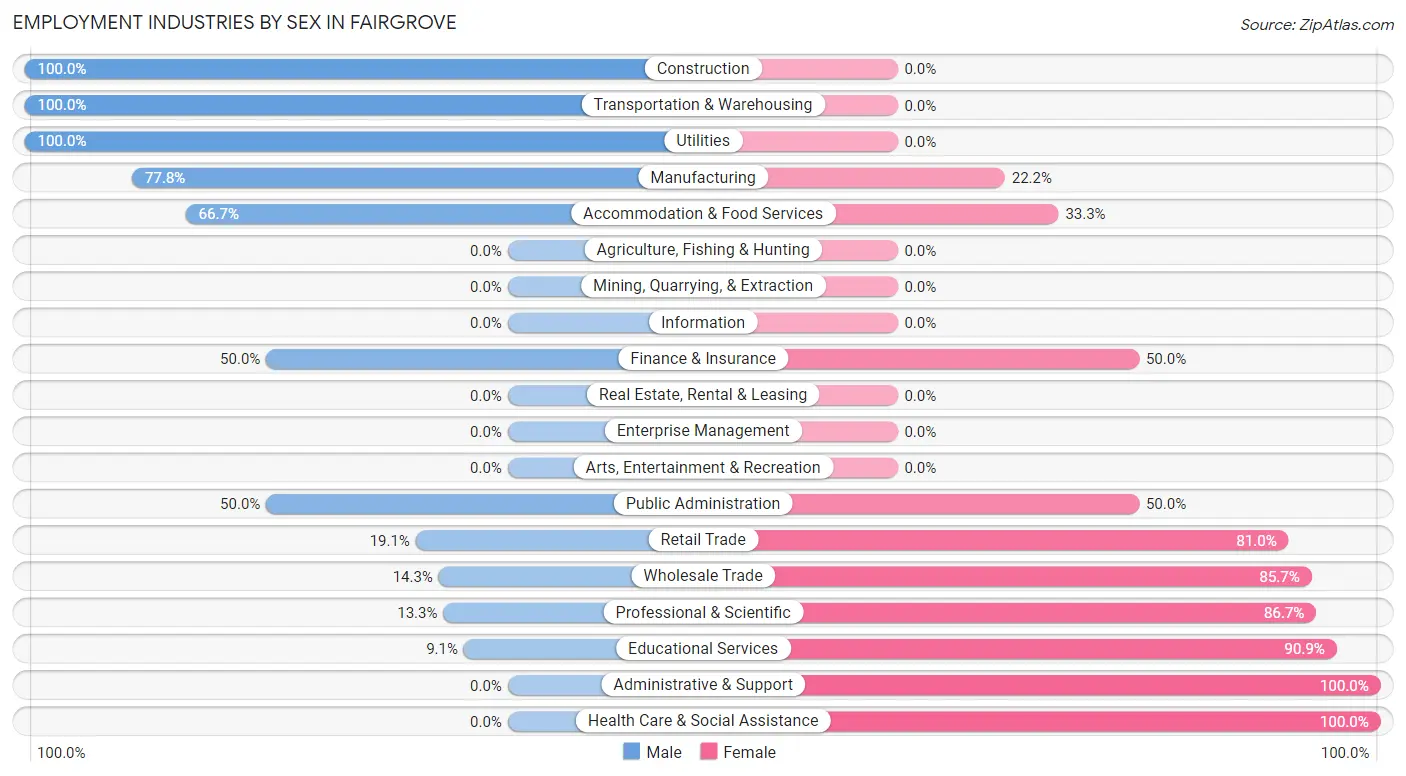
Employment Industries by Sex in Fairgrove
The Fairgrove industries that see more men than women are Construction (100.0%), Transportation & Warehousing (100.0%), and Utilities (100.0%), whereas the industries that tend to have a higher number of women are Administrative & Support (100.0%), Health Care & Social Assistance (100.0%), and Educational Services (90.9%).
| Industry | Male | Female |
| Agriculture, Fishing & Hunting | 0 (0.0%) | 0 (0.0%) |
| Mining, Quarrying, & Extraction | 0 (0.0%) | 0 (0.0%) |
| Construction | 12 (100.0%) | 0 (0.0%) |
| Manufacturing | 28 (77.8%) | 8 (22.2%) |
| Wholesale Trade | 1 (14.3%) | 6 (85.7%) |
| Retail Trade | 4 (19.1%) | 17 (80.9%) |
| Transportation & Warehousing | 11 (100.0%) | 0 (0.0%) |
| Utilities | 1 (100.0%) | 0 (0.0%) |
| Information | 0 (0.0%) | 0 (0.0%) |
| Finance & Insurance | 3 (50.0%) | 3 (50.0%) |
| Real Estate, Rental & Leasing | 0 (0.0%) | 0 (0.0%) |
| Professional & Scientific | 2 (13.3%) | 13 (86.7%) |
| Enterprise Management | 0 (0.0%) | 0 (0.0%) |
| Administrative & Support | 0 (0.0%) | 1 (100.0%) |
| Educational Services | 1 (9.1%) | 10 (90.9%) |
| Health Care & Social Assistance | 0 (0.0%) | 36 (100.0%) |
| Arts, Entertainment & Recreation | 0 (0.0%) | 0 (0.0%) |
| Accommodation & Food Services | 4 (66.7%) | 2 (33.3%) |
| Public Administration | 2 (50.0%) | 2 (50.0%) |
| Total | 79 (43.9%) | 101 (56.1%) |
Education in Fairgrove
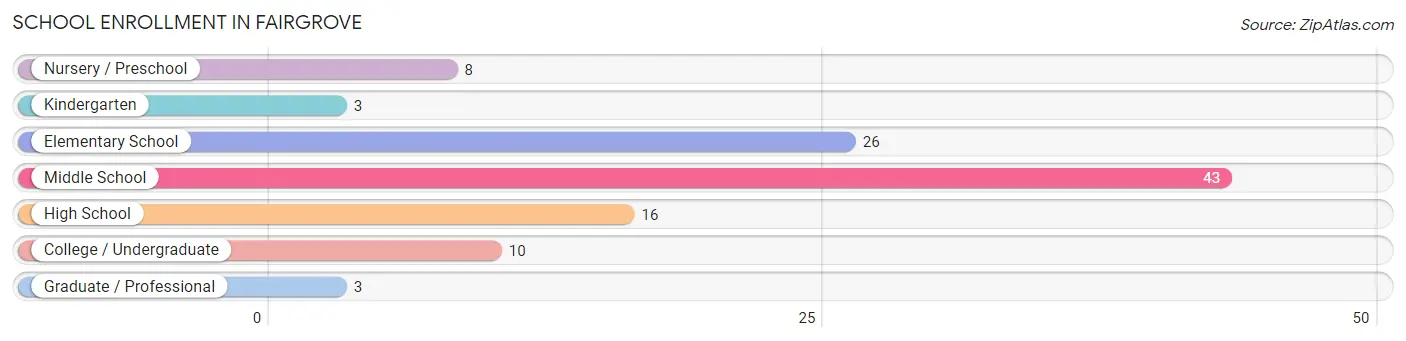
School Enrollment in Fairgrove
The most common levels of schooling among the 109 students in Fairgrove are middle school (43 | 39.5%), elementary school (26 | 23.8%), and high school (16 | 14.7%).
| School Level | # Students | % Students |
| Nursery / Preschool | 8 | 7.3% |
| Kindergarten | 3 | 2.8% |
| Elementary School | 26 | 23.8% |
| Middle School | 43 | 39.5% |
| High School | 16 | 14.7% |
| College / Undergraduate | 10 | 9.2% |
| Graduate / Professional | 3 | 2.8% |
| Total | 109 | 100.0% |
School Enrollment by Age by Funding Source in Fairgrove
Out of a total of 109 students who are enrolled in schools in Fairgrove, 9 (8.3%) attend a private institution, while the remaining 100 (91.7%) are enrolled in public schools. The age group of 35 years and over has the highest likelihood of being enrolled in private schools, with 3 (100.0% in the age bracket) enrolled. Conversely, the age group of 3 to 4 year olds has the lowest likelihood of being enrolled in a private school, with 3 (100.0% in the age bracket) attending a public institution.
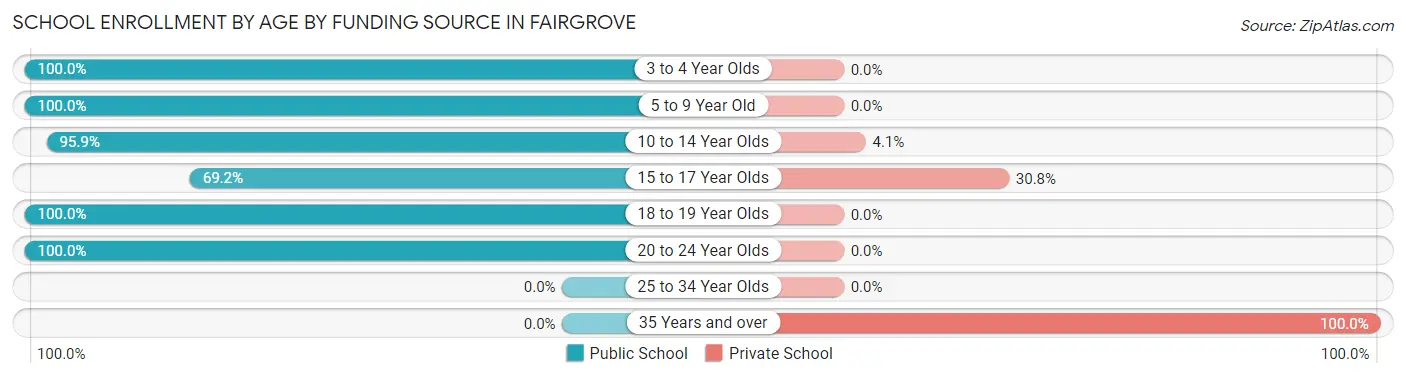
| Age Bracket | Public School | Private School |
| 3 to 4 Year Olds | 3 (100.0%) | 0 (0.0%) |
| 5 to 9 Year Old | 28 (100.0%) | 0 (0.0%) |
| 10 to 14 Year Olds | 47 (95.9%) | 2 (4.1%) |
| 15 to 17 Year Olds | 9 (69.2%) | 4 (30.8%) |
| 18 to 19 Year Olds | 5 (100.0%) | 0 (0.0%) |
| 20 to 24 Year Olds | 8 (100.0%) | 0 (0.0%) |
| 25 to 34 Year Olds | 0 (0.0%) | 0 (0.0%) |
| 35 Years and over | 0 (0.0%) | 3 (100.0%) |
| Total | 100 (91.7%) | 9 (8.3%) |
Educational Attainment by Field of Study in Fairgrove
Business (12 | 33.3%), arts & humanities (6 | 16.7%), education (5 | 13.9%), science & technology (4 | 11.1%), and engineering (3 | 8.3%) are the most common fields of study among 36 individuals in Fairgrove who have obtained a bachelor's degree or higher.
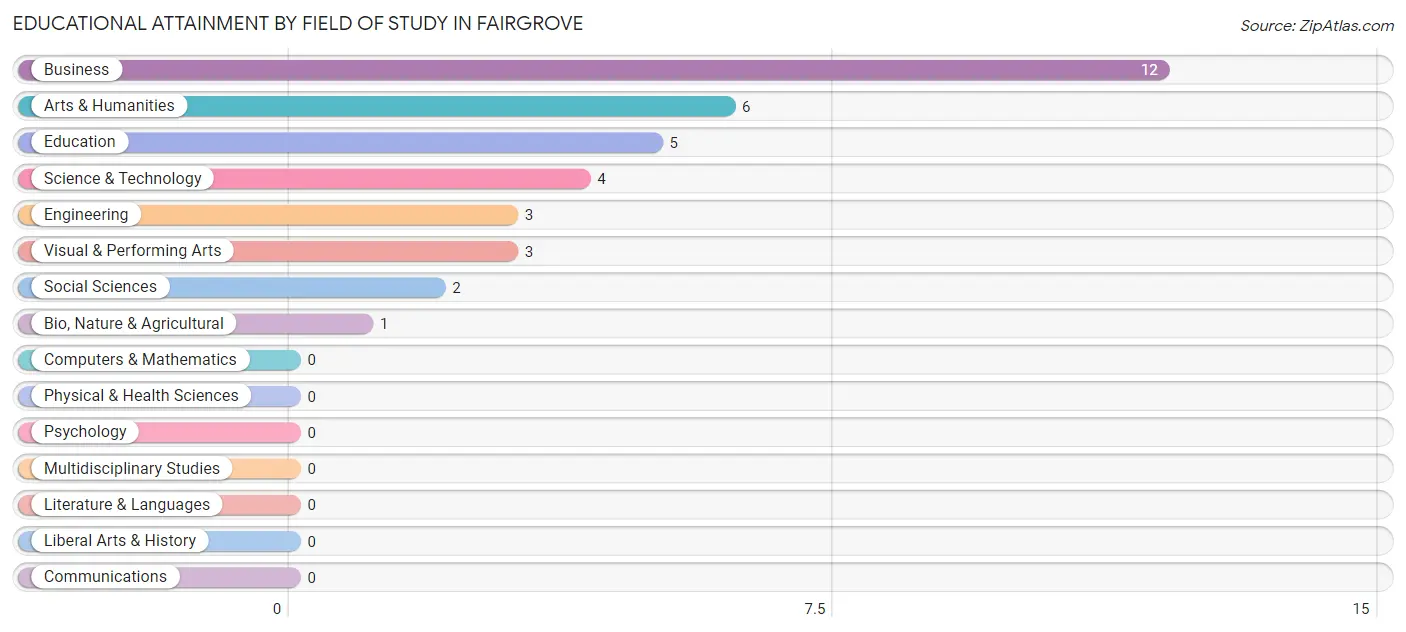
| Field of Study | # Graduates | % Graduates |
| Computers & Mathematics | 0 | 0.0% |
| Bio, Nature & Agricultural | 1 | 2.8% |
| Physical & Health Sciences | 0 | 0.0% |
| Psychology | 0 | 0.0% |
| Social Sciences | 2 | 5.6% |
| Engineering | 3 | 8.3% |
| Multidisciplinary Studies | 0 | 0.0% |
| Science & Technology | 4 | 11.1% |
| Business | 12 | 33.3% |
| Education | 5 | 13.9% |
| Literature & Languages | 0 | 0.0% |
| Liberal Arts & History | 0 | 0.0% |
| Visual & Performing Arts | 3 | 8.3% |
| Communications | 0 | 0.0% |
| Arts & Humanities | 6 | 16.7% |
| Total | 36 | 100.0% |
Transportation & Commute in Fairgrove
Vehicle Availability by Sex in Fairgrove
The most prevalent vehicle ownership categories in Fairgrove are males with 2 vehicles (44, accounting for 62.0%) and females with 2 vehicles (56, making up 43.6%).
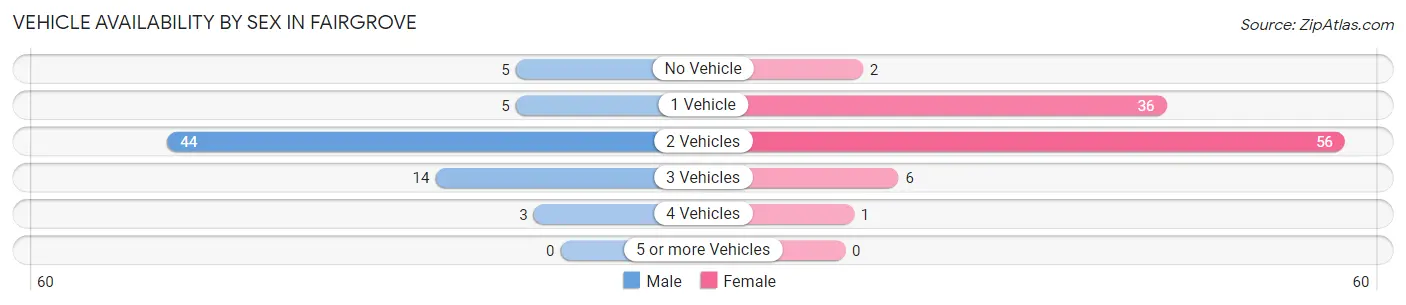
| Vehicles Available | Male | Female |
| No Vehicle | 5 (7.0%) | 2 (2.0%) |
| 1 Vehicle | 5 (7.0%) | 36 (35.6%) |
| 2 Vehicles | 44 (62.0%) | 56 (55.4%) |
| 3 Vehicles | 14 (19.7%) | 6 (5.9%) |
| 4 Vehicles | 3 (4.2%) | 1 (1.0%) |
| 5 or more Vehicles | 0 (0.0%) | 0 (0.0%) |
| Total | 71 (100.0%) | 101 (100.0%) |
Commute Time in Fairgrove
The most frequently occuring commute durations in Fairgrove are 30 to 34 minutes (34 commuters, 21.4%), 45 to 59 minutes (29 commuters, 18.2%), and 40 to 44 minutes (24 commuters, 15.1%).
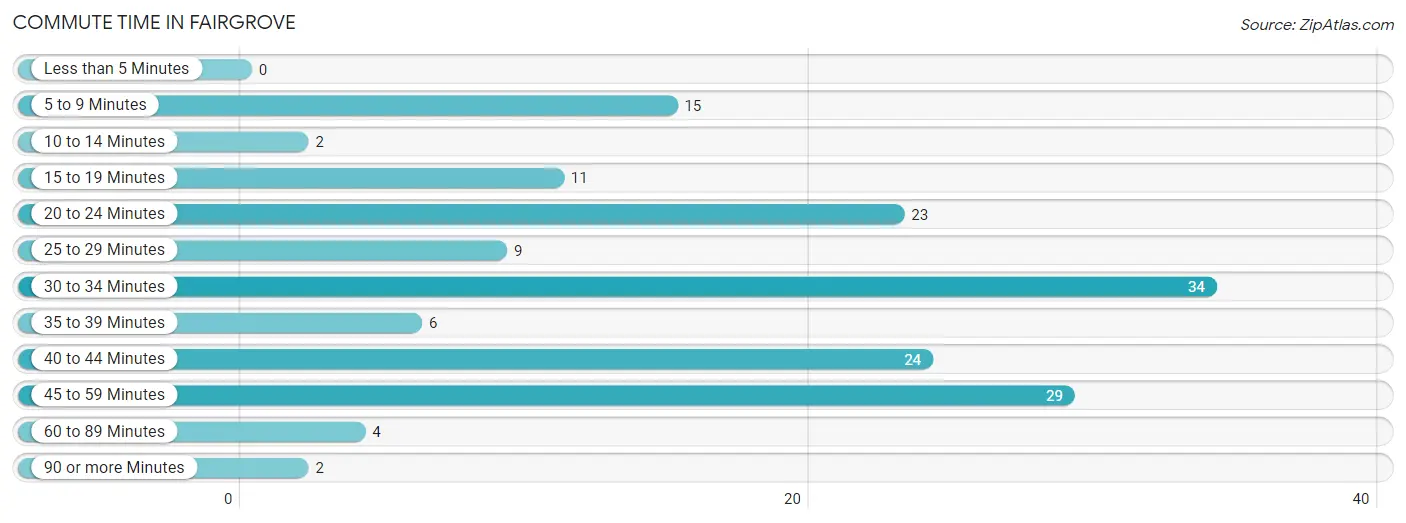
| Commute Time | # Commuters | % Commuters |
| Less than 5 Minutes | 0 | 0.0% |
| 5 to 9 Minutes | 15 | 9.4% |
| 10 to 14 Minutes | 2 | 1.3% |
| 15 to 19 Minutes | 11 | 6.9% |
| 20 to 24 Minutes | 23 | 14.5% |
| 25 to 29 Minutes | 9 | 5.7% |
| 30 to 34 Minutes | 34 | 21.4% |
| 35 to 39 Minutes | 6 | 3.8% |
| 40 to 44 Minutes | 24 | 15.1% |
| 45 to 59 Minutes | 29 | 18.2% |
| 60 to 89 Minutes | 4 | 2.5% |
| 90 or more Minutes | 2 | 1.3% |
Commute Time by Sex in Fairgrove
The most common commute times in Fairgrove are 45 to 59 minutes (18 commuters, 26.5%) for males and 30 to 34 minutes (27 commuters, 29.7%) for females.
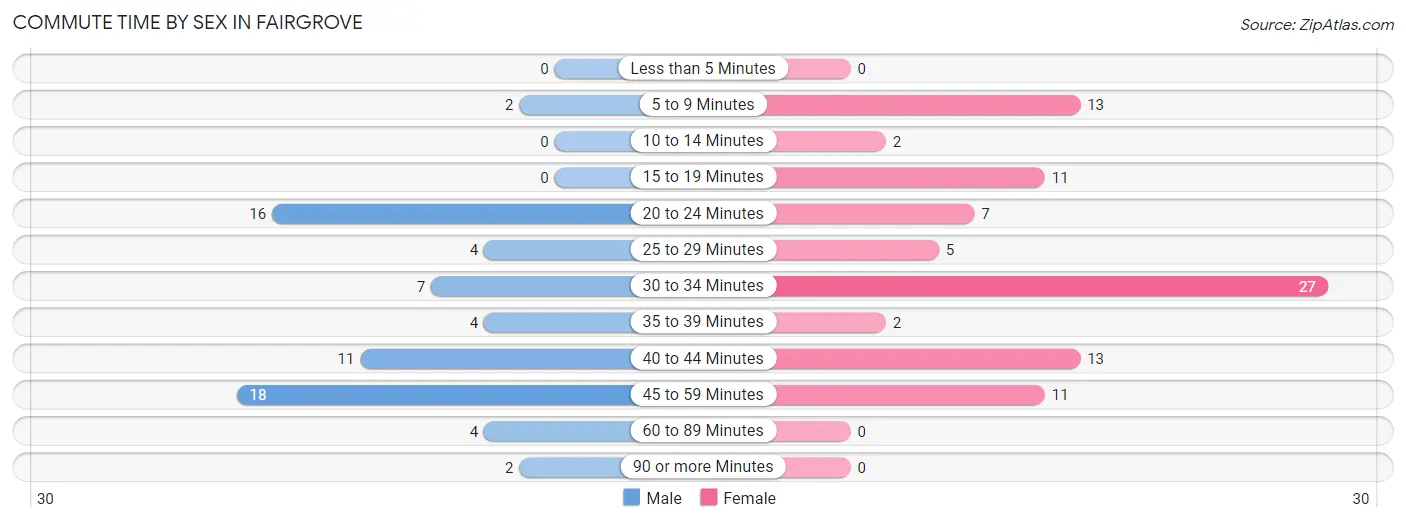
| Commute Time | Male | Female |
| Less than 5 Minutes | 0 (0.0%) | 0 (0.0%) |
| 5 to 9 Minutes | 2 (2.9%) | 13 (14.3%) |
| 10 to 14 Minutes | 0 (0.0%) | 2 (2.2%) |
| 15 to 19 Minutes | 0 (0.0%) | 11 (12.1%) |
| 20 to 24 Minutes | 16 (23.5%) | 7 (7.7%) |
| 25 to 29 Minutes | 4 (5.9%) | 5 (5.5%) |
| 30 to 34 Minutes | 7 (10.3%) | 27 (29.7%) |
| 35 to 39 Minutes | 4 (5.9%) | 2 (2.2%) |
| 40 to 44 Minutes | 11 (16.2%) | 13 (14.3%) |
| 45 to 59 Minutes | 18 (26.5%) | 11 (12.1%) |
| 60 to 89 Minutes | 4 (5.9%) | 0 (0.0%) |
| 90 or more Minutes | 2 (2.9%) | 0 (0.0%) |
Time of Departure to Work by Sex in Fairgrove
The most frequent times of departure to work in Fairgrove are 5:30 AM to 5:59 AM (20, 29.4%) for males and 7:30 AM to 7:59 AM (24, 26.4%) for females.
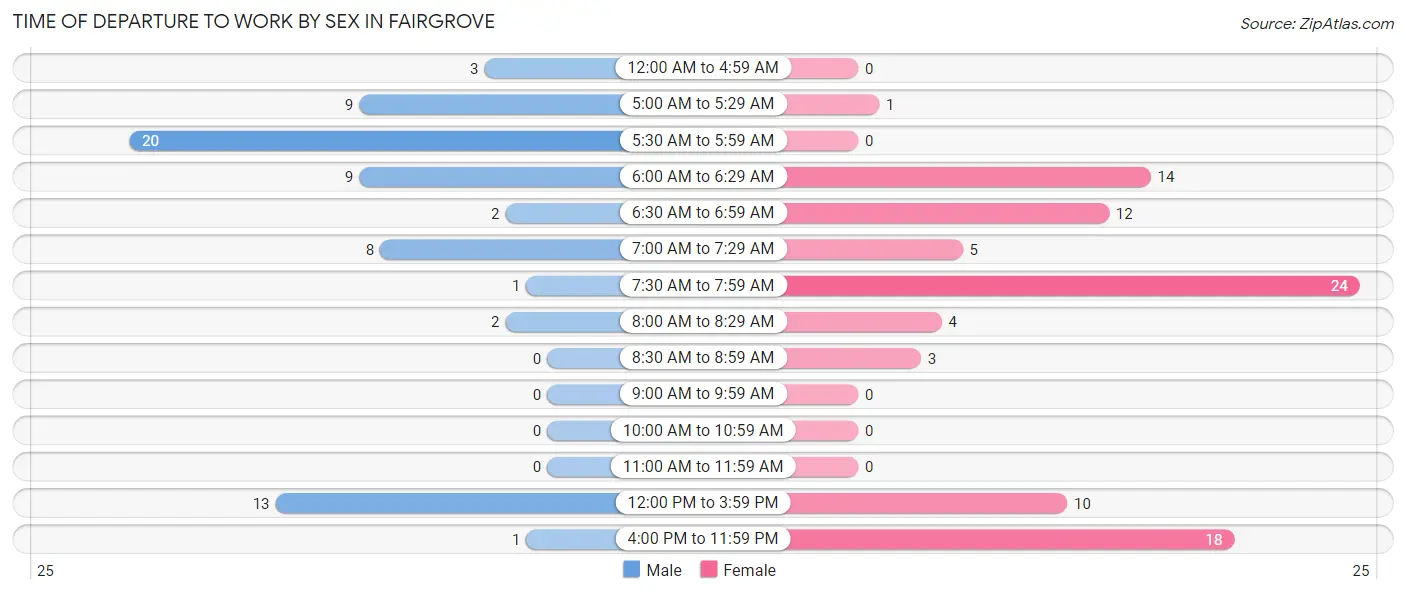
| Time of Departure | Male | Female |
| 12:00 AM to 4:59 AM | 3 (4.4%) | 0 (0.0%) |
| 5:00 AM to 5:29 AM | 9 (13.2%) | 1 (1.1%) |
| 5:30 AM to 5:59 AM | 20 (29.4%) | 0 (0.0%) |
| 6:00 AM to 6:29 AM | 9 (13.2%) | 14 (15.4%) |
| 6:30 AM to 6:59 AM | 2 (2.9%) | 12 (13.2%) |
| 7:00 AM to 7:29 AM | 8 (11.8%) | 5 (5.5%) |
| 7:30 AM to 7:59 AM | 1 (1.5%) | 24 (26.4%) |
| 8:00 AM to 8:29 AM | 2 (2.9%) | 4 (4.4%) |
| 8:30 AM to 8:59 AM | 0 (0.0%) | 3 (3.3%) |
| 9:00 AM to 9:59 AM | 0 (0.0%) | 0 (0.0%) |
| 10:00 AM to 10:59 AM | 0 (0.0%) | 0 (0.0%) |
| 11:00 AM to 11:59 AM | 0 (0.0%) | 0 (0.0%) |
| 12:00 PM to 3:59 PM | 13 (19.1%) | 10 (11.0%) |
| 4:00 PM to 11:59 PM | 1 (1.5%) | 18 (19.8%) |
| Total | 68 (100.0%) | 91 (100.0%) |
Housing Occupancy in Fairgrove
Occupancy by Ownership in Fairgrove
Of the total 205 dwellings in Fairgrove, owner-occupied units account for 175 (85.4%), while renter-occupied units make up 30 (14.6%).
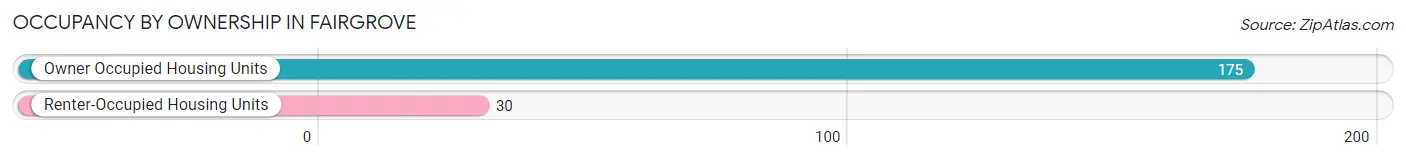
| Occupancy | # Housing Units | % Housing Units |
| Owner Occupied Housing Units | 175 | 85.4% |
| Renter-Occupied Housing Units | 30 | 14.6% |
| Total Occupied Housing Units | 205 | 100.0% |
Occupancy by Household Size in Fairgrove
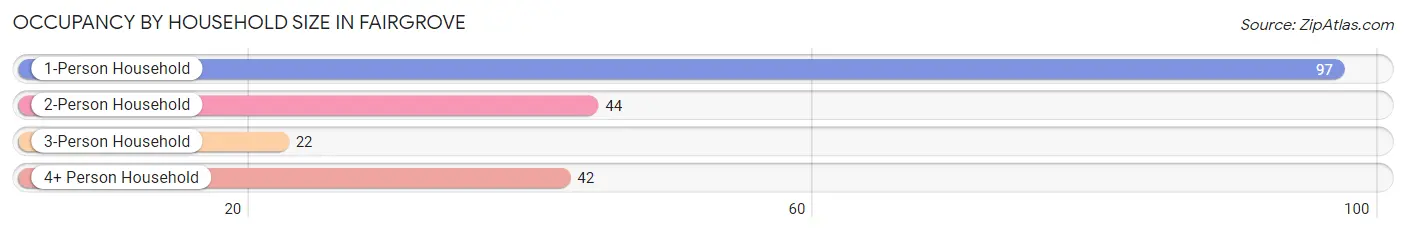
| Household Size | # Housing Units | % Housing Units |
| 1-Person Household | 97 | 47.3% |
| 2-Person Household | 44 | 21.5% |
| 3-Person Household | 22 | 10.7% |
| 4+ Person Household | 42 | 20.5% |
| Total Housing Units | 205 | 100.0% |
Occupancy by Ownership by Household Size in Fairgrove
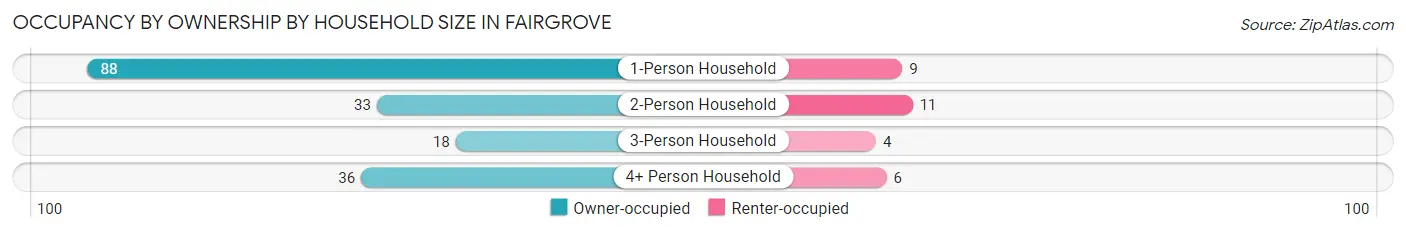
| Household Size | Owner-occupied | Renter-occupied |
| 1-Person Household | 88 (90.7%) | 9 (9.3%) |
| 2-Person Household | 33 (75.0%) | 11 (25.0%) |
| 3-Person Household | 18 (81.8%) | 4 (18.2%) |
| 4+ Person Household | 36 (85.7%) | 6 (14.3%) |
| Total Housing Units | 175 (85.4%) | 30 (14.6%) |
Occupancy by Educational Attainment in Fairgrove
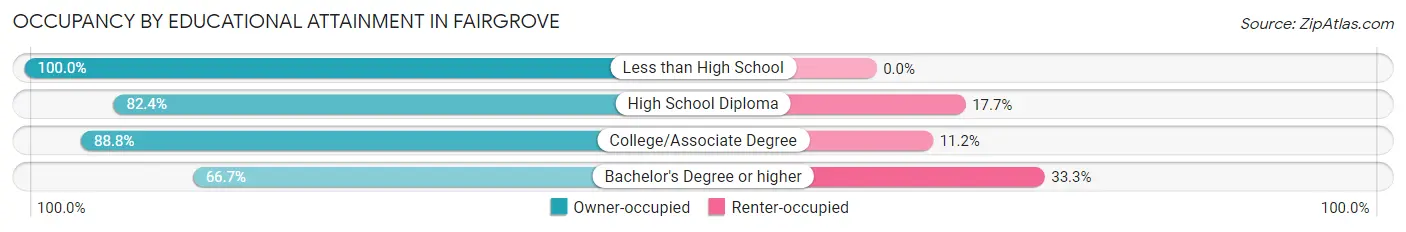
| Household Size | Owner-occupied | Renter-occupied |
| Less than High School | 12 (100.0%) | 0 (0.0%) |
| High School Diploma | 56 (82.4%) | 12 (17.6%) |
| College/Associate Degree | 95 (88.8%) | 12 (11.2%) |
| Bachelor's Degree or higher | 12 (66.7%) | 6 (33.3%) |
Occupancy by Age of Householder in Fairgrove
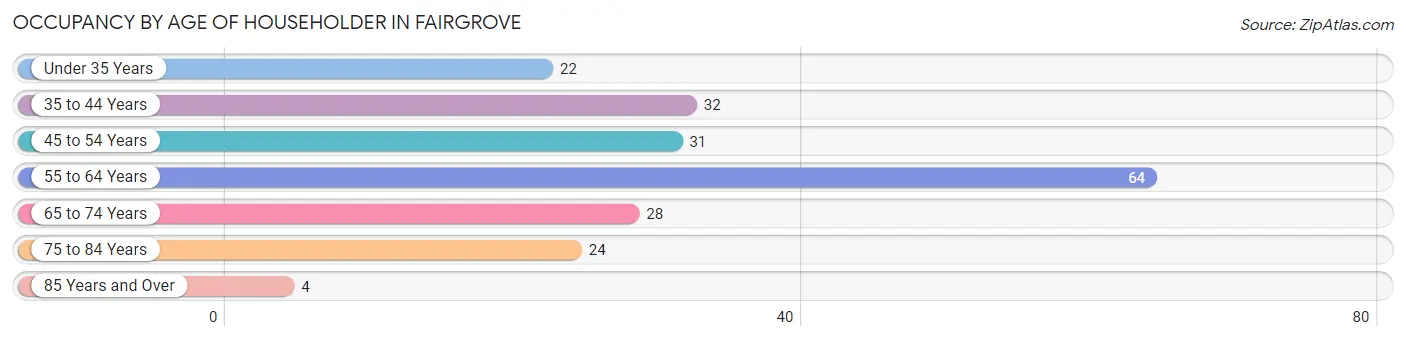
| Age Bracket | # Households | % Households |
| Under 35 Years | 22 | 10.7% |
| 35 to 44 Years | 32 | 15.6% |
| 45 to 54 Years | 31 | 15.1% |
| 55 to 64 Years | 64 | 31.2% |
| 65 to 74 Years | 28 | 13.7% |
| 75 to 84 Years | 24 | 11.7% |
| 85 Years and Over | 4 | 1.9% |
| Total | 205 | 100.0% |
Housing Finances in Fairgrove
Median Income by Occupancy in Fairgrove
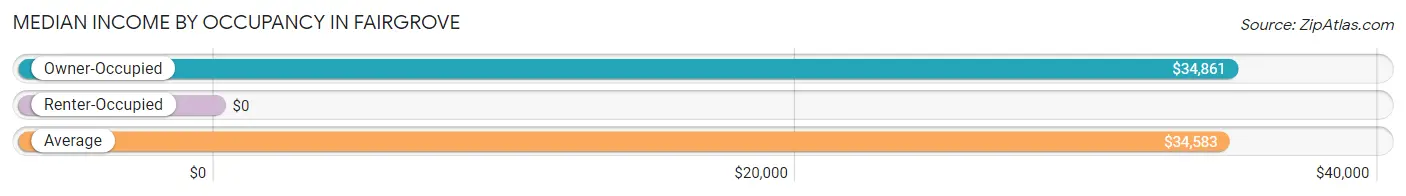
| Occupancy Type | # Households | Median Income |
| Owner-Occupied | 175 (85.4%) | $34,861 |
| Renter-Occupied | 30 (14.6%) | $0 |
| Average | 205 (100.0%) | $34,583 |
Occupancy by Householder Income Bracket in Fairgrove
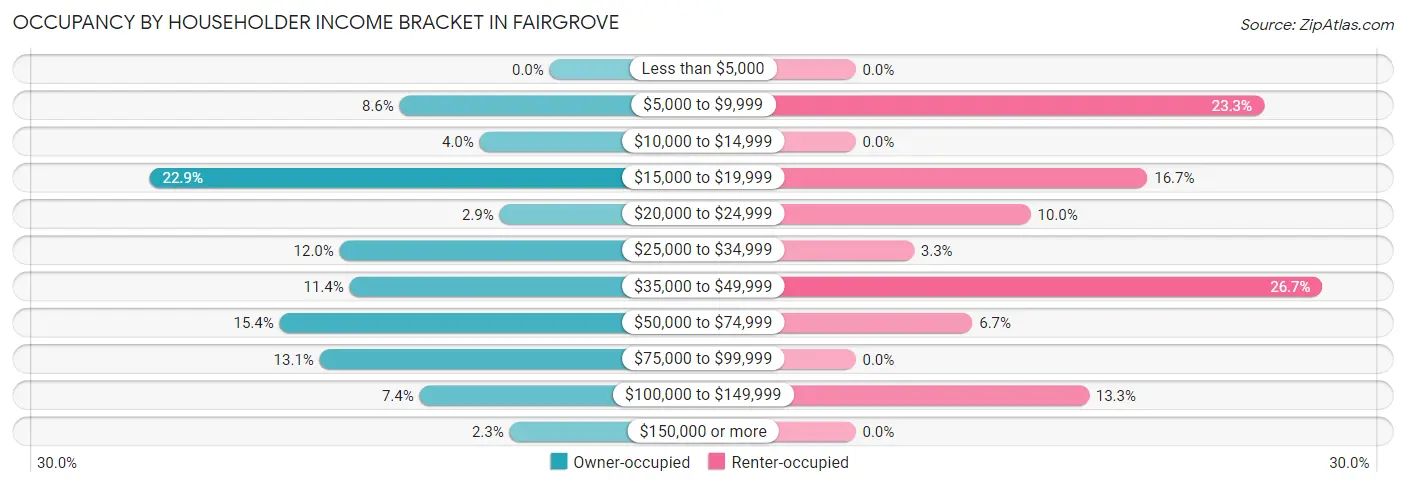
| Income Bracket | Owner-occupied | Renter-occupied |
| Less than $5,000 | 0 (0.0%) | 0 (0.0%) |
| $5,000 to $9,999 | 15 (8.6%) | 7 (23.3%) |
| $10,000 to $14,999 | 7 (4.0%) | 0 (0.0%) |
| $15,000 to $19,999 | 40 (22.9%) | 5 (16.7%) |
| $20,000 to $24,999 | 5 (2.9%) | 3 (10.0%) |
| $25,000 to $34,999 | 21 (12.0%) | 1 (3.3%) |
| $35,000 to $49,999 | 20 (11.4%) | 8 (26.7%) |
| $50,000 to $74,999 | 27 (15.4%) | 2 (6.7%) |
| $75,000 to $99,999 | 23 (13.1%) | 0 (0.0%) |
| $100,000 to $149,999 | 13 (7.4%) | 4 (13.3%) |
| $150,000 or more | 4 (2.3%) | 0 (0.0%) |
| Total | 175 (100.0%) | 30 (100.0%) |
Monthly Housing Cost Tiers in Fairgrove
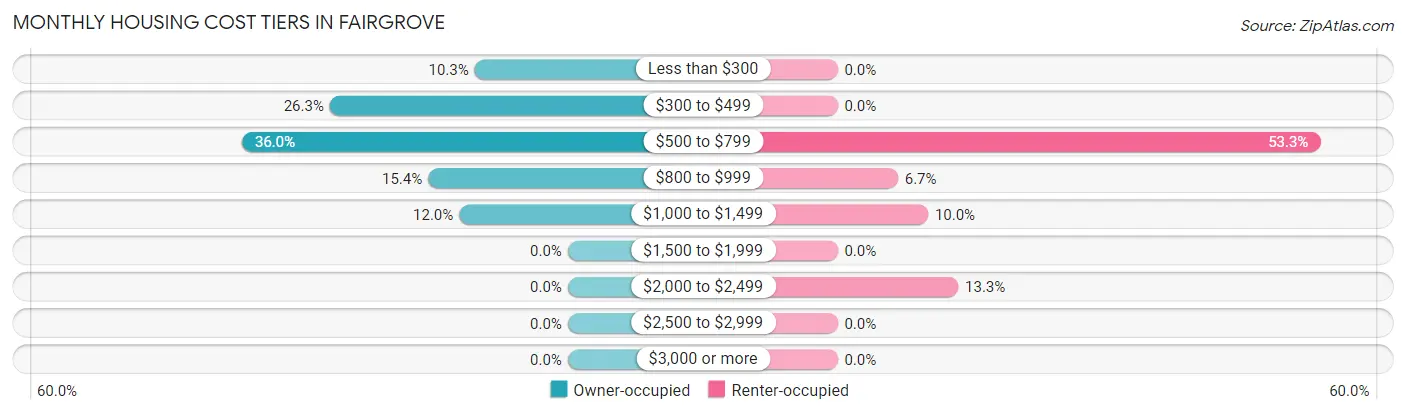
| Monthly Cost | Owner-occupied | Renter-occupied |
| Less than $300 | 18 (10.3%) | 0 (0.0%) |
| $300 to $499 | 46 (26.3%) | 0 (0.0%) |
| $500 to $799 | 63 (36.0%) | 16 (53.3%) |
| $800 to $999 | 27 (15.4%) | 2 (6.7%) |
| $1,000 to $1,499 | 21 (12.0%) | 3 (10.0%) |
| $1,500 to $1,999 | 0 (0.0%) | 0 (0.0%) |
| $2,000 to $2,499 | 0 (0.0%) | 4 (13.3%) |
| $2,500 to $2,999 | 0 (0.0%) | 0 (0.0%) |
| $3,000 or more | 0 (0.0%) | 0 (0.0%) |
| Total | 175 (100.0%) | 30 (100.0%) |
Physical Housing Characteristics in Fairgrove
Housing Structures in Fairgrove
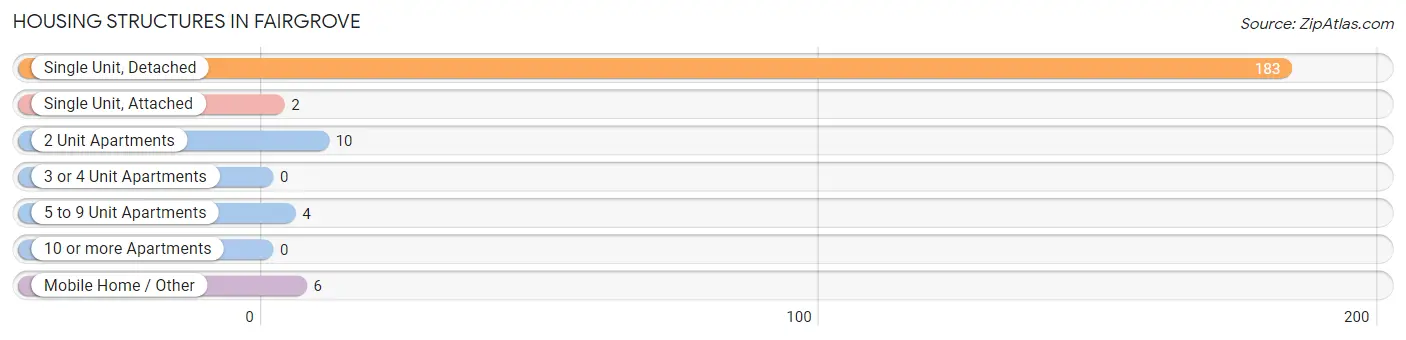
| Structure Type | # Housing Units | % Housing Units |
| Single Unit, Detached | 183 | 89.3% |
| Single Unit, Attached | 2 | 1.0% |
| 2 Unit Apartments | 10 | 4.9% |
| 3 or 4 Unit Apartments | 0 | 0.0% |
| 5 to 9 Unit Apartments | 4 | 1.9% |
| 10 or more Apartments | 0 | 0.0% |
| Mobile Home / Other | 6 | 2.9% |
| Total | 205 | 100.0% |
Housing Structures by Occupancy in Fairgrove
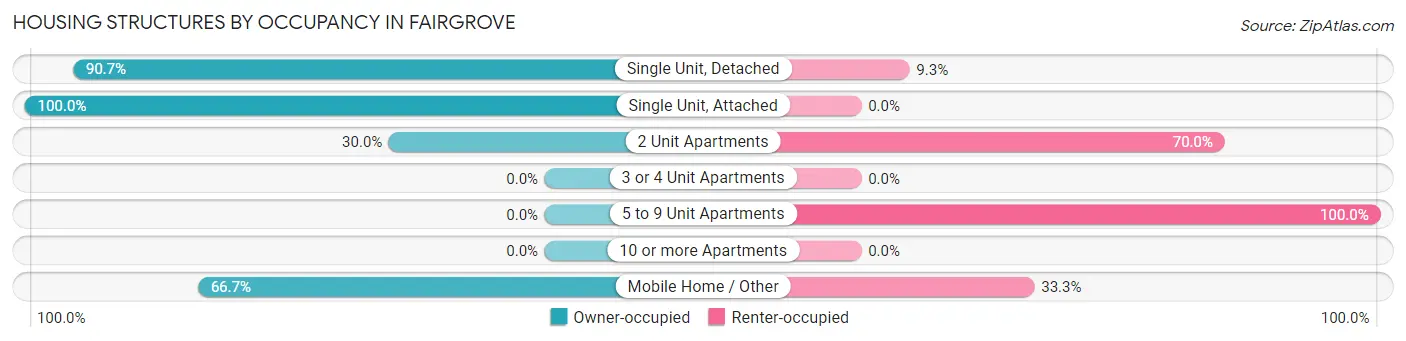
| Structure Type | Owner-occupied | Renter-occupied |
| Single Unit, Detached | 166 (90.7%) | 17 (9.3%) |
| Single Unit, Attached | 2 (100.0%) | 0 (0.0%) |
| 2 Unit Apartments | 3 (30.0%) | 7 (70.0%) |
| 3 or 4 Unit Apartments | 0 (0.0%) | 0 (0.0%) |
| 5 to 9 Unit Apartments | 0 (0.0%) | 4 (100.0%) |
| 10 or more Apartments | 0 (0.0%) | 0 (0.0%) |
| Mobile Home / Other | 4 (66.7%) | 2 (33.3%) |
| Total | 175 (85.4%) | 30 (14.6%) |
Housing Structures by Number of Rooms in Fairgrove
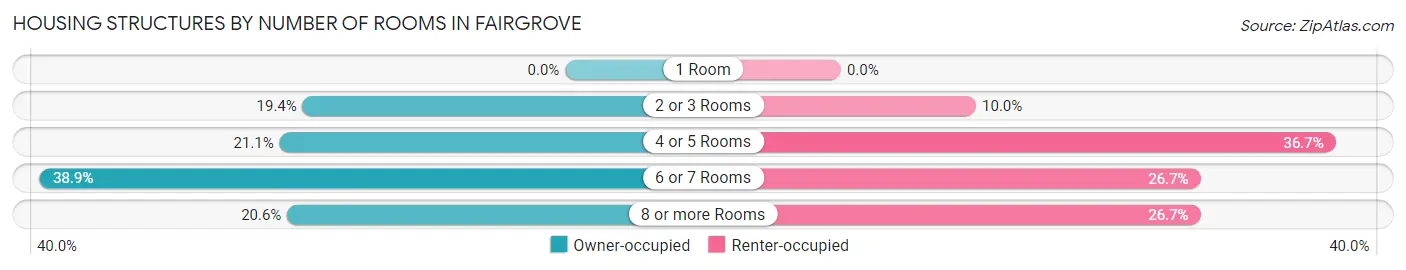
| Number of Rooms | Owner-occupied | Renter-occupied |
| 1 Room | 0 (0.0%) | 0 (0.0%) |
| 2 or 3 Rooms | 34 (19.4%) | 3 (10.0%) |
| 4 or 5 Rooms | 37 (21.1%) | 11 (36.7%) |
| 6 or 7 Rooms | 68 (38.9%) | 8 (26.7%) |
| 8 or more Rooms | 36 (20.6%) | 8 (26.7%) |
| Total | 175 (100.0%) | 30 (100.0%) |
Housing Structure by Heating Type in Fairgrove
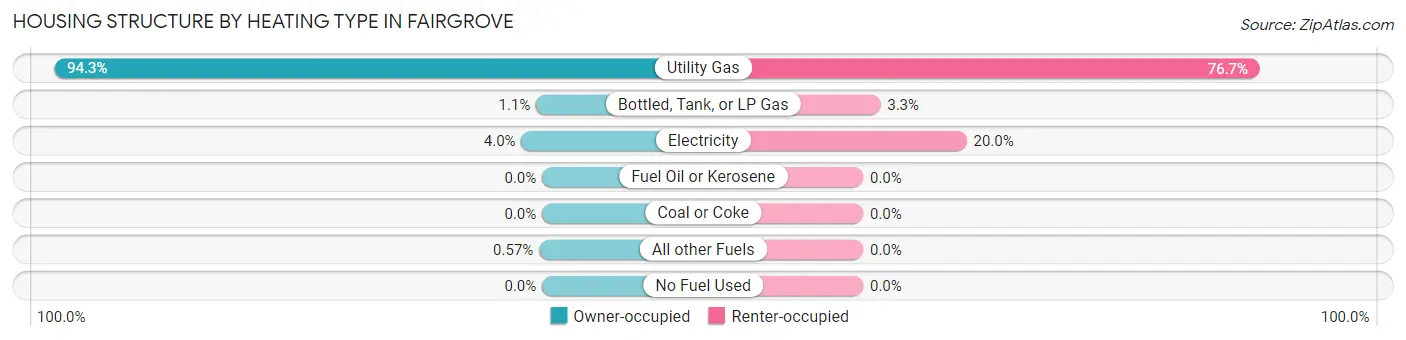
| Heating Type | Owner-occupied | Renter-occupied |
| Utility Gas | 165 (94.3%) | 23 (76.7%) |
| Bottled, Tank, or LP Gas | 2 (1.1%) | 1 (3.3%) |
| Electricity | 7 (4.0%) | 6 (20.0%) |
| Fuel Oil or Kerosene | 0 (0.0%) | 0 (0.0%) |
| Coal or Coke | 0 (0.0%) | 0 (0.0%) |
| All other Fuels | 1 (0.6%) | 0 (0.0%) |
| No Fuel Used | 0 (0.0%) | 0 (0.0%) |
| Total | 175 (100.0%) | 30 (100.0%) |
Household Vehicle Usage in Fairgrove
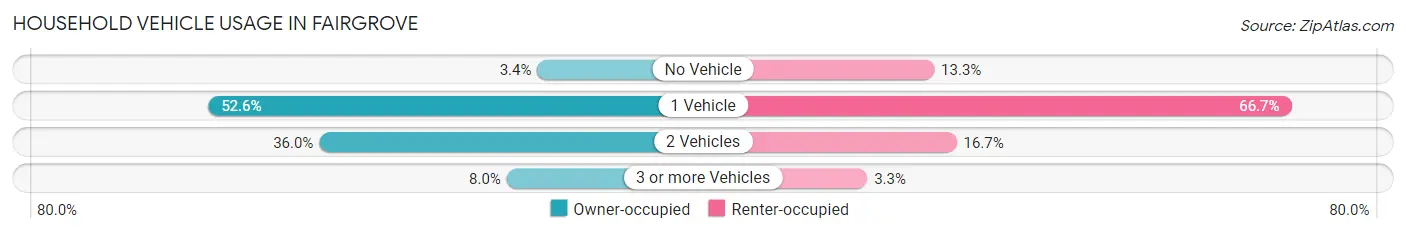
| Vehicles per Household | Owner-occupied | Renter-occupied |
| No Vehicle | 6 (3.4%) | 4 (13.3%) |
| 1 Vehicle | 92 (52.6%) | 20 (66.7%) |
| 2 Vehicles | 63 (36.0%) | 5 (16.7%) |
| 3 or more Vehicles | 14 (8.0%) | 1 (3.3%) |
| Total | 175 (100.0%) | 30 (100.0%) |
Real Estate & Mortgages in Fairgrove
Real Estate and Mortgage Overview in Fairgrove
| Characteristic | Without Mortgage | With Mortgage |
| Housing Units | 63 | 112 |
| Median Property Value | $67,200 | $75,700 |
| Median Household Income | $43,125 | $4 |
| Monthly Housing Costs | $380 | $0 |
| Real Estate Taxes | $1,323 | $17 |
Property Value by Mortgage Status in Fairgrove
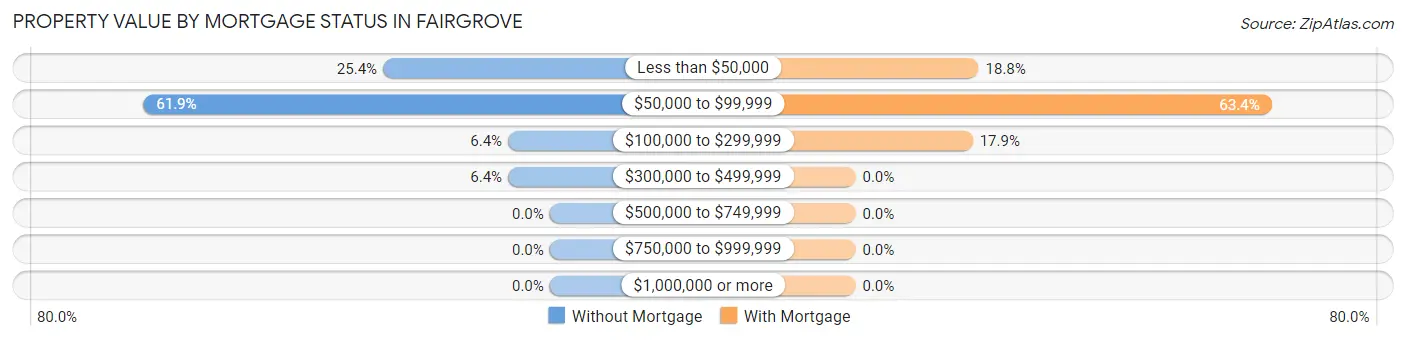
| Property Value | Without Mortgage | With Mortgage |
| Less than $50,000 | 16 (25.4%) | 21 (18.8%) |
| $50,000 to $99,999 | 39 (61.9%) | 71 (63.4%) |
| $100,000 to $299,999 | 4 (6.4%) | 20 (17.9%) |
| $300,000 to $499,999 | 4 (6.4%) | 0 (0.0%) |
| $500,000 to $749,999 | 0 (0.0%) | 0 (0.0%) |
| $750,000 to $999,999 | 0 (0.0%) | 0 (0.0%) |
| $1,000,000 or more | 0 (0.0%) | 0 (0.0%) |
| Total | 63 (100.0%) | 112 (100.0%) |
Household Income by Mortgage Status in Fairgrove
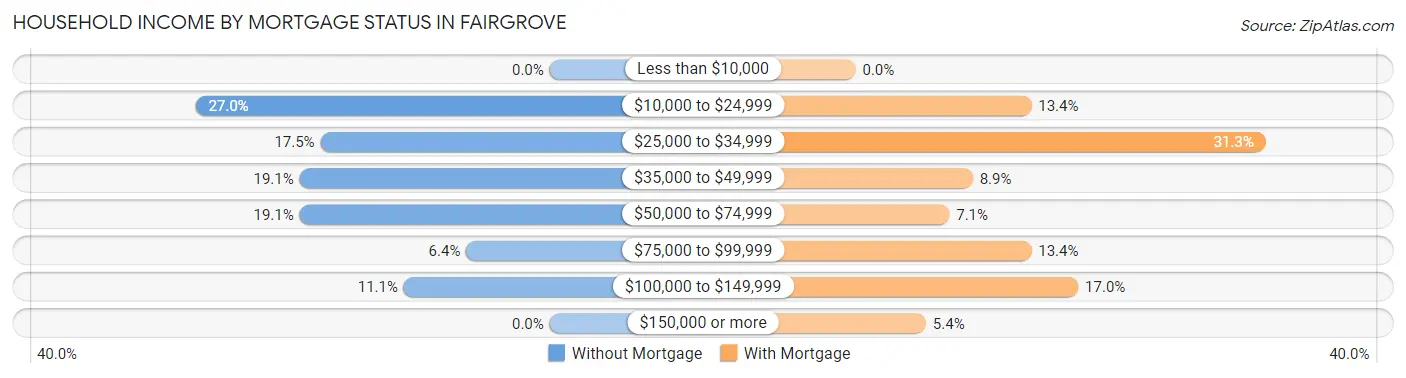
| Household Income | Without Mortgage | With Mortgage |
| Less than $10,000 | 0 (0.0%) | 0 (0.0%) |
| $10,000 to $24,999 | 17 (27.0%) | 15 (13.4%) |
| $25,000 to $34,999 | 11 (17.5%) | 35 (31.2%) |
| $35,000 to $49,999 | 12 (19.1%) | 10 (8.9%) |
| $50,000 to $74,999 | 12 (19.1%) | 8 (7.1%) |
| $75,000 to $99,999 | 4 (6.4%) | 15 (13.4%) |
| $100,000 to $149,999 | 7 (11.1%) | 19 (17.0%) |
| $150,000 or more | 0 (0.0%) | 6 (5.4%) |
| Total | 63 (100.0%) | 112 (100.0%) |
Property Value to Household Income Ratio in Fairgrove
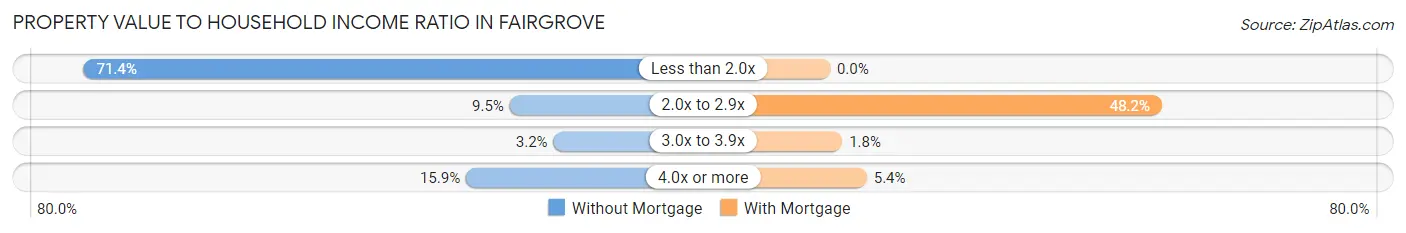
| Value-to-Income Ratio | Without Mortgage | With Mortgage |
| Less than 2.0x | 45 (71.4%) | 0 (0.0%) |
| 2.0x to 2.9x | 6 (9.5%) | 54 (48.2%) |
| 3.0x to 3.9x | 2 (3.2%) | 2 (1.8%) |
| 4.0x or more | 10 (15.9%) | 6 (5.4%) |
| Total | 63 (100.0%) | 112 (100.0%) |
Real Estate Taxes by Mortgage Status in Fairgrove
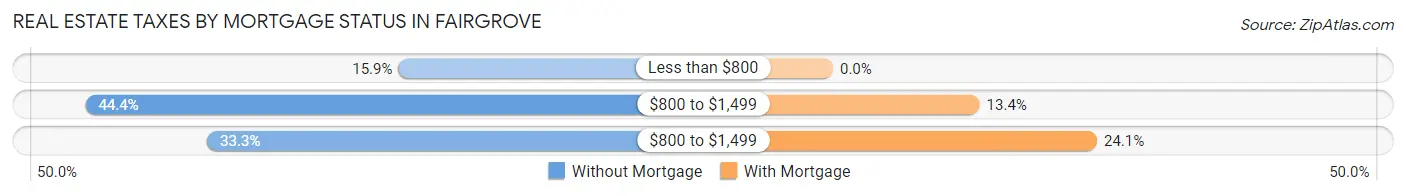
| Property Taxes | Without Mortgage | With Mortgage |
| Less than $800 | 10 (15.9%) | 0 (0.0%) |
| $800 to $1,499 | 28 (44.4%) | 15 (13.4%) |
| $800 to $1,499 | 21 (33.3%) | 27 (24.1%) |
| Total | 63 (100.0%) | 112 (100.0%) |
Health & Disability in Fairgrove
Health Insurance Coverage by Age in Fairgrove
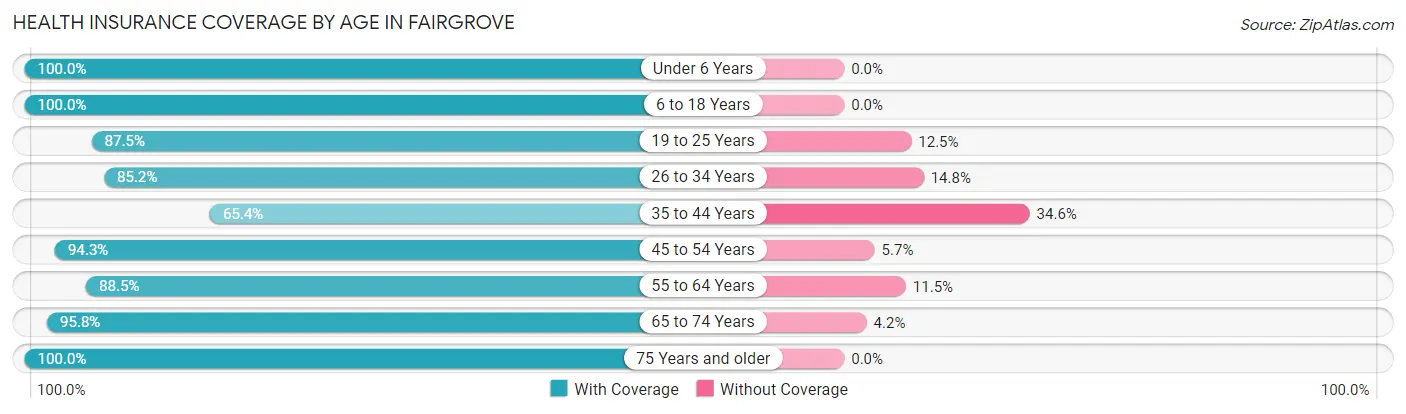
| Age Bracket | With Coverage | Without Coverage |
| Under 6 Years | 33 (100.0%) | 0 (0.0%) |
| 6 to 18 Years | 85 (100.0%) | 0 (0.0%) |
| 19 to 25 Years | 21 (87.5%) | 3 (12.5%) |
| 26 to 34 Years | 46 (85.2%) | 8 (14.8%) |
| 35 to 44 Years | 53 (65.4%) | 28 (34.6%) |
| 45 to 54 Years | 50 (94.3%) | 3 (5.7%) |
| 55 to 64 Years | 77 (88.5%) | 10 (11.5%) |
| 65 to 74 Years | 46 (95.8%) | 2 (4.2%) |
| 75 Years and older | 36 (100.0%) | 0 (0.0%) |
| Total | 447 (89.2%) | 54 (10.8%) |
Health Insurance Coverage by Citizenship Status in Fairgrove
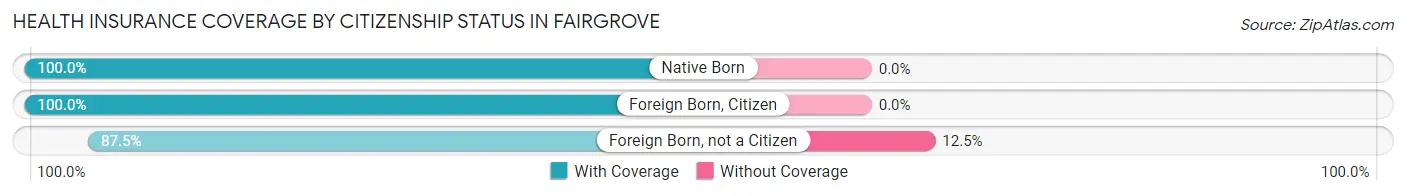
| Citizenship Status | With Coverage | Without Coverage |
| Native Born | 33 (100.0%) | 0 (0.0%) |
| Foreign Born, Citizen | 85 (100.0%) | 0 (0.0%) |
| Foreign Born, not a Citizen | 21 (87.5%) | 3 (12.5%) |
Health Insurance Coverage by Household Income in Fairgrove
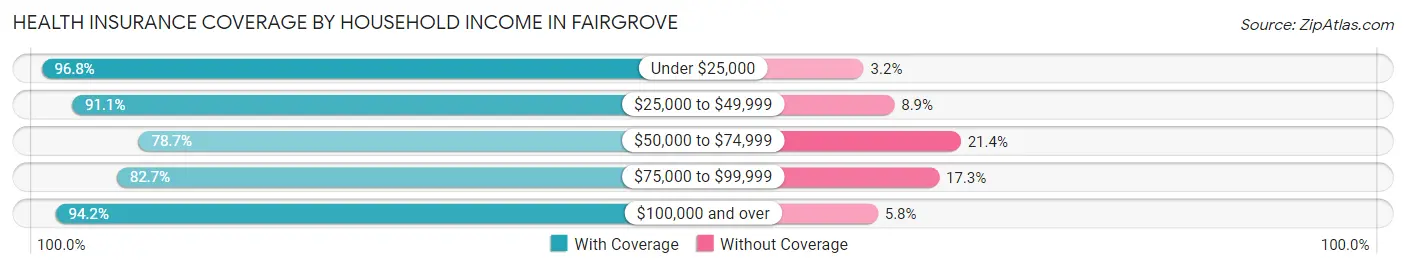
| Household Income | With Coverage | Without Coverage |
| Under $25,000 | 92 (96.8%) | 3 (3.2%) |
| $25,000 to $49,999 | 133 (91.1%) | 13 (8.9%) |
| $50,000 to $74,999 | 70 (78.6%) | 19 (21.3%) |
| $75,000 to $99,999 | 67 (82.7%) | 14 (17.3%) |
| $100,000 and over | 81 (94.2%) | 5 (5.8%) |
Public vs Private Health Insurance Coverage by Age in Fairgrove
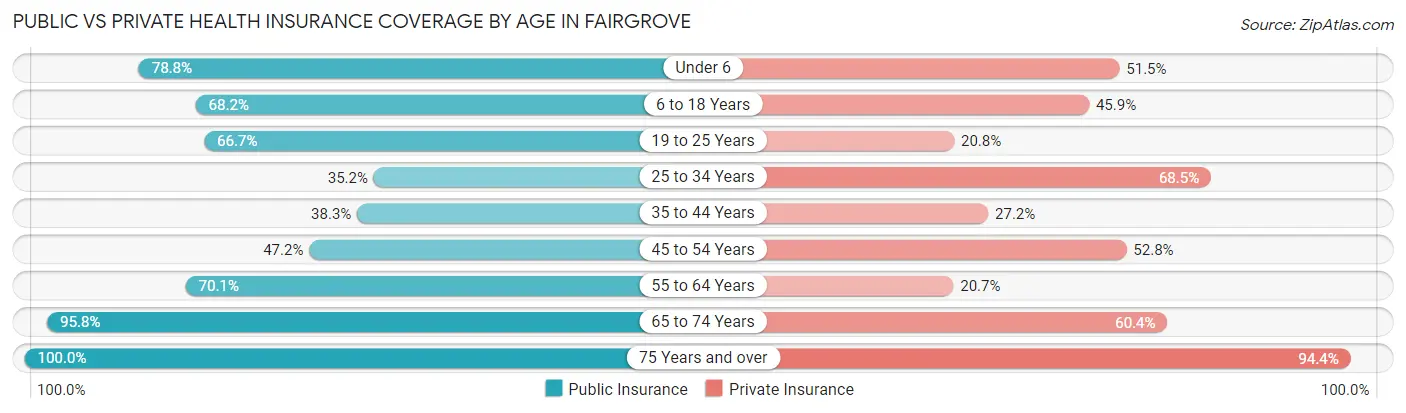
| Age Bracket | Public Insurance | Private Insurance |
| Under 6 | 26 (78.8%) | 17 (51.5%) |
| 6 to 18 Years | 58 (68.2%) | 39 (45.9%) |
| 19 to 25 Years | 16 (66.7%) | 5 (20.8%) |
| 25 to 34 Years | 19 (35.2%) | 37 (68.5%) |
| 35 to 44 Years | 31 (38.3%) | 22 (27.2%) |
| 45 to 54 Years | 25 (47.2%) | 28 (52.8%) |
| 55 to 64 Years | 61 (70.1%) | 18 (20.7%) |
| 65 to 74 Years | 46 (95.8%) | 29 (60.4%) |
| 75 Years and over | 36 (100.0%) | 34 (94.4%) |
| Total | 318 (63.5%) | 229 (45.7%) |
Disability Status by Sex by Age in Fairgrove
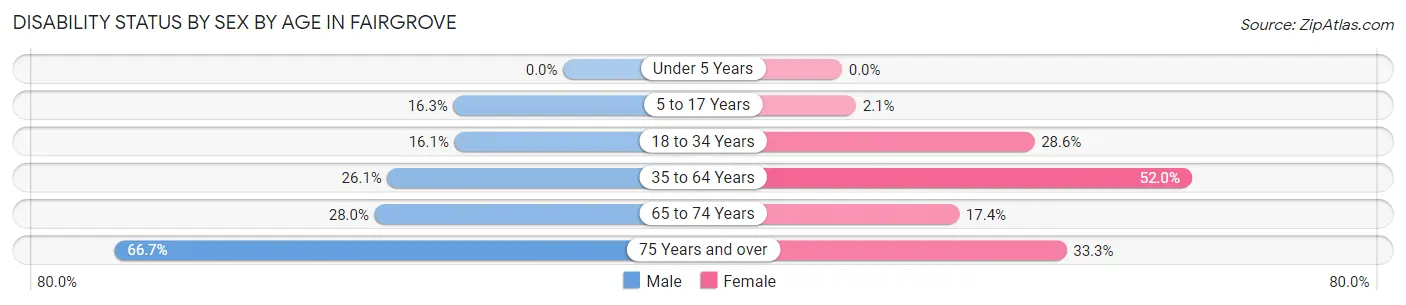
| Age Bracket | Male | Female |
| Under 5 Years | 0 (0.0%) | 0 (0.0%) |
| 5 to 17 Years | 7 (16.3%) | 1 (2.1%) |
| 18 to 34 Years | 5 (16.1%) | 14 (28.6%) |
| 35 to 64 Years | 18 (26.1%) | 79 (52.0%) |
| 65 to 74 Years | 7 (28.0%) | 4 (17.4%) |
| 75 Years and over | 20 (66.7%) | 2 (33.3%) |
Disability Class by Sex by Age in Fairgrove
Disability Class: Hearing Difficulty
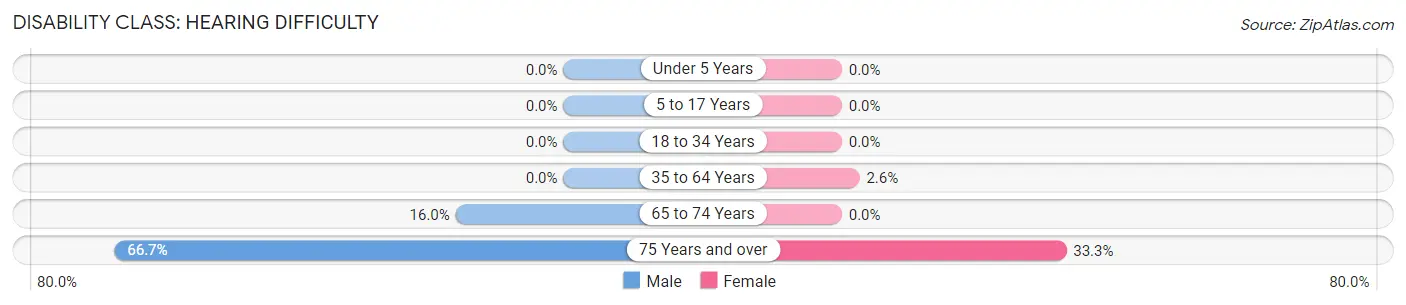
| Age Bracket | Male | Female |
| Under 5 Years | 0 (0.0%) | 0 (0.0%) |
| 5 to 17 Years | 0 (0.0%) | 0 (0.0%) |
| 18 to 34 Years | 0 (0.0%) | 0 (0.0%) |
| 35 to 64 Years | 0 (0.0%) | 4 (2.6%) |
| 65 to 74 Years | 4 (16.0%) | 0 (0.0%) |
| 75 Years and over | 20 (66.7%) | 2 (33.3%) |
Disability Class: Vision Difficulty
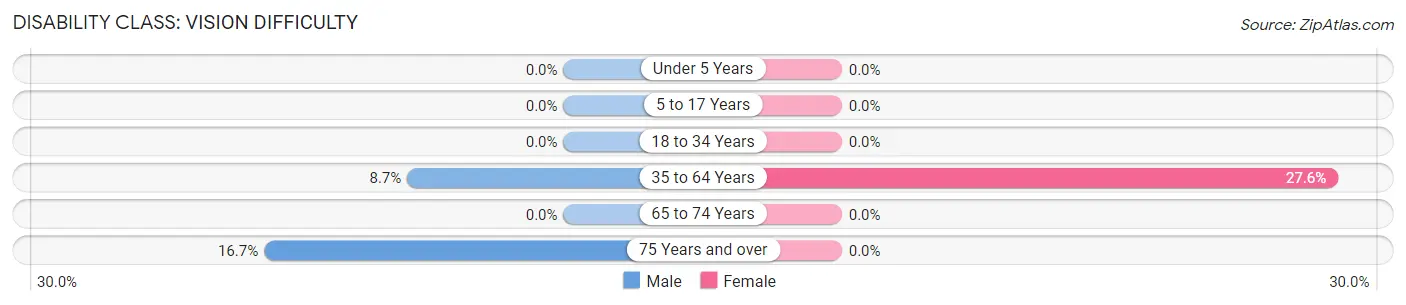
| Age Bracket | Male | Female |
| Under 5 Years | 0 (0.0%) | 0 (0.0%) |
| 5 to 17 Years | 0 (0.0%) | 0 (0.0%) |
| 18 to 34 Years | 0 (0.0%) | 0 (0.0%) |
| 35 to 64 Years | 6 (8.7%) | 42 (27.6%) |
| 65 to 74 Years | 0 (0.0%) | 0 (0.0%) |
| 75 Years and over | 5 (16.7%) | 0 (0.0%) |
Disability Class: Cognitive Difficulty
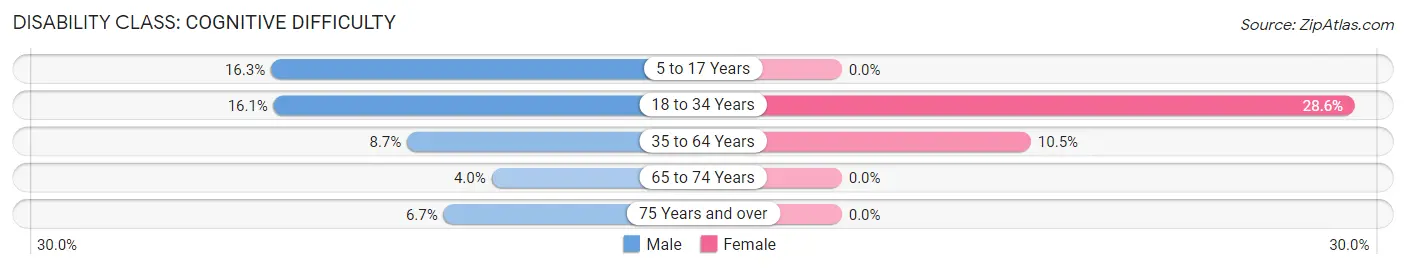
| Age Bracket | Male | Female |
| 5 to 17 Years | 7 (16.3%) | 0 (0.0%) |
| 18 to 34 Years | 5 (16.1%) | 14 (28.6%) |
| 35 to 64 Years | 6 (8.7%) | 16 (10.5%) |
| 65 to 74 Years | 1 (4.0%) | 0 (0.0%) |
| 75 Years and over | 2 (6.7%) | 0 (0.0%) |
Disability Class: Ambulatory Difficulty
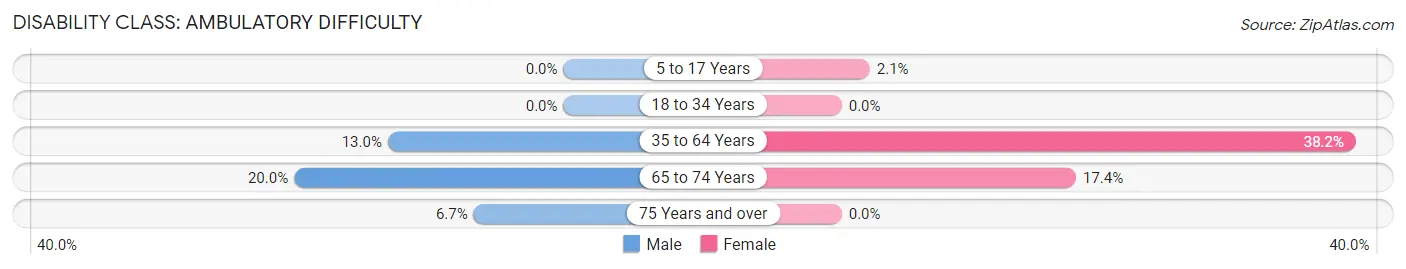
| Age Bracket | Male | Female |
| 5 to 17 Years | 0 (0.0%) | 1 (2.1%) |
| 18 to 34 Years | 0 (0.0%) | 0 (0.0%) |
| 35 to 64 Years | 9 (13.0%) | 58 (38.2%) |
| 65 to 74 Years | 5 (20.0%) | 4 (17.4%) |
| 75 Years and over | 2 (6.7%) | 0 (0.0%) |
Disability Class: Self-Care Difficulty
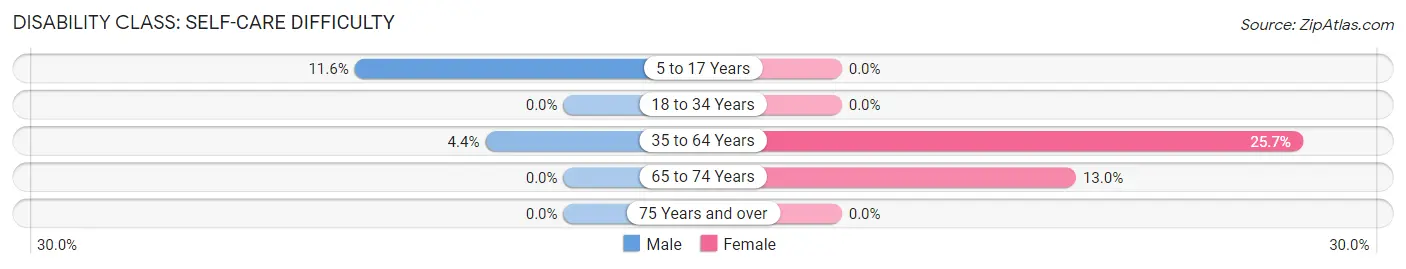
| Age Bracket | Male | Female |
| 5 to 17 Years | 5 (11.6%) | 0 (0.0%) |
| 18 to 34 Years | 0 (0.0%) | 0 (0.0%) |
| 35 to 64 Years | 3 (4.3%) | 39 (25.7%) |
| 65 to 74 Years | 0 (0.0%) | 3 (13.0%) |
| 75 Years and over | 0 (0.0%) | 0 (0.0%) |
Technology Access in Fairgrove
Computing Device Access in Fairgrove
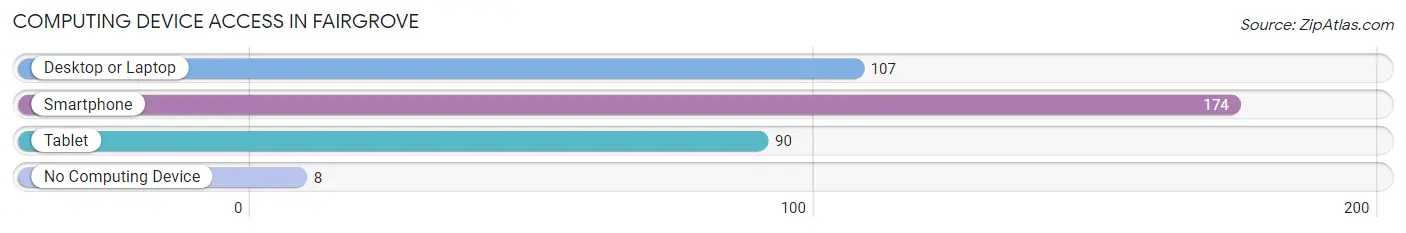
| Device Type | # Households | % Households |
| Desktop or Laptop | 107 | 52.2% |
| Smartphone | 174 | 84.9% |
| Tablet | 90 | 43.9% |
| No Computing Device | 8 | 3.9% |
| Total | 205 | 100.0% |
Internet Access in Fairgrove
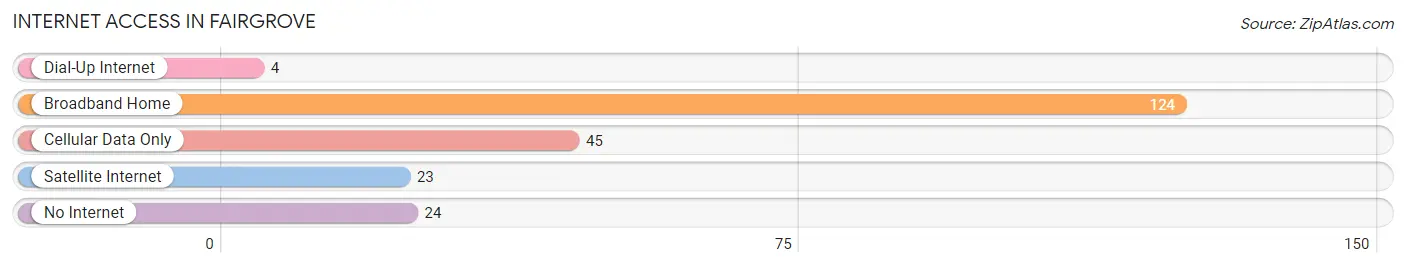
| Internet Type | # Households | % Households |
| Dial-Up Internet | 4 | 1.9% |
| Broadband Home | 124 | 60.5% |
| Cellular Data Only | 45 | 22.0% |
| Satellite Internet | 23 | 11.2% |
| No Internet | 24 | 11.7% |
| Total | 205 | 100.0% |
Fairgrove Summary
History
Fairgrove is a small village located in the Tuscola County of Michigan. It is situated on the banks of the Cass River and is part of the Saginaw-Bay City-Midland Metropolitan Statistical Area. The village was founded in 1854 by a group of settlers from New York. The settlers were attracted to the area due to its fertile soil and abundant natural resources. The village was originally named Fairgrove after the grove of trees that surrounded the settlement.
The village was initially a farming community, with the main crops being wheat, corn, and oats. The village also had a sawmill, a gristmill, and a blacksmith shop. In the late 1800s, the village began to grow and prosper due to the lumber industry. The village was home to several lumber mills, which provided employment for many of the residents.
In the early 1900s, the village began to experience a decline in population due to the decline of the lumber industry. The village was also affected by the Great Depression, which caused many of the businesses to close. However, the village was able to survive and eventually began to experience a resurgence in the 1950s.
The village experienced a period of growth in the 1960s and 1970s due to the construction of the Cass River Dam. The dam provided the village with a reliable source of water and electricity, which allowed for the development of new businesses and industries.
The village has continued to grow and prosper in recent years. The village is home to several businesses, including a grocery store, a hardware store, a bank, and a post office. The village also has a public library, a fire department, and a police department.
Geography
Fairgrove is located in the southeastern corner of Tuscola County, Michigan. The village is situated on the banks of the Cass River, which flows through the village. The village is surrounded by farmland and is located approximately 10 miles from the city of Saginaw.
The village has a total area of 0.7 square miles, all of which is land. The village has a humid continental climate, with hot summers and cold winters. The average temperature in the summer is around 75 degrees Fahrenheit, while the average temperature in the winter is around 25 degrees Fahrenheit.
Economy
The economy of Fairgrove is largely based on agriculture and manufacturing. The village is home to several farms, which produce a variety of crops, including wheat, corn, and oats. The village also has several manufacturing businesses, which produce a variety of products, including furniture, clothing, and automotive parts.
The village also has several retail businesses, including a grocery store, a hardware store, and a bank. The village also has a post office and a public library.
Demographics
As of the 2010 census, the population of Fairgrove was 1,093. The village has a total area of 0.7 square miles, all of which is land. The population density is 1,541 people per square mile.
The racial makeup of the village is 97.3% White, 0.7% African American, 0.2% Native American, 0.2% Asian, 0.1% from other races, and 1.5% from two or more races. The median household income is $41,250, and the median family income is $50,000. The per capita income is $20,000.
Common Questions
What is Per Capita Income in Fairgrove?
Per Capita income in Fairgrove is $20,902.
What is the Median Family Income in Fairgrove?
Median Family Income in Fairgrove is $59,318.
What is the Median Household income in Fairgrove?
Median Household Income in Fairgrove is $34,583.
What is Income or Wage Gap in Fairgrove?
Income or Wage Gap in Fairgrove is 21.8%.
Women in Fairgrove earn 78.2 cents for every dollar earned by a man.
What is Inequality or Gini Index in Fairgrove?
Inequality or Gini Index in Fairgrove is 0.44.
What is the Total Population of Fairgrove?
Total Population of Fairgrove is 501.
What is the Total Male Population of Fairgrove?
Total Male Population of Fairgrove is 214.
What is the Total Female Population of Fairgrove?
Total Female Population of Fairgrove is 287.
What is the Ratio of Males per 100 Females in Fairgrove?
There are 74.56 Males per 100 Females in Fairgrove.
What is the Ratio of Females per 100 Males in Fairgrove?
There are 134.11 Females per 100 Males in Fairgrove.
What is the Median Population Age in Fairgrove?
Median Population Age in Fairgrove is 42.4 Years.
What is the Average Family Size in Fairgrove
Average Family Size in Fairgrove is 3.5 People.
What is the Average Household Size in Fairgrove
Average Household Size in Fairgrove is 2.4 People.
How Large is the Labor Force in Fairgrove?
There are 185 People in the Labor Forcein in Fairgrove.
What is the Percentage of People in the Labor Force in Fairgrove?
46.6% of People are in the Labor Force in Fairgrove.
What is the Unemployment Rate in Fairgrove?
Unemployment Rate in Fairgrove is 2.7%.