Essexville, MI Map & Demographics
Essexville Map
Essexville Overview
$33,088
PER CAPITA INCOME
$73,446
AVG FAMILY INCOME
$72,516
AVG HOUSEHOLD INCOME
9.1%
WAGE / INCOME GAP [ % ]
90.9¢/ $1
WAGE / INCOME GAP [ $ ]
0.32
INEQUALITY / GINI INDEX
3,372
TOTAL POPULATION
1,761
MALE POPULATION
1,611
FEMALE POPULATION
109.31
MALES / 100 FEMALES
91.48
FEMALES / 100 MALES
43.3
MEDIAN AGE
3.1
AVG FAMILY SIZE
2.4
AVG HOUSEHOLD SIZE
1,537
LABOR FORCE [ PEOPLE ]
55.7%
PERCENT IN LABOR FORCE
2.9%
UNEMPLOYMENT RATE
Essexville Zip Codes
Essexville Area Codes
Income in Essexville
Income Overview in Essexville
Per Capita Income in Essexville is $33,088, while median incomes of families and households are $73,446 and $72,516 respectively.
| Characteristic | Number | Measure |
| Per Capita Income | 3,372 | $33,088 |
| Median Family Income | 891 | $73,446 |
| Mean Family Income | 891 | $84,500 |
| Median Household Income | 1,379 | $72,516 |
| Mean Household Income | 1,379 | $80,228 |
| Income Deficit | 891 | $0 |
| Wage / Income Gap (%) | 3,372 | 9.14% |
| Wage / Income Gap ($) | 3,372 | 90.86¢ per $1 |
| Gini / Inequality Index | 3,372 | 0.32 |
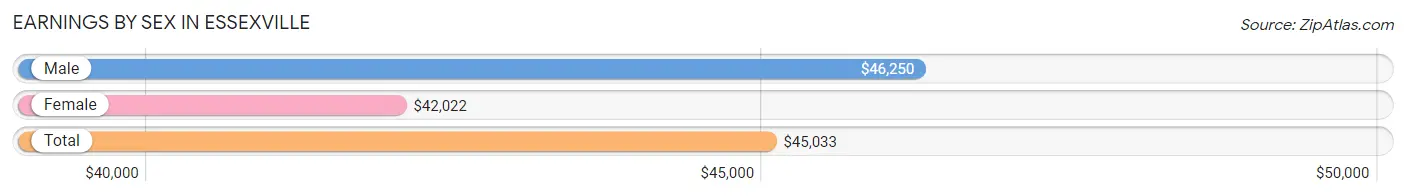
Earnings by Sex in Essexville
Average Earnings in Essexville are $45,033, $46,250 for men and $42,022 for women, a difference of 9.1%.
| Sex | Number | Average Earnings |
| Male | 857 (54.8%) | $46,250 |
| Female | 707 (45.2%) | $42,022 |
| Total | 1,564 (100.0%) | $45,033 |
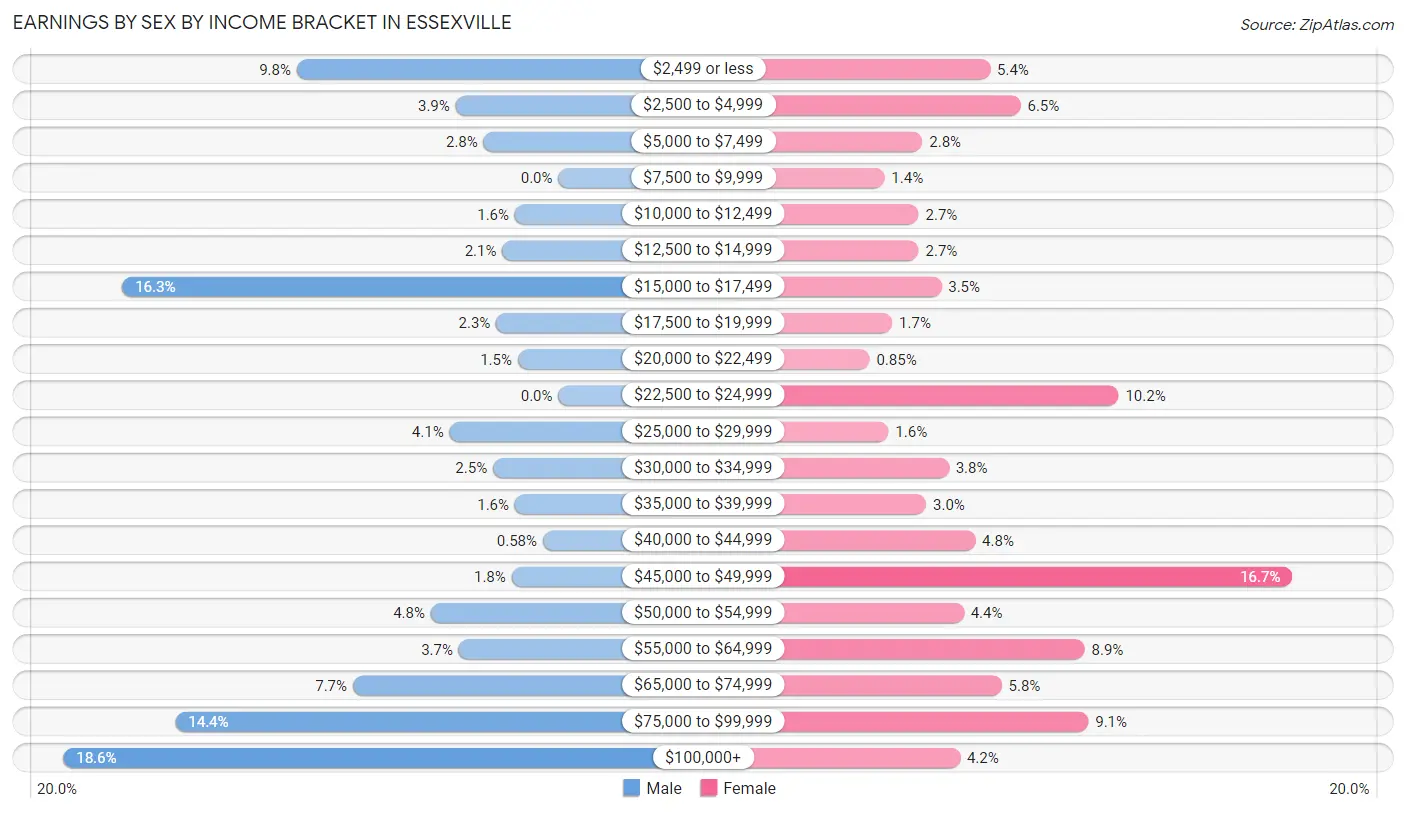
Earnings by Sex by Income Bracket in Essexville
The most common earnings brackets in Essexville are $100,000+ for men (159 | 18.5%) and $45,000 to $49,999 for women (118 | 16.7%).
| Income | Male | Female |
| $2,499 or less | 84 (9.8%) | 38 (5.4%) |
| $2,500 to $4,999 | 33 (3.8%) | 46 (6.5%) |
| $5,000 to $7,499 | 24 (2.8%) | 20 (2.8%) |
| $7,500 to $9,999 | 0 (0.0%) | 10 (1.4%) |
| $10,000 to $12,499 | 14 (1.6%) | 19 (2.7%) |
| $12,500 to $14,999 | 18 (2.1%) | 19 (2.7%) |
| $15,000 to $17,499 | 140 (16.3%) | 25 (3.5%) |
| $17,500 to $19,999 | 20 (2.3%) | 12 (1.7%) |
| $20,000 to $22,499 | 13 (1.5%) | 6 (0.9%) |
| $22,500 to $24,999 | 0 (0.0%) | 72 (10.2%) |
| $25,000 to $29,999 | 35 (4.1%) | 11 (1.6%) |
| $30,000 to $34,999 | 21 (2.5%) | 27 (3.8%) |
| $35,000 to $39,999 | 14 (1.6%) | 21 (3.0%) |
| $40,000 to $44,999 | 5 (0.6%) | 34 (4.8%) |
| $45,000 to $49,999 | 15 (1.8%) | 118 (16.7%) |
| $50,000 to $54,999 | 41 (4.8%) | 31 (4.4%) |
| $55,000 to $64,999 | 32 (3.7%) | 63 (8.9%) |
| $65,000 to $74,999 | 66 (7.7%) | 41 (5.8%) |
| $75,000 to $99,999 | 123 (14.3%) | 64 (9.0%) |
| $100,000+ | 159 (18.5%) | 30 (4.2%) |
| Total | 857 (100.0%) | 707 (100.0%) |
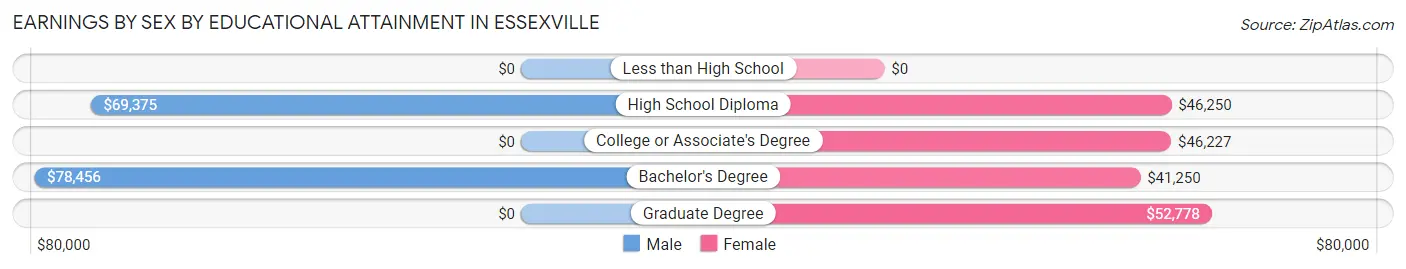
Earnings by Sex by Educational Attainment in Essexville
Average earnings in Essexville are $59,191 for men and $46,352 for women, a difference of 21.7%. Men with an educational attainment of bachelor's degree enjoy the highest average annual earnings of $78,456, while those with high school diploma education earn the least with $69,375. Women with an educational attainment of graduate degree earn the most with the average annual earnings of $52,778, while those with bachelor's degree education have the smallest earnings of $41,250.
| Educational Attainment | Male Income | Female Income |
| Less than High School | - | - |
| High School Diploma | $69,375 | $46,250 |
| College or Associate's Degree | - | - |
| Bachelor's Degree | $78,456 | $41,250 |
| Graduate Degree | - | - |
| Total | $59,191 | $46,352 |
Family Income in Essexville
Family Income Brackets in Essexville
According to the Essexville family income data, there are 251 families falling into the $50,000 to $74,999 income range, which is the most common income bracket and makes up 28.2% of all families.
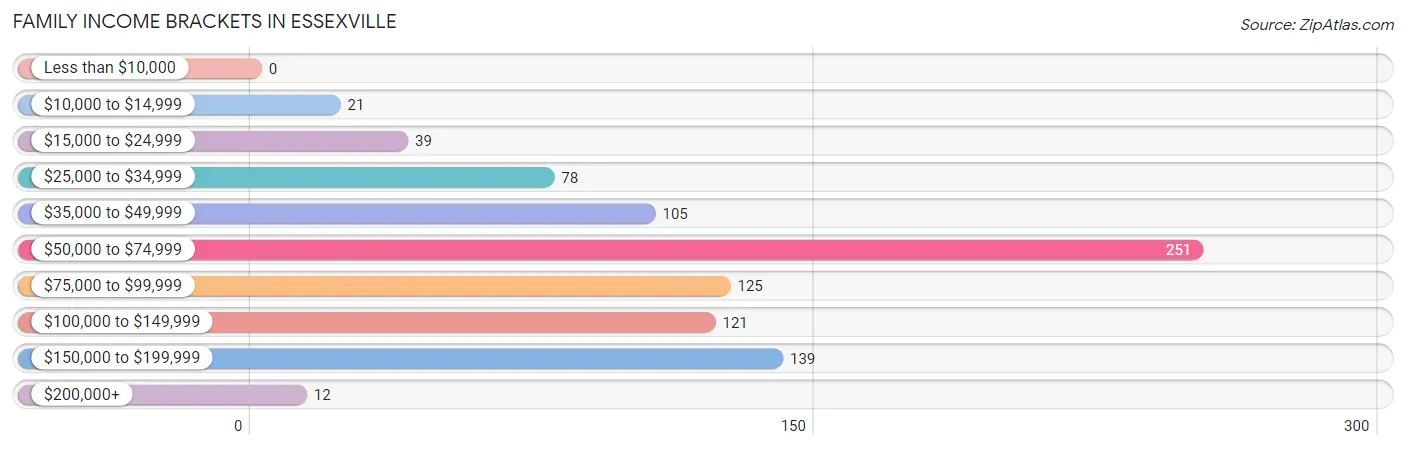
| Income Bracket | # Families | % Families |
| Less than $10,000 | 0 | 0.0% |
| $10,000 to $14,999 | 21 | 2.4% |
| $15,000 to $24,999 | 39 | 4.4% |
| $25,000 to $34,999 | 78 | 8.8% |
| $35,000 to $49,999 | 105 | 11.8% |
| $50,000 to $74,999 | 251 | 28.2% |
| $75,000 to $99,999 | 125 | 14.0% |
| $100,000 to $149,999 | 121 | 13.6% |
| $150,000 to $199,999 | 139 | 15.6% |
| $200,000+ | 12 | 1.3% |
Family Income by Famaliy Size in Essexville
5-person families (41 | 4.6%) account for the highest median family income in Essexville with $135,694 per family, while 4-person families (193 | 21.7%) have the highest median income of $30,759 per family member.
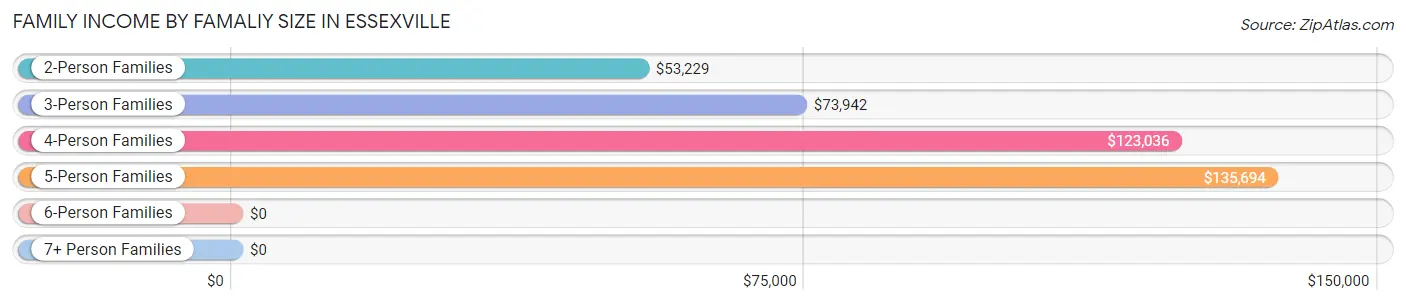
| Income Bracket | # Families | Median Income |
| 2-Person Families | 391 (43.9%) | $53,229 |
| 3-Person Families | 232 (26.0%) | $73,942 |
| 4-Person Families | 193 (21.7%) | $123,036 |
| 5-Person Families | 41 (4.6%) | $135,694 |
| 6-Person Families | 34 (3.8%) | $0 |
| 7+ Person Families | 0 (0.0%) | $0 |
| Total | 891 (100.0%) | $73,446 |
Family Income by Number of Earners in Essexville
The median family income in Essexville is $73,446, with families comprising 3+ earners (91) having the highest median family income of $140,329, while families with no earners (284) have the lowest median family income of $47,643, accounting for 10.2% and 31.9% of families, respectively.
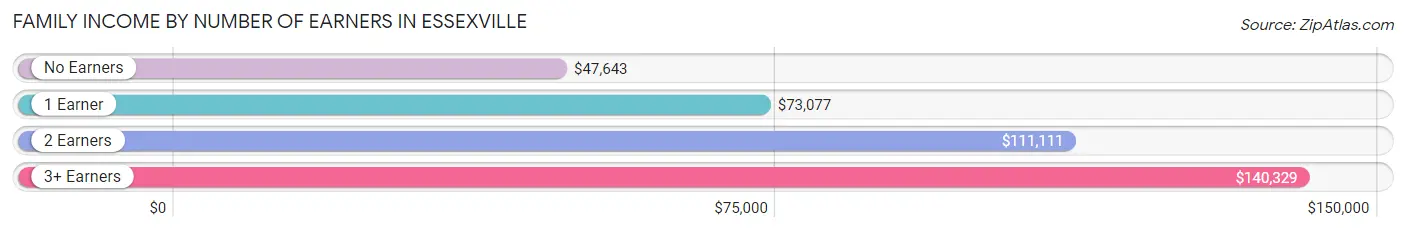
| Number of Earners | # Families | Median Income |
| No Earners | 284 (31.9%) | $47,643 |
| 1 Earner | 190 (21.3%) | $73,077 |
| 2 Earners | 326 (36.6%) | $111,111 |
| 3+ Earners | 91 (10.2%) | $140,329 |
| Total | 891 (100.0%) | $73,446 |
Household Income in Essexville
Household Income Brackets in Essexville
With 352 households falling in the category, the $50,000 to $74,999 income range is the most frequent in Essexville, accounting for 25.5% of all households.
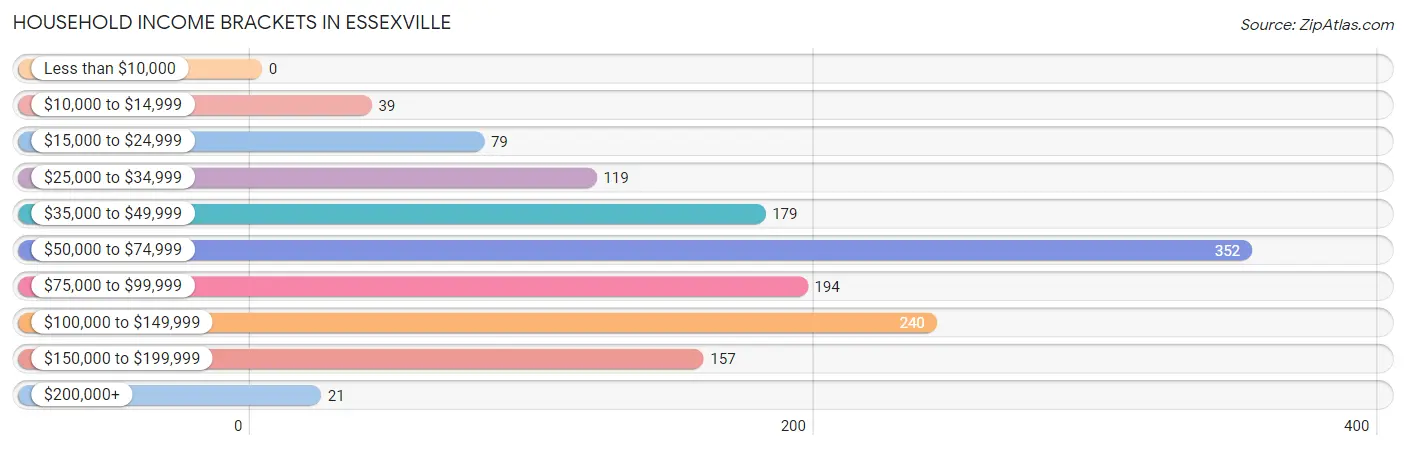
| Income Bracket | # Households | % Households |
| Less than $10,000 | 0 | 0.0% |
| $10,000 to $14,999 | 39 | 2.8% |
| $15,000 to $24,999 | 79 | 5.7% |
| $25,000 to $34,999 | 119 | 8.6% |
| $35,000 to $49,999 | 179 | 13.0% |
| $50,000 to $74,999 | 352 | 25.5% |
| $75,000 to $99,999 | 194 | 14.1% |
| $100,000 to $149,999 | 240 | 17.4% |
| $150,000 to $199,999 | 157 | 11.4% |
| $200,000+ | 21 | 1.5% |
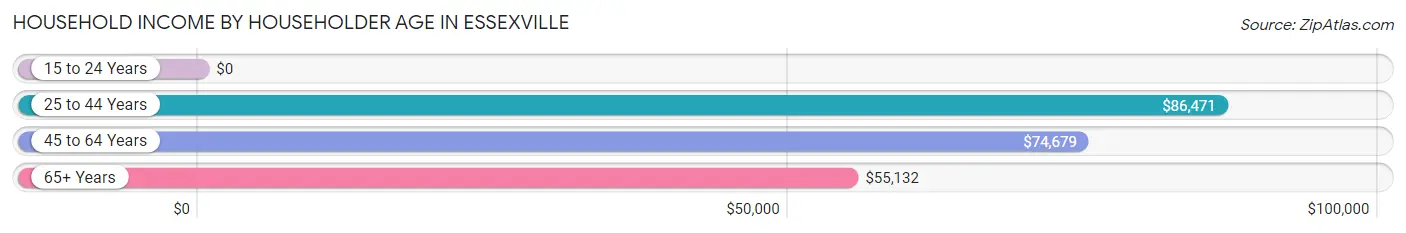
Household Income by Householder Age in Essexville
The median household income in Essexville is $72,516, with the highest median household income of $86,471 found in the 25 to 44 years age bracket for the primary householder. A total of 356 households (25.8%) fall into this category. Meanwhile, the 15 to 24 years age bracket for the primary householder has the lowest median household income of $0, with 21 households (1.5%) in this group.
| Income Bracket | # Households | Median Income |
| 15 to 24 Years | 21 (1.5%) | $0 |
| 25 to 44 Years | 356 (25.8%) | $86,471 |
| 45 to 64 Years | 658 (47.7%) | $74,679 |
| 65+ Years | 344 (24.9%) | $55,132 |
| Total | 1,379 (100.0%) | $72,516 |
Poverty in Essexville
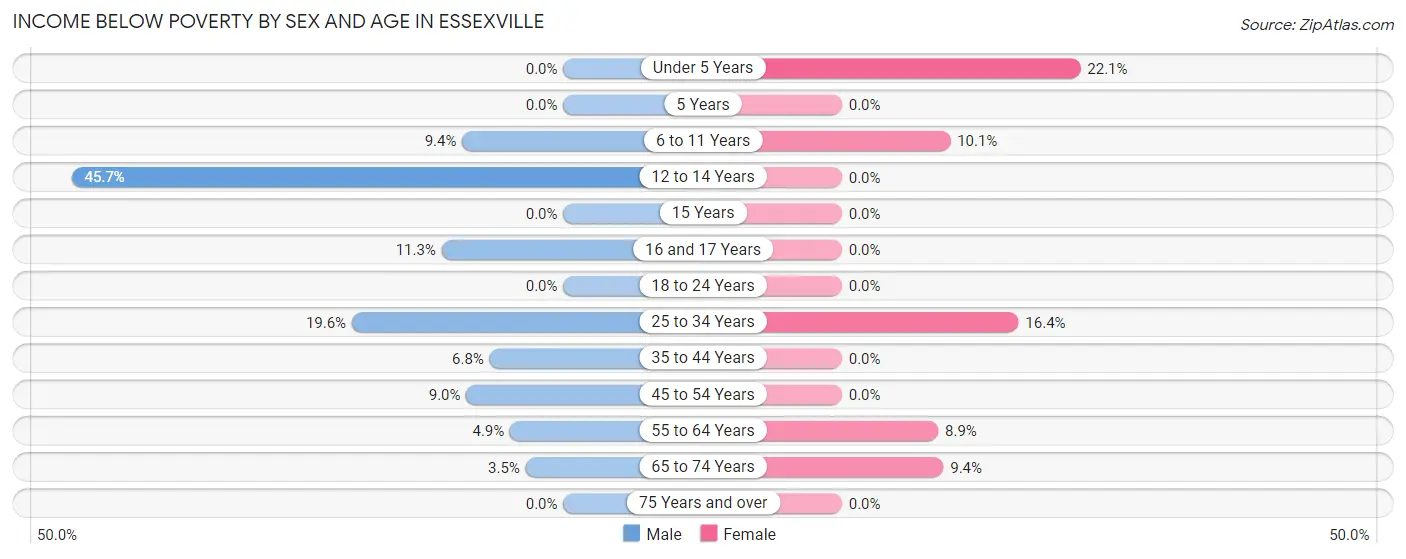
Income Below Poverty by Sex and Age in Essexville
With 8.9% poverty level for males and 7.1% for females among the residents of Essexville, 12 to 14 year old males and under 5 year old females are the most vulnerable to poverty, with 42 males (45.7%) and 29 females (22.1%) in their respective age groups living below the poverty level.
| Age Bracket | Male | Female |
| Under 5 Years | 0 (0.0%) | 29 (22.1%) |
| 5 Years | 0 (0.0%) | 0 (0.0%) |
| 6 to 11 Years | 9 (9.4%) | 16 (10.1%) |
| 12 to 14 Years | 42 (45.7%) | 0 (0.0%) |
| 15 Years | 0 (0.0%) | 0 (0.0%) |
| 16 and 17 Years | 14 (11.3%) | 0 (0.0%) |
| 18 to 24 Years | 0 (0.0%) | 0 (0.0%) |
| 25 to 34 Years | 31 (19.6%) | 30 (16.4%) |
| 35 to 44 Years | 21 (6.8%) | 0 (0.0%) |
| 45 to 54 Years | 18 (9.0%) | 0 (0.0%) |
| 55 to 64 Years | 13 (4.9%) | 22 (8.9%) |
| 65 to 74 Years | 9 (3.5%) | 18 (9.4%) |
| 75 Years and over | 0 (0.0%) | 0 (0.0%) |
| Total | 157 (8.9%) | 115 (7.1%) |
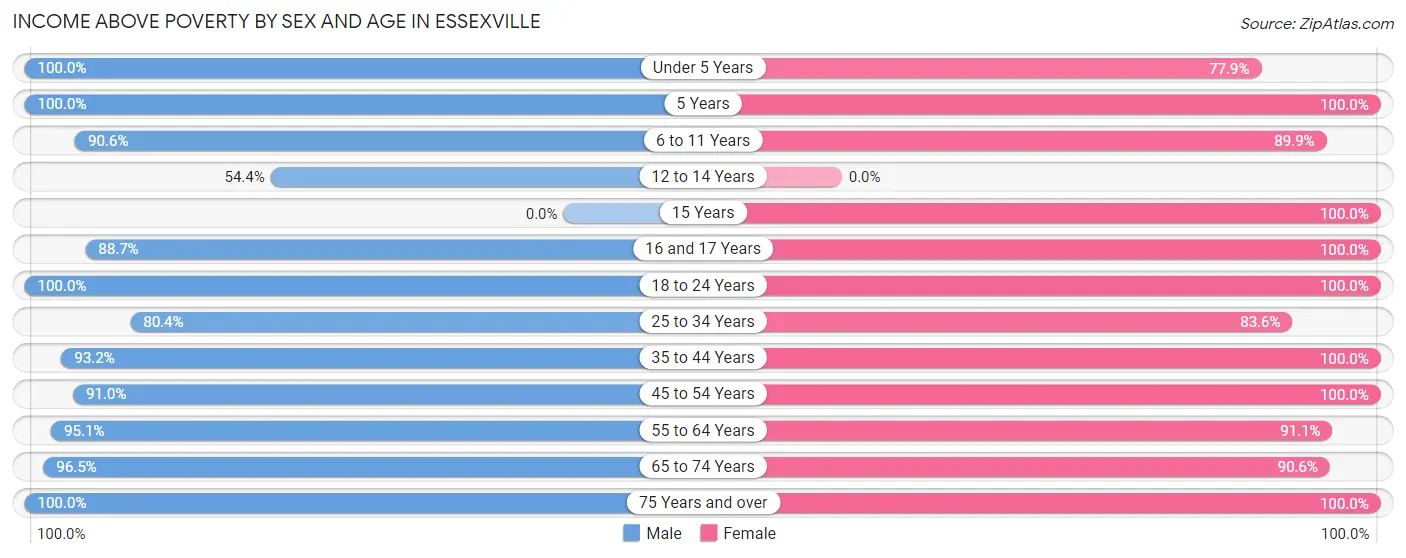
Income Above Poverty by Sex and Age in Essexville
According to the poverty statistics in Essexville, males aged under 5 years and females aged 5 years are the age groups that are most secure financially, with 100.0% of males and 100.0% of females in these age groups living above the poverty line.
| Age Bracket | Male | Female |
| Under 5 Years | 72 (100.0%) | 102 (77.9%) |
| 5 Years | 18 (100.0%) | 5 (100.0%) |
| 6 to 11 Years | 87 (90.6%) | 143 (89.9%) |
| 12 to 14 Years | 50 (54.3%) | 0 (0.0%) |
| 15 Years | 0 (0.0%) | 39 (100.0%) |
| 16 and 17 Years | 110 (88.7%) | 51 (100.0%) |
| 18 to 24 Years | 56 (100.0%) | 82 (100.0%) |
| 25 to 34 Years | 127 (80.4%) | 153 (83.6%) |
| 35 to 44 Years | 286 (93.2%) | 182 (100.0%) |
| 45 to 54 Years | 182 (91.0%) | 215 (100.0%) |
| 55 to 64 Years | 250 (95.1%) | 224 (91.1%) |
| 65 to 74 Years | 248 (96.5%) | 173 (90.6%) |
| 75 Years and over | 118 (100.0%) | 127 (100.0%) |
| Total | 1,604 (91.1%) | 1,496 (92.9%) |
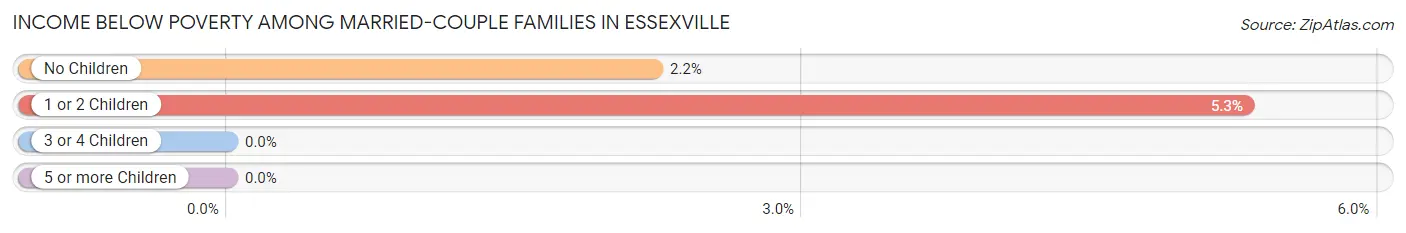
Income Below Poverty Among Married-Couple Families in Essexville
The poverty statistics for married-couple families in Essexville show that 3.2% or 22 of the total 699 families live below the poverty line. Families with 1 or 2 children have the highest poverty rate of 5.3%, comprising of 13 families. On the other hand, families with 3 or 4 children have the lowest poverty rate of 0.0%, which includes 0 families.
| Children | Above Poverty | Below Poverty |
| No Children | 396 (97.8%) | 9 (2.2%) |
| 1 or 2 Children | 232 (94.7%) | 13 (5.3%) |
| 3 or 4 Children | 49 (100.0%) | 0 (0.0%) |
| 5 or more Children | 0 (0.0%) | 0 (0.0%) |
| Total | 677 (96.9%) | 22 (3.2%) |
Income Below Poverty Among Single-Parent Households in Essexville
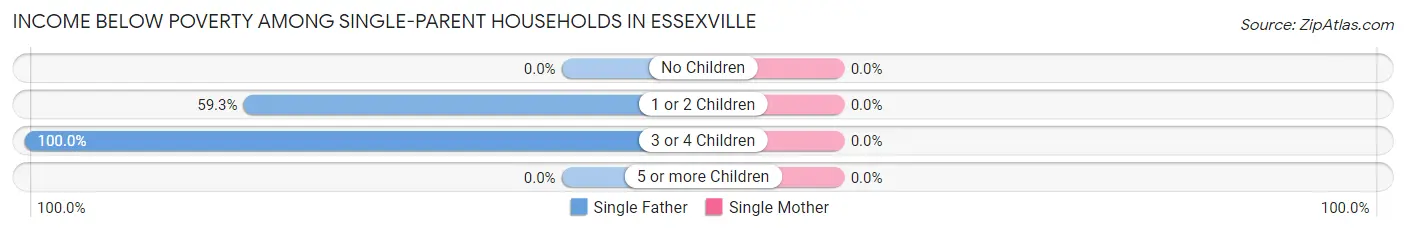
| Children | Single Father | Single Mother |
| No Children | 0 (0.0%) | 0 (0.0%) |
| 1 or 2 Children | 16 (59.3%) | 0 (0.0%) |
| 3 or 4 Children | 21 (100.0%) | 0 (0.0%) |
| 5 or more Children | 0 (0.0%) | 0 (0.0%) |
| Total | 37 (46.8%) | 0 (0.0%) |
Income Below Poverty Among Married-Couple vs Single-Parent Households in Essexville
The poverty data for Essexville shows that 22 of the married-couple family households (3.2%) and 37 of the single-parent households (19.3%) are living below the poverty level. Within the married-couple family households, those with 1 or 2 children have the highest poverty rate, with 13 households (5.3%) falling below the poverty line. Among the single-parent households, those with 3 or 4 children have the highest poverty rate, with 21 household (100.0%) living below poverty.
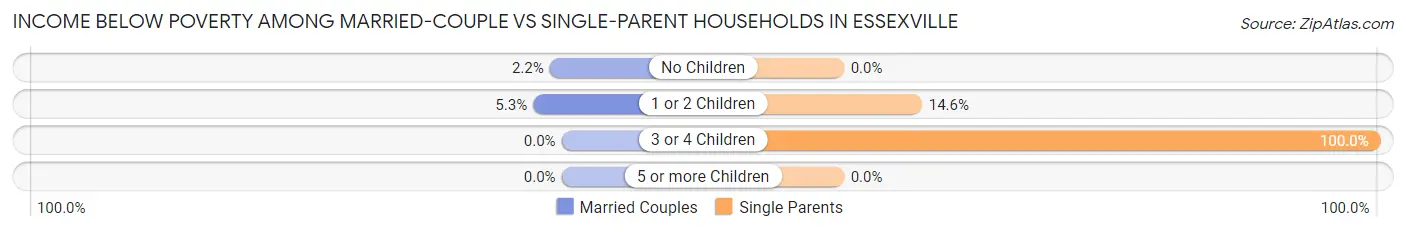
| Children | Married-Couple Families | Single-Parent Households |
| No Children | 9 (2.2%) | 0 (0.0%) |
| 1 or 2 Children | 13 (5.3%) | 16 (14.5%) |
| 3 or 4 Children | 0 (0.0%) | 21 (100.0%) |
| 5 or more Children | 0 (0.0%) | 0 (0.0%) |
| Total | 22 (3.2%) | 37 (19.3%) |
Race in Essexville
The most populous races in Essexville are White / Caucasian (3,238 | 96.0%), Hispanic or Latino (320 | 9.5%), and Two or more Races (116 | 3.4%).
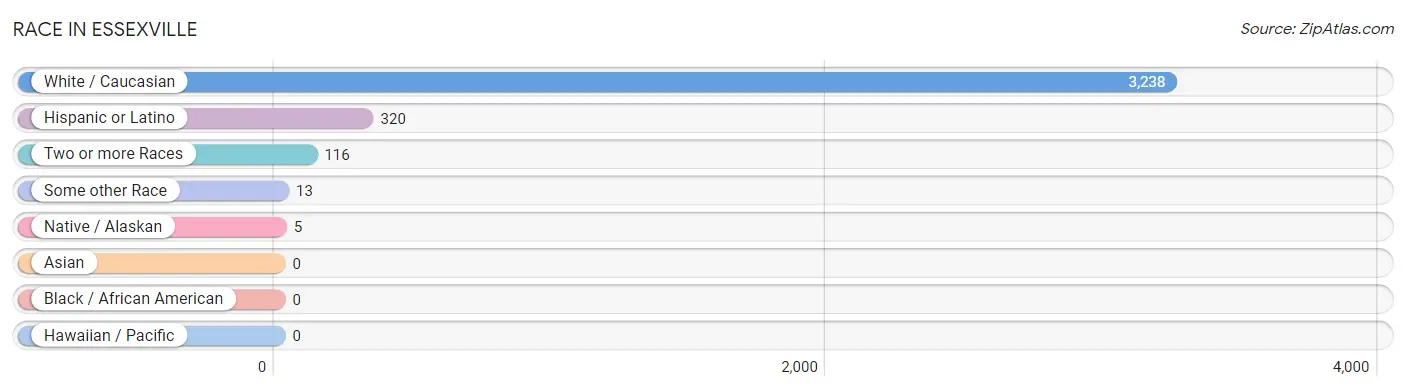
| Race | # Population | % Population |
| Asian | 0 | 0.0% |
| Black / African American | 0 | 0.0% |
| Hawaiian / Pacific | 0 | 0.0% |
| Hispanic or Latino | 320 | 9.5% |
| Native / Alaskan | 5 | 0.2% |
| White / Caucasian | 3,238 | 96.0% |
| Two or more Races | 116 | 3.4% |
| Some other Race | 13 | 0.4% |
| Total | 3,372 | 100.0% |
Ancestry in Essexville
The most populous ancestries reported in Essexville are German (1,077 | 31.9%), Irish (571 | 16.9%), English (332 | 9.9%), Polish (302 | 9.0%), and Mexican (289 | 8.6%), together accounting for 76.3% of all Essexville residents.
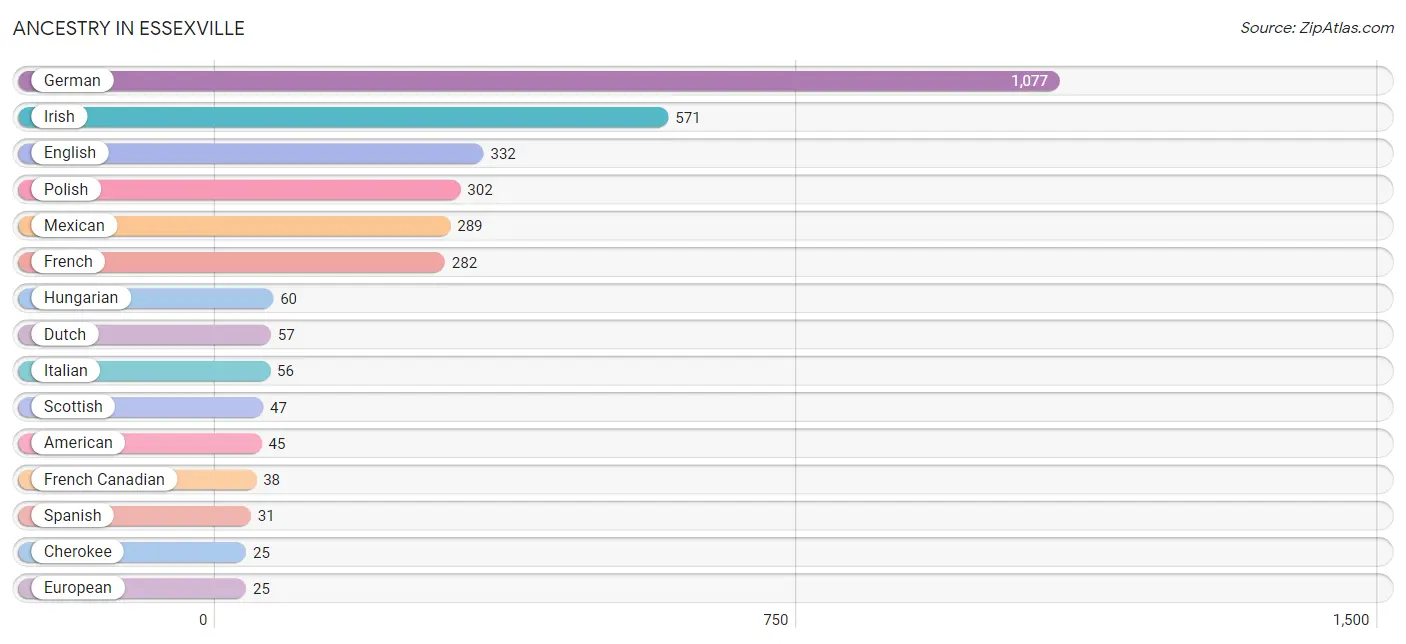
| Ancestry | # Population | % Population |
| Albanian | 16 | 0.5% |
| American | 45 | 1.3% |
| Belgian | 15 | 0.4% |
| British | 6 | 0.2% |
| Cherokee | 25 | 0.7% |
| Chippewa | 19 | 0.6% |
| Dutch | 57 | 1.7% |
| Eastern European | 10 | 0.3% |
| English | 332 | 9.9% |
| European | 25 | 0.7% |
| French | 282 | 8.4% |
| French Canadian | 38 | 1.1% |
| German | 1,077 | 31.9% |
| Hungarian | 60 | 1.8% |
| Irish | 571 | 16.9% |
| Italian | 56 | 1.7% |
| Latvian | 6 | 0.2% |
| Mexican | 289 | 8.6% |
| Northern European | 9 | 0.3% |
| Pennsylvania German | 9 | 0.3% |
| Polish | 302 | 9.0% |
| Scottish | 47 | 1.4% |
| Spanish | 31 | 0.9% |
| Swedish | 17 | 0.5% |
| Swiss | 18 | 0.5% | View All 25 Rows |
Immigrants in Essexville

| Immigration Origin | # Population | % Population | View All 0 Rows |
Sex and Age in Essexville
Sex and Age in Essexville
The most populous age groups in Essexville are 35 to 39 Years (218 | 12.4%) for men and 60 to 64 Years (176 | 10.9%) for women.
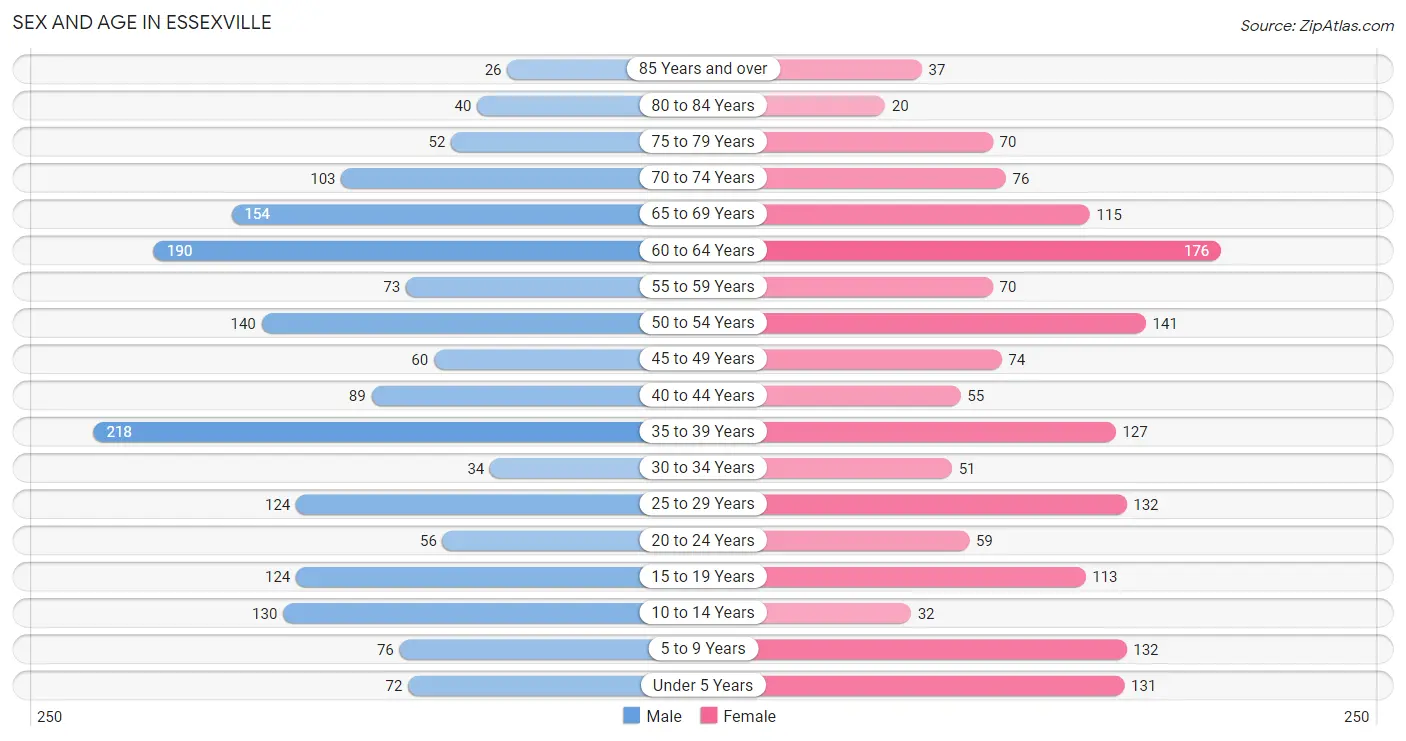
| Age Bracket | Male | Female |
| Under 5 Years | 72 (4.1%) | 131 (8.1%) |
| 5 to 9 Years | 76 (4.3%) | 132 (8.2%) |
| 10 to 14 Years | 130 (7.4%) | 32 (2.0%) |
| 15 to 19 Years | 124 (7.0%) | 113 (7.0%) |
| 20 to 24 Years | 56 (3.2%) | 59 (3.7%) |
| 25 to 29 Years | 124 (7.0%) | 132 (8.2%) |
| 30 to 34 Years | 34 (1.9%) | 51 (3.2%) |
| 35 to 39 Years | 218 (12.4%) | 127 (7.9%) |
| 40 to 44 Years | 89 (5.1%) | 55 (3.4%) |
| 45 to 49 Years | 60 (3.4%) | 74 (4.6%) |
| 50 to 54 Years | 140 (8.0%) | 141 (8.7%) |
| 55 to 59 Years | 73 (4.2%) | 70 (4.3%) |
| 60 to 64 Years | 190 (10.8%) | 176 (10.9%) |
| 65 to 69 Years | 154 (8.7%) | 115 (7.1%) |
| 70 to 74 Years | 103 (5.9%) | 76 (4.7%) |
| 75 to 79 Years | 52 (2.9%) | 70 (4.3%) |
| 80 to 84 Years | 40 (2.3%) | 20 (1.2%) |
| 85 Years and over | 26 (1.5%) | 37 (2.3%) |
| Total | 1,761 (100.0%) | 1,611 (100.0%) |
Families and Households in Essexville
Median Family Size in Essexville
The median family size in Essexville is 3.14 persons per family, with married-couple families (699 | 78.4%) accounting for the largest median family size of 3.24 persons per family. On the other hand, single female/mother families (113 | 12.7%) represent the smallest median family size with 2.56 persons per family.
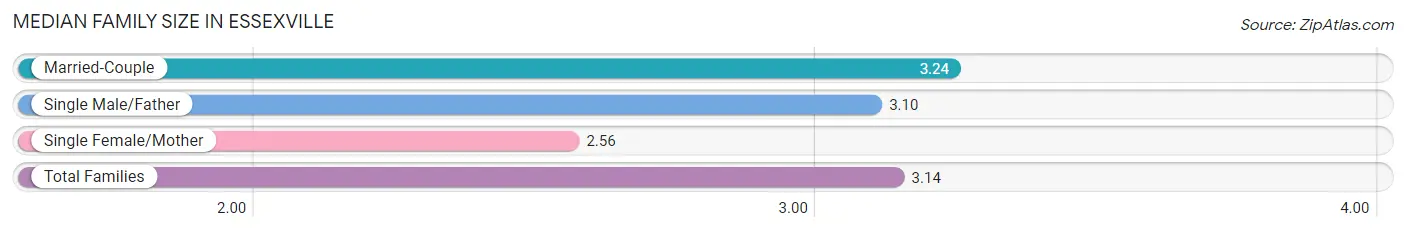
| Family Type | # Families | Family Size |
| Married-Couple | 699 (78.4%) | 3.24 |
| Single Male/Father | 79 (8.9%) | 3.10 |
| Single Female/Mother | 113 (12.7%) | 2.56 |
| Total Families | 891 (100.0%) | 3.14 |
Median Household Size in Essexville
The median household size in Essexville is 2.44 persons per household, with single male/father households (79 | 5.7%) accounting for the largest median household size of 3.52 persons per household. non-family households (488 | 35.4%) represent the smallest median household size with 1.09 persons per household.
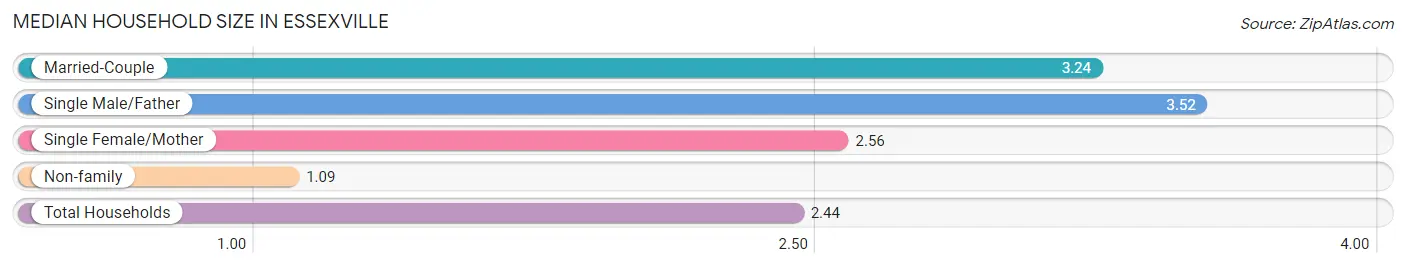
| Household Type | # Households | Household Size |
| Married-Couple | 699 (50.7%) | 3.24 |
| Single Male/Father | 79 (5.7%) | 3.52 |
| Single Female/Mother | 113 (8.2%) | 2.56 |
| Non-family | 488 (35.4%) | 1.09 |
| Total Households | 1,379 (100.0%) | 2.44 |
Household Size by Marriage Status in Essexville
Out of a total of 1,379 households in Essexville, 891 (64.6%) are family households, while 488 (35.4%) are nonfamily households. The most numerous type of family households are 2-person households, comprising 380, and the most common type of nonfamily households are 1-person households, comprising 443.
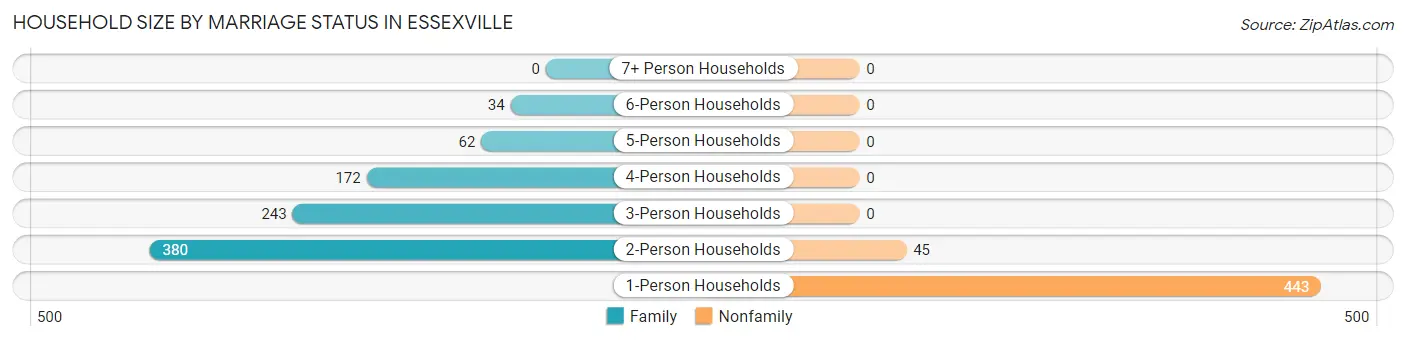
| Household Size | Family Households | Nonfamily Households |
| 1-Person Households | - | 443 (32.1%) |
| 2-Person Households | 380 (27.6%) | 45 (3.3%) |
| 3-Person Households | 243 (17.6%) | 0 (0.0%) |
| 4-Person Households | 172 (12.5%) | 0 (0.0%) |
| 5-Person Households | 62 (4.5%) | 0 (0.0%) |
| 6-Person Households | 34 (2.5%) | 0 (0.0%) |
| 7+ Person Households | 0 (0.0%) | 0 (0.0%) |
| Total | 891 (64.6%) | 488 (35.4%) |
Female Fertility in Essexville
Fertility by Age in Essexville
Average fertility rate in Essexville is 17.0 births per 1,000 women. Women in the age bracket of 20 to 34 years have the highest fertility rate with 21.0 births per 1,000 women. Women in the age bracket of 35 to 50 years acount for 54.5% of all women with births.
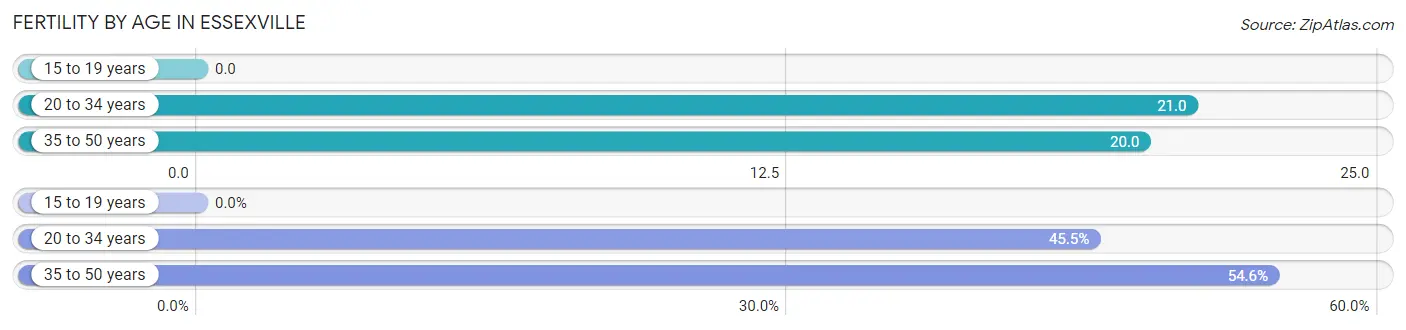
| Age Bracket | Women with Births | Births / 1,000 Women |
| 15 to 19 years | 0 (0.0%) | 0.0 |
| 20 to 34 years | 5 (45.5%) | 21.0 |
| 35 to 50 years | 6 (54.5%) | 20.0 |
| Total | 11 (100.0%) | 17.0 |
Fertility by Age by Marriage Status in Essexville
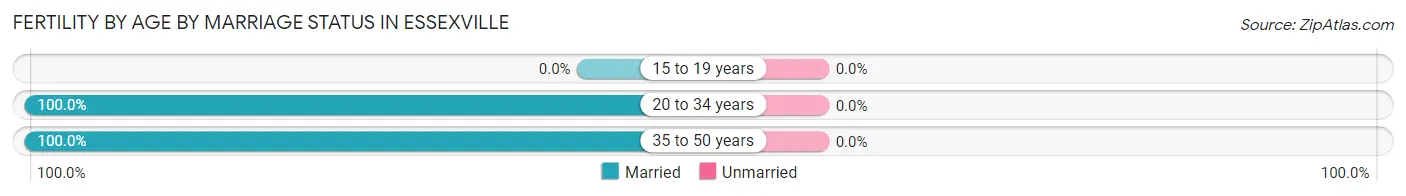
| Age Bracket | Married | Unmarried |
| 15 to 19 years | 0 (0.0%) | 0 (0.0%) |
| 20 to 34 years | 5 (100.0%) | 0 (0.0%) |
| 35 to 50 years | 6 (100.0%) | 0 (0.0%) |
| Total | 11 (100.0%) | 0 (0.0%) |
Fertility by Education in Essexville
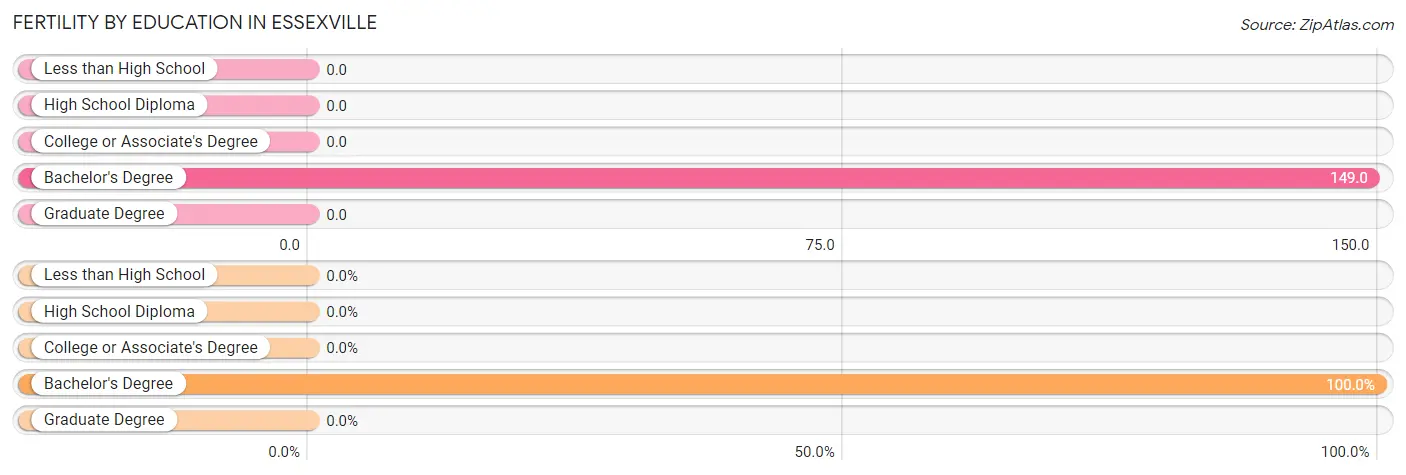
| Educational Attainment | Women with Births | Births / 1,000 Women |
| Less than High School | 0 (0.0%) | 0.0 |
| High School Diploma | 0 (0.0%) | 0.0 |
| College or Associate's Degree | 0 (0.0%) | 0.0 |
| Bachelor's Degree | 11 (100.0%) | 149.0 |
| Graduate Degree | 0 (0.0%) | 0.0 |
| Total | 11 (100.0%) | 17.0 |
Fertility by Education by Marriage Status in Essexville
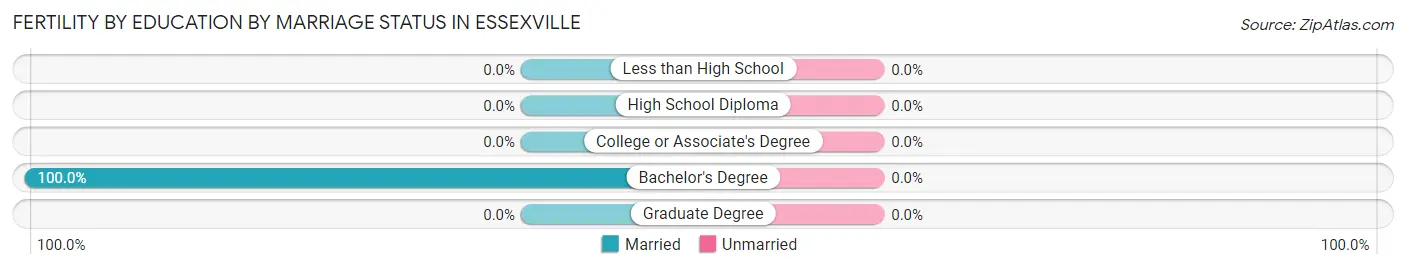
| Educational Attainment | Married | Unmarried |
| Less than High School | 0 (0.0%) | 0 (0.0%) |
| High School Diploma | 0 (0.0%) | 0 (0.0%) |
| College or Associate's Degree | 0 (0.0%) | 0 (0.0%) |
| Bachelor's Degree | 11 (100.0%) | 0 (0.0%) |
| Graduate Degree | 0 (0.0%) | 0 (0.0%) |
| Total | 11 (100.0%) | 0 (0.0%) |
Employment Characteristics in Essexville
Employment by Class of Employer in Essexville
Among the 1,471 employed individuals in Essexville, private company employees (998 | 67.8%), not-for-profit organizations (124 | 8.4%), and self-employed (incorporated) (107 | 7.3%) make up the most common classes of employment.
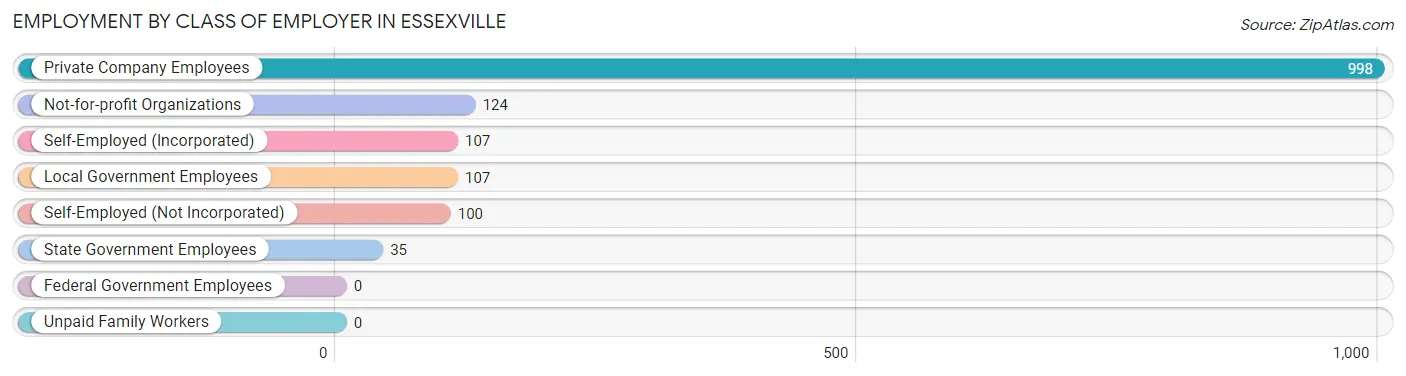
| Employer Class | # Employees | % Employees |
| Private Company Employees | 998 | 67.8% |
| Self-Employed (Incorporated) | 107 | 7.3% |
| Self-Employed (Not Incorporated) | 100 | 6.8% |
| Not-for-profit Organizations | 124 | 8.4% |
| Local Government Employees | 107 | 7.3% |
| State Government Employees | 35 | 2.4% |
| Federal Government Employees | 0 | 0.0% |
| Unpaid Family Workers | 0 | 0.0% |
| Total | 1,471 | 100.0% |
Employment Status by Age in Essexville
According to the labor force statistics for Essexville, out of the total population over 16 years of age (2,760), 55.7% or 1,537 individuals are in the labor force, with 2.9% or 45 of them unemployed. The age group with the highest labor force participation rate is 20 to 24 years, with 89.6% or 103 individuals in the labor force. Within the labor force, the 30 to 34 years age range has the highest percentage of unemployed individuals, with 12.7% or 8 of them being unemployed.
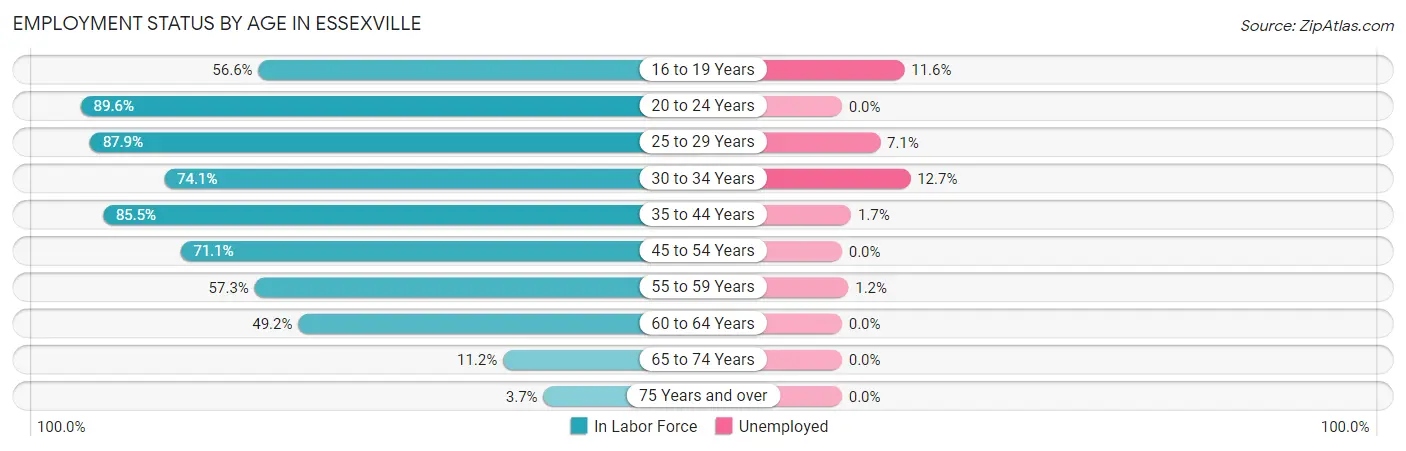
| Age Bracket | In Labor Force | Unemployed |
| 16 to 19 Years | 112 (56.6%) | 13 (11.6%) |
| 20 to 24 Years | 103 (89.6%) | 0 (0.0%) |
| 25 to 29 Years | 225 (87.9%) | 16 (7.1%) |
| 30 to 34 Years | 63 (74.1%) | 8 (12.7%) |
| 35 to 44 Years | 418 (85.5%) | 7 (1.7%) |
| 45 to 54 Years | 295 (71.1%) | 0 (0.0%) |
| 55 to 59 Years | 82 (57.3%) | 1 (1.2%) |
| 60 to 64 Years | 180 (49.2%) | 0 (0.0%) |
| 65 to 74 Years | 50 (11.2%) | 0 (0.0%) |
| 75 Years and over | 9 (3.7%) | 0 (0.0%) |
| Total | 1,537 (55.7%) | 45 (2.9%) |
Employment Status by Educational Attainment in Essexville
According to labor force statistics for Essexville, 72.0% of individuals (1,263) out of the total population between 25 and 64 years of age (1,754) are in the labor force, with 2.5% or 32 of them being unemployed. The group with the highest labor force participation rate are those with the educational attainment of college / associate degree, with 86.9% or 699 individuals in the labor force. Within the labor force, individuals with college / associate degree education have the highest percentage of unemployment, with 4.0% or 28 of them being unemployed.
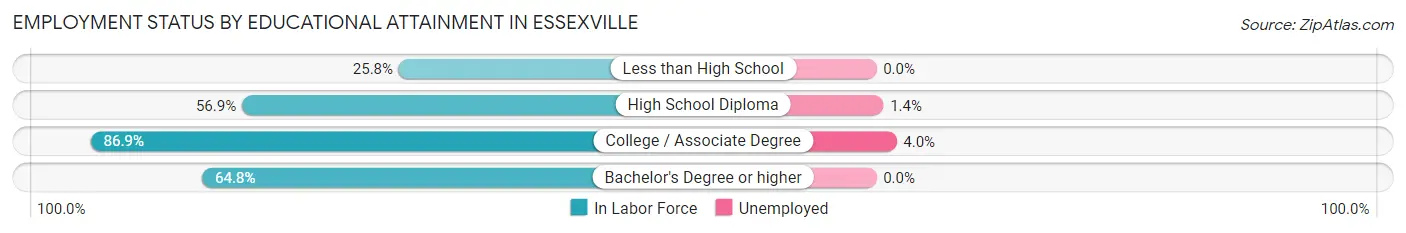
| Educational Attainment | In Labor Force | Unemployed |
| Less than High School | 8 (25.8%) | 0 (0.0%) |
| High School Diploma | 287 (56.9%) | 7 (1.4%) |
| College / Associate Degree | 699 (86.9%) | 32 (4.0%) |
| Bachelor's Degree or higher | 269 (64.8%) | 0 (0.0%) |
| Total | 1,263 (72.0%) | 44 (2.5%) |
Employment Occupations by Sex in Essexville
Management, Business, Science and Arts Occupations
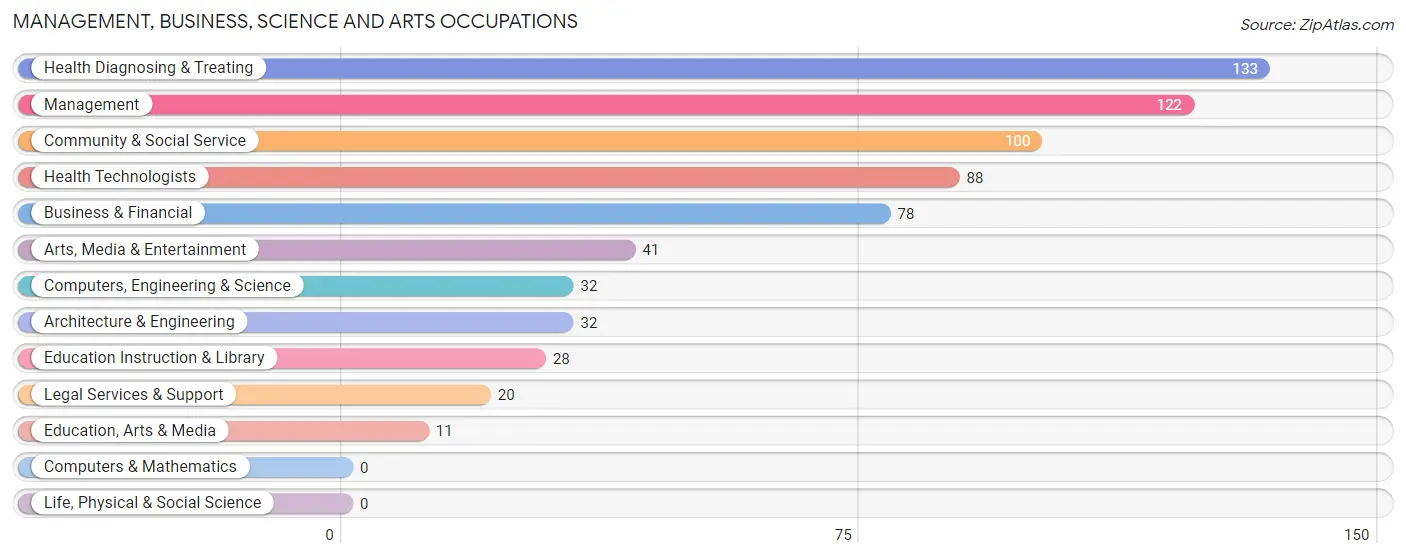
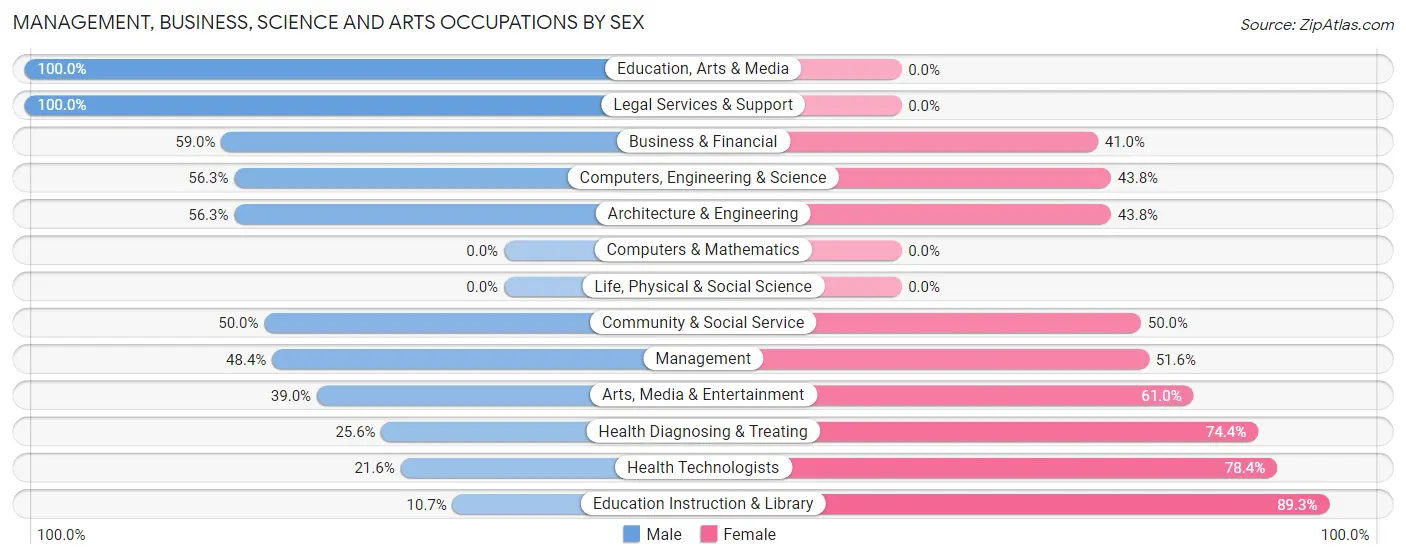
The most common Management, Business, Science and Arts occupations in Essexville are Health Diagnosing & Treating (133 | 8.9%), Management (122 | 8.2%), Community & Social Service (100 | 6.7%), Health Technologists (88 | 5.9%), and Business & Financial (78 | 5.2%).
Management, Business, Science and Arts Occupations by Sex
Within the Management, Business, Science and Arts occupations in Essexville, the most male-oriented occupations are Education, Arts & Media (100.0%), Legal Services & Support (100.0%), and Business & Financial (59.0%), while the most female-oriented occupations are Education Instruction & Library (89.3%), Health Technologists (78.4%), and Health Diagnosing & Treating (74.4%).
| Occupation | Male | Female |
| Management | 59 (48.4%) | 63 (51.6%) |
| Business & Financial | 46 (59.0%) | 32 (41.0%) |
| Computers, Engineering & Science | 18 (56.2%) | 14 (43.8%) |
| Computers & Mathematics | 0 (0.0%) | 0 (0.0%) |
| Architecture & Engineering | 18 (56.2%) | 14 (43.8%) |
| Life, Physical & Social Science | 0 (0.0%) | 0 (0.0%) |
| Community & Social Service | 50 (50.0%) | 50 (50.0%) |
| Education, Arts & Media | 11 (100.0%) | 0 (0.0%) |
| Legal Services & Support | 20 (100.0%) | 0 (0.0%) |
| Education Instruction & Library | 3 (10.7%) | 25 (89.3%) |
| Arts, Media & Entertainment | 16 (39.0%) | 25 (61.0%) |
| Health Diagnosing & Treating | 34 (25.6%) | 99 (74.4%) |
| Health Technologists | 19 (21.6%) | 69 (78.4%) |
| Total (Category) | 207 (44.5%) | 258 (55.5%) |
| Total (Overall) | 830 (55.6%) | 662 (44.4%) |
Services Occupations
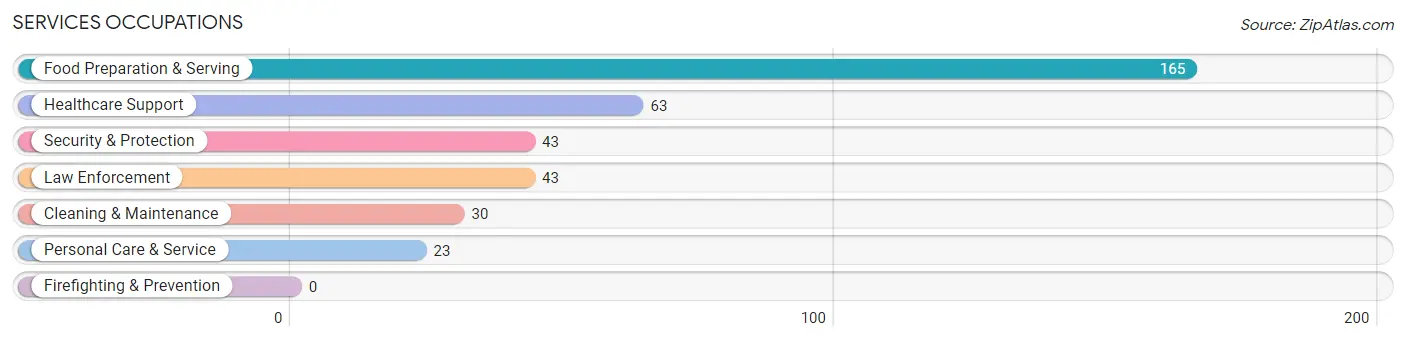
The most common Services occupations in Essexville are Food Preparation & Serving (165 | 11.1%), Healthcare Support (63 | 4.2%), Security & Protection (43 | 2.9%), Law Enforcement (43 | 2.9%), and Cleaning & Maintenance (30 | 2.0%).
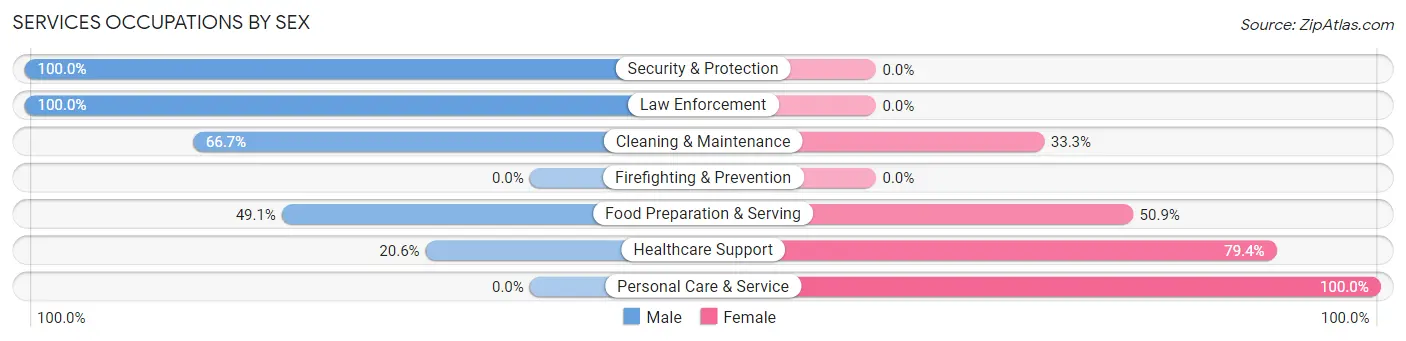
Services Occupations by Sex
Within the Services occupations in Essexville, the most male-oriented occupations are Security & Protection (100.0%), Law Enforcement (100.0%), and Cleaning & Maintenance (66.7%), while the most female-oriented occupations are Personal Care & Service (100.0%), Healthcare Support (79.4%), and Food Preparation & Serving (50.9%).
| Occupation | Male | Female |
| Healthcare Support | 13 (20.6%) | 50 (79.4%) |
| Security & Protection | 43 (100.0%) | 0 (0.0%) |
| Firefighting & Prevention | 0 (0.0%) | 0 (0.0%) |
| Law Enforcement | 43 (100.0%) | 0 (0.0%) |
| Food Preparation & Serving | 81 (49.1%) | 84 (50.9%) |
| Cleaning & Maintenance | 20 (66.7%) | 10 (33.3%) |
| Personal Care & Service | 0 (0.0%) | 23 (100.0%) |
| Total (Category) | 157 (48.5%) | 167 (51.5%) |
| Total (Overall) | 830 (55.6%) | 662 (44.4%) |
Sales and Office Occupations
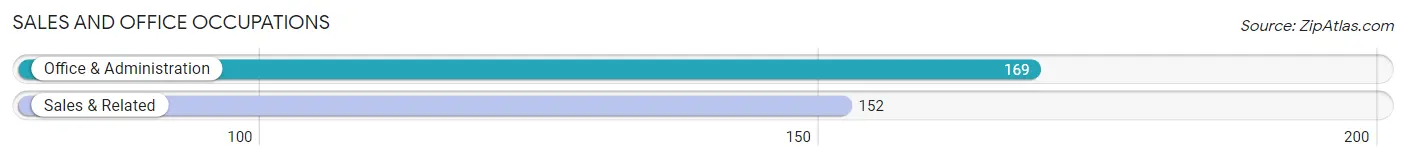
The most common Sales and Office occupations in Essexville are Office & Administration (169 | 11.3%), and Sales & Related (152 | 10.2%).
Sales and Office Occupations by Sex
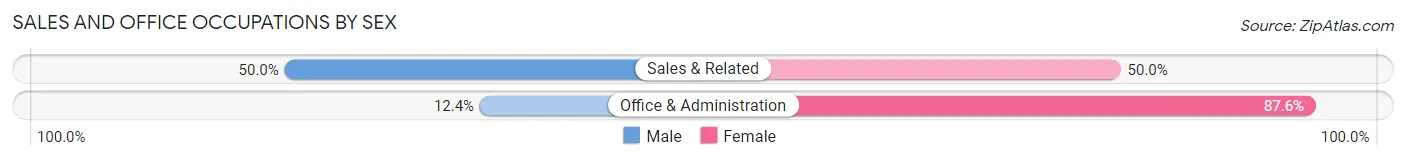
| Occupation | Male | Female |
| Sales & Related | 76 (50.0%) | 76 (50.0%) |
| Office & Administration | 21 (12.4%) | 148 (87.6%) |
| Total (Category) | 97 (30.2%) | 224 (69.8%) |
| Total (Overall) | 830 (55.6%) | 662 (44.4%) |
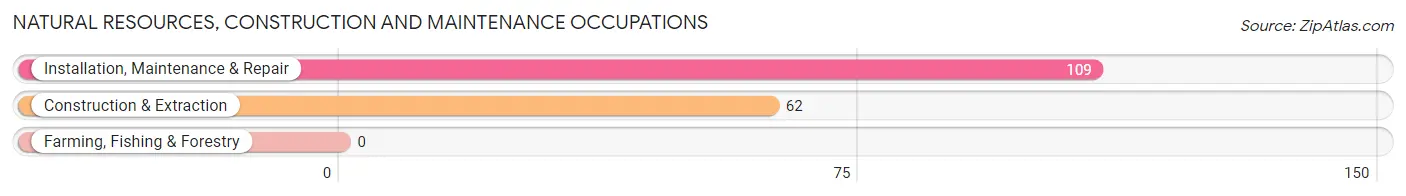
Natural Resources, Construction and Maintenance Occupations
The most common Natural Resources, Construction and Maintenance occupations in Essexville are Installation, Maintenance & Repair (109 | 7.3%), and Construction & Extraction (62 | 4.2%).
Natural Resources, Construction and Maintenance Occupations by Sex
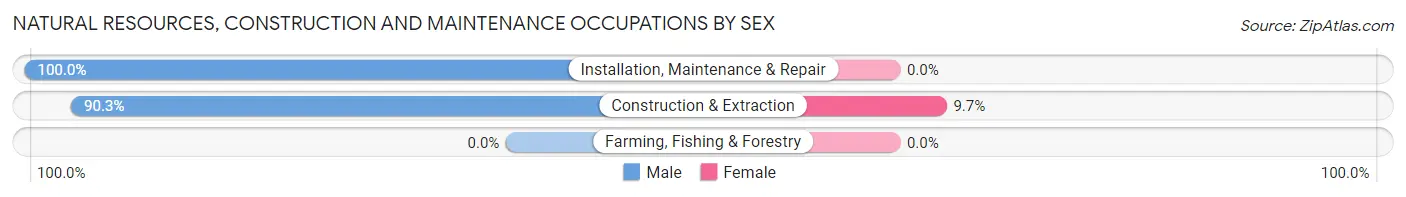
| Occupation | Male | Female |
| Farming, Fishing & Forestry | 0 (0.0%) | 0 (0.0%) |
| Construction & Extraction | 56 (90.3%) | 6 (9.7%) |
| Installation, Maintenance & Repair | 109 (100.0%) | 0 (0.0%) |
| Total (Category) | 165 (96.5%) | 6 (3.5%) |
| Total (Overall) | 830 (55.6%) | 662 (44.4%) |
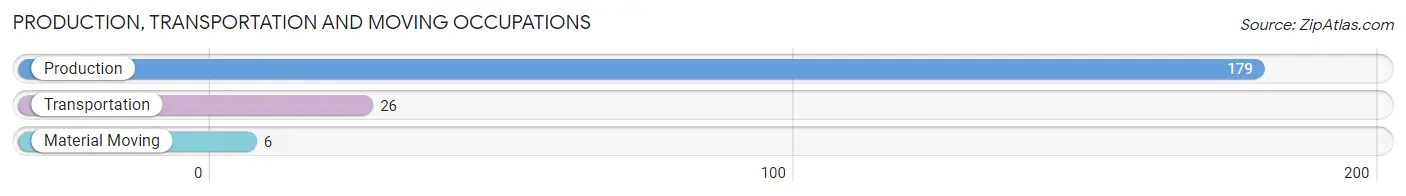
Production, Transportation and Moving Occupations
The most common Production, Transportation and Moving occupations in Essexville are Production (179 | 12.0%), Transportation (26 | 1.7%), and Material Moving (6 | 0.4%).
Production, Transportation and Moving Occupations by Sex
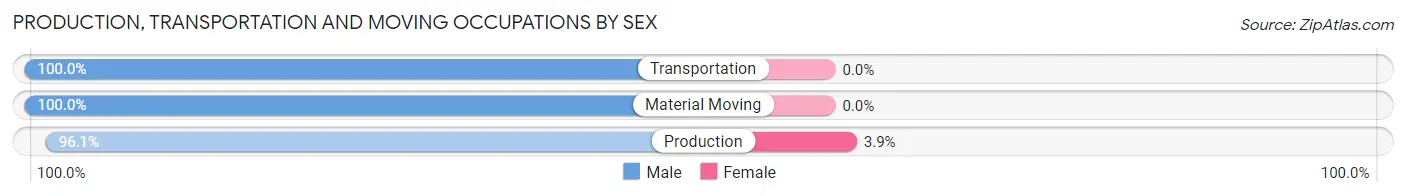
| Occupation | Male | Female |
| Production | 172 (96.1%) | 7 (3.9%) |
| Transportation | 26 (100.0%) | 0 (0.0%) |
| Material Moving | 6 (100.0%) | 0 (0.0%) |
| Total (Category) | 204 (96.7%) | 7 (3.3%) |
| Total (Overall) | 830 (55.6%) | 662 (44.4%) |
Employment Industries by Sex in Essexville
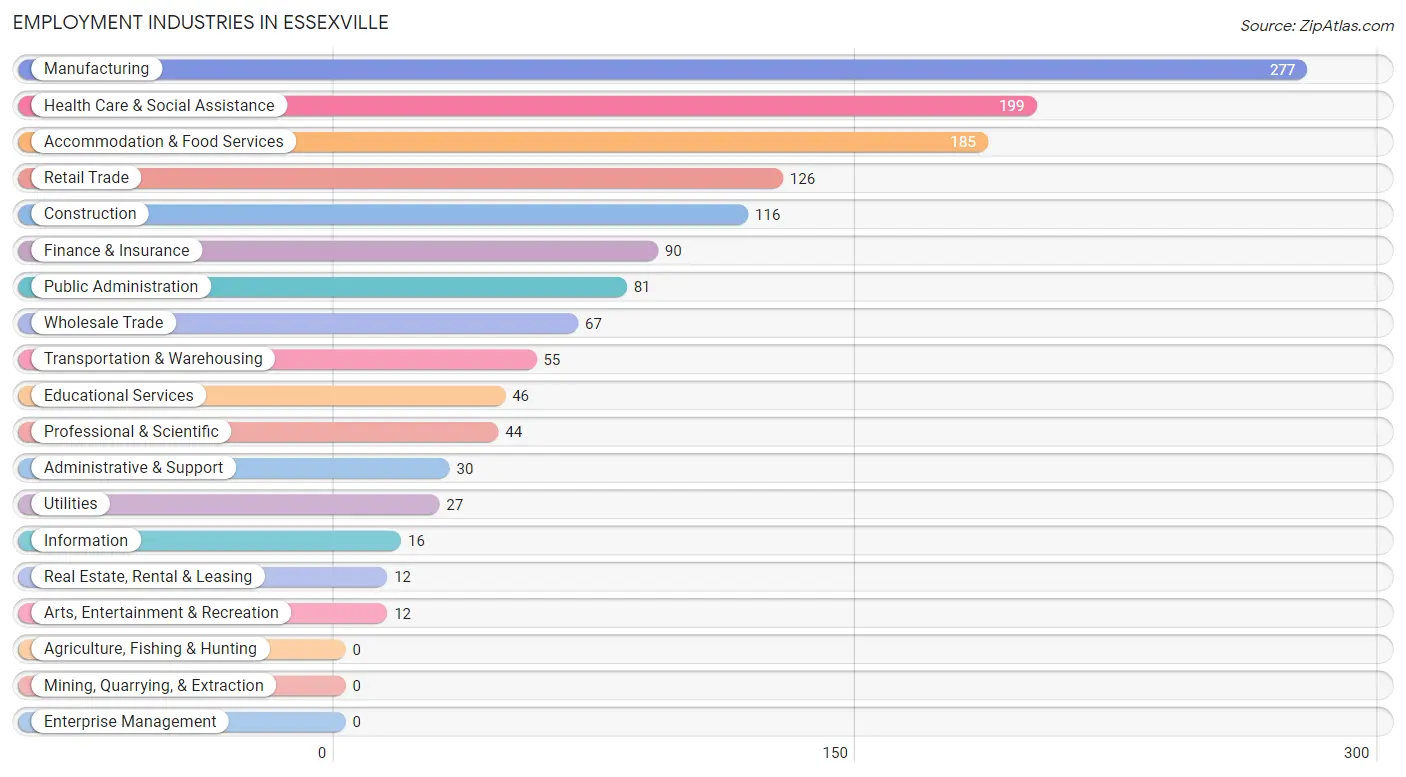
Employment Industries in Essexville
The major employment industries in Essexville include Manufacturing (277 | 18.6%), Health Care & Social Assistance (199 | 13.3%), Accommodation & Food Services (185 | 12.4%), Retail Trade (126 | 8.5%), and Construction (116 | 7.8%).
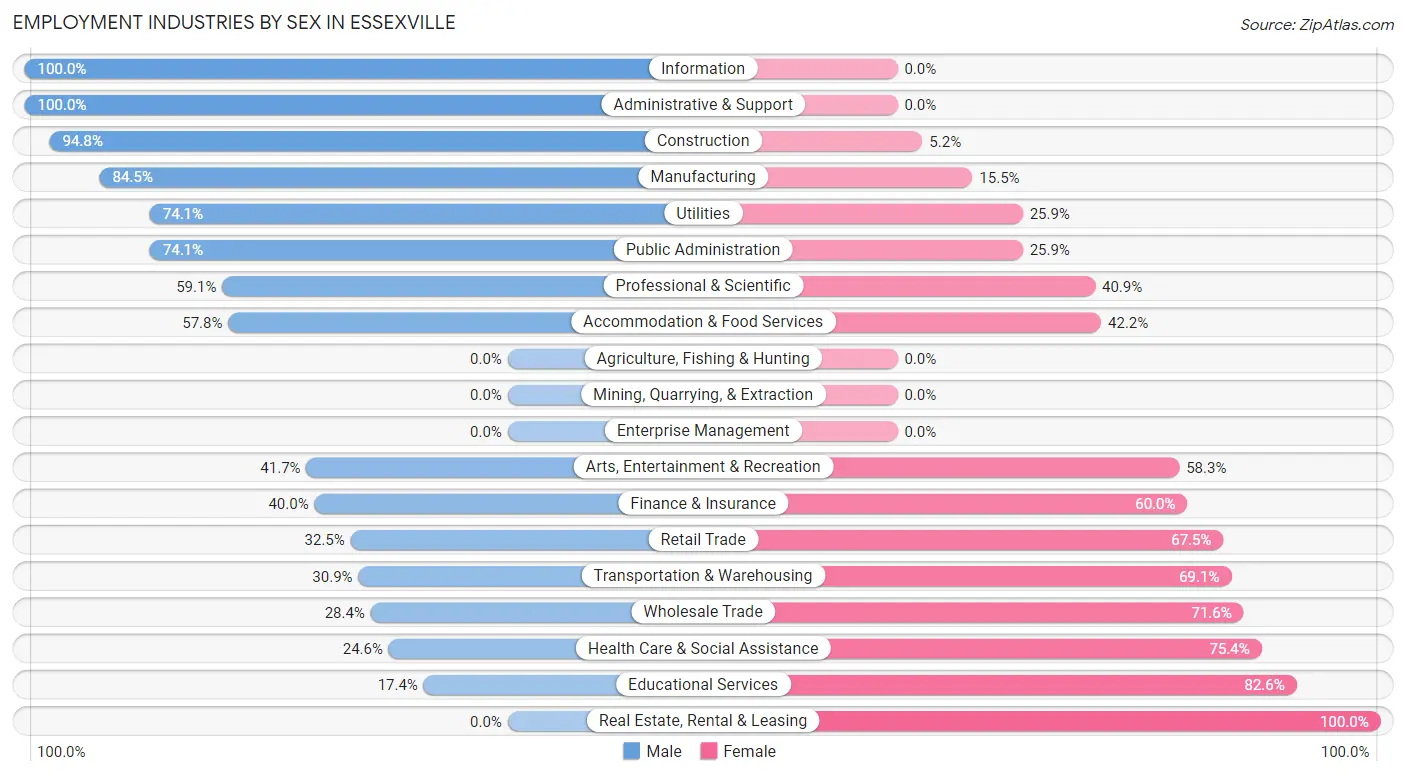
Employment Industries by Sex in Essexville
The Essexville industries that see more men than women are Information (100.0%), Administrative & Support (100.0%), and Construction (94.8%), whereas the industries that tend to have a higher number of women are Real Estate, Rental & Leasing (100.0%), Educational Services (82.6%), and Health Care & Social Assistance (75.4%).
| Industry | Male | Female |
| Agriculture, Fishing & Hunting | 0 (0.0%) | 0 (0.0%) |
| Mining, Quarrying, & Extraction | 0 (0.0%) | 0 (0.0%) |
| Construction | 110 (94.8%) | 6 (5.2%) |
| Manufacturing | 234 (84.5%) | 43 (15.5%) |
| Wholesale Trade | 19 (28.4%) | 48 (71.6%) |
| Retail Trade | 41 (32.5%) | 85 (67.5%) |
| Transportation & Warehousing | 17 (30.9%) | 38 (69.1%) |
| Utilities | 20 (74.1%) | 7 (25.9%) |
| Information | 16 (100.0%) | 0 (0.0%) |
| Finance & Insurance | 36 (40.0%) | 54 (60.0%) |
| Real Estate, Rental & Leasing | 0 (0.0%) | 12 (100.0%) |
| Professional & Scientific | 26 (59.1%) | 18 (40.9%) |
| Enterprise Management | 0 (0.0%) | 0 (0.0%) |
| Administrative & Support | 30 (100.0%) | 0 (0.0%) |
| Educational Services | 8 (17.4%) | 38 (82.6%) |
| Health Care & Social Assistance | 49 (24.6%) | 150 (75.4%) |
| Arts, Entertainment & Recreation | 5 (41.7%) | 7 (58.3%) |
| Accommodation & Food Services | 107 (57.8%) | 78 (42.2%) |
| Public Administration | 60 (74.1%) | 21 (25.9%) |
| Total | 830 (55.6%) | 662 (44.4%) |
Education in Essexville
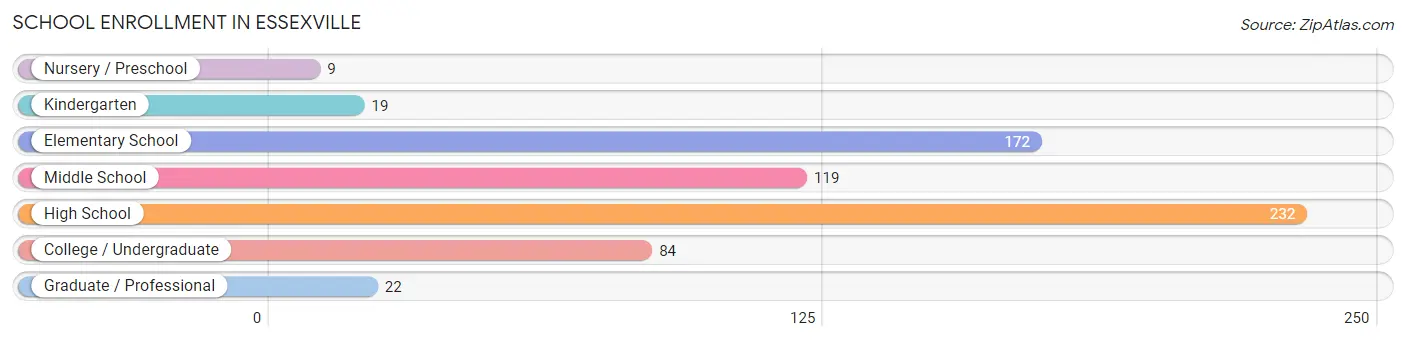
School Enrollment in Essexville
The most common levels of schooling among the 657 students in Essexville are high school (232 | 35.3%), elementary school (172 | 26.2%), and middle school (119 | 18.1%).
| School Level | # Students | % Students |
| Nursery / Preschool | 9 | 1.4% |
| Kindergarten | 19 | 2.9% |
| Elementary School | 172 | 26.2% |
| Middle School | 119 | 18.1% |
| High School | 232 | 35.3% |
| College / Undergraduate | 84 | 12.8% |
| Graduate / Professional | 22 | 3.4% |
| Total | 657 | 100.0% |
School Enrollment by Age by Funding Source in Essexville
Out of a total of 657 students who are enrolled in schools in Essexville, 48 (7.3%) attend a private institution, while the remaining 609 (92.7%) are enrolled in public schools. The age group of 3 to 4 year olds has the highest likelihood of being enrolled in private schools, with 9 (100.0% in the age bracket) enrolled. Conversely, the age group of 15 to 17 year olds has the lowest likelihood of being enrolled in a private school, with 214 (100.0% in the age bracket) attending a public institution.
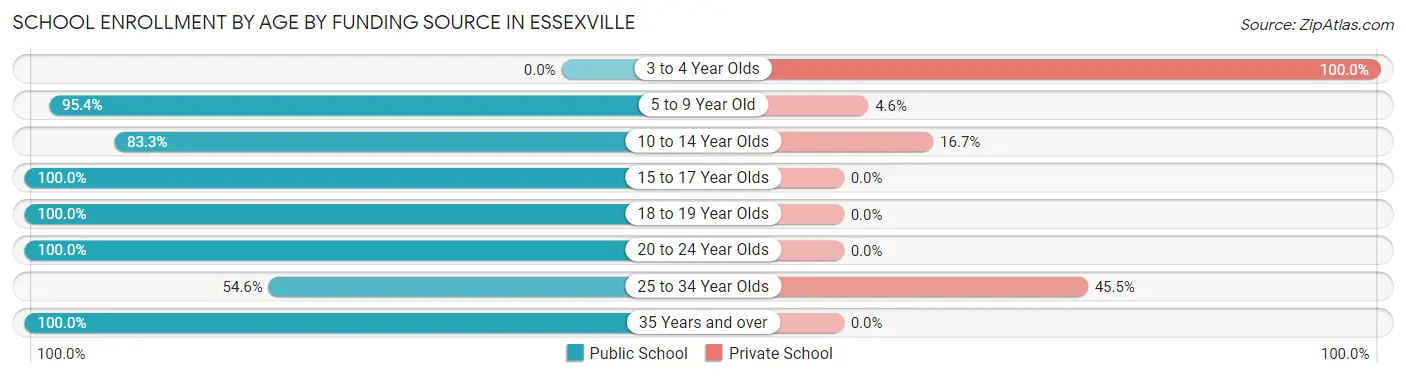
| Age Bracket | Public School | Private School |
| 3 to 4 Year Olds | 0 (0.0%) | 9 (100.0%) |
| 5 to 9 Year Old | 146 (95.4%) | 7 (4.6%) |
| 10 to 14 Year Olds | 135 (83.3%) | 27 (16.7%) |
| 15 to 17 Year Olds | 214 (100.0%) | 0 (0.0%) |
| 18 to 19 Year Olds | 15 (100.0%) | 0 (0.0%) |
| 20 to 24 Year Olds | 42 (100.0%) | 0 (0.0%) |
| 25 to 34 Year Olds | 6 (54.5%) | 5 (45.5%) |
| 35 Years and over | 51 (100.0%) | 0 (0.0%) |
| Total | 609 (92.7%) | 48 (7.3%) |
Educational Attainment by Field of Study in Essexville
Business (212 | 36.5%), education (104 | 17.9%), science & technology (75 | 12.9%), arts & humanities (44 | 7.6%), and visual & performing arts (40 | 6.9%) are the most common fields of study among 581 individuals in Essexville who have obtained a bachelor's degree or higher.
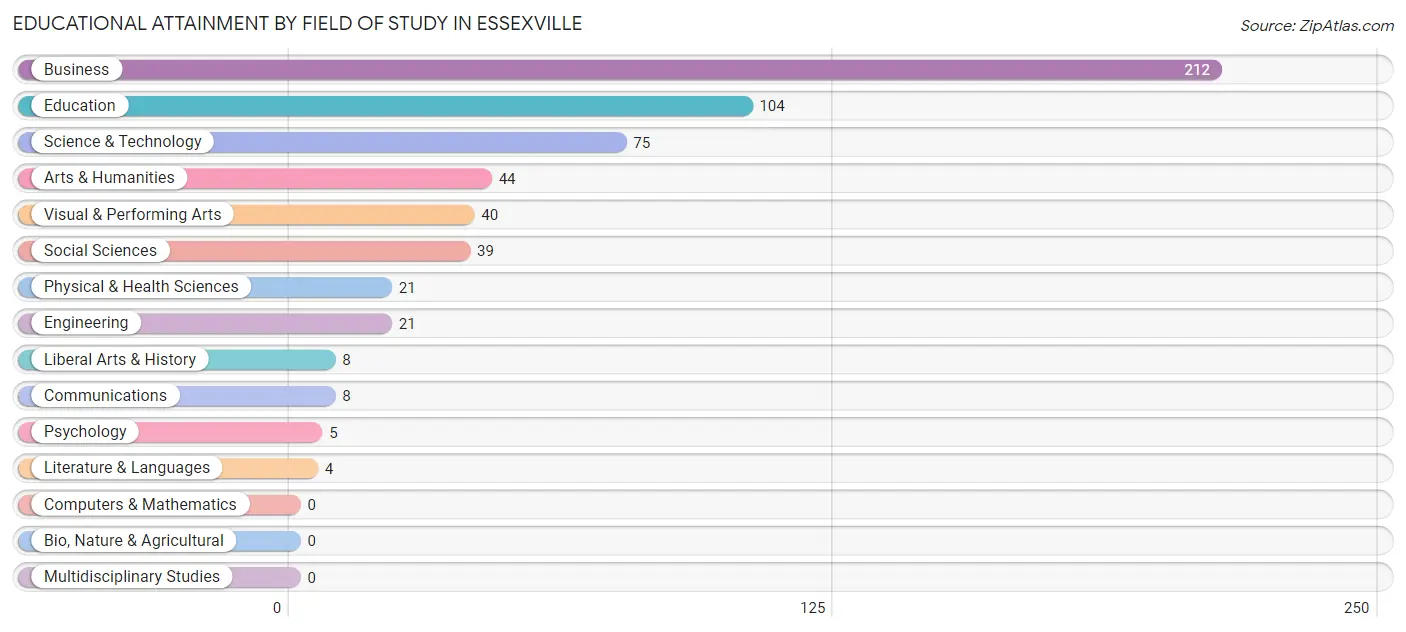
| Field of Study | # Graduates | % Graduates |
| Computers & Mathematics | 0 | 0.0% |
| Bio, Nature & Agricultural | 0 | 0.0% |
| Physical & Health Sciences | 21 | 3.6% |
| Psychology | 5 | 0.9% |
| Social Sciences | 39 | 6.7% |
| Engineering | 21 | 3.6% |
| Multidisciplinary Studies | 0 | 0.0% |
| Science & Technology | 75 | 12.9% |
| Business | 212 | 36.5% |
| Education | 104 | 17.9% |
| Literature & Languages | 4 | 0.7% |
| Liberal Arts & History | 8 | 1.4% |
| Visual & Performing Arts | 40 | 6.9% |
| Communications | 8 | 1.4% |
| Arts & Humanities | 44 | 7.6% |
| Total | 581 | 100.0% |
Transportation & Commute in Essexville
Vehicle Availability by Sex in Essexville
The most prevalent vehicle ownership categories in Essexville are males with 3 vehicles (289, accounting for 35.3%) and females with 3 vehicles (217, making up 44.3%).
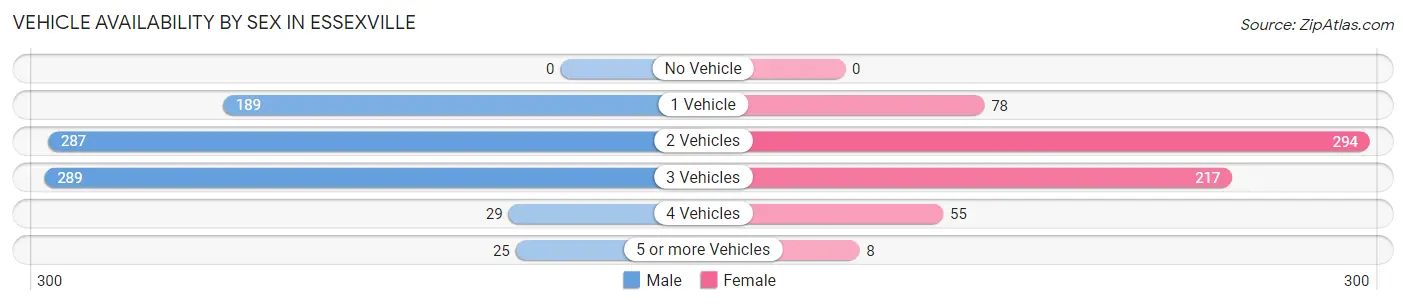
| Vehicles Available | Male | Female |
| No Vehicle | 0 (0.0%) | 0 (0.0%) |
| 1 Vehicle | 189 (23.1%) | 78 (12.0%) |
| 2 Vehicles | 287 (35.0%) | 294 (45.1%) |
| 3 Vehicles | 289 (35.3%) | 217 (33.3%) |
| 4 Vehicles | 29 (3.5%) | 55 (8.4%) |
| 5 or more Vehicles | 25 (3.0%) | 8 (1.2%) |
| Total | 819 (100.0%) | 652 (100.0%) |
Commute Time in Essexville
The most frequently occuring commute durations in Essexville are 10 to 14 minutes (336 commuters, 25.0%), 5 to 9 minutes (329 commuters, 24.5%), and 30 to 34 minutes (195 commuters, 14.5%).
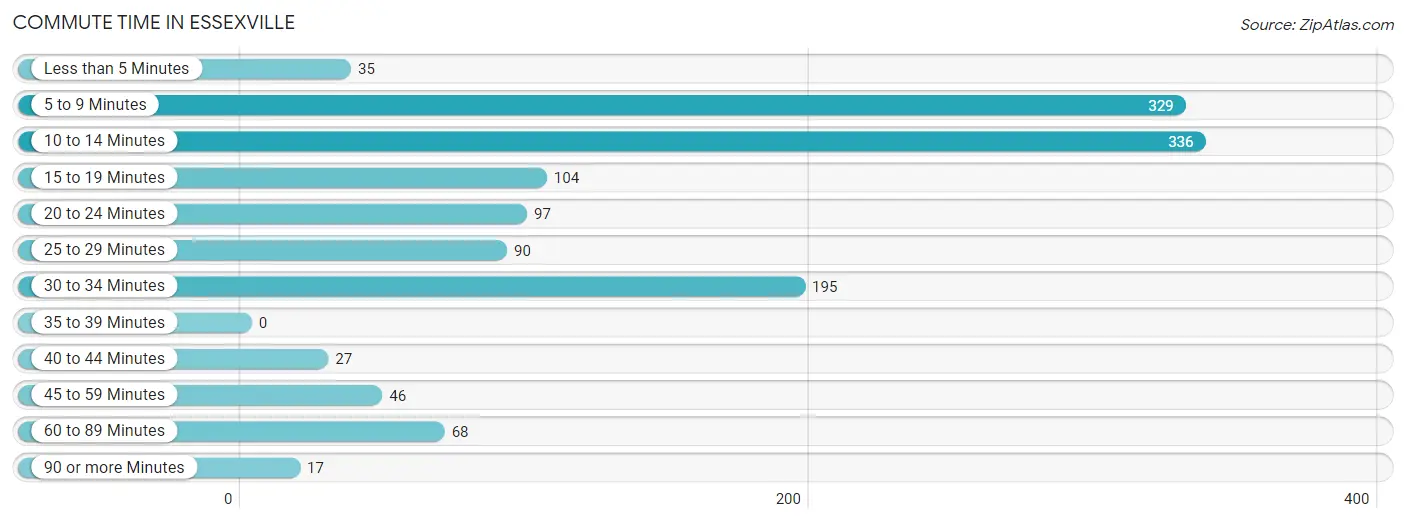
| Commute Time | # Commuters | % Commuters |
| Less than 5 Minutes | 35 | 2.6% |
| 5 to 9 Minutes | 329 | 24.5% |
| 10 to 14 Minutes | 336 | 25.0% |
| 15 to 19 Minutes | 104 | 7.7% |
| 20 to 24 Minutes | 97 | 7.2% |
| 25 to 29 Minutes | 90 | 6.7% |
| 30 to 34 Minutes | 195 | 14.5% |
| 35 to 39 Minutes | 0 | 0.0% |
| 40 to 44 Minutes | 27 | 2.0% |
| 45 to 59 Minutes | 46 | 3.4% |
| 60 to 89 Minutes | 68 | 5.1% |
| 90 or more Minutes | 17 | 1.3% |
Commute Time by Sex in Essexville
The most common commute times in Essexville are 10 to 14 minutes (276 commuters, 35.3%) for males and 5 to 9 minutes (179 commuters, 31.9%) for females.
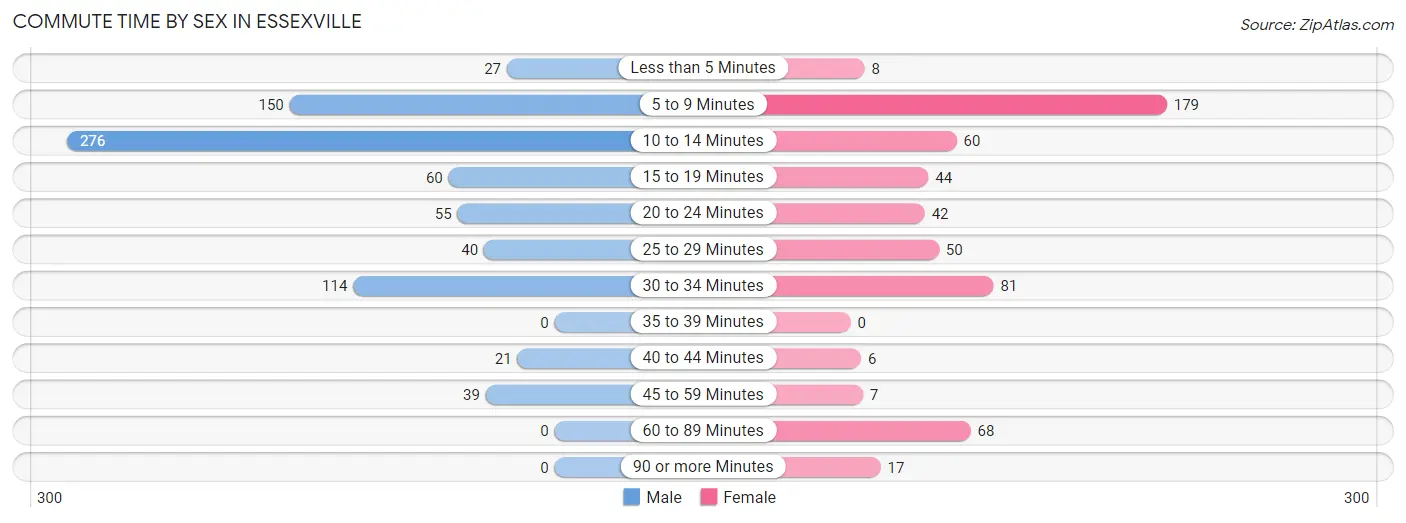
| Commute Time | Male | Female |
| Less than 5 Minutes | 27 (3.5%) | 8 (1.4%) |
| 5 to 9 Minutes | 150 (19.2%) | 179 (31.9%) |
| 10 to 14 Minutes | 276 (35.3%) | 60 (10.7%) |
| 15 to 19 Minutes | 60 (7.7%) | 44 (7.8%) |
| 20 to 24 Minutes | 55 (7.0%) | 42 (7.5%) |
| 25 to 29 Minutes | 40 (5.1%) | 50 (8.9%) |
| 30 to 34 Minutes | 114 (14.6%) | 81 (14.4%) |
| 35 to 39 Minutes | 0 (0.0%) | 0 (0.0%) |
| 40 to 44 Minutes | 21 (2.7%) | 6 (1.1%) |
| 45 to 59 Minutes | 39 (5.0%) | 7 (1.3%) |
| 60 to 89 Minutes | 0 (0.0%) | 68 (12.1%) |
| 90 or more Minutes | 0 (0.0%) | 17 (3.0%) |
Time of Departure to Work by Sex in Essexville
The most frequent times of departure to work in Essexville are 6:00 AM to 6:29 AM (202, 25.8%) for males and 6:00 AM to 6:29 AM (137, 24.4%) for females.
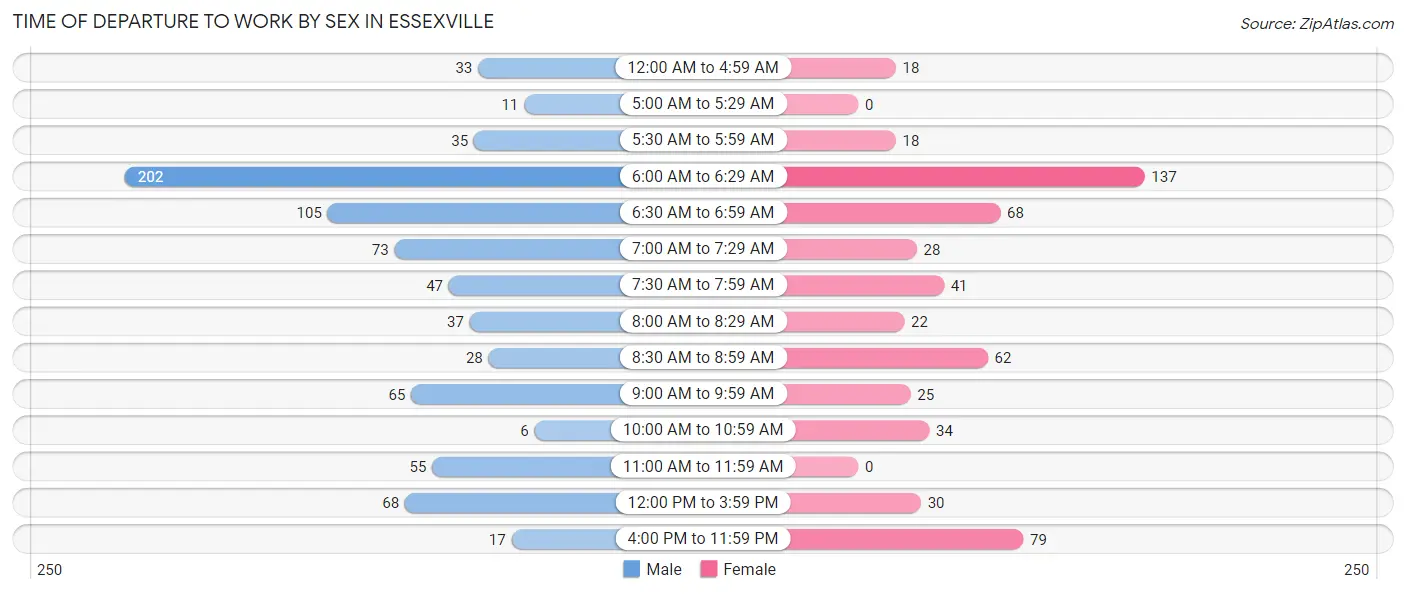
| Time of Departure | Male | Female |
| 12:00 AM to 4:59 AM | 33 (4.2%) | 18 (3.2%) |
| 5:00 AM to 5:29 AM | 11 (1.4%) | 0 (0.0%) |
| 5:30 AM to 5:59 AM | 35 (4.5%) | 18 (3.2%) |
| 6:00 AM to 6:29 AM | 202 (25.8%) | 137 (24.4%) |
| 6:30 AM to 6:59 AM | 105 (13.4%) | 68 (12.1%) |
| 7:00 AM to 7:29 AM | 73 (9.3%) | 28 (5.0%) |
| 7:30 AM to 7:59 AM | 47 (6.0%) | 41 (7.3%) |
| 8:00 AM to 8:29 AM | 37 (4.7%) | 22 (3.9%) |
| 8:30 AM to 8:59 AM | 28 (3.6%) | 62 (11.0%) |
| 9:00 AM to 9:59 AM | 65 (8.3%) | 25 (4.4%) |
| 10:00 AM to 10:59 AM | 6 (0.8%) | 34 (6.0%) |
| 11:00 AM to 11:59 AM | 55 (7.0%) | 0 (0.0%) |
| 12:00 PM to 3:59 PM | 68 (8.7%) | 30 (5.3%) |
| 4:00 PM to 11:59 PM | 17 (2.2%) | 79 (14.1%) |
| Total | 782 (100.0%) | 562 (100.0%) |
Housing Occupancy in Essexville
Occupancy by Ownership in Essexville
Of the total 1,379 dwellings in Essexville, owner-occupied units account for 1,261 (91.4%), while renter-occupied units make up 118 (8.6%).
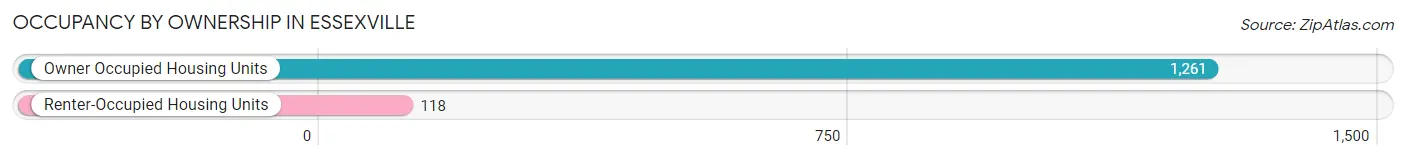
| Occupancy | # Housing Units | % Housing Units |
| Owner Occupied Housing Units | 1,261 | 91.4% |
| Renter-Occupied Housing Units | 118 | 8.6% |
| Total Occupied Housing Units | 1,379 | 100.0% |
Occupancy by Household Size in Essexville
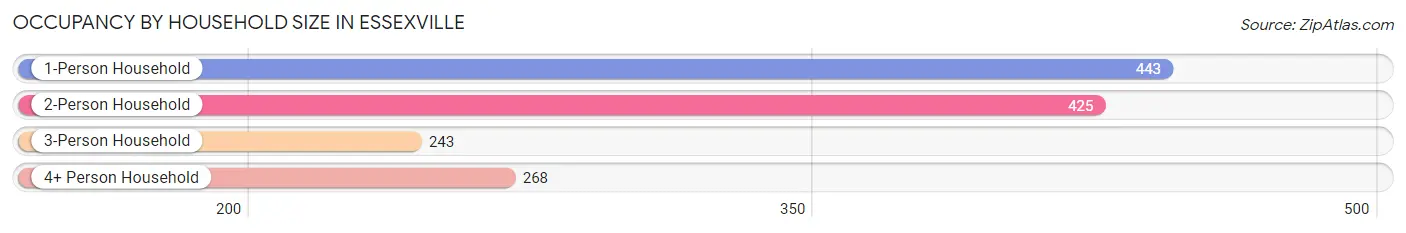
| Household Size | # Housing Units | % Housing Units |
| 1-Person Household | 443 | 32.1% |
| 2-Person Household | 425 | 30.8% |
| 3-Person Household | 243 | 17.6% |
| 4+ Person Household | 268 | 19.4% |
| Total Housing Units | 1,379 | 100.0% |
Occupancy by Ownership by Household Size in Essexville
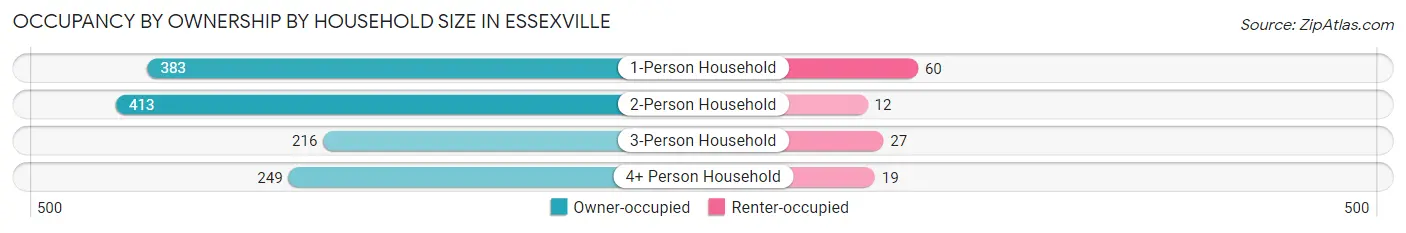
| Household Size | Owner-occupied | Renter-occupied |
| 1-Person Household | 383 (86.5%) | 60 (13.5%) |
| 2-Person Household | 413 (97.2%) | 12 (2.8%) |
| 3-Person Household | 216 (88.9%) | 27 (11.1%) |
| 4+ Person Household | 249 (92.9%) | 19 (7.1%) |
| Total Housing Units | 1,261 (91.4%) | 118 (8.6%) |
Occupancy by Educational Attainment in Essexville
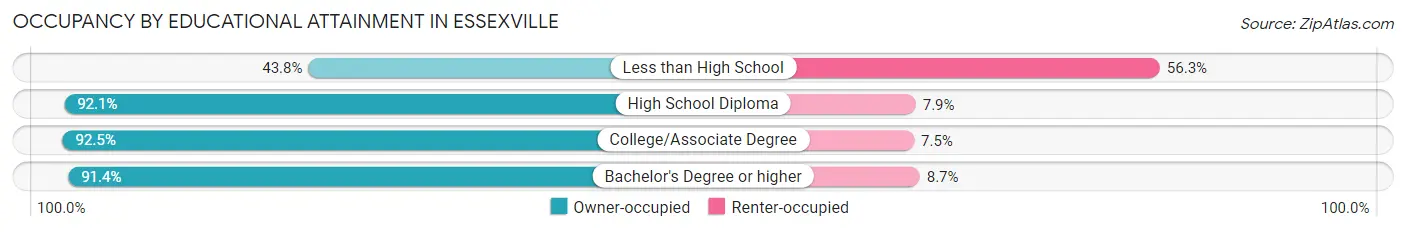
| Household Size | Owner-occupied | Renter-occupied |
| Less than High School | 7 (43.8%) | 9 (56.2%) |
| High School Diploma | 375 (92.1%) | 32 (7.9%) |
| College/Associate Degree | 467 (92.5%) | 38 (7.5%) |
| Bachelor's Degree or higher | 412 (91.3%) | 39 (8.6%) |
Occupancy by Age of Householder in Essexville
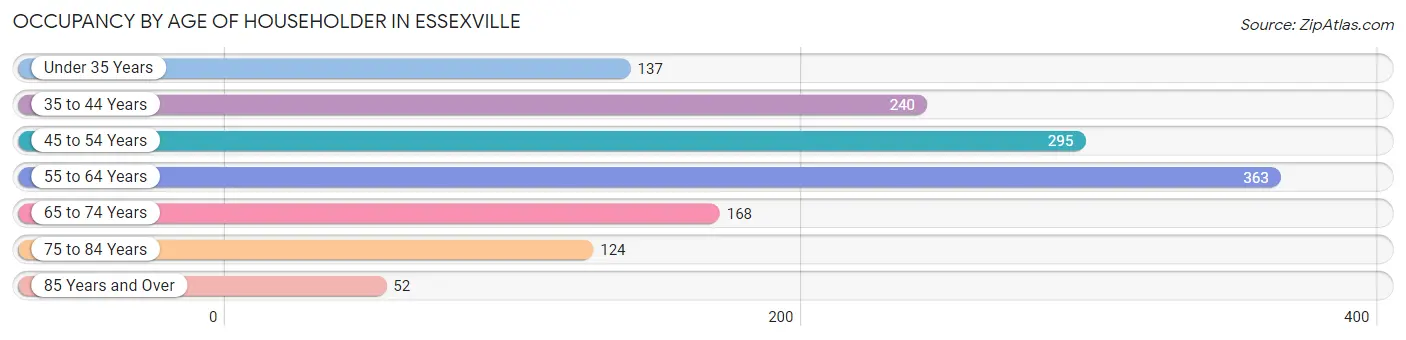
| Age Bracket | # Households | % Households |
| Under 35 Years | 137 | 9.9% |
| 35 to 44 Years | 240 | 17.4% |
| 45 to 54 Years | 295 | 21.4% |
| 55 to 64 Years | 363 | 26.3% |
| 65 to 74 Years | 168 | 12.2% |
| 75 to 84 Years | 124 | 9.0% |
| 85 Years and Over | 52 | 3.8% |
| Total | 1,379 | 100.0% |
Housing Finances in Essexville
Median Income by Occupancy in Essexville
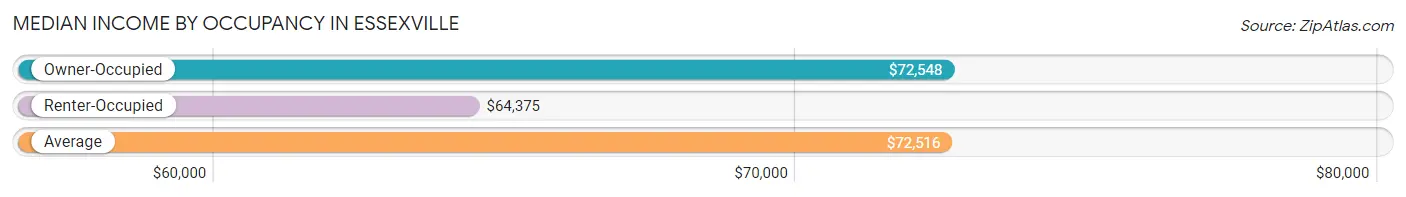
| Occupancy Type | # Households | Median Income |
| Owner-Occupied | 1,261 (91.4%) | $72,548 |
| Renter-Occupied | 118 (8.6%) | $64,375 |
| Average | 1,379 (100.0%) | $72,516 |
Occupancy by Householder Income Bracket in Essexville
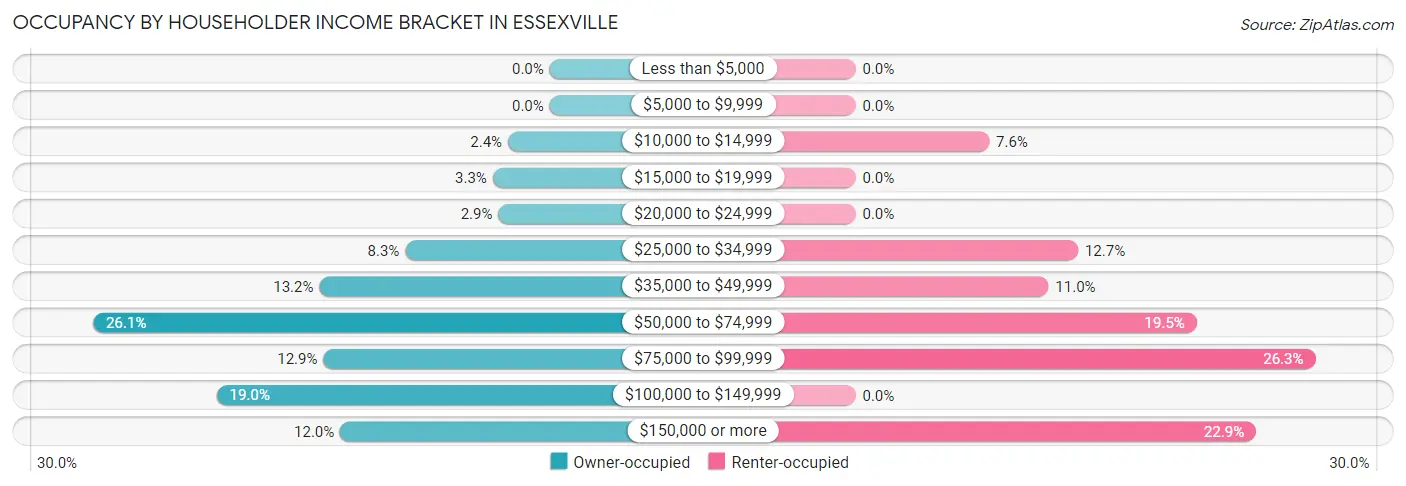
| Income Bracket | Owner-occupied | Renter-occupied |
| Less than $5,000 | 0 (0.0%) | 0 (0.0%) |
| $5,000 to $9,999 | 0 (0.0%) | 0 (0.0%) |
| $10,000 to $14,999 | 30 (2.4%) | 9 (7.6%) |
| $15,000 to $19,999 | 41 (3.3%) | 0 (0.0%) |
| $20,000 to $24,999 | 37 (2.9%) | 0 (0.0%) |
| $25,000 to $34,999 | 104 (8.3%) | 15 (12.7%) |
| $35,000 to $49,999 | 166 (13.2%) | 13 (11.0%) |
| $50,000 to $74,999 | 329 (26.1%) | 23 (19.5%) |
| $75,000 to $99,999 | 163 (12.9%) | 31 (26.3%) |
| $100,000 to $149,999 | 240 (19.0%) | 0 (0.0%) |
| $150,000 or more | 151 (12.0%) | 27 (22.9%) |
| Total | 1,261 (100.0%) | 118 (100.0%) |
Monthly Housing Cost Tiers in Essexville
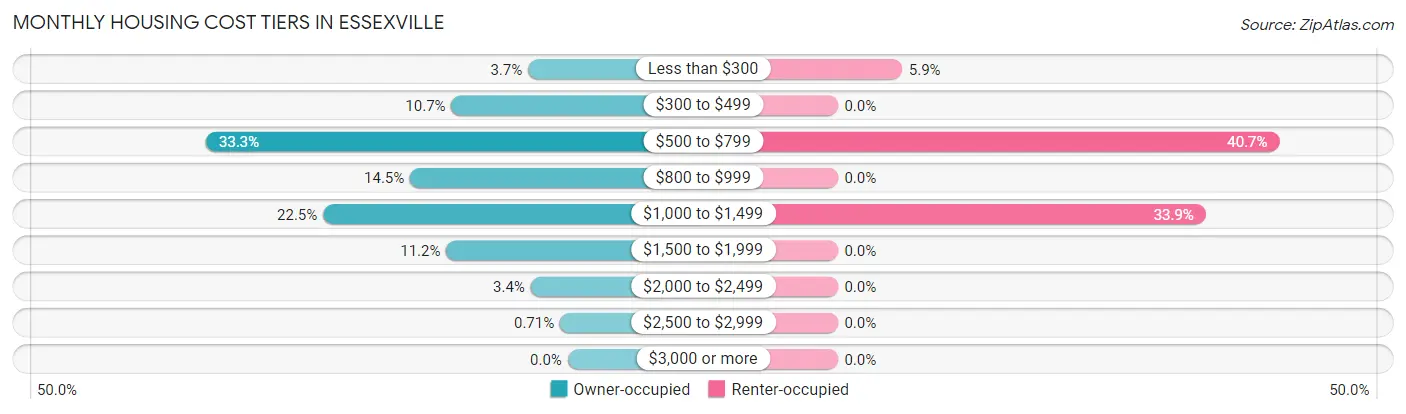
| Monthly Cost | Owner-occupied | Renter-occupied |
| Less than $300 | 46 (3.6%) | 7 (5.9%) |
| $300 to $499 | 135 (10.7%) | 0 (0.0%) |
| $500 to $799 | 420 (33.3%) | 48 (40.7%) |
| $800 to $999 | 183 (14.5%) | 0 (0.0%) |
| $1,000 to $1,499 | 284 (22.5%) | 40 (33.9%) |
| $1,500 to $1,999 | 141 (11.2%) | 0 (0.0%) |
| $2,000 to $2,499 | 43 (3.4%) | 0 (0.0%) |
| $2,500 to $2,999 | 9 (0.7%) | 0 (0.0%) |
| $3,000 or more | 0 (0.0%) | 0 (0.0%) |
| Total | 1,261 (100.0%) | 118 (100.0%) |
Physical Housing Characteristics in Essexville
Housing Structures in Essexville
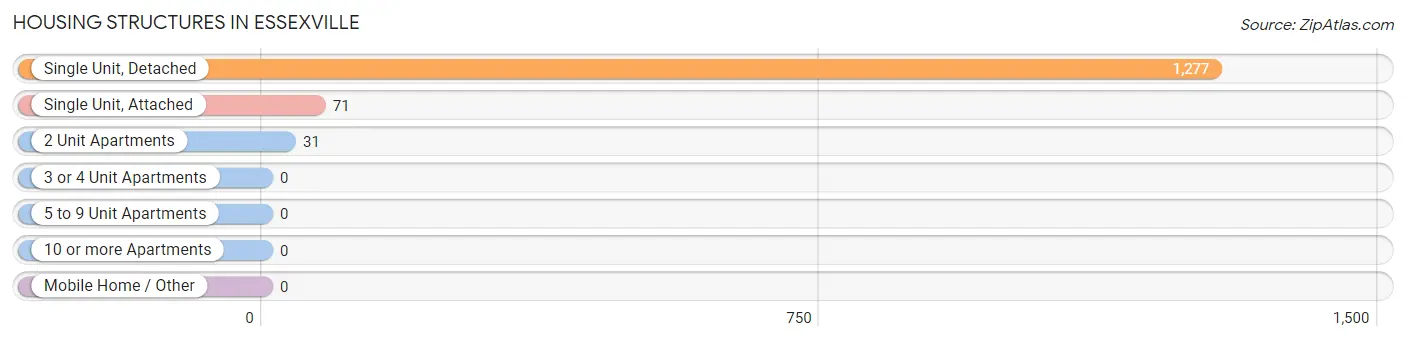
| Structure Type | # Housing Units | % Housing Units |
| Single Unit, Detached | 1,277 | 92.6% |
| Single Unit, Attached | 71 | 5.1% |
| 2 Unit Apartments | 31 | 2.2% |
| 3 or 4 Unit Apartments | 0 | 0.0% |
| 5 to 9 Unit Apartments | 0 | 0.0% |
| 10 or more Apartments | 0 | 0.0% |
| Mobile Home / Other | 0 | 0.0% |
| Total | 1,379 | 100.0% |
Housing Structures by Occupancy in Essexville
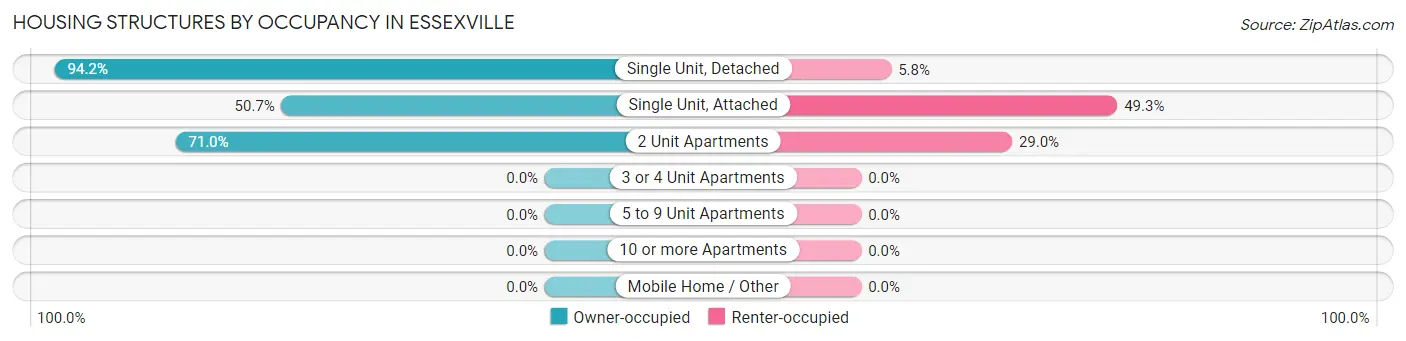
| Structure Type | Owner-occupied | Renter-occupied |
| Single Unit, Detached | 1,203 (94.2%) | 74 (5.8%) |
| Single Unit, Attached | 36 (50.7%) | 35 (49.3%) |
| 2 Unit Apartments | 22 (71.0%) | 9 (29.0%) |
| 3 or 4 Unit Apartments | 0 (0.0%) | 0 (0.0%) |
| 5 to 9 Unit Apartments | 0 (0.0%) | 0 (0.0%) |
| 10 or more Apartments | 0 (0.0%) | 0 (0.0%) |
| Mobile Home / Other | 0 (0.0%) | 0 (0.0%) |
| Total | 1,261 (91.4%) | 118 (8.6%) |
Housing Structures by Number of Rooms in Essexville
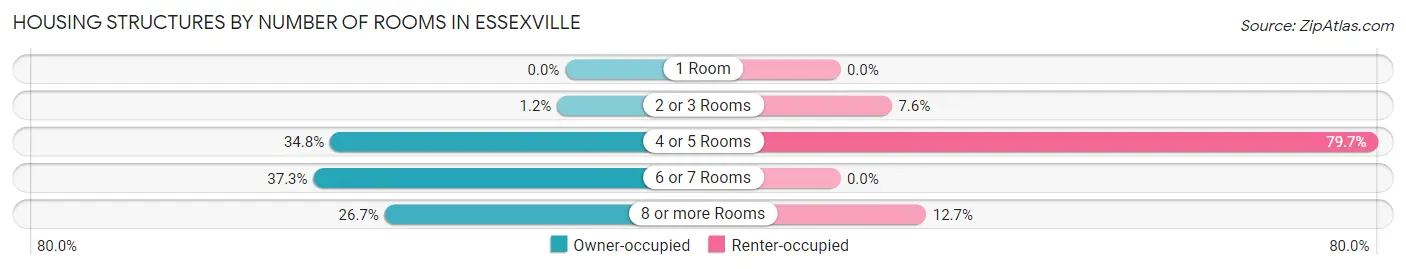
| Number of Rooms | Owner-occupied | Renter-occupied |
| 1 Room | 0 (0.0%) | 0 (0.0%) |
| 2 or 3 Rooms | 15 (1.2%) | 9 (7.6%) |
| 4 or 5 Rooms | 439 (34.8%) | 94 (79.7%) |
| 6 or 7 Rooms | 470 (37.3%) | 0 (0.0%) |
| 8 or more Rooms | 337 (26.7%) | 15 (12.7%) |
| Total | 1,261 (100.0%) | 118 (100.0%) |
Housing Structure by Heating Type in Essexville
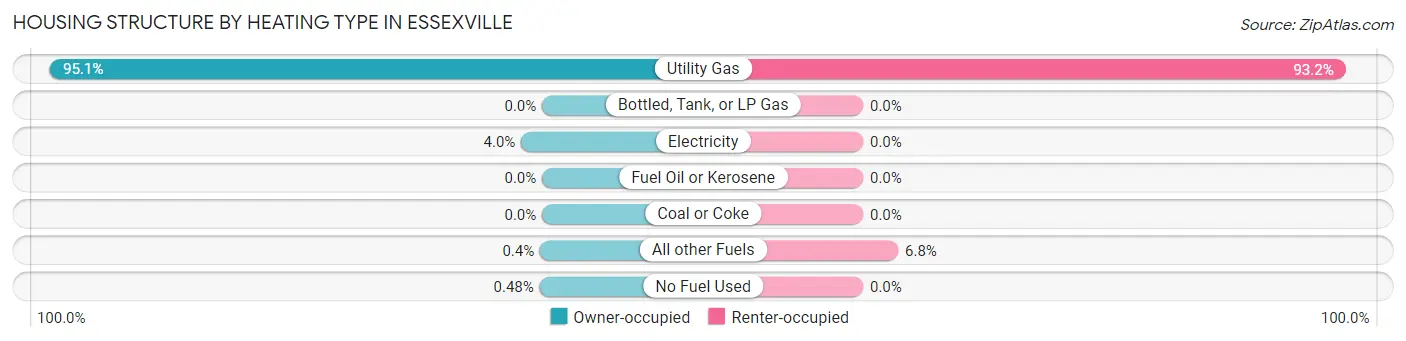
| Heating Type | Owner-occupied | Renter-occupied |
| Utility Gas | 1,199 (95.1%) | 110 (93.2%) |
| Bottled, Tank, or LP Gas | 0 (0.0%) | 0 (0.0%) |
| Electricity | 51 (4.0%) | 0 (0.0%) |
| Fuel Oil or Kerosene | 0 (0.0%) | 0 (0.0%) |
| Coal or Coke | 0 (0.0%) | 0 (0.0%) |
| All other Fuels | 5 (0.4%) | 8 (6.8%) |
| No Fuel Used | 6 (0.5%) | 0 (0.0%) |
| Total | 1,261 (100.0%) | 118 (100.0%) |
Household Vehicle Usage in Essexville
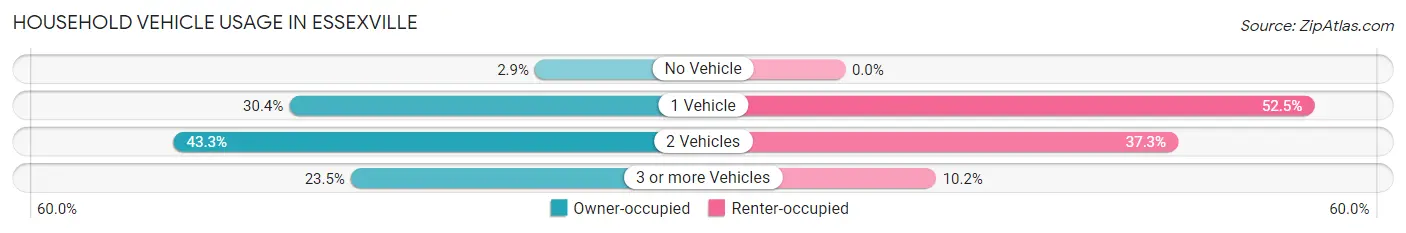
| Vehicles per Household | Owner-occupied | Renter-occupied |
| No Vehicle | 36 (2.9%) | 0 (0.0%) |
| 1 Vehicle | 383 (30.4%) | 62 (52.5%) |
| 2 Vehicles | 546 (43.3%) | 44 (37.3%) |
| 3 or more Vehicles | 296 (23.5%) | 12 (10.2%) |
| Total | 1,261 (100.0%) | 118 (100.0%) |
Real Estate & Mortgages in Essexville
Real Estate and Mortgage Overview in Essexville
| Characteristic | Without Mortgage | With Mortgage |
| Housing Units | 559 | 702 |
| Median Property Value | $107,600 | $129,500 |
| Median Household Income | $67,841 | $132 |
| Monthly Housing Costs | $594 | $0 |
| Real Estate Taxes | $2,287 | $15 |
Property Value by Mortgage Status in Essexville
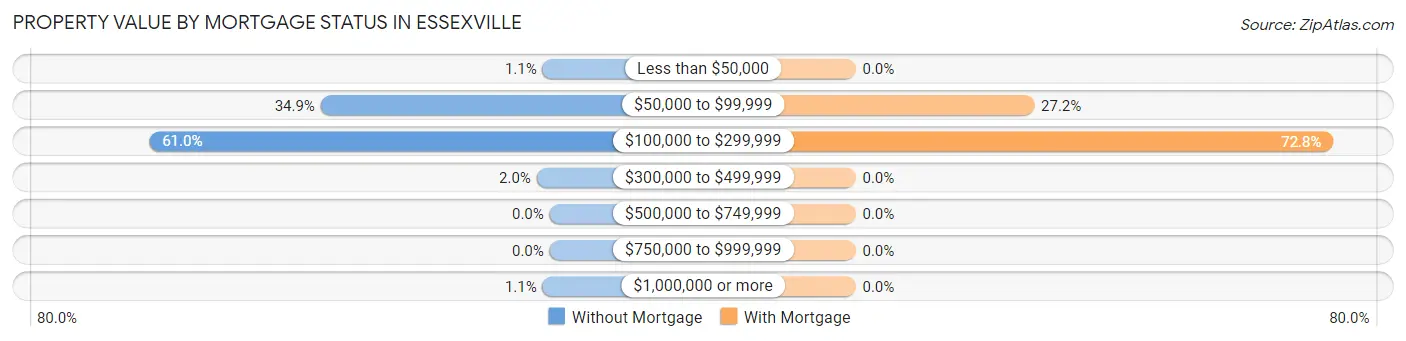
| Property Value | Without Mortgage | With Mortgage |
| Less than $50,000 | 6 (1.1%) | 0 (0.0%) |
| $50,000 to $99,999 | 195 (34.9%) | 191 (27.2%) |
| $100,000 to $299,999 | 341 (61.0%) | 511 (72.8%) |
| $300,000 to $499,999 | 11 (2.0%) | 0 (0.0%) |
| $500,000 to $749,999 | 0 (0.0%) | 0 (0.0%) |
| $750,000 to $999,999 | 0 (0.0%) | 0 (0.0%) |
| $1,000,000 or more | 6 (1.1%) | 0 (0.0%) |
| Total | 559 (100.0%) | 702 (100.0%) |
Household Income by Mortgage Status in Essexville
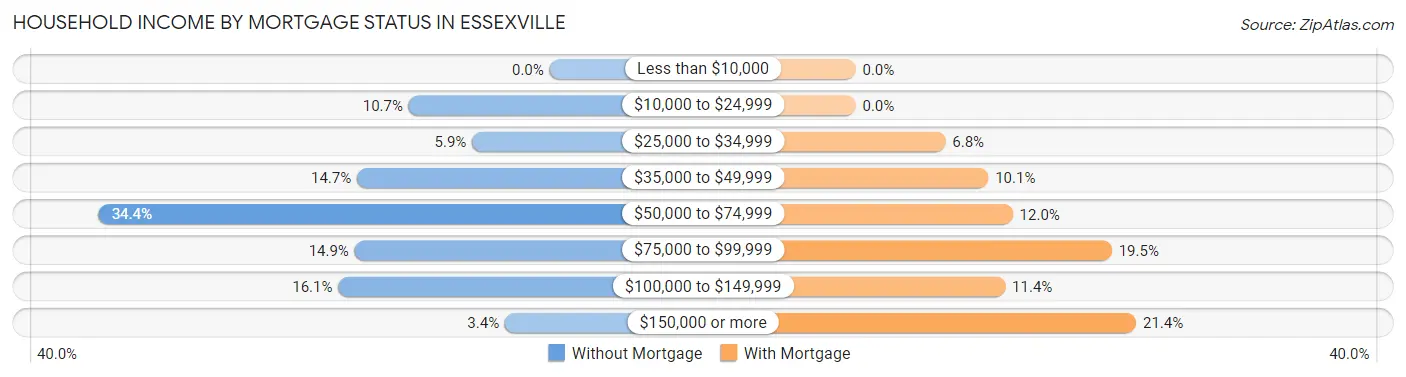
| Household Income | Without Mortgage | With Mortgage |
| Less than $10,000 | 0 (0.0%) | 0 (0.0%) |
| $10,000 to $24,999 | 60 (10.7%) | 0 (0.0%) |
| $25,000 to $34,999 | 33 (5.9%) | 48 (6.8%) |
| $35,000 to $49,999 | 82 (14.7%) | 71 (10.1%) |
| $50,000 to $74,999 | 192 (34.4%) | 84 (12.0%) |
| $75,000 to $99,999 | 83 (14.8%) | 137 (19.5%) |
| $100,000 to $149,999 | 90 (16.1%) | 80 (11.4%) |
| $150,000 or more | 19 (3.4%) | 150 (21.4%) |
| Total | 559 (100.0%) | 702 (100.0%) |
Property Value to Household Income Ratio in Essexville
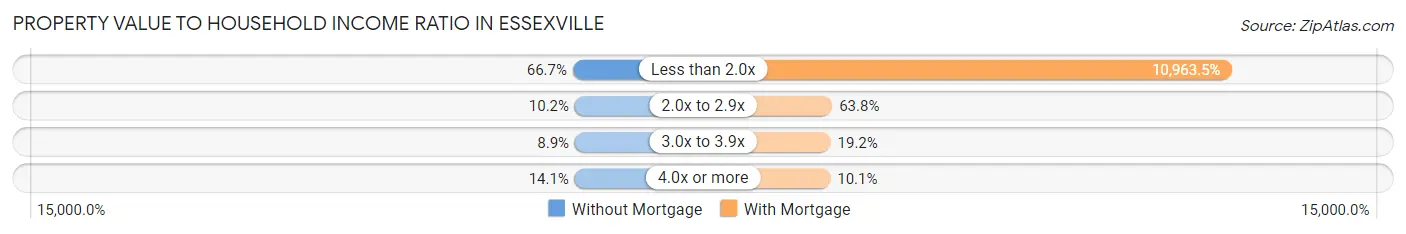
| Value-to-Income Ratio | Without Mortgage | With Mortgage |
| Less than 2.0x | 373 (66.7%) | 76,964 (10,963.5%) |
| 2.0x to 2.9x | 57 (10.2%) | 448 (63.8%) |
| 3.0x to 3.9x | 50 (8.9%) | 135 (19.2%) |
| 4.0x or more | 79 (14.1%) | 71 (10.1%) |
| Total | 559 (100.0%) | 702 (100.0%) |
Real Estate Taxes by Mortgage Status in Essexville
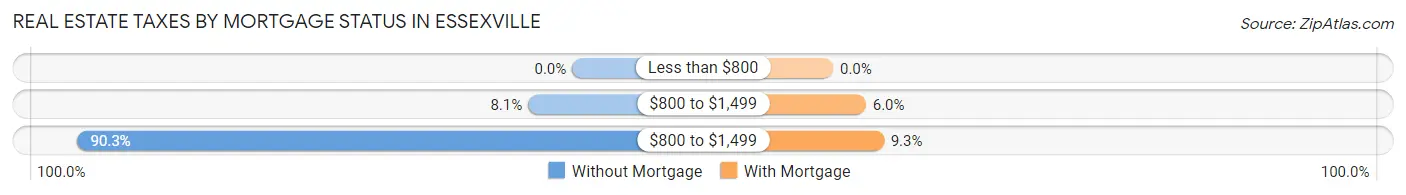
| Property Taxes | Without Mortgage | With Mortgage |
| Less than $800 | 0 (0.0%) | 0 (0.0%) |
| $800 to $1,499 | 45 (8.1%) | 42 (6.0%) |
| $800 to $1,499 | 505 (90.3%) | 65 (9.3%) |
| Total | 559 (100.0%) | 702 (100.0%) |
Health & Disability in Essexville
Health Insurance Coverage by Age in Essexville
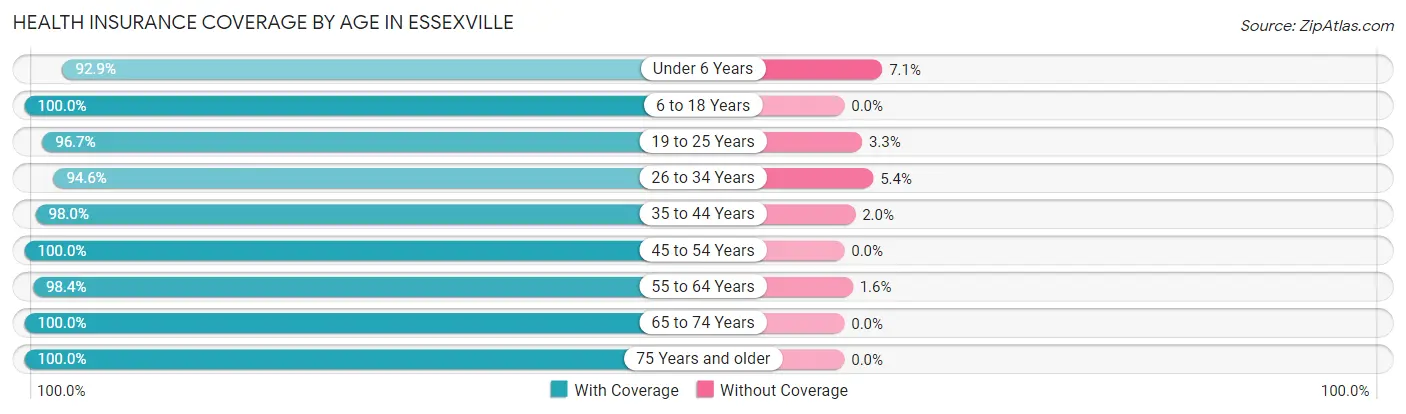
| Age Bracket | With Coverage | Without Coverage |
| Under 6 Years | 210 (92.9%) | 16 (7.1%) |
| 6 to 18 Years | 561 (100.0%) | 0 (0.0%) |
| 19 to 25 Years | 176 (96.7%) | 6 (3.3%) |
| 26 to 34 Years | 281 (94.6%) | 16 (5.4%) |
| 35 to 44 Years | 479 (98.0%) | 10 (2.0%) |
| 45 to 54 Years | 415 (100.0%) | 0 (0.0%) |
| 55 to 64 Years | 501 (98.4%) | 8 (1.6%) |
| 65 to 74 Years | 448 (100.0%) | 0 (0.0%) |
| 75 Years and older | 245 (100.0%) | 0 (0.0%) |
| Total | 3,316 (98.3%) | 56 (1.7%) |
Health Insurance Coverage by Citizenship Status in Essexville
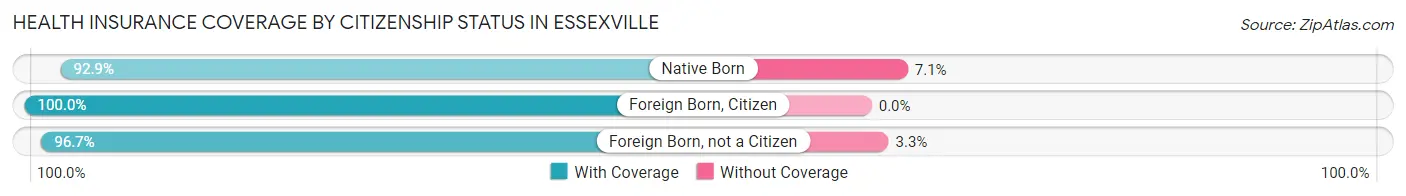
| Citizenship Status | With Coverage | Without Coverage |
| Native Born | 210 (92.9%) | 16 (7.1%) |
| Foreign Born, Citizen | 561 (100.0%) | 0 (0.0%) |
| Foreign Born, not a Citizen | 176 (96.7%) | 6 (3.3%) |
Health Insurance Coverage by Household Income in Essexville
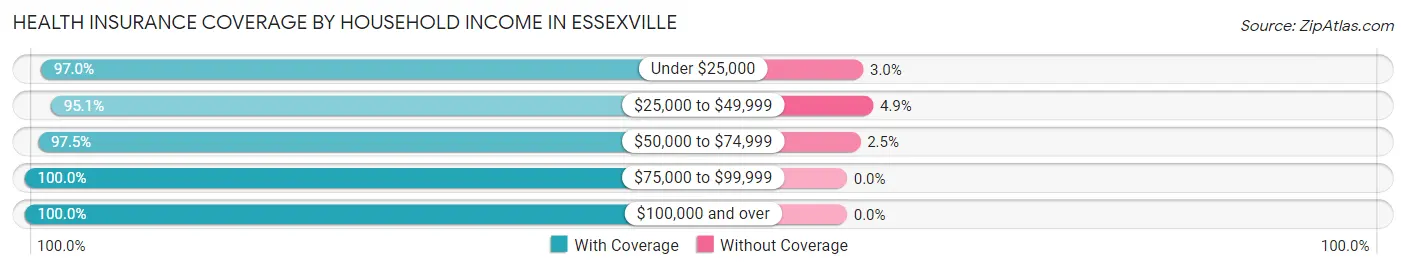
| Household Income | With Coverage | Without Coverage |
| Under $25,000 | 255 (97.0%) | 8 (3.0%) |
| $25,000 to $49,999 | 502 (95.1%) | 26 (4.9%) |
| $50,000 to $74,999 | 853 (97.5%) | 22 (2.5%) |
| $75,000 to $99,999 | 445 (100.0%) | 0 (0.0%) |
| $100,000 and over | 1,256 (100.0%) | 0 (0.0%) |
Public vs Private Health Insurance Coverage by Age in Essexville
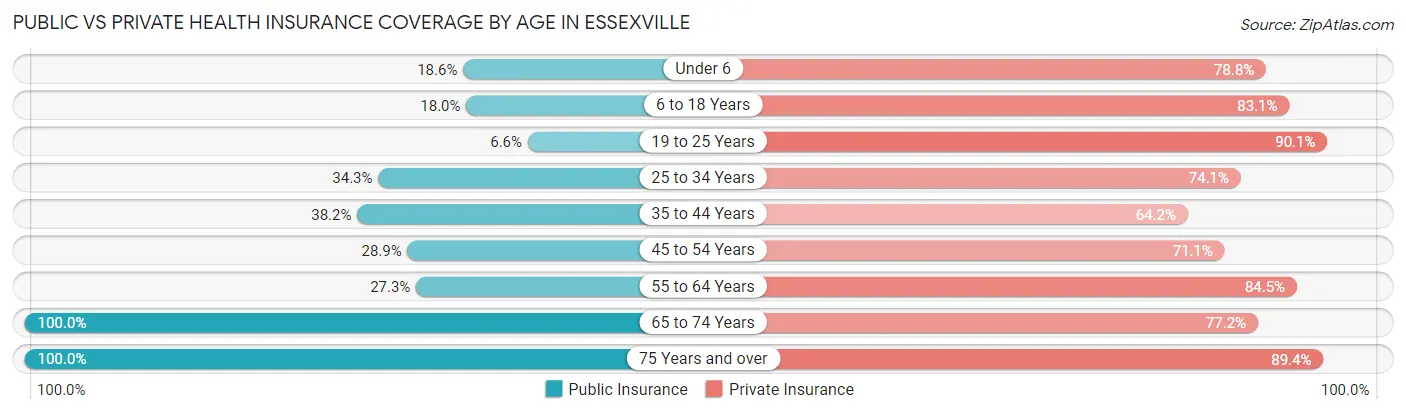
| Age Bracket | Public Insurance | Private Insurance |
| Under 6 | 42 (18.6%) | 178 (78.8%) |
| 6 to 18 Years | 101 (18.0%) | 466 (83.1%) |
| 19 to 25 Years | 12 (6.6%) | 164 (90.1%) |
| 25 to 34 Years | 102 (34.3%) | 220 (74.1%) |
| 35 to 44 Years | 187 (38.2%) | 314 (64.2%) |
| 45 to 54 Years | 120 (28.9%) | 295 (71.1%) |
| 55 to 64 Years | 139 (27.3%) | 430 (84.5%) |
| 65 to 74 Years | 448 (100.0%) | 346 (77.2%) |
| 75 Years and over | 245 (100.0%) | 219 (89.4%) |
| Total | 1,396 (41.4%) | 2,632 (78.0%) |
Disability Status by Sex by Age in Essexville
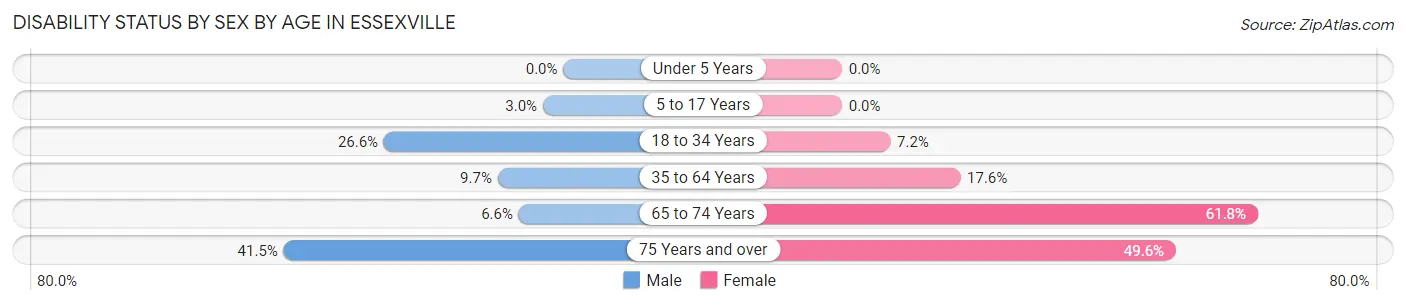
| Age Bracket | Male | Female |
| Under 5 Years | 0 (0.0%) | 0 (0.0%) |
| 5 to 17 Years | 10 (3.0%) | 0 (0.0%) |
| 18 to 34 Years | 57 (26.6%) | 19 (7.2%) |
| 35 to 64 Years | 75 (9.7%) | 113 (17.6%) |
| 65 to 74 Years | 17 (6.6%) | 118 (61.8%) |
| 75 Years and over | 49 (41.5%) | 63 (49.6%) |
Disability Class by Sex by Age in Essexville
Disability Class: Hearing Difficulty
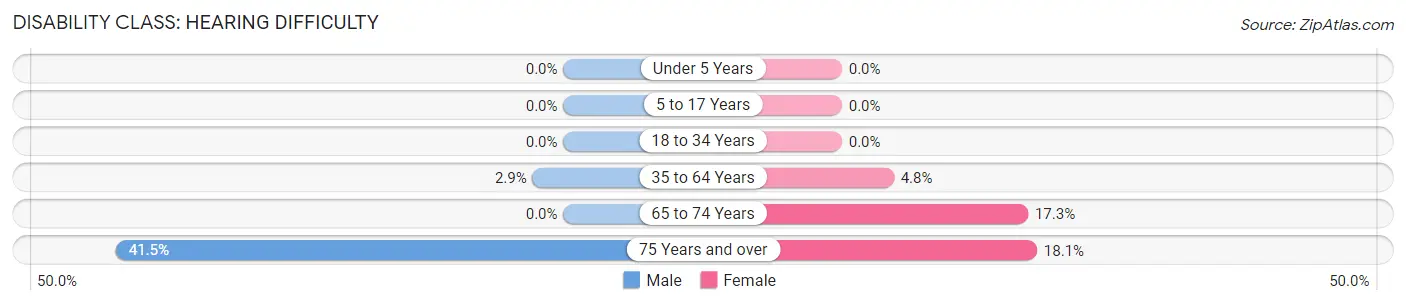
| Age Bracket | Male | Female |
| Under 5 Years | 0 (0.0%) | 0 (0.0%) |
| 5 to 17 Years | 0 (0.0%) | 0 (0.0%) |
| 18 to 34 Years | 0 (0.0%) | 0 (0.0%) |
| 35 to 64 Years | 22 (2.9%) | 31 (4.8%) |
| 65 to 74 Years | 0 (0.0%) | 33 (17.3%) |
| 75 Years and over | 49 (41.5%) | 23 (18.1%) |
Disability Class: Vision Difficulty
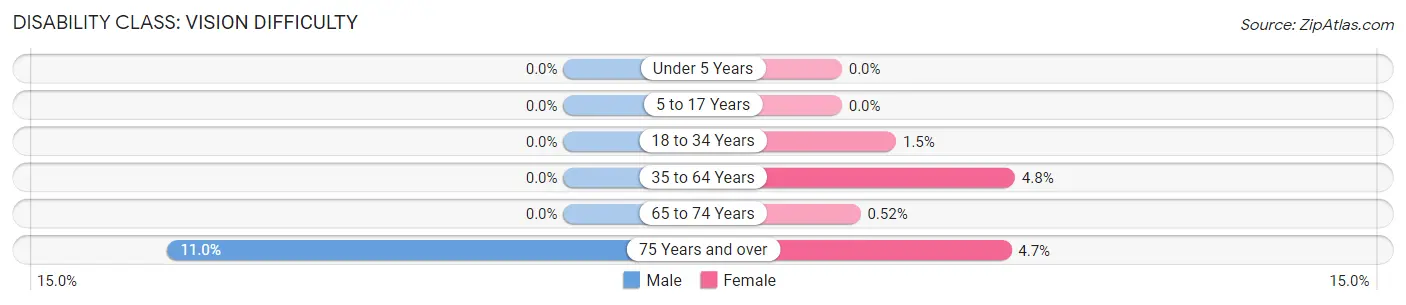
| Age Bracket | Male | Female |
| Under 5 Years | 0 (0.0%) | 0 (0.0%) |
| 5 to 17 Years | 0 (0.0%) | 0 (0.0%) |
| 18 to 34 Years | 0 (0.0%) | 4 (1.5%) |
| 35 to 64 Years | 0 (0.0%) | 31 (4.8%) |
| 65 to 74 Years | 0 (0.0%) | 1 (0.5%) |
| 75 Years and over | 13 (11.0%) | 6 (4.7%) |
Disability Class: Cognitive Difficulty
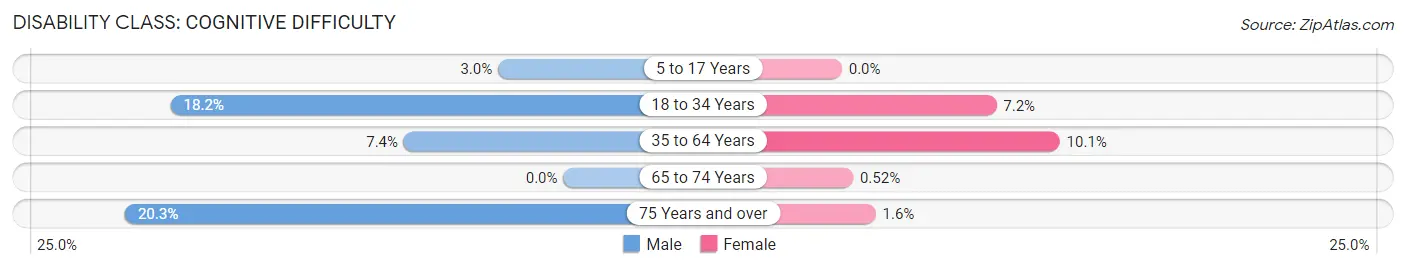
| Age Bracket | Male | Female |
| 5 to 17 Years | 10 (3.0%) | 0 (0.0%) |
| 18 to 34 Years | 39 (18.2%) | 19 (7.2%) |
| 35 to 64 Years | 57 (7.4%) | 65 (10.1%) |
| 65 to 74 Years | 0 (0.0%) | 1 (0.5%) |
| 75 Years and over | 24 (20.3%) | 2 (1.6%) |
Disability Class: Ambulatory Difficulty
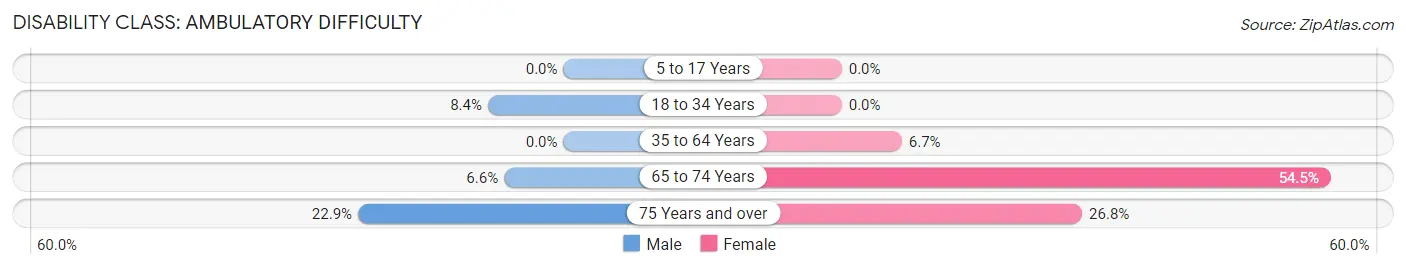
| Age Bracket | Male | Female |
| 5 to 17 Years | 0 (0.0%) | 0 (0.0%) |
| 18 to 34 Years | 18 (8.4%) | 0 (0.0%) |
| 35 to 64 Years | 0 (0.0%) | 43 (6.7%) |
| 65 to 74 Years | 17 (6.6%) | 104 (54.4%) |
| 75 Years and over | 27 (22.9%) | 34 (26.8%) |
Disability Class: Self-Care Difficulty
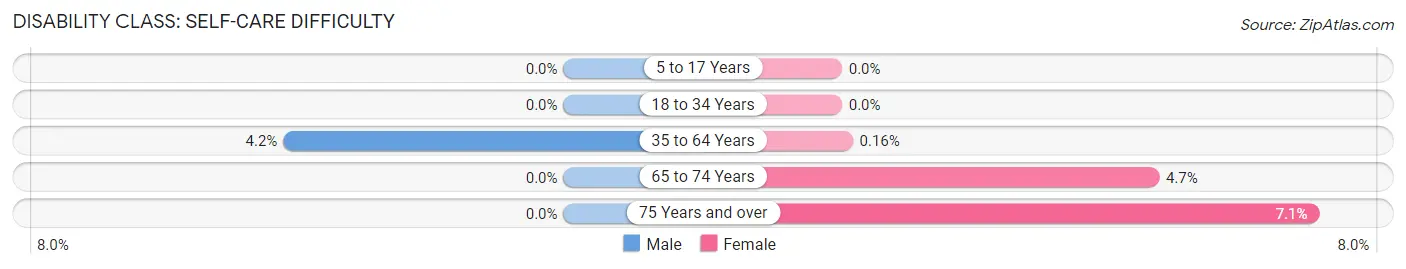
| Age Bracket | Male | Female |
| 5 to 17 Years | 0 (0.0%) | 0 (0.0%) |
| 18 to 34 Years | 0 (0.0%) | 0 (0.0%) |
| 35 to 64 Years | 32 (4.2%) | 1 (0.2%) |
| 65 to 74 Years | 0 (0.0%) | 9 (4.7%) |
| 75 Years and over | 0 (0.0%) | 9 (7.1%) |
Technology Access in Essexville
Computing Device Access in Essexville
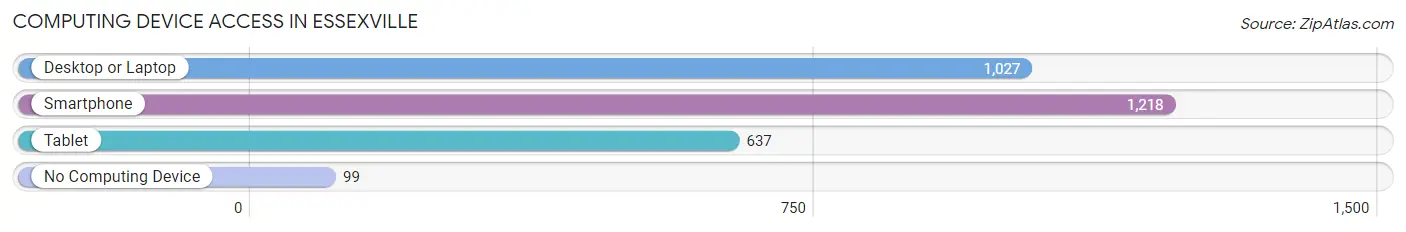
| Device Type | # Households | % Households |
| Desktop or Laptop | 1,027 | 74.5% |
| Smartphone | 1,218 | 88.3% |
| Tablet | 637 | 46.2% |
| No Computing Device | 99 | 7.2% |
| Total | 1,379 | 100.0% |
Internet Access in Essexville
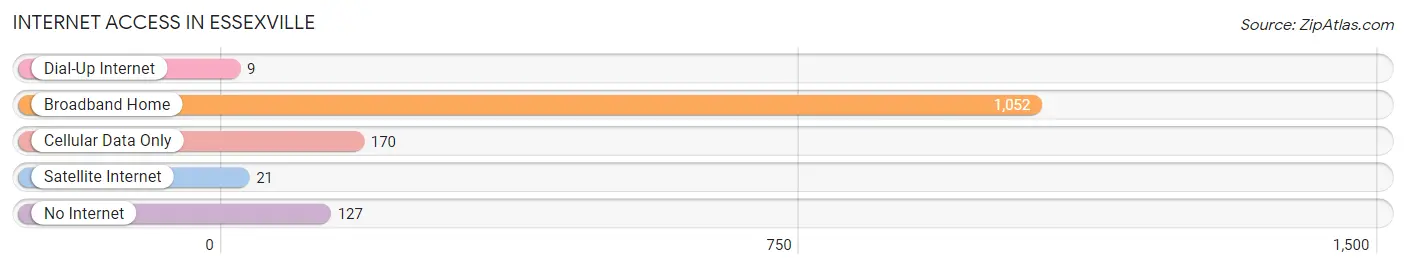
| Internet Type | # Households | % Households |
| Dial-Up Internet | 9 | 0.6% |
| Broadband Home | 1,052 | 76.3% |
| Cellular Data Only | 170 | 12.3% |
| Satellite Internet | 21 | 1.5% |
| No Internet | 127 | 9.2% |
| Total | 1,379 | 100.0% |
Essexville Summary
Essexville, Michigan is a small city located in Bay County, Michigan. It is situated on the Saginaw Bay of Lake Huron, and is part of the Bay City Metropolitan Statistical Area. The city has a population of approximately 3,000 people, and is known for its small-town charm and friendly atmosphere.
History
Essexville was founded in 1867 by William Essex, a lumberman from Canada. He purchased the land from the local Chippewa Indians and began to develop the area. The first settlers were mostly German immigrants, and the town was originally called “Essexville” after its founder.
In 1871, the first post office was established in Essexville, and the town was officially incorporated in 1873. The first mayor of Essexville was William Essex, and the first school was built in 1875.
In the late 19th century, Essexville was a thriving lumber town. The town was home to several sawmills, and the lumber industry was the main source of employment for the residents. The lumber industry declined in the early 20th century, and the town began to focus on other industries, such as agriculture and manufacturing.
Geography
Essexville is located in Bay County, Michigan, and is situated on the Saginaw Bay of Lake Huron. The city is located approximately 10 miles south of Bay City, and is part of the Bay City Metropolitan Statistical Area.
The city has a total area of 2.2 square miles, and is located at an elevation of 590 feet above sea level. The city is located in a humid continental climate zone, and experiences hot summers and cold winters.
Economy
Essexville’s economy is largely based on manufacturing and agriculture. The city is home to several manufacturing companies, including Essexville Manufacturing, which produces automotive parts, and Essexville Plastics, which produces plastic products.
Agriculture is also an important part of the local economy. The city is home to several farms, and the surrounding area is known for its production of corn, soybeans, and wheat.
Demographics
As of the 2010 census, Essexville had a population of 3,000 people. The racial makeup of the city was 94.3% White, 1.7% African American, 0.7% Native American, 0.3% Asian, 0.1% Pacific Islander, and 2.8% from other races.
The median household income in Essexville was $37,917, and the median family income was $45,938. The per capita income was $19,945. Approximately 11.3% of the population was below the poverty line.
Essexville is a small city with a friendly atmosphere and a rich history. The city is home to several manufacturing and agricultural businesses, and the local economy is largely based on these industries. The city has a diverse population, and the median household income is slightly below the national average.
Common Questions
What is Per Capita Income in Essexville?
Per Capita income in Essexville is $33,088.
What is the Median Family Income in Essexville?
Median Family Income in Essexville is $73,446.
What is the Median Household income in Essexville?
Median Household Income in Essexville is $72,516.
What is Income or Wage Gap in Essexville?
Income or Wage Gap in Essexville is 9.1%.
Women in Essexville earn 90.9 cents for every dollar earned by a man.
What is Inequality or Gini Index in Essexville?
Inequality or Gini Index in Essexville is 0.32.
What is the Total Population of Essexville?
Total Population of Essexville is 3,372.
What is the Total Male Population of Essexville?
Total Male Population of Essexville is 1,761.
What is the Total Female Population of Essexville?
Total Female Population of Essexville is 1,611.
What is the Ratio of Males per 100 Females in Essexville?
There are 109.31 Males per 100 Females in Essexville.
What is the Ratio of Females per 100 Males in Essexville?
There are 91.48 Females per 100 Males in Essexville.
What is the Median Population Age in Essexville?
Median Population Age in Essexville is 43.3 Years.
What is the Average Family Size in Essexville
Average Family Size in Essexville is 3.1 People.
What is the Average Household Size in Essexville
Average Household Size in Essexville is 2.4 People.
How Large is the Labor Force in Essexville?
There are 1,537 People in the Labor Forcein in Essexville.
What is the Percentage of People in the Labor Force in Essexville?
55.7% of People are in the Labor Force in Essexville.
What is the Unemployment Rate in Essexville?
Unemployment Rate in Essexville is 2.9%.