Dundee, MI Map & Demographics
Dundee Map
Dundee Overview
$48,334
PER CAPITA INCOME
$114,179
AVG FAMILY INCOME
$73,641
AVG HOUSEHOLD INCOME
11.4%
WAGE / INCOME GAP [ % ]
88.6¢/ $1
WAGE / INCOME GAP [ $ ]
0.44
INEQUALITY / GINI INDEX
5,408
TOTAL POPULATION
2,684
MALE POPULATION
2,724
FEMALE POPULATION
98.53
MALES / 100 FEMALES
101.49
FEMALES / 100 MALES
37.0
MEDIAN AGE
2.9
AVG FAMILY SIZE
2.1
AVG HOUSEHOLD SIZE
3,194
LABOR FORCE [ PEOPLE ]
71.0%
PERCENT IN LABOR FORCE
7.5%
UNEMPLOYMENT RATE
Dundee Zip Codes
Dundee Area Codes
Income in Dundee
Income Overview in Dundee
Per Capita Income in Dundee is $48,334, while median incomes of families and households are $114,179 and $73,641 respectively.
| Characteristic | Number | Measure |
| Per Capita Income | 5,408 | $48,334 |
| Median Family Income | 1,234 | $114,179 |
| Mean Family Income | 1,234 | $132,804 |
| Median Household Income | 2,558 | $73,641 |
| Mean Household Income | 2,558 | $102,951 |
| Income Deficit | 1,234 | $0 |
| Wage / Income Gap (%) | 5,408 | 11.43% |
| Wage / Income Gap ($) | 5,408 | 88.57¢ per $1 |
| Gini / Inequality Index | 5,408 | 0.44 |
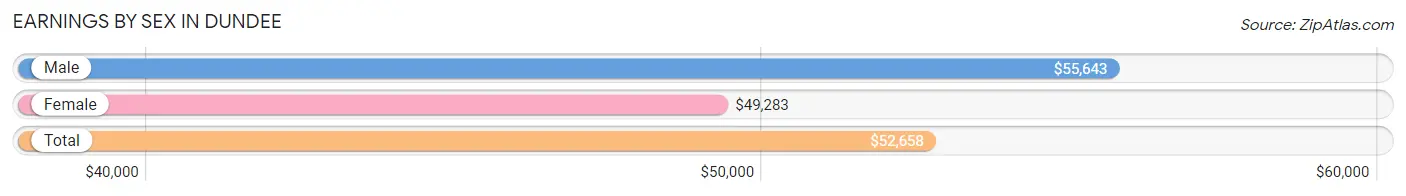
Earnings by Sex in Dundee
Average Earnings in Dundee are $52,658, $55,643 for men and $49,283 for women, a difference of 11.4%.
| Sex | Number | Average Earnings |
| Male | 1,801 (55.2%) | $55,643 |
| Female | 1,464 (44.8%) | $49,283 |
| Total | 3,265 (100.0%) | $52,658 |
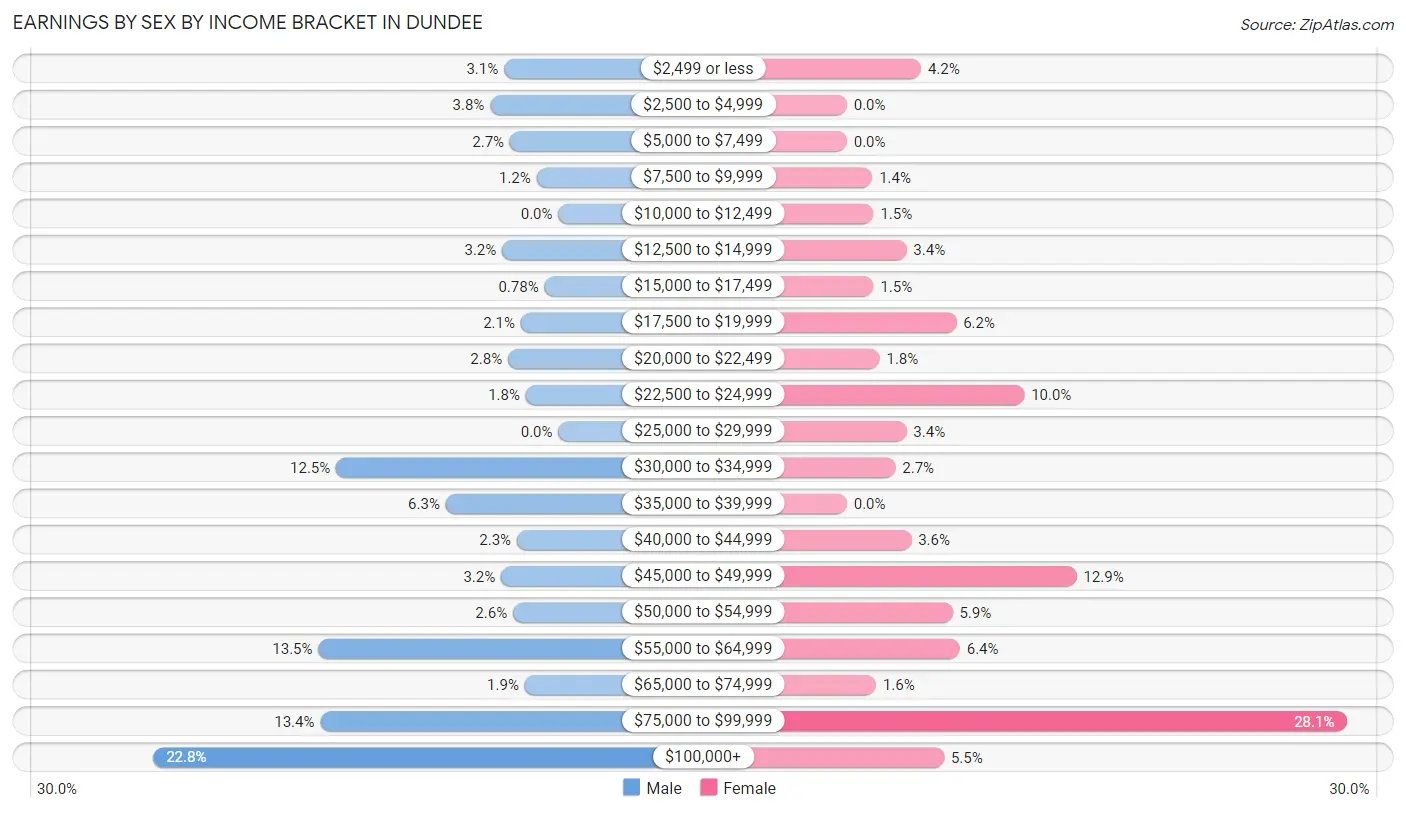
Earnings by Sex by Income Bracket in Dundee
The most common earnings brackets in Dundee are $100,000+ for men (410 | 22.8%) and $75,000 to $99,999 for women (411 | 28.1%).
| Income | Male | Female |
| $2,499 or less | 55 (3.0%) | 61 (4.2%) |
| $2,500 to $4,999 | 69 (3.8%) | 0 (0.0%) |
| $5,000 to $7,499 | 49 (2.7%) | 0 (0.0%) |
| $7,500 to $9,999 | 22 (1.2%) | 21 (1.4%) |
| $10,000 to $12,499 | 0 (0.0%) | 22 (1.5%) |
| $12,500 to $14,999 | 57 (3.2%) | 49 (3.4%) |
| $15,000 to $17,499 | 14 (0.8%) | 22 (1.5%) |
| $17,500 to $19,999 | 38 (2.1%) | 90 (6.1%) |
| $20,000 to $22,499 | 51 (2.8%) | 27 (1.8%) |
| $22,500 to $24,999 | 33 (1.8%) | 146 (10.0%) |
| $25,000 to $29,999 | 0 (0.0%) | 49 (3.4%) |
| $30,000 to $34,999 | 225 (12.5%) | 40 (2.7%) |
| $35,000 to $39,999 | 114 (6.3%) | 0 (0.0%) |
| $40,000 to $44,999 | 42 (2.3%) | 53 (3.6%) |
| $45,000 to $49,999 | 58 (3.2%) | 189 (12.9%) |
| $50,000 to $54,999 | 46 (2.5%) | 87 (5.9%) |
| $55,000 to $64,999 | 243 (13.5%) | 93 (6.4%) |
| $65,000 to $74,999 | 34 (1.9%) | 24 (1.6%) |
| $75,000 to $99,999 | 241 (13.4%) | 411 (28.1%) |
| $100,000+ | 410 (22.8%) | 80 (5.5%) |
| Total | 1,801 (100.0%) | 1,464 (100.0%) |
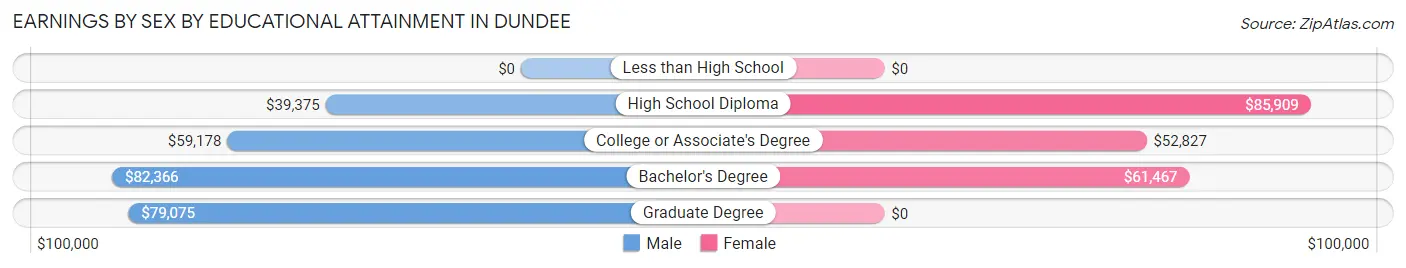
Earnings by Sex by Educational Attainment in Dundee
Average earnings in Dundee are $59,503 for men and $53,865 for women, a difference of 9.5%. Men with an educational attainment of bachelor's degree enjoy the highest average annual earnings of $82,366, while those with high school diploma education earn the least with $39,375. Women with an educational attainment of high school diploma earn the most with the average annual earnings of $85,909, while those with college or associate's degree education have the smallest earnings of $52,827.
| Educational Attainment | Male Income | Female Income |
| Less than High School | - | - |
| High School Diploma | $39,375 | $85,909 |
| College or Associate's Degree | $59,178 | $52,827 |
| Bachelor's Degree | $82,366 | $61,467 |
| Graduate Degree | $79,075 | $0 |
| Total | $59,503 | $53,865 |
Family Income in Dundee
Family Income Brackets in Dundee
According to the Dundee family income data, there are 365 families falling into the $100,000 to $149,999 income range, which is the most common income bracket and makes up 29.6% of all families.
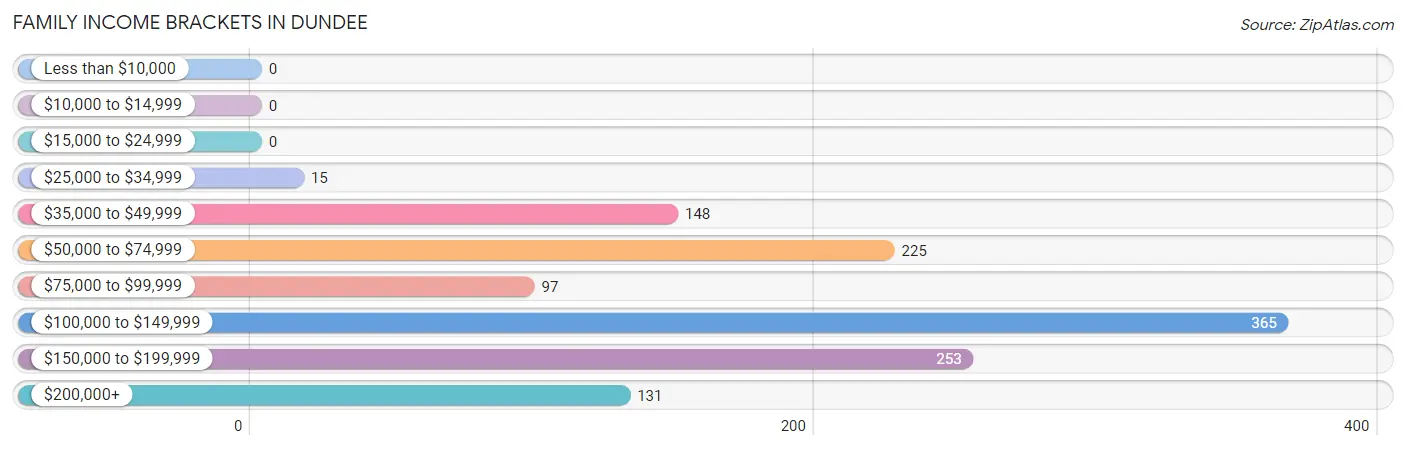
| Income Bracket | # Families | % Families |
| Less than $10,000 | 0 | 0.0% |
| $10,000 to $14,999 | 0 | 0.0% |
| $15,000 to $24,999 | 0 | 0.0% |
| $25,000 to $34,999 | 15 | 1.2% |
| $35,000 to $49,999 | 148 | 12.0% |
| $50,000 to $74,999 | 225 | 18.2% |
| $75,000 to $99,999 | 97 | 7.9% |
| $100,000 to $149,999 | 365 | 29.6% |
| $150,000 to $199,999 | 253 | 20.5% |
| $200,000+ | 131 | 10.6% |
Family Income by Famaliy Size in Dundee
3-person families (274 | 22.2%) account for the highest median family income in Dundee with $143,636 per family, while 3-person families (274 | 22.2%) have the highest median income of $47,879 per family member.
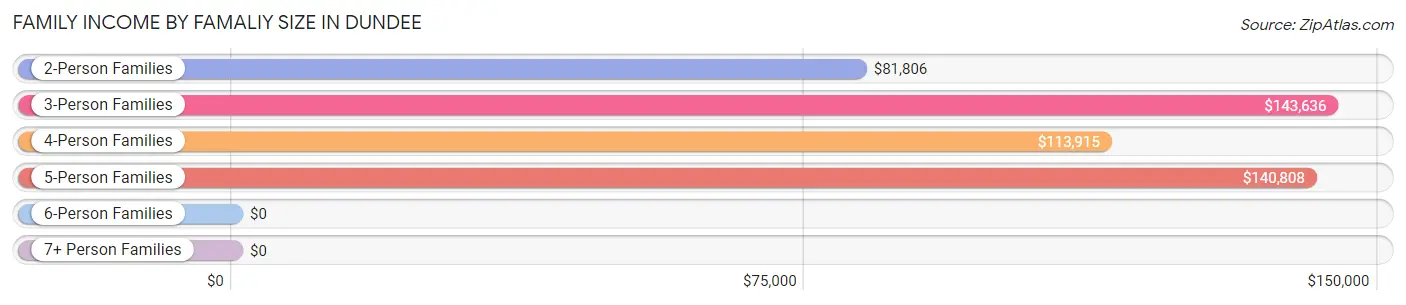
| Income Bracket | # Families | Median Income |
| 2-Person Families | 542 (43.9%) | $81,806 |
| 3-Person Families | 274 (22.2%) | $143,636 |
| 4-Person Families | 230 (18.6%) | $113,915 |
| 5-Person Families | 170 (13.8%) | $140,808 |
| 6-Person Families | 18 (1.5%) | $0 |
| 7+ Person Families | 0 (0.0%) | $0 |
| Total | 1,234 (100.0%) | $114,179 |
Family Income by Number of Earners in Dundee
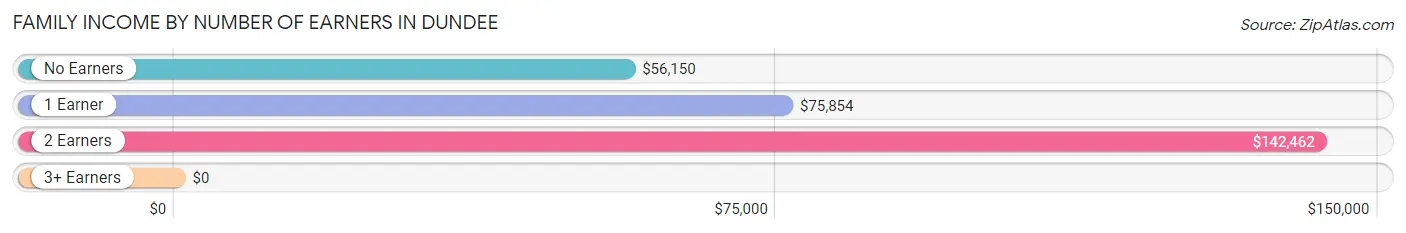
| Number of Earners | # Families | Median Income |
| No Earners | 111 (9.0%) | $56,150 |
| 1 Earner | 374 (30.3%) | $75,854 |
| 2 Earners | 713 (57.8%) | $142,462 |
| 3+ Earners | 36 (2.9%) | $0 |
| Total | 1,234 (100.0%) | $114,179 |
Household Income in Dundee
Household Income Brackets in Dundee
With 606 households falling in the category, the $50,000 to $74,999 income range is the most frequent in Dundee, accounting for 23.7% of all households. In contrast, only 23 households (0.9%) fall into the less than $10,000 income bracket, making it the least populous group.
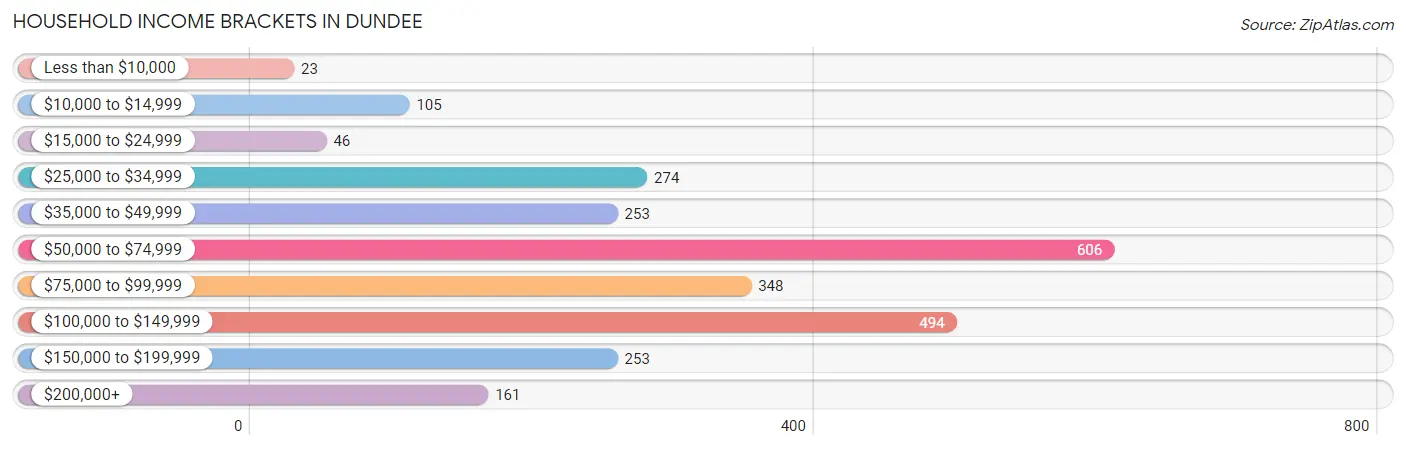
| Income Bracket | # Households | % Households |
| Less than $10,000 | 23 | 0.9% |
| $10,000 to $14,999 | 105 | 4.1% |
| $15,000 to $24,999 | 46 | 1.8% |
| $25,000 to $34,999 | 274 | 10.7% |
| $35,000 to $49,999 | 253 | 9.9% |
| $50,000 to $74,999 | 606 | 23.7% |
| $75,000 to $99,999 | 348 | 13.6% |
| $100,000 to $149,999 | 494 | 19.3% |
| $150,000 to $199,999 | 253 | 9.9% |
| $200,000+ | 161 | 6.3% |
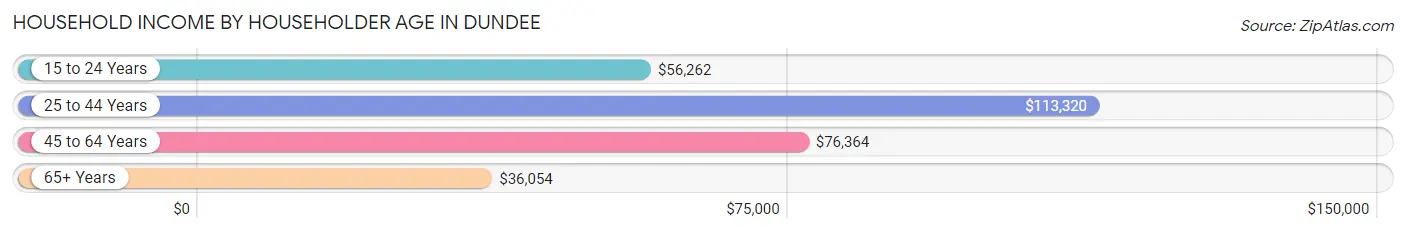
Household Income by Householder Age in Dundee
The median household income in Dundee is $73,641, with the highest median household income of $113,320 found in the 25 to 44 years age bracket for the primary householder. A total of 900 households (35.2%) fall into this category. Meanwhile, the 65+ years age bracket for the primary householder has the lowest median household income of $36,054, with 505 households (19.7%) in this group.
| Income Bracket | # Households | Median Income |
| 15 to 24 Years | 155 (6.1%) | $56,262 |
| 25 to 44 Years | 900 (35.2%) | $113,320 |
| 45 to 64 Years | 998 (39.0%) | $76,364 |
| 65+ Years | 505 (19.7%) | $36,054 |
| Total | 2,558 (100.0%) | $73,641 |
Poverty in Dundee
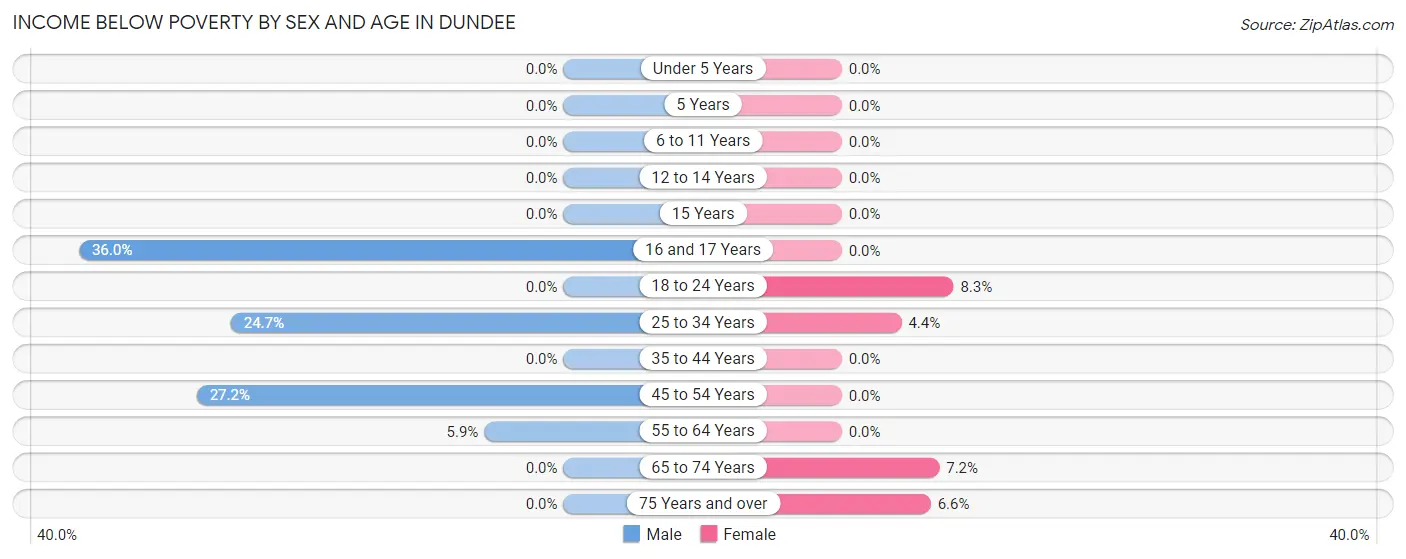
Income Below Poverty by Sex and Age in Dundee
With 10.6% poverty level for males and 2.5% for females among the residents of Dundee, 16 and 17 year old males and 18 to 24 year old females are the most vulnerable to poverty, with 32 males (36.0%) and 18 females (8.3%) in their respective age groups living below the poverty level.
| Age Bracket | Male | Female |
| Under 5 Years | 0 (0.0%) | 0 (0.0%) |
| 5 Years | 0 (0.0%) | 0 (0.0%) |
| 6 to 11 Years | 0 (0.0%) | 0 (0.0%) |
| 12 to 14 Years | 0 (0.0%) | 0 (0.0%) |
| 15 Years | 0 (0.0%) | 0 (0.0%) |
| 16 and 17 Years | 32 (36.0%) | 0 (0.0%) |
| 18 to 24 Years | 0 (0.0%) | 18 (8.3%) |
| 25 to 34 Years | 138 (24.7%) | 14 (4.4%) |
| 35 to 44 Years | 0 (0.0%) | 0 (0.0%) |
| 45 to 54 Years | 101 (27.2%) | 0 (0.0%) |
| 55 to 64 Years | 13 (5.9%) | 0 (0.0%) |
| 65 to 74 Years | 0 (0.0%) | 22 (7.2%) |
| 75 Years and over | 0 (0.0%) | 14 (6.6%) |
| Total | 284 (10.6%) | 68 (2.5%) |
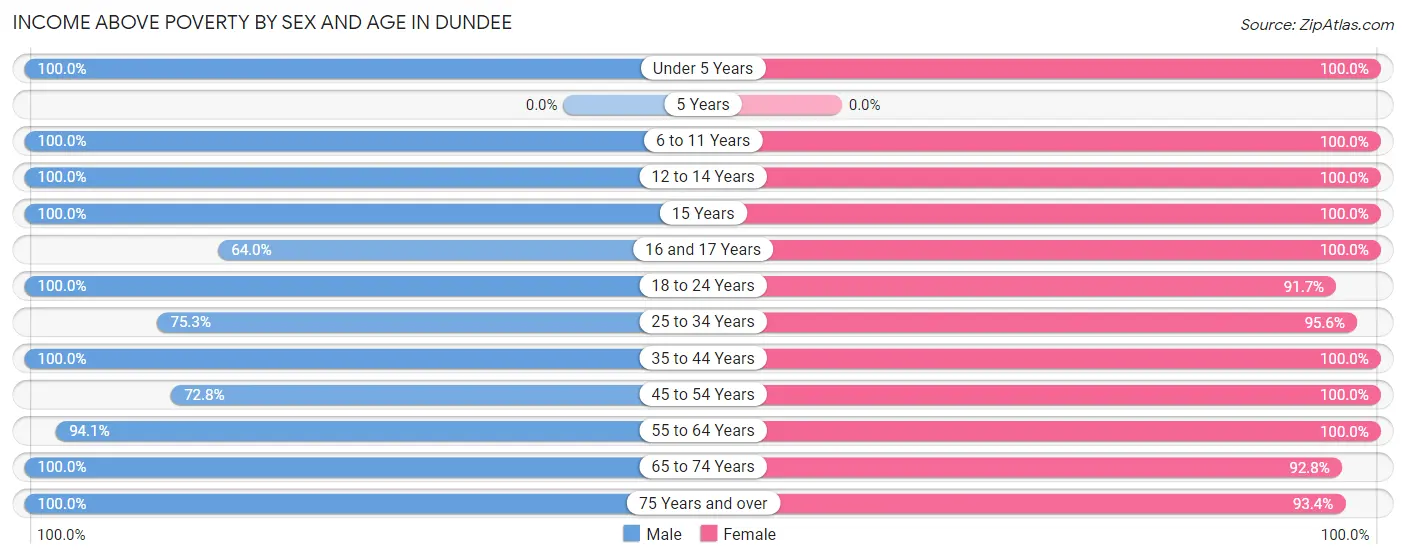
Income Above Poverty by Sex and Age in Dundee
According to the poverty statistics in Dundee, males aged under 5 years and females aged under 5 years are the age groups that are most secure financially, with 100.0% of males and 100.0% of females in these age groups living above the poverty line.
| Age Bracket | Male | Female |
| Under 5 Years | 66 (100.0%) | 149 (100.0%) |
| 5 Years | 0 (0.0%) | 0 (0.0%) |
| 6 to 11 Years | 280 (100.0%) | 180 (100.0%) |
| 12 to 14 Years | 19 (100.0%) | 63 (100.0%) |
| 15 Years | 95 (100.0%) | 58 (100.0%) |
| 16 and 17 Years | 57 (64.0%) | 26 (100.0%) |
| 18 to 24 Years | 244 (100.0%) | 199 (91.7%) |
| 25 to 34 Years | 421 (75.3%) | 302 (95.6%) |
| 35 to 44 Years | 573 (100.0%) | 404 (100.0%) |
| 45 to 54 Years | 270 (72.8%) | 529 (100.0%) |
| 55 to 64 Years | 208 (94.1%) | 264 (100.0%) |
| 65 to 74 Years | 42 (100.0%) | 282 (92.8%) |
| 75 Years and over | 124 (100.0%) | 198 (93.4%) |
| Total | 2,399 (89.4%) | 2,654 (97.5%) |
Income Below Poverty Among Married-Couple Families in Dundee
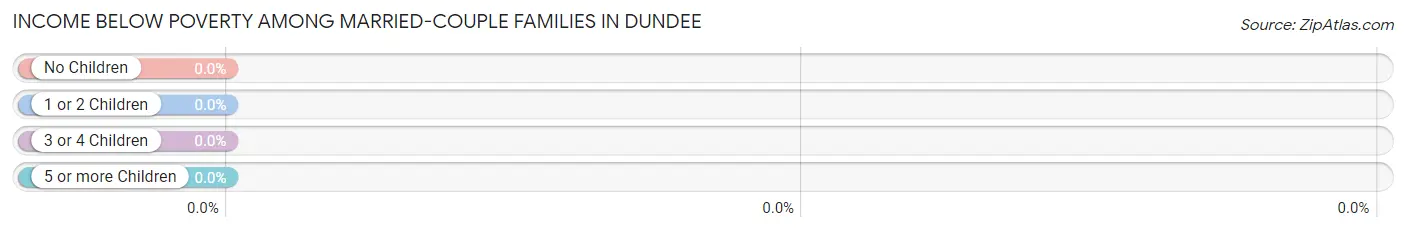
| Children | Above Poverty | Below Poverty |
| No Children | 600 (100.0%) | 0 (0.0%) |
| 1 or 2 Children | 240 (100.0%) | 0 (0.0%) |
| 3 or 4 Children | 188 (100.0%) | 0 (0.0%) |
| 5 or more Children | 0 (0.0%) | 0 (0.0%) |
| Total | 1,028 (100.0%) | 0 (0.0%) |
Income Below Poverty Among Single-Parent Households in Dundee
| Children | Single Father | Single Mother |
| No Children | 0 (0.0%) | 0 (0.0%) |
| 1 or 2 Children | 0 (0.0%) | 0 (0.0%) |
| 3 or 4 Children | 0 (0.0%) | 0 (0.0%) |
| 5 or more Children | 0 (0.0%) | 0 (0.0%) |
| Total | 0 (0.0%) | 0 (0.0%) |
Income Below Poverty Among Married-Couple vs Single-Parent Households in Dundee
| Children | Married-Couple Families | Single-Parent Households |
| No Children | 0 (0.0%) | 0 (0.0%) |
| 1 or 2 Children | 0 (0.0%) | 0 (0.0%) |
| 3 or 4 Children | 0 (0.0%) | 0 (0.0%) |
| 5 or more Children | 0 (0.0%) | 0 (0.0%) |
| Total | 0 (0.0%) | 0 (0.0%) |
Race in Dundee
The most populous races in Dundee are White / Caucasian (4,907 | 90.7%), Two or more Races (458 | 8.5%), and Hispanic or Latino (437 | 8.1%).
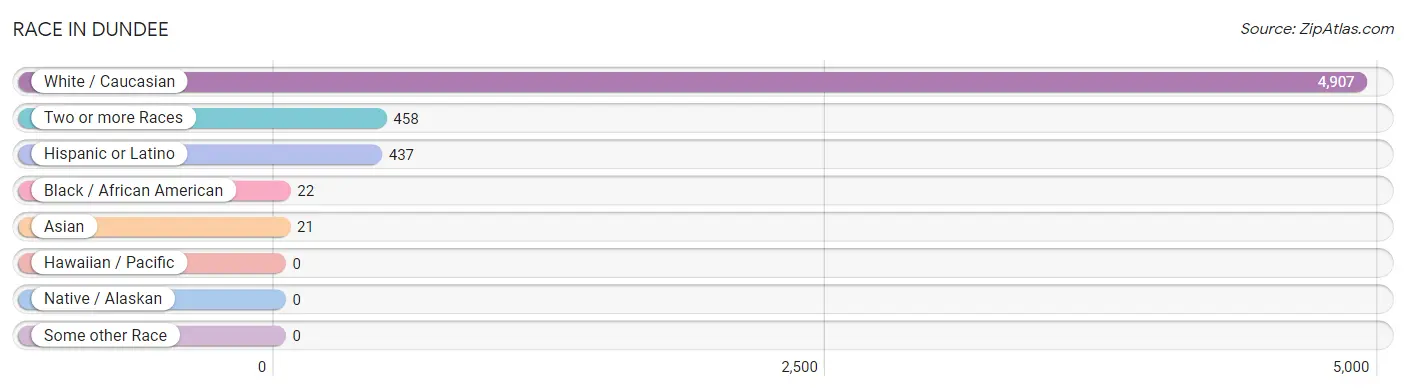
| Race | # Population | % Population |
| Asian | 21 | 0.4% |
| Black / African American | 22 | 0.4% |
| Hawaiian / Pacific | 0 | 0.0% |
| Hispanic or Latino | 437 | 8.1% |
| Native / Alaskan | 0 | 0.0% |
| White / Caucasian | 4,907 | 90.7% |
| Two or more Races | 458 | 8.5% |
| Some other Race | 0 | 0.0% |
| Total | 5,408 | 100.0% |
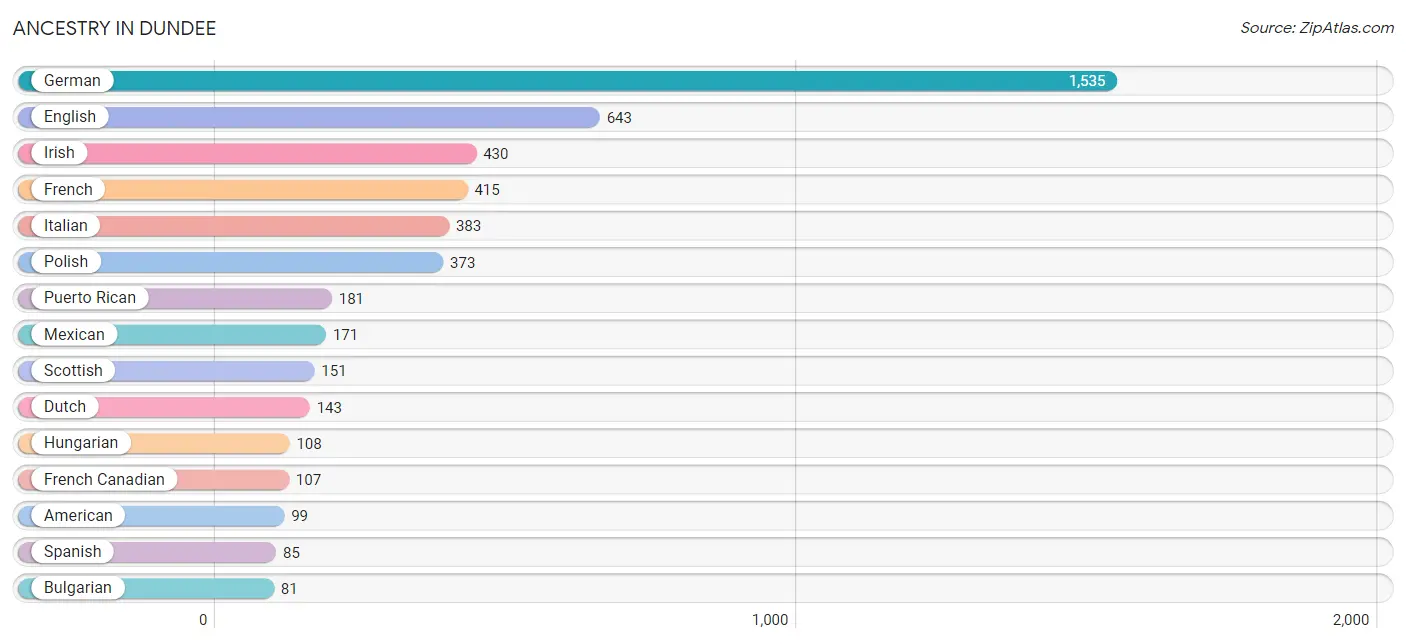
Ancestry in Dundee
The most populous ancestries reported in Dundee are German (1,535 | 28.4%), English (643 | 11.9%), Irish (430 | 8.0%), French (415 | 7.7%), and Italian (383 | 7.1%), together accounting for 63.0% of all Dundee residents.
| Ancestry | # Population | % Population |
| American | 99 | 1.8% |
| Arab | 55 | 1.0% |
| Armenian | 15 | 0.3% |
| Belgian | 12 | 0.2% |
| British | 37 | 0.7% |
| Bulgarian | 81 | 1.5% |
| Burmese | 61 | 1.1% |
| Cherokee | 14 | 0.3% |
| Czech | 23 | 0.4% |
| Danish | 12 | 0.2% |
| Dutch | 143 | 2.6% |
| English | 643 | 11.9% |
| European | 59 | 1.1% |
| French | 415 | 7.7% |
| French Canadian | 107 | 2.0% |
| German | 1,535 | 28.4% |
| Hungarian | 108 | 2.0% |
| Irish | 430 | 8.0% |
| Iroquois | 8 | 0.2% |
| Italian | 383 | 7.1% |
| Lebanese | 55 | 1.0% |
| Mexican | 171 | 3.2% |
| Norwegian | 23 | 0.4% |
| Polish | 373 | 6.9% |
| Puerto Rican | 181 | 3.4% |
| Scandinavian | 29 | 0.5% |
| Scotch-Irish | 25 | 0.5% |
| Scottish | 151 | 2.8% |
| Slavic | 11 | 0.2% |
| Slovak | 21 | 0.4% |
| Spanish | 85 | 1.6% |
| Swedish | 76 | 1.4% |
| Swiss | 11 | 0.2% |
| Thai | 39 | 0.7% |
| Ukrainian | 13 | 0.2% | View All 35 Rows |
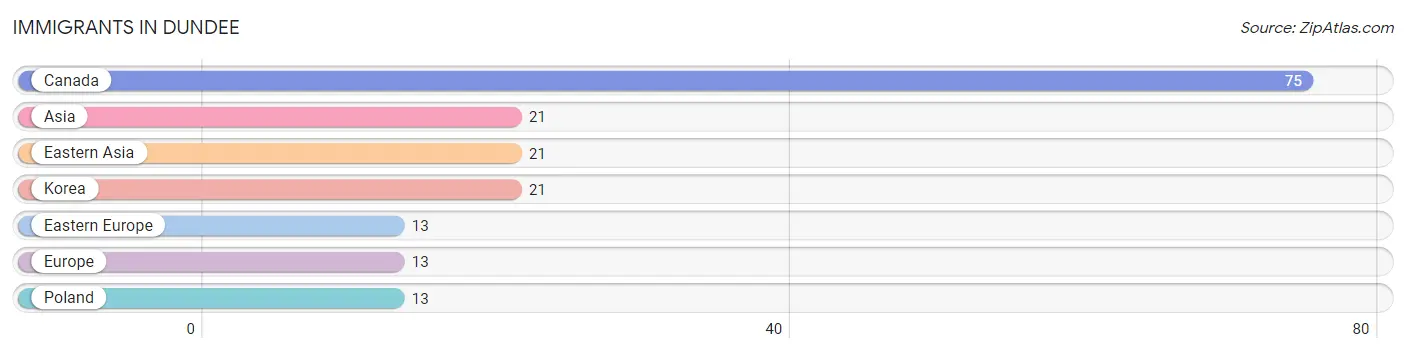
Immigrants in Dundee
The most numerous immigrant groups reported in Dundee came from Canada (75 | 1.4%), Asia (21 | 0.4%), Eastern Asia (21 | 0.4%), Korea (21 | 0.4%), and Eastern Europe (13 | 0.2%), together accounting for 2.8% of all Dundee residents.
| Immigration Origin | # Population | % Population |
| Asia | 21 | 0.4% |
| Canada | 75 | 1.4% |
| Eastern Asia | 21 | 0.4% |
| Eastern Europe | 13 | 0.2% |
| Europe | 13 | 0.2% |
| Korea | 21 | 0.4% |
| Poland | 13 | 0.2% | View All 7 Rows |
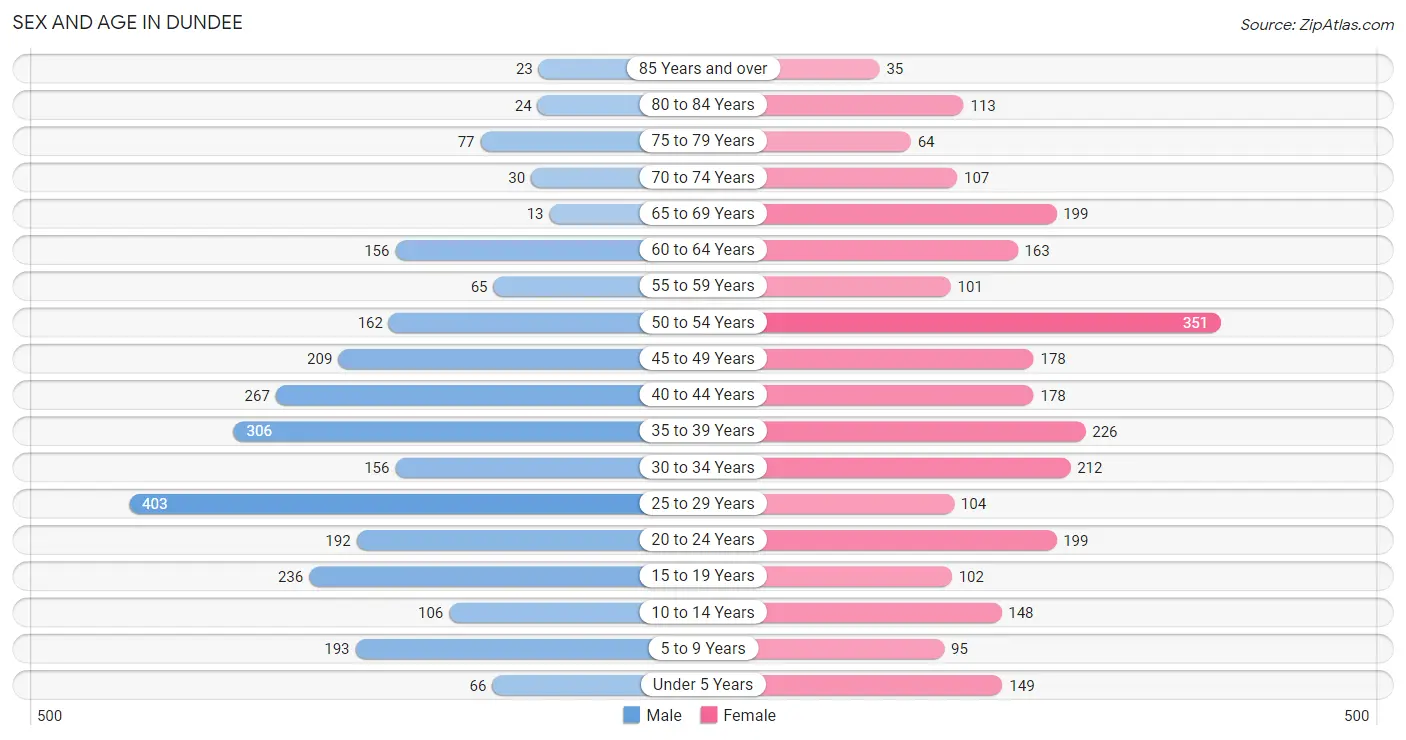
Sex and Age in Dundee
Sex and Age in Dundee
The most populous age groups in Dundee are 25 to 29 Years (403 | 15.0%) for men and 50 to 54 Years (351 | 12.9%) for women.
| Age Bracket | Male | Female |
| Under 5 Years | 66 (2.5%) | 149 (5.5%) |
| 5 to 9 Years | 193 (7.2%) | 95 (3.5%) |
| 10 to 14 Years | 106 (4.0%) | 148 (5.4%) |
| 15 to 19 Years | 236 (8.8%) | 102 (3.7%) |
| 20 to 24 Years | 192 (7.1%) | 199 (7.3%) |
| 25 to 29 Years | 403 (15.0%) | 104 (3.8%) |
| 30 to 34 Years | 156 (5.8%) | 212 (7.8%) |
| 35 to 39 Years | 306 (11.4%) | 226 (8.3%) |
| 40 to 44 Years | 267 (10.0%) | 178 (6.5%) |
| 45 to 49 Years | 209 (7.8%) | 178 (6.5%) |
| 50 to 54 Years | 162 (6.0%) | 351 (12.9%) |
| 55 to 59 Years | 65 (2.4%) | 101 (3.7%) |
| 60 to 64 Years | 156 (5.8%) | 163 (6.0%) |
| 65 to 69 Years | 13 (0.5%) | 199 (7.3%) |
| 70 to 74 Years | 30 (1.1%) | 107 (3.9%) |
| 75 to 79 Years | 77 (2.9%) | 64 (2.4%) |
| 80 to 84 Years | 24 (0.9%) | 113 (4.2%) |
| 85 Years and over | 23 (0.9%) | 35 (1.3%) |
| Total | 2,684 (100.0%) | 2,724 (100.0%) |
Families and Households in Dundee
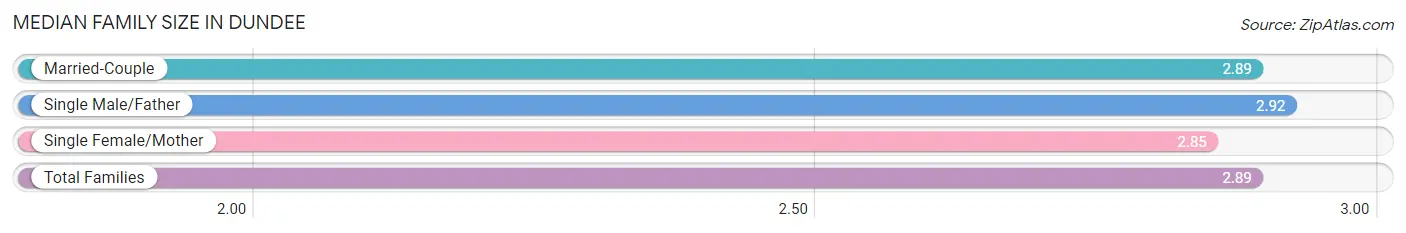
Median Family Size in Dundee
The median family size in Dundee is 2.89 persons per family, with single male/father families (49 | 4.0%) accounting for the largest median family size of 2.92 persons per family. On the other hand, single female/mother families (157 | 12.7%) represent the smallest median family size with 2.85 persons per family.
| Family Type | # Families | Family Size |
| Married-Couple | 1,028 (83.3%) | 2.89 |
| Single Male/Father | 49 (4.0%) | 2.92 |
| Single Female/Mother | 157 (12.7%) | 2.85 |
| Total Families | 1,234 (100.0%) | 2.89 |
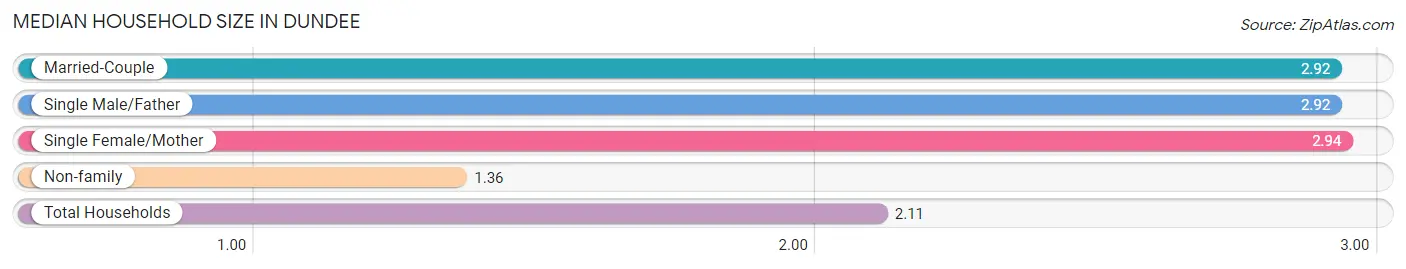
Median Household Size in Dundee
The median household size in Dundee is 2.11 persons per household, with single female/mother households (157 | 6.1%) accounting for the largest median household size of 2.94 persons per household. non-family households (1,324 | 51.8%) represent the smallest median household size with 1.36 persons per household.
| Household Type | # Households | Household Size |
| Married-Couple | 1,028 (40.2%) | 2.92 |
| Single Male/Father | 49 (1.9%) | 2.92 |
| Single Female/Mother | 157 (6.1%) | 2.94 |
| Non-family | 1,324 (51.8%) | 1.36 |
| Total Households | 2,558 (100.0%) | 2.11 |
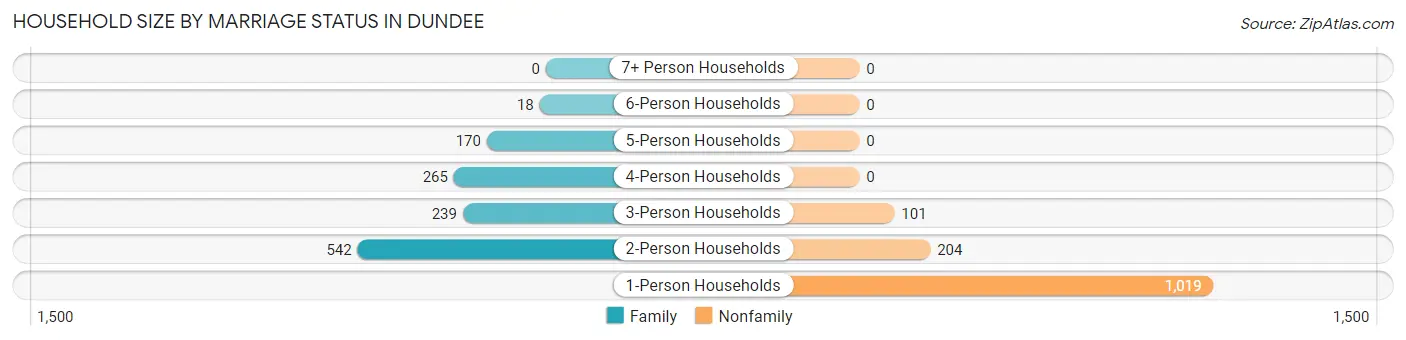
Household Size by Marriage Status in Dundee
Out of a total of 2,558 households in Dundee, 1,234 (48.2%) are family households, while 1,324 (51.8%) are nonfamily households. The most numerous type of family households are 2-person households, comprising 542, and the most common type of nonfamily households are 1-person households, comprising 1,019.
| Household Size | Family Households | Nonfamily Households |
| 1-Person Households | - | 1,019 (39.8%) |
| 2-Person Households | 542 (21.2%) | 204 (8.0%) |
| 3-Person Households | 239 (9.3%) | 101 (4.0%) |
| 4-Person Households | 265 (10.4%) | 0 (0.0%) |
| 5-Person Households | 170 (6.7%) | 0 (0.0%) |
| 6-Person Households | 18 (0.7%) | 0 (0.0%) |
| 7+ Person Households | 0 (0.0%) | 0 (0.0%) |
| Total | 1,234 (48.2%) | 1,324 (51.8%) |
Female Fertility in Dundee
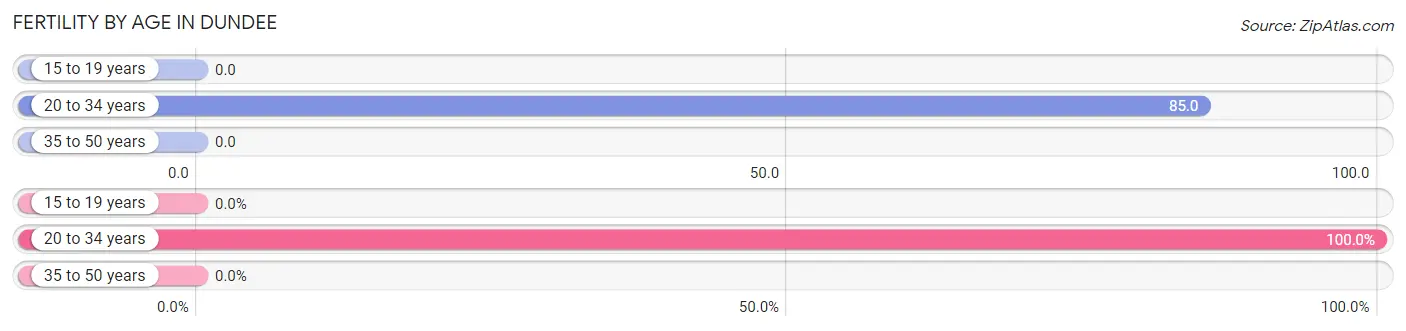
Fertility by Age in Dundee
Average fertility rate in Dundee is 35.0 births per 1,000 women. Women in the age bracket of 20 to 34 years have the highest fertility rate with 85.0 births per 1,000 women. Women in the age bracket of 20 to 34 years acount for 100.0% of all women with births.
| Age Bracket | Women with Births | Births / 1,000 Women |
| 15 to 19 years | 0 (0.0%) | 0.0 |
| 20 to 34 years | 44 (100.0%) | 85.0 |
| 35 to 50 years | 0 (0.0%) | 0.0 |
| Total | 44 (100.0%) | 35.0 |
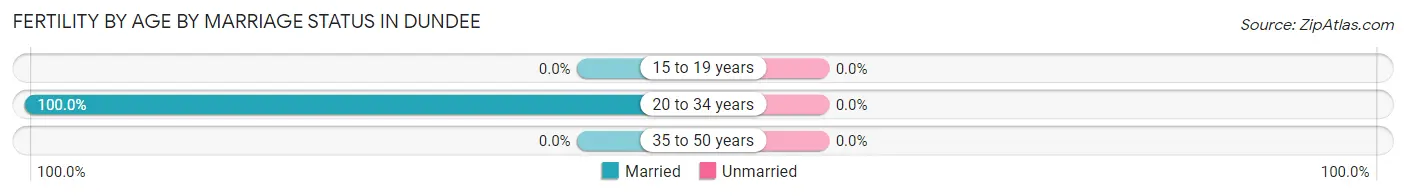
Fertility by Age by Marriage Status in Dundee
| Age Bracket | Married | Unmarried |
| 15 to 19 years | 0 (0.0%) | 0 (0.0%) |
| 20 to 34 years | 44 (100.0%) | 0 (0.0%) |
| 35 to 50 years | 0 (0.0%) | 0 (0.0%) |
| Total | 44 (100.0%) | 0 (0.0%) |
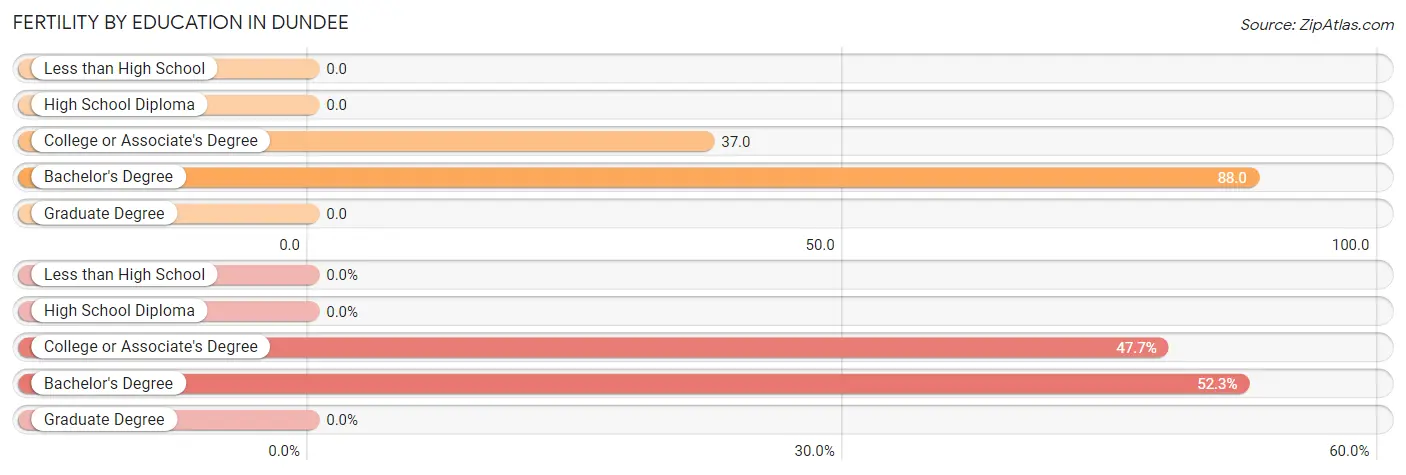
Fertility by Education in Dundee
| Educational Attainment | Women with Births | Births / 1,000 Women |
| Less than High School | 0 (0.0%) | 0.0 |
| High School Diploma | 0 (0.0%) | 0.0 |
| College or Associate's Degree | 21 (47.7%) | 37.0 |
| Bachelor's Degree | 23 (52.3%) | 88.0 |
| Graduate Degree | 0 (0.0%) | 0.0 |
| Total | 44 (100.0%) | 35.0 |
Fertility by Education by Marriage Status in Dundee
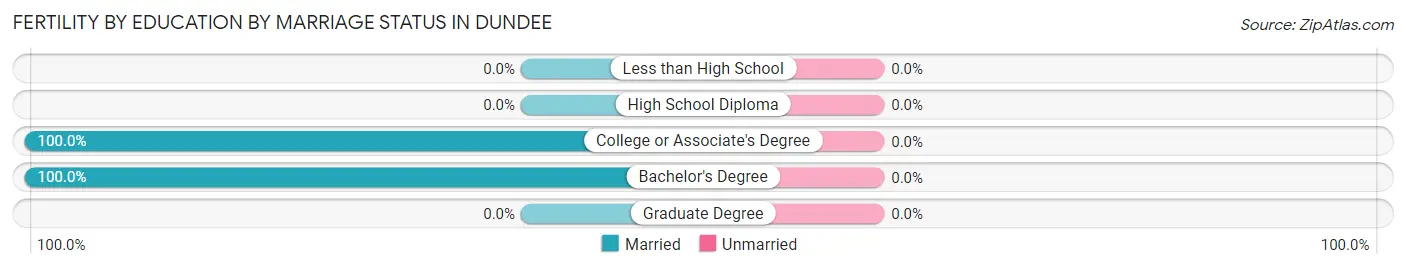
| Educational Attainment | Married | Unmarried |
| Less than High School | 0 (0.0%) | 0 (0.0%) |
| High School Diploma | 0 (0.0%) | 0 (0.0%) |
| College or Associate's Degree | 21 (100.0%) | 0 (0.0%) |
| Bachelor's Degree | 23 (100.0%) | 0 (0.0%) |
| Graduate Degree | 0 (0.0%) | 0 (0.0%) |
| Total | 44 (100.0%) | 0 (0.0%) |
Employment Characteristics in Dundee
Employment by Class of Employer in Dundee
Among the 2,851 employed individuals in Dundee, private company employees (2,202 | 77.2%), state government employees (206 | 7.2%), and not-for-profit organizations (200 | 7.0%) make up the most common classes of employment.
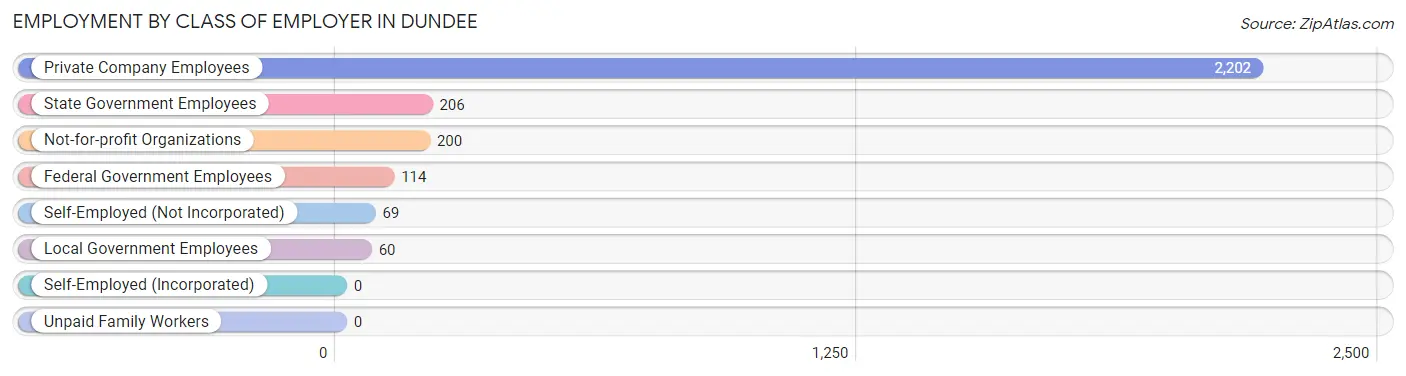
| Employer Class | # Employees | % Employees |
| Private Company Employees | 2,202 | 77.2% |
| Self-Employed (Incorporated) | 0 | 0.0% |
| Self-Employed (Not Incorporated) | 69 | 2.4% |
| Not-for-profit Organizations | 200 | 7.0% |
| Local Government Employees | 60 | 2.1% |
| State Government Employees | 206 | 7.2% |
| Federal Government Employees | 114 | 4.0% |
| Unpaid Family Workers | 0 | 0.0% |
| Total | 2,851 | 100.0% |
Employment Status by Age in Dundee
According to the labor force statistics for Dundee, out of the total population over 16 years of age (4,498), 71.0% or 3,194 individuals are in the labor force, with 7.5% or 240 of them unemployed. The age group with the highest labor force participation rate is 25 to 29 years, with 93.1% or 472 individuals in the labor force. Within the labor force, the 25 to 29 years age range has the highest percentage of unemployed individuals, with 36.4% or 172 of them being unemployed.
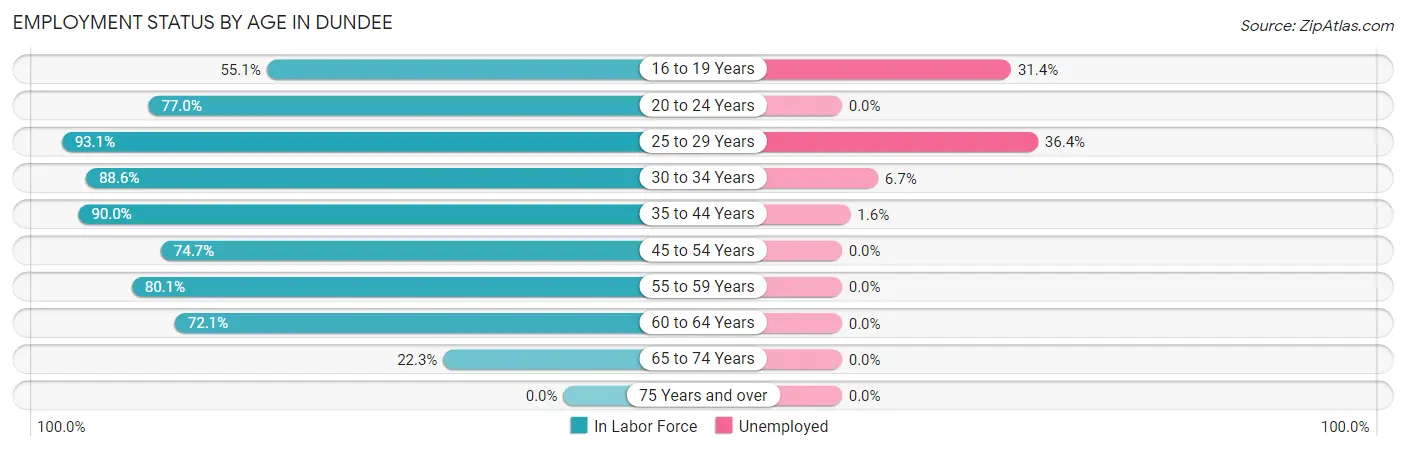
| Age Bracket | In Labor Force | Unemployed |
| 16 to 19 Years | 102 (55.1%) | 32 (31.4%) |
| 20 to 24 Years | 301 (77.0%) | 0 (0.0%) |
| 25 to 29 Years | 472 (93.1%) | 172 (36.4%) |
| 30 to 34 Years | 326 (88.6%) | 22 (6.7%) |
| 35 to 44 Years | 879 (90.0%) | 14 (1.6%) |
| 45 to 54 Years | 672 (74.7%) | 0 (0.0%) |
| 55 to 59 Years | 133 (80.1%) | 0 (0.0%) |
| 60 to 64 Years | 230 (72.1%) | 0 (0.0%) |
| 65 to 74 Years | 78 (22.3%) | 0 (0.0%) |
| 75 Years and over | 0 (0.0%) | 0 (0.0%) |
| Total | 3,194 (71.0%) | 240 (7.5%) |
Employment Status by Educational Attainment in Dundee
According to labor force statistics for Dundee, 83.8% of individuals (2,713) out of the total population between 25 and 64 years of age (3,237) are in the labor force, with 7.7% or 209 of them being unemployed. The group with the highest labor force participation rate are those with the educational attainment of bachelor's degree or higher, with 91.3% or 954 individuals in the labor force. Within the labor force, individuals with high school diploma education have the highest percentage of unemployment, with 18.3% or 152 of them being unemployed.
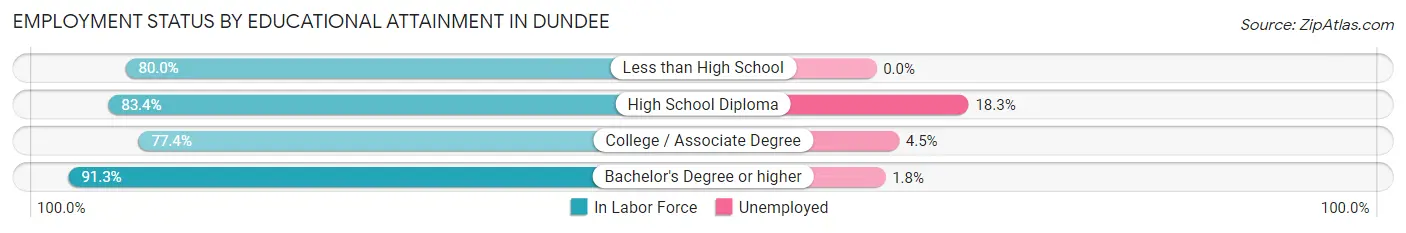
| Educational Attainment | In Labor Force | Unemployed |
| Less than High School | 56 (80.0%) | 0 (0.0%) |
| High School Diploma | 830 (83.4%) | 182 (18.3%) |
| College / Associate Degree | 872 (77.4%) | 51 (4.5%) |
| Bachelor's Degree or higher | 954 (91.3%) | 19 (1.8%) |
| Total | 2,713 (83.8%) | 249 (7.7%) |
Employment Occupations by Sex in Dundee
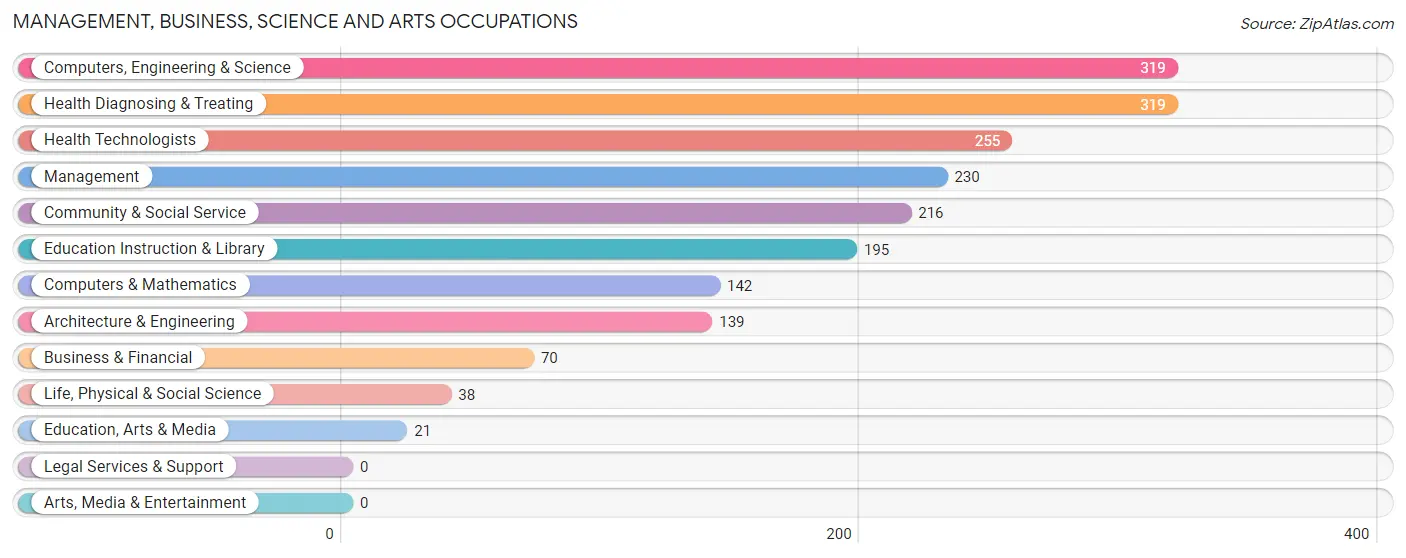
Management, Business, Science and Arts Occupations
The most common Management, Business, Science and Arts occupations in Dundee are Computers, Engineering & Science (319 | 10.8%), Health Diagnosing & Treating (319 | 10.8%), Health Technologists (255 | 8.6%), Management (230 | 7.8%), and Community & Social Service (216 | 7.3%).
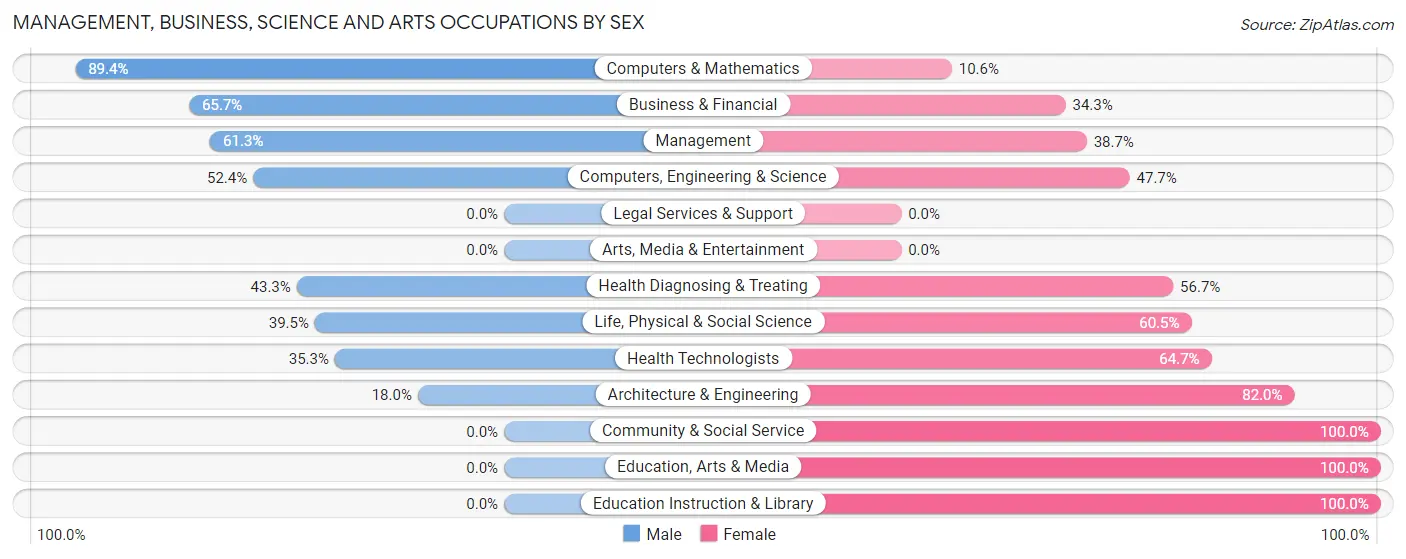
Management, Business, Science and Arts Occupations by Sex
Within the Management, Business, Science and Arts occupations in Dundee, the most male-oriented occupations are Computers & Mathematics (89.4%), Business & Financial (65.7%), and Management (61.3%), while the most female-oriented occupations are Community & Social Service (100.0%), Education, Arts & Media (100.0%), and Education Instruction & Library (100.0%).
| Occupation | Male | Female |
| Management | 141 (61.3%) | 89 (38.7%) |
| Business & Financial | 46 (65.7%) | 24 (34.3%) |
| Computers, Engineering & Science | 167 (52.3%) | 152 (47.6%) |
| Computers & Mathematics | 127 (89.4%) | 15 (10.6%) |
| Architecture & Engineering | 25 (18.0%) | 114 (82.0%) |
| Life, Physical & Social Science | 15 (39.5%) | 23 (60.5%) |
| Community & Social Service | 0 (0.0%) | 216 (100.0%) |
| Education, Arts & Media | 0 (0.0%) | 21 (100.0%) |
| Legal Services & Support | 0 (0.0%) | 0 (0.0%) |
| Education Instruction & Library | 0 (0.0%) | 195 (100.0%) |
| Arts, Media & Entertainment | 0 (0.0%) | 0 (0.0%) |
| Health Diagnosing & Treating | 138 (43.3%) | 181 (56.7%) |
| Health Technologists | 90 (35.3%) | 165 (64.7%) |
| Total (Category) | 492 (42.6%) | 662 (57.4%) |
| Total (Overall) | 1,575 (53.3%) | 1,378 (46.7%) |
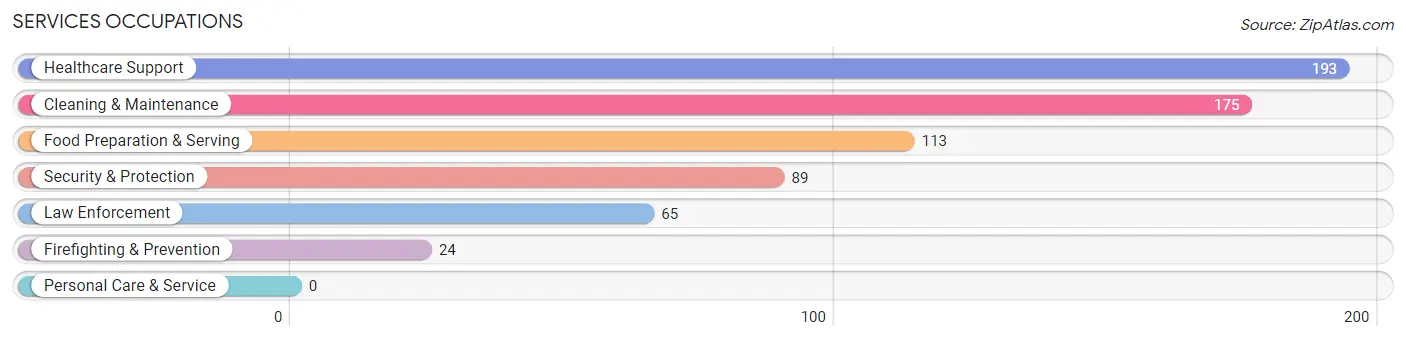
Services Occupations
The most common Services occupations in Dundee are Healthcare Support (193 | 6.5%), Cleaning & Maintenance (175 | 5.9%), Food Preparation & Serving (113 | 3.8%), Security & Protection (89 | 3.0%), and Law Enforcement (65 | 2.2%).
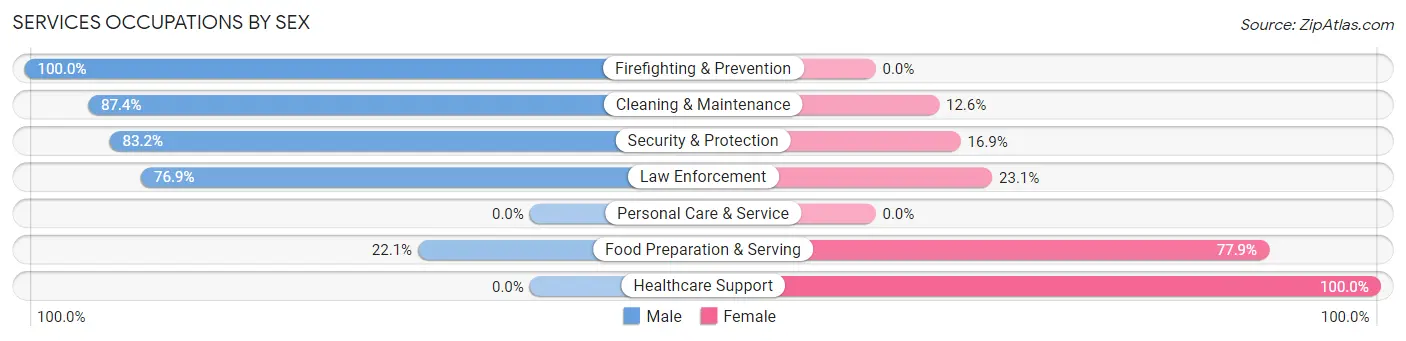
Services Occupations by Sex
Within the Services occupations in Dundee, the most male-oriented occupations are Firefighting & Prevention (100.0%), Cleaning & Maintenance (87.4%), and Security & Protection (83.2%), while the most female-oriented occupations are Healthcare Support (100.0%), Food Preparation & Serving (77.9%), and Law Enforcement (23.1%).
| Occupation | Male | Female |
| Healthcare Support | 0 (0.0%) | 193 (100.0%) |
| Security & Protection | 74 (83.2%) | 15 (16.9%) |
| Firefighting & Prevention | 24 (100.0%) | 0 (0.0%) |
| Law Enforcement | 50 (76.9%) | 15 (23.1%) |
| Food Preparation & Serving | 25 (22.1%) | 88 (77.9%) |
| Cleaning & Maintenance | 153 (87.4%) | 22 (12.6%) |
| Personal Care & Service | 0 (0.0%) | 0 (0.0%) |
| Total (Category) | 252 (44.2%) | 318 (55.8%) |
| Total (Overall) | 1,575 (53.3%) | 1,378 (46.7%) |
Sales and Office Occupations
The most common Sales and Office occupations in Dundee are Office & Administration (323 | 10.9%), and Sales & Related (108 | 3.7%).

Sales and Office Occupations by Sex
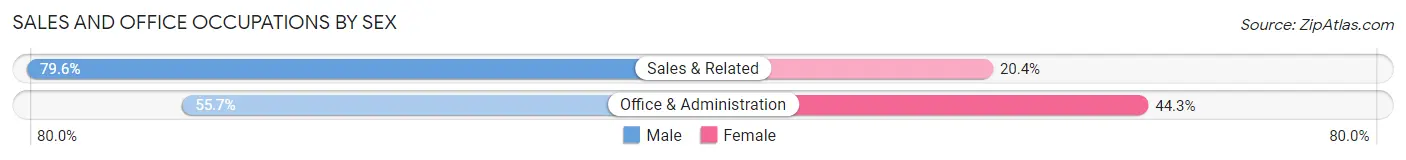
| Occupation | Male | Female |
| Sales & Related | 86 (79.6%) | 22 (20.4%) |
| Office & Administration | 180 (55.7%) | 143 (44.3%) |
| Total (Category) | 266 (61.7%) | 165 (38.3%) |
| Total (Overall) | 1,575 (53.3%) | 1,378 (46.7%) |
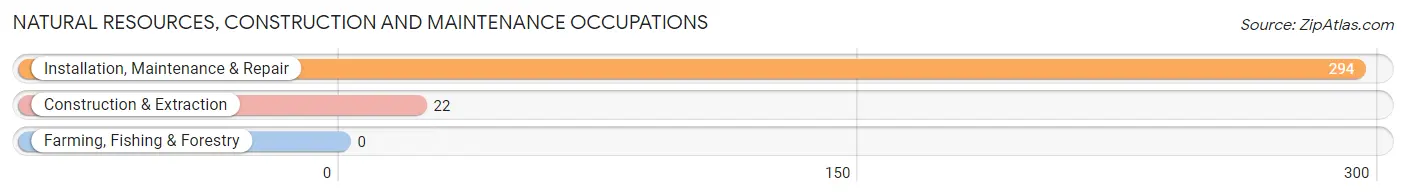
Natural Resources, Construction and Maintenance Occupations
The most common Natural Resources, Construction and Maintenance occupations in Dundee are Installation, Maintenance & Repair (294 | 10.0%), and Construction & Extraction (22 | 0.7%).
Natural Resources, Construction and Maintenance Occupations by Sex
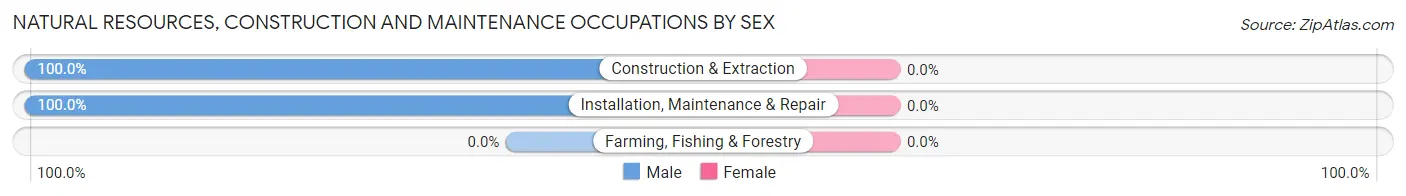
| Occupation | Male | Female |
| Farming, Fishing & Forestry | 0 (0.0%) | 0 (0.0%) |
| Construction & Extraction | 22 (100.0%) | 0 (0.0%) |
| Installation, Maintenance & Repair | 294 (100.0%) | 0 (0.0%) |
| Total (Category) | 316 (100.0%) | 0 (0.0%) |
| Total (Overall) | 1,575 (53.3%) | 1,378 (46.7%) |
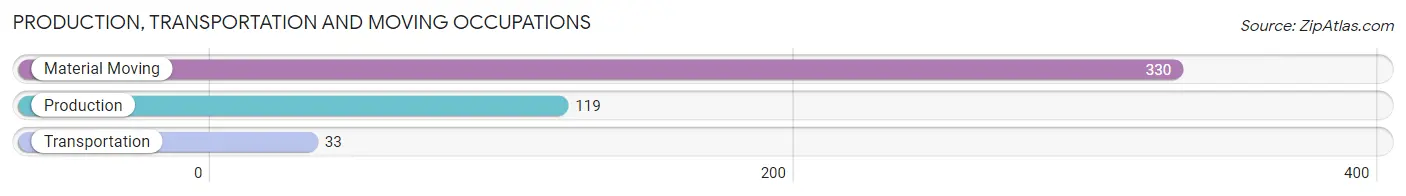
Production, Transportation and Moving Occupations
The most common Production, Transportation and Moving occupations in Dundee are Material Moving (330 | 11.2%), Production (119 | 4.0%), and Transportation (33 | 1.1%).
Production, Transportation and Moving Occupations by Sex
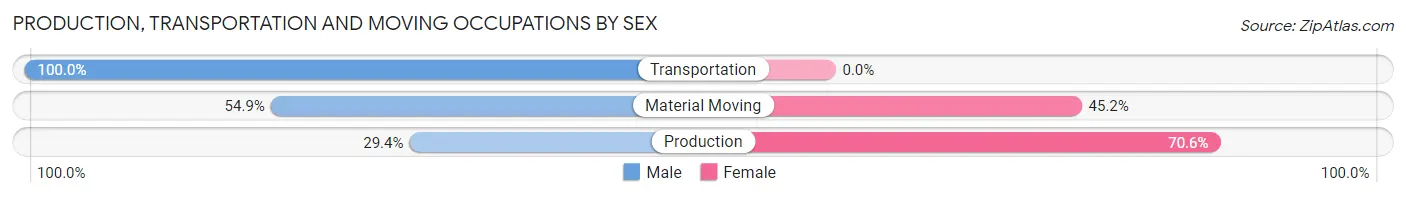
| Occupation | Male | Female |
| Production | 35 (29.4%) | 84 (70.6%) |
| Transportation | 33 (100.0%) | 0 (0.0%) |
| Material Moving | 181 (54.8%) | 149 (45.2%) |
| Total (Category) | 249 (51.7%) | 233 (48.3%) |
| Total (Overall) | 1,575 (53.3%) | 1,378 (46.7%) |
Employment Industries by Sex in Dundee
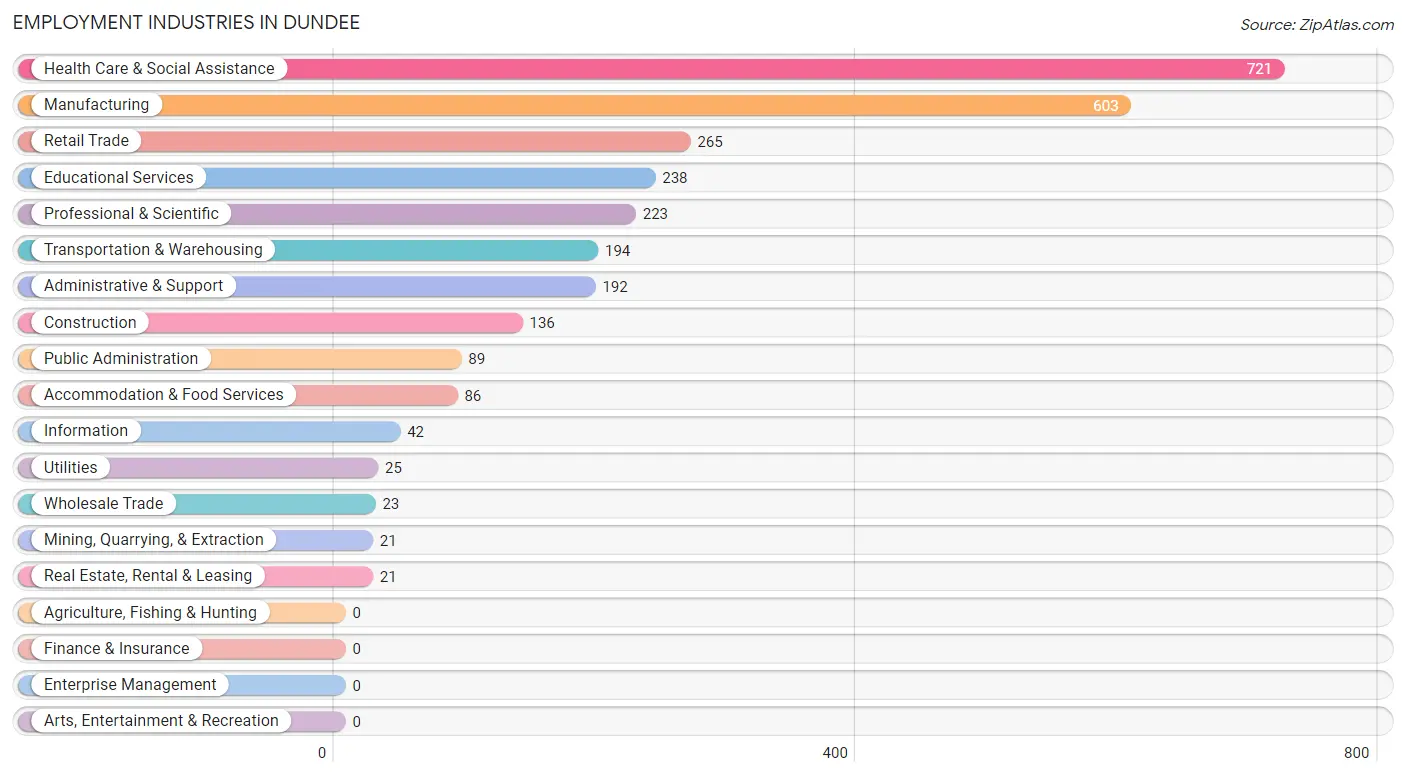
Employment Industries in Dundee
The major employment industries in Dundee include Health Care & Social Assistance (721 | 24.4%), Manufacturing (603 | 20.4%), Retail Trade (265 | 9.0%), Educational Services (238 | 8.1%), and Professional & Scientific (223 | 7.5%).
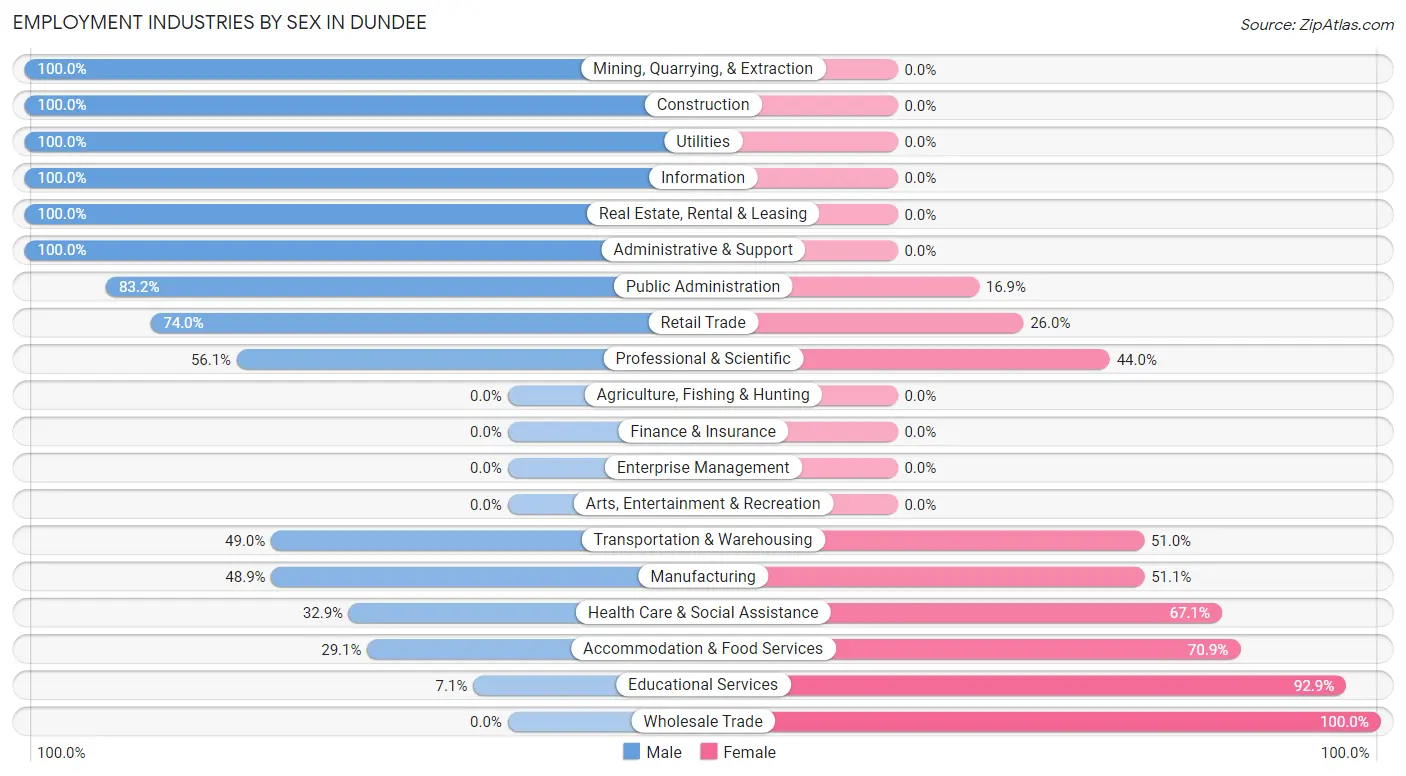
Employment Industries by Sex in Dundee
The Dundee industries that see more men than women are Mining, Quarrying, & Extraction (100.0%), Construction (100.0%), and Utilities (100.0%), whereas the industries that tend to have a higher number of women are Wholesale Trade (100.0%), Educational Services (92.9%), and Accommodation & Food Services (70.9%).
| Industry | Male | Female |
| Agriculture, Fishing & Hunting | 0 (0.0%) | 0 (0.0%) |
| Mining, Quarrying, & Extraction | 21 (100.0%) | 0 (0.0%) |
| Construction | 136 (100.0%) | 0 (0.0%) |
| Manufacturing | 295 (48.9%) | 308 (51.1%) |
| Wholesale Trade | 0 (0.0%) | 23 (100.0%) |
| Retail Trade | 196 (74.0%) | 69 (26.0%) |
| Transportation & Warehousing | 95 (49.0%) | 99 (51.0%) |
| Utilities | 25 (100.0%) | 0 (0.0%) |
| Information | 42 (100.0%) | 0 (0.0%) |
| Finance & Insurance | 0 (0.0%) | 0 (0.0%) |
| Real Estate, Rental & Leasing | 21 (100.0%) | 0 (0.0%) |
| Professional & Scientific | 125 (56.0%) | 98 (44.0%) |
| Enterprise Management | 0 (0.0%) | 0 (0.0%) |
| Administrative & Support | 192 (100.0%) | 0 (0.0%) |
| Educational Services | 17 (7.1%) | 221 (92.9%) |
| Health Care & Social Assistance | 237 (32.9%) | 484 (67.1%) |
| Arts, Entertainment & Recreation | 0 (0.0%) | 0 (0.0%) |
| Accommodation & Food Services | 25 (29.1%) | 61 (70.9%) |
| Public Administration | 74 (83.2%) | 15 (16.9%) |
| Total | 1,575 (53.3%) | 1,378 (46.7%) |
Education in Dundee
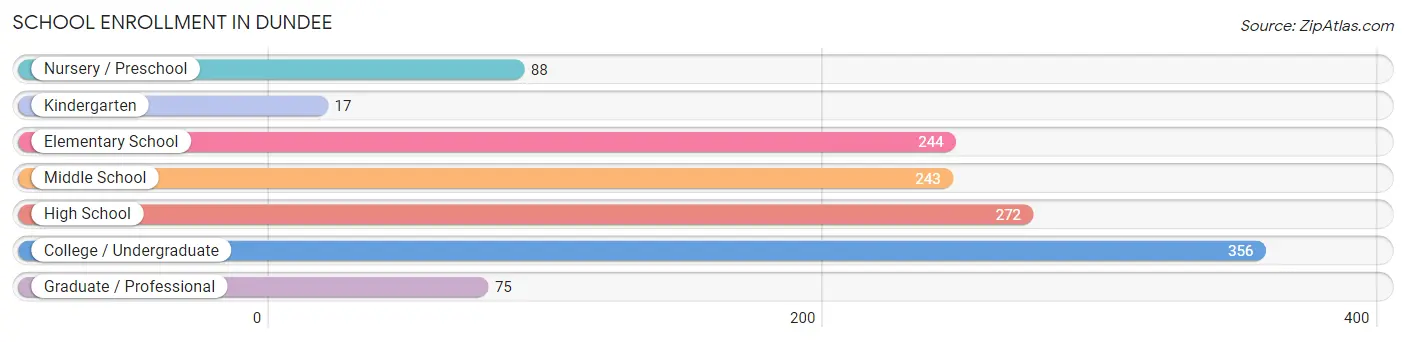
School Enrollment in Dundee
The most common levels of schooling among the 1,295 students in Dundee are college / undergraduate (356 | 27.5%), high school (272 | 21.0%), and elementary school (244 | 18.8%).
| School Level | # Students | % Students |
| Nursery / Preschool | 88 | 6.8% |
| Kindergarten | 17 | 1.3% |
| Elementary School | 244 | 18.8% |
| Middle School | 243 | 18.8% |
| High School | 272 | 21.0% |
| College / Undergraduate | 356 | 27.5% |
| Graduate / Professional | 75 | 5.8% |
| Total | 1,295 | 100.0% |
School Enrollment by Age by Funding Source in Dundee
Out of a total of 1,295 students who are enrolled in schools in Dundee, 119 (9.2%) attend a private institution, while the remaining 1,176 (90.8%) are enrolled in public schools. The age group of 3 to 4 year olds has the highest likelihood of being enrolled in private schools, with 68 (77.3% in the age bracket) enrolled. Conversely, the age group of 5 to 9 year old has the lowest likelihood of being enrolled in a private school, with 261 (100.0% in the age bracket) attending a public institution.
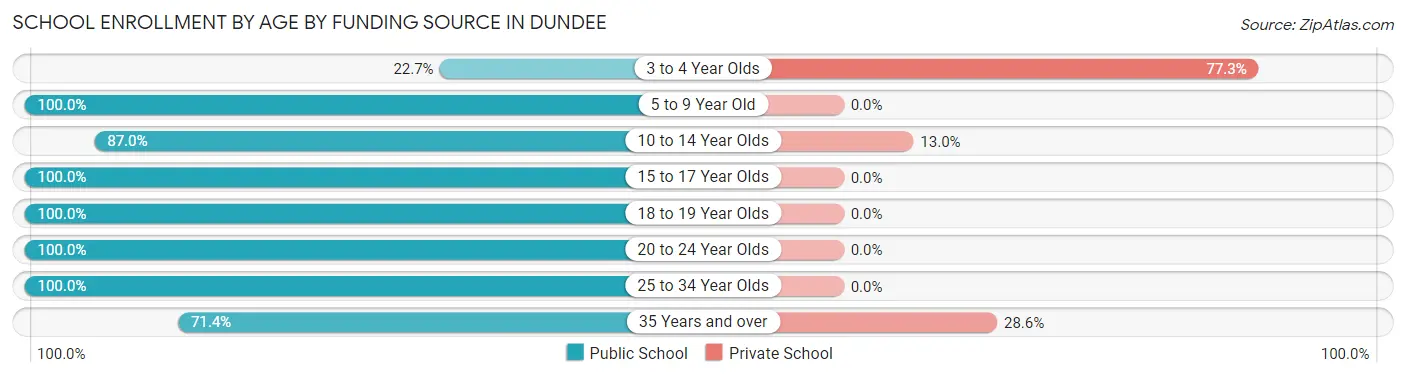
| Age Bracket | Public School | Private School |
| 3 to 4 Year Olds | 20 (22.7%) | 68 (77.3%) |
| 5 to 9 Year Old | 261 (100.0%) | 0 (0.0%) |
| 10 to 14 Year Olds | 221 (87.0%) | 33 (13.0%) |
| 15 to 17 Year Olds | 247 (100.0%) | 0 (0.0%) |
| 18 to 19 Year Olds | 52 (100.0%) | 0 (0.0%) |
| 20 to 24 Year Olds | 188 (100.0%) | 0 (0.0%) |
| 25 to 34 Year Olds | 142 (100.0%) | 0 (0.0%) |
| 35 Years and over | 45 (71.4%) | 18 (28.6%) |
| Total | 1,176 (90.8%) | 119 (9.2%) |
Educational Attainment by Field of Study in Dundee
Education (217 | 17.0%), business (196 | 15.4%), arts & humanities (172 | 13.5%), social sciences (134 | 10.5%), and science & technology (134 | 10.5%) are the most common fields of study among 1,275 individuals in Dundee who have obtained a bachelor's degree or higher.
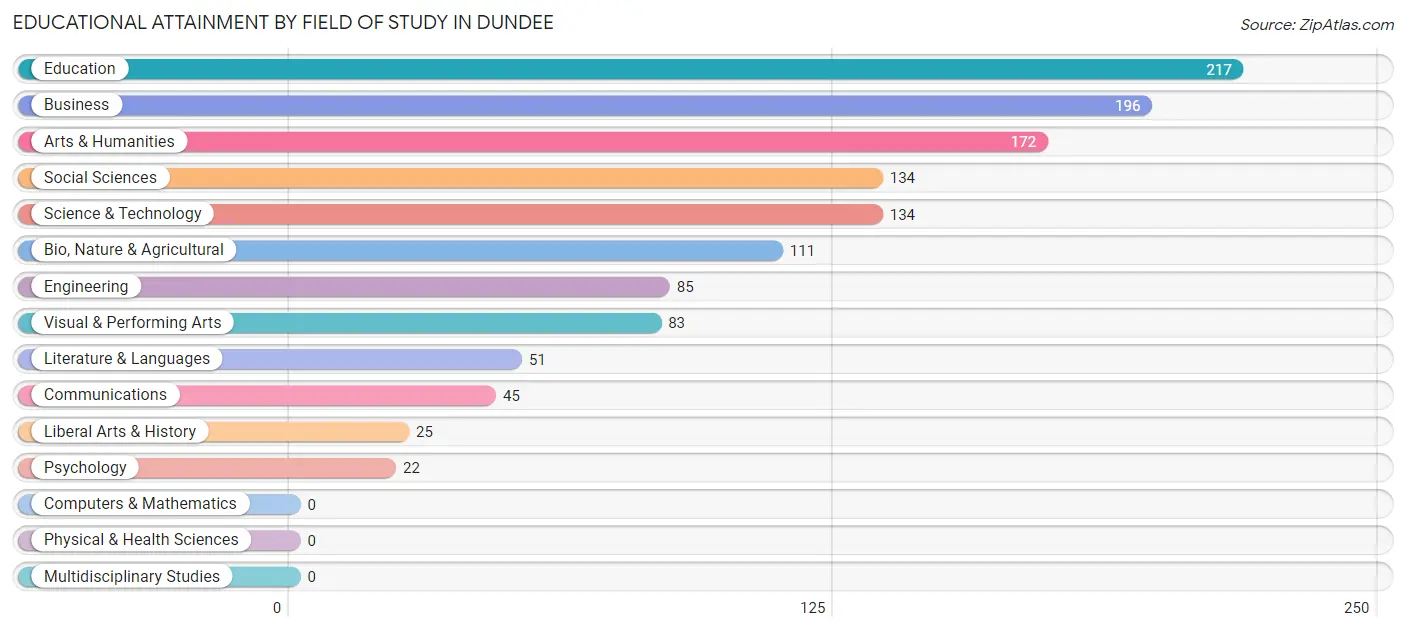
| Field of Study | # Graduates | % Graduates |
| Computers & Mathematics | 0 | 0.0% |
| Bio, Nature & Agricultural | 111 | 8.7% |
| Physical & Health Sciences | 0 | 0.0% |
| Psychology | 22 | 1.7% |
| Social Sciences | 134 | 10.5% |
| Engineering | 85 | 6.7% |
| Multidisciplinary Studies | 0 | 0.0% |
| Science & Technology | 134 | 10.5% |
| Business | 196 | 15.4% |
| Education | 217 | 17.0% |
| Literature & Languages | 51 | 4.0% |
| Liberal Arts & History | 25 | 2.0% |
| Visual & Performing Arts | 83 | 6.5% |
| Communications | 45 | 3.5% |
| Arts & Humanities | 172 | 13.5% |
| Total | 1,275 | 100.0% |
Transportation & Commute in Dundee
Vehicle Availability by Sex in Dundee
The most prevalent vehicle ownership categories in Dundee are males with 2 vehicles (771, accounting for 51.6%) and females with 2 vehicles (603, making up 56.8%).
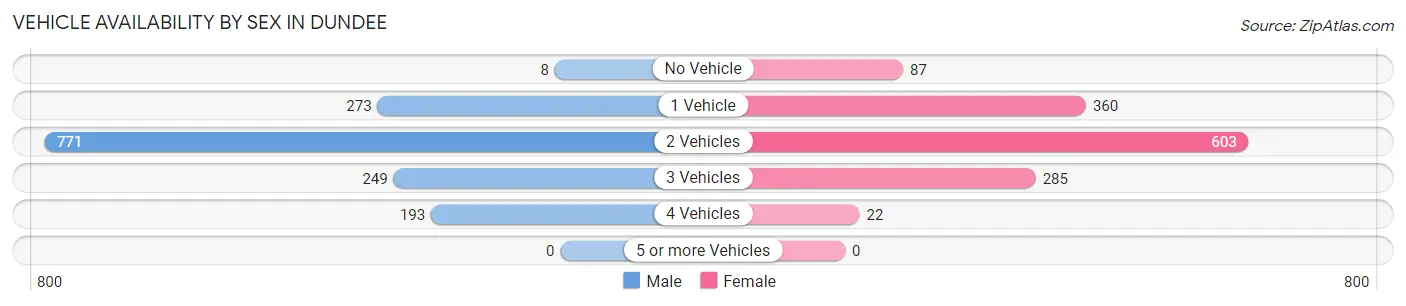
| Vehicles Available | Male | Female |
| No Vehicle | 8 (0.5%) | 87 (6.4%) |
| 1 Vehicle | 273 (18.3%) | 360 (26.5%) |
| 2 Vehicles | 771 (51.6%) | 603 (44.4%) |
| 3 Vehicles | 249 (16.7%) | 285 (21.0%) |
| 4 Vehicles | 193 (12.9%) | 22 (1.6%) |
| 5 or more Vehicles | 0 (0.0%) | 0 (0.0%) |
| Total | 1,494 (100.0%) | 1,357 (100.0%) |
Commute Time in Dundee
The most frequently occuring commute durations in Dundee are 30 to 34 minutes (737 commuters, 28.0%), 35 to 39 minutes (439 commuters, 16.7%), and 20 to 24 minutes (329 commuters, 12.5%).
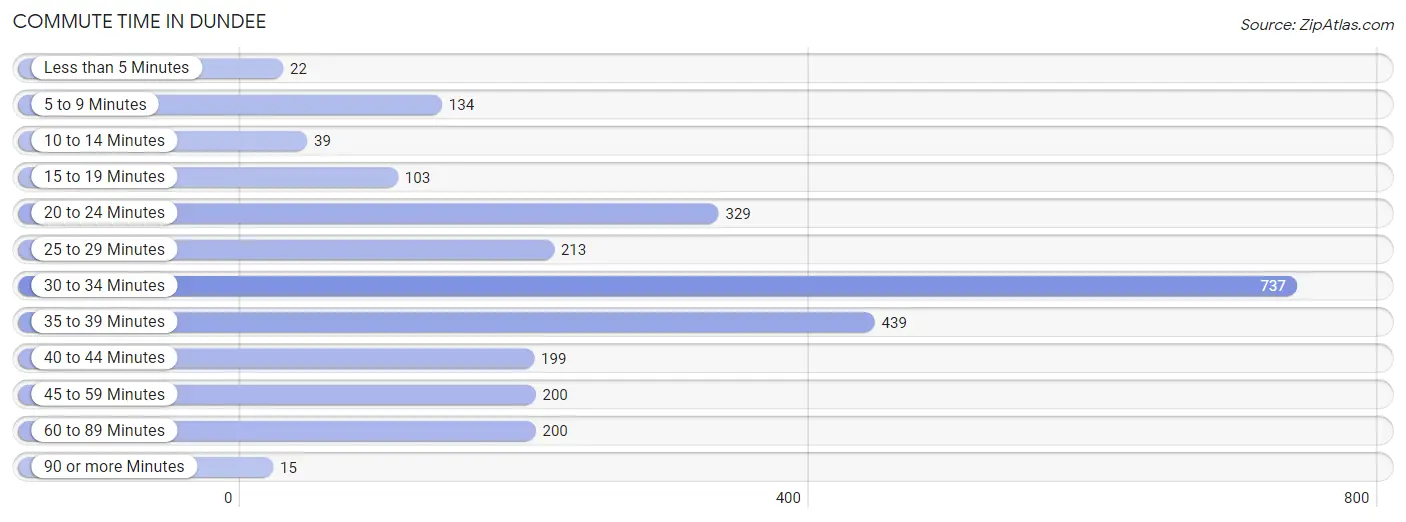
| Commute Time | # Commuters | % Commuters |
| Less than 5 Minutes | 22 | 0.8% |
| 5 to 9 Minutes | 134 | 5.1% |
| 10 to 14 Minutes | 39 | 1.5% |
| 15 to 19 Minutes | 103 | 3.9% |
| 20 to 24 Minutes | 329 | 12.5% |
| 25 to 29 Minutes | 213 | 8.1% |
| 30 to 34 Minutes | 737 | 28.0% |
| 35 to 39 Minutes | 439 | 16.7% |
| 40 to 44 Minutes | 199 | 7.6% |
| 45 to 59 Minutes | 200 | 7.6% |
| 60 to 89 Minutes | 200 | 7.6% |
| 90 or more Minutes | 15 | 0.6% |
Commute Time by Sex in Dundee
The most common commute times in Dundee are 30 to 34 minutes (441 commuters, 30.5%) for males and 30 to 34 minutes (296 commuters, 25.0%) for females.
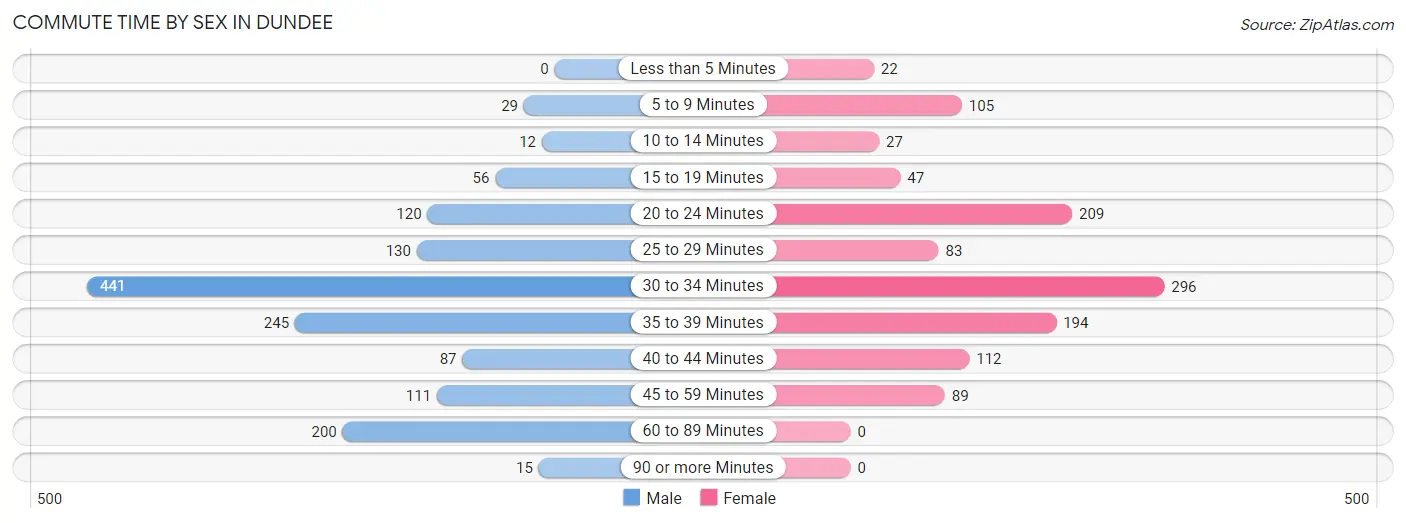
| Commute Time | Male | Female |
| Less than 5 Minutes | 0 (0.0%) | 22 (1.9%) |
| 5 to 9 Minutes | 29 (2.0%) | 105 (8.9%) |
| 10 to 14 Minutes | 12 (0.8%) | 27 (2.3%) |
| 15 to 19 Minutes | 56 (3.9%) | 47 (4.0%) |
| 20 to 24 Minutes | 120 (8.3%) | 209 (17.6%) |
| 25 to 29 Minutes | 130 (9.0%) | 83 (7.0%) |
| 30 to 34 Minutes | 441 (30.5%) | 296 (25.0%) |
| 35 to 39 Minutes | 245 (16.9%) | 194 (16.4%) |
| 40 to 44 Minutes | 87 (6.0%) | 112 (9.5%) |
| 45 to 59 Minutes | 111 (7.7%) | 89 (7.5%) |
| 60 to 89 Minutes | 200 (13.8%) | 0 (0.0%) |
| 90 or more Minutes | 15 (1.0%) | 0 (0.0%) |
Time of Departure to Work by Sex in Dundee
The most frequent times of departure to work in Dundee are 6:00 AM to 6:29 AM (365, 25.2%) for males and 6:00 AM to 6:29 AM (284, 24.0%) for females.
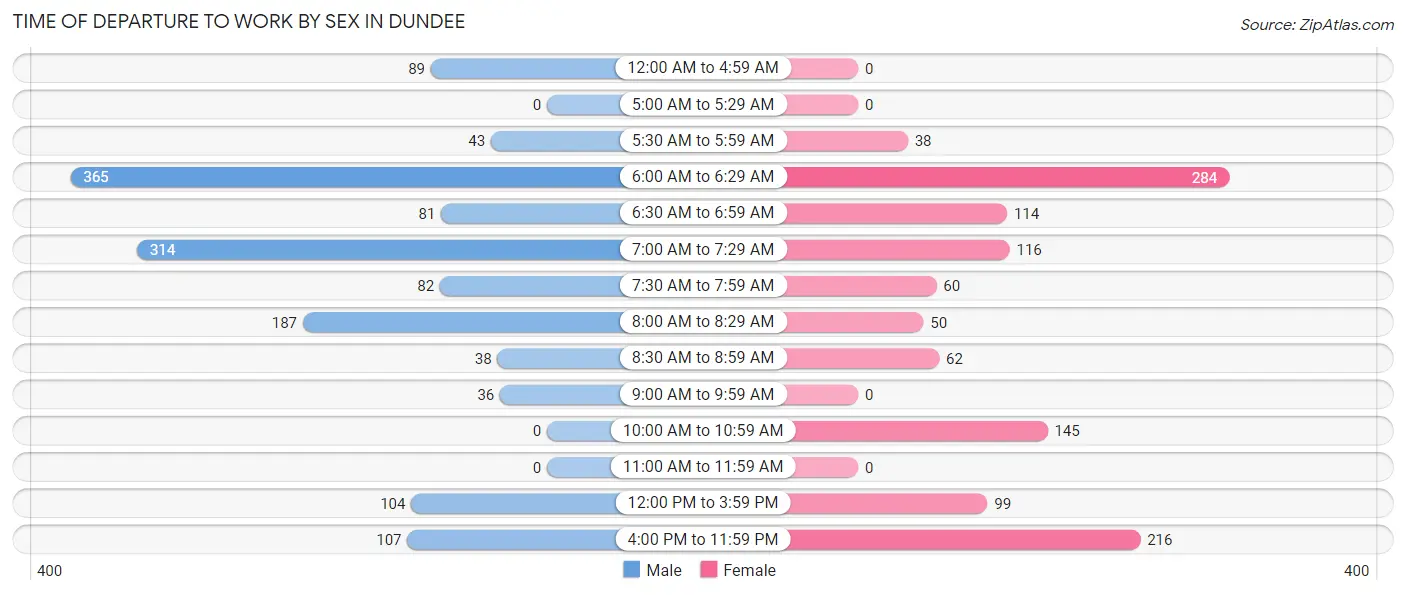
| Time of Departure | Male | Female |
| 12:00 AM to 4:59 AM | 89 (6.1%) | 0 (0.0%) |
| 5:00 AM to 5:29 AM | 0 (0.0%) | 0 (0.0%) |
| 5:30 AM to 5:59 AM | 43 (3.0%) | 38 (3.2%) |
| 6:00 AM to 6:29 AM | 365 (25.2%) | 284 (24.0%) |
| 6:30 AM to 6:59 AM | 81 (5.6%) | 114 (9.6%) |
| 7:00 AM to 7:29 AM | 314 (21.7%) | 116 (9.8%) |
| 7:30 AM to 7:59 AM | 82 (5.7%) | 60 (5.1%) |
| 8:00 AM to 8:29 AM | 187 (12.9%) | 50 (4.2%) |
| 8:30 AM to 8:59 AM | 38 (2.6%) | 62 (5.2%) |
| 9:00 AM to 9:59 AM | 36 (2.5%) | 0 (0.0%) |
| 10:00 AM to 10:59 AM | 0 (0.0%) | 145 (12.2%) |
| 11:00 AM to 11:59 AM | 0 (0.0%) | 0 (0.0%) |
| 12:00 PM to 3:59 PM | 104 (7.2%) | 99 (8.4%) |
| 4:00 PM to 11:59 PM | 107 (7.4%) | 216 (18.2%) |
| Total | 1,446 (100.0%) | 1,184 (100.0%) |
Housing Occupancy in Dundee
Occupancy by Ownership in Dundee
Of the total 2,558 dwellings in Dundee, owner-occupied units account for 1,599 (62.5%), while renter-occupied units make up 959 (37.5%).
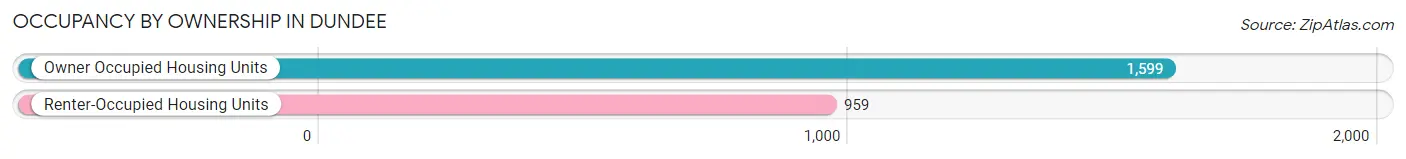
| Occupancy | # Housing Units | % Housing Units |
| Owner Occupied Housing Units | 1,599 | 62.5% |
| Renter-Occupied Housing Units | 959 | 37.5% |
| Total Occupied Housing Units | 2,558 | 100.0% |
Occupancy by Household Size in Dundee
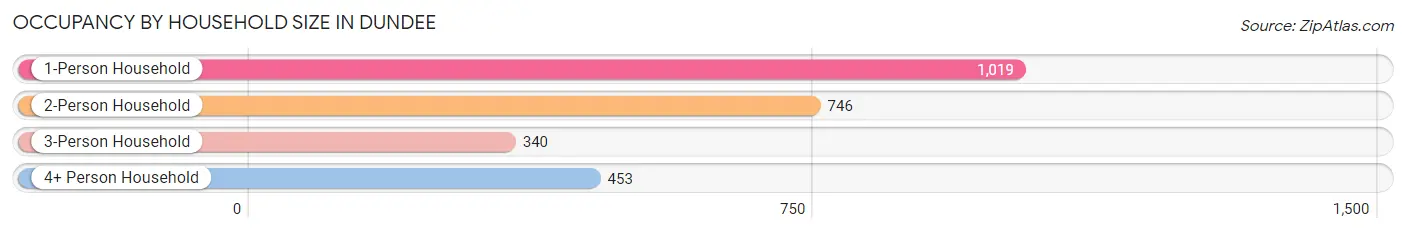
| Household Size | # Housing Units | % Housing Units |
| 1-Person Household | 1,019 | 39.8% |
| 2-Person Household | 746 | 29.2% |
| 3-Person Household | 340 | 13.3% |
| 4+ Person Household | 453 | 17.7% |
| Total Housing Units | 2,558 | 100.0% |
Occupancy by Ownership by Household Size in Dundee
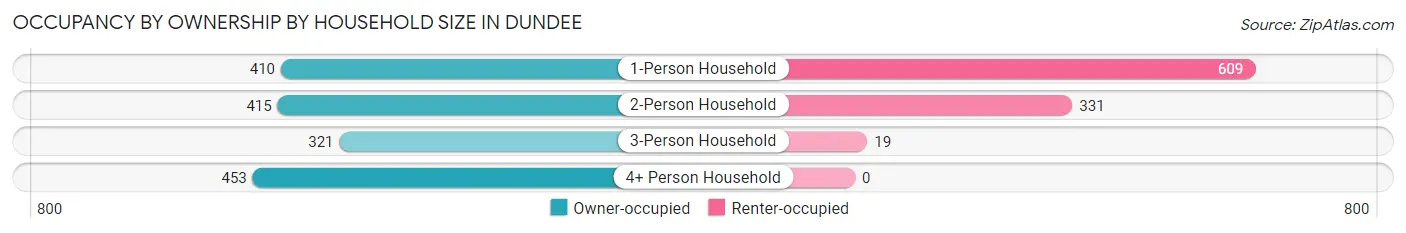
| Household Size | Owner-occupied | Renter-occupied |
| 1-Person Household | 410 (40.2%) | 609 (59.8%) |
| 2-Person Household | 415 (55.6%) | 331 (44.4%) |
| 3-Person Household | 321 (94.4%) | 19 (5.6%) |
| 4+ Person Household | 453 (100.0%) | 0 (0.0%) |
| Total Housing Units | 1,599 (62.5%) | 959 (37.5%) |
Occupancy by Educational Attainment in Dundee
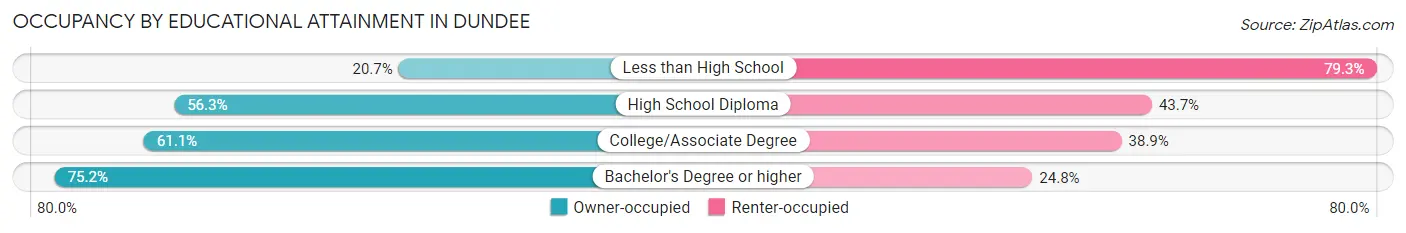
| Household Size | Owner-occupied | Renter-occupied |
| Less than High School | 18 (20.7%) | 69 (79.3%) |
| High School Diploma | 454 (56.3%) | 353 (43.7%) |
| College/Associate Degree | 538 (61.1%) | 343 (38.9%) |
| Bachelor's Degree or higher | 589 (75.2%) | 194 (24.8%) |
Occupancy by Age of Householder in Dundee
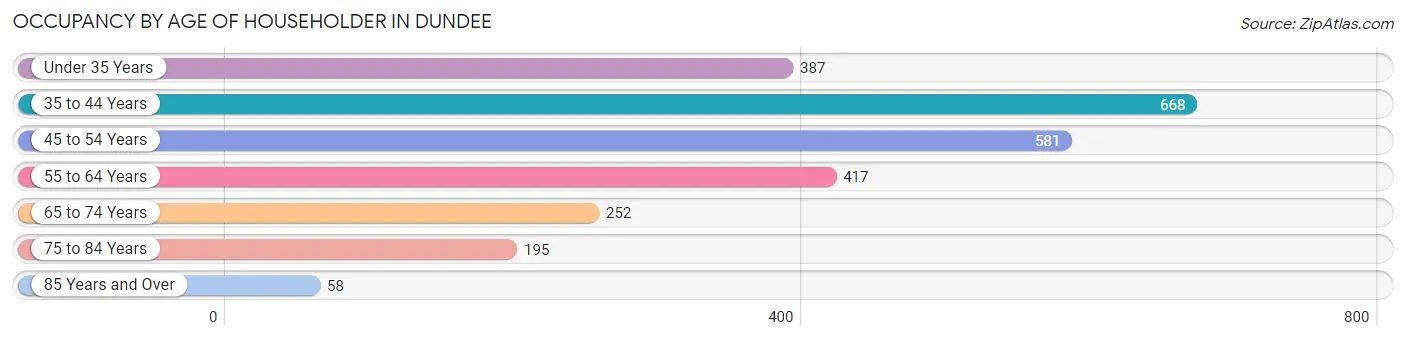
| Age Bracket | # Households | % Households |
| Under 35 Years | 387 | 15.1% |
| 35 to 44 Years | 668 | 26.1% |
| 45 to 54 Years | 581 | 22.7% |
| 55 to 64 Years | 417 | 16.3% |
| 65 to 74 Years | 252 | 9.9% |
| 75 to 84 Years | 195 | 7.6% |
| 85 Years and Over | 58 | 2.3% |
| Total | 2,558 | 100.0% |
Housing Finances in Dundee
Median Income by Occupancy in Dundee
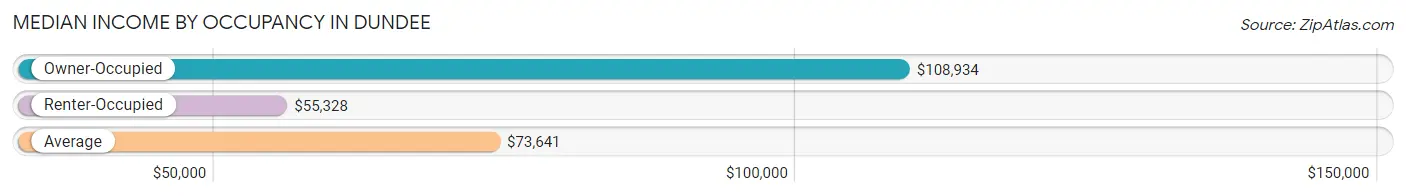
| Occupancy Type | # Households | Median Income |
| Owner-Occupied | 1,599 (62.5%) | $108,934 |
| Renter-Occupied | 959 (37.5%) | $55,328 |
| Average | 2,558 (100.0%) | $73,641 |
Occupancy by Householder Income Bracket in Dundee
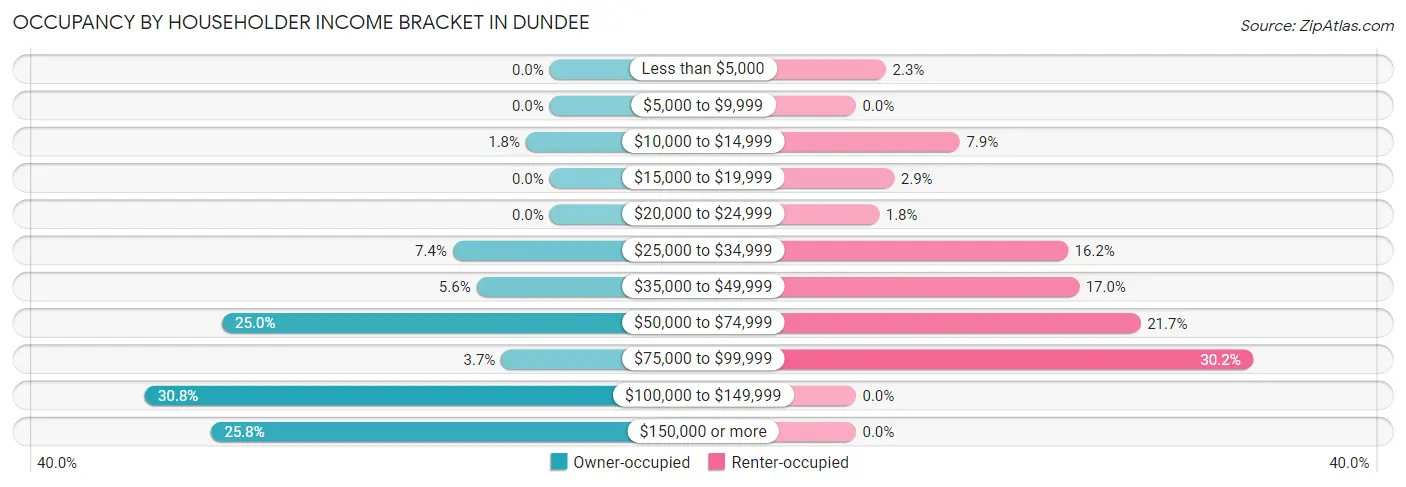
| Income Bracket | Owner-occupied | Renter-occupied |
| Less than $5,000 | 0 (0.0%) | 22 (2.3%) |
| $5,000 to $9,999 | 0 (0.0%) | 0 (0.0%) |
| $10,000 to $14,999 | 29 (1.8%) | 76 (7.9%) |
| $15,000 to $19,999 | 0 (0.0%) | 28 (2.9%) |
| $20,000 to $24,999 | 0 (0.0%) | 17 (1.8%) |
| $25,000 to $34,999 | 118 (7.4%) | 155 (16.2%) |
| $35,000 to $49,999 | 89 (5.6%) | 163 (17.0%) |
| $50,000 to $74,999 | 399 (24.9%) | 208 (21.7%) |
| $75,000 to $99,999 | 59 (3.7%) | 290 (30.2%) |
| $100,000 to $149,999 | 493 (30.8%) | 0 (0.0%) |
| $150,000 or more | 412 (25.8%) | 0 (0.0%) |
| Total | 1,599 (100.0%) | 959 (100.0%) |
Monthly Housing Cost Tiers in Dundee
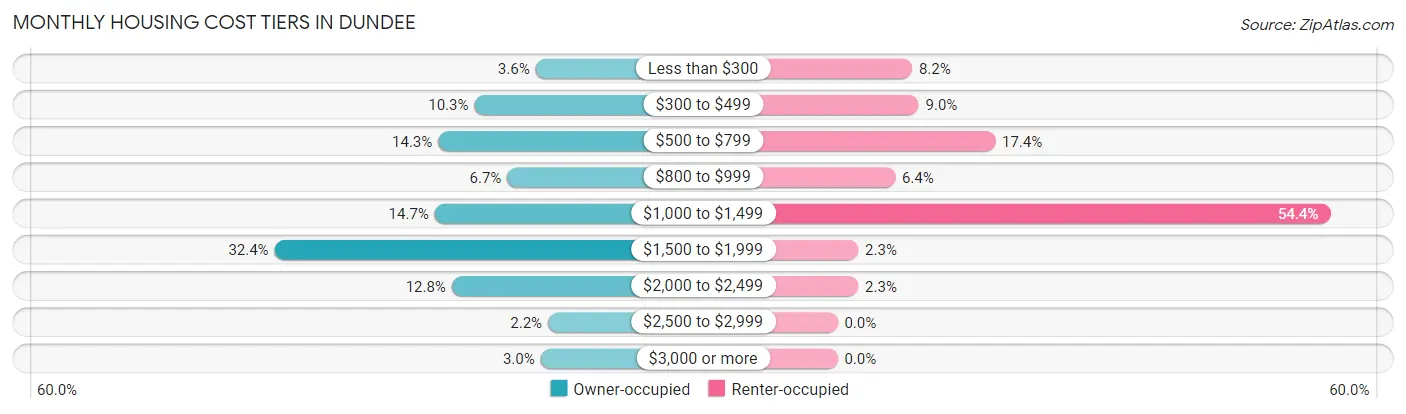
| Monthly Cost | Owner-occupied | Renter-occupied |
| Less than $300 | 57 (3.6%) | 79 (8.2%) |
| $300 to $499 | 165 (10.3%) | 86 (9.0%) |
| $500 to $799 | 229 (14.3%) | 167 (17.4%) |
| $800 to $999 | 107 (6.7%) | 61 (6.4%) |
| $1,000 to $1,499 | 235 (14.7%) | 522 (54.4%) |
| $1,500 to $1,999 | 518 (32.4%) | 22 (2.3%) |
| $2,000 to $2,499 | 205 (12.8%) | 22 (2.3%) |
| $2,500 to $2,999 | 35 (2.2%) | 0 (0.0%) |
| $3,000 or more | 48 (3.0%) | 0 (0.0%) |
| Total | 1,599 (100.0%) | 959 (100.0%) |
Physical Housing Characteristics in Dundee
Housing Structures in Dundee
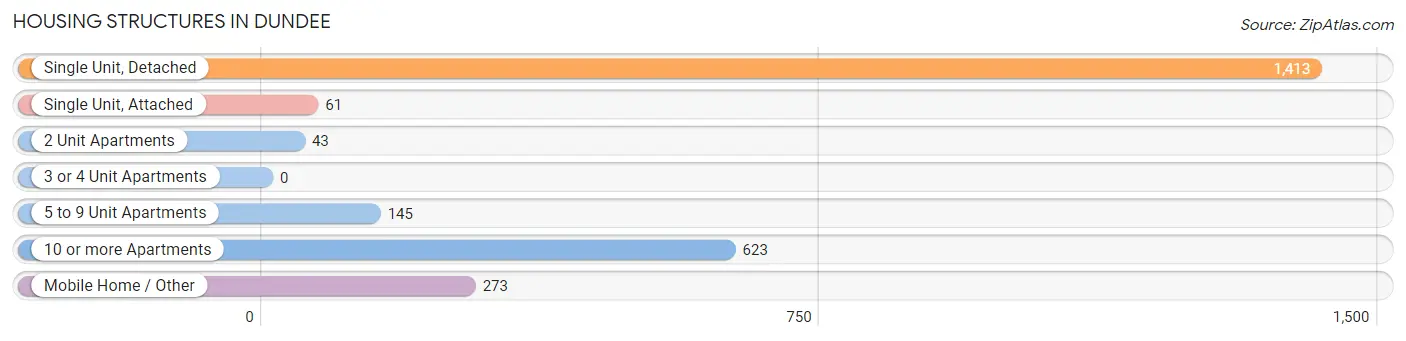
| Structure Type | # Housing Units | % Housing Units |
| Single Unit, Detached | 1,413 | 55.2% |
| Single Unit, Attached | 61 | 2.4% |
| 2 Unit Apartments | 43 | 1.7% |
| 3 or 4 Unit Apartments | 0 | 0.0% |
| 5 to 9 Unit Apartments | 145 | 5.7% |
| 10 or more Apartments | 623 | 24.3% |
| Mobile Home / Other | 273 | 10.7% |
| Total | 2,558 | 100.0% |
Housing Structures by Occupancy in Dundee
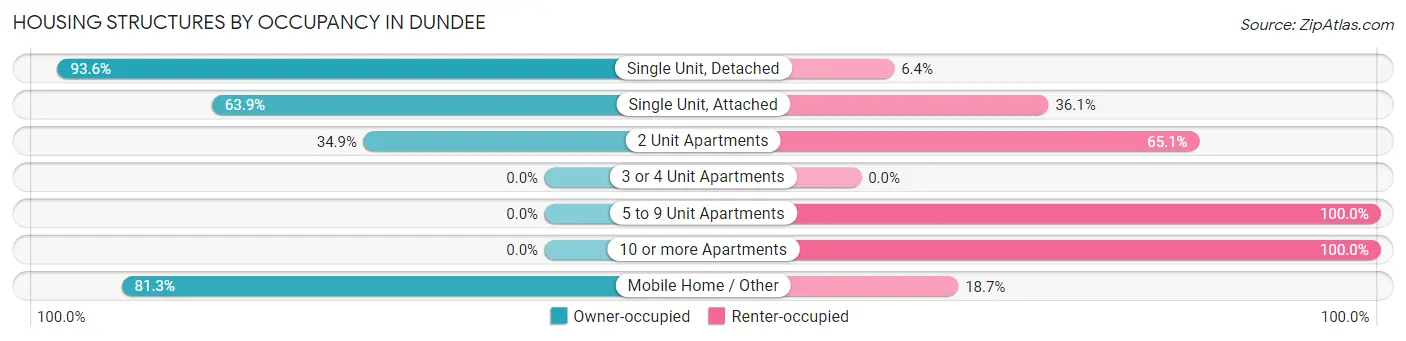
| Structure Type | Owner-occupied | Renter-occupied |
| Single Unit, Detached | 1,323 (93.6%) | 90 (6.4%) |
| Single Unit, Attached | 39 (63.9%) | 22 (36.1%) |
| 2 Unit Apartments | 15 (34.9%) | 28 (65.1%) |
| 3 or 4 Unit Apartments | 0 (0.0%) | 0 (0.0%) |
| 5 to 9 Unit Apartments | 0 (0.0%) | 145 (100.0%) |
| 10 or more Apartments | 0 (0.0%) | 623 (100.0%) |
| Mobile Home / Other | 222 (81.3%) | 51 (18.7%) |
| Total | 1,599 (62.5%) | 959 (37.5%) |
Housing Structures by Number of Rooms in Dundee
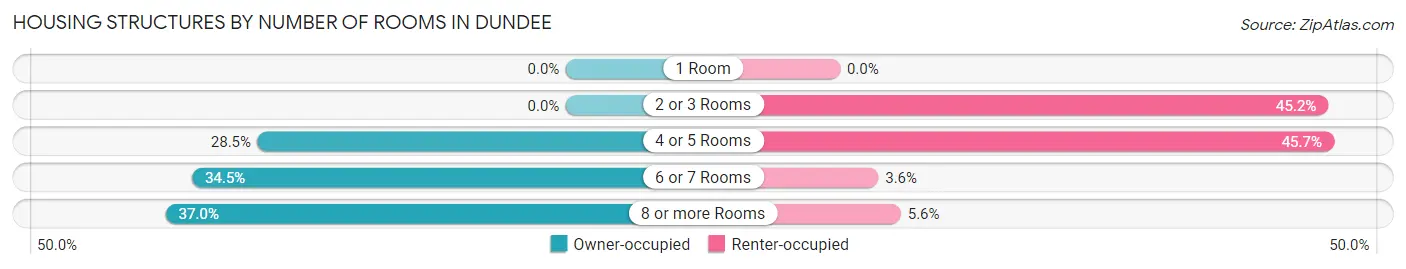
| Number of Rooms | Owner-occupied | Renter-occupied |
| 1 Room | 0 (0.0%) | 0 (0.0%) |
| 2 or 3 Rooms | 0 (0.0%) | 433 (45.2%) |
| 4 or 5 Rooms | 456 (28.5%) | 438 (45.7%) |
| 6 or 7 Rooms | 552 (34.5%) | 34 (3.5%) |
| 8 or more Rooms | 591 (37.0%) | 54 (5.6%) |
| Total | 1,599 (100.0%) | 959 (100.0%) |
Housing Structure by Heating Type in Dundee
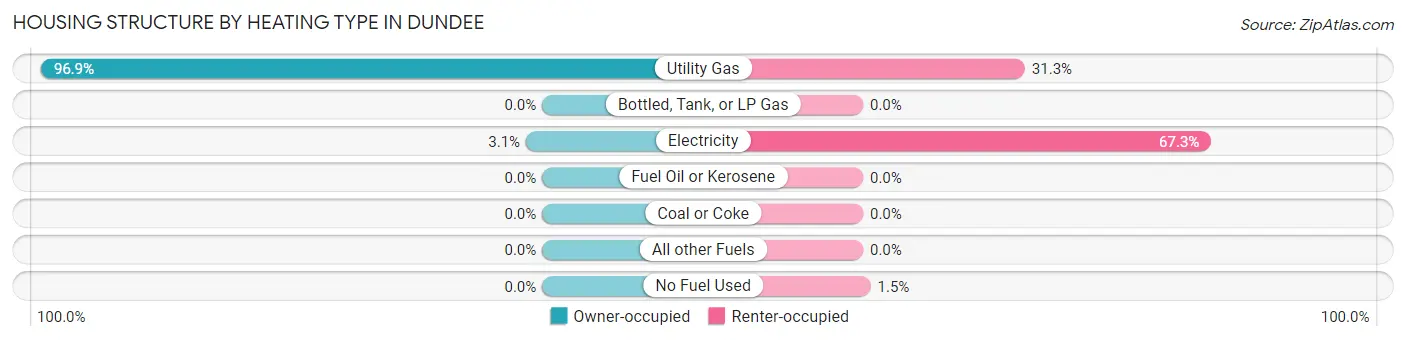
| Heating Type | Owner-occupied | Renter-occupied |
| Utility Gas | 1,549 (96.9%) | 300 (31.3%) |
| Bottled, Tank, or LP Gas | 0 (0.0%) | 0 (0.0%) |
| Electricity | 50 (3.1%) | 645 (67.3%) |
| Fuel Oil or Kerosene | 0 (0.0%) | 0 (0.0%) |
| Coal or Coke | 0 (0.0%) | 0 (0.0%) |
| All other Fuels | 0 (0.0%) | 0 (0.0%) |
| No Fuel Used | 0 (0.0%) | 14 (1.5%) |
| Total | 1,599 (100.0%) | 959 (100.0%) |
Household Vehicle Usage in Dundee
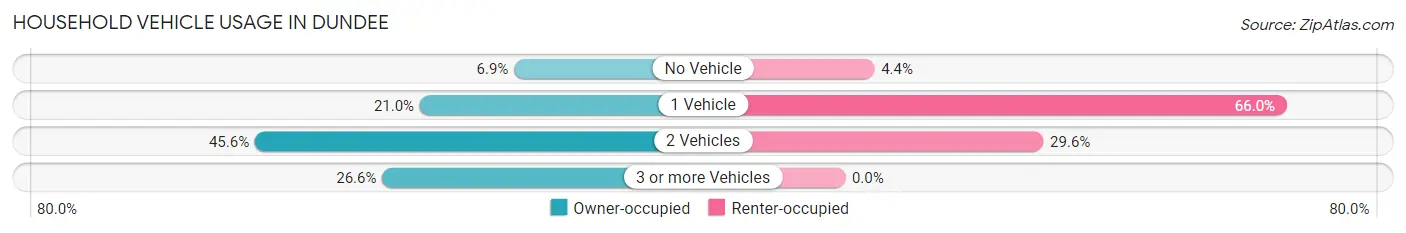
| Vehicles per Household | Owner-occupied | Renter-occupied |
| No Vehicle | 110 (6.9%) | 42 (4.4%) |
| 1 Vehicle | 335 (20.9%) | 633 (66.0%) |
| 2 Vehicles | 729 (45.6%) | 284 (29.6%) |
| 3 or more Vehicles | 425 (26.6%) | 0 (0.0%) |
| Total | 1,599 (100.0%) | 959 (100.0%) |
Real Estate & Mortgages in Dundee
Real Estate and Mortgage Overview in Dundee
| Characteristic | Without Mortgage | With Mortgage |
| Housing Units | 453 | 1,146 |
| Median Property Value | $111,800 | $252,500 |
| Median Household Income | $58,286 | $398 |
| Monthly Housing Costs | $541 | $30 |
| Real Estate Taxes | $1,734 | $97 |
Property Value by Mortgage Status in Dundee
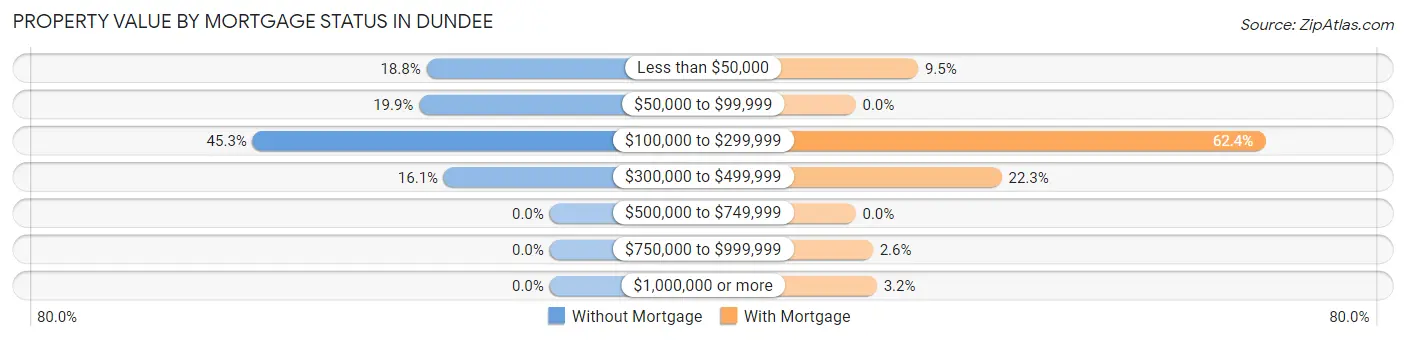
| Property Value | Without Mortgage | With Mortgage |
| Less than $50,000 | 85 (18.8%) | 109 (9.5%) |
| $50,000 to $99,999 | 90 (19.9%) | 0 (0.0%) |
| $100,000 to $299,999 | 205 (45.3%) | 715 (62.4%) |
| $300,000 to $499,999 | 73 (16.1%) | 255 (22.3%) |
| $500,000 to $749,999 | 0 (0.0%) | 0 (0.0%) |
| $750,000 to $999,999 | 0 (0.0%) | 30 (2.6%) |
| $1,000,000 or more | 0 (0.0%) | 37 (3.2%) |
| Total | 453 (100.0%) | 1,146 (100.0%) |
Household Income by Mortgage Status in Dundee
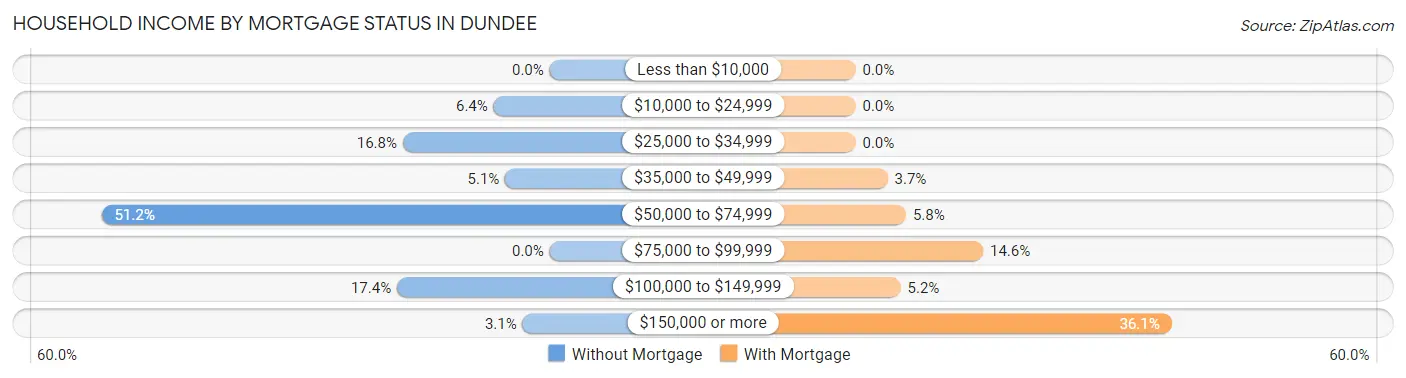
| Household Income | Without Mortgage | With Mortgage |
| Less than $10,000 | 0 (0.0%) | 0 (0.0%) |
| $10,000 to $24,999 | 29 (6.4%) | 0 (0.0%) |
| $25,000 to $34,999 | 76 (16.8%) | 0 (0.0%) |
| $35,000 to $49,999 | 23 (5.1%) | 42 (3.7%) |
| $50,000 to $74,999 | 232 (51.2%) | 66 (5.8%) |
| $75,000 to $99,999 | 0 (0.0%) | 167 (14.6%) |
| $100,000 to $149,999 | 79 (17.4%) | 59 (5.1%) |
| $150,000 or more | 14 (3.1%) | 414 (36.1%) |
| Total | 453 (100.0%) | 1,146 (100.0%) |
Property Value to Household Income Ratio in Dundee
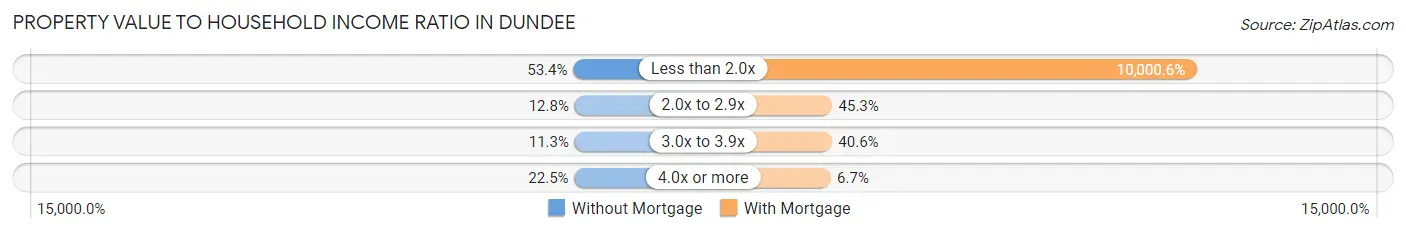
| Value-to-Income Ratio | Without Mortgage | With Mortgage |
| Less than 2.0x | 242 (53.4%) | 114,607 (10,000.6%) |
| 2.0x to 2.9x | 58 (12.8%) | 519 (45.3%) |
| 3.0x to 3.9x | 51 (11.3%) | 465 (40.6%) |
| 4.0x or more | 102 (22.5%) | 77 (6.7%) |
| Total | 453 (100.0%) | 1,146 (100.0%) |
Real Estate Taxes by Mortgage Status in Dundee
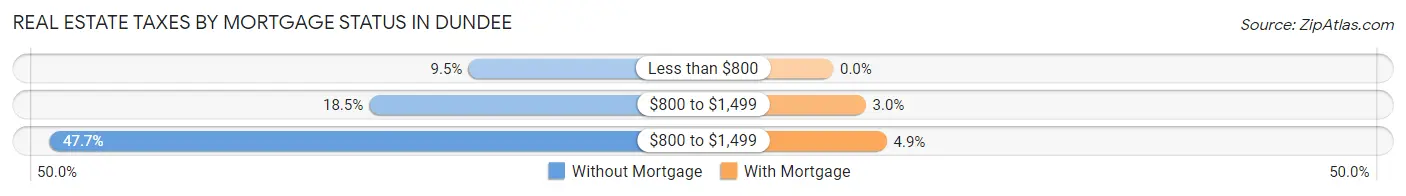
| Property Taxes | Without Mortgage | With Mortgage |
| Less than $800 | 43 (9.5%) | 0 (0.0%) |
| $800 to $1,499 | 84 (18.5%) | 34 (3.0%) |
| $800 to $1,499 | 216 (47.7%) | 56 (4.9%) |
| Total | 453 (100.0%) | 1,146 (100.0%) |
Health & Disability in Dundee
Health Insurance Coverage by Age in Dundee
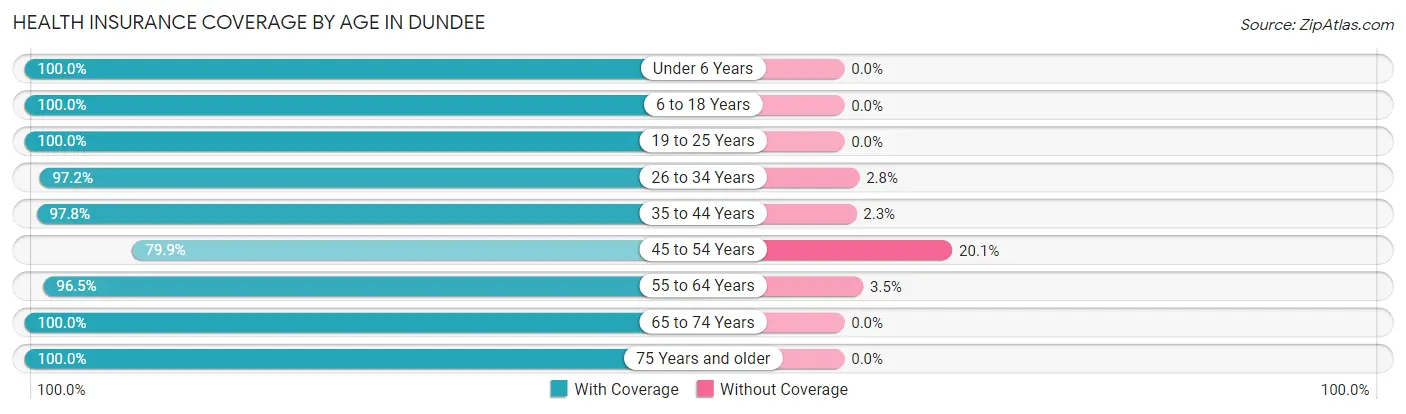
| Age Bracket | With Coverage | Without Coverage |
| Under 6 Years | 215 (100.0%) | 0 (0.0%) |
| 6 to 18 Years | 844 (100.0%) | 0 (0.0%) |
| 19 to 25 Years | 511 (100.0%) | 0 (0.0%) |
| 26 to 34 Years | 769 (97.2%) | 22 (2.8%) |
| 35 to 44 Years | 955 (97.8%) | 22 (2.2%) |
| 45 to 54 Years | 719 (79.9%) | 181 (20.1%) |
| 55 to 64 Years | 468 (96.5%) | 17 (3.5%) |
| 65 to 74 Years | 346 (100.0%) | 0 (0.0%) |
| 75 Years and older | 336 (100.0%) | 0 (0.0%) |
| Total | 5,163 (95.5%) | 242 (4.5%) |
Health Insurance Coverage by Citizenship Status in Dundee
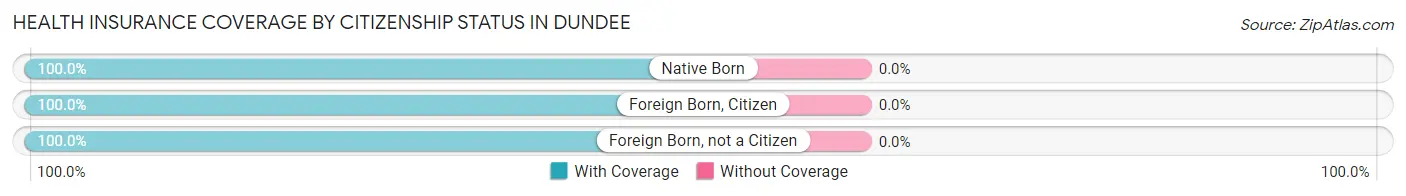
| Citizenship Status | With Coverage | Without Coverage |
| Native Born | 215 (100.0%) | 0 (0.0%) |
| Foreign Born, Citizen | 844 (100.0%) | 0 (0.0%) |
| Foreign Born, not a Citizen | 511 (100.0%) | 0 (0.0%) |
Health Insurance Coverage by Household Income in Dundee
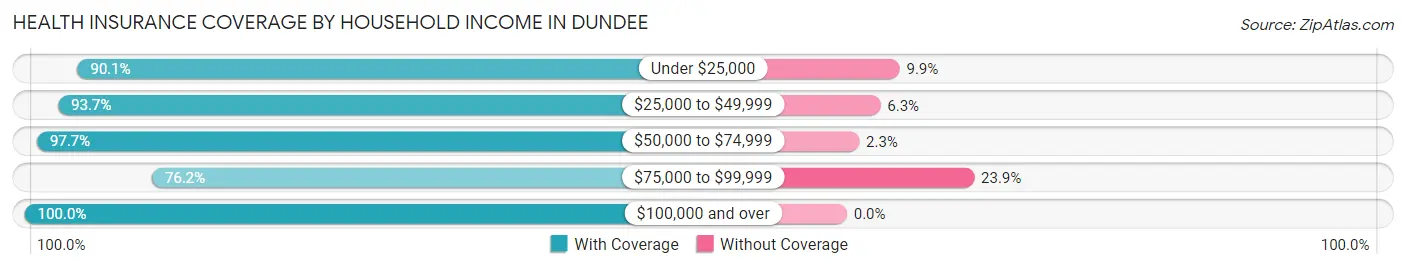
| Household Income | With Coverage | Without Coverage |
| Under $25,000 | 155 (90.1%) | 17 (9.9%) |
| $25,000 to $49,999 | 672 (93.7%) | 45 (6.3%) |
| $50,000 to $74,999 | 1,272 (97.7%) | 30 (2.3%) |
| $75,000 to $99,999 | 479 (76.1%) | 150 (23.8%) |
| $100,000 and over | 2,585 (100.0%) | 0 (0.0%) |
Public vs Private Health Insurance Coverage by Age in Dundee
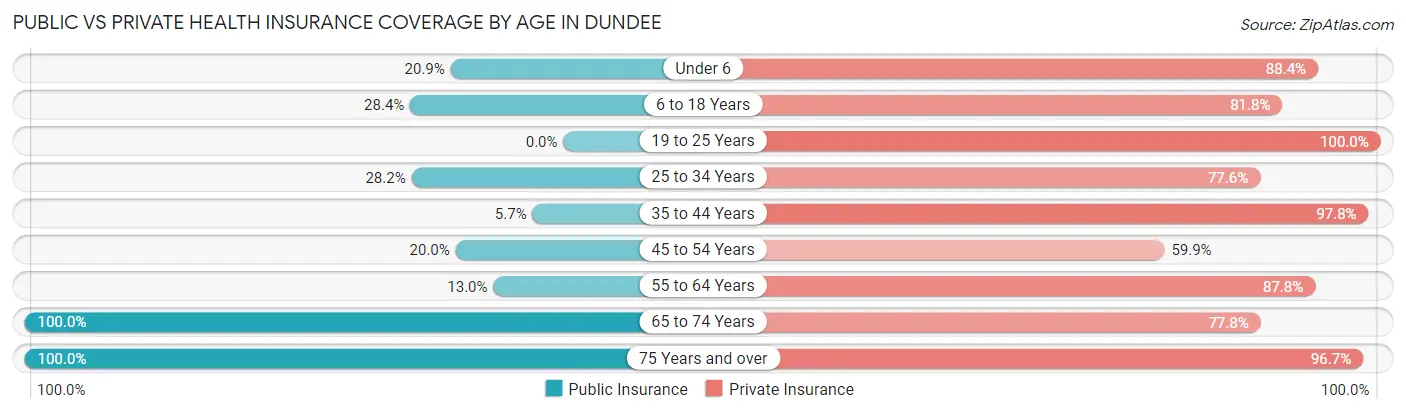
| Age Bracket | Public Insurance | Private Insurance |
| Under 6 | 45 (20.9%) | 190 (88.4%) |
| 6 to 18 Years | 240 (28.4%) | 690 (81.8%) |
| 19 to 25 Years | 0 (0.0%) | 511 (100.0%) |
| 25 to 34 Years | 223 (28.2%) | 614 (77.6%) |
| 35 to 44 Years | 56 (5.7%) | 955 (97.8%) |
| 45 to 54 Years | 180 (20.0%) | 539 (59.9%) |
| 55 to 64 Years | 63 (13.0%) | 426 (87.8%) |
| 65 to 74 Years | 346 (100.0%) | 269 (77.7%) |
| 75 Years and over | 336 (100.0%) | 325 (96.7%) |
| Total | 1,489 (27.6%) | 4,519 (83.6%) |
Disability Status by Sex by Age in Dundee
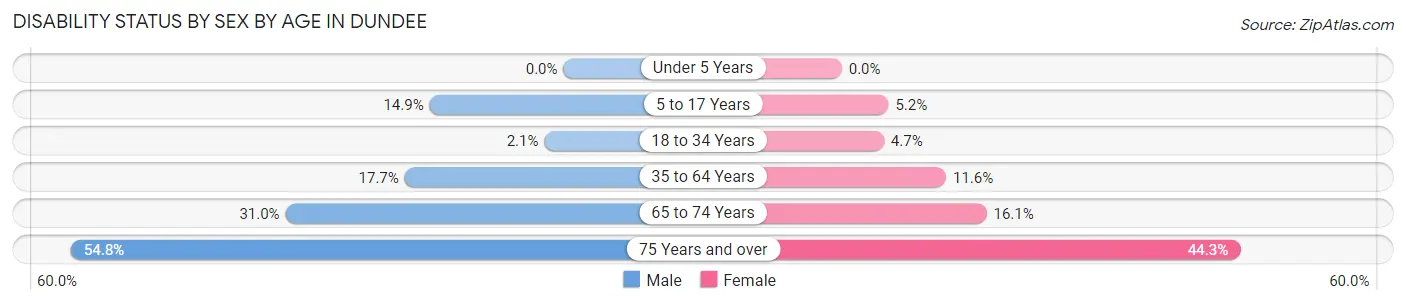
| Age Bracket | Male | Female |
| Under 5 Years | 0 (0.0%) | 0 (0.0%) |
| 5 to 17 Years | 72 (14.9%) | 17 (5.2%) |
| 18 to 34 Years | 17 (2.1%) | 25 (4.7%) |
| 35 to 64 Years | 206 (17.7%) | 139 (11.6%) |
| 65 to 74 Years | 13 (30.9%) | 49 (16.1%) |
| 75 Years and over | 68 (54.8%) | 94 (44.3%) |
Disability Class by Sex by Age in Dundee
Disability Class: Hearing Difficulty
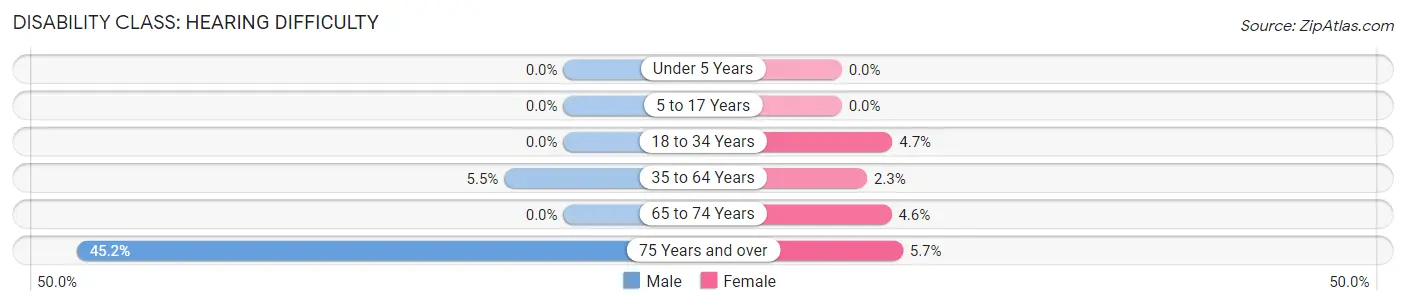
| Age Bracket | Male | Female |
| Under 5 Years | 0 (0.0%) | 0 (0.0%) |
| 5 to 17 Years | 0 (0.0%) | 0 (0.0%) |
| 18 to 34 Years | 0 (0.0%) | 25 (4.7%) |
| 35 to 64 Years | 64 (5.5%) | 28 (2.3%) |
| 65 to 74 Years | 0 (0.0%) | 14 (4.6%) |
| 75 Years and over | 56 (45.2%) | 12 (5.7%) |
Disability Class: Vision Difficulty
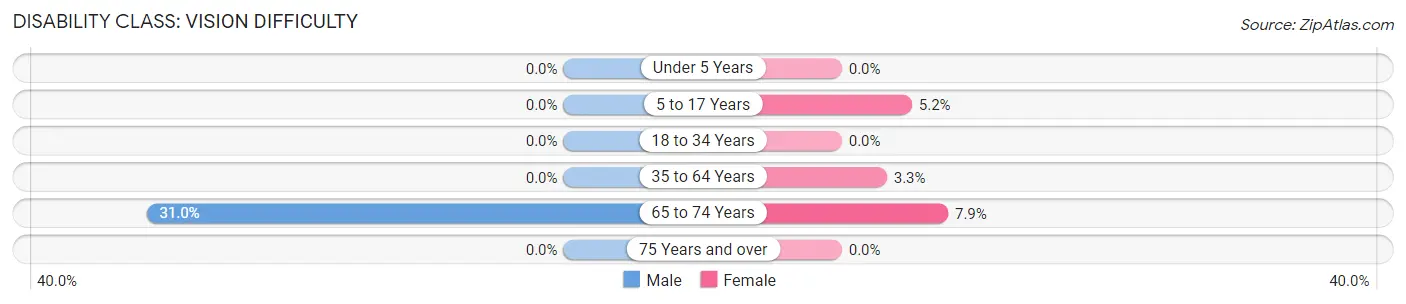
| Age Bracket | Male | Female |
| Under 5 Years | 0 (0.0%) | 0 (0.0%) |
| 5 to 17 Years | 0 (0.0%) | 17 (5.2%) |
| 18 to 34 Years | 0 (0.0%) | 0 (0.0%) |
| 35 to 64 Years | 0 (0.0%) | 40 (3.3%) |
| 65 to 74 Years | 13 (30.9%) | 24 (7.9%) |
| 75 Years and over | 0 (0.0%) | 0 (0.0%) |
Disability Class: Cognitive Difficulty
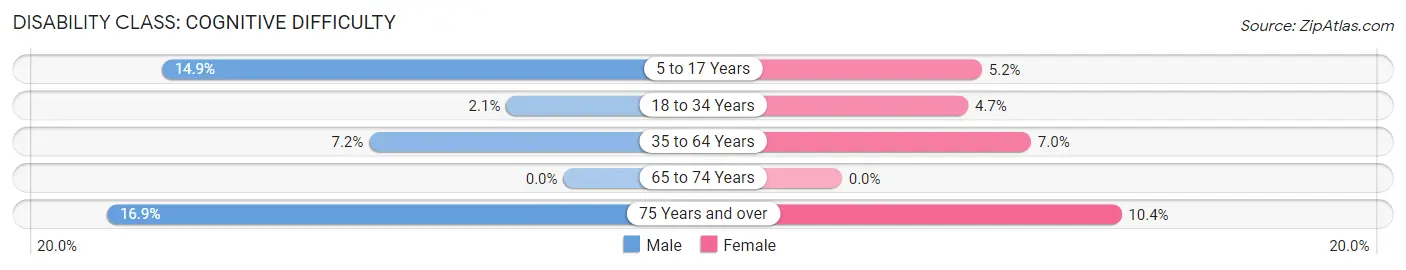
| Age Bracket | Male | Female |
| 5 to 17 Years | 72 (14.9%) | 17 (5.2%) |
| 18 to 34 Years | 17 (2.1%) | 25 (4.7%) |
| 35 to 64 Years | 84 (7.2%) | 84 (7.0%) |
| 65 to 74 Years | 0 (0.0%) | 0 (0.0%) |
| 75 Years and over | 21 (16.9%) | 22 (10.4%) |
Disability Class: Ambulatory Difficulty
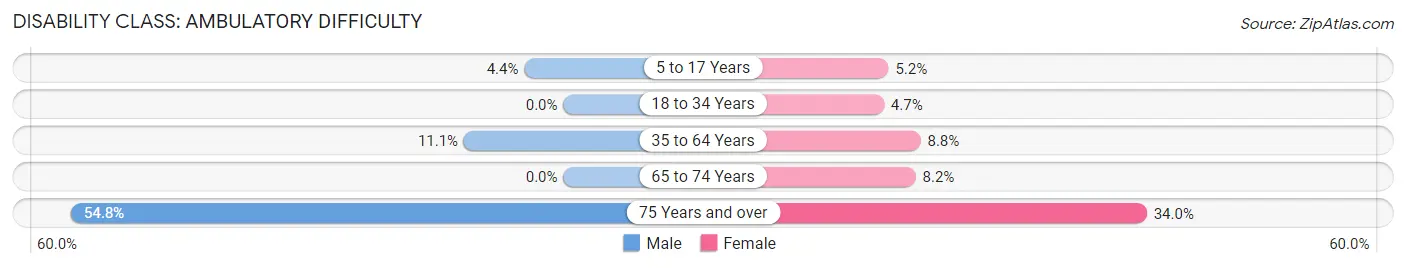
| Age Bracket | Male | Female |
| 5 to 17 Years | 21 (4.3%) | 17 (5.2%) |
| 18 to 34 Years | 0 (0.0%) | 25 (4.7%) |
| 35 to 64 Years | 129 (11.1%) | 105 (8.8%) |
| 65 to 74 Years | 0 (0.0%) | 25 (8.2%) |
| 75 Years and over | 68 (54.8%) | 72 (34.0%) |
Disability Class: Self-Care Difficulty
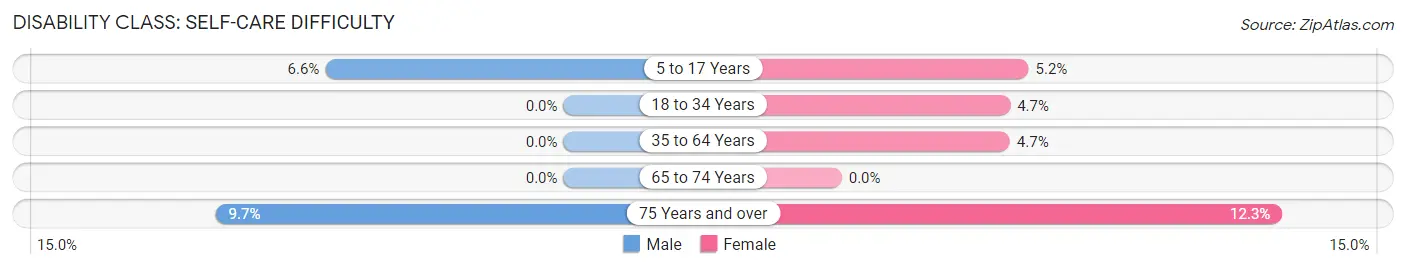
| Age Bracket | Male | Female |
| 5 to 17 Years | 32 (6.6%) | 17 (5.2%) |
| 18 to 34 Years | 0 (0.0%) | 25 (4.7%) |
| 35 to 64 Years | 0 (0.0%) | 56 (4.7%) |
| 65 to 74 Years | 0 (0.0%) | 0 (0.0%) |
| 75 Years and over | 12 (9.7%) | 26 (12.3%) |
Technology Access in Dundee
Computing Device Access in Dundee
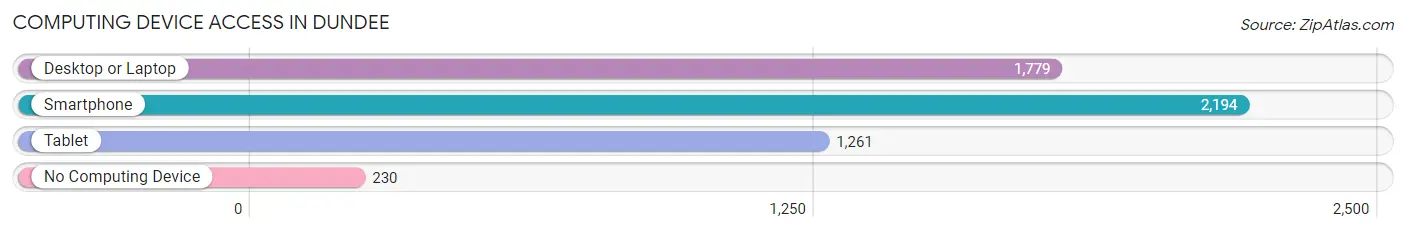
| Device Type | # Households | % Households |
| Desktop or Laptop | 1,779 | 69.6% |
| Smartphone | 2,194 | 85.8% |
| Tablet | 1,261 | 49.3% |
| No Computing Device | 230 | 9.0% |
| Total | 2,558 | 100.0% |
Internet Access in Dundee
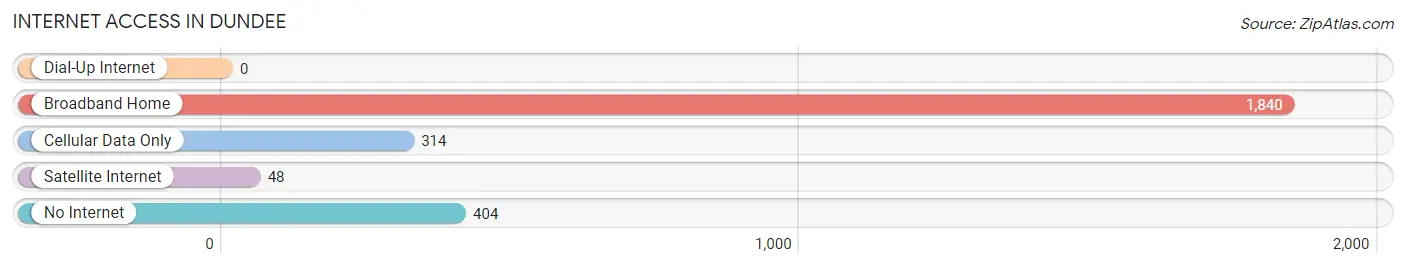
| Internet Type | # Households | % Households |
| Dial-Up Internet | 0 | 0.0% |
| Broadband Home | 1,840 | 71.9% |
| Cellular Data Only | 314 | 12.3% |
| Satellite Internet | 48 | 1.9% |
| No Internet | 404 | 15.8% |
| Total | 2,558 | 100.0% |
Dundee Summary
Dundee, Michigan is a small village located in Monroe County, Michigan. It is situated on the banks of the River Raisin, and is part of the Monroe Metropolitan Statistical Area. The village has a population of approximately 3,000 people, and is located about 25 miles south of Toledo, Ohio.
History
Dundee was first settled in 1824 by a group of settlers from New York. The village was originally known as “Raisinville”, and was later renamed “Dundee” in 1837. The name was chosen in honor of the Scottish town of Dundee. The village was incorporated in 1855, and has remained a small, rural community ever since.
Geography
Dundee is located in southeastern Michigan, in Monroe County. It is situated on the banks of the River Raisin, and is part of the Monroe Metropolitan Statistical Area. The village is located about 25 miles south of Toledo, Ohio, and is bordered by the cities of Monroe and Lambertville. The village covers an area of 1.3 square miles, and has a population of approximately 3,000 people.
Economy
Dundee’s economy is largely based on agriculture and tourism. The village is home to several wineries, and is a popular destination for wine-tasting tours. The village also has a number of small businesses, including restaurants, retail stores, and service providers. The village is also home to a number of manufacturing companies, including a plastics manufacturer and a metal fabrication company.
Demographics
As of the 2010 census, the population of Dundee was 3,000 people. The racial makeup of the village was 95.3% White, 0.7% African American, 0.3% Native American, 0.7% Asian, 0.1% Pacific Islander, and 2.0% from other races. The median household income was $45,000, and the median family income was $50,000. The per capita income was $20,000.
Conclusion
Dundee, Michigan is a small village located in Monroe County, Michigan. It is situated on the banks of the River Raisin, and is part of the Monroe Metropolitan Statistical Area. The village has a population of approximately 3,000 people, and is located about 25 miles south of Toledo, Ohio. The village’s economy is largely based on agriculture and tourism, and it is home to several wineries and small businesses. The village has a diverse population, with a median household income of $45,000 and a median family income of $50,000.
Common Questions
What is Per Capita Income in Dundee?
Per Capita income in Dundee is $48,334.
What is the Median Family Income in Dundee?
Median Family Income in Dundee is $114,179.
What is the Median Household income in Dundee?
Median Household Income in Dundee is $73,641.
What is Income or Wage Gap in Dundee?
Income or Wage Gap in Dundee is 11.4%.
Women in Dundee earn 88.6 cents for every dollar earned by a man.
What is Inequality or Gini Index in Dundee?
Inequality or Gini Index in Dundee is 0.44.
What is the Total Population of Dundee?
Total Population of Dundee is 5,408.
What is the Total Male Population of Dundee?
Total Male Population of Dundee is 2,684.
What is the Total Female Population of Dundee?
Total Female Population of Dundee is 2,724.
What is the Ratio of Males per 100 Females in Dundee?
There are 98.53 Males per 100 Females in Dundee.
What is the Ratio of Females per 100 Males in Dundee?
There are 101.49 Females per 100 Males in Dundee.
What is the Median Population Age in Dundee?
Median Population Age in Dundee is 37.0 Years.
What is the Average Family Size in Dundee
Average Family Size in Dundee is 2.9 People.
What is the Average Household Size in Dundee
Average Household Size in Dundee is 2.1 People.
How Large is the Labor Force in Dundee?
There are 3,194 People in the Labor Forcein in Dundee.
What is the Percentage of People in the Labor Force in Dundee?
71.0% of People are in the Labor Force in Dundee.
What is the Unemployment Rate in Dundee?
Unemployment Rate in Dundee is 7.5%.