Crystal Falls, MI Map & Demographics
Crystal Falls Map
Crystal Falls Overview
$25,449
PER CAPITA INCOME
$65,833
AVG FAMILY INCOME
$59,236
AVG HOUSEHOLD INCOME
9.1%
WAGE / INCOME GAP [ % ]
90.9¢/ $1
WAGE / INCOME GAP [ $ ]
0.36
INEQUALITY / GINI INDEX
1,773
TOTAL POPULATION
983
MALE POPULATION
790
FEMALE POPULATION
124.43
MALES / 100 FEMALES
80.37
FEMALES / 100 MALES
44.2
MEDIAN AGE
3.0
AVG FAMILY SIZE
2.5
AVG HOUSEHOLD SIZE
655
LABOR FORCE [ PEOPLE ]
47.9%
PERCENT IN LABOR FORCE
2.9%
UNEMPLOYMENT RATE
Crystal Falls Zip Codes
Crystal Falls Area Codes
Income in Crystal Falls
Income Overview in Crystal Falls
Per Capita Income in Crystal Falls is $25,449, while median incomes of families and households are $65,833 and $59,236 respectively.
| Characteristic | Number | Measure |
| Per Capita Income | 1,773 | $25,449 |
| Median Family Income | 408 | $65,833 |
| Mean Family Income | 408 | $71,677 |
| Median Household Income | 691 | $59,236 |
| Mean Household Income | 691 | $64,479 |
| Income Deficit | 408 | $0 |
| Wage / Income Gap (%) | 1,773 | 9.09% |
| Wage / Income Gap ($) | 1,773 | 90.91¢ per $1 |
| Gini / Inequality Index | 1,773 | 0.36 |
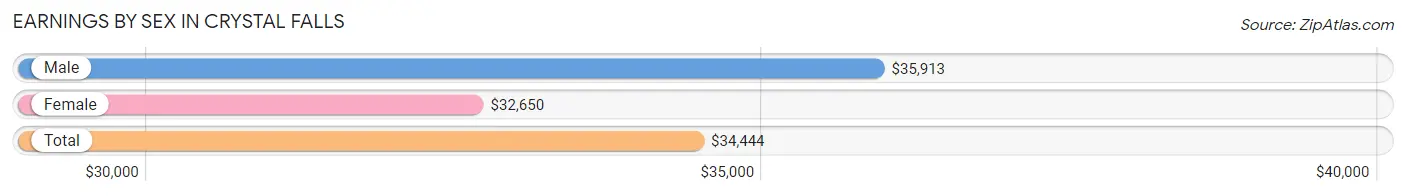
Earnings by Sex in Crystal Falls
Average Earnings in Crystal Falls are $34,444, $35,913 for men and $32,650 for women, a difference of 9.1%.
| Sex | Number | Average Earnings |
| Male | 443 (57.2%) | $35,913 |
| Female | 331 (42.8%) | $32,650 |
| Total | 774 (100.0%) | $34,444 |
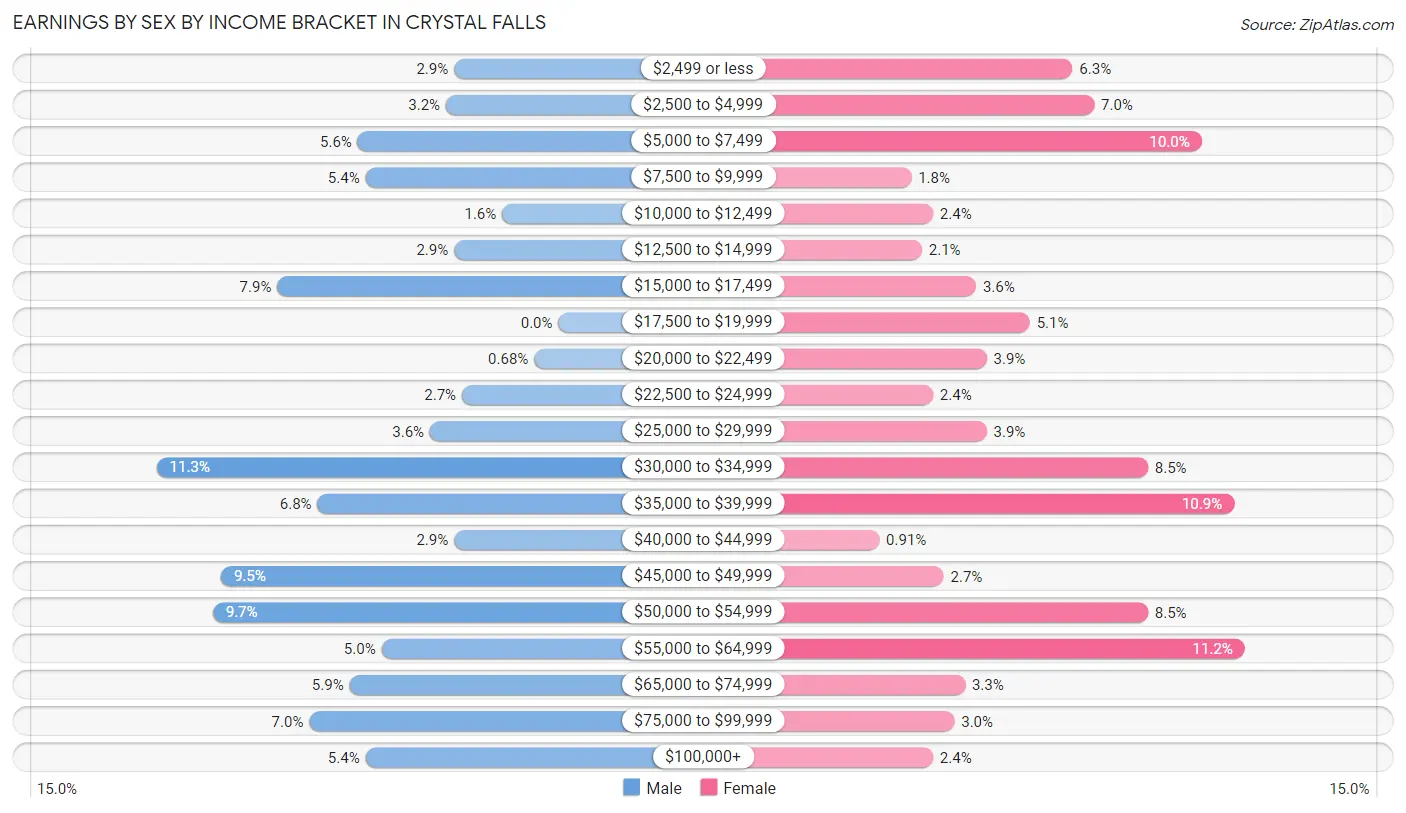
Earnings by Sex by Income Bracket in Crystal Falls
The most common earnings brackets in Crystal Falls are $30,000 to $34,999 for men (50 | 11.3%) and $55,000 to $64,999 for women (37 | 11.2%).
| Income | Male | Female |
| $2,499 or less | 13 (2.9%) | 21 (6.3%) |
| $2,500 to $4,999 | 14 (3.2%) | 23 (7.0%) |
| $5,000 to $7,499 | 25 (5.6%) | 33 (10.0%) |
| $7,500 to $9,999 | 24 (5.4%) | 6 (1.8%) |
| $10,000 to $12,499 | 7 (1.6%) | 8 (2.4%) |
| $12,500 to $14,999 | 13 (2.9%) | 7 (2.1%) |
| $15,000 to $17,499 | 35 (7.9%) | 12 (3.6%) |
| $17,500 to $19,999 | 0 (0.0%) | 17 (5.1%) |
| $20,000 to $22,499 | 3 (0.7%) | 13 (3.9%) |
| $22,500 to $24,999 | 12 (2.7%) | 8 (2.4%) |
| $25,000 to $29,999 | 16 (3.6%) | 13 (3.9%) |
| $30,000 to $34,999 | 50 (11.3%) | 28 (8.5%) |
| $35,000 to $39,999 | 30 (6.8%) | 36 (10.9%) |
| $40,000 to $44,999 | 13 (2.9%) | 3 (0.9%) |
| $45,000 to $49,999 | 42 (9.5%) | 9 (2.7%) |
| $50,000 to $54,999 | 43 (9.7%) | 28 (8.5%) |
| $55,000 to $64,999 | 22 (5.0%) | 37 (11.2%) |
| $65,000 to $74,999 | 26 (5.9%) | 11 (3.3%) |
| $75,000 to $99,999 | 31 (7.0%) | 10 (3.0%) |
| $100,000+ | 24 (5.4%) | 8 (2.4%) |
| Total | 443 (100.0%) | 331 (100.0%) |
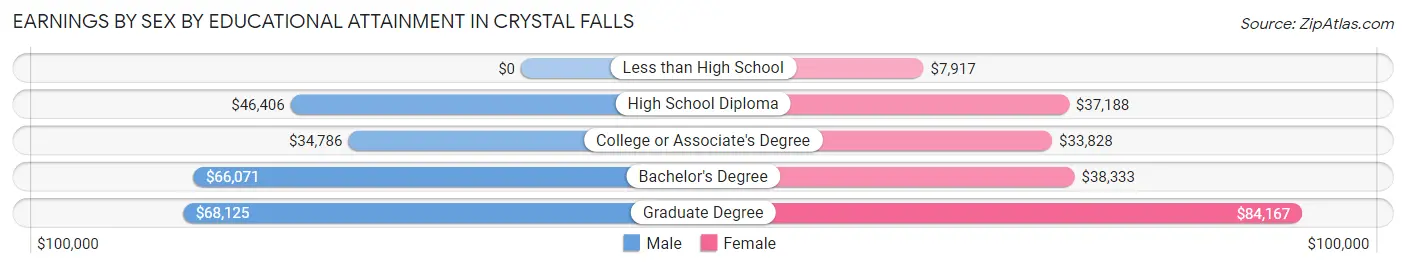
Earnings by Sex by Educational Attainment in Crystal Falls
Average earnings in Crystal Falls are $41,042 for men and $33,950 for women, a difference of 17.3%. Men with an educational attainment of graduate degree enjoy the highest average annual earnings of $68,125, while those with college or associate's degree education earn the least with $34,786. Women with an educational attainment of graduate degree earn the most with the average annual earnings of $84,167, while those with less than high school education have the smallest earnings of $7,917.
| Educational Attainment | Male Income | Female Income |
| Less than High School | - | - |
| High School Diploma | $46,406 | $37,188 |
| College or Associate's Degree | $34,786 | $33,828 |
| Bachelor's Degree | $66,071 | $38,333 |
| Graduate Degree | $68,125 | $84,167 |
| Total | $41,042 | $33,950 |
Family Income in Crystal Falls
Family Income Brackets in Crystal Falls
According to the Crystal Falls family income data, there are 115 families falling into the $100,000 to $149,999 income range, which is the most common income bracket and makes up 28.2% of all families.
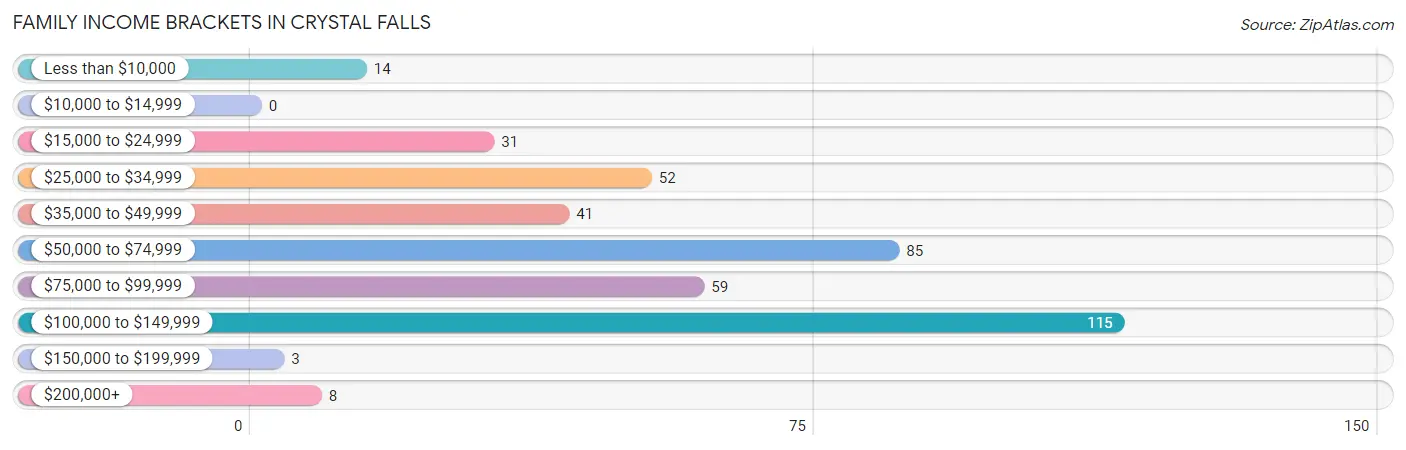
| Income Bracket | # Families | % Families |
| Less than $10,000 | 14 | 3.4% |
| $10,000 to $14,999 | 0 | 0.0% |
| $15,000 to $24,999 | 31 | 7.6% |
| $25,000 to $34,999 | 52 | 12.7% |
| $35,000 to $49,999 | 41 | 10.0% |
| $50,000 to $74,999 | 85 | 20.8% |
| $75,000 to $99,999 | 59 | 14.5% |
| $100,000 to $149,999 | 115 | 28.2% |
| $150,000 to $199,999 | 3 | 0.7% |
| $200,000+ | 8 | 2.0% |
Family Income by Famaliy Size in Crystal Falls
2-person families (266 | 65.2%) account for the highest median family income in Crystal Falls with $68,125 per family, while 2-person families (266 | 65.2%) have the highest median income of $34,062 per family member.
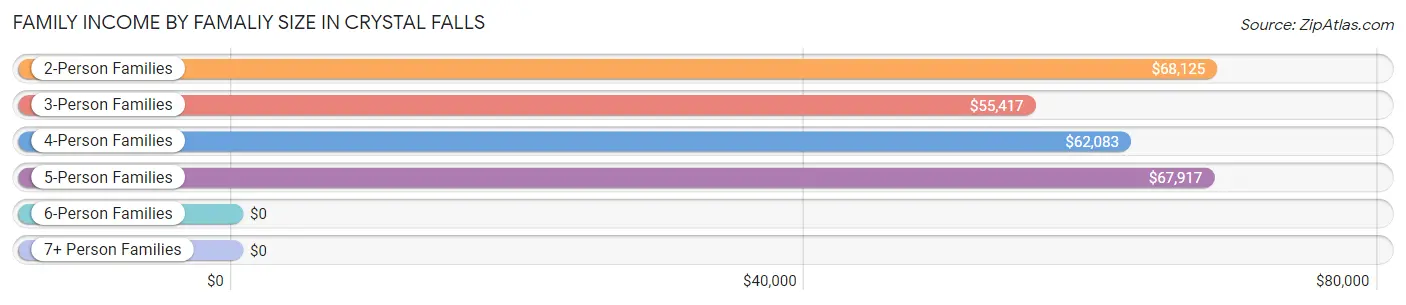
| Income Bracket | # Families | Median Income |
| 2-Person Families | 266 (65.2%) | $68,125 |
| 3-Person Families | 43 (10.5%) | $55,417 |
| 4-Person Families | 41 (10.1%) | $62,083 |
| 5-Person Families | 39 (9.6%) | $67,917 |
| 6-Person Families | 16 (3.9%) | $0 |
| 7+ Person Families | 3 (0.7%) | $0 |
| Total | 408 (100.0%) | $65,833 |
Family Income by Number of Earners in Crystal Falls
The median family income in Crystal Falls is $65,833, with families comprising 3+ earners (26) having the highest median family income of $105,625, while families with no earners (94) have the lowest median family income of $56,667, accounting for 6.4% and 23.0% of families, respectively.
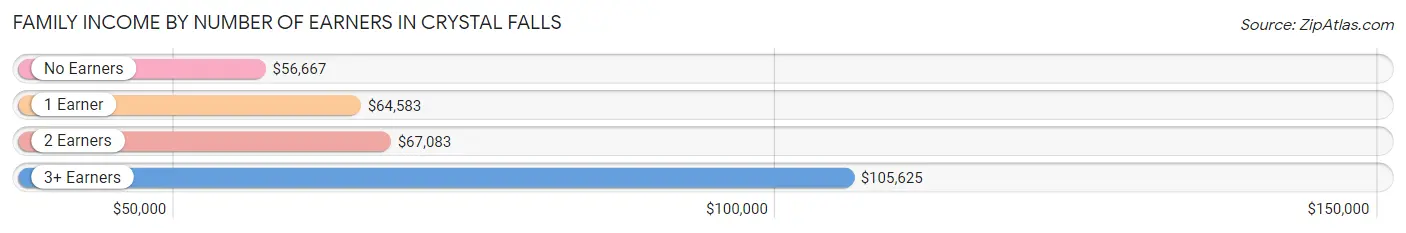
| Number of Earners | # Families | Median Income |
| No Earners | 94 (23.0%) | $56,667 |
| 1 Earner | 161 (39.5%) | $64,583 |
| 2 Earners | 127 (31.1%) | $67,083 |
| 3+ Earners | 26 (6.4%) | $105,625 |
| Total | 408 (100.0%) | $65,833 |
Household Income in Crystal Falls
Household Income Brackets in Crystal Falls
With 145 households falling in the category, the $50,000 to $74,999 income range is the most frequent in Crystal Falls, accounting for 21.0% of all households. In contrast, only 3 households (0.4%) fall into the $150,000 to $199,999 income bracket, making it the least populous group.
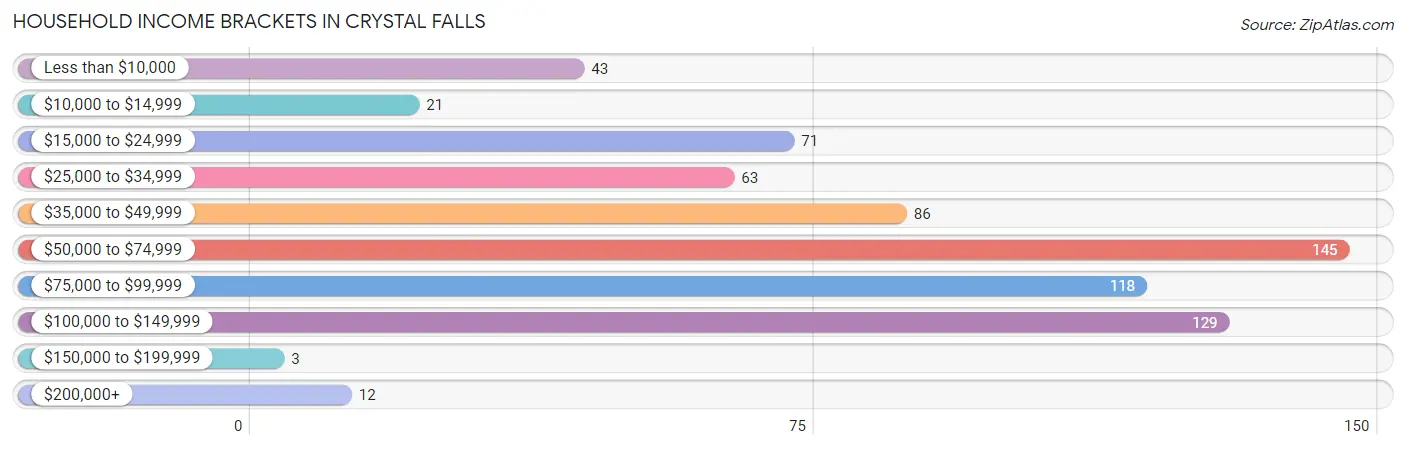
| Income Bracket | # Households | % Households |
| Less than $10,000 | 43 | 6.2% |
| $10,000 to $14,999 | 21 | 3.0% |
| $15,000 to $24,999 | 71 | 10.3% |
| $25,000 to $34,999 | 63 | 9.1% |
| $35,000 to $49,999 | 86 | 12.4% |
| $50,000 to $74,999 | 145 | 21.0% |
| $75,000 to $99,999 | 118 | 17.1% |
| $100,000 to $149,999 | 129 | 18.7% |
| $150,000 to $199,999 | 3 | 0.4% |
| $200,000+ | 12 | 1.7% |
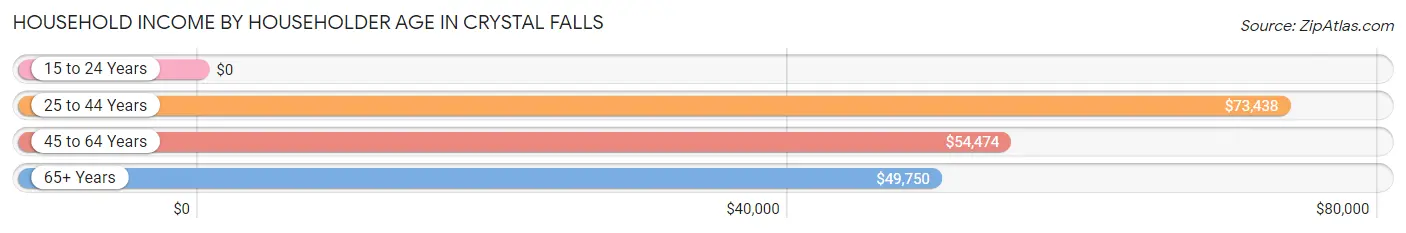
Household Income by Householder Age in Crystal Falls
The median household income in Crystal Falls is $59,236, with the highest median household income of $73,438 found in the 25 to 44 years age bracket for the primary householder. A total of 166 households (24.0%) fall into this category. Meanwhile, the 15 to 24 years age bracket for the primary householder has the lowest median household income of $0, with 4 households (0.6%) in this group.
| Income Bracket | # Households | Median Income |
| 15 to 24 Years | 4 (0.6%) | $0 |
| 25 to 44 Years | 166 (24.0%) | $73,438 |
| 45 to 64 Years | 266 (38.5%) | $54,474 |
| 65+ Years | 255 (36.9%) | $49,750 |
| Total | 691 (100.0%) | $59,236 |
Poverty in Crystal Falls
Income Below Poverty by Sex and Age in Crystal Falls
With 24.4% poverty level for males and 18.7% for females among the residents of Crystal Falls, 18 to 24 year old males and 12 to 14 year old females are the most vulnerable to poverty, with 29 males (65.9%) and 20 females (48.8%) in their respective age groups living below the poverty level.
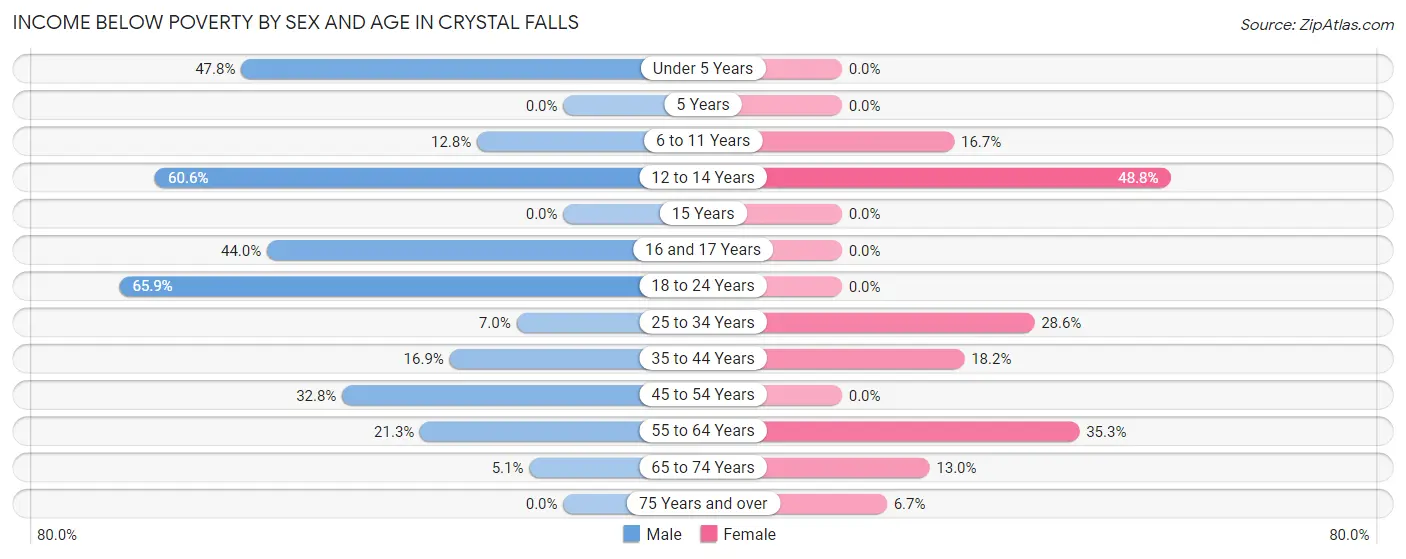
| Age Bracket | Male | Female |
| Under 5 Years | 22 (47.8%) | 0 (0.0%) |
| 5 Years | 0 (0.0%) | 0 (0.0%) |
| 6 to 11 Years | 5 (12.8%) | 7 (16.7%) |
| 12 to 14 Years | 40 (60.6%) | 20 (48.8%) |
| 15 Years | 0 (0.0%) | 0 (0.0%) |
| 16 and 17 Years | 22 (44.0%) | 0 (0.0%) |
| 18 to 24 Years | 29 (65.9%) | 0 (0.0%) |
| 25 to 34 Years | 8 (7.0%) | 28 (28.6%) |
| 35 to 44 Years | 13 (16.9%) | 12 (18.2%) |
| 45 to 54 Years | 44 (32.8%) | 0 (0.0%) |
| 55 to 64 Years | 27 (21.3%) | 55 (35.3%) |
| 65 to 74 Years | 4 (5.1%) | 13 (13.0%) |
| 75 Years and over | 0 (0.0%) | 6 (6.7%) |
| Total | 214 (24.4%) | 141 (18.7%) |
Income Above Poverty by Sex and Age in Crystal Falls
According to the poverty statistics in Crystal Falls, males aged 5 years and females aged under 5 years are the age groups that are most secure financially, with 100.0% of males and 100.0% of females in these age groups living above the poverty line.
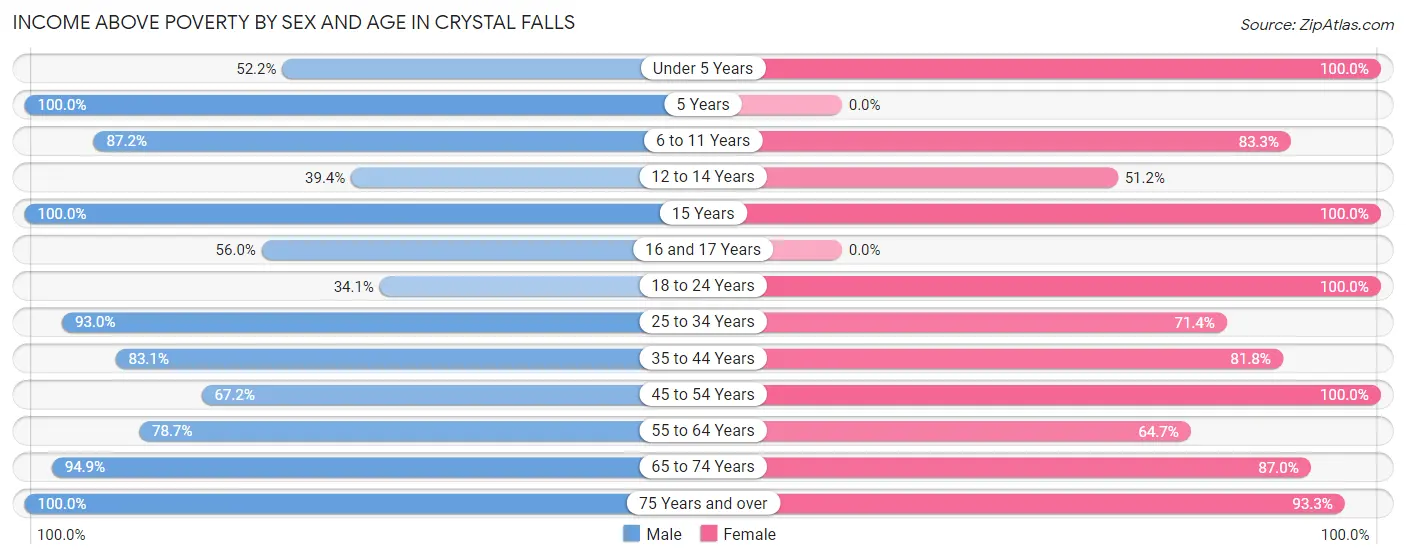
| Age Bracket | Male | Female |
| Under 5 Years | 24 (52.2%) | 43 (100.0%) |
| 5 Years | 5 (100.0%) | 0 (0.0%) |
| 6 to 11 Years | 34 (87.2%) | 35 (83.3%) |
| 12 to 14 Years | 26 (39.4%) | 21 (51.2%) |
| 15 Years | 4 (100.0%) | 22 (100.0%) |
| 16 and 17 Years | 28 (56.0%) | 0 (0.0%) |
| 18 to 24 Years | 15 (34.1%) | 26 (100.0%) |
| 25 to 34 Years | 107 (93.0%) | 70 (71.4%) |
| 35 to 44 Years | 64 (83.1%) | 54 (81.8%) |
| 45 to 54 Years | 90 (67.2%) | 70 (100.0%) |
| 55 to 64 Years | 100 (78.7%) | 101 (64.7%) |
| 65 to 74 Years | 75 (94.9%) | 87 (87.0%) |
| 75 Years and over | 92 (100.0%) | 84 (93.3%) |
| Total | 664 (75.6%) | 613 (81.3%) |
Income Below Poverty Among Married-Couple Families in Crystal Falls
The poverty statistics for married-couple families in Crystal Falls show that 0.8% or 2 of the total 260 families live below the poverty line. Families with no children have the highest poverty rate of 1.1%, comprising of 2 families. On the other hand, families with 1 or 2 children have the lowest poverty rate of 0.0%, which includes 0 families.
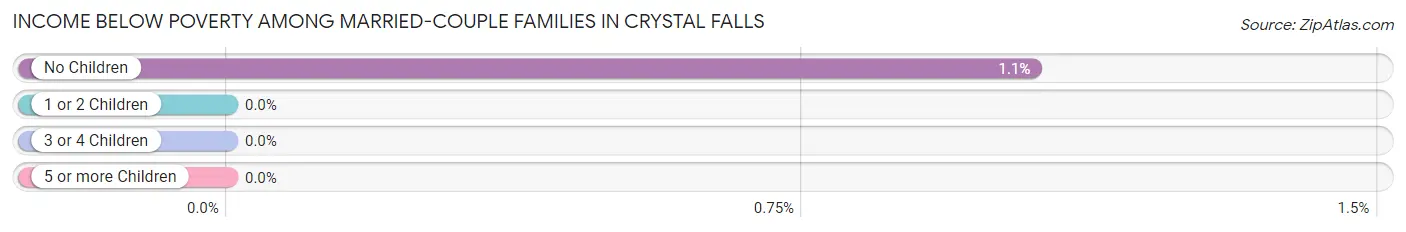
| Children | Above Poverty | Below Poverty |
| No Children | 189 (99.0%) | 2 (1.1%) |
| 1 or 2 Children | 55 (100.0%) | 0 (0.0%) |
| 3 or 4 Children | 11 (100.0%) | 0 (0.0%) |
| 5 or more Children | 3 (100.0%) | 0 (0.0%) |
| Total | 258 (99.2%) | 2 (0.8%) |
Income Below Poverty Among Single-Parent Households in Crystal Falls
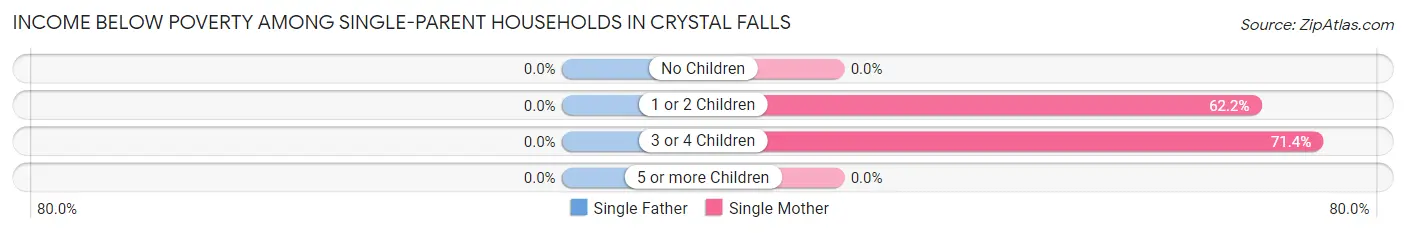
| Children | Single Father | Single Mother |
| No Children | 0 (0.0%) | 0 (0.0%) |
| 1 or 2 Children | 0 (0.0%) | 28 (62.2%) |
| 3 or 4 Children | 0 (0.0%) | 15 (71.4%) |
| 5 or more Children | 0 (0.0%) | 0 (0.0%) |
| Total | 0 (0.0%) | 43 (51.8%) |
Income Below Poverty Among Married-Couple vs Single-Parent Households in Crystal Falls
The poverty data for Crystal Falls shows that 2 of the married-couple family households (0.8%) and 43 of the single-parent households (29.0%) are living below the poverty level. Within the married-couple family households, those with no children have the highest poverty rate, with 2 households (1.1%) falling below the poverty line. Among the single-parent households, those with 3 or 4 children have the highest poverty rate, with 15 household (71.4%) living below poverty.
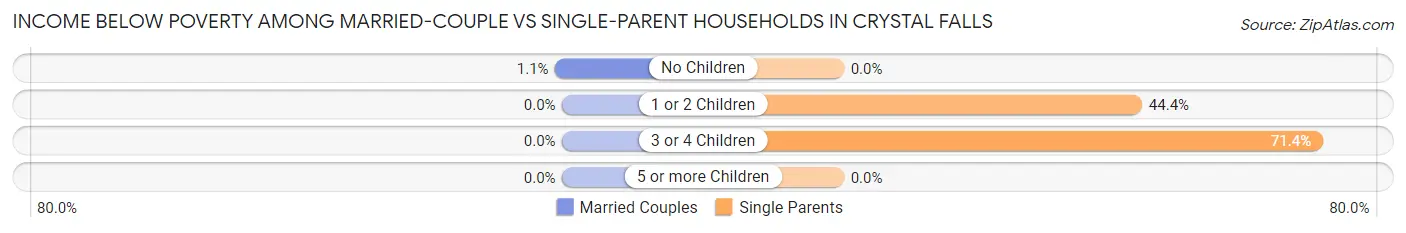
| Children | Married-Couple Families | Single-Parent Households |
| No Children | 2 (1.1%) | 0 (0.0%) |
| 1 or 2 Children | 0 (0.0%) | 28 (44.4%) |
| 3 or 4 Children | 0 (0.0%) | 15 (71.4%) |
| 5 or more Children | 0 (0.0%) | 0 (0.0%) |
| Total | 2 (0.8%) | 43 (29.0%) |
Race in Crystal Falls
The most populous races in Crystal Falls are White / Caucasian (1,662 | 93.7%), Two or more Races (62 | 3.5%), and Black / African American (23 | 1.3%).
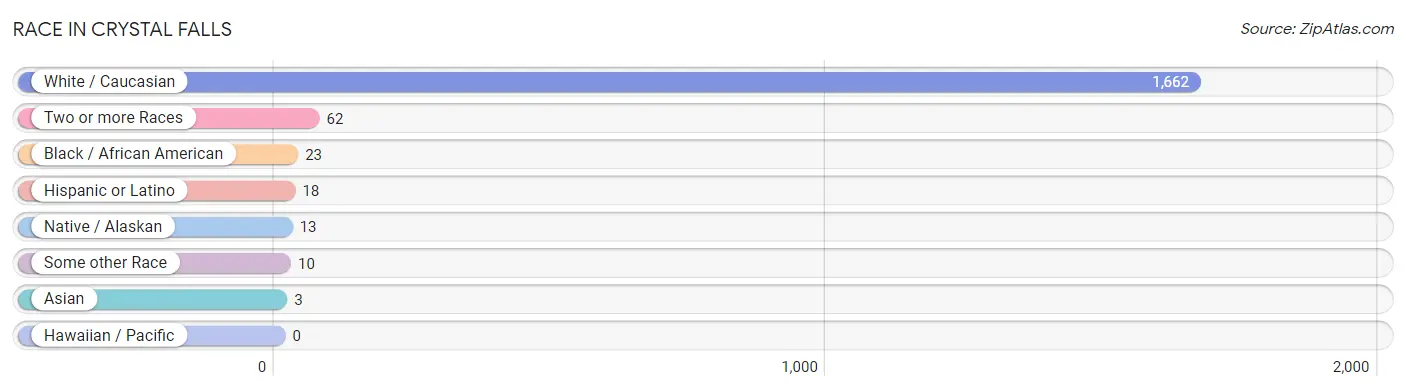
| Race | # Population | % Population |
| Asian | 3 | 0.2% |
| Black / African American | 23 | 1.3% |
| Hawaiian / Pacific | 0 | 0.0% |
| Hispanic or Latino | 18 | 1.0% |
| Native / Alaskan | 13 | 0.7% |
| White / Caucasian | 1,662 | 93.7% |
| Two or more Races | 62 | 3.5% |
| Some other Race | 10 | 0.6% |
| Total | 1,773 | 100.0% |
Ancestry in Crystal Falls
The most populous ancestries reported in Crystal Falls are German (422 | 23.8%), Italian (371 | 20.9%), American (332 | 18.7%), Finnish (199 | 11.2%), and Polish (168 | 9.5%), together accounting for 84.1% of all Crystal Falls residents.
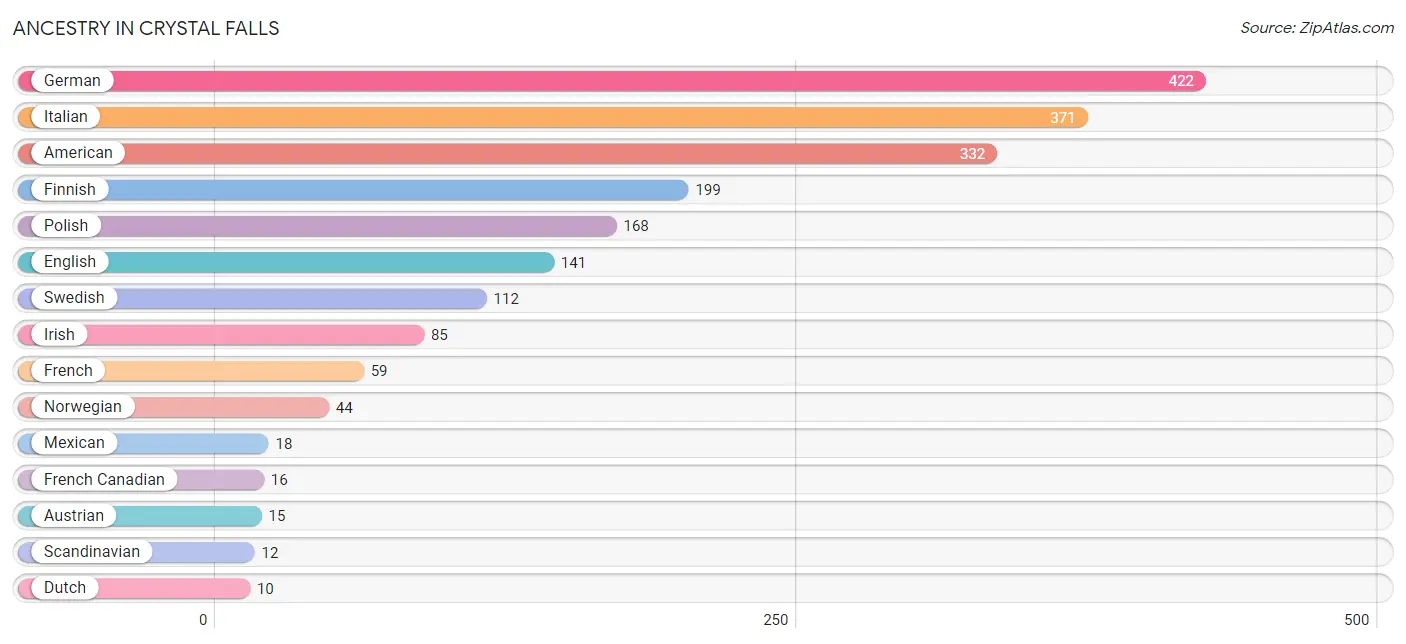
| Ancestry | # Population | % Population |
| American | 332 | 18.7% |
| Austrian | 15 | 0.9% |
| Belgian | 2 | 0.1% |
| British | 9 | 0.5% |
| Bulgarian | 3 | 0.2% |
| Cherokee | 4 | 0.2% |
| Croatian | 4 | 0.2% |
| Czech | 6 | 0.3% |
| Czechoslovakian | 3 | 0.2% |
| Danish | 8 | 0.4% |
| Dutch | 10 | 0.6% |
| English | 141 | 8.0% |
| Finnish | 199 | 11.2% |
| French | 59 | 3.3% |
| French Canadian | 16 | 0.9% |
| German | 422 | 23.8% |
| Hungarian | 8 | 0.4% |
| Indian (Asian) | 3 | 0.2% |
| Irish | 85 | 4.8% |
| Italian | 371 | 20.9% |
| Lithuanian | 3 | 0.2% |
| Mexican | 18 | 1.0% |
| Norwegian | 44 | 2.5% |
| Polish | 168 | 9.5% |
| Portuguese | 3 | 0.2% |
| Russian | 3 | 0.2% |
| Scandinavian | 12 | 0.7% |
| Scotch-Irish | 10 | 0.6% |
| Scottish | 3 | 0.2% |
| Slavic | 6 | 0.3% |
| Slovak | 5 | 0.3% |
| Slovene | 2 | 0.1% |
| Swedish | 112 | 6.3% |
| Welsh | 4 | 0.2% | View All 34 Rows |
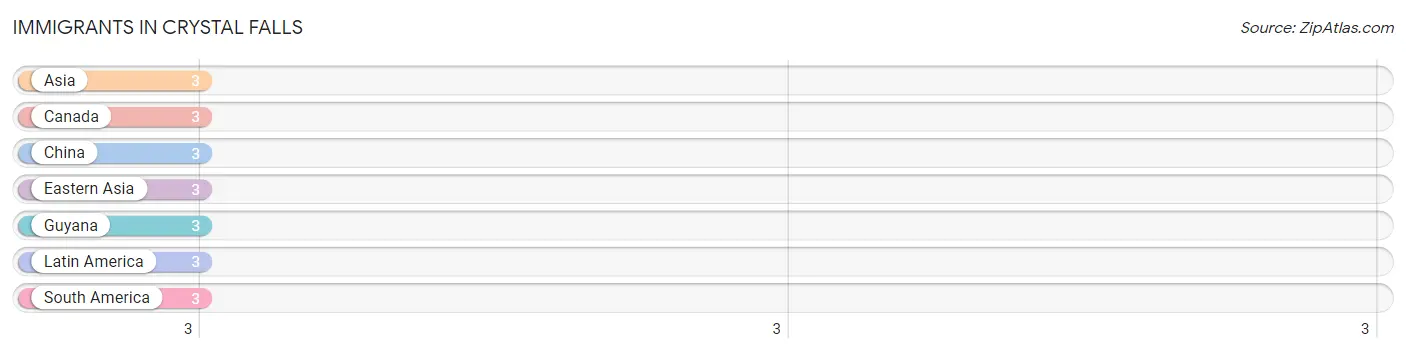
Immigrants in Crystal Falls
The most numerous immigrant groups reported in Crystal Falls came from Asia (3 | 0.2%), Canada (3 | 0.2%), China (3 | 0.2%), Eastern Asia (3 | 0.2%), and Guyana (3 | 0.2%), together accounting for 0.8% of all Crystal Falls residents.
| Immigration Origin | # Population | % Population |
| Asia | 3 | 0.2% |
| Canada | 3 | 0.2% |
| China | 3 | 0.2% |
| Eastern Asia | 3 | 0.2% |
| Guyana | 3 | 0.2% |
| Latin America | 3 | 0.2% |
| South America | 3 | 0.2% | View All 7 Rows |
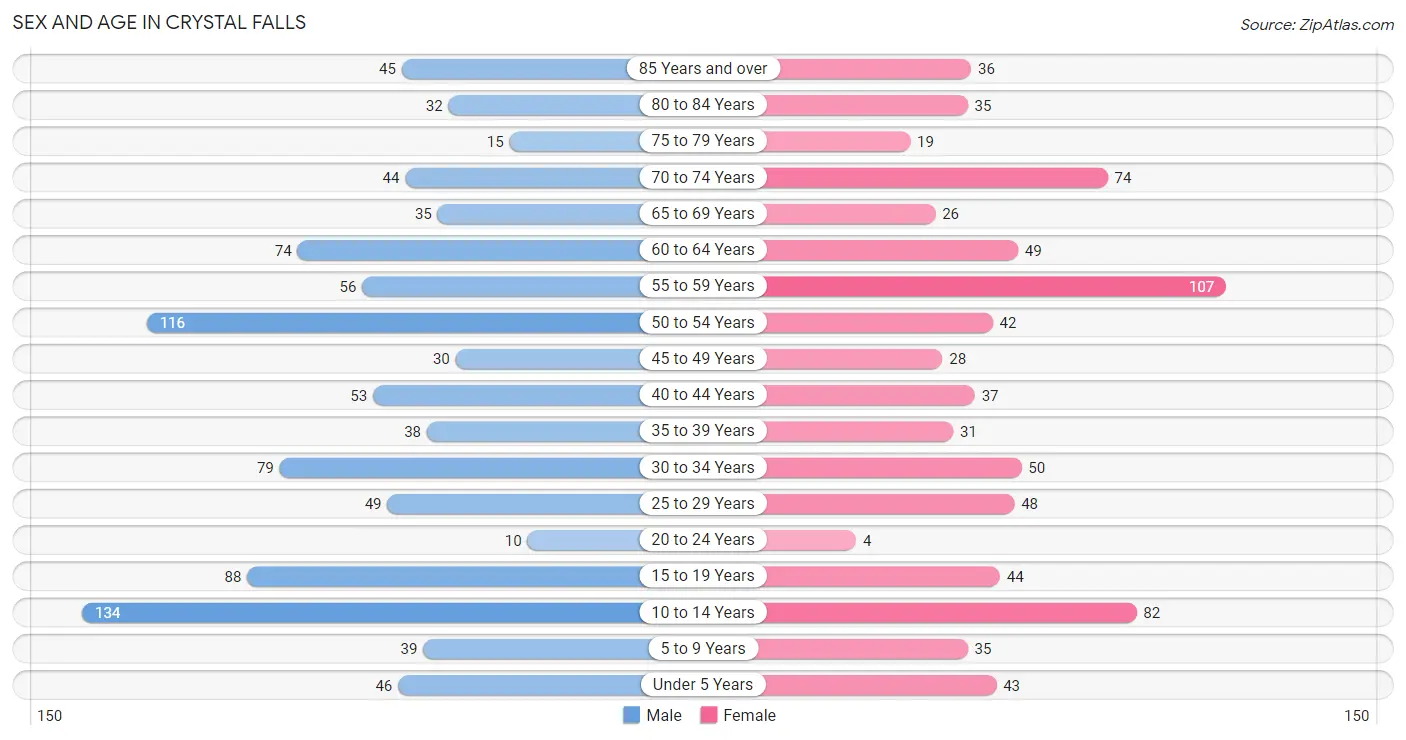
Sex and Age in Crystal Falls
Sex and Age in Crystal Falls
The most populous age groups in Crystal Falls are 10 to 14 Years (134 | 13.6%) for men and 55 to 59 Years (107 | 13.5%) for women.
| Age Bracket | Male | Female |
| Under 5 Years | 46 (4.7%) | 43 (5.4%) |
| 5 to 9 Years | 39 (4.0%) | 35 (4.4%) |
| 10 to 14 Years | 134 (13.6%) | 82 (10.4%) |
| 15 to 19 Years | 88 (8.9%) | 44 (5.6%) |
| 20 to 24 Years | 10 (1.0%) | 4 (0.5%) |
| 25 to 29 Years | 49 (5.0%) | 48 (6.1%) |
| 30 to 34 Years | 79 (8.0%) | 50 (6.3%) |
| 35 to 39 Years | 38 (3.9%) | 31 (3.9%) |
| 40 to 44 Years | 53 (5.4%) | 37 (4.7%) |
| 45 to 49 Years | 30 (3.0%) | 28 (3.5%) |
| 50 to 54 Years | 116 (11.8%) | 42 (5.3%) |
| 55 to 59 Years | 56 (5.7%) | 107 (13.5%) |
| 60 to 64 Years | 74 (7.5%) | 49 (6.2%) |
| 65 to 69 Years | 35 (3.6%) | 26 (3.3%) |
| 70 to 74 Years | 44 (4.5%) | 74 (9.4%) |
| 75 to 79 Years | 15 (1.5%) | 19 (2.4%) |
| 80 to 84 Years | 32 (3.3%) | 35 (4.4%) |
| 85 Years and over | 45 (4.6%) | 36 (4.6%) |
| Total | 983 (100.0%) | 790 (100.0%) |
Families and Households in Crystal Falls
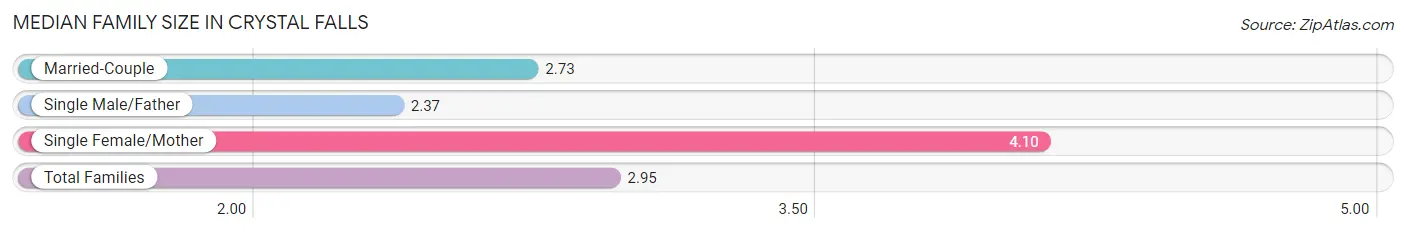
Median Family Size in Crystal Falls
The median family size in Crystal Falls is 2.95 persons per family, with single female/mother families (83 | 20.3%) accounting for the largest median family size of 4.1 persons per family. On the other hand, single male/father families (65 | 15.9%) represent the smallest median family size with 2.37 persons per family.
| Family Type | # Families | Family Size |
| Married-Couple | 260 (63.7%) | 2.73 |
| Single Male/Father | 65 (15.9%) | 2.37 |
| Single Female/Mother | 83 (20.3%) | 4.10 |
| Total Families | 408 (100.0%) | 2.95 |
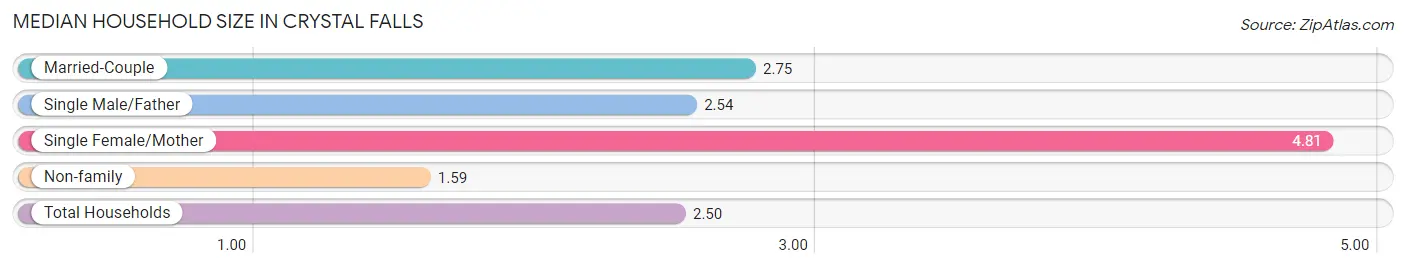
Median Household Size in Crystal Falls
The median household size in Crystal Falls is 2.50 persons per household, with single female/mother households (83 | 12.0%) accounting for the largest median household size of 4.81 persons per household. non-family households (283 | 41.0%) represent the smallest median household size with 1.59 persons per household.
| Household Type | # Households | Household Size |
| Married-Couple | 260 (37.6%) | 2.75 |
| Single Male/Father | 65 (9.4%) | 2.54 |
| Single Female/Mother | 83 (12.0%) | 4.81 |
| Non-family | 283 (41.0%) | 1.59 |
| Total Households | 691 (100.0%) | 2.50 |
Household Size by Marriage Status in Crystal Falls
Out of a total of 691 households in Crystal Falls, 408 (59.0%) are family households, while 283 (41.0%) are nonfamily households. The most numerous type of family households are 2-person households, comprising 258, and the most common type of nonfamily households are 1-person households, comprising 227.
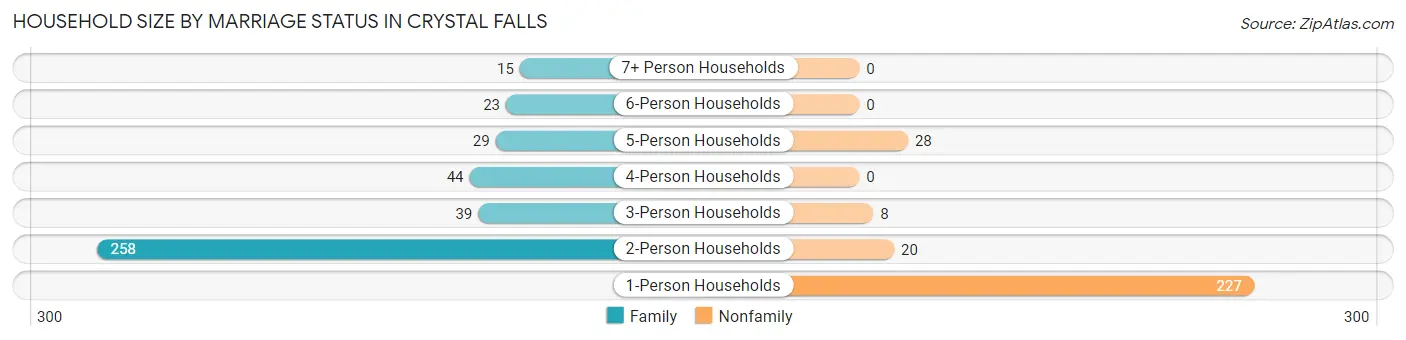
| Household Size | Family Households | Nonfamily Households |
| 1-Person Households | - | 227 (32.9%) |
| 2-Person Households | 258 (37.3%) | 20 (2.9%) |
| 3-Person Households | 39 (5.6%) | 8 (1.2%) |
| 4-Person Households | 44 (6.4%) | 0 (0.0%) |
| 5-Person Households | 29 (4.2%) | 28 (4.1%) |
| 6-Person Households | 23 (3.3%) | 0 (0.0%) |
| 7+ Person Households | 15 (2.2%) | 0 (0.0%) |
| Total | 408 (59.0%) | 283 (41.0%) |
Female Fertility in Crystal Falls
Fertility by Age in Crystal Falls
Average fertility rate in Crystal Falls is 23.0 births per 1,000 women. Women in the age bracket of 20 to 34 years have the highest fertility rate with 59.0 births per 1,000 women. Women in the age bracket of 20 to 34 years acount for 100.0% of all women with births.
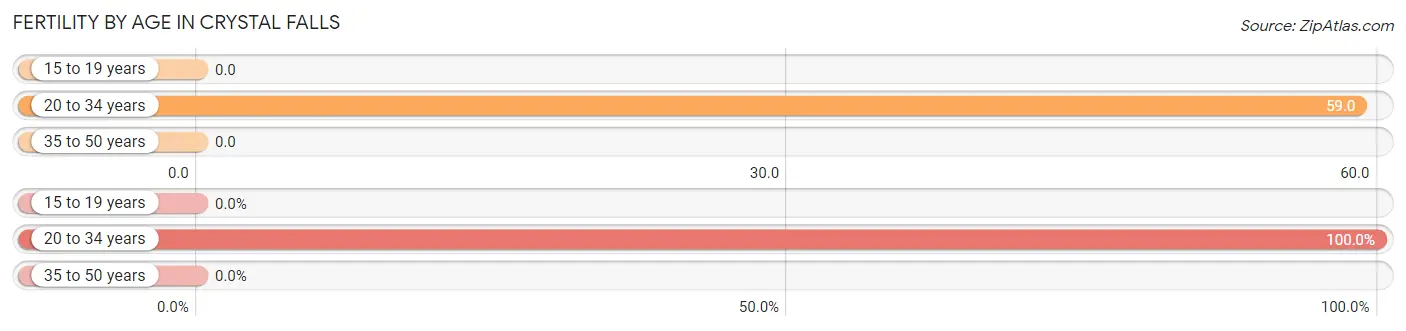
| Age Bracket | Women with Births | Births / 1,000 Women |
| 15 to 19 years | 0 (0.0%) | 0.0 |
| 20 to 34 years | 6 (100.0%) | 59.0 |
| 35 to 50 years | 0 (0.0%) | 0.0 |
| Total | 6 (100.0%) | 23.0 |
Fertility by Age by Marriage Status in Crystal Falls
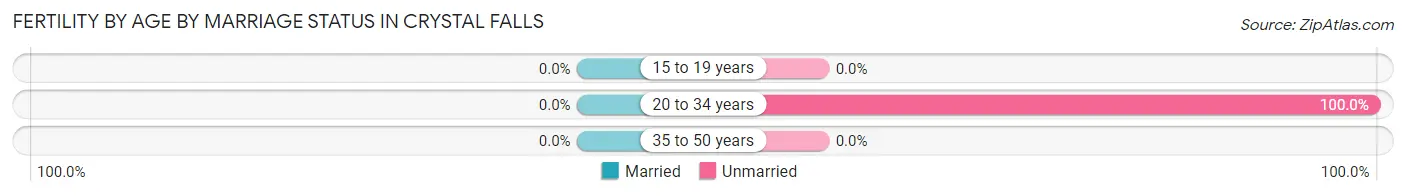
| Age Bracket | Married | Unmarried |
| 15 to 19 years | 0 (0.0%) | 0 (0.0%) |
| 20 to 34 years | 0 (0.0%) | 6 (100.0%) |
| 35 to 50 years | 0 (0.0%) | 0 (0.0%) |
| Total | 0 (0.0%) | 6 (100.0%) |
Fertility by Education in Crystal Falls
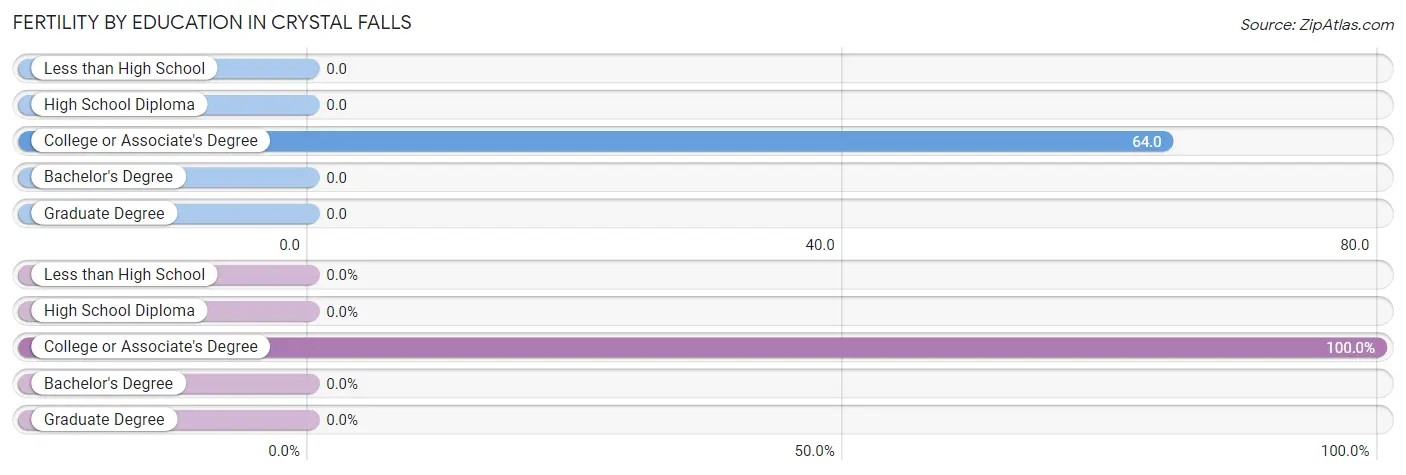
| Educational Attainment | Women with Births | Births / 1,000 Women |
| Less than High School | 0 (0.0%) | 0.0 |
| High School Diploma | 0 (0.0%) | 0.0 |
| College or Associate's Degree | 6 (100.0%) | 64.0 |
| Bachelor's Degree | 0 (0.0%) | 0.0 |
| Graduate Degree | 0 (0.0%) | 0.0 |
| Total | 6 (100.0%) | 23.0 |
Fertility by Education by Marriage Status in Crystal Falls
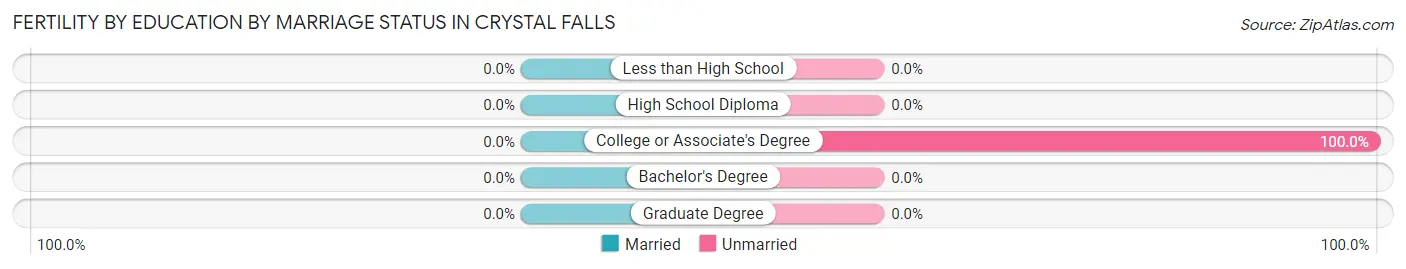
| Educational Attainment | Married | Unmarried |
| Less than High School | 0 (0.0%) | 0 (0.0%) |
| High School Diploma | 0 (0.0%) | 0 (0.0%) |
| College or Associate's Degree | 0 (0.0%) | 6 (100.0%) |
| Bachelor's Degree | 0 (0.0%) | 0 (0.0%) |
| Graduate Degree | 0 (0.0%) | 0 (0.0%) |
| Total | 0 (0.0%) | 6 (100.0%) |
Employment Characteristics in Crystal Falls
Employment by Class of Employer in Crystal Falls
Among the 624 employed individuals in Crystal Falls, private company employees (355 | 56.9%), local government employees (68 | 10.9%), and self-employed (not incorporated) (62 | 9.9%) make up the most common classes of employment.
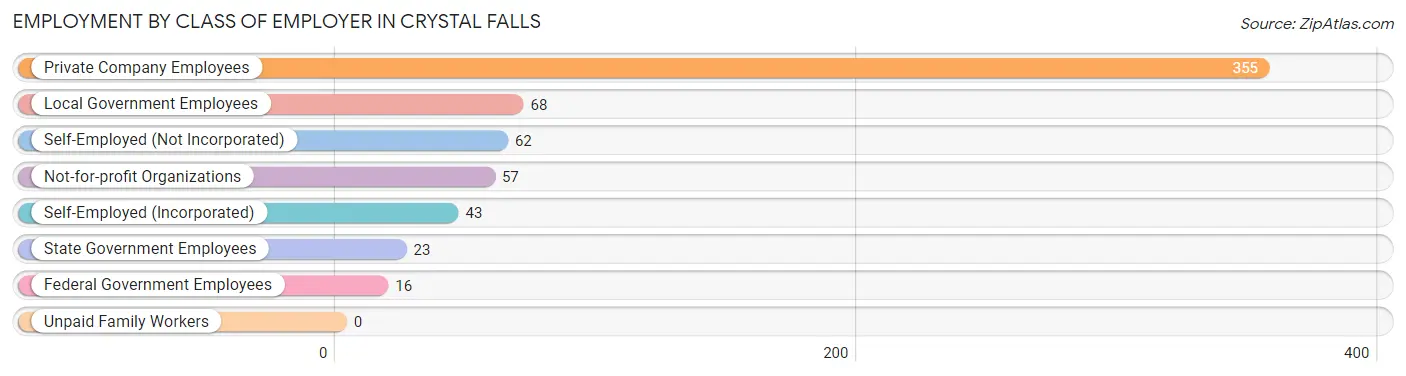
| Employer Class | # Employees | % Employees |
| Private Company Employees | 355 | 56.9% |
| Self-Employed (Incorporated) | 43 | 6.9% |
| Self-Employed (Not Incorporated) | 62 | 9.9% |
| Not-for-profit Organizations | 57 | 9.1% |
| Local Government Employees | 68 | 10.9% |
| State Government Employees | 23 | 3.7% |
| Federal Government Employees | 16 | 2.6% |
| Unpaid Family Workers | 0 | 0.0% |
| Total | 624 | 100.0% |
Employment Status by Age in Crystal Falls
According to the labor force statistics for Crystal Falls, out of the total population over 16 years of age (1,368), 47.9% or 655 individuals are in the labor force, with 2.9% or 19 of them unemployed. The age group with the highest labor force participation rate is 25 to 29 years, with 84.5% or 82 individuals in the labor force. Within the labor force, the 16 to 19 years age range has the highest percentage of unemployed individuals, with 17.2% or 5 of them being unemployed.
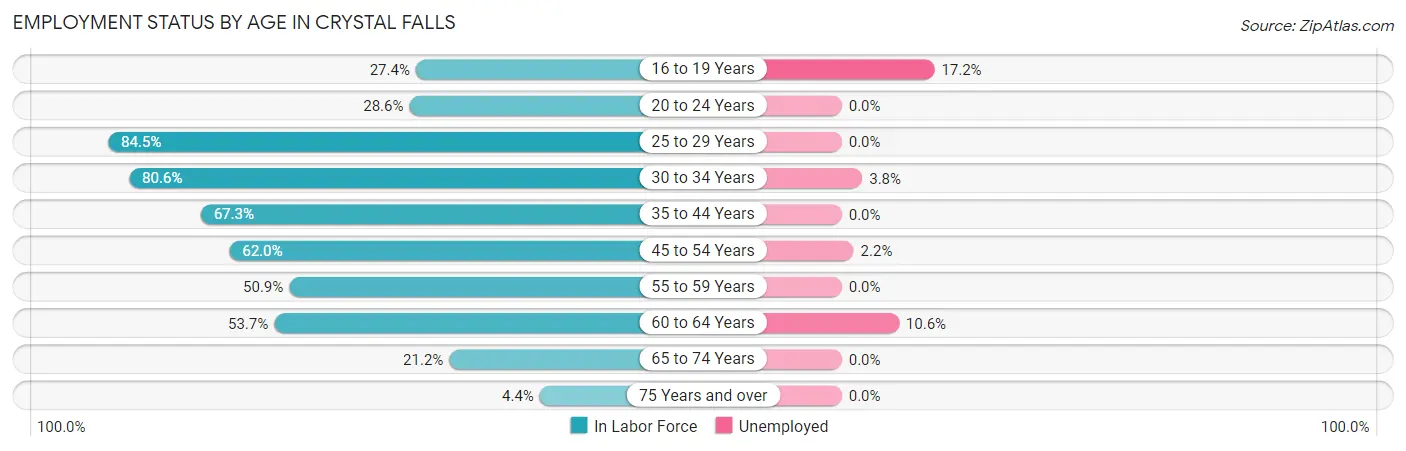
| Age Bracket | In Labor Force | Unemployed |
| 16 to 19 Years | 29 (27.4%) | 5 (17.2%) |
| 20 to 24 Years | 4 (28.6%) | 0 (0.0%) |
| 25 to 29 Years | 82 (84.5%) | 0 (0.0%) |
| 30 to 34 Years | 104 (80.6%) | 4 (3.8%) |
| 35 to 44 Years | 107 (67.3%) | 0 (0.0%) |
| 45 to 54 Years | 134 (62.0%) | 3 (2.2%) |
| 55 to 59 Years | 83 (50.9%) | 0 (0.0%) |
| 60 to 64 Years | 66 (53.7%) | 7 (10.6%) |
| 65 to 74 Years | 38 (21.2%) | 0 (0.0%) |
| 75 Years and over | 8 (4.4%) | 0 (0.0%) |
| Total | 655 (47.9%) | 19 (2.9%) |
Employment Status by Educational Attainment in Crystal Falls
According to labor force statistics for Crystal Falls, 64.9% of individuals (576) out of the total population between 25 and 64 years of age (887) are in the labor force, with 2.4% or 14 of them being unemployed. The group with the highest labor force participation rate are those with the educational attainment of bachelor's degree or higher, with 91.1% or 92 individuals in the labor force. Within the labor force, individuals with bachelor's degree or higher education have the highest percentage of unemployment, with 7.6% or 7 of them being unemployed.
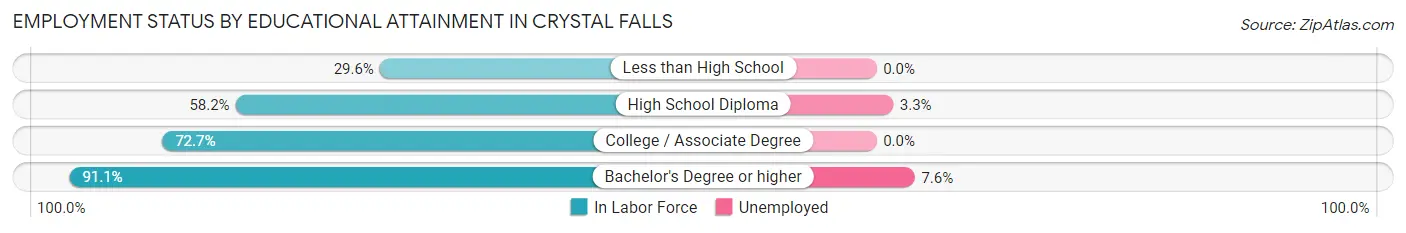
| Educational Attainment | In Labor Force | Unemployed |
| Less than High School | 24 (29.6%) | 0 (0.0%) |
| High School Diploma | 212 (58.2%) | 12 (3.3%) |
| College / Associate Degree | 248 (72.7%) | 0 (0.0%) |
| Bachelor's Degree or higher | 92 (91.1%) | 8 (7.6%) |
| Total | 576 (64.9%) | 21 (2.4%) |
Employment Occupations by Sex in Crystal Falls
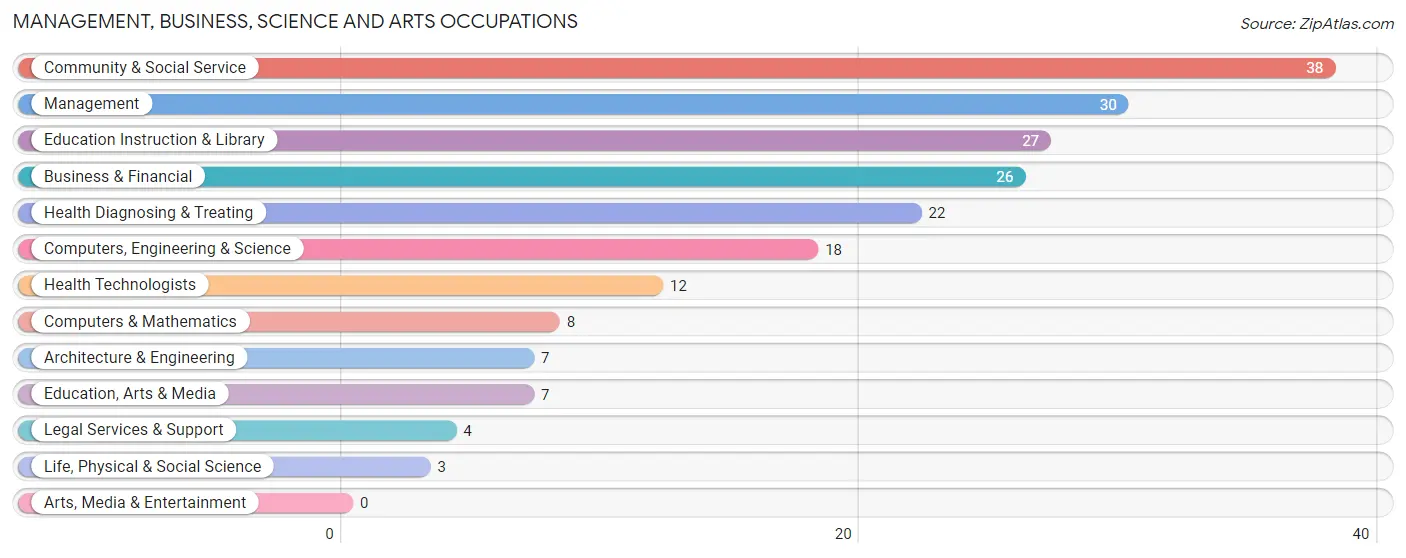
Management, Business, Science and Arts Occupations
The most common Management, Business, Science and Arts occupations in Crystal Falls are Community & Social Service (38 | 6.0%), Management (30 | 4.7%), Education Instruction & Library (27 | 4.3%), Business & Financial (26 | 4.1%), and Health Diagnosing & Treating (22 | 3.5%).
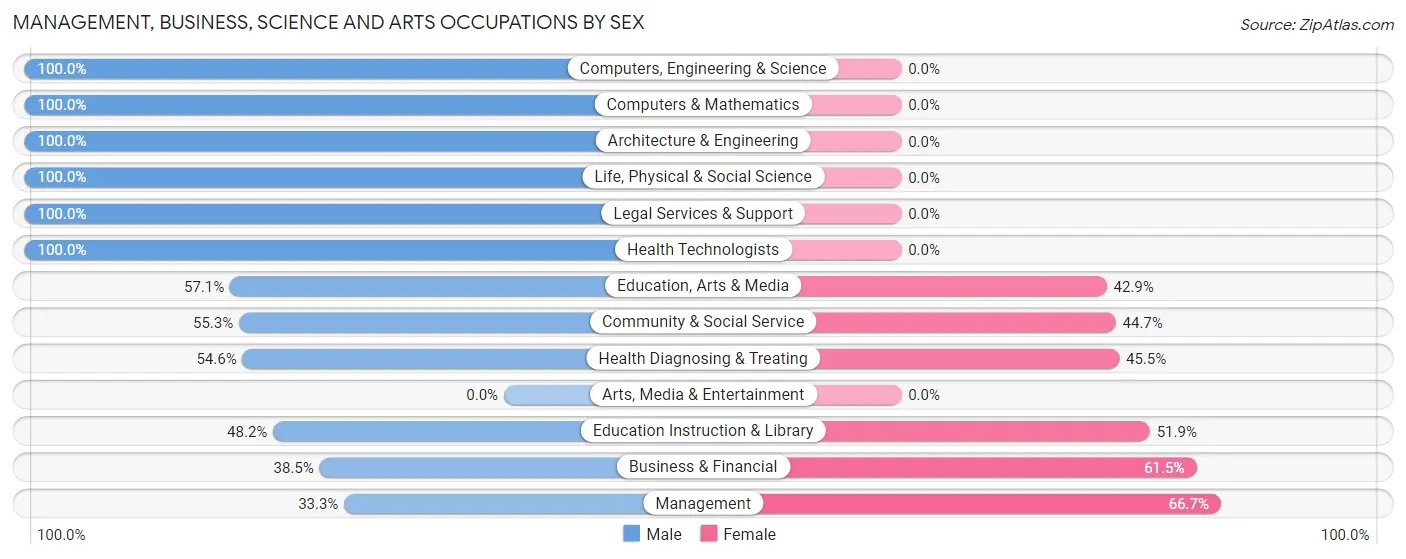
Management, Business, Science and Arts Occupations by Sex
Within the Management, Business, Science and Arts occupations in Crystal Falls, the most male-oriented occupations are Computers, Engineering & Science (100.0%), Computers & Mathematics (100.0%), and Architecture & Engineering (100.0%), while the most female-oriented occupations are Management (66.7%), Business & Financial (61.5%), and Education Instruction & Library (51.8%).
| Occupation | Male | Female |
| Management | 10 (33.3%) | 20 (66.7%) |
| Business & Financial | 10 (38.5%) | 16 (61.5%) |
| Computers, Engineering & Science | 18 (100.0%) | 0 (0.0%) |
| Computers & Mathematics | 8 (100.0%) | 0 (0.0%) |
| Architecture & Engineering | 7 (100.0%) | 0 (0.0%) |
| Life, Physical & Social Science | 3 (100.0%) | 0 (0.0%) |
| Community & Social Service | 21 (55.3%) | 17 (44.7%) |
| Education, Arts & Media | 4 (57.1%) | 3 (42.9%) |
| Legal Services & Support | 4 (100.0%) | 0 (0.0%) |
| Education Instruction & Library | 13 (48.1%) | 14 (51.8%) |
| Arts, Media & Entertainment | 0 (0.0%) | 0 (0.0%) |
| Health Diagnosing & Treating | 12 (54.5%) | 10 (45.5%) |
| Health Technologists | 12 (100.0%) | 0 (0.0%) |
| Total (Category) | 71 (53.0%) | 63 (47.0%) |
| Total (Overall) | 328 (51.6%) | 308 (48.4%) |
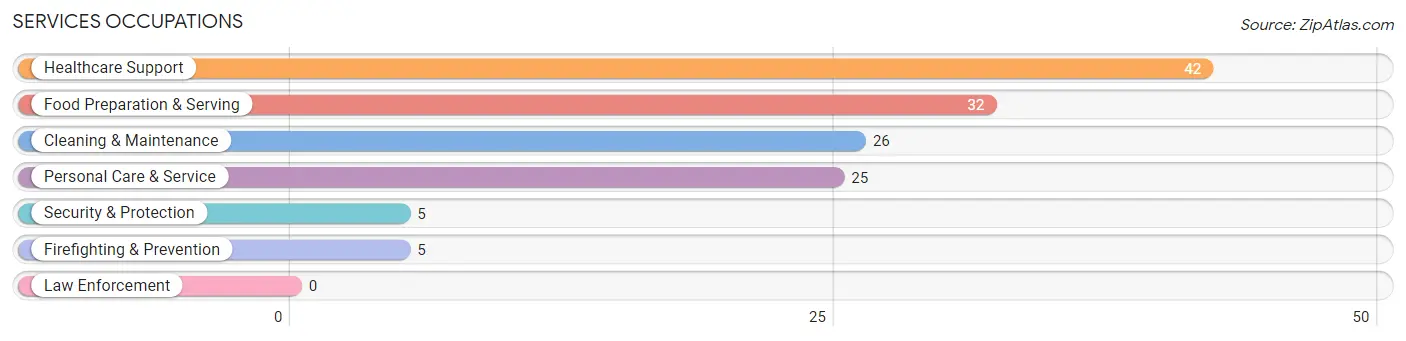
Services Occupations
The most common Services occupations in Crystal Falls are Healthcare Support (42 | 6.6%), Food Preparation & Serving (32 | 5.0%), Cleaning & Maintenance (26 | 4.1%), Personal Care & Service (25 | 3.9%), and Security & Protection (5 | 0.8%).
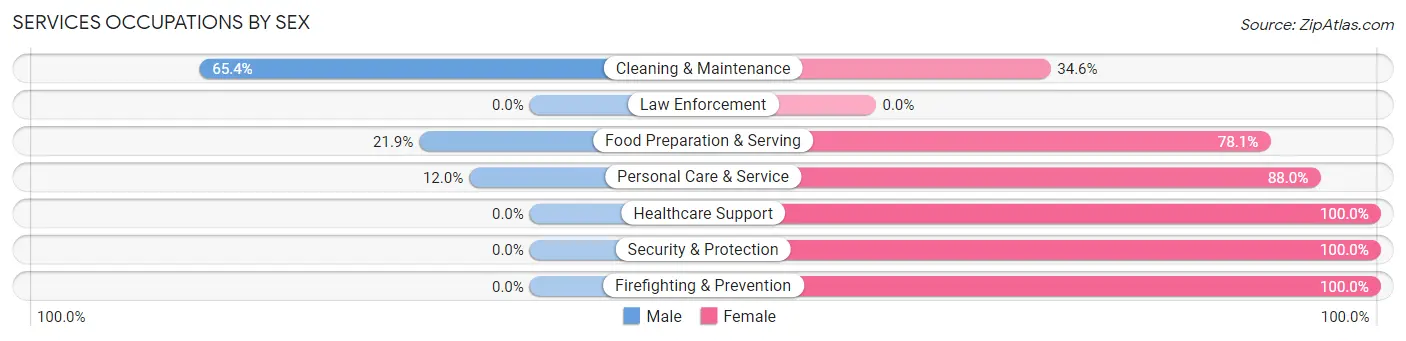
Services Occupations by Sex
Within the Services occupations in Crystal Falls, the most male-oriented occupations are Cleaning & Maintenance (65.4%), Food Preparation & Serving (21.9%), and Personal Care & Service (12.0%), while the most female-oriented occupations are Healthcare Support (100.0%), Security & Protection (100.0%), and Firefighting & Prevention (100.0%).
| Occupation | Male | Female |
| Healthcare Support | 0 (0.0%) | 42 (100.0%) |
| Security & Protection | 0 (0.0%) | 5 (100.0%) |
| Firefighting & Prevention | 0 (0.0%) | 5 (100.0%) |
| Law Enforcement | 0 (0.0%) | 0 (0.0%) |
| Food Preparation & Serving | 7 (21.9%) | 25 (78.1%) |
| Cleaning & Maintenance | 17 (65.4%) | 9 (34.6%) |
| Personal Care & Service | 3 (12.0%) | 22 (88.0%) |
| Total (Category) | 27 (20.8%) | 103 (79.2%) |
| Total (Overall) | 328 (51.6%) | 308 (48.4%) |
Sales and Office Occupations
The most common Sales and Office occupations in Crystal Falls are Office & Administration (87 | 13.7%), and Sales & Related (44 | 6.9%).
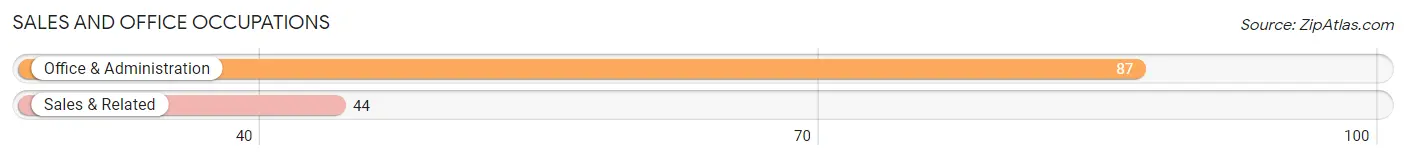
Sales and Office Occupations by Sex
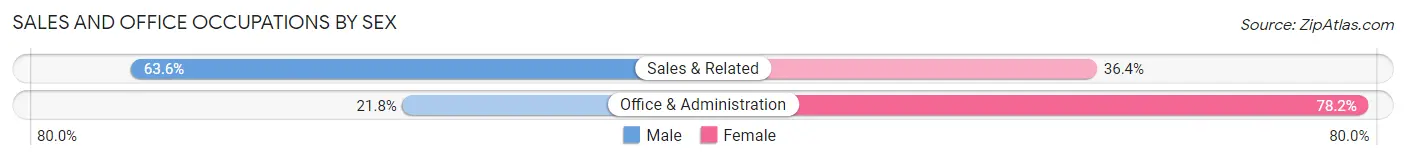
| Occupation | Male | Female |
| Sales & Related | 28 (63.6%) | 16 (36.4%) |
| Office & Administration | 19 (21.8%) | 68 (78.2%) |
| Total (Category) | 47 (35.9%) | 84 (64.1%) |
| Total (Overall) | 328 (51.6%) | 308 (48.4%) |
Natural Resources, Construction and Maintenance Occupations
The most common Natural Resources, Construction and Maintenance occupations in Crystal Falls are Construction & Extraction (39 | 6.1%), Installation, Maintenance & Repair (27 | 4.3%), and Farming, Fishing & Forestry (7 | 1.1%).
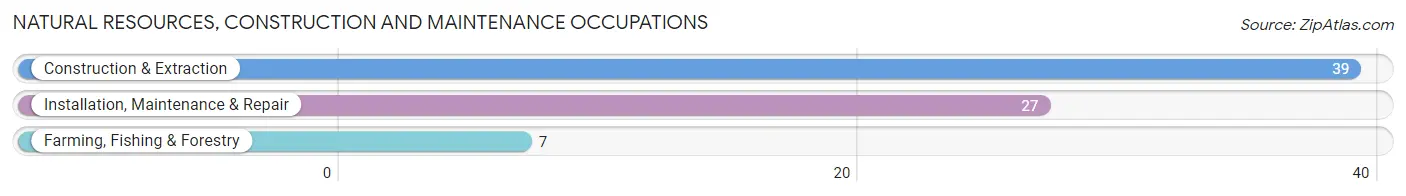
Natural Resources, Construction and Maintenance Occupations by Sex
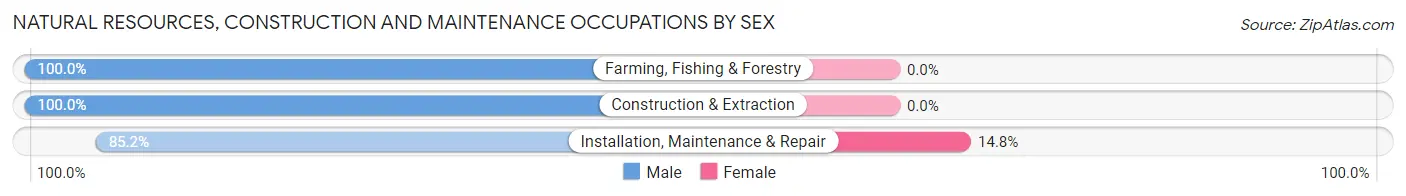
| Occupation | Male | Female |
| Farming, Fishing & Forestry | 7 (100.0%) | 0 (0.0%) |
| Construction & Extraction | 39 (100.0%) | 0 (0.0%) |
| Installation, Maintenance & Repair | 23 (85.2%) | 4 (14.8%) |
| Total (Category) | 69 (94.5%) | 4 (5.5%) |
| Total (Overall) | 328 (51.6%) | 308 (48.4%) |
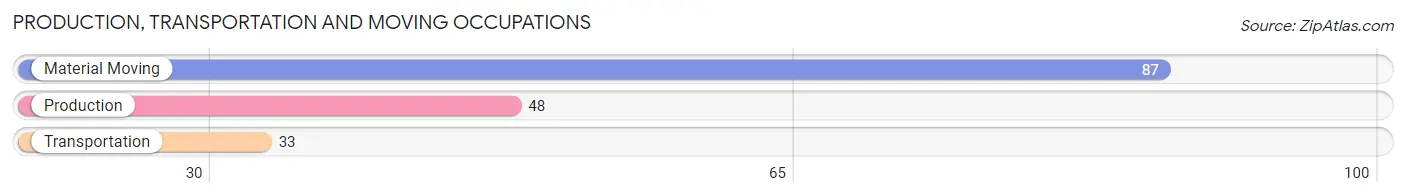
Production, Transportation and Moving Occupations
The most common Production, Transportation and Moving occupations in Crystal Falls are Material Moving (87 | 13.7%), Production (48 | 7.5%), and Transportation (33 | 5.2%).
Production, Transportation and Moving Occupations by Sex
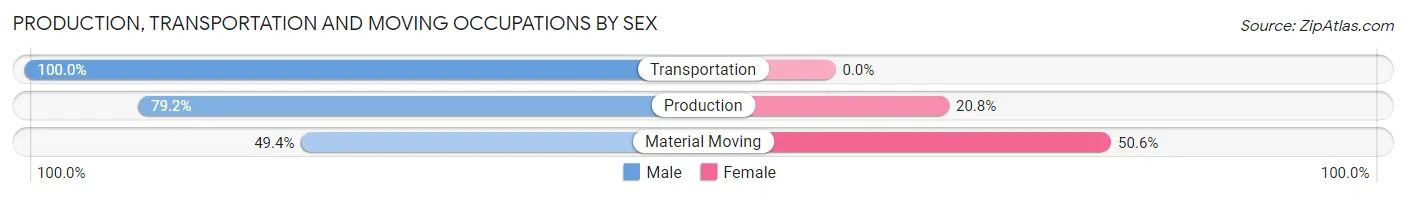
| Occupation | Male | Female |
| Production | 38 (79.2%) | 10 (20.8%) |
| Transportation | 33 (100.0%) | 0 (0.0%) |
| Material Moving | 43 (49.4%) | 44 (50.6%) |
| Total (Category) | 114 (67.9%) | 54 (32.1%) |
| Total (Overall) | 328 (51.6%) | 308 (48.4%) |
Employment Industries by Sex in Crystal Falls
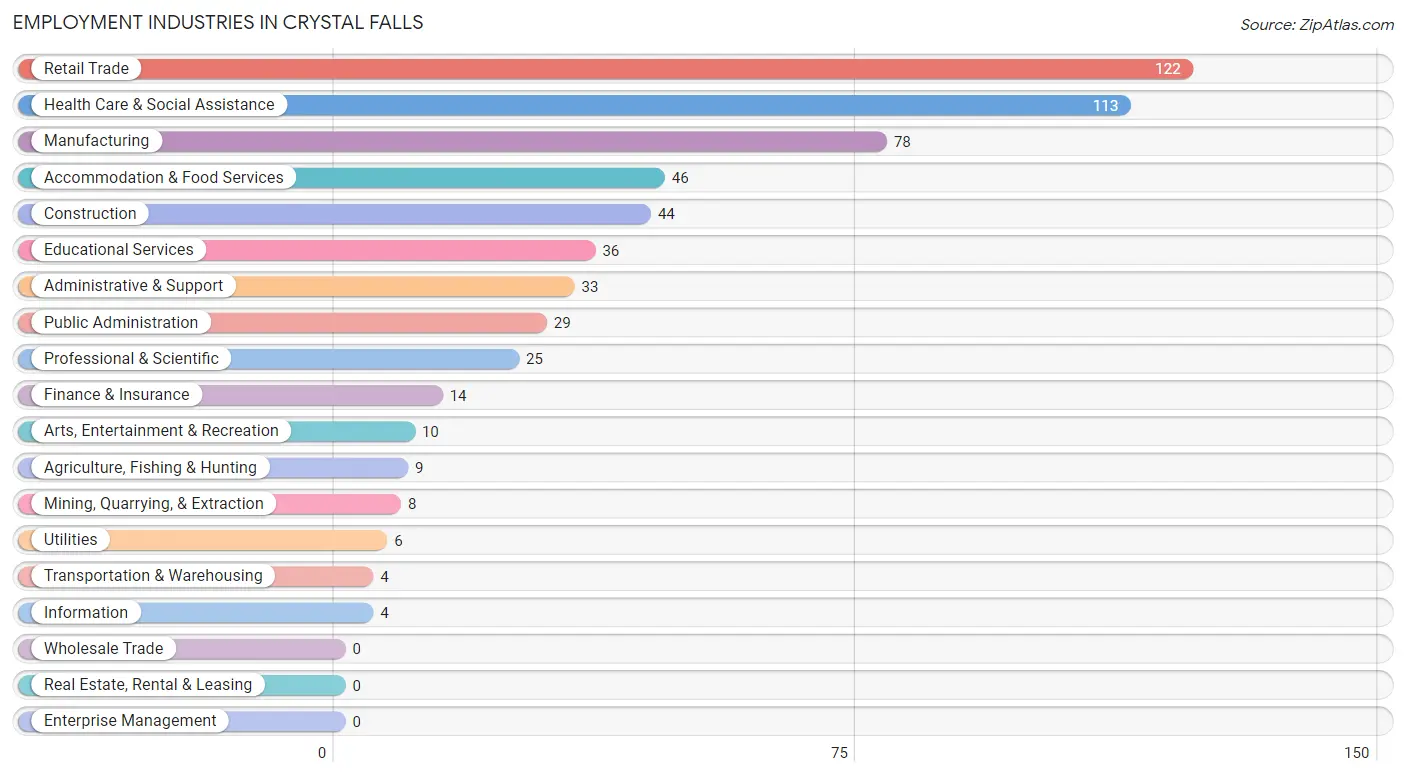
Employment Industries in Crystal Falls
The major employment industries in Crystal Falls include Retail Trade (122 | 19.2%), Health Care & Social Assistance (113 | 17.8%), Manufacturing (78 | 12.3%), Accommodation & Food Services (46 | 7.2%), and Construction (44 | 6.9%).
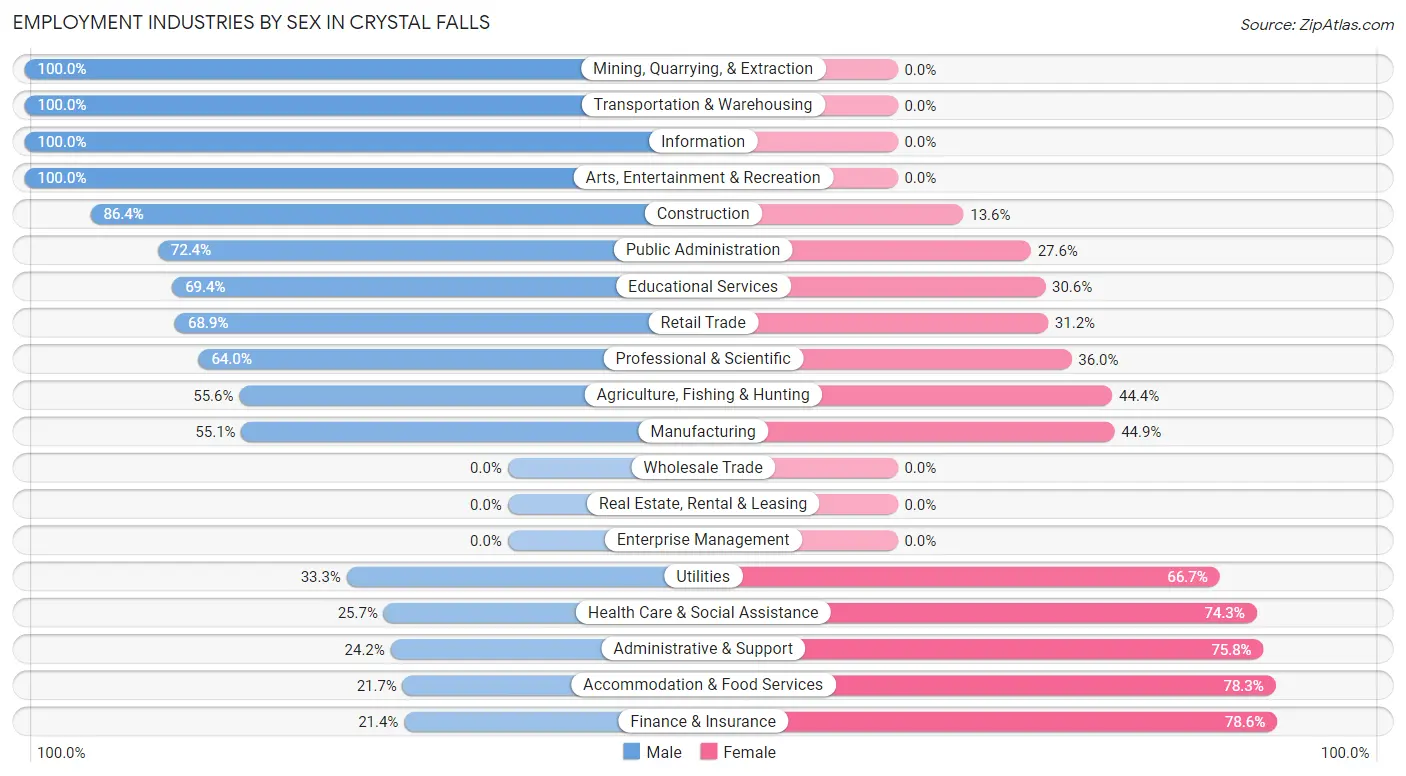
Employment Industries by Sex in Crystal Falls
The Crystal Falls industries that see more men than women are Mining, Quarrying, & Extraction (100.0%), Transportation & Warehousing (100.0%), and Information (100.0%), whereas the industries that tend to have a higher number of women are Finance & Insurance (78.6%), Accommodation & Food Services (78.3%), and Administrative & Support (75.8%).
| Industry | Male | Female |
| Agriculture, Fishing & Hunting | 5 (55.6%) | 4 (44.4%) |
| Mining, Quarrying, & Extraction | 8 (100.0%) | 0 (0.0%) |
| Construction | 38 (86.4%) | 6 (13.6%) |
| Manufacturing | 43 (55.1%) | 35 (44.9%) |
| Wholesale Trade | 0 (0.0%) | 0 (0.0%) |
| Retail Trade | 84 (68.9%) | 38 (31.1%) |
| Transportation & Warehousing | 4 (100.0%) | 0 (0.0%) |
| Utilities | 2 (33.3%) | 4 (66.7%) |
| Information | 4 (100.0%) | 0 (0.0%) |
| Finance & Insurance | 3 (21.4%) | 11 (78.6%) |
| Real Estate, Rental & Leasing | 0 (0.0%) | 0 (0.0%) |
| Professional & Scientific | 16 (64.0%) | 9 (36.0%) |
| Enterprise Management | 0 (0.0%) | 0 (0.0%) |
| Administrative & Support | 8 (24.2%) | 25 (75.8%) |
| Educational Services | 25 (69.4%) | 11 (30.6%) |
| Health Care & Social Assistance | 29 (25.7%) | 84 (74.3%) |
| Arts, Entertainment & Recreation | 10 (100.0%) | 0 (0.0%) |
| Accommodation & Food Services | 10 (21.7%) | 36 (78.3%) |
| Public Administration | 21 (72.4%) | 8 (27.6%) |
| Total | 328 (51.6%) | 308 (48.4%) |
Education in Crystal Falls
School Enrollment in Crystal Falls
The most common levels of schooling among the 475 students in Crystal Falls are middle school (145 | 30.5%), high school (140 | 29.5%), and elementary school (132 | 27.8%).
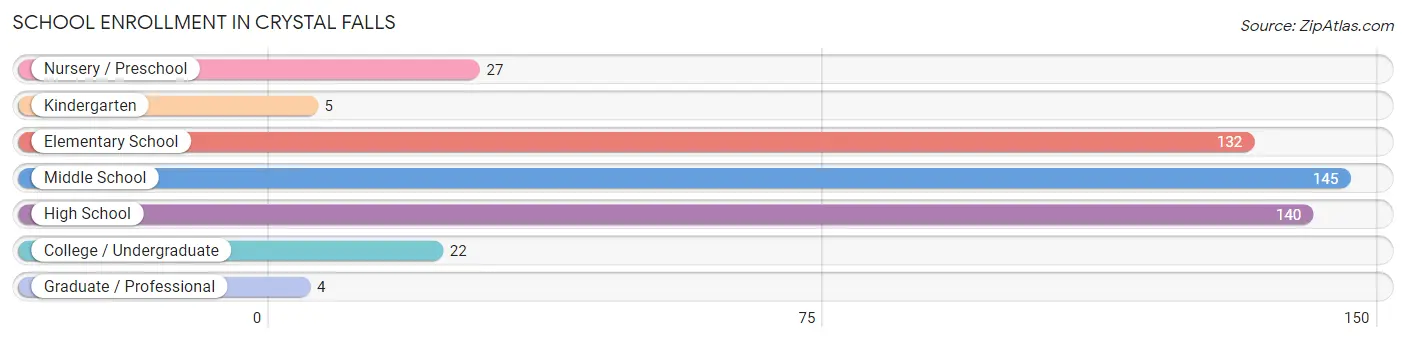
| School Level | # Students | % Students |
| Nursery / Preschool | 27 | 5.7% |
| Kindergarten | 5 | 1.1% |
| Elementary School | 132 | 27.8% |
| Middle School | 145 | 30.5% |
| High School | 140 | 29.5% |
| College / Undergraduate | 22 | 4.6% |
| Graduate / Professional | 4 | 0.8% |
| Total | 475 | 100.0% |
School Enrollment by Age by Funding Source in Crystal Falls
Out of a total of 475 students who are enrolled in schools in Crystal Falls, 24 (5.1%) attend a private institution, while the remaining 451 (94.9%) are enrolled in public schools. The age group of 5 to 9 year old has the highest likelihood of being enrolled in private schools, with 13 (17.6% in the age bracket) enrolled. Conversely, the age group of 3 to 4 year olds has the lowest likelihood of being enrolled in a private school, with 27 (100.0% in the age bracket) attending a public institution.
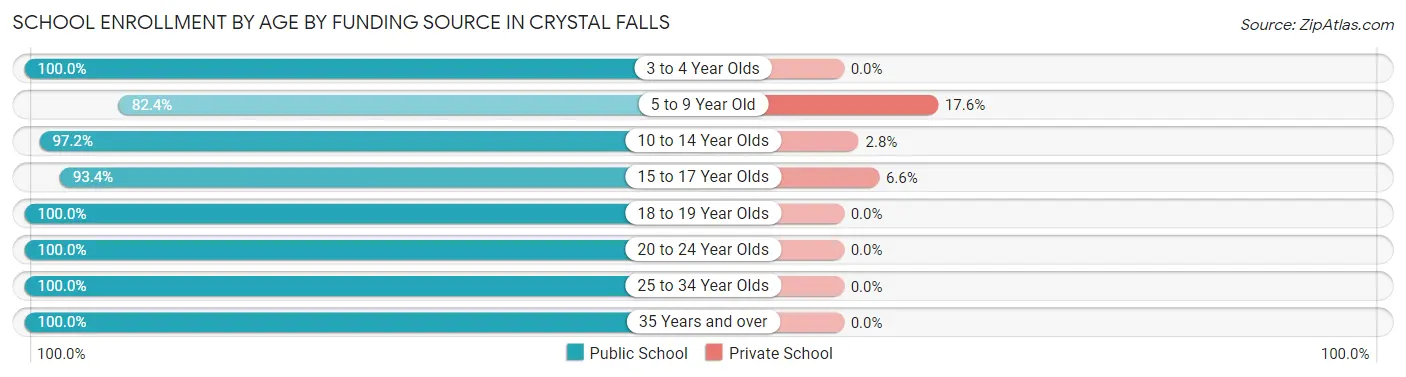
| Age Bracket | Public School | Private School |
| 3 to 4 Year Olds | 27 (100.0%) | 0 (0.0%) |
| 5 to 9 Year Old | 61 (82.4%) | 13 (17.6%) |
| 10 to 14 Year Olds | 210 (97.2%) | 6 (2.8%) |
| 15 to 17 Year Olds | 71 (93.4%) | 5 (6.6%) |
| 18 to 19 Year Olds | 56 (100.0%) | 0 (0.0%) |
| 20 to 24 Year Olds | 14 (100.0%) | 0 (0.0%) |
| 25 to 34 Year Olds | 5 (100.0%) | 0 (0.0%) |
| 35 Years and over | 7 (100.0%) | 0 (0.0%) |
| Total | 451 (94.9%) | 24 (5.1%) |
Educational Attainment by Field of Study in Crystal Falls
Education (66 | 28.8%), business (34 | 14.8%), arts & humanities (26 | 11.4%), science & technology (25 | 10.9%), and liberal arts & history (17 | 7.4%) are the most common fields of study among 229 individuals in Crystal Falls who have obtained a bachelor's degree or higher.
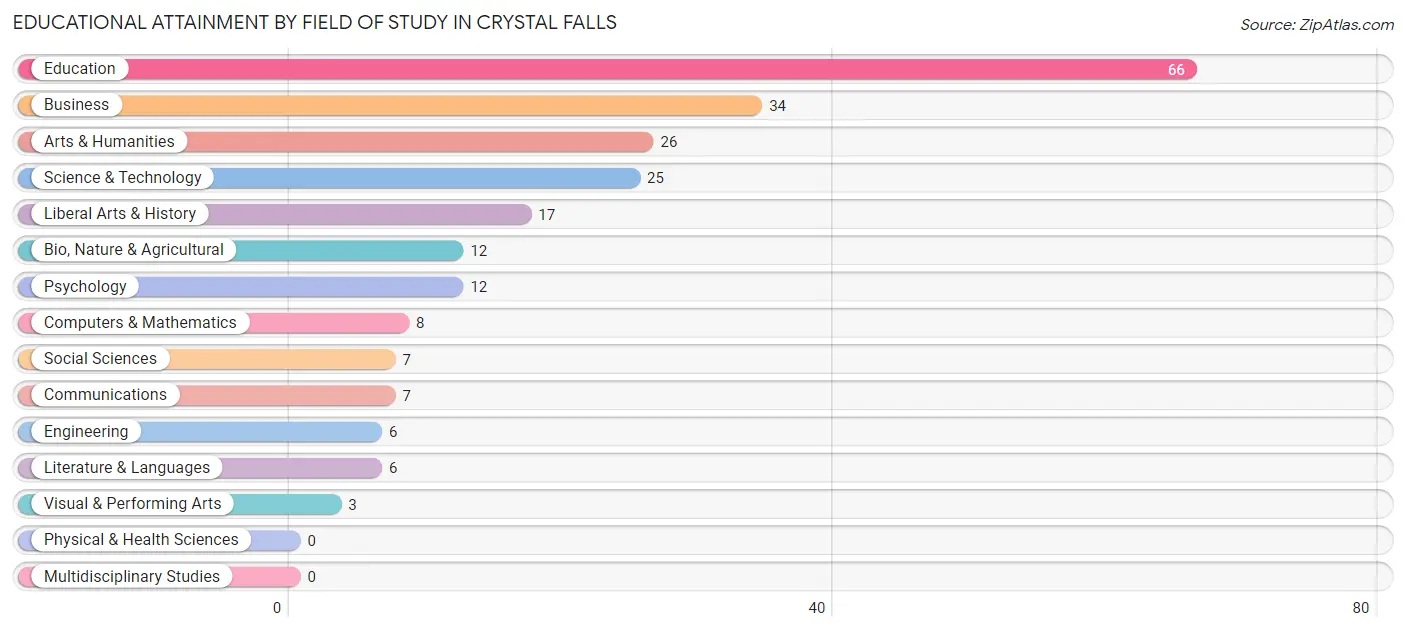
| Field of Study | # Graduates | % Graduates |
| Computers & Mathematics | 8 | 3.5% |
| Bio, Nature & Agricultural | 12 | 5.2% |
| Physical & Health Sciences | 0 | 0.0% |
| Psychology | 12 | 5.2% |
| Social Sciences | 7 | 3.1% |
| Engineering | 6 | 2.6% |
| Multidisciplinary Studies | 0 | 0.0% |
| Science & Technology | 25 | 10.9% |
| Business | 34 | 14.8% |
| Education | 66 | 28.8% |
| Literature & Languages | 6 | 2.6% |
| Liberal Arts & History | 17 | 7.4% |
| Visual & Performing Arts | 3 | 1.3% |
| Communications | 7 | 3.1% |
| Arts & Humanities | 26 | 11.4% |
| Total | 229 | 100.0% |
Transportation & Commute in Crystal Falls
Vehicle Availability by Sex in Crystal Falls
The most prevalent vehicle ownership categories in Crystal Falls are males with 2 vehicles (177, accounting for 54.6%) and females with 2 vehicles (98, making up 59.0%).
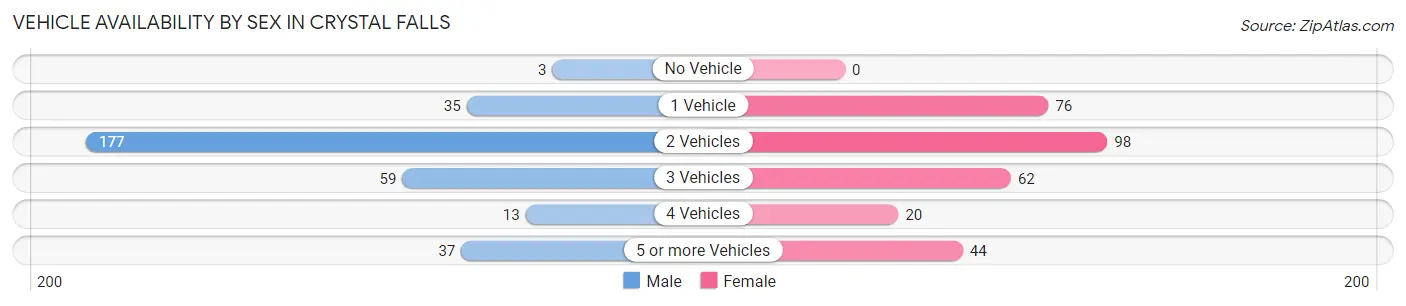
| Vehicles Available | Male | Female |
| No Vehicle | 3 (0.9%) | 0 (0.0%) |
| 1 Vehicle | 35 (10.8%) | 76 (25.3%) |
| 2 Vehicles | 177 (54.6%) | 98 (32.7%) |
| 3 Vehicles | 59 (18.2%) | 62 (20.7%) |
| 4 Vehicles | 13 (4.0%) | 20 (6.7%) |
| 5 or more Vehicles | 37 (11.4%) | 44 (14.7%) |
| Total | 324 (100.0%) | 300 (100.0%) |
Commute Time in Crystal Falls
The most frequently occuring commute durations in Crystal Falls are 5 to 9 minutes (149 commuters, 25.9%), less than 5 minutes (78 commuters, 13.6%), and 10 to 14 minutes (70 commuters, 12.2%).
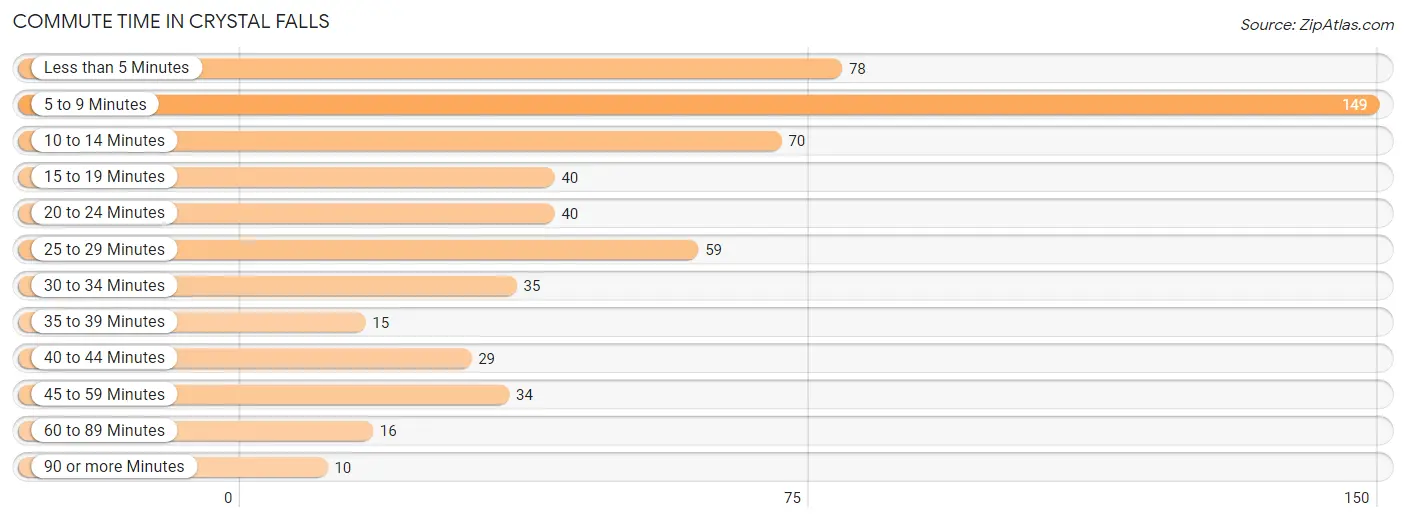
| Commute Time | # Commuters | % Commuters |
| Less than 5 Minutes | 78 | 13.6% |
| 5 to 9 Minutes | 149 | 25.9% |
| 10 to 14 Minutes | 70 | 12.2% |
| 15 to 19 Minutes | 40 | 7.0% |
| 20 to 24 Minutes | 40 | 7.0% |
| 25 to 29 Minutes | 59 | 10.3% |
| 30 to 34 Minutes | 35 | 6.1% |
| 35 to 39 Minutes | 15 | 2.6% |
| 40 to 44 Minutes | 29 | 5.0% |
| 45 to 59 Minutes | 34 | 5.9% |
| 60 to 89 Minutes | 16 | 2.8% |
| 90 or more Minutes | 10 | 1.7% |
Commute Time by Sex in Crystal Falls
The most common commute times in Crystal Falls are 5 to 9 minutes (59 commuters, 19.7%) for males and 5 to 9 minutes (90 commuters, 32.7%) for females.
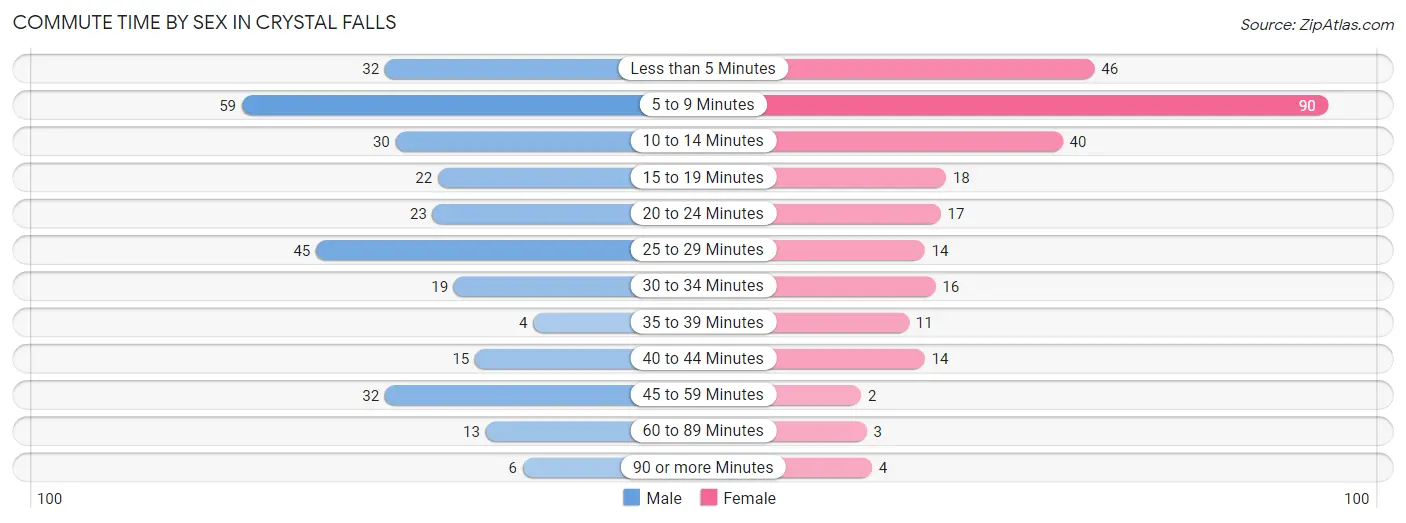
| Commute Time | Male | Female |
| Less than 5 Minutes | 32 (10.7%) | 46 (16.7%) |
| 5 to 9 Minutes | 59 (19.7%) | 90 (32.7%) |
| 10 to 14 Minutes | 30 (10.0%) | 40 (14.5%) |
| 15 to 19 Minutes | 22 (7.3%) | 18 (6.6%) |
| 20 to 24 Minutes | 23 (7.7%) | 17 (6.2%) |
| 25 to 29 Minutes | 45 (15.0%) | 14 (5.1%) |
| 30 to 34 Minutes | 19 (6.3%) | 16 (5.8%) |
| 35 to 39 Minutes | 4 (1.3%) | 11 (4.0%) |
| 40 to 44 Minutes | 15 (5.0%) | 14 (5.1%) |
| 45 to 59 Minutes | 32 (10.7%) | 2 (0.7%) |
| 60 to 89 Minutes | 13 (4.3%) | 3 (1.1%) |
| 90 or more Minutes | 6 (2.0%) | 4 (1.5%) |
Time of Departure to Work by Sex in Crystal Falls
The most frequent times of departure to work in Crystal Falls are 6:00 AM to 6:29 AM (61, 20.3%) for males and 12:00 AM to 4:59 AM (46, 16.7%) for females.
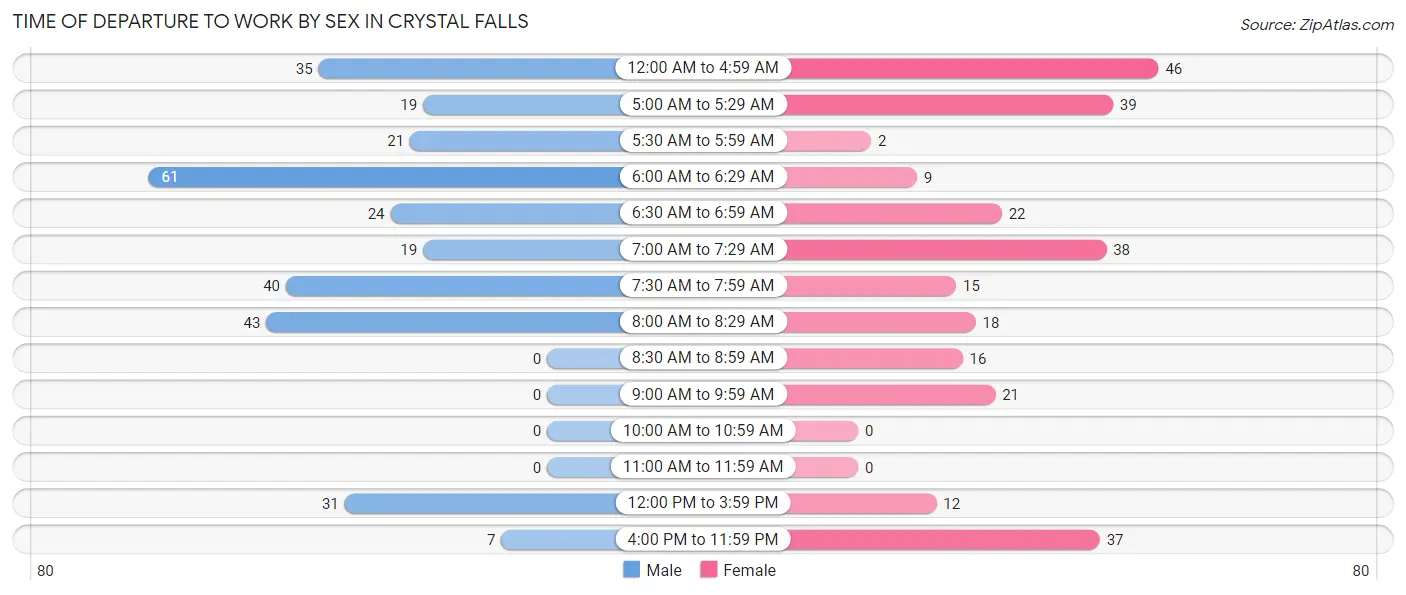
| Time of Departure | Male | Female |
| 12:00 AM to 4:59 AM | 35 (11.7%) | 46 (16.7%) |
| 5:00 AM to 5:29 AM | 19 (6.3%) | 39 (14.2%) |
| 5:30 AM to 5:59 AM | 21 (7.0%) | 2 (0.7%) |
| 6:00 AM to 6:29 AM | 61 (20.3%) | 9 (3.3%) |
| 6:30 AM to 6:59 AM | 24 (8.0%) | 22 (8.0%) |
| 7:00 AM to 7:29 AM | 19 (6.3%) | 38 (13.8%) |
| 7:30 AM to 7:59 AM | 40 (13.3%) | 15 (5.4%) |
| 8:00 AM to 8:29 AM | 43 (14.3%) | 18 (6.6%) |
| 8:30 AM to 8:59 AM | 0 (0.0%) | 16 (5.8%) |
| 9:00 AM to 9:59 AM | 0 (0.0%) | 21 (7.6%) |
| 10:00 AM to 10:59 AM | 0 (0.0%) | 0 (0.0%) |
| 11:00 AM to 11:59 AM | 0 (0.0%) | 0 (0.0%) |
| 12:00 PM to 3:59 PM | 31 (10.3%) | 12 (4.4%) |
| 4:00 PM to 11:59 PM | 7 (2.3%) | 37 (13.5%) |
| Total | 300 (100.0%) | 275 (100.0%) |
Housing Occupancy in Crystal Falls
Occupancy by Ownership in Crystal Falls
Of the total 691 dwellings in Crystal Falls, owner-occupied units account for 573 (82.9%), while renter-occupied units make up 118 (17.1%).
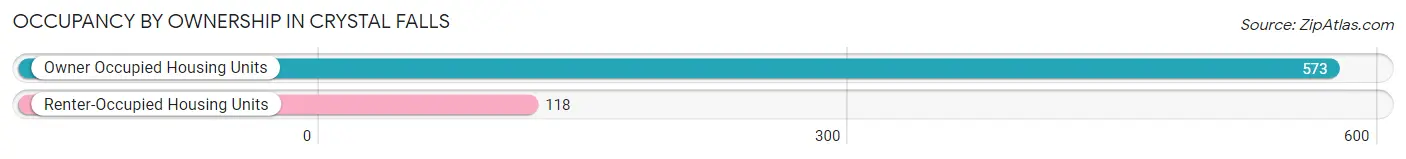
| Occupancy | # Housing Units | % Housing Units |
| Owner Occupied Housing Units | 573 | 82.9% |
| Renter-Occupied Housing Units | 118 | 17.1% |
| Total Occupied Housing Units | 691 | 100.0% |
Occupancy by Household Size in Crystal Falls
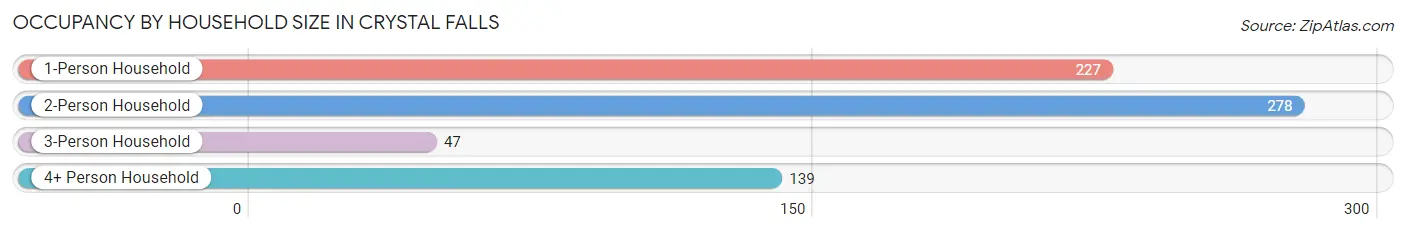
| Household Size | # Housing Units | % Housing Units |
| 1-Person Household | 227 | 32.9% |
| 2-Person Household | 278 | 40.2% |
| 3-Person Household | 47 | 6.8% |
| 4+ Person Household | 139 | 20.1% |
| Total Housing Units | 691 | 100.0% |
Occupancy by Ownership by Household Size in Crystal Falls
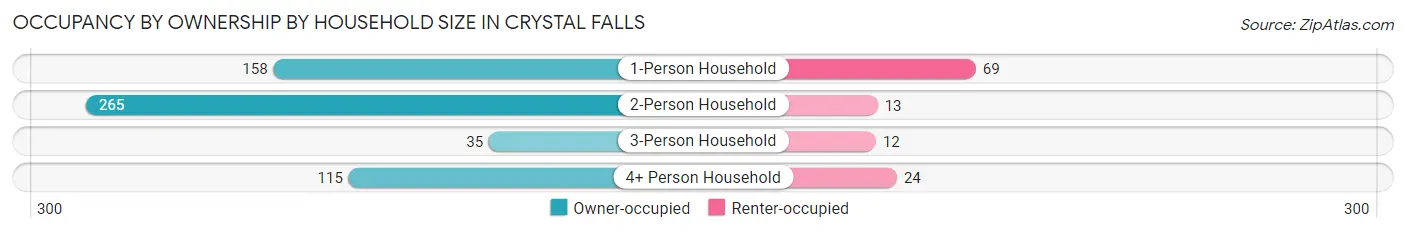
| Household Size | Owner-occupied | Renter-occupied |
| 1-Person Household | 158 (69.6%) | 69 (30.4%) |
| 2-Person Household | 265 (95.3%) | 13 (4.7%) |
| 3-Person Household | 35 (74.5%) | 12 (25.5%) |
| 4+ Person Household | 115 (82.7%) | 24 (17.3%) |
| Total Housing Units | 573 (82.9%) | 118 (17.1%) |
Occupancy by Educational Attainment in Crystal Falls
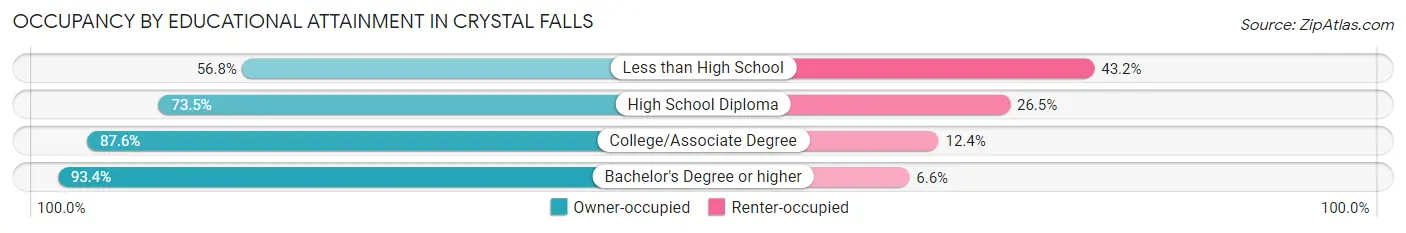
| Household Size | Owner-occupied | Renter-occupied |
| Less than High School | 21 (56.8%) | 16 (43.2%) |
| High School Diploma | 155 (73.5%) | 56 (26.5%) |
| College/Associate Degree | 255 (87.6%) | 36 (12.4%) |
| Bachelor's Degree or higher | 142 (93.4%) | 10 (6.6%) |
Occupancy by Age of Householder in Crystal Falls
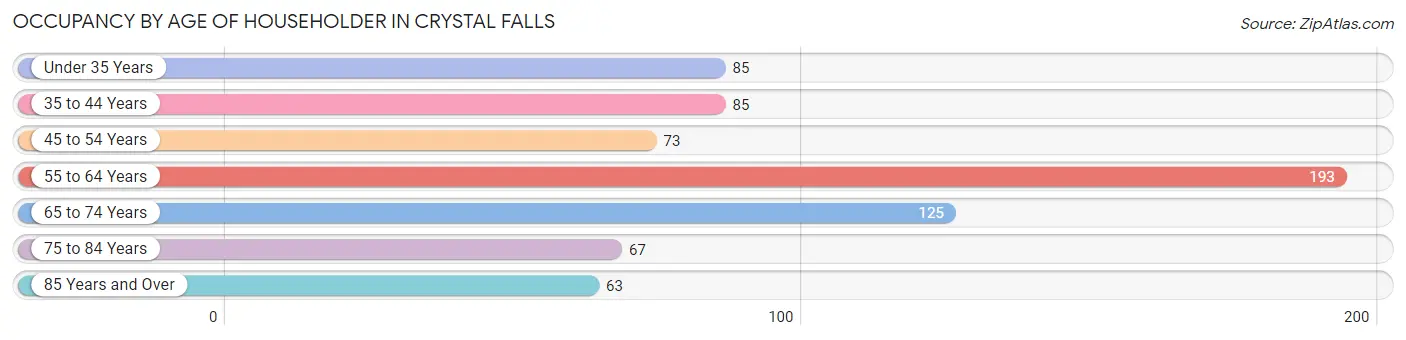
| Age Bracket | # Households | % Households |
| Under 35 Years | 85 | 12.3% |
| 35 to 44 Years | 85 | 12.3% |
| 45 to 54 Years | 73 | 10.6% |
| 55 to 64 Years | 193 | 27.9% |
| 65 to 74 Years | 125 | 18.1% |
| 75 to 84 Years | 67 | 9.7% |
| 85 Years and Over | 63 | 9.1% |
| Total | 691 | 100.0% |
Housing Finances in Crystal Falls
Median Income by Occupancy in Crystal Falls
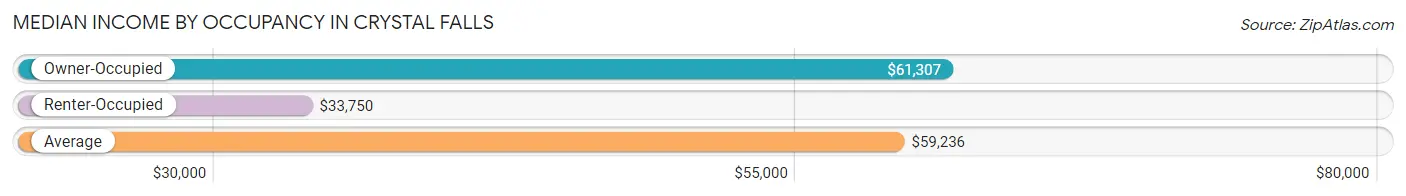
| Occupancy Type | # Households | Median Income |
| Owner-Occupied | 573 (82.9%) | $61,307 |
| Renter-Occupied | 118 (17.1%) | $33,750 |
| Average | 691 (100.0%) | $59,236 |
Occupancy by Householder Income Bracket in Crystal Falls
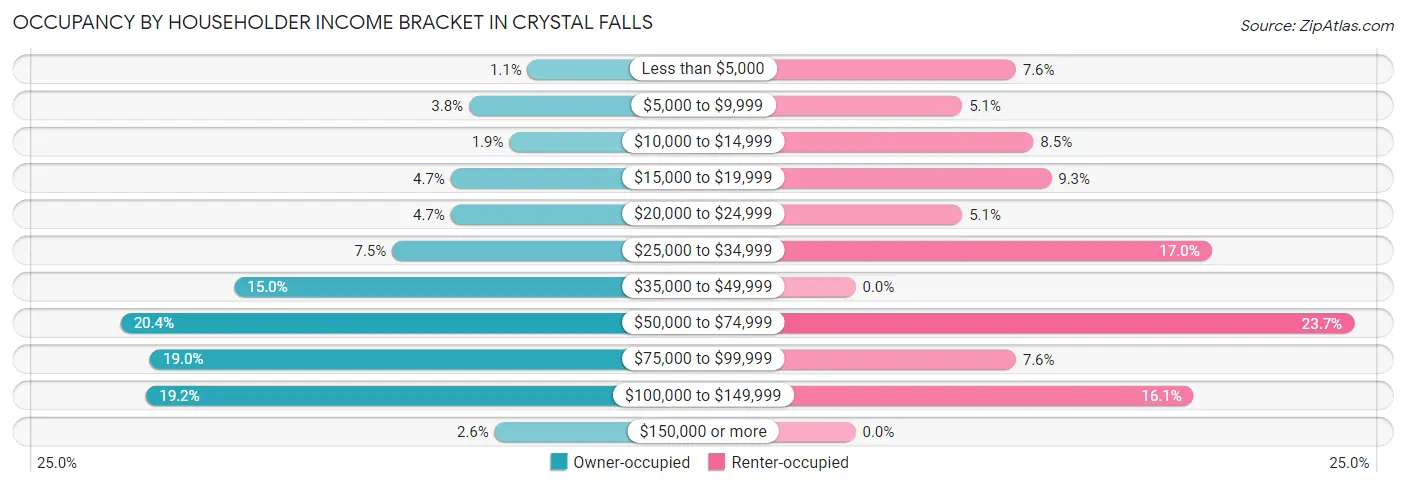
| Income Bracket | Owner-occupied | Renter-occupied |
| Less than $5,000 | 6 (1.1%) | 9 (7.6%) |
| $5,000 to $9,999 | 22 (3.8%) | 6 (5.1%) |
| $10,000 to $14,999 | 11 (1.9%) | 10 (8.5%) |
| $15,000 to $19,999 | 27 (4.7%) | 11 (9.3%) |
| $20,000 to $24,999 | 27 (4.7%) | 6 (5.1%) |
| $25,000 to $34,999 | 43 (7.5%) | 20 (17.0%) |
| $35,000 to $49,999 | 86 (15.0%) | 0 (0.0%) |
| $50,000 to $74,999 | 117 (20.4%) | 28 (23.7%) |
| $75,000 to $99,999 | 109 (19.0%) | 9 (7.6%) |
| $100,000 to $149,999 | 110 (19.2%) | 19 (16.1%) |
| $150,000 or more | 15 (2.6%) | 0 (0.0%) |
| Total | 573 (100.0%) | 118 (100.0%) |
Monthly Housing Cost Tiers in Crystal Falls
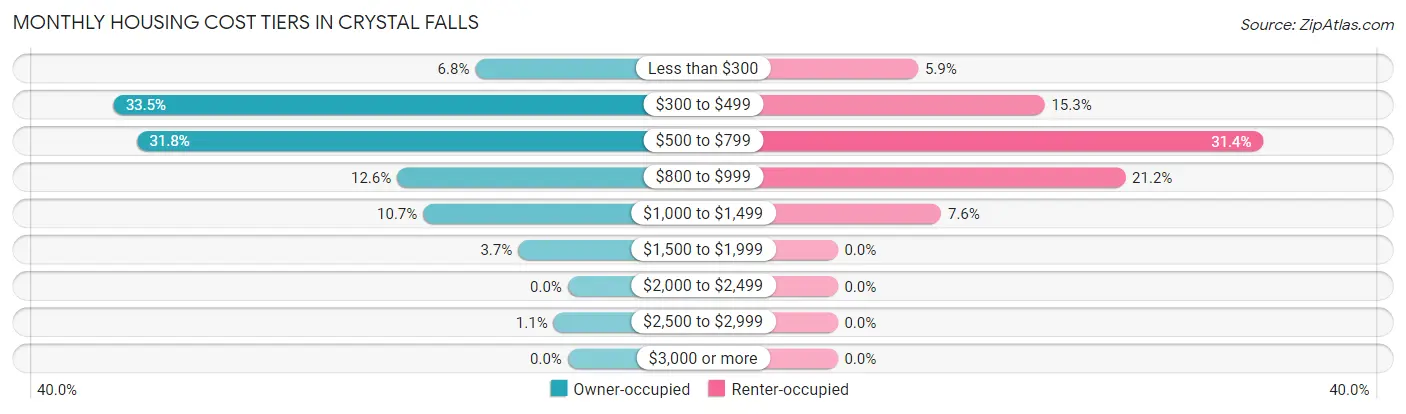
| Monthly Cost | Owner-occupied | Renter-occupied |
| Less than $300 | 39 (6.8%) | 7 (5.9%) |
| $300 to $499 | 192 (33.5%) | 18 (15.2%) |
| $500 to $799 | 182 (31.8%) | 37 (31.4%) |
| $800 to $999 | 72 (12.6%) | 25 (21.2%) |
| $1,000 to $1,499 | 61 (10.6%) | 9 (7.6%) |
| $1,500 to $1,999 | 21 (3.7%) | 0 (0.0%) |
| $2,000 to $2,499 | 0 (0.0%) | 0 (0.0%) |
| $2,500 to $2,999 | 6 (1.1%) | 0 (0.0%) |
| $3,000 or more | 0 (0.0%) | 0 (0.0%) |
| Total | 573 (100.0%) | 118 (100.0%) |
Physical Housing Characteristics in Crystal Falls
Housing Structures in Crystal Falls
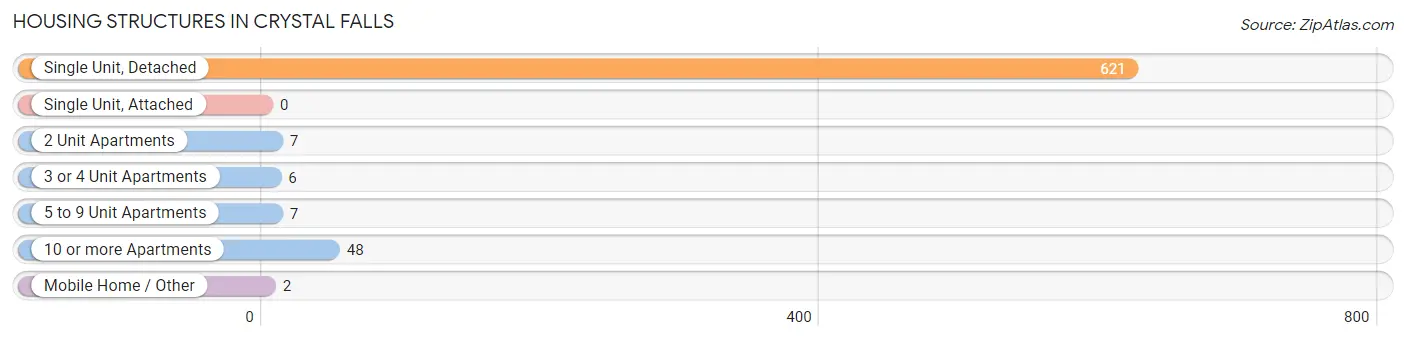
| Structure Type | # Housing Units | % Housing Units |
| Single Unit, Detached | 621 | 89.9% |
| Single Unit, Attached | 0 | 0.0% |
| 2 Unit Apartments | 7 | 1.0% |
| 3 or 4 Unit Apartments | 6 | 0.9% |
| 5 to 9 Unit Apartments | 7 | 1.0% |
| 10 or more Apartments | 48 | 7.0% |
| Mobile Home / Other | 2 | 0.3% |
| Total | 691 | 100.0% |
Housing Structures by Occupancy in Crystal Falls
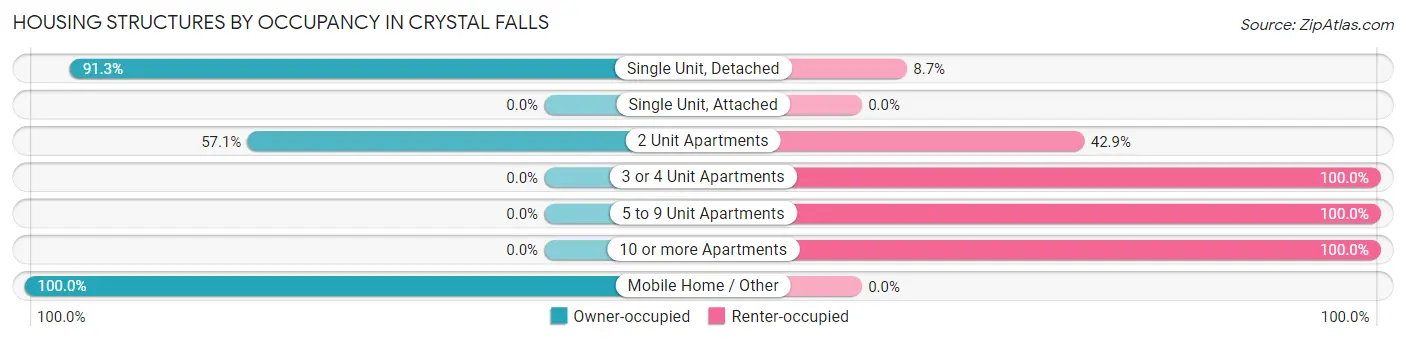
| Structure Type | Owner-occupied | Renter-occupied |
| Single Unit, Detached | 567 (91.3%) | 54 (8.7%) |
| Single Unit, Attached | 0 (0.0%) | 0 (0.0%) |
| 2 Unit Apartments | 4 (57.1%) | 3 (42.9%) |
| 3 or 4 Unit Apartments | 0 (0.0%) | 6 (100.0%) |
| 5 to 9 Unit Apartments | 0 (0.0%) | 7 (100.0%) |
| 10 or more Apartments | 0 (0.0%) | 48 (100.0%) |
| Mobile Home / Other | 2 (100.0%) | 0 (0.0%) |
| Total | 573 (82.9%) | 118 (17.1%) |
Housing Structures by Number of Rooms in Crystal Falls
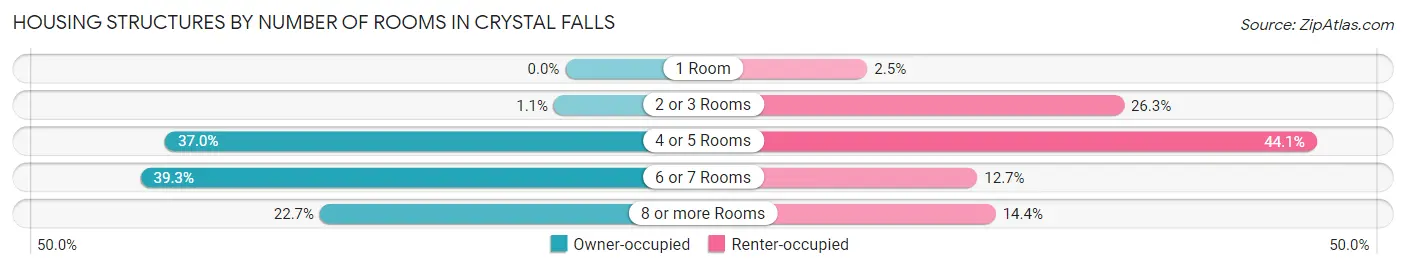
| Number of Rooms | Owner-occupied | Renter-occupied |
| 1 Room | 0 (0.0%) | 3 (2.5%) |
| 2 or 3 Rooms | 6 (1.1%) | 31 (26.3%) |
| 4 or 5 Rooms | 212 (37.0%) | 52 (44.1%) |
| 6 or 7 Rooms | 225 (39.3%) | 15 (12.7%) |
| 8 or more Rooms | 130 (22.7%) | 17 (14.4%) |
| Total | 573 (100.0%) | 118 (100.0%) |
Housing Structure by Heating Type in Crystal Falls
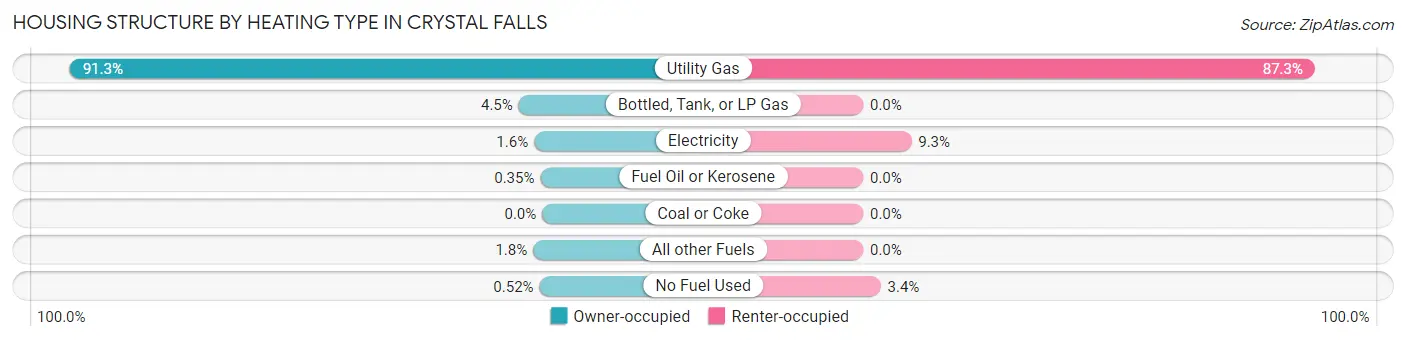
| Heating Type | Owner-occupied | Renter-occupied |
| Utility Gas | 523 (91.3%) | 103 (87.3%) |
| Bottled, Tank, or LP Gas | 26 (4.5%) | 0 (0.0%) |
| Electricity | 9 (1.6%) | 11 (9.3%) |
| Fuel Oil or Kerosene | 2 (0.4%) | 0 (0.0%) |
| Coal or Coke | 0 (0.0%) | 0 (0.0%) |
| All other Fuels | 10 (1.8%) | 0 (0.0%) |
| No Fuel Used | 3 (0.5%) | 4 (3.4%) |
| Total | 573 (100.0%) | 118 (100.0%) |
Household Vehicle Usage in Crystal Falls
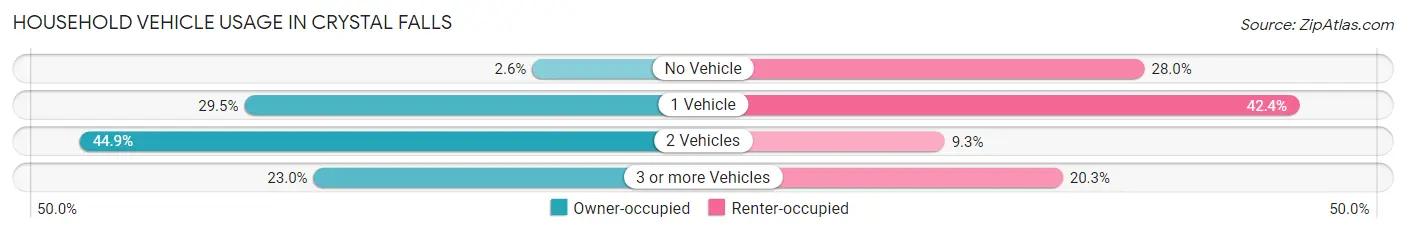
| Vehicles per Household | Owner-occupied | Renter-occupied |
| No Vehicle | 15 (2.6%) | 33 (28.0%) |
| 1 Vehicle | 169 (29.5%) | 50 (42.4%) |
| 2 Vehicles | 257 (44.9%) | 11 (9.3%) |
| 3 or more Vehicles | 132 (23.0%) | 24 (20.3%) |
| Total | 573 (100.0%) | 118 (100.0%) |
Real Estate & Mortgages in Crystal Falls
Real Estate and Mortgage Overview in Crystal Falls
| Characteristic | Without Mortgage | With Mortgage |
| Housing Units | 329 | 244 |
| Median Property Value | $71,100 | $80,600 |
| Median Household Income | $68,015 | $11 |
| Monthly Housing Costs | $464 | $0 |
| Real Estate Taxes | $1,440 | $3 |
Property Value by Mortgage Status in Crystal Falls
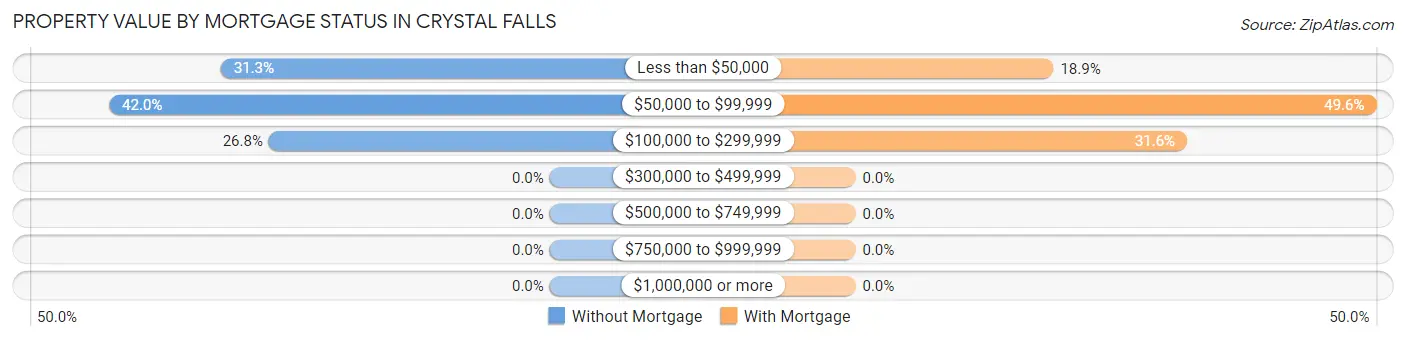
| Property Value | Without Mortgage | With Mortgage |
| Less than $50,000 | 103 (31.3%) | 46 (18.9%) |
| $50,000 to $99,999 | 138 (41.9%) | 121 (49.6%) |
| $100,000 to $299,999 | 88 (26.8%) | 77 (31.6%) |
| $300,000 to $499,999 | 0 (0.0%) | 0 (0.0%) |
| $500,000 to $749,999 | 0 (0.0%) | 0 (0.0%) |
| $750,000 to $999,999 | 0 (0.0%) | 0 (0.0%) |
| $1,000,000 or more | 0 (0.0%) | 0 (0.0%) |
| Total | 329 (100.0%) | 244 (100.0%) |
Household Income by Mortgage Status in Crystal Falls
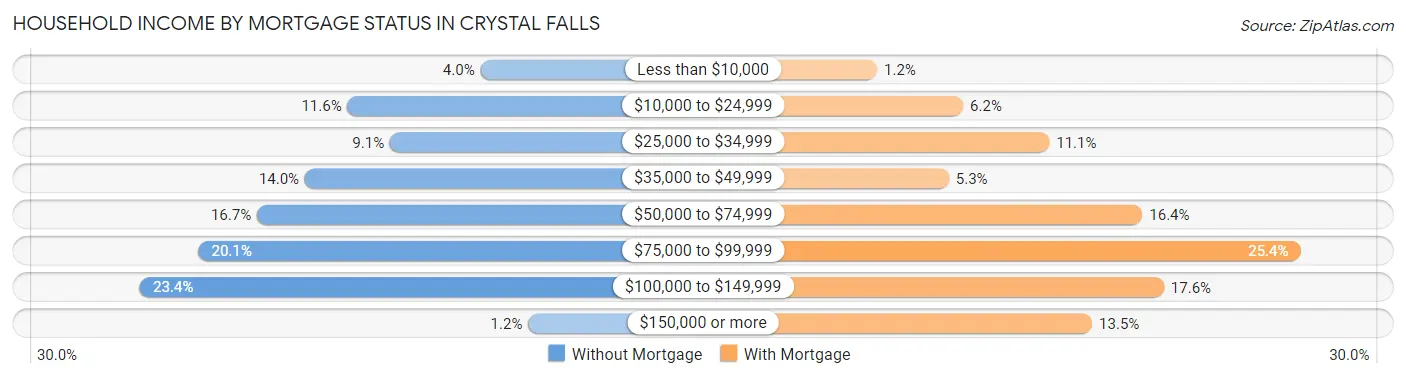
| Household Income | Without Mortgage | With Mortgage |
| Less than $10,000 | 13 (4.0%) | 3 (1.2%) |
| $10,000 to $24,999 | 38 (11.6%) | 15 (6.1%) |
| $25,000 to $34,999 | 30 (9.1%) | 27 (11.1%) |
| $35,000 to $49,999 | 46 (14.0%) | 13 (5.3%) |
| $50,000 to $74,999 | 55 (16.7%) | 40 (16.4%) |
| $75,000 to $99,999 | 66 (20.1%) | 62 (25.4%) |
| $100,000 to $149,999 | 77 (23.4%) | 43 (17.6%) |
| $150,000 or more | 4 (1.2%) | 33 (13.5%) |
| Total | 329 (100.0%) | 244 (100.0%) |
Property Value to Household Income Ratio in Crystal Falls
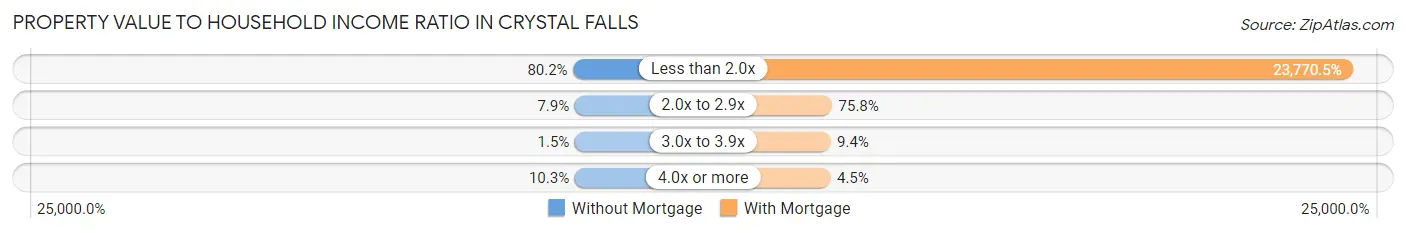
| Value-to-Income Ratio | Without Mortgage | With Mortgage |
| Less than 2.0x | 264 (80.2%) | 58,000 (23,770.5%) |
| 2.0x to 2.9x | 26 (7.9%) | 185 (75.8%) |
| 3.0x to 3.9x | 5 (1.5%) | 23 (9.4%) |
| 4.0x or more | 34 (10.3%) | 11 (4.5%) |
| Total | 329 (100.0%) | 244 (100.0%) |
Real Estate Taxes by Mortgage Status in Crystal Falls
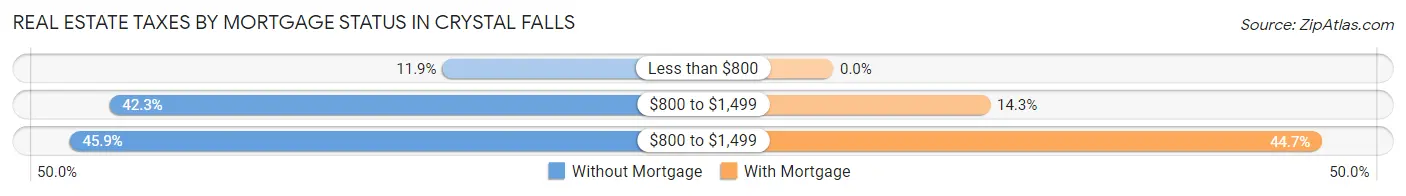
| Property Taxes | Without Mortgage | With Mortgage |
| Less than $800 | 39 (11.8%) | 0 (0.0%) |
| $800 to $1,499 | 139 (42.2%) | 35 (14.3%) |
| $800 to $1,499 | 151 (45.9%) | 109 (44.7%) |
| Total | 329 (100.0%) | 244 (100.0%) |
Health & Disability in Crystal Falls
Health Insurance Coverage by Age in Crystal Falls
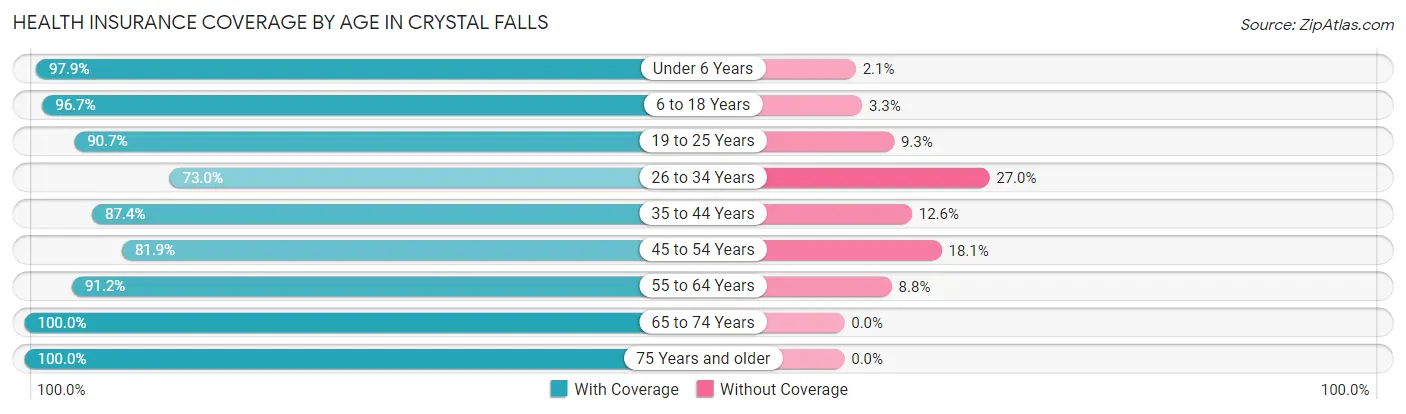
| Age Bracket | With Coverage | Without Coverage |
| Under 6 Years | 92 (97.9%) | 2 (2.1%) |
| 6 to 18 Years | 381 (96.7%) | 13 (3.3%) |
| 19 to 25 Years | 49 (90.7%) | 5 (9.3%) |
| 26 to 34 Years | 143 (73.0%) | 53 (27.0%) |
| 35 to 44 Years | 125 (87.4%) | 18 (12.6%) |
| 45 to 54 Years | 167 (81.9%) | 37 (18.1%) |
| 55 to 64 Years | 258 (91.2%) | 25 (8.8%) |
| 65 to 74 Years | 179 (100.0%) | 0 (0.0%) |
| 75 Years and older | 182 (100.0%) | 0 (0.0%) |
| Total | 1,576 (91.1%) | 153 (8.8%) |
Health Insurance Coverage by Citizenship Status in Crystal Falls
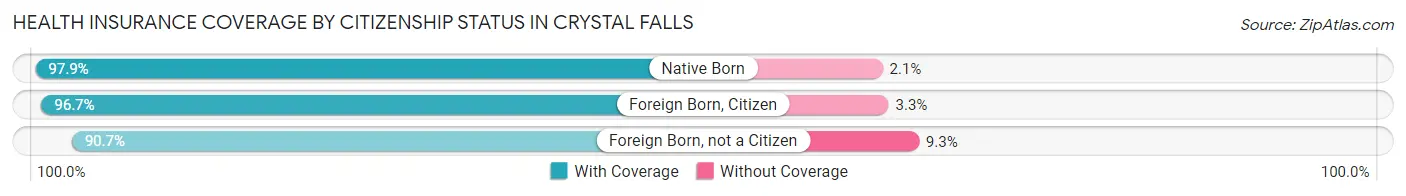
| Citizenship Status | With Coverage | Without Coverage |
| Native Born | 92 (97.9%) | 2 (2.1%) |
| Foreign Born, Citizen | 381 (96.7%) | 13 (3.3%) |
| Foreign Born, not a Citizen | 49 (90.7%) | 5 (9.3%) |
Health Insurance Coverage by Household Income in Crystal Falls
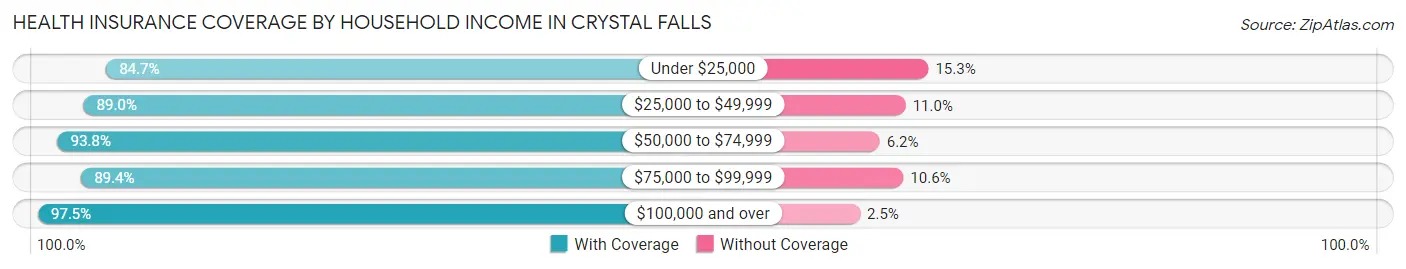
| Household Income | With Coverage | Without Coverage |
| Under $25,000 | 227 (84.7%) | 41 (15.3%) |
| $25,000 to $49,999 | 298 (89.0%) | 37 (11.0%) |
| $50,000 to $74,999 | 319 (93.8%) | 21 (6.2%) |
| $75,000 to $99,999 | 379 (89.4%) | 45 (10.6%) |
| $100,000 and over | 353 (97.5%) | 9 (2.5%) |
Public vs Private Health Insurance Coverage by Age in Crystal Falls
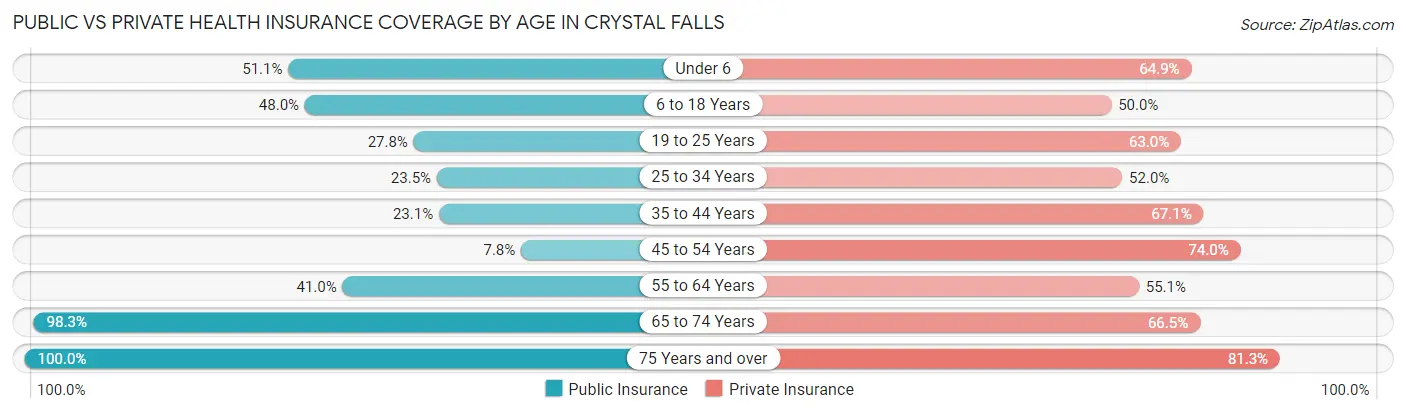
| Age Bracket | Public Insurance | Private Insurance |
| Under 6 | 48 (51.1%) | 61 (64.9%) |
| 6 to 18 Years | 189 (48.0%) | 197 (50.0%) |
| 19 to 25 Years | 15 (27.8%) | 34 (63.0%) |
| 25 to 34 Years | 46 (23.5%) | 102 (52.0%) |
| 35 to 44 Years | 33 (23.1%) | 96 (67.1%) |
| 45 to 54 Years | 16 (7.8%) | 151 (74.0%) |
| 55 to 64 Years | 116 (41.0%) | 156 (55.1%) |
| 65 to 74 Years | 176 (98.3%) | 119 (66.5%) |
| 75 Years and over | 182 (100.0%) | 148 (81.3%) |
| Total | 821 (47.5%) | 1,064 (61.5%) |
Disability Status by Sex by Age in Crystal Falls
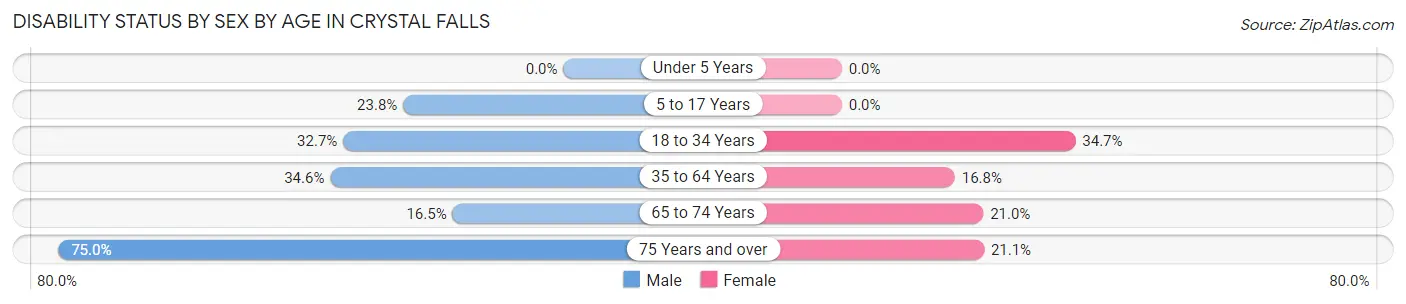
| Age Bracket | Male | Female |
| Under 5 Years | 0 (0.0%) | 0 (0.0%) |
| 5 to 17 Years | 54 (23.8%) | 0 (0.0%) |
| 18 to 34 Years | 52 (32.7%) | 43 (34.7%) |
| 35 to 64 Years | 117 (34.6%) | 49 (16.8%) |
| 65 to 74 Years | 13 (16.5%) | 21 (21.0%) |
| 75 Years and over | 69 (75.0%) | 19 (21.1%) |
Disability Class by Sex by Age in Crystal Falls
Disability Class: Hearing Difficulty
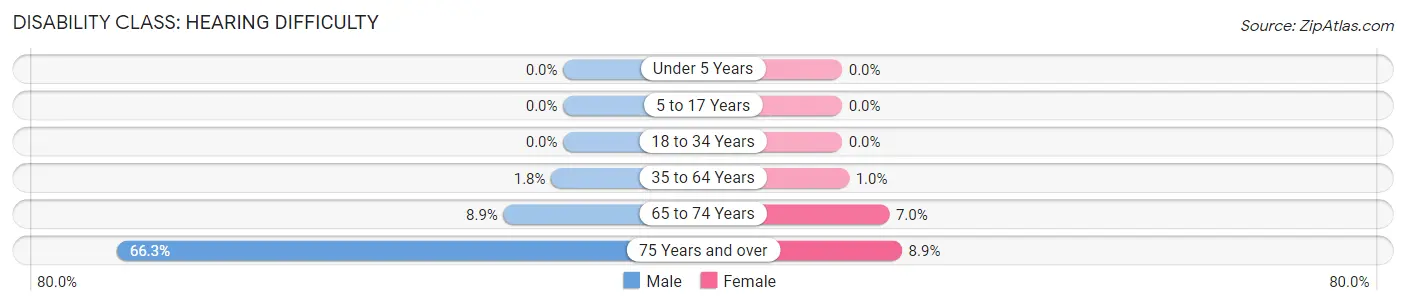
| Age Bracket | Male | Female |
| Under 5 Years | 0 (0.0%) | 0 (0.0%) |
| 5 to 17 Years | 0 (0.0%) | 0 (0.0%) |
| 18 to 34 Years | 0 (0.0%) | 0 (0.0%) |
| 35 to 64 Years | 6 (1.8%) | 3 (1.0%) |
| 65 to 74 Years | 7 (8.9%) | 7 (7.0%) |
| 75 Years and over | 61 (66.3%) | 8 (8.9%) |
Disability Class: Vision Difficulty
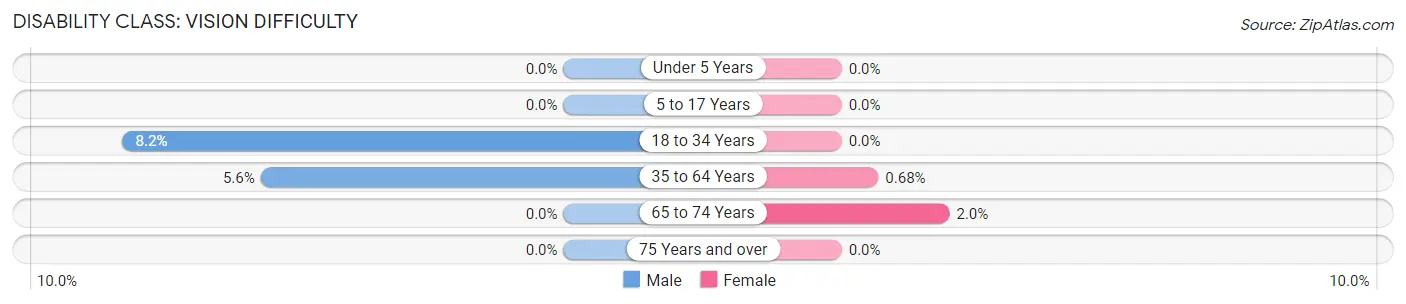
| Age Bracket | Male | Female |
| Under 5 Years | 0 (0.0%) | 0 (0.0%) |
| 5 to 17 Years | 0 (0.0%) | 0 (0.0%) |
| 18 to 34 Years | 13 (8.2%) | 0 (0.0%) |
| 35 to 64 Years | 19 (5.6%) | 2 (0.7%) |
| 65 to 74 Years | 0 (0.0%) | 2 (2.0%) |
| 75 Years and over | 0 (0.0%) | 0 (0.0%) |
Disability Class: Cognitive Difficulty
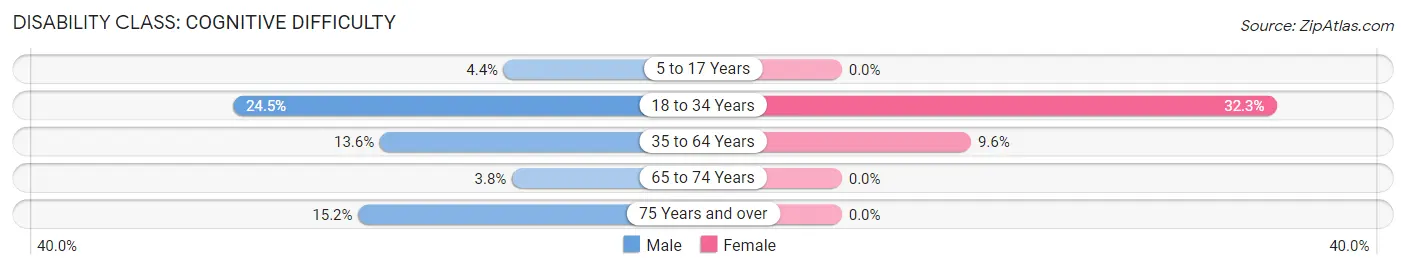
| Age Bracket | Male | Female |
| 5 to 17 Years | 10 (4.4%) | 0 (0.0%) |
| 18 to 34 Years | 39 (24.5%) | 40 (32.3%) |
| 35 to 64 Years | 46 (13.6%) | 28 (9.6%) |
| 65 to 74 Years | 3 (3.8%) | 0 (0.0%) |
| 75 Years and over | 14 (15.2%) | 0 (0.0%) |
Disability Class: Ambulatory Difficulty
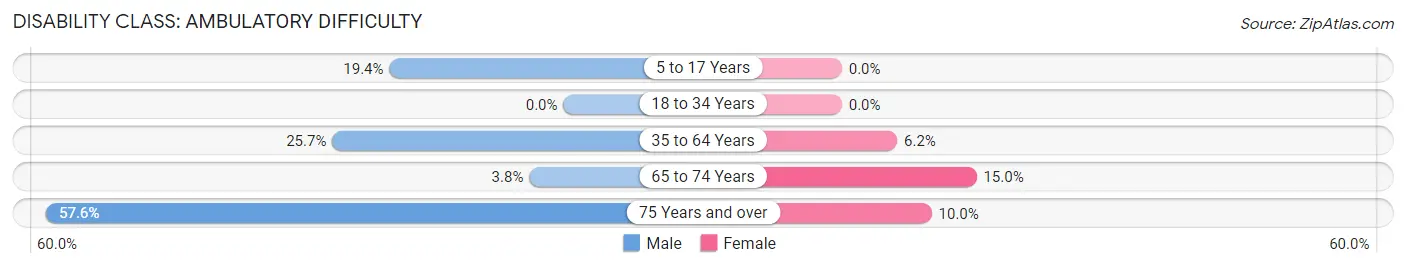
| Age Bracket | Male | Female |
| 5 to 17 Years | 44 (19.4%) | 0 (0.0%) |
| 18 to 34 Years | 0 (0.0%) | 0 (0.0%) |
| 35 to 64 Years | 87 (25.7%) | 18 (6.2%) |
| 65 to 74 Years | 3 (3.8%) | 15 (15.0%) |
| 75 Years and over | 53 (57.6%) | 9 (10.0%) |
Disability Class: Self-Care Difficulty
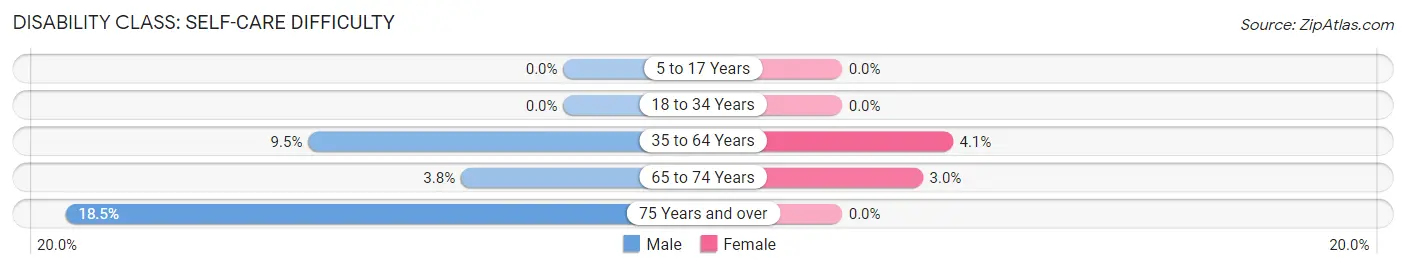
| Age Bracket | Male | Female |
| 5 to 17 Years | 0 (0.0%) | 0 (0.0%) |
| 18 to 34 Years | 0 (0.0%) | 0 (0.0%) |
| 35 to 64 Years | 32 (9.5%) | 12 (4.1%) |
| 65 to 74 Years | 3 (3.8%) | 3 (3.0%) |
| 75 Years and over | 17 (18.5%) | 0 (0.0%) |
Technology Access in Crystal Falls
Computing Device Access in Crystal Falls
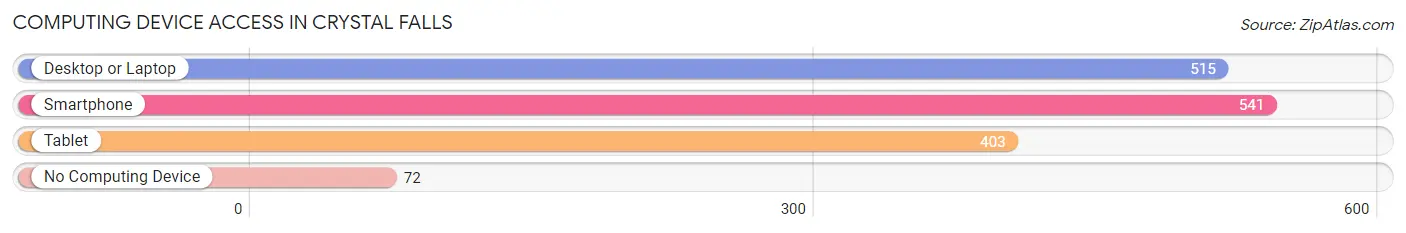
| Device Type | # Households | % Households |
| Desktop or Laptop | 515 | 74.5% |
| Smartphone | 541 | 78.3% |
| Tablet | 403 | 58.3% |
| No Computing Device | 72 | 10.4% |
| Total | 691 | 100.0% |
Internet Access in Crystal Falls
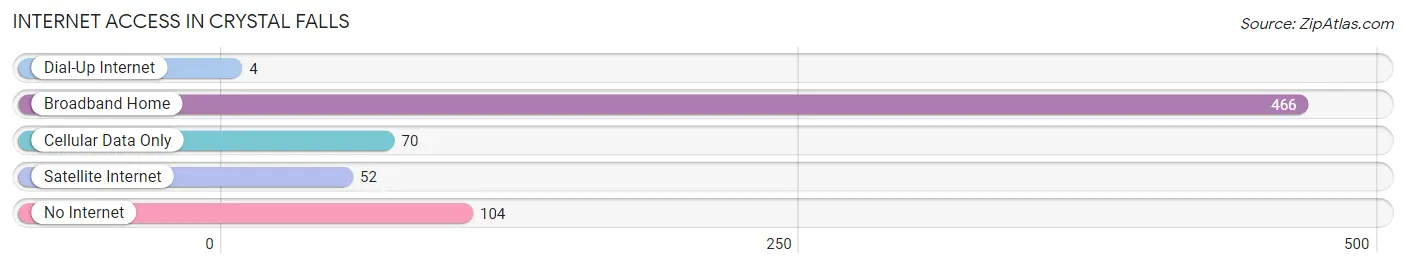
| Internet Type | # Households | % Households |
| Dial-Up Internet | 4 | 0.6% |
| Broadband Home | 466 | 67.4% |
| Cellular Data Only | 70 | 10.1% |
| Satellite Internet | 52 | 7.5% |
| No Internet | 104 | 15.0% |
| Total | 691 | 100.0% |
Crystal Falls Summary
History
The area now known as Crystal Falls, Michigan was first inhabited by the Ojibwe people, who were part of the Algonquin nation. The Ojibwe were a nomadic people who moved around the area, hunting and fishing. They were known for their skill in making birch bark canoes, which they used to travel the rivers and lakes of the area.
The first European settlers arrived in the area in the late 1800s. The area was first known as "Crystal Falls Township" and was officially incorporated in 1887. The town was named after the nearby Crystal Falls, which is a waterfall on the Paint River.
The town quickly grew and became a center for logging and mining. The area was home to several sawmills, a paper mill, and a number of mines. The mines produced copper, iron, and other minerals. The town also had a number of stores, hotels, and other businesses.
In the early 1900s, the town was connected to the rest of the state by the Chicago and North Western Railway. This allowed for the transportation of goods and people to and from the town.
The town continued to grow and prosper until the Great Depression. During this time, many of the businesses in the town closed and the population declined. After World War II, the town began to recover and the population began to grow again.
Geography
Crystal Falls is located in Iron County, Michigan. It is situated on the Paint River, which is a tributary of the Menominee River. The town is surrounded by forests and lakes, and is known for its scenic beauty.
The town is located in the Upper Peninsula of Michigan, and is about 30 miles from the Wisconsin border. The nearest major city is Green Bay, Wisconsin, which is about 90 miles away.
The town has a total area of 4.2 square miles, all of which is land. The elevation of the town is 1,072 feet above sea level.
Economy
The economy of Crystal Falls is largely based on tourism and outdoor recreation. The town is home to several resorts and campgrounds, as well as a number of outdoor activities such as fishing, hunting, and hiking.
The town is also home to a number of small businesses, including restaurants, stores, and other services. The town is also home to a number of manufacturing companies, which produce a variety of products such as paper, furniture, and metal products.
Demographics
As of the 2010 census, the population of Crystal Falls was 1,845. The racial makeup of the town was 97.2% White, 0.3% African American, 0.2% Native American, 0.2% Asian, 0.1% Pacific Islander, 0.7% from other races, and 1.3% from two or more races. Hispanic or Latino of any race were 1.7% of the population.
The median household income in the town was $37,917, and the median family income was $45,000. The per capita income for the town was $19,945. About 11.2% of families and 14.2% of the population were below the poverty line, including 18.2% of those under age 18 and 8.3% of those age 65 or over.
Common Questions
What is Per Capita Income in Crystal Falls?
Per Capita income in Crystal Falls is $25,449.
What is the Median Family Income in Crystal Falls?
Median Family Income in Crystal Falls is $65,833.
What is the Median Household income in Crystal Falls?
Median Household Income in Crystal Falls is $59,236.
What is Income or Wage Gap in Crystal Falls?
Income or Wage Gap in Crystal Falls is 9.1%.
Women in Crystal Falls earn 90.9 cents for every dollar earned by a man.
What is Inequality or Gini Index in Crystal Falls?
Inequality or Gini Index in Crystal Falls is 0.36.
What is the Total Population of Crystal Falls?
Total Population of Crystal Falls is 1,773.
What is the Total Male Population of Crystal Falls?
Total Male Population of Crystal Falls is 983.
What is the Total Female Population of Crystal Falls?
Total Female Population of Crystal Falls is 790.
What is the Ratio of Males per 100 Females in Crystal Falls?
There are 124.43 Males per 100 Females in Crystal Falls.
What is the Ratio of Females per 100 Males in Crystal Falls?
There are 80.37 Females per 100 Males in Crystal Falls.
What is the Median Population Age in Crystal Falls?
Median Population Age in Crystal Falls is 44.2 Years.
What is the Average Family Size in Crystal Falls
Average Family Size in Crystal Falls is 3.0 People.
What is the Average Household Size in Crystal Falls
Average Household Size in Crystal Falls is 2.5 People.
How Large is the Labor Force in Crystal Falls?
There are 655 People in the Labor Forcein in Crystal Falls.
What is the Percentage of People in the Labor Force in Crystal Falls?
47.9% of People are in the Labor Force in Crystal Falls.
What is the Unemployment Rate in Crystal Falls?
Unemployment Rate in Crystal Falls is 2.9%.