Corunna, MI Map & Demographics
Corunna Map
Corunna Overview
$26,543
PER CAPITA INCOME
$64,286
AVG FAMILY INCOME
$43,911
AVG HOUSEHOLD INCOME
26.5%
WAGE / INCOME GAP [ % ]
73.5¢/ $1
WAGE / INCOME GAP [ $ ]
0.42
INEQUALITY / GINI INDEX
3,057
TOTAL POPULATION
1,603
MALE POPULATION
1,454
FEMALE POPULATION
110.25
MALES / 100 FEMALES
90.70
FEMALES / 100 MALES
37.4
MEDIAN AGE
3.0
AVG FAMILY SIZE
2.0
AVG HOUSEHOLD SIZE
1,246
LABOR FORCE [ PEOPLE ]
51.1%
PERCENT IN LABOR FORCE
4.7%
UNEMPLOYMENT RATE
Corunna Zip Codes
Income in Corunna
Income Overview in Corunna
Per Capita Income in Corunna is $26,543, while median incomes of families and households are $64,286 and $43,911 respectively.
| Characteristic | Number | Measure |
| Per Capita Income | 3,057 | $26,543 |
| Median Family Income | 666 | $64,286 |
| Mean Family Income | 666 | $74,277 |
| Median Household Income | 1,403 | $43,911 |
| Mean Household Income | 1,403 | $53,422 |
| Income Deficit | 666 | $0 |
| Wage / Income Gap (%) | 3,057 | 26.54% |
| Wage / Income Gap ($) | 3,057 | 73.46¢ per $1 |
| Gini / Inequality Index | 3,057 | 0.42 |
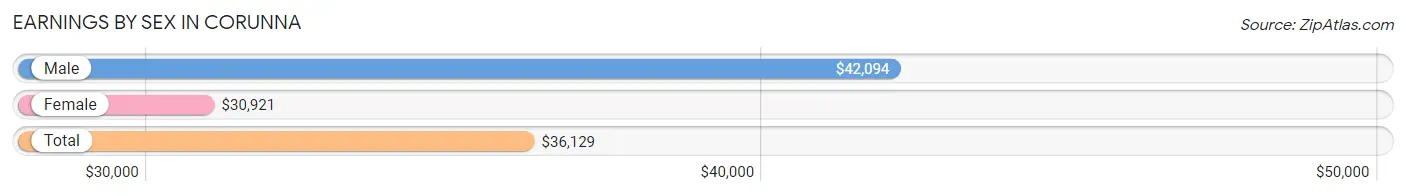
Earnings by Sex in Corunna
Average Earnings in Corunna are $36,129, $42,094 for men and $30,921 for women, a difference of 26.5%.
| Sex | Number | Average Earnings |
| Male | 653 (47.1%) | $42,094 |
| Female | 734 (52.9%) | $30,921 |
| Total | 1,387 (100.0%) | $36,129 |
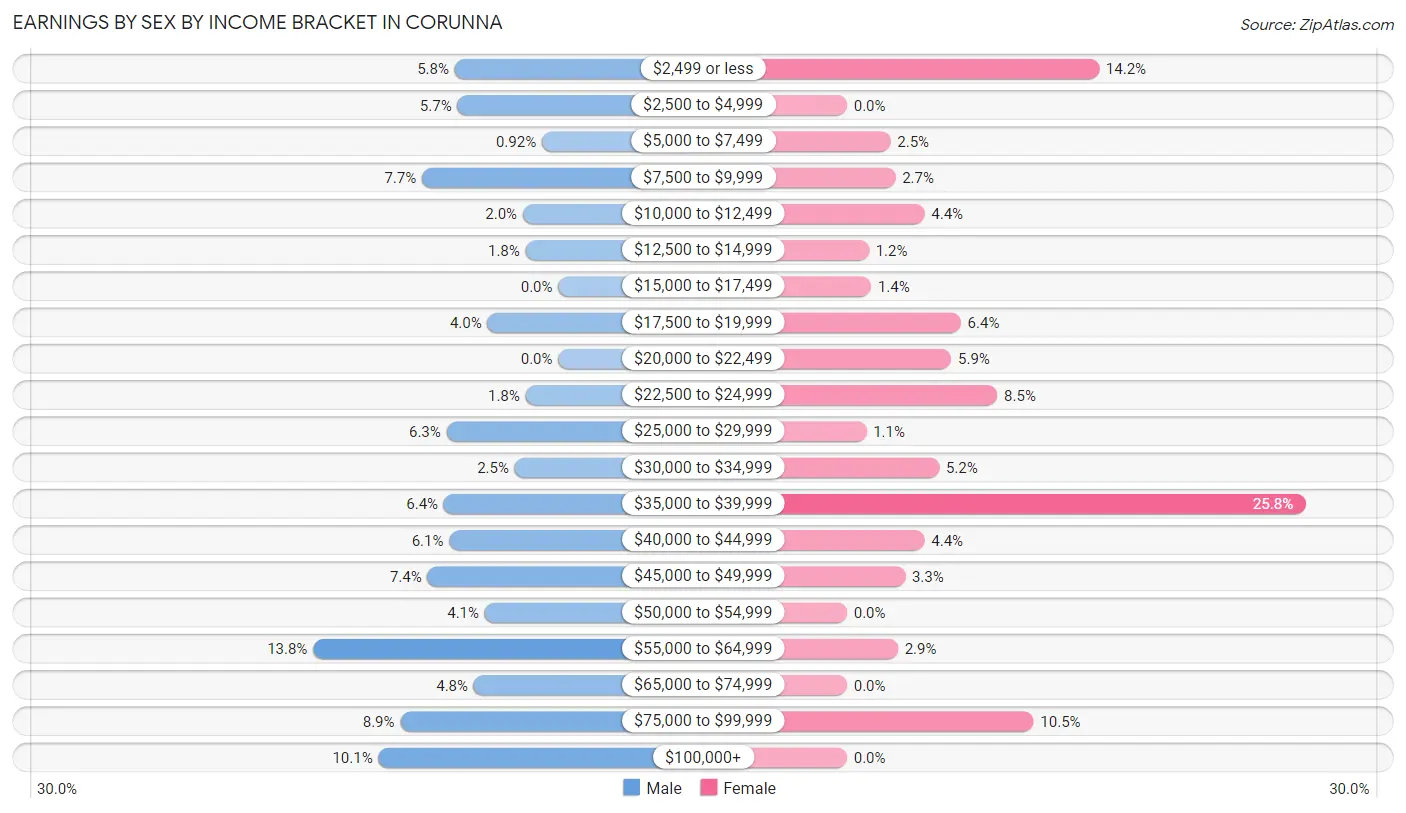
Earnings by Sex by Income Bracket in Corunna
The most common earnings brackets in Corunna are $55,000 to $64,999 for men (90 | 13.8%) and $35,000 to $39,999 for women (189 | 25.8%).
| Income | Male | Female |
| $2,499 or less | 38 (5.8%) | 104 (14.2%) |
| $2,500 to $4,999 | 37 (5.7%) | 0 (0.0%) |
| $5,000 to $7,499 | 6 (0.9%) | 18 (2.5%) |
| $7,500 to $9,999 | 50 (7.7%) | 20 (2.7%) |
| $10,000 to $12,499 | 13 (2.0%) | 32 (4.4%) |
| $12,500 to $14,999 | 12 (1.8%) | 9 (1.2%) |
| $15,000 to $17,499 | 0 (0.0%) | 10 (1.4%) |
| $17,500 to $19,999 | 26 (4.0%) | 47 (6.4%) |
| $20,000 to $22,499 | 0 (0.0%) | 43 (5.9%) |
| $22,500 to $24,999 | 12 (1.8%) | 62 (8.5%) |
| $25,000 to $29,999 | 41 (6.3%) | 8 (1.1%) |
| $30,000 to $34,999 | 16 (2.5%) | 38 (5.2%) |
| $35,000 to $39,999 | 42 (6.4%) | 189 (25.8%) |
| $40,000 to $44,999 | 40 (6.1%) | 32 (4.4%) |
| $45,000 to $49,999 | 48 (7.3%) | 24 (3.3%) |
| $50,000 to $54,999 | 27 (4.1%) | 0 (0.0%) |
| $55,000 to $64,999 | 90 (13.8%) | 21 (2.9%) |
| $65,000 to $74,999 | 31 (4.8%) | 0 (0.0%) |
| $75,000 to $99,999 | 58 (8.9%) | 77 (10.5%) |
| $100,000+ | 66 (10.1%) | 0 (0.0%) |
| Total | 653 (100.0%) | 734 (100.0%) |
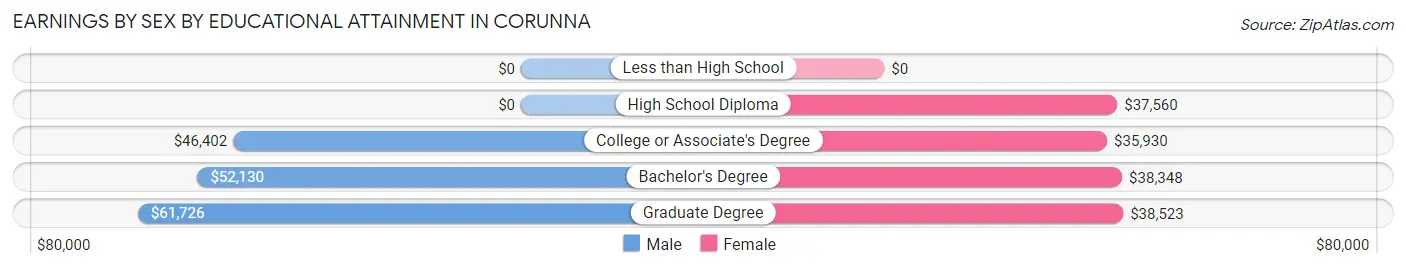
Earnings by Sex by Educational Attainment in Corunna
Average earnings in Corunna are $46,190 for men and $36,448 for women, a difference of 21.1%. Men with an educational attainment of graduate degree enjoy the highest average annual earnings of $61,726, while those with college or associate's degree education earn the least with $46,402. Women with an educational attainment of graduate degree earn the most with the average annual earnings of $38,523, while those with college or associate's degree education have the smallest earnings of $35,930.
| Educational Attainment | Male Income | Female Income |
| Less than High School | - | - |
| High School Diploma | - | - |
| College or Associate's Degree | $46,402 | $35,930 |
| Bachelor's Degree | $52,130 | $38,348 |
| Graduate Degree | $61,726 | $38,523 |
| Total | $46,190 | $36,448 |
Family Income in Corunna
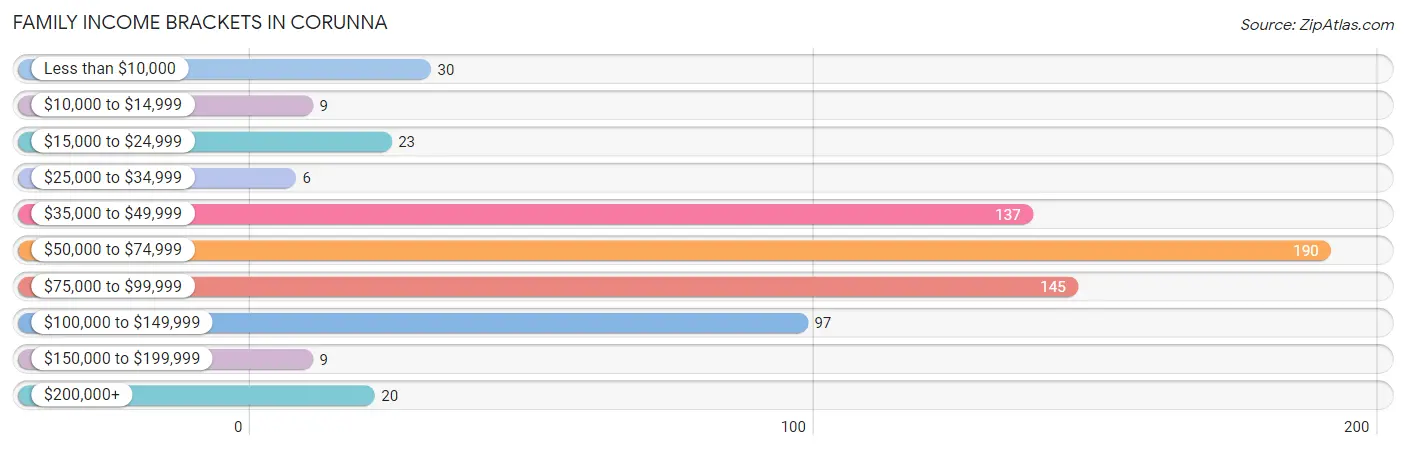
Family Income Brackets in Corunna
According to the Corunna family income data, there are 190 families falling into the $50,000 to $74,999 income range, which is the most common income bracket and makes up 28.5% of all families. Conversely, the $25,000 to $34,999 income bracket is the least frequent group with only 6 families (0.9%) belonging to this category.
| Income Bracket | # Families | % Families |
| Less than $10,000 | 30 | 4.5% |
| $10,000 to $14,999 | 9 | 1.4% |
| $15,000 to $24,999 | 23 | 3.5% |
| $25,000 to $34,999 | 6 | 0.9% |
| $35,000 to $49,999 | 137 | 20.6% |
| $50,000 to $74,999 | 190 | 28.5% |
| $75,000 to $99,999 | 145 | 21.8% |
| $100,000 to $149,999 | 97 | 14.6% |
| $150,000 to $199,999 | 9 | 1.4% |
| $200,000+ | 20 | 3.0% |
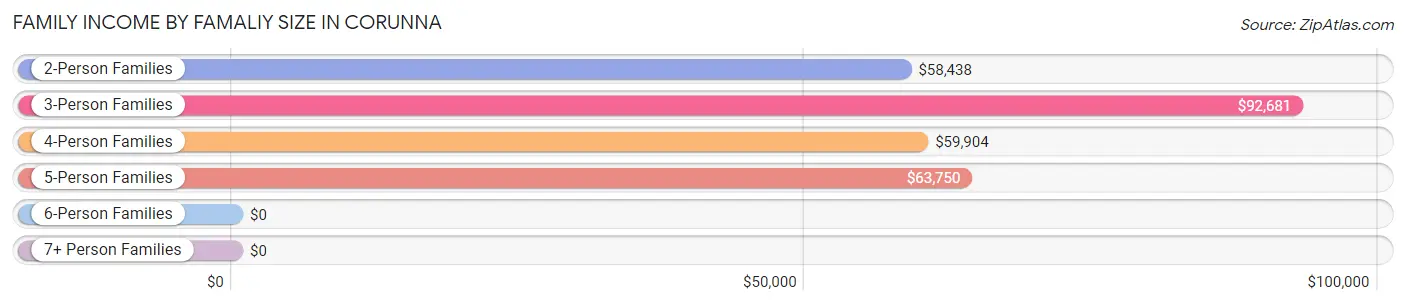
Family Income by Famaliy Size in Corunna
3-person families (154 | 23.1%) account for the highest median family income in Corunna with $92,681 per family, while 3-person families (154 | 23.1%) have the highest median income of $30,894 per family member.
| Income Bracket | # Families | Median Income |
| 2-Person Families | 309 (46.4%) | $58,438 |
| 3-Person Families | 154 (23.1%) | $92,681 |
| 4-Person Families | 156 (23.4%) | $59,904 |
| 5-Person Families | 47 (7.1%) | $63,750 |
| 6-Person Families | 0 (0.0%) | $0 |
| 7+ Person Families | 0 (0.0%) | $0 |
| Total | 666 (100.0%) | $64,286 |
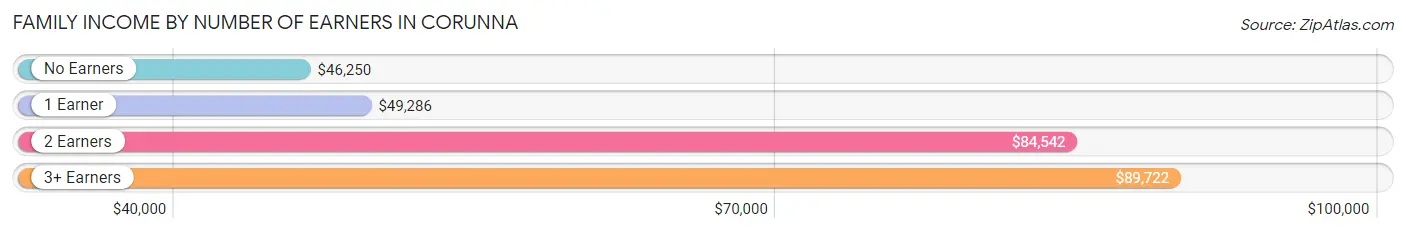
Family Income by Number of Earners in Corunna
The median family income in Corunna is $64,286, with families comprising 3+ earners (16) having the highest median family income of $89,722, while families with no earners (97) have the lowest median family income of $46,250, accounting for 2.4% and 14.6% of families, respectively.
| Number of Earners | # Families | Median Income |
| No Earners | 97 (14.6%) | $46,250 |
| 1 Earner | 192 (28.8%) | $49,286 |
| 2 Earners | 361 (54.2%) | $84,542 |
| 3+ Earners | 16 (2.4%) | $89,722 |
| Total | 666 (100.0%) | $64,286 |
Household Income in Corunna
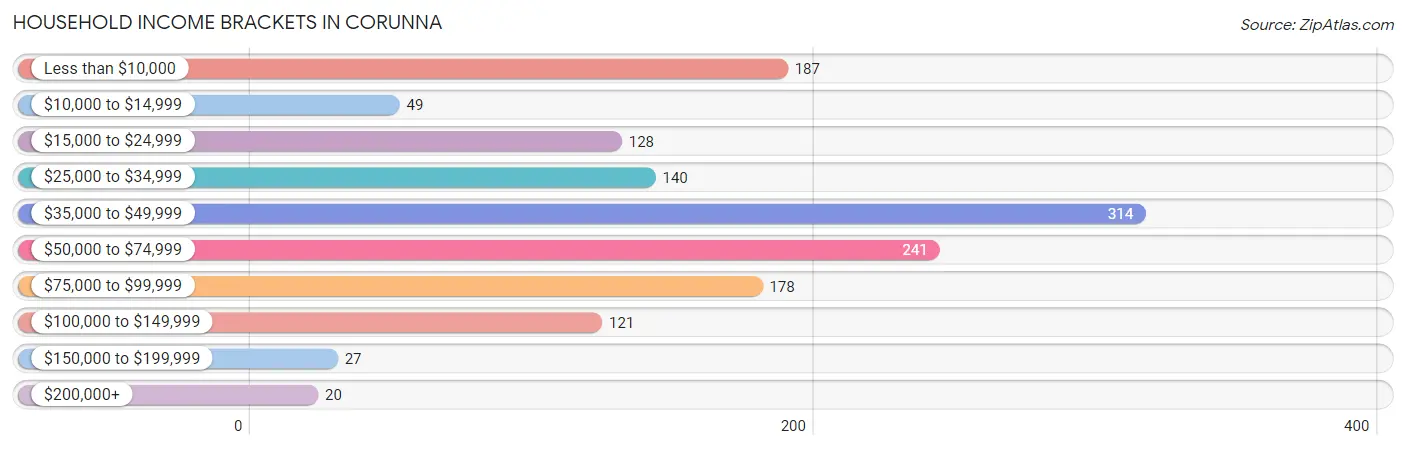
Household Income Brackets in Corunna
With 314 households falling in the category, the $35,000 to $49,999 income range is the most frequent in Corunna, accounting for 22.4% of all households. In contrast, only 20 households (1.4%) fall into the $200,000+ income bracket, making it the least populous group.
| Income Bracket | # Households | % Households |
| Less than $10,000 | 187 | 13.3% |
| $10,000 to $14,999 | 49 | 3.5% |
| $15,000 to $24,999 | 128 | 9.1% |
| $25,000 to $34,999 | 140 | 10.0% |
| $35,000 to $49,999 | 314 | 22.4% |
| $50,000 to $74,999 | 241 | 17.2% |
| $75,000 to $99,999 | 178 | 12.7% |
| $100,000 to $149,999 | 121 | 8.6% |
| $150,000 to $199,999 | 27 | 1.9% |
| $200,000+ | 20 | 1.4% |
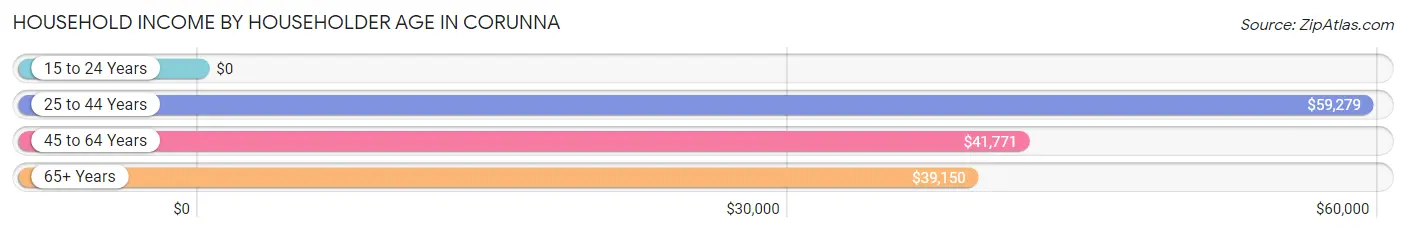
Household Income by Householder Age in Corunna
The median household income in Corunna is $43,911, with the highest median household income of $59,279 found in the 25 to 44 years age bracket for the primary householder. A total of 484 households (34.5%) fall into this category. Meanwhile, the 15 to 24 years age bracket for the primary householder has the lowest median household income of $0, with 53 households (3.8%) in this group.
| Income Bracket | # Households | Median Income |
| 15 to 24 Years | 53 (3.8%) | $0 |
| 25 to 44 Years | 484 (34.5%) | $59,279 |
| 45 to 64 Years | 469 (33.4%) | $41,771 |
| 65+ Years | 397 (28.3%) | $39,150 |
| Total | 1,403 (100.0%) | $43,911 |
Poverty in Corunna
Income Below Poverty by Sex and Age in Corunna
With 15.8% poverty level for males and 10.8% for females among the residents of Corunna, 25 to 34 year old males and 6 to 11 year old females are the most vulnerable to poverty, with 104 males (43.3%) and 22 females (62.9%) in their respective age groups living below the poverty level.
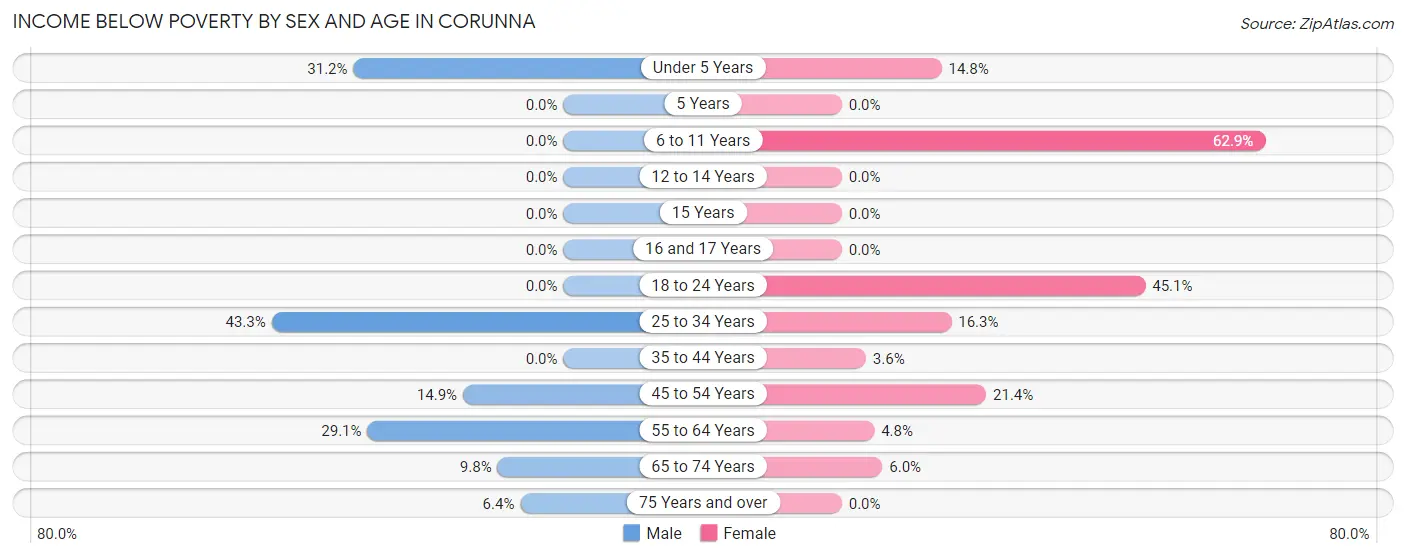
| Age Bracket | Male | Female |
| Under 5 Years | 53 (31.2%) | 12 (14.8%) |
| 5 Years | 0 (0.0%) | 0 (0.0%) |
| 6 to 11 Years | 0 (0.0%) | 22 (62.9%) |
| 12 to 14 Years | 0 (0.0%) | 0 (0.0%) |
| 15 Years | 0 (0.0%) | 0 (0.0%) |
| 16 and 17 Years | 0 (0.0%) | 0 (0.0%) |
| 18 to 24 Years | 0 (0.0%) | 32 (45.1%) |
| 25 to 34 Years | 104 (43.3%) | 20 (16.3%) |
| 35 to 44 Years | 0 (0.0%) | 10 (3.6%) |
| 45 to 54 Years | 17 (14.9%) | 36 (21.4%) |
| 55 to 64 Years | 39 (29.1%) | 9 (4.8%) |
| 65 to 74 Years | 9 (9.8%) | 8 (6.0%) |
| 75 Years and over | 8 (6.4%) | 0 (0.0%) |
| Total | 230 (15.8%) | 149 (10.8%) |
Income Above Poverty by Sex and Age in Corunna
According to the poverty statistics in Corunna, males aged 5 years and females aged 5 years are the age groups that are most secure financially, with 100.0% of males and 100.0% of females in these age groups living above the poverty line.
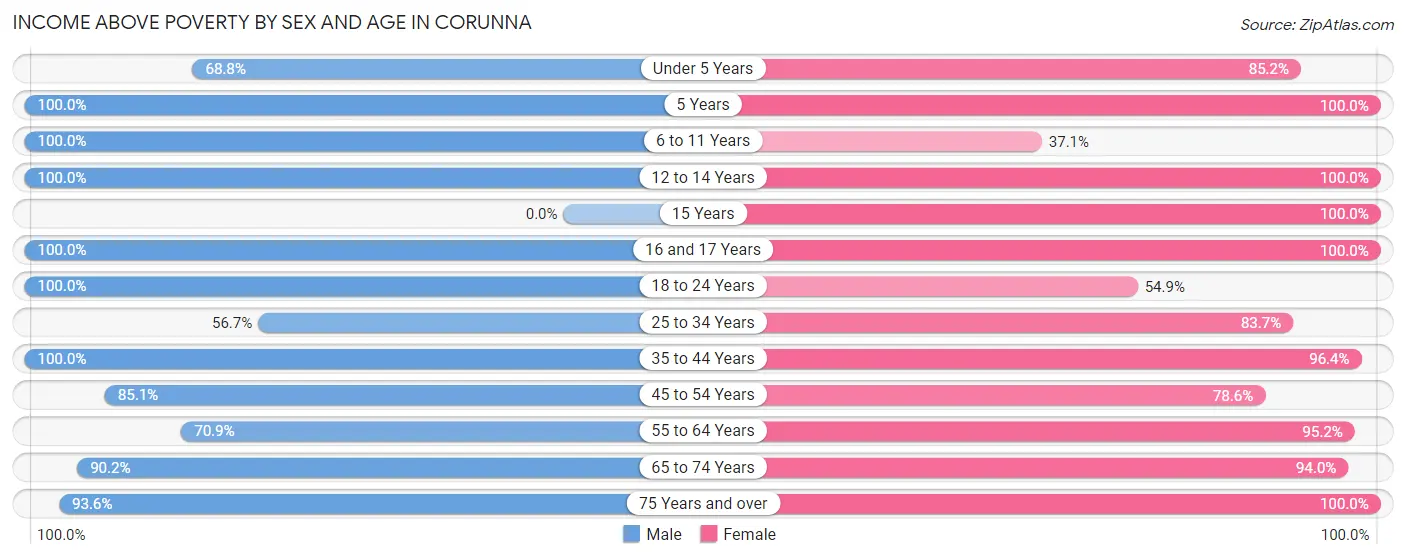
| Age Bracket | Male | Female |
| Under 5 Years | 117 (68.8%) | 69 (85.2%) |
| 5 Years | 15 (100.0%) | 25 (100.0%) |
| 6 to 11 Years | 125 (100.0%) | 13 (37.1%) |
| 12 to 14 Years | 124 (100.0%) | 13 (100.0%) |
| 15 Years | 0 (0.0%) | 31 (100.0%) |
| 16 and 17 Years | 89 (100.0%) | 93 (100.0%) |
| 18 to 24 Years | 65 (100.0%) | 39 (54.9%) |
| 25 to 34 Years | 136 (56.7%) | 103 (83.7%) |
| 35 to 44 Years | 160 (100.0%) | 269 (96.4%) |
| 45 to 54 Years | 97 (85.1%) | 132 (78.6%) |
| 55 to 64 Years | 95 (70.9%) | 178 (95.2%) |
| 65 to 74 Years | 83 (90.2%) | 125 (94.0%) |
| 75 Years and over | 117 (93.6%) | 140 (100.0%) |
| Total | 1,223 (84.2%) | 1,230 (89.2%) |
Income Below Poverty Among Married-Couple Families in Corunna
The poverty statistics for married-couple families in Corunna show that 2.2% or 9 of the total 407 families live below the poverty line. Families with 1 or 2 children have the highest poverty rate of 4.4%, comprising of 9 families. On the other hand, families with no children have the lowest poverty rate of 0.0%, which includes 0 families.
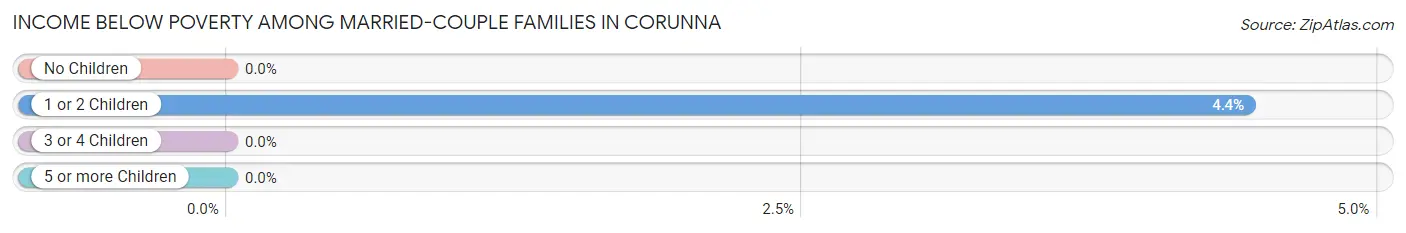
| Children | Above Poverty | Below Poverty |
| No Children | 172 (100.0%) | 0 (0.0%) |
| 1 or 2 Children | 194 (95.6%) | 9 (4.4%) |
| 3 or 4 Children | 32 (100.0%) | 0 (0.0%) |
| 5 or more Children | 0 (0.0%) | 0 (0.0%) |
| Total | 398 (97.8%) | 9 (2.2%) |
Income Below Poverty Among Single-Parent Households in Corunna
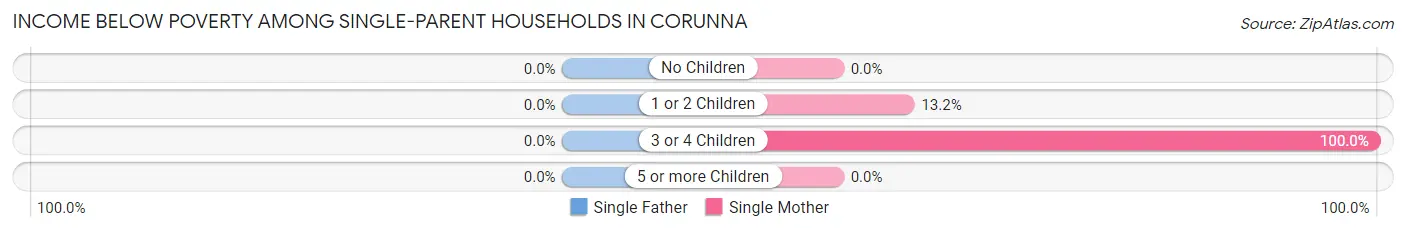
| Children | Single Father | Single Mother |
| No Children | 0 (0.0%) | 0 (0.0%) |
| 1 or 2 Children | 0 (0.0%) | 19 (13.2%) |
| 3 or 4 Children | 0 (0.0%) | 11 (100.0%) |
| 5 or more Children | 0 (0.0%) | 0 (0.0%) |
| Total | 0 (0.0%) | 30 (12.6%) |
Income Below Poverty Among Married-Couple vs Single-Parent Households in Corunna
The poverty data for Corunna shows that 9 of the married-couple family households (2.2%) and 30 of the single-parent households (11.6%) are living below the poverty level. Within the married-couple family households, those with 1 or 2 children have the highest poverty rate, with 9 households (4.4%) falling below the poverty line. Among the single-parent households, those with 3 or 4 children have the highest poverty rate, with 11 household (100.0%) living below poverty.
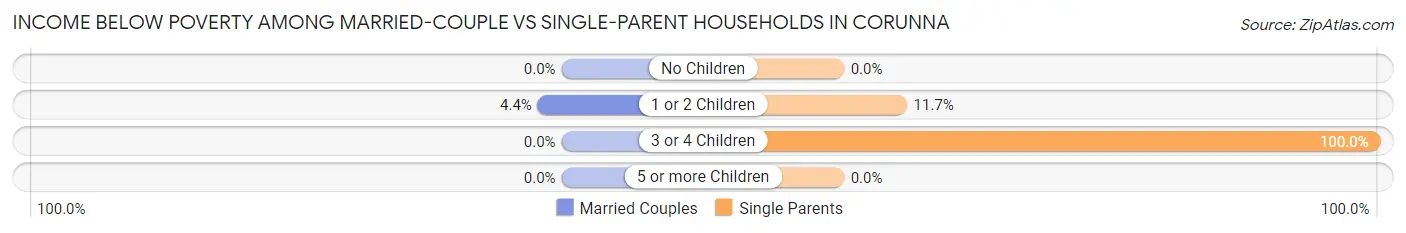
| Children | Married-Couple Families | Single-Parent Households |
| No Children | 0 (0.0%) | 0 (0.0%) |
| 1 or 2 Children | 9 (4.4%) | 19 (11.7%) |
| 3 or 4 Children | 0 (0.0%) | 11 (100.0%) |
| 5 or more Children | 0 (0.0%) | 0 (0.0%) |
| Total | 9 (2.2%) | 30 (11.6%) |
Race in Corunna
The most populous races in Corunna are White / Caucasian (2,859 | 93.5%), Black / African American (113 | 3.7%), and Hispanic or Latino (71 | 2.3%).
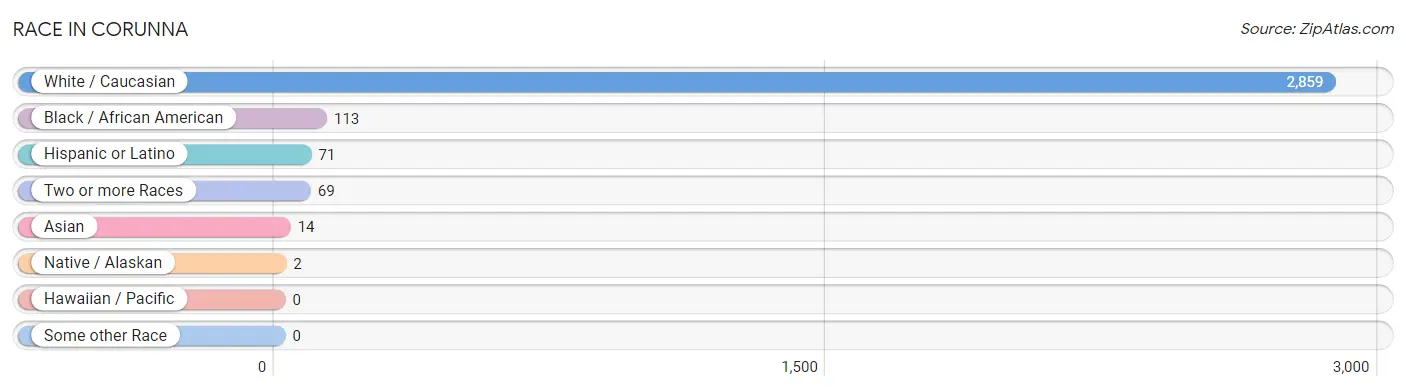
| Race | # Population | % Population |
| Asian | 14 | 0.5% |
| Black / African American | 113 | 3.7% |
| Hawaiian / Pacific | 0 | 0.0% |
| Hispanic or Latino | 71 | 2.3% |
| Native / Alaskan | 2 | 0.1% |
| White / Caucasian | 2,859 | 93.5% |
| Two or more Races | 69 | 2.3% |
| Some other Race | 0 | 0.0% |
| Total | 3,057 | 100.0% |
Ancestry in Corunna
The most populous ancestries reported in Corunna are German (761 | 24.9%), English (377 | 12.3%), Irish (318 | 10.4%), French (200 | 6.5%), and Dutch (181 | 5.9%), together accounting for 60.1% of all Corunna residents.
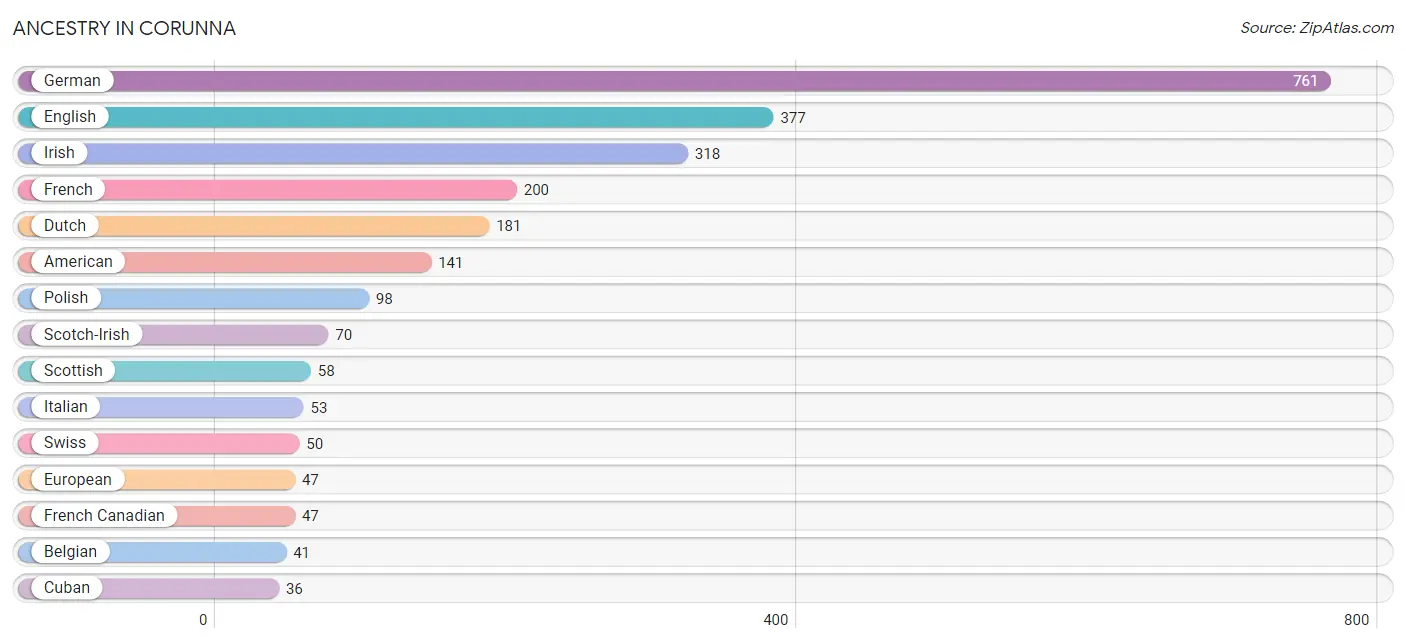
| Ancestry | # Population | % Population |
| American | 141 | 4.6% |
| Armenian | 7 | 0.2% |
| Belgian | 41 | 1.3% |
| Canadian | 11 | 0.4% |
| Croatian | 7 | 0.2% |
| Cuban | 36 | 1.2% |
| Czech | 10 | 0.3% |
| Czechoslovakian | 15 | 0.5% |
| Danish | 4 | 0.1% |
| Dutch | 181 | 5.9% |
| English | 377 | 12.3% |
| European | 47 | 1.5% |
| Finnish | 23 | 0.7% |
| French | 200 | 6.5% |
| French Canadian | 47 | 1.5% |
| German | 761 | 24.9% |
| Greek | 15 | 0.5% |
| Hungarian | 9 | 0.3% |
| Irish | 318 | 10.4% |
| Italian | 53 | 1.7% |
| Lithuanian | 9 | 0.3% |
| Mexican | 35 | 1.1% |
| Pennsylvania German | 5 | 0.2% |
| Polish | 98 | 3.2% |
| Scotch-Irish | 70 | 2.3% |
| Scottish | 58 | 1.9% |
| Slovak | 22 | 0.7% |
| Swedish | 10 | 0.3% |
| Swiss | 50 | 1.6% | View All 29 Rows |
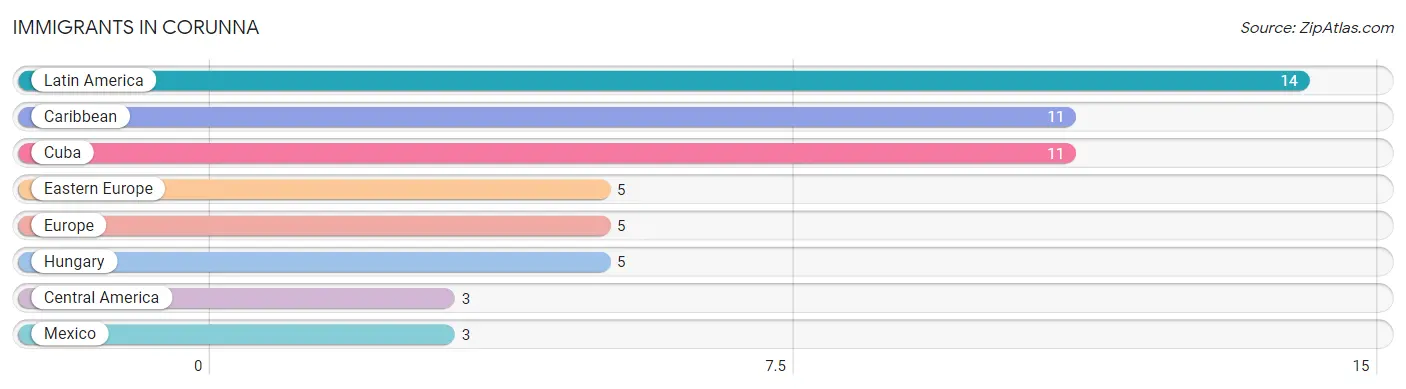
Immigrants in Corunna
The most numerous immigrant groups reported in Corunna came from Latin America (14 | 0.5%), Caribbean (11 | 0.4%), Cuba (11 | 0.4%), Eastern Europe (5 | 0.2%), and Europe (5 | 0.2%), together accounting for 1.5% of all Corunna residents.
| Immigration Origin | # Population | % Population |
| Caribbean | 11 | 0.4% |
| Central America | 3 | 0.1% |
| Cuba | 11 | 0.4% |
| Eastern Europe | 5 | 0.2% |
| Europe | 5 | 0.2% |
| Hungary | 5 | 0.2% |
| Latin America | 14 | 0.5% |
| Mexico | 3 | 0.1% | View All 8 Rows |
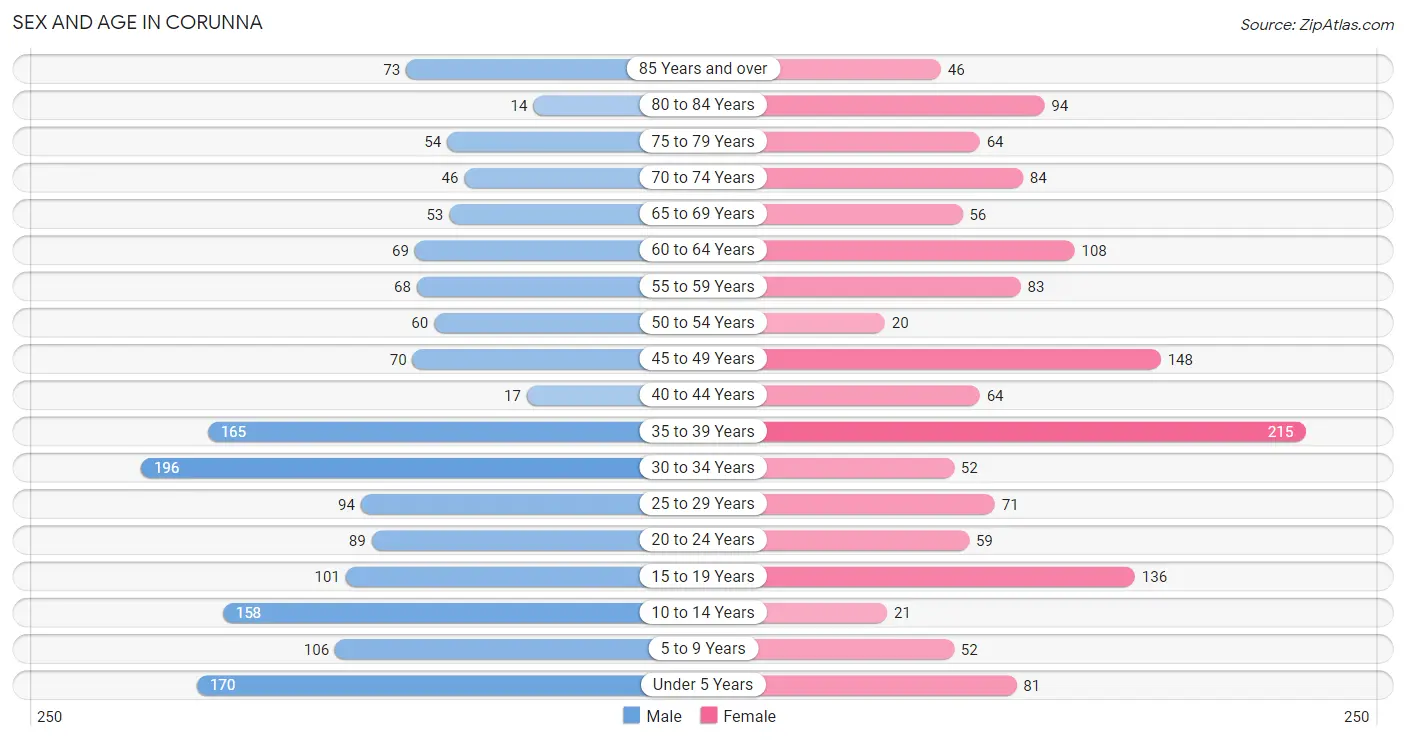
Sex and Age in Corunna
Sex and Age in Corunna
The most populous age groups in Corunna are 30 to 34 Years (196 | 12.2%) for men and 35 to 39 Years (215 | 14.8%) for women.
| Age Bracket | Male | Female |
| Under 5 Years | 170 (10.6%) | 81 (5.6%) |
| 5 to 9 Years | 106 (6.6%) | 52 (3.6%) |
| 10 to 14 Years | 158 (9.9%) | 21 (1.4%) |
| 15 to 19 Years | 101 (6.3%) | 136 (9.3%) |
| 20 to 24 Years | 89 (5.6%) | 59 (4.1%) |
| 25 to 29 Years | 94 (5.9%) | 71 (4.9%) |
| 30 to 34 Years | 196 (12.2%) | 52 (3.6%) |
| 35 to 39 Years | 165 (10.3%) | 215 (14.8%) |
| 40 to 44 Years | 17 (1.1%) | 64 (4.4%) |
| 45 to 49 Years | 70 (4.4%) | 148 (10.2%) |
| 50 to 54 Years | 60 (3.7%) | 20 (1.4%) |
| 55 to 59 Years | 68 (4.2%) | 83 (5.7%) |
| 60 to 64 Years | 69 (4.3%) | 108 (7.4%) |
| 65 to 69 Years | 53 (3.3%) | 56 (3.8%) |
| 70 to 74 Years | 46 (2.9%) | 84 (5.8%) |
| 75 to 79 Years | 54 (3.4%) | 64 (4.4%) |
| 80 to 84 Years | 14 (0.9%) | 94 (6.5%) |
| 85 Years and over | 73 (4.5%) | 46 (3.2%) |
| Total | 1,603 (100.0%) | 1,454 (100.0%) |
Families and Households in Corunna
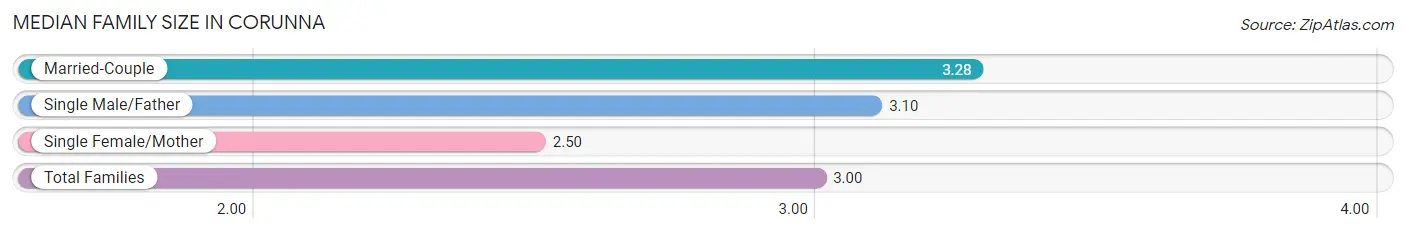
Median Family Size in Corunna
The median family size in Corunna is 3.00 persons per family, with married-couple families (407 | 61.1%) accounting for the largest median family size of 3.28 persons per family. On the other hand, single female/mother families (238 | 35.7%) represent the smallest median family size with 2.50 persons per family.
| Family Type | # Families | Family Size |
| Married-Couple | 407 (61.1%) | 3.28 |
| Single Male/Father | 21 (3.2%) | 3.10 |
| Single Female/Mother | 238 (35.7%) | 2.50 |
| Total Families | 666 (100.0%) | 3.00 |
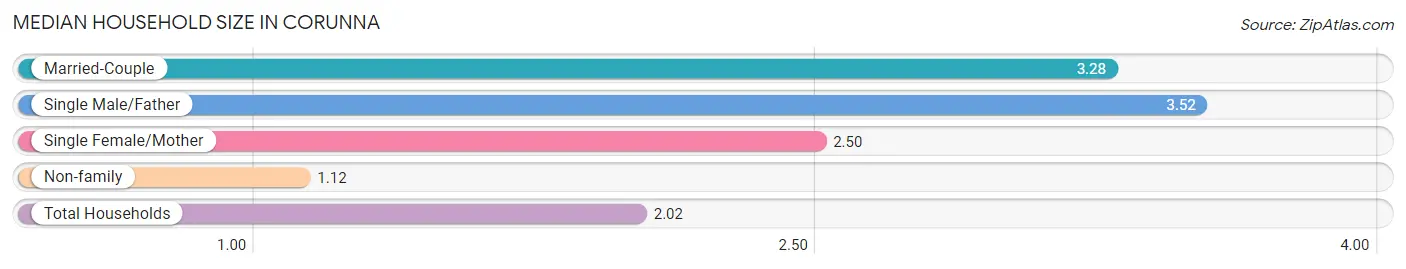
Median Household Size in Corunna
The median household size in Corunna is 2.02 persons per household, with single male/father households (21 | 1.5%) accounting for the largest median household size of 3.52 persons per household. non-family households (737 | 52.5%) represent the smallest median household size with 1.12 persons per household.
| Household Type | # Households | Household Size |
| Married-Couple | 407 (29.0%) | 3.28 |
| Single Male/Father | 21 (1.5%) | 3.52 |
| Single Female/Mother | 238 (17.0%) | 2.50 |
| Non-family | 737 (52.5%) | 1.12 |
| Total Households | 1,403 (100.0%) | 2.02 |
Household Size by Marriage Status in Corunna
Out of a total of 1,403 households in Corunna, 666 (47.5%) are family households, while 737 (52.5%) are nonfamily households. The most numerous type of family households are 2-person households, comprising 309, and the most common type of nonfamily households are 1-person households, comprising 668.
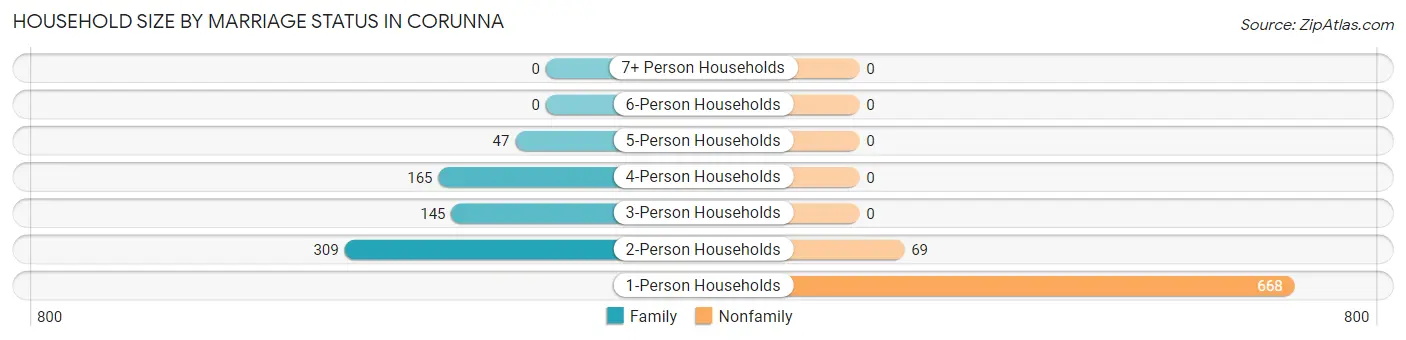
| Household Size | Family Households | Nonfamily Households |
| 1-Person Households | - | 668 (47.6%) |
| 2-Person Households | 309 (22.0%) | 69 (4.9%) |
| 3-Person Households | 145 (10.3%) | 0 (0.0%) |
| 4-Person Households | 165 (11.8%) | 0 (0.0%) |
| 5-Person Households | 47 (3.4%) | 0 (0.0%) |
| 6-Person Households | 0 (0.0%) | 0 (0.0%) |
| 7+ Person Households | 0 (0.0%) | 0 (0.0%) |
| Total | 666 (47.5%) | 737 (52.5%) |
Female Fertility in Corunna
Fertility by Age in Corunna
Average fertility rate in Corunna is 15.0 births per 1,000 women. Women in the age bracket of 20 to 34 years have the highest fertility rate with 60.0 births per 1,000 women. Women in the age bracket of 20 to 34 years acount for 100.0% of all women with births.
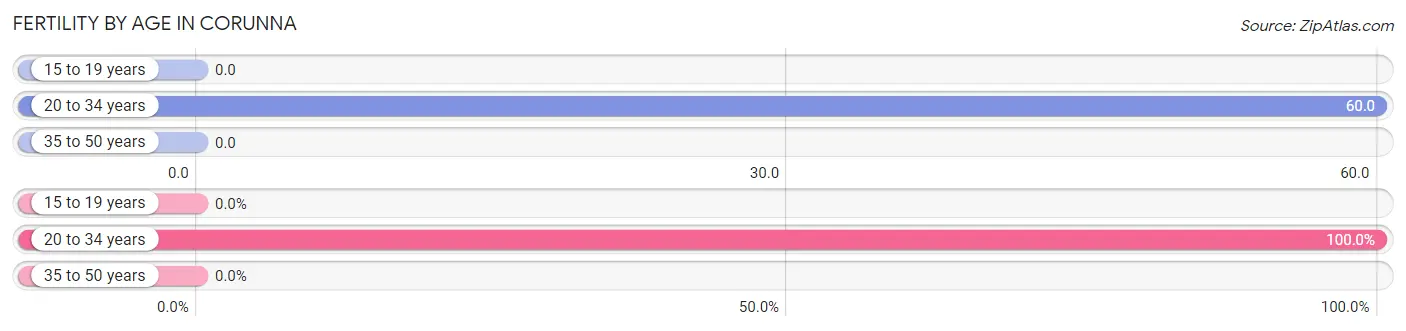
| Age Bracket | Women with Births | Births / 1,000 Women |
| 15 to 19 years | 0 (0.0%) | 0.0 |
| 20 to 34 years | 11 (100.0%) | 60.0 |
| 35 to 50 years | 0 (0.0%) | 0.0 |
| Total | 11 (100.0%) | 15.0 |
Fertility by Age by Marriage Status in Corunna
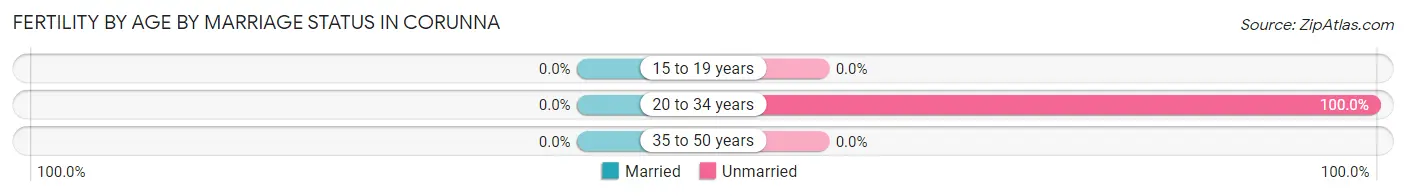
| Age Bracket | Married | Unmarried |
| 15 to 19 years | 0 (0.0%) | 0 (0.0%) |
| 20 to 34 years | 0 (0.0%) | 11 (100.0%) |
| 35 to 50 years | 0 (0.0%) | 0 (0.0%) |
| Total | 0 (0.0%) | 11 (100.0%) |
Fertility by Education in Corunna
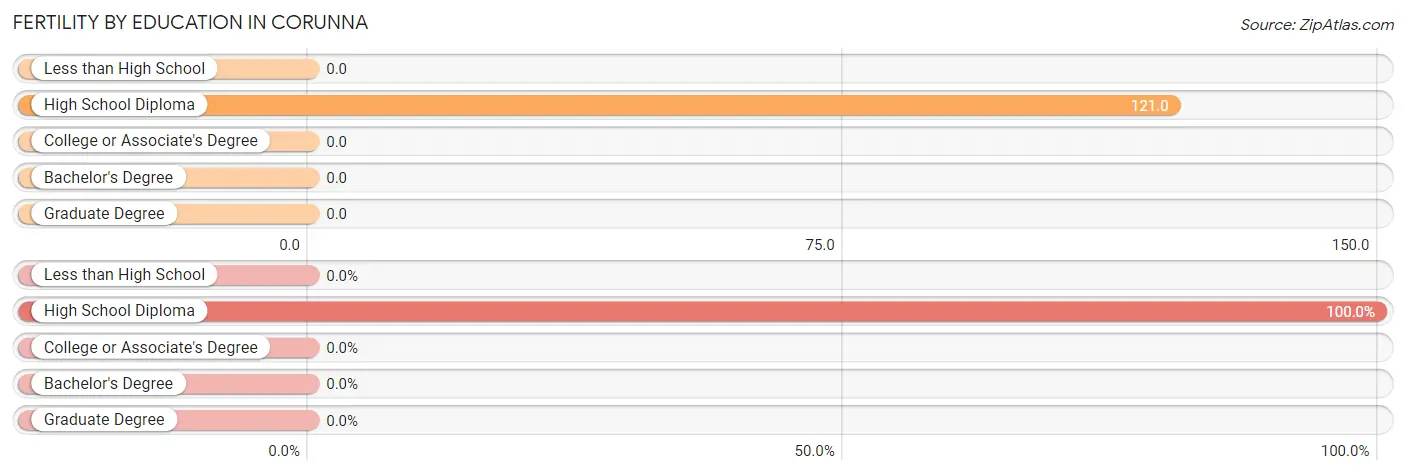
| Educational Attainment | Women with Births | Births / 1,000 Women |
| Less than High School | 0 (0.0%) | 0.0 |
| High School Diploma | 11 (100.0%) | 121.0 |
| College or Associate's Degree | 0 (0.0%) | 0.0 |
| Bachelor's Degree | 0 (0.0%) | 0.0 |
| Graduate Degree | 0 (0.0%) | 0.0 |
| Total | 11 (100.0%) | 15.0 |
Fertility by Education by Marriage Status in Corunna
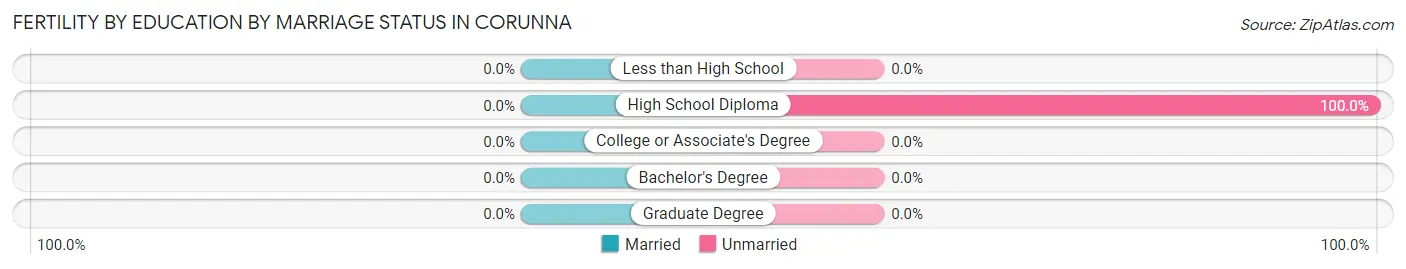
| Educational Attainment | Married | Unmarried |
| Less than High School | 0 (0.0%) | 0 (0.0%) |
| High School Diploma | 0 (0.0%) | 11 (100.0%) |
| College or Associate's Degree | 0 (0.0%) | 0 (0.0%) |
| Bachelor's Degree | 0 (0.0%) | 0 (0.0%) |
| Graduate Degree | 0 (0.0%) | 0 (0.0%) |
| Total | 0 (0.0%) | 11 (100.0%) |
Employment Characteristics in Corunna
Employment by Class of Employer in Corunna
Among the 1,178 employed individuals in Corunna, private company employees (853 | 72.4%), not-for-profit organizations (127 | 10.8%), and self-employed (not incorporated) (60 | 5.1%) make up the most common classes of employment.
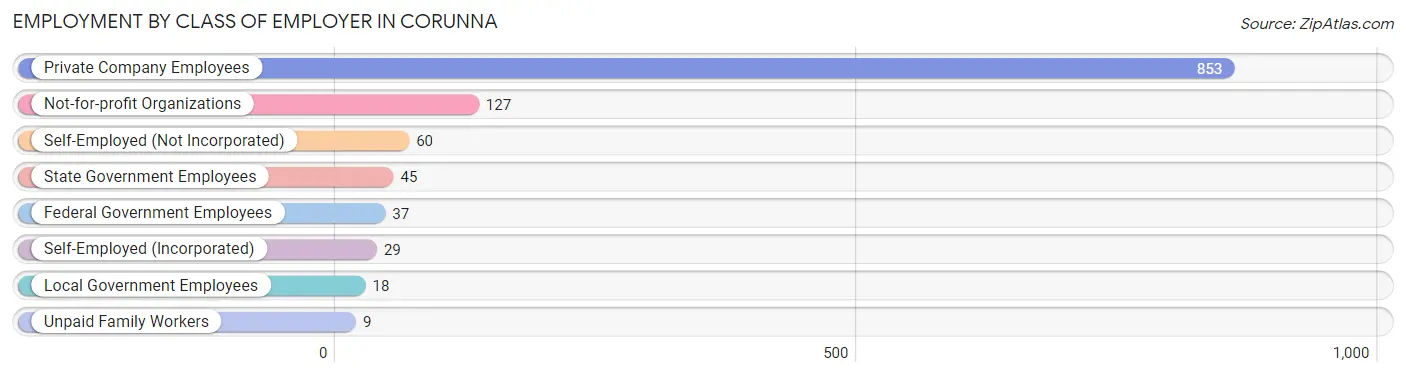
| Employer Class | # Employees | % Employees |
| Private Company Employees | 853 | 72.4% |
| Self-Employed (Incorporated) | 29 | 2.5% |
| Self-Employed (Not Incorporated) | 60 | 5.1% |
| Not-for-profit Organizations | 127 | 10.8% |
| Local Government Employees | 18 | 1.5% |
| State Government Employees | 45 | 3.8% |
| Federal Government Employees | 37 | 3.1% |
| Unpaid Family Workers | 9 | 0.8% |
| Total | 1,178 | 100.0% |
Employment Status by Age in Corunna
According to the labor force statistics for Corunna, out of the total population over 16 years of age (2,438), 51.1% or 1,246 individuals are in the labor force, with 4.7% or 59 of them unemployed. The age group with the highest labor force participation rate is 20 to 24 years, with 83.8% or 124 individuals in the labor force. Within the labor force, the 30 to 34 years age range has the highest percentage of unemployed individuals, with 28.3% or 28 of them being unemployed.
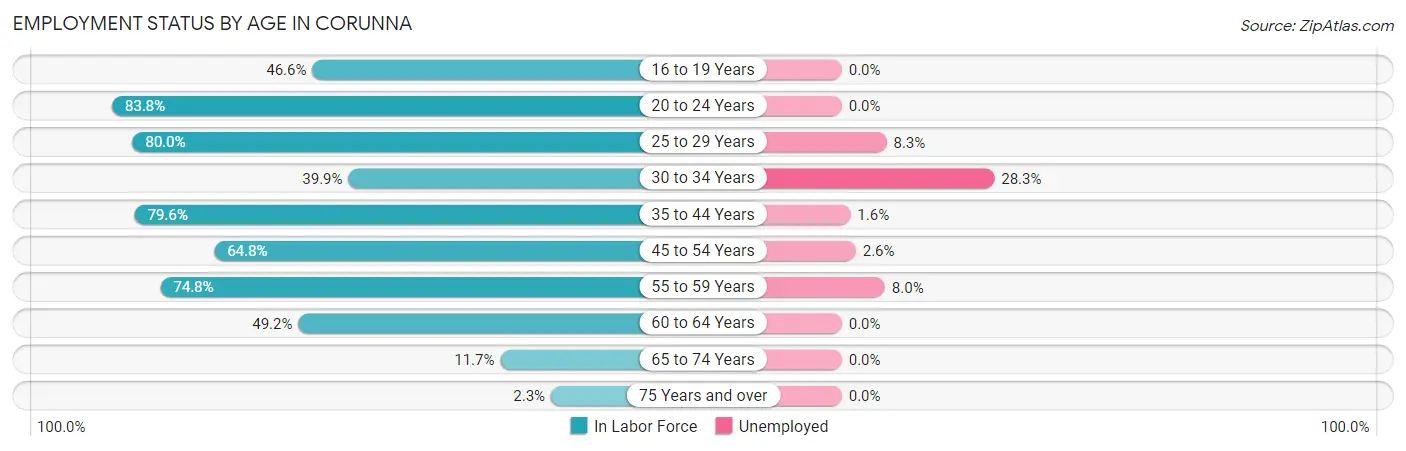
| Age Bracket | In Labor Force | Unemployed |
| 16 to 19 Years | 96 (46.6%) | 0 (0.0%) |
| 20 to 24 Years | 124 (83.8%) | 0 (0.0%) |
| 25 to 29 Years | 132 (80.0%) | 11 (8.3%) |
| 30 to 34 Years | 99 (39.9%) | 28 (28.3%) |
| 35 to 44 Years | 367 (79.6%) | 6 (1.6%) |
| 45 to 54 Years | 193 (64.8%) | 5 (2.6%) |
| 55 to 59 Years | 113 (74.8%) | 9 (8.0%) |
| 60 to 64 Years | 87 (49.2%) | 0 (0.0%) |
| 65 to 74 Years | 28 (11.7%) | 0 (0.0%) |
| 75 Years and over | 8 (2.3%) | 0 (0.0%) |
| Total | 1,246 (51.1%) | 59 (4.7%) |
Employment Status by Educational Attainment in Corunna
According to labor force statistics for Corunna, 66.1% of individuals (992) out of the total population between 25 and 64 years of age (1,500) are in the labor force, with 6.0% or 60 of them being unemployed. The group with the highest labor force participation rate are those with the educational attainment of less than high school, with 100.0% or 27 individuals in the labor force. Within the labor force, individuals with less than high school education have the highest percentage of unemployment, with 33.3% or 9 of them being unemployed.
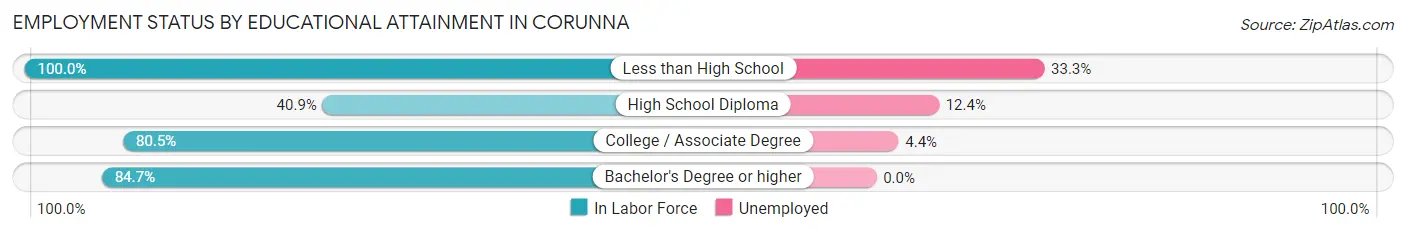
| Educational Attainment | In Labor Force | Unemployed |
| Less than High School | 27 (100.0%) | 9 (33.3%) |
| High School Diploma | 242 (40.9%) | 73 (12.4%) |
| College / Associate Degree | 457 (80.5%) | 25 (4.4%) |
| Bachelor's Degree or higher | 265 (84.7%) | 0 (0.0%) |
| Total | 991 (66.1%) | 90 (6.0%) |
Employment Occupations by Sex in Corunna
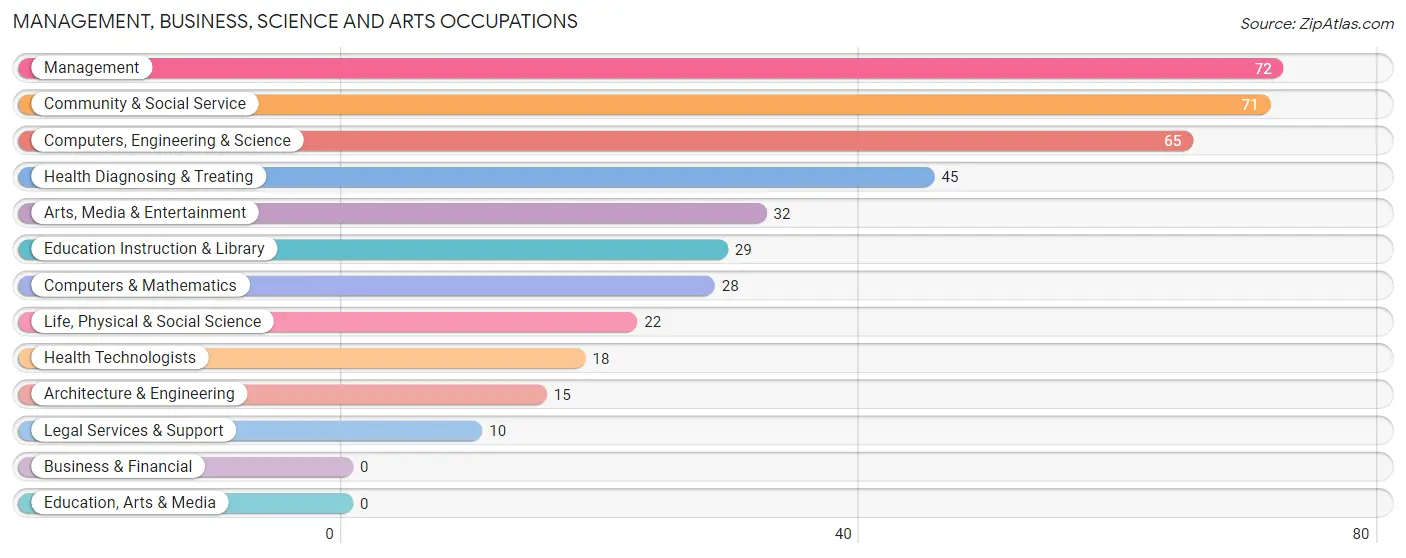
Management, Business, Science and Arts Occupations
The most common Management, Business, Science and Arts occupations in Corunna are Management (72 | 6.1%), Community & Social Service (71 | 6.0%), Computers, Engineering & Science (65 | 5.5%), Health Diagnosing & Treating (45 | 3.8%), and Arts, Media & Entertainment (32 | 2.7%).
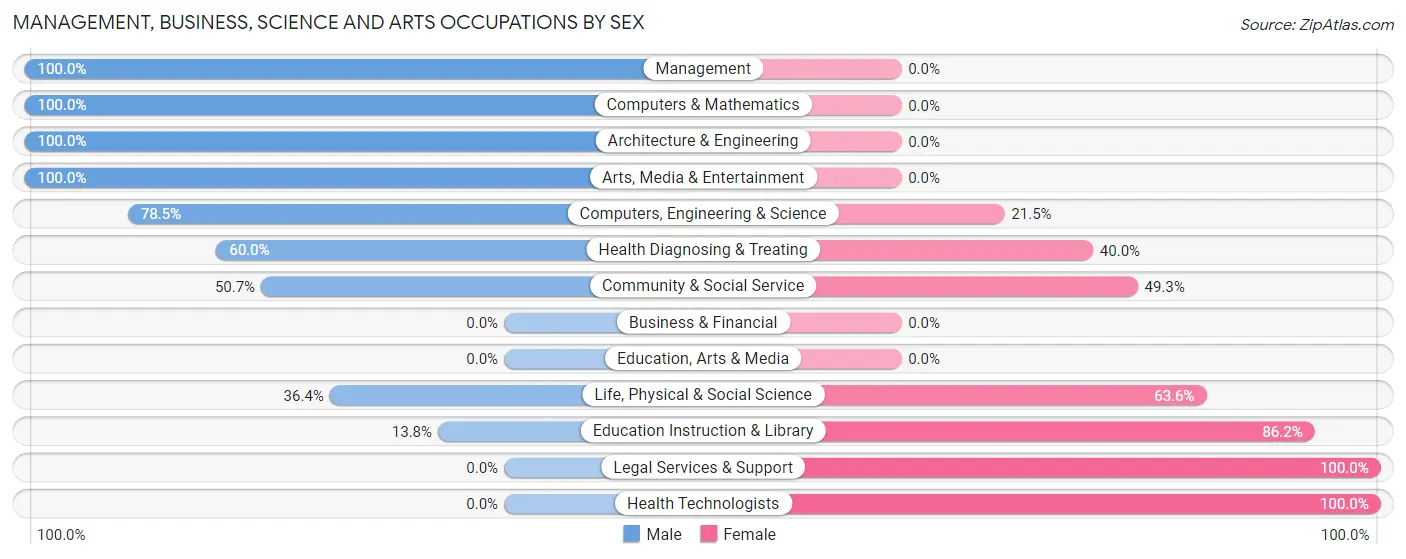
Management, Business, Science and Arts Occupations by Sex
Within the Management, Business, Science and Arts occupations in Corunna, the most male-oriented occupations are Management (100.0%), Computers & Mathematics (100.0%), and Architecture & Engineering (100.0%), while the most female-oriented occupations are Legal Services & Support (100.0%), Health Technologists (100.0%), and Education Instruction & Library (86.2%).
| Occupation | Male | Female |
| Management | 72 (100.0%) | 0 (0.0%) |
| Business & Financial | 0 (0.0%) | 0 (0.0%) |
| Computers, Engineering & Science | 51 (78.5%) | 14 (21.5%) |
| Computers & Mathematics | 28 (100.0%) | 0 (0.0%) |
| Architecture & Engineering | 15 (100.0%) | 0 (0.0%) |
| Life, Physical & Social Science | 8 (36.4%) | 14 (63.6%) |
| Community & Social Service | 36 (50.7%) | 35 (49.3%) |
| Education, Arts & Media | 0 (0.0%) | 0 (0.0%) |
| Legal Services & Support | 0 (0.0%) | 10 (100.0%) |
| Education Instruction & Library | 4 (13.8%) | 25 (86.2%) |
| Arts, Media & Entertainment | 32 (100.0%) | 0 (0.0%) |
| Health Diagnosing & Treating | 27 (60.0%) | 18 (40.0%) |
| Health Technologists | 0 (0.0%) | 18 (100.0%) |
| Total (Category) | 186 (73.5%) | 67 (26.5%) |
| Total (Overall) | 490 (41.2%) | 698 (58.8%) |
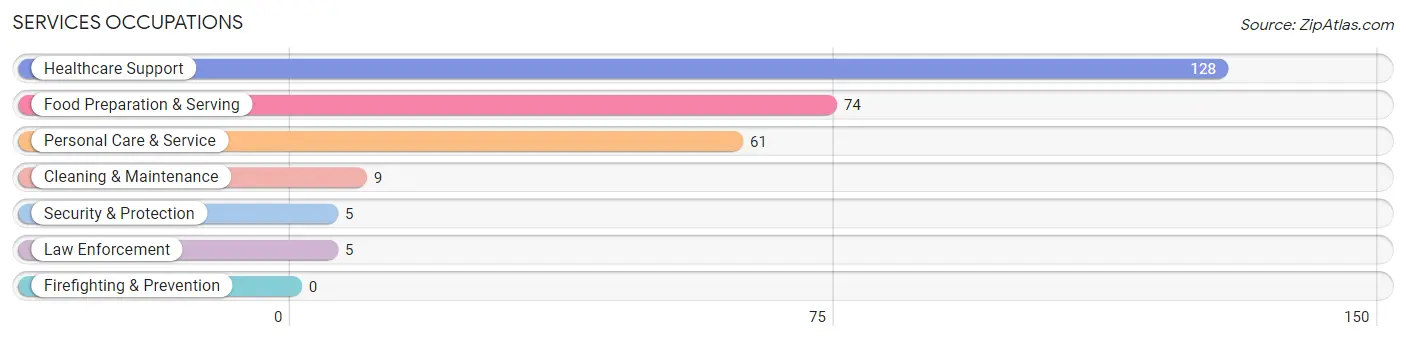
Services Occupations
The most common Services occupations in Corunna are Healthcare Support (128 | 10.8%), Food Preparation & Serving (74 | 6.2%), Personal Care & Service (61 | 5.1%), Cleaning & Maintenance (9 | 0.8%), and Security & Protection (5 | 0.4%).
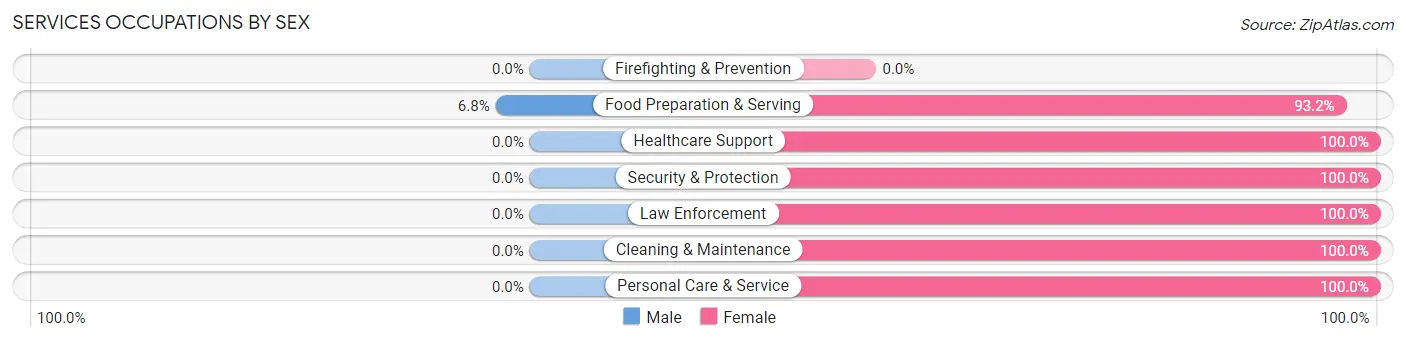
Services Occupations by Sex
| Occupation | Male | Female |
| Healthcare Support | 0 (0.0%) | 128 (100.0%) |
| Security & Protection | 0 (0.0%) | 5 (100.0%) |
| Firefighting & Prevention | 0 (0.0%) | 0 (0.0%) |
| Law Enforcement | 0 (0.0%) | 5 (100.0%) |
| Food Preparation & Serving | 5 (6.8%) | 69 (93.2%) |
| Cleaning & Maintenance | 0 (0.0%) | 9 (100.0%) |
| Personal Care & Service | 0 (0.0%) | 61 (100.0%) |
| Total (Category) | 5 (1.8%) | 272 (98.2%) |
| Total (Overall) | 490 (41.2%) | 698 (58.8%) |
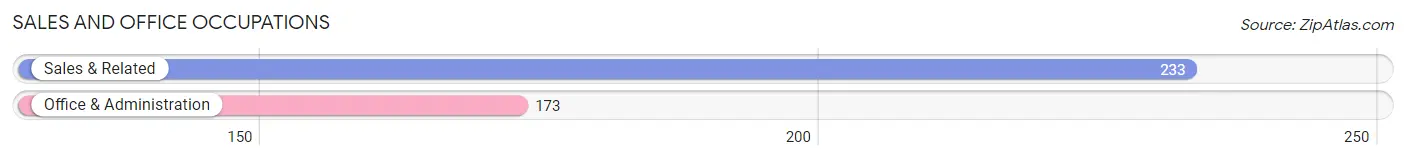
Sales and Office Occupations
The most common Sales and Office occupations in Corunna are Sales & Related (233 | 19.6%), and Office & Administration (173 | 14.6%).
Sales and Office Occupations by Sex
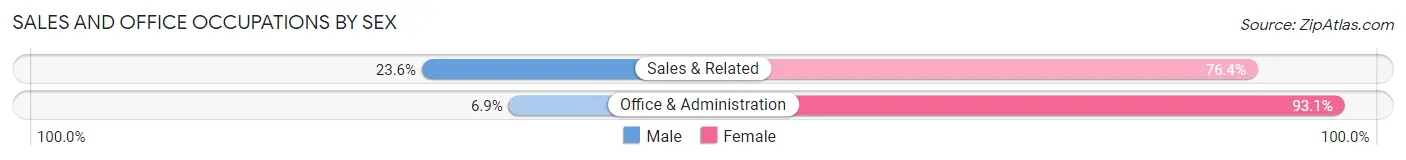
| Occupation | Male | Female |
| Sales & Related | 55 (23.6%) | 178 (76.4%) |
| Office & Administration | 12 (6.9%) | 161 (93.1%) |
| Total (Category) | 67 (16.5%) | 339 (83.5%) |
| Total (Overall) | 490 (41.2%) | 698 (58.8%) |
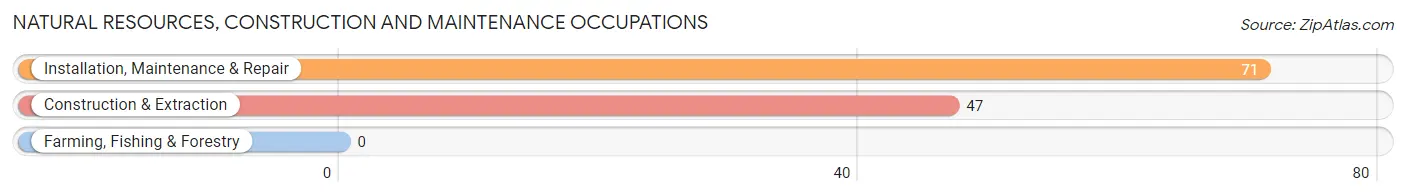
Natural Resources, Construction and Maintenance Occupations
The most common Natural Resources, Construction and Maintenance occupations in Corunna are Installation, Maintenance & Repair (71 | 6.0%), and Construction & Extraction (47 | 4.0%).
Natural Resources, Construction and Maintenance Occupations by Sex
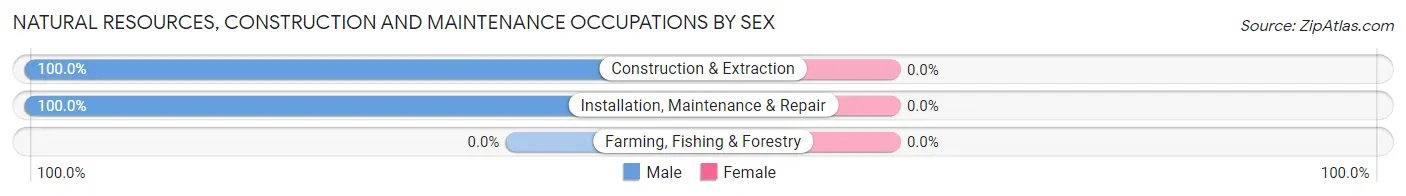
| Occupation | Male | Female |
| Farming, Fishing & Forestry | 0 (0.0%) | 0 (0.0%) |
| Construction & Extraction | 47 (100.0%) | 0 (0.0%) |
| Installation, Maintenance & Repair | 71 (100.0%) | 0 (0.0%) |
| Total (Category) | 118 (100.0%) | 0 (0.0%) |
| Total (Overall) | 490 (41.2%) | 698 (58.8%) |
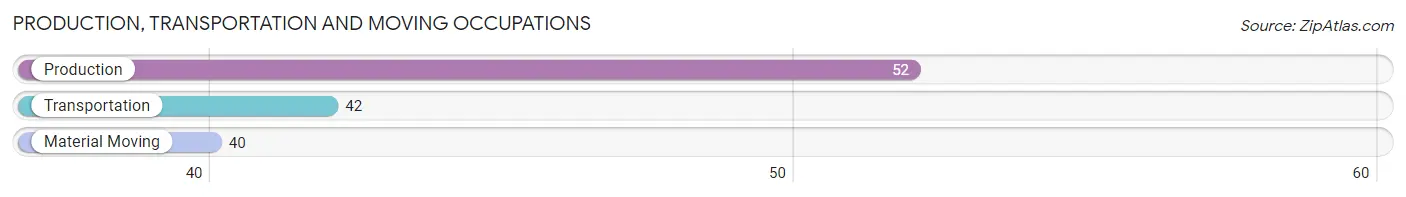
Production, Transportation and Moving Occupations
The most common Production, Transportation and Moving occupations in Corunna are Production (52 | 4.4%), Transportation (42 | 3.5%), and Material Moving (40 | 3.4%).
Production, Transportation and Moving Occupations by Sex
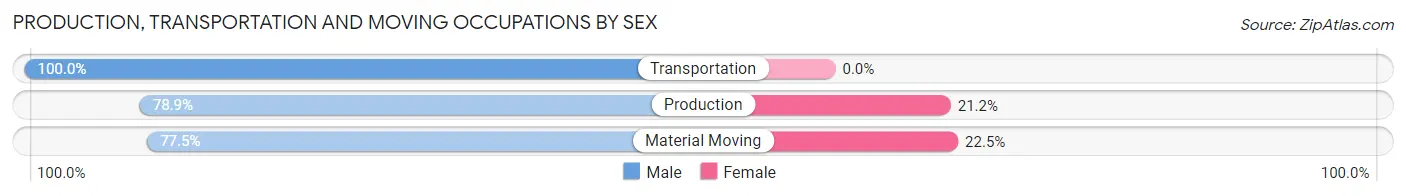
| Occupation | Male | Female |
| Production | 41 (78.8%) | 11 (21.1%) |
| Transportation | 42 (100.0%) | 0 (0.0%) |
| Material Moving | 31 (77.5%) | 9 (22.5%) |
| Total (Category) | 114 (85.1%) | 20 (14.9%) |
| Total (Overall) | 490 (41.2%) | 698 (58.8%) |
Employment Industries by Sex in Corunna
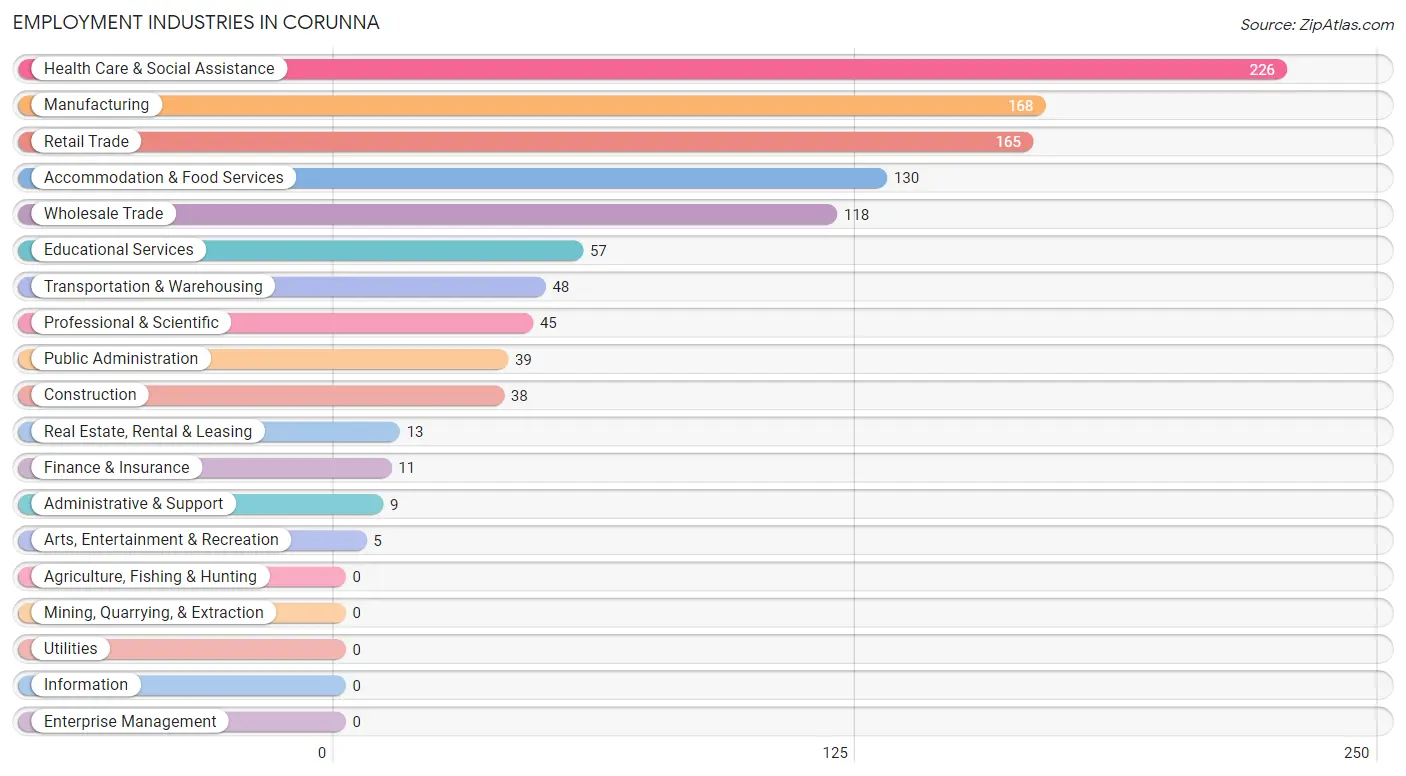
Employment Industries in Corunna
The major employment industries in Corunna include Health Care & Social Assistance (226 | 19.0%), Manufacturing (168 | 14.1%), Retail Trade (165 | 13.9%), Accommodation & Food Services (130 | 10.9%), and Wholesale Trade (118 | 9.9%).
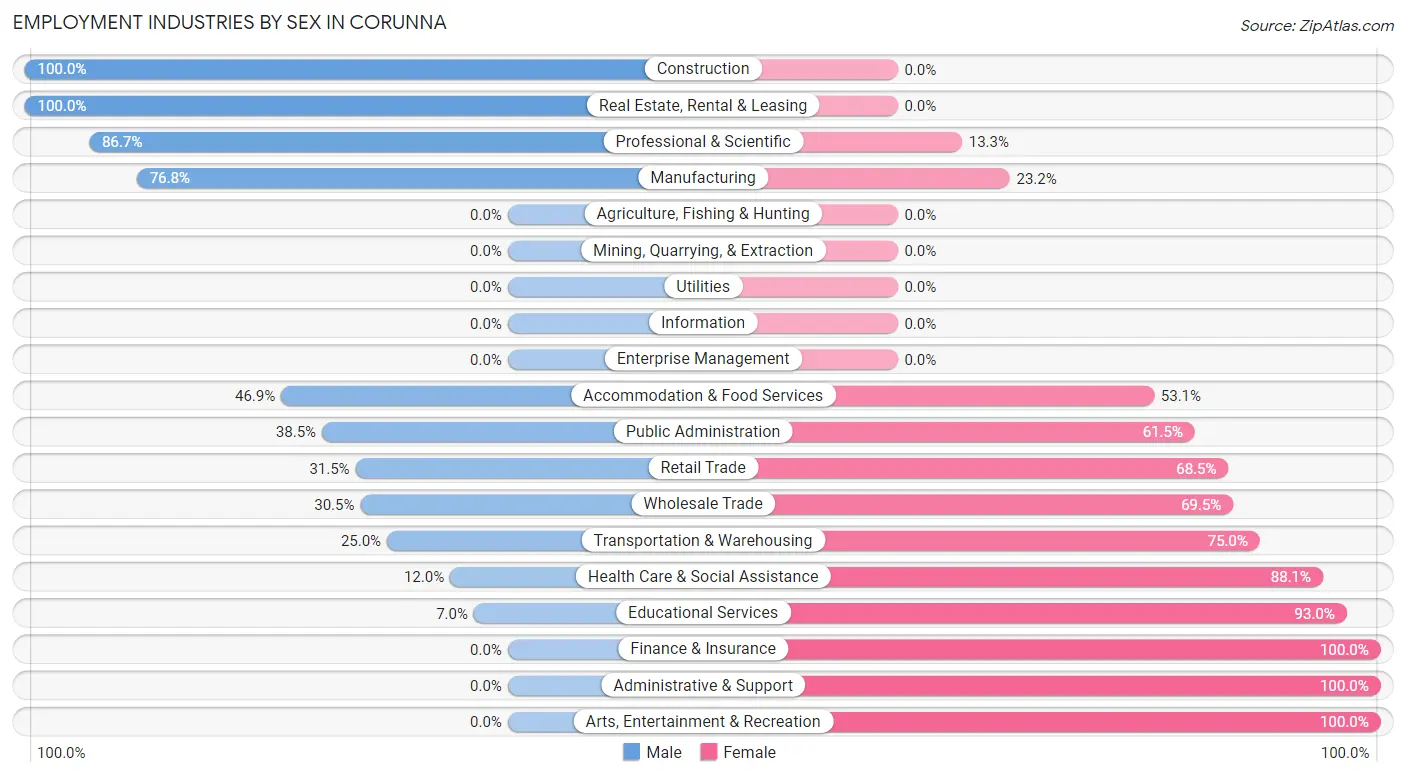
Employment Industries by Sex in Corunna
The Corunna industries that see more men than women are Construction (100.0%), Real Estate, Rental & Leasing (100.0%), and Professional & Scientific (86.7%), whereas the industries that tend to have a higher number of women are Finance & Insurance (100.0%), Administrative & Support (100.0%), and Arts, Entertainment & Recreation (100.0%).
| Industry | Male | Female |
| Agriculture, Fishing & Hunting | 0 (0.0%) | 0 (0.0%) |
| Mining, Quarrying, & Extraction | 0 (0.0%) | 0 (0.0%) |
| Construction | 38 (100.0%) | 0 (0.0%) |
| Manufacturing | 129 (76.8%) | 39 (23.2%) |
| Wholesale Trade | 36 (30.5%) | 82 (69.5%) |
| Retail Trade | 52 (31.5%) | 113 (68.5%) |
| Transportation & Warehousing | 12 (25.0%) | 36 (75.0%) |
| Utilities | 0 (0.0%) | 0 (0.0%) |
| Information | 0 (0.0%) | 0 (0.0%) |
| Finance & Insurance | 0 (0.0%) | 11 (100.0%) |
| Real Estate, Rental & Leasing | 13 (100.0%) | 0 (0.0%) |
| Professional & Scientific | 39 (86.7%) | 6 (13.3%) |
| Enterprise Management | 0 (0.0%) | 0 (0.0%) |
| Administrative & Support | 0 (0.0%) | 9 (100.0%) |
| Educational Services | 4 (7.0%) | 53 (93.0%) |
| Health Care & Social Assistance | 27 (11.9%) | 199 (88.0%) |
| Arts, Entertainment & Recreation | 0 (0.0%) | 5 (100.0%) |
| Accommodation & Food Services | 61 (46.9%) | 69 (53.1%) |
| Public Administration | 15 (38.5%) | 24 (61.5%) |
| Total | 490 (41.2%) | 698 (58.8%) |
Education in Corunna
School Enrollment in Corunna
The most common levels of schooling among the 622 students in Corunna are high school (213 | 34.2%), middle school (145 | 23.3%), and elementary school (124 | 19.9%).
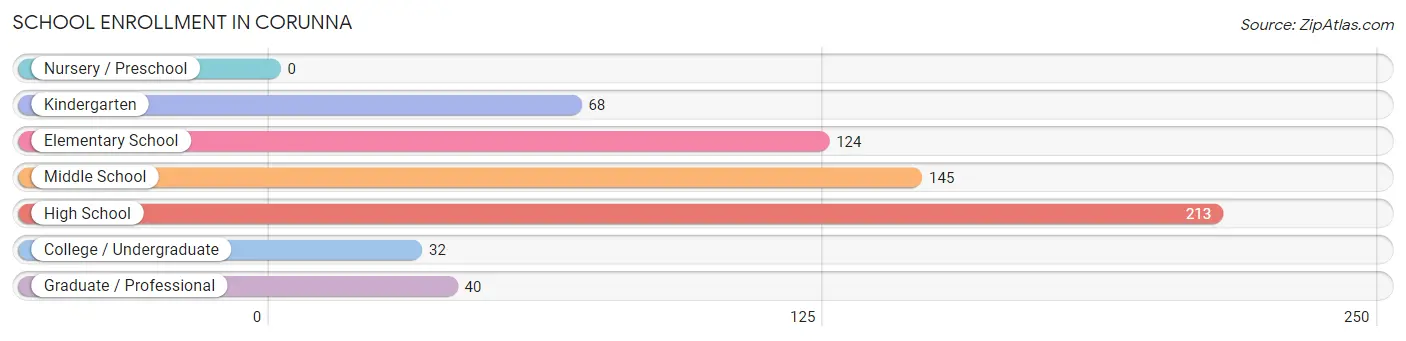
| School Level | # Students | % Students |
| Nursery / Preschool | 0 | 0.0% |
| Kindergarten | 68 | 10.9% |
| Elementary School | 124 | 19.9% |
| Middle School | 145 | 23.3% |
| High School | 213 | 34.2% |
| College / Undergraduate | 32 | 5.1% |
| Graduate / Professional | 40 | 6.4% |
| Total | 622 | 100.0% |
School Enrollment by Age by Funding Source in Corunna
Out of a total of 622 students who are enrolled in schools in Corunna, 60 (9.6%) attend a private institution, while the remaining 562 (90.4%) are enrolled in public schools. The age group of 5 to 9 year old has the highest likelihood of being enrolled in private schools, with 60 (38.0% in the age bracket) enrolled. Conversely, the age group of 10 to 14 year olds has the lowest likelihood of being enrolled in a private school, with 179 (100.0% in the age bracket) attending a public institution.
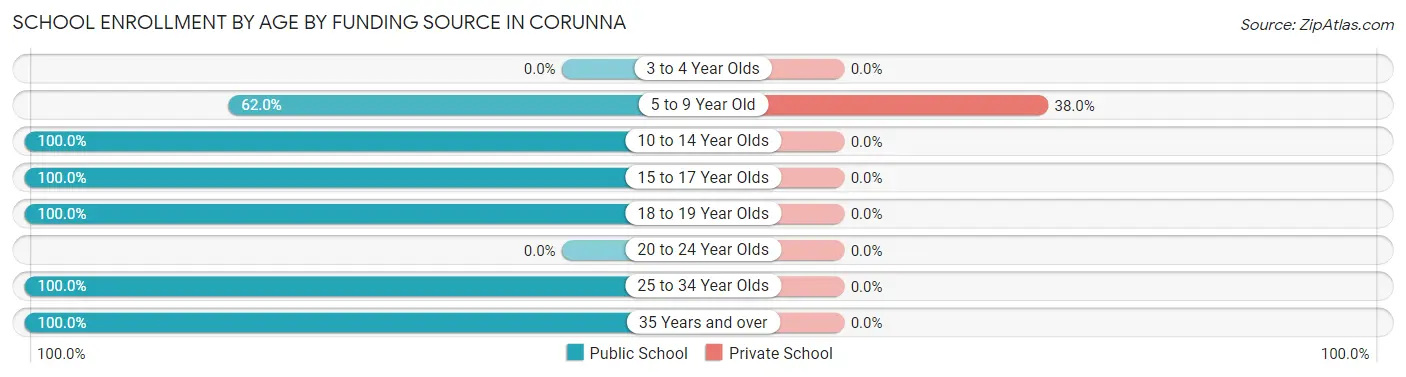
| Age Bracket | Public School | Private School |
| 3 to 4 Year Olds | 0 (0.0%) | 0 (0.0%) |
| 5 to 9 Year Old | 98 (62.0%) | 60 (38.0%) |
| 10 to 14 Year Olds | 179 (100.0%) | 0 (0.0%) |
| 15 to 17 Year Olds | 213 (100.0%) | 0 (0.0%) |
| 18 to 19 Year Olds | 12 (100.0%) | 0 (0.0%) |
| 20 to 24 Year Olds | 0 (0.0%) | 0 (0.0%) |
| 25 to 34 Year Olds | 14 (100.0%) | 0 (0.0%) |
| 35 Years and over | 46 (100.0%) | 0 (0.0%) |
| Total | 562 (90.4%) | 60 (9.6%) |
Educational Attainment by Field of Study in Corunna
Business (136 | 35.1%), science & technology (85 | 22.0%), education (65 | 16.8%), communications (26 | 6.7%), and social sciences (21 | 5.4%) are the most common fields of study among 387 individuals in Corunna who have obtained a bachelor's degree or higher.
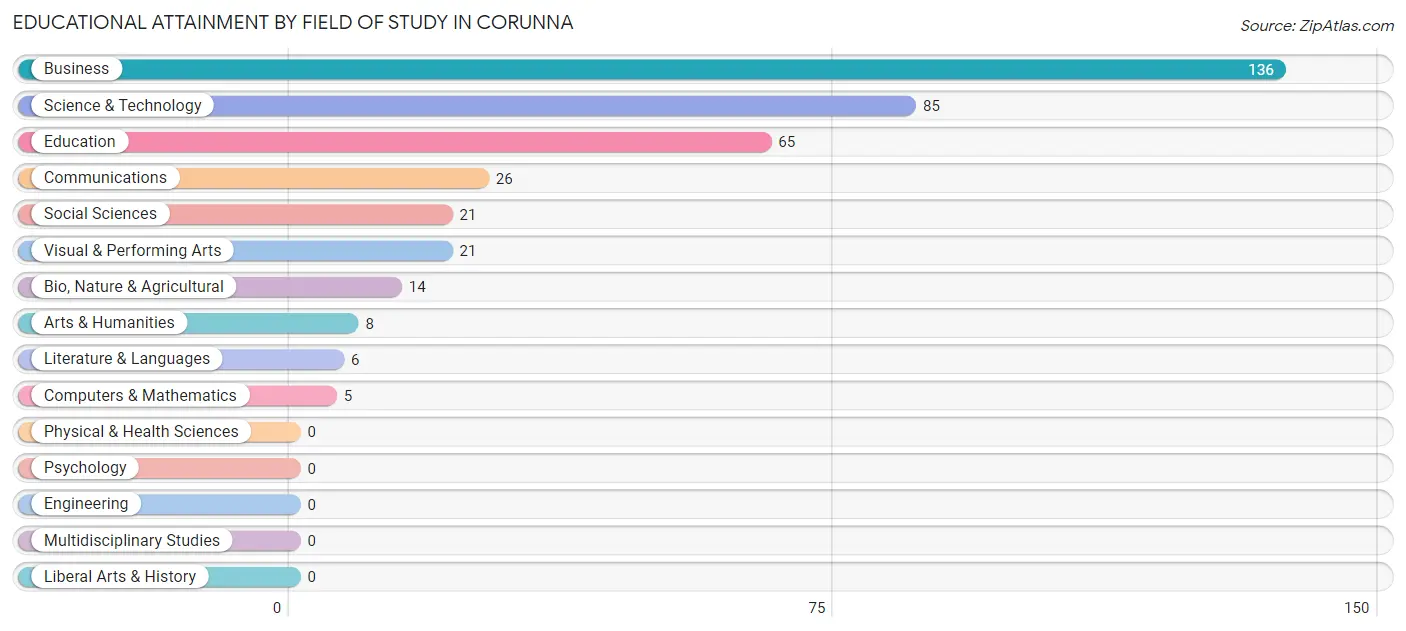
| Field of Study | # Graduates | % Graduates |
| Computers & Mathematics | 5 | 1.3% |
| Bio, Nature & Agricultural | 14 | 3.6% |
| Physical & Health Sciences | 0 | 0.0% |
| Psychology | 0 | 0.0% |
| Social Sciences | 21 | 5.4% |
| Engineering | 0 | 0.0% |
| Multidisciplinary Studies | 0 | 0.0% |
| Science & Technology | 85 | 22.0% |
| Business | 136 | 35.1% |
| Education | 65 | 16.8% |
| Literature & Languages | 6 | 1.5% |
| Liberal Arts & History | 0 | 0.0% |
| Visual & Performing Arts | 21 | 5.4% |
| Communications | 26 | 6.7% |
| Arts & Humanities | 8 | 2.1% |
| Total | 387 | 100.0% |
Transportation & Commute in Corunna
Vehicle Availability by Sex in Corunna
The most prevalent vehicle ownership categories in Corunna are males with 2 vehicles (243, accounting for 50.6%) and females with 2 vehicles (325, making up 34.8%).
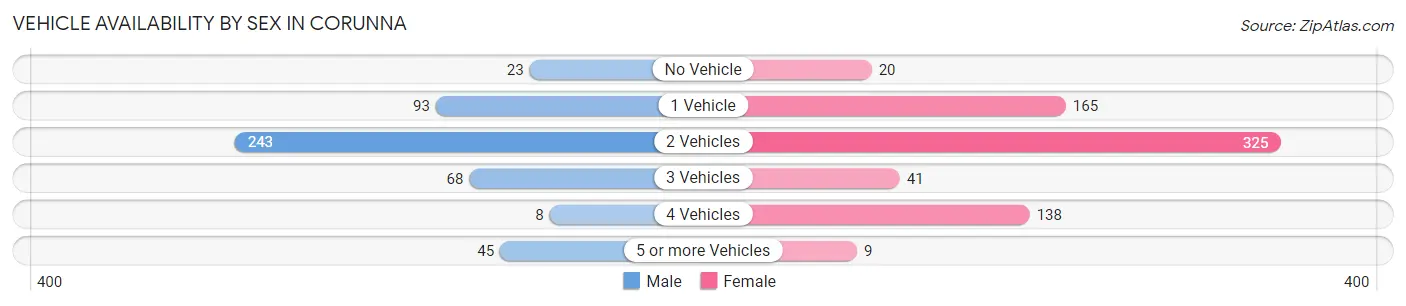
| Vehicles Available | Male | Female |
| No Vehicle | 23 (4.8%) | 20 (2.9%) |
| 1 Vehicle | 93 (19.4%) | 165 (23.6%) |
| 2 Vehicles | 243 (50.6%) | 325 (46.6%) |
| 3 Vehicles | 68 (14.2%) | 41 (5.9%) |
| 4 Vehicles | 8 (1.7%) | 138 (19.8%) |
| 5 or more Vehicles | 45 (9.4%) | 9 (1.3%) |
| Total | 480 (100.0%) | 698 (100.0%) |
Commute Time in Corunna
The most frequently occuring commute durations in Corunna are 10 to 14 minutes (301 commuters, 26.0%), 5 to 9 minutes (194 commuters, 16.8%), and 45 to 59 minutes (175 commuters, 15.1%).
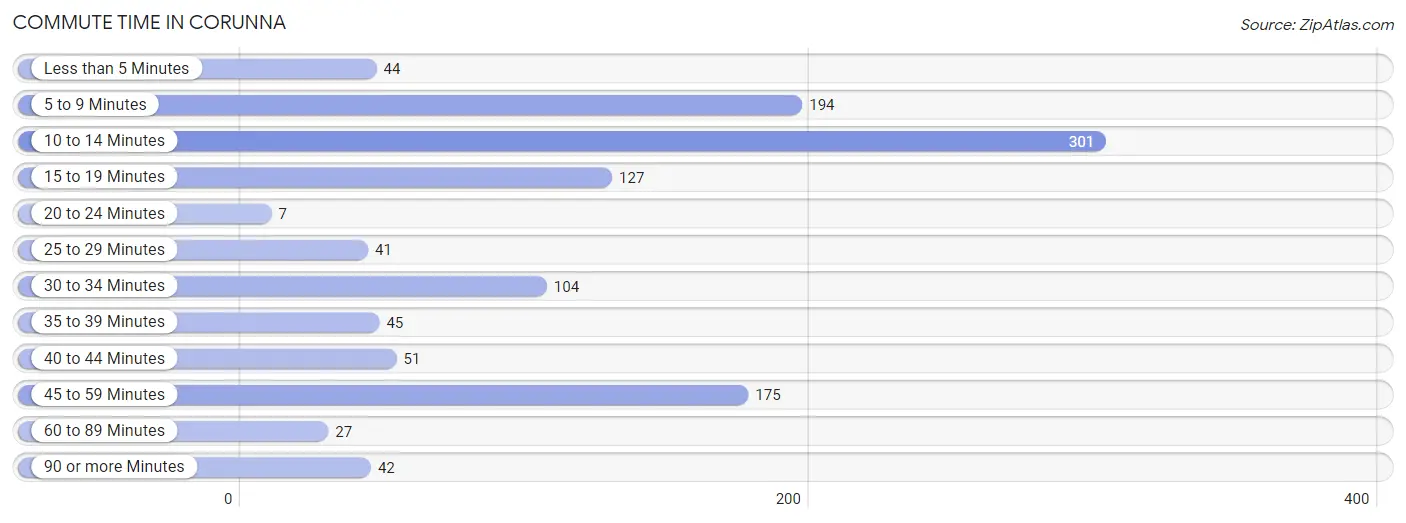
| Commute Time | # Commuters | % Commuters |
| Less than 5 Minutes | 44 | 3.8% |
| 5 to 9 Minutes | 194 | 16.8% |
| 10 to 14 Minutes | 301 | 26.0% |
| 15 to 19 Minutes | 127 | 11.0% |
| 20 to 24 Minutes | 7 | 0.6% |
| 25 to 29 Minutes | 41 | 3.5% |
| 30 to 34 Minutes | 104 | 9.0% |
| 35 to 39 Minutes | 45 | 3.9% |
| 40 to 44 Minutes | 51 | 4.4% |
| 45 to 59 Minutes | 175 | 15.1% |
| 60 to 89 Minutes | 27 | 2.3% |
| 90 or more Minutes | 42 | 3.6% |
Commute Time by Sex in Corunna
The most common commute times in Corunna are 10 to 14 minutes (153 commuters, 32.5%) for males and 10 to 14 minutes (148 commuters, 21.5%) for females.
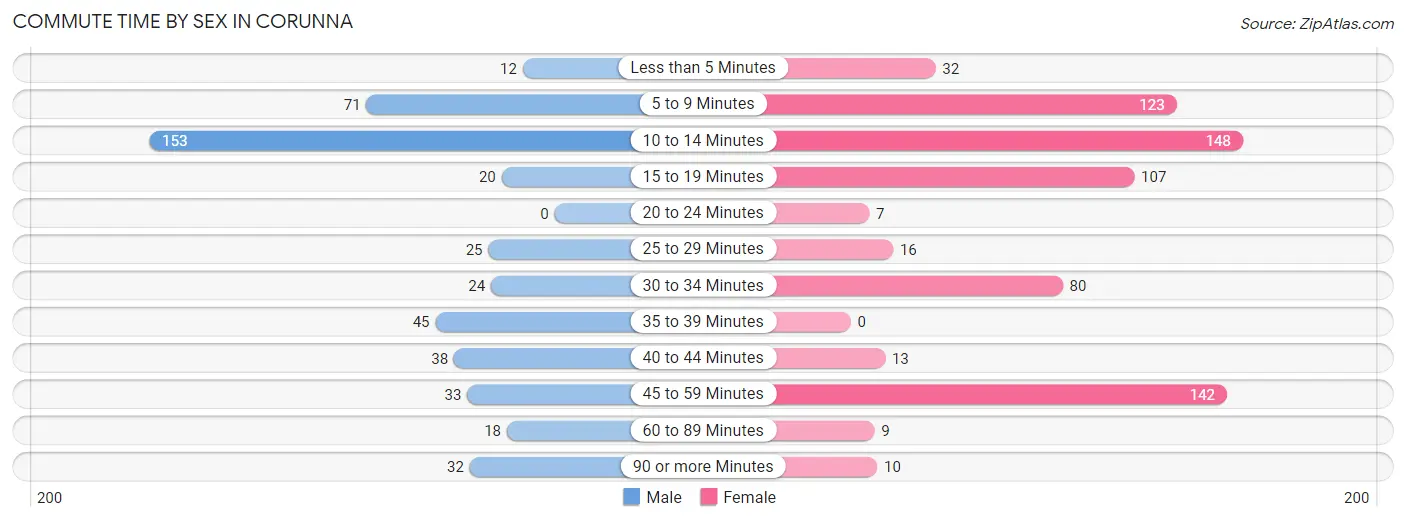
| Commute Time | Male | Female |
| Less than 5 Minutes | 12 (2.5%) | 32 (4.7%) |
| 5 to 9 Minutes | 71 (15.1%) | 123 (17.9%) |
| 10 to 14 Minutes | 153 (32.5%) | 148 (21.5%) |
| 15 to 19 Minutes | 20 (4.3%) | 107 (15.6%) |
| 20 to 24 Minutes | 0 (0.0%) | 7 (1.0%) |
| 25 to 29 Minutes | 25 (5.3%) | 16 (2.3%) |
| 30 to 34 Minutes | 24 (5.1%) | 80 (11.6%) |
| 35 to 39 Minutes | 45 (9.6%) | 0 (0.0%) |
| 40 to 44 Minutes | 38 (8.1%) | 13 (1.9%) |
| 45 to 59 Minutes | 33 (7.0%) | 142 (20.7%) |
| 60 to 89 Minutes | 18 (3.8%) | 9 (1.3%) |
| 90 or more Minutes | 32 (6.8%) | 10 (1.5%) |
Time of Departure to Work by Sex in Corunna
The most frequent times of departure to work in Corunna are 7:00 AM to 7:29 AM (101, 21.4%) for males and 7:00 AM to 7:29 AM (176, 25.6%) for females.
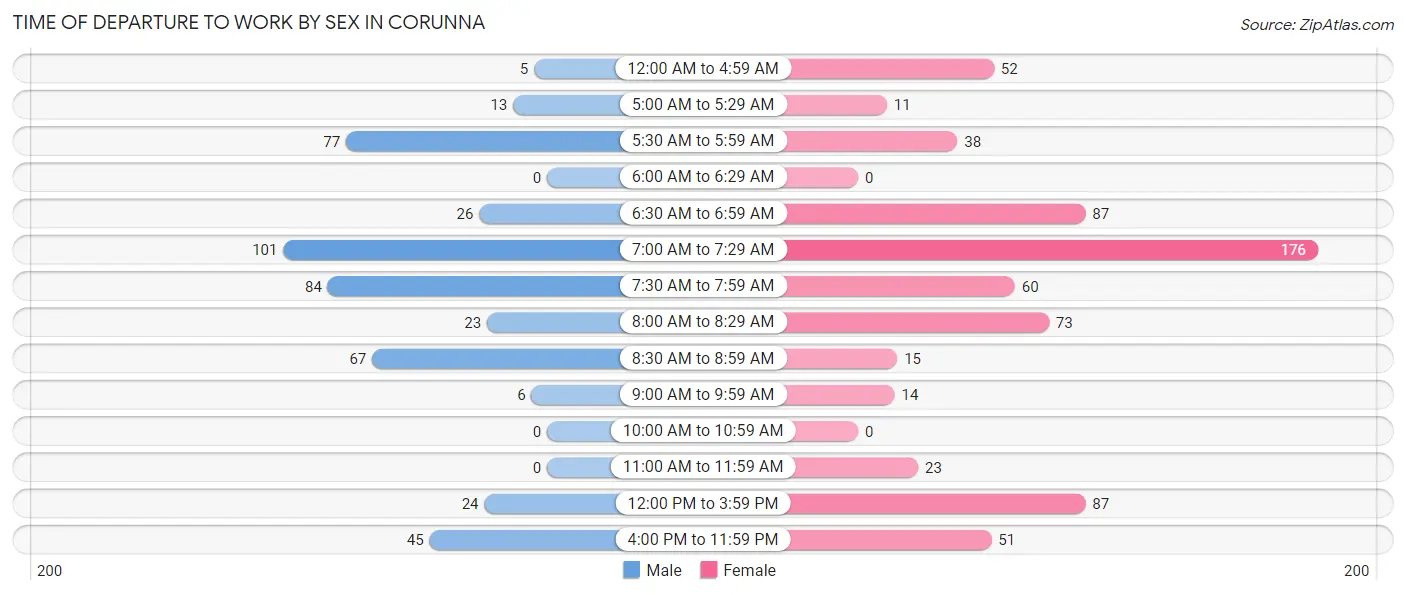
| Time of Departure | Male | Female |
| 12:00 AM to 4:59 AM | 5 (1.1%) | 52 (7.6%) |
| 5:00 AM to 5:29 AM | 13 (2.8%) | 11 (1.6%) |
| 5:30 AM to 5:59 AM | 77 (16.4%) | 38 (5.5%) |
| 6:00 AM to 6:29 AM | 0 (0.0%) | 0 (0.0%) |
| 6:30 AM to 6:59 AM | 26 (5.5%) | 87 (12.7%) |
| 7:00 AM to 7:29 AM | 101 (21.4%) | 176 (25.6%) |
| 7:30 AM to 7:59 AM | 84 (17.8%) | 60 (8.7%) |
| 8:00 AM to 8:29 AM | 23 (4.9%) | 73 (10.6%) |
| 8:30 AM to 8:59 AM | 67 (14.2%) | 15 (2.2%) |
| 9:00 AM to 9:59 AM | 6 (1.3%) | 14 (2.0%) |
| 10:00 AM to 10:59 AM | 0 (0.0%) | 0 (0.0%) |
| 11:00 AM to 11:59 AM | 0 (0.0%) | 23 (3.4%) |
| 12:00 PM to 3:59 PM | 24 (5.1%) | 87 (12.7%) |
| 4:00 PM to 11:59 PM | 45 (9.6%) | 51 (7.4%) |
| Total | 471 (100.0%) | 687 (100.0%) |
Housing Occupancy in Corunna
Occupancy by Ownership in Corunna
Of the total 1,403 dwellings in Corunna, owner-occupied units account for 774 (55.2%), while renter-occupied units make up 629 (44.8%).
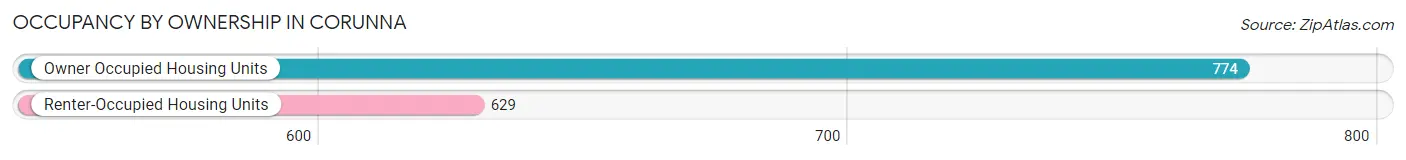
| Occupancy | # Housing Units | % Housing Units |
| Owner Occupied Housing Units | 774 | 55.2% |
| Renter-Occupied Housing Units | 629 | 44.8% |
| Total Occupied Housing Units | 1,403 | 100.0% |
Occupancy by Household Size in Corunna
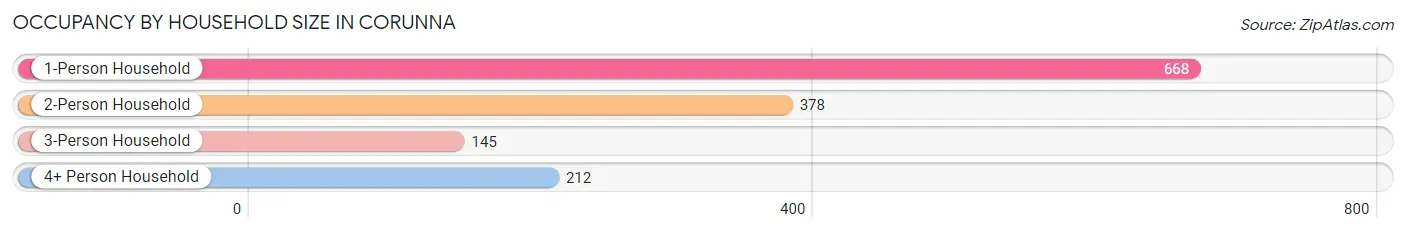
| Household Size | # Housing Units | % Housing Units |
| 1-Person Household | 668 | 47.6% |
| 2-Person Household | 378 | 26.9% |
| 3-Person Household | 145 | 10.3% |
| 4+ Person Household | 212 | 15.1% |
| Total Housing Units | 1,403 | 100.0% |
Occupancy by Ownership by Household Size in Corunna
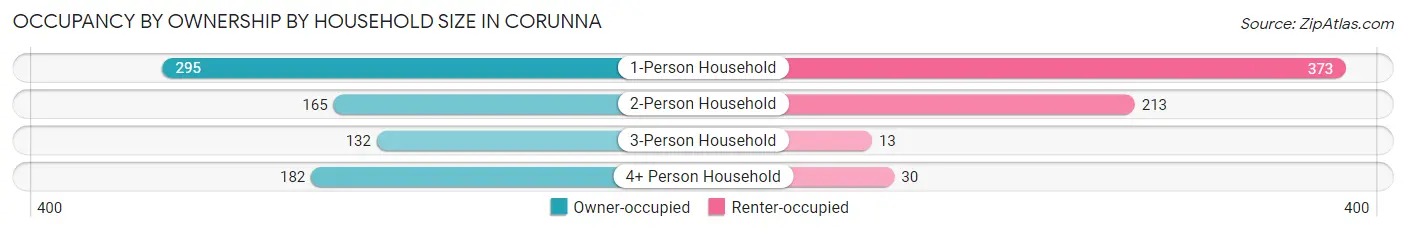
| Household Size | Owner-occupied | Renter-occupied |
| 1-Person Household | 295 (44.2%) | 373 (55.8%) |
| 2-Person Household | 165 (43.6%) | 213 (56.4%) |
| 3-Person Household | 132 (91.0%) | 13 (9.0%) |
| 4+ Person Household | 182 (85.9%) | 30 (14.1%) |
| Total Housing Units | 774 (55.2%) | 629 (44.8%) |
Occupancy by Educational Attainment in Corunna
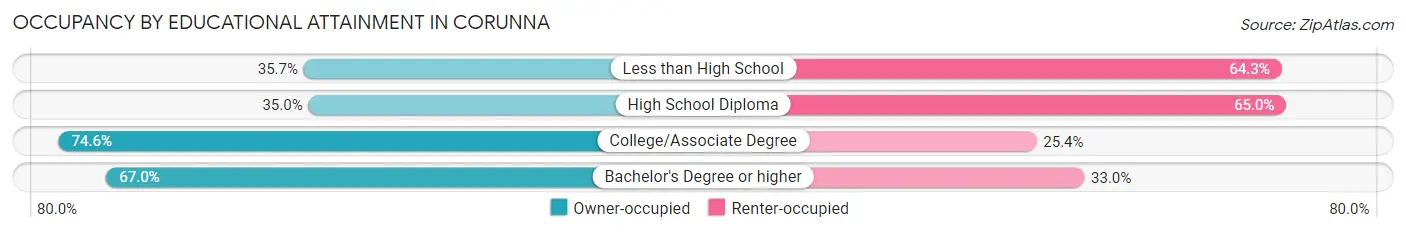
| Household Size | Owner-occupied | Renter-occupied |
| Less than High School | 15 (35.7%) | 27 (64.3%) |
| High School Diploma | 207 (35.0%) | 385 (65.0%) |
| College/Associate Degree | 361 (74.6%) | 123 (25.4%) |
| Bachelor's Degree or higher | 191 (67.0%) | 94 (33.0%) |
Occupancy by Age of Householder in Corunna
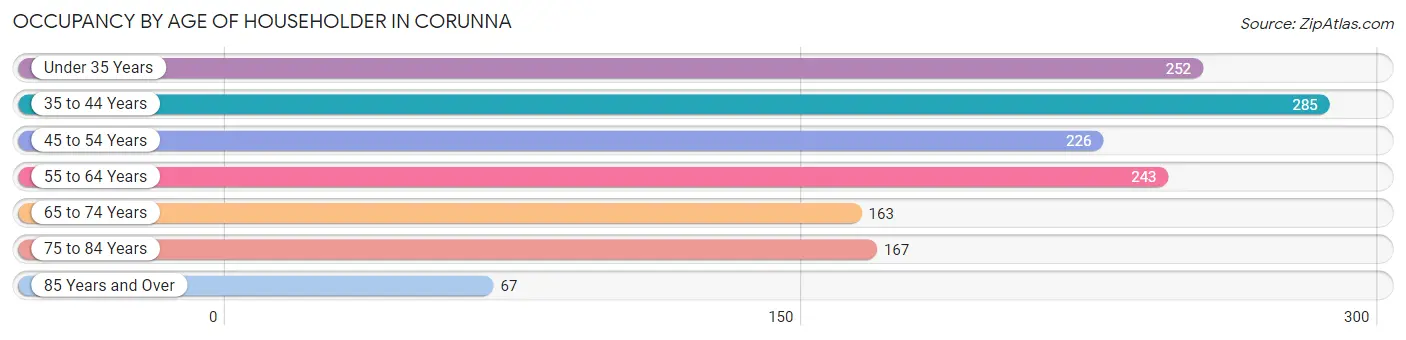
| Age Bracket | # Households | % Households |
| Under 35 Years | 252 | 18.0% |
| 35 to 44 Years | 285 | 20.3% |
| 45 to 54 Years | 226 | 16.1% |
| 55 to 64 Years | 243 | 17.3% |
| 65 to 74 Years | 163 | 11.6% |
| 75 to 84 Years | 167 | 11.9% |
| 85 Years and Over | 67 | 4.8% |
| Total | 1,403 | 100.0% |
Housing Finances in Corunna
Median Income by Occupancy in Corunna
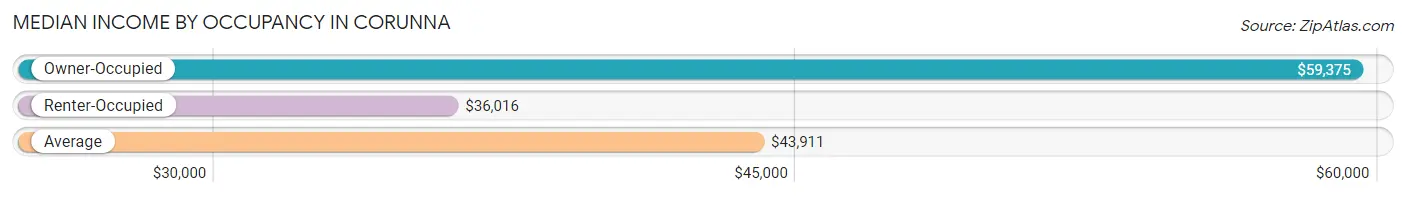
| Occupancy Type | # Households | Median Income |
| Owner-Occupied | 774 (55.2%) | $59,375 |
| Renter-Occupied | 629 (44.8%) | $36,016 |
| Average | 1,403 (100.0%) | $43,911 |
Occupancy by Householder Income Bracket in Corunna
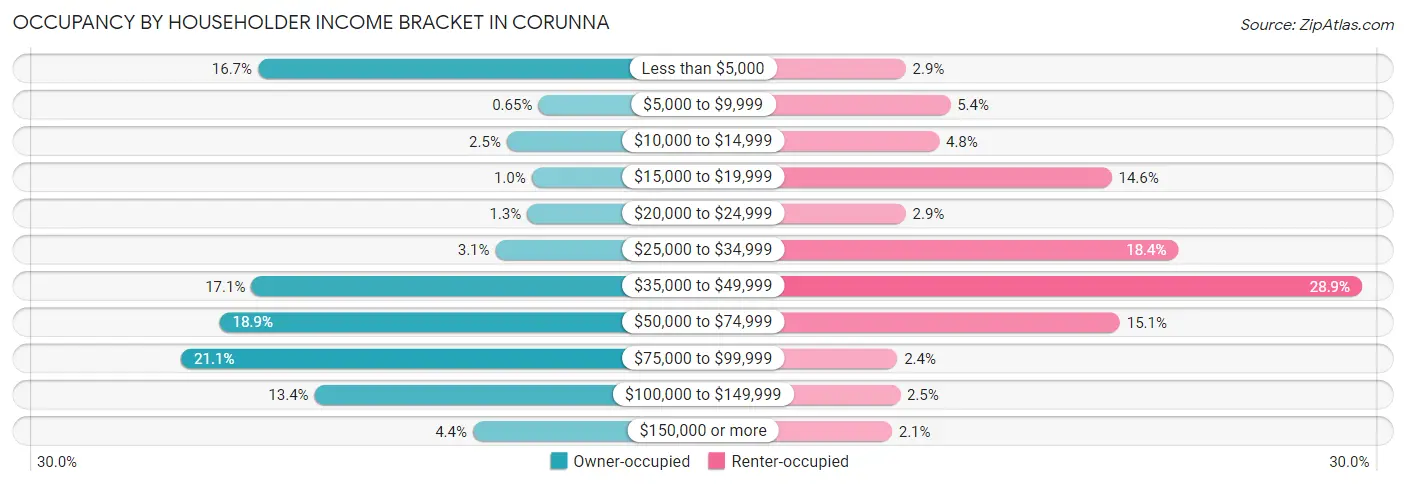
| Income Bracket | Owner-occupied | Renter-occupied |
| Less than $5,000 | 129 (16.7%) | 18 (2.9%) |
| $5,000 to $9,999 | 5 (0.6%) | 34 (5.4%) |
| $10,000 to $14,999 | 19 (2.5%) | 30 (4.8%) |
| $15,000 to $19,999 | 8 (1.0%) | 92 (14.6%) |
| $20,000 to $24,999 | 10 (1.3%) | 18 (2.9%) |
| $25,000 to $34,999 | 24 (3.1%) | 116 (18.4%) |
| $35,000 to $49,999 | 132 (17.1%) | 182 (28.9%) |
| $50,000 to $74,999 | 146 (18.9%) | 95 (15.1%) |
| $75,000 to $99,999 | 163 (21.1%) | 15 (2.4%) |
| $100,000 to $149,999 | 104 (13.4%) | 16 (2.5%) |
| $150,000 or more | 34 (4.4%) | 13 (2.1%) |
| Total | 774 (100.0%) | 629 (100.0%) |
Monthly Housing Cost Tiers in Corunna
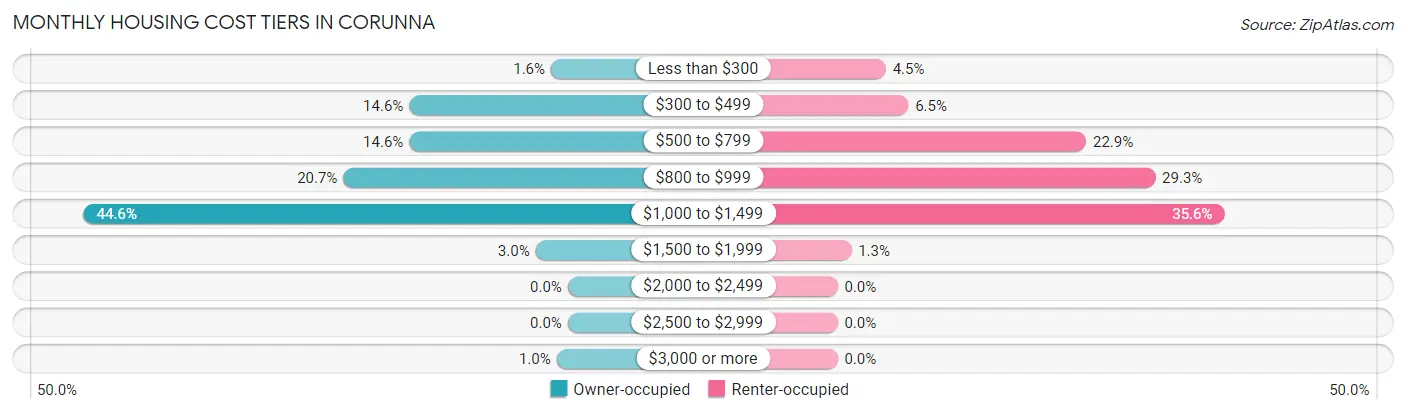
| Monthly Cost | Owner-occupied | Renter-occupied |
| Less than $300 | 12 (1.5%) | 28 (4.4%) |
| $300 to $499 | 113 (14.6%) | 41 (6.5%) |
| $500 to $799 | 113 (14.6%) | 144 (22.9%) |
| $800 to $999 | 160 (20.7%) | 184 (29.2%) |
| $1,000 to $1,499 | 345 (44.6%) | 224 (35.6%) |
| $1,500 to $1,999 | 23 (3.0%) | 8 (1.3%) |
| $2,000 to $2,499 | 0 (0.0%) | 0 (0.0%) |
| $2,500 to $2,999 | 0 (0.0%) | 0 (0.0%) |
| $3,000 or more | 8 (1.0%) | 0 (0.0%) |
| Total | 774 (100.0%) | 629 (100.0%) |
Physical Housing Characteristics in Corunna
Housing Structures in Corunna
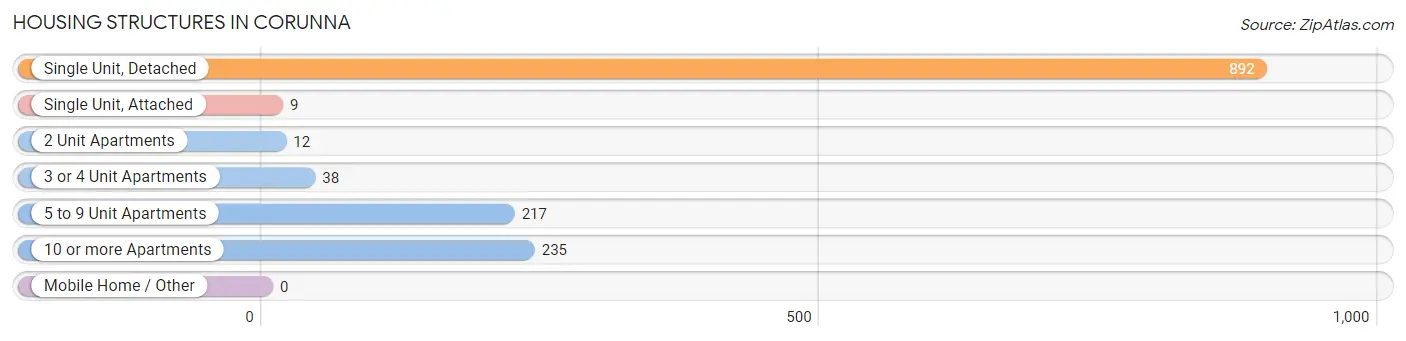
| Structure Type | # Housing Units | % Housing Units |
| Single Unit, Detached | 892 | 63.6% |
| Single Unit, Attached | 9 | 0.6% |
| 2 Unit Apartments | 12 | 0.9% |
| 3 or 4 Unit Apartments | 38 | 2.7% |
| 5 to 9 Unit Apartments | 217 | 15.5% |
| 10 or more Apartments | 235 | 16.8% |
| Mobile Home / Other | 0 | 0.0% |
| Total | 1,403 | 100.0% |
Housing Structures by Occupancy in Corunna
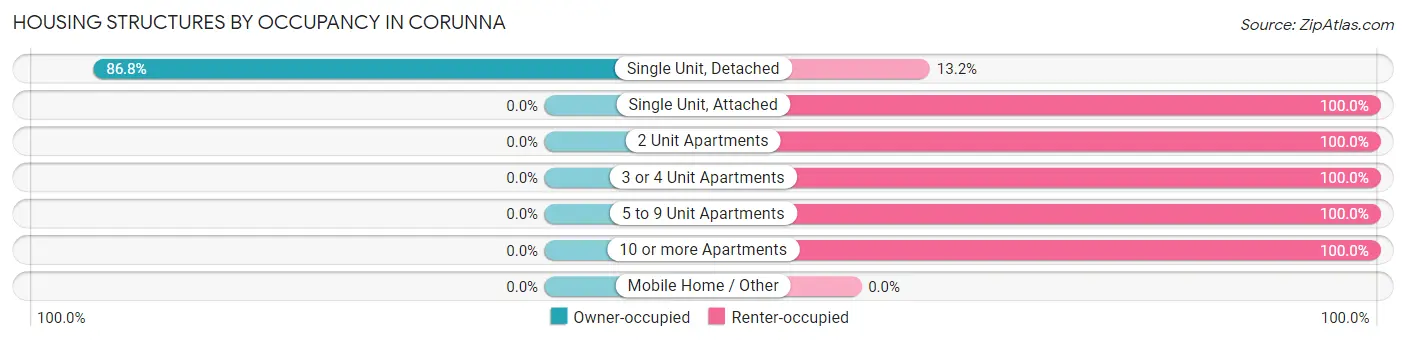
| Structure Type | Owner-occupied | Renter-occupied |
| Single Unit, Detached | 774 (86.8%) | 118 (13.2%) |
| Single Unit, Attached | 0 (0.0%) | 9 (100.0%) |
| 2 Unit Apartments | 0 (0.0%) | 12 (100.0%) |
| 3 or 4 Unit Apartments | 0 (0.0%) | 38 (100.0%) |
| 5 to 9 Unit Apartments | 0 (0.0%) | 217 (100.0%) |
| 10 or more Apartments | 0 (0.0%) | 235 (100.0%) |
| Mobile Home / Other | 0 (0.0%) | 0 (0.0%) |
| Total | 774 (55.2%) | 629 (44.8%) |
Housing Structures by Number of Rooms in Corunna
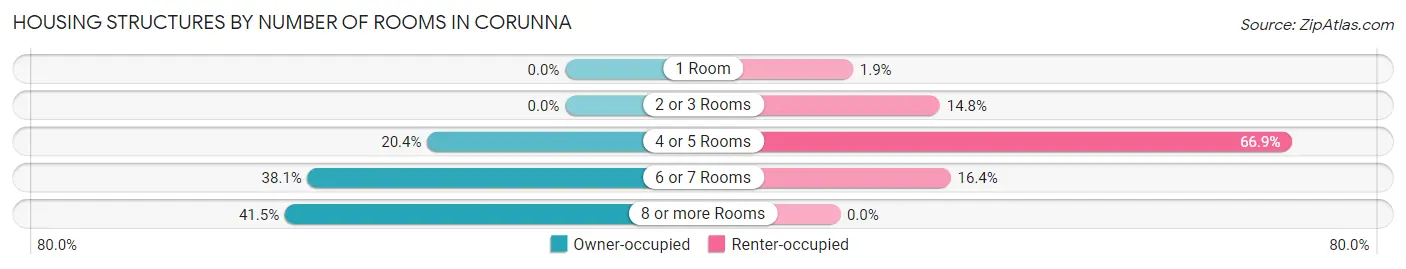
| Number of Rooms | Owner-occupied | Renter-occupied |
| 1 Room | 0 (0.0%) | 12 (1.9%) |
| 2 or 3 Rooms | 0 (0.0%) | 93 (14.8%) |
| 4 or 5 Rooms | 158 (20.4%) | 421 (66.9%) |
| 6 or 7 Rooms | 295 (38.1%) | 103 (16.4%) |
| 8 or more Rooms | 321 (41.5%) | 0 (0.0%) |
| Total | 774 (100.0%) | 629 (100.0%) |
Housing Structure by Heating Type in Corunna
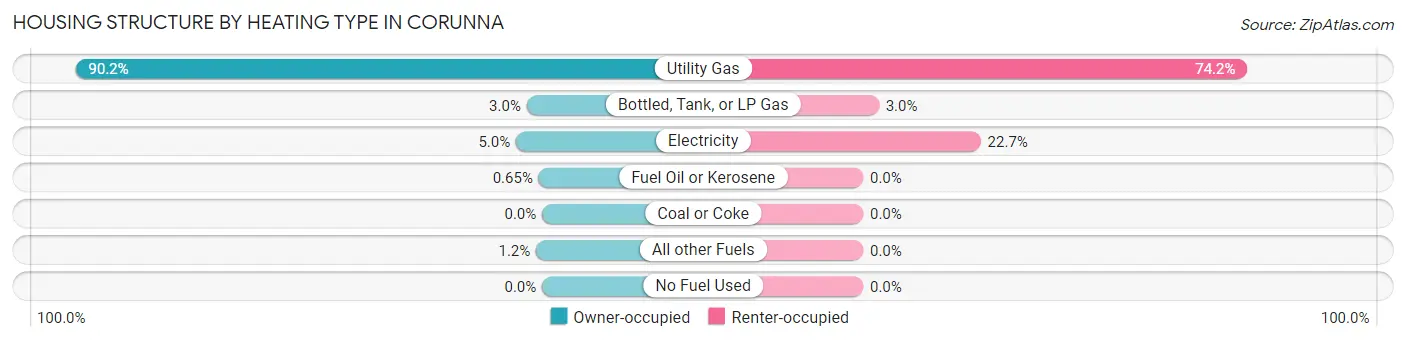
| Heating Type | Owner-occupied | Renter-occupied |
| Utility Gas | 698 (90.2%) | 467 (74.2%) |
| Bottled, Tank, or LP Gas | 23 (3.0%) | 19 (3.0%) |
| Electricity | 39 (5.0%) | 143 (22.7%) |
| Fuel Oil or Kerosene | 5 (0.6%) | 0 (0.0%) |
| Coal or Coke | 0 (0.0%) | 0 (0.0%) |
| All other Fuels | 9 (1.2%) | 0 (0.0%) |
| No Fuel Used | 0 (0.0%) | 0 (0.0%) |
| Total | 774 (100.0%) | 629 (100.0%) |
Household Vehicle Usage in Corunna
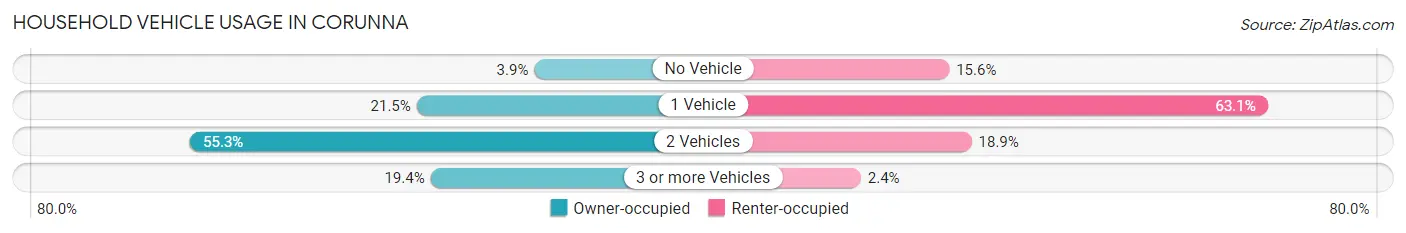
| Vehicles per Household | Owner-occupied | Renter-occupied |
| No Vehicle | 30 (3.9%) | 98 (15.6%) |
| 1 Vehicle | 166 (21.4%) | 397 (63.1%) |
| 2 Vehicles | 428 (55.3%) | 119 (18.9%) |
| 3 or more Vehicles | 150 (19.4%) | 15 (2.4%) |
| Total | 774 (100.0%) | 629 (100.0%) |
Real Estate & Mortgages in Corunna
Real Estate and Mortgage Overview in Corunna
| Characteristic | Without Mortgage | With Mortgage |
| Housing Units | 263 | 511 |
| Median Property Value | $142,500 | $139,000 |
| Median Household Income | $58,438 | $28 |
| Monthly Housing Costs | $634 | $8 |
| Real Estate Taxes | $2,637 | $0 |
Property Value by Mortgage Status in Corunna
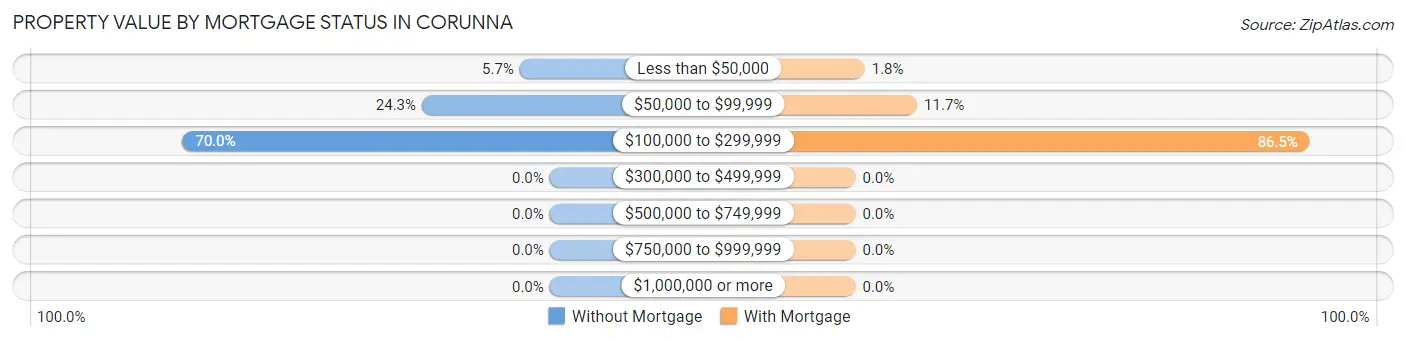
| Property Value | Without Mortgage | With Mortgage |
| Less than $50,000 | 15 (5.7%) | 9 (1.8%) |
| $50,000 to $99,999 | 64 (24.3%) | 60 (11.7%) |
| $100,000 to $299,999 | 184 (70.0%) | 442 (86.5%) |
| $300,000 to $499,999 | 0 (0.0%) | 0 (0.0%) |
| $500,000 to $749,999 | 0 (0.0%) | 0 (0.0%) |
| $750,000 to $999,999 | 0 (0.0%) | 0 (0.0%) |
| $1,000,000 or more | 0 (0.0%) | 0 (0.0%) |
| Total | 263 (100.0%) | 511 (100.0%) |
Household Income by Mortgage Status in Corunna
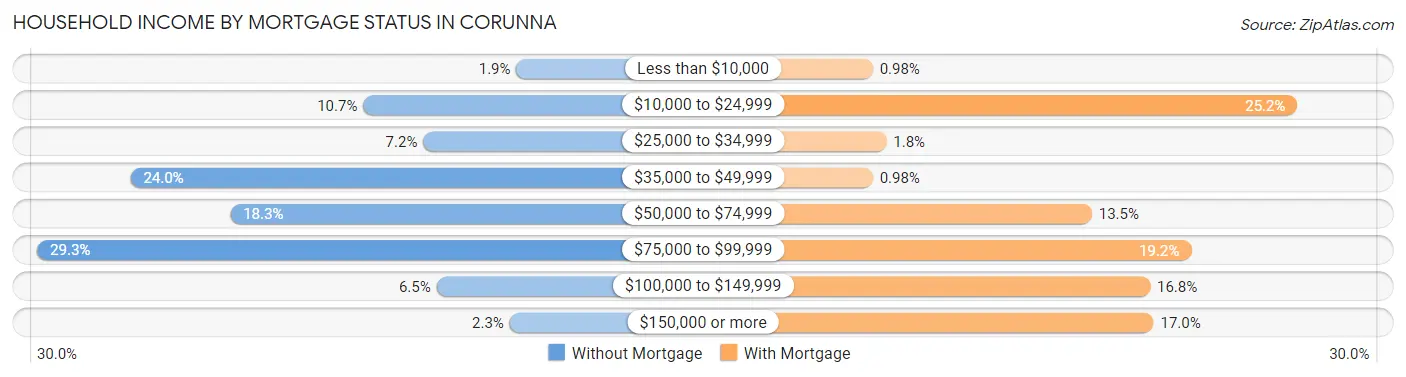
| Household Income | Without Mortgage | With Mortgage |
| Less than $10,000 | 5 (1.9%) | 5 (1.0%) |
| $10,000 to $24,999 | 28 (10.6%) | 129 (25.2%) |
| $25,000 to $34,999 | 19 (7.2%) | 9 (1.8%) |
| $35,000 to $49,999 | 63 (23.9%) | 5 (1.0%) |
| $50,000 to $74,999 | 48 (18.2%) | 69 (13.5%) |
| $75,000 to $99,999 | 77 (29.3%) | 98 (19.2%) |
| $100,000 to $149,999 | 17 (6.5%) | 86 (16.8%) |
| $150,000 or more | 6 (2.3%) | 87 (17.0%) |
| Total | 263 (100.0%) | 511 (100.0%) |
Property Value to Household Income Ratio in Corunna
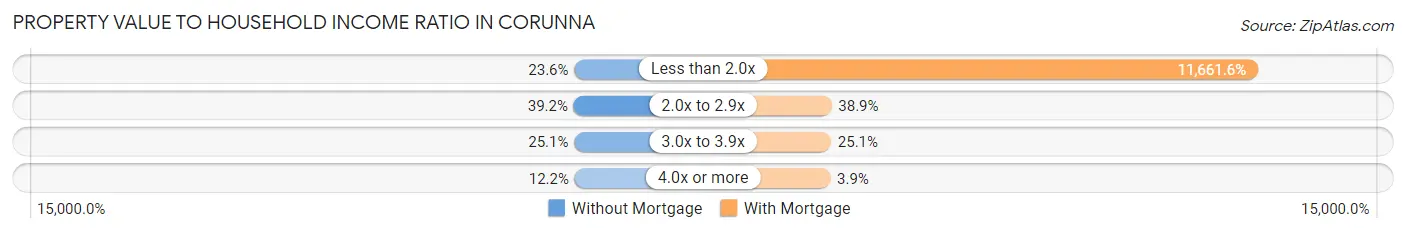
| Value-to-Income Ratio | Without Mortgage | With Mortgage |
| Less than 2.0x | 62 (23.6%) | 59,591 (11,661.6%) |
| 2.0x to 2.9x | 103 (39.2%) | 199 (38.9%) |
| 3.0x to 3.9x | 66 (25.1%) | 128 (25.1%) |
| 4.0x or more | 32 (12.2%) | 20 (3.9%) |
| Total | 263 (100.0%) | 511 (100.0%) |
Real Estate Taxes by Mortgage Status in Corunna
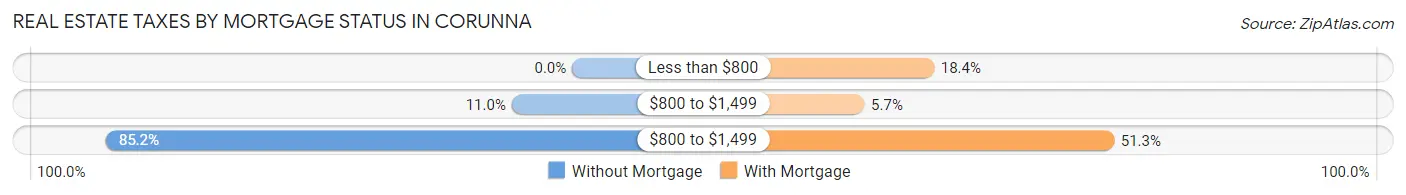
| Property Taxes | Without Mortgage | With Mortgage |
| Less than $800 | 0 (0.0%) | 94 (18.4%) |
| $800 to $1,499 | 29 (11.0%) | 29 (5.7%) |
| $800 to $1,499 | 224 (85.2%) | 262 (51.3%) |
| Total | 263 (100.0%) | 511 (100.0%) |
Health & Disability in Corunna
Health Insurance Coverage by Age in Corunna
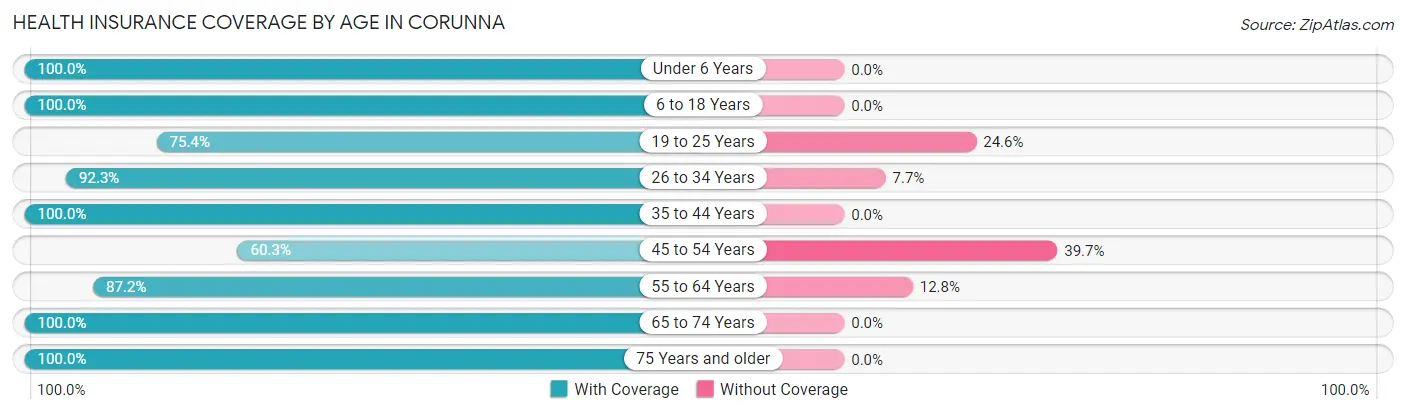
| Age Bracket | With Coverage | Without Coverage |
| Under 6 Years | 291 (100.0%) | 0 (0.0%) |
| 6 to 18 Years | 516 (100.0%) | 0 (0.0%) |
| 19 to 25 Years | 98 (75.4%) | 32 (24.6%) |
| 26 to 34 Years | 335 (92.3%) | 28 (7.7%) |
| 35 to 44 Years | 439 (100.0%) | 0 (0.0%) |
| 45 to 54 Years | 170 (60.3%) | 112 (39.7%) |
| 55 to 64 Years | 280 (87.2%) | 41 (12.8%) |
| 65 to 74 Years | 225 (100.0%) | 0 (0.0%) |
| 75 Years and older | 265 (100.0%) | 0 (0.0%) |
| Total | 2,619 (92.5%) | 213 (7.5%) |
Health Insurance Coverage by Citizenship Status in Corunna
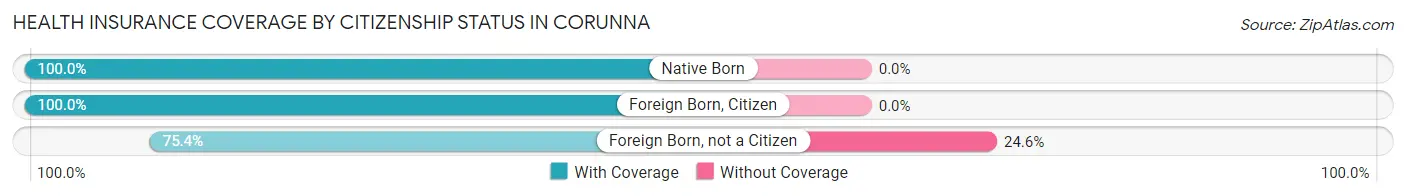
| Citizenship Status | With Coverage | Without Coverage |
| Native Born | 291 (100.0%) | 0 (0.0%) |
| Foreign Born, Citizen | 516 (100.0%) | 0 (0.0%) |
| Foreign Born, not a Citizen | 98 (75.4%) | 32 (24.6%) |
Health Insurance Coverage by Household Income in Corunna

| Household Income | With Coverage | Without Coverage |
| Under $25,000 | 465 (95.3%) | 23 (4.7%) |
| $25,000 to $49,999 | 673 (92.2%) | 57 (7.8%) |
| $50,000 to $74,999 | 597 (90.3%) | 64 (9.7%) |
| $75,000 to $99,999 | 474 (93.7%) | 32 (6.3%) |
| $100,000 and over | 410 (91.7%) | 37 (8.3%) |
Public vs Private Health Insurance Coverage by Age in Corunna
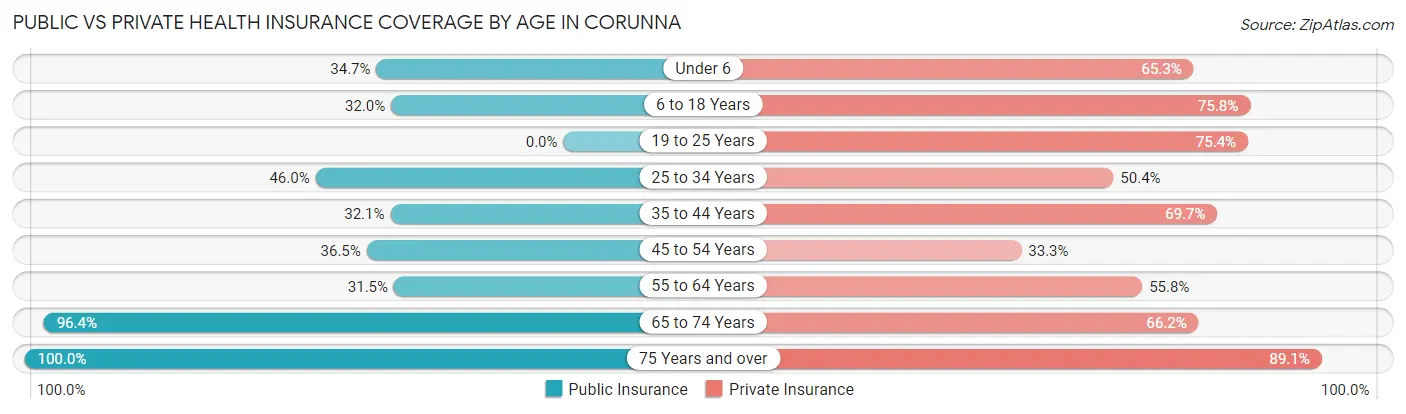
| Age Bracket | Public Insurance | Private Insurance |
| Under 6 | 101 (34.7%) | 190 (65.3%) |
| 6 to 18 Years | 165 (32.0%) | 391 (75.8%) |
| 19 to 25 Years | 0 (0.0%) | 98 (75.4%) |
| 25 to 34 Years | 167 (46.0%) | 183 (50.4%) |
| 35 to 44 Years | 141 (32.1%) | 306 (69.7%) |
| 45 to 54 Years | 103 (36.5%) | 94 (33.3%) |
| 55 to 64 Years | 101 (31.5%) | 179 (55.8%) |
| 65 to 74 Years | 217 (96.4%) | 149 (66.2%) |
| 75 Years and over | 265 (100.0%) | 236 (89.1%) |
| Total | 1,260 (44.5%) | 1,826 (64.5%) |
Disability Status by Sex by Age in Corunna
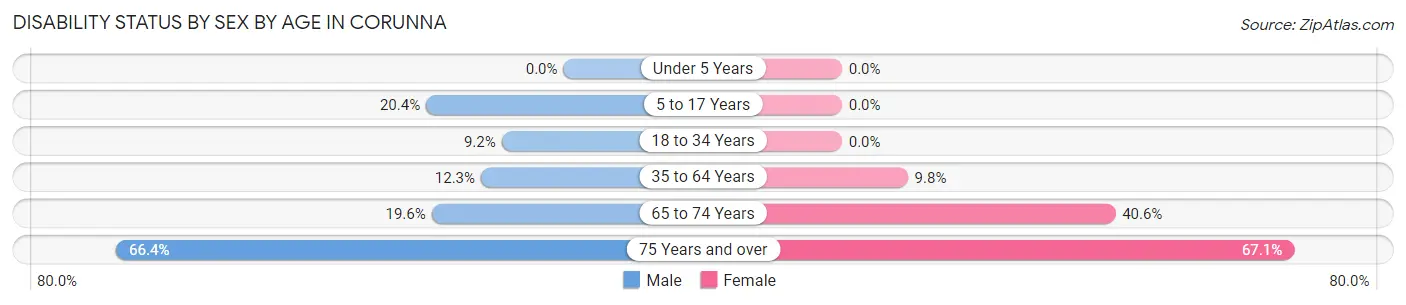
| Age Bracket | Male | Female |
| Under 5 Years | 0 (0.0%) | 0 (0.0%) |
| 5 to 17 Years | 72 (20.4%) | 0 (0.0%) |
| 18 to 34 Years | 28 (9.2%) | 0 (0.0%) |
| 35 to 64 Years | 50 (12.2%) | 62 (9.8%) |
| 65 to 74 Years | 18 (19.6%) | 54 (40.6%) |
| 75 Years and over | 83 (66.4%) | 94 (67.1%) |
Disability Class by Sex by Age in Corunna
Disability Class: Hearing Difficulty
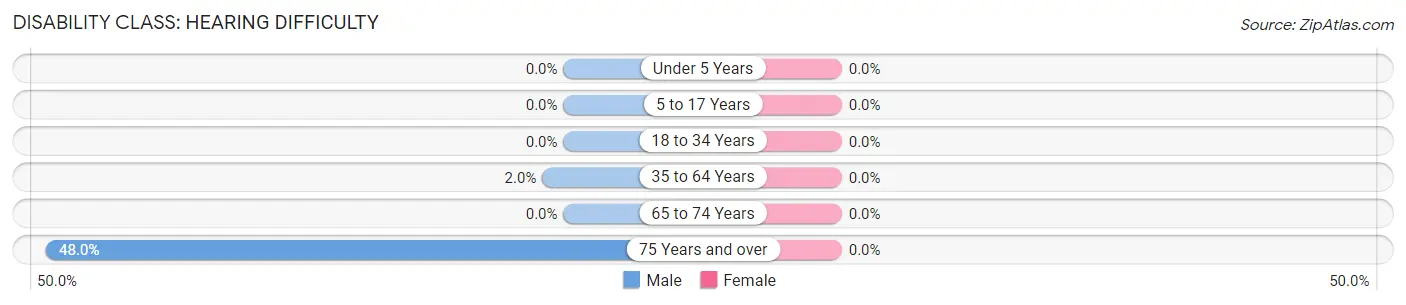
| Age Bracket | Male | Female |
| Under 5 Years | 0 (0.0%) | 0 (0.0%) |
| 5 to 17 Years | 0 (0.0%) | 0 (0.0%) |
| 18 to 34 Years | 0 (0.0%) | 0 (0.0%) |
| 35 to 64 Years | 8 (2.0%) | 0 (0.0%) |
| 65 to 74 Years | 0 (0.0%) | 0 (0.0%) |
| 75 Years and over | 60 (48.0%) | 0 (0.0%) |
Disability Class: Vision Difficulty
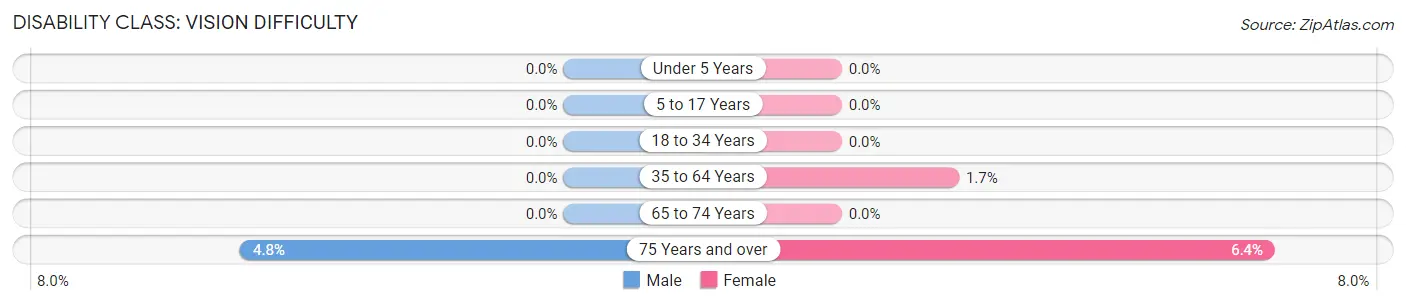
| Age Bracket | Male | Female |
| Under 5 Years | 0 (0.0%) | 0 (0.0%) |
| 5 to 17 Years | 0 (0.0%) | 0 (0.0%) |
| 18 to 34 Years | 0 (0.0%) | 0 (0.0%) |
| 35 to 64 Years | 0 (0.0%) | 11 (1.7%) |
| 65 to 74 Years | 0 (0.0%) | 0 (0.0%) |
| 75 Years and over | 6 (4.8%) | 9 (6.4%) |
Disability Class: Cognitive Difficulty
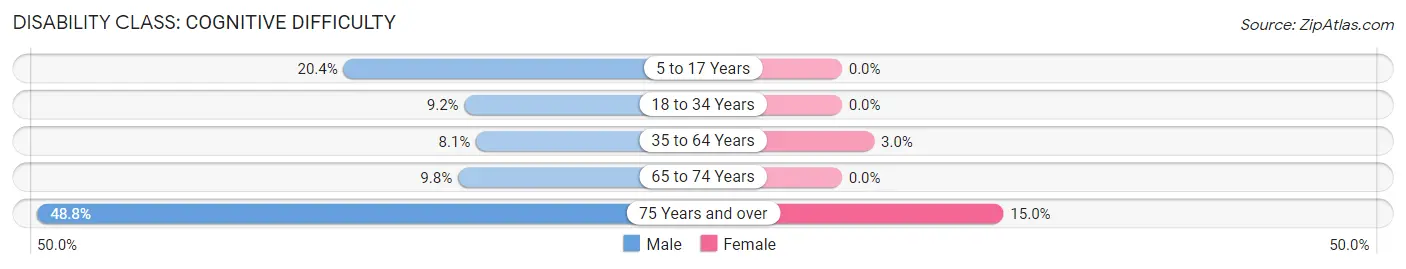
| Age Bracket | Male | Female |
| 5 to 17 Years | 72 (20.4%) | 0 (0.0%) |
| 18 to 34 Years | 28 (9.2%) | 0 (0.0%) |
| 35 to 64 Years | 33 (8.1%) | 19 (3.0%) |
| 65 to 74 Years | 9 (9.8%) | 0 (0.0%) |
| 75 Years and over | 61 (48.8%) | 21 (15.0%) |
Disability Class: Ambulatory Difficulty
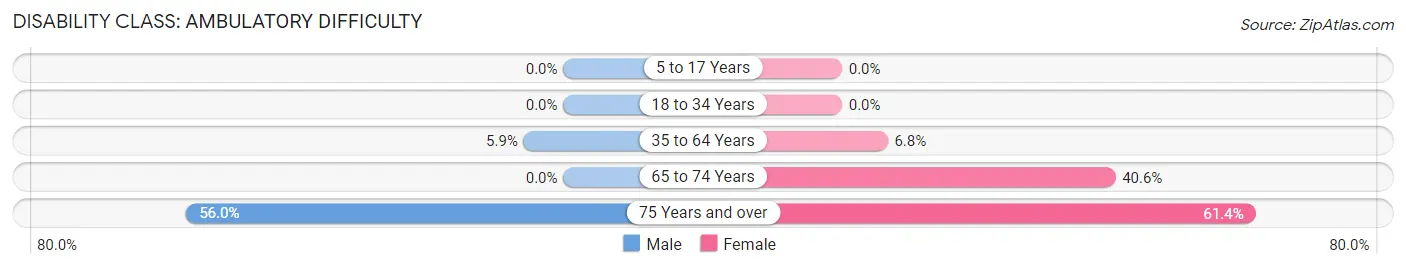
| Age Bracket | Male | Female |
| 5 to 17 Years | 0 (0.0%) | 0 (0.0%) |
| 18 to 34 Years | 0 (0.0%) | 0 (0.0%) |
| 35 to 64 Years | 24 (5.9%) | 43 (6.8%) |
| 65 to 74 Years | 0 (0.0%) | 54 (40.6%) |
| 75 Years and over | 70 (56.0%) | 86 (61.4%) |
Disability Class: Self-Care Difficulty
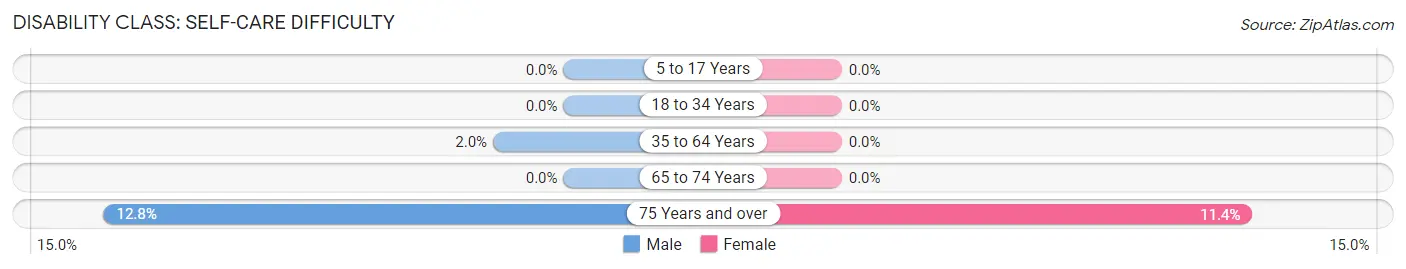
| Age Bracket | Male | Female |
| 5 to 17 Years | 0 (0.0%) | 0 (0.0%) |
| 18 to 34 Years | 0 (0.0%) | 0 (0.0%) |
| 35 to 64 Years | 8 (2.0%) | 0 (0.0%) |
| 65 to 74 Years | 0 (0.0%) | 0 (0.0%) |
| 75 Years and over | 16 (12.8%) | 16 (11.4%) |
Technology Access in Corunna
Computing Device Access in Corunna
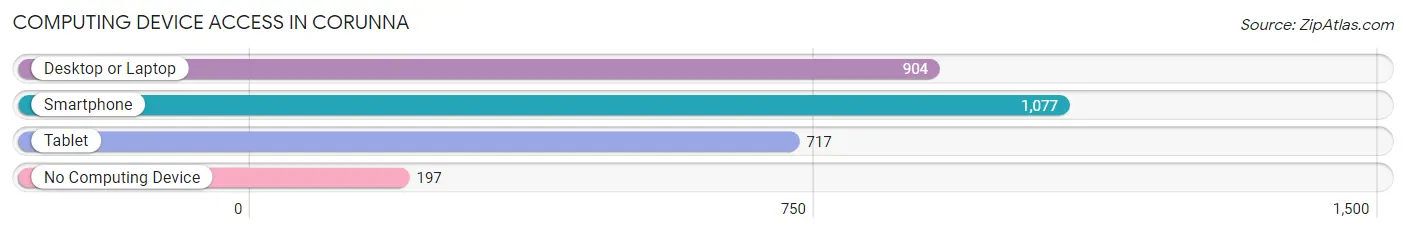
| Device Type | # Households | % Households |
| Desktop or Laptop | 904 | 64.4% |
| Smartphone | 1,077 | 76.8% |
| Tablet | 717 | 51.1% |
| No Computing Device | 197 | 14.0% |
| Total | 1,403 | 100.0% |
Internet Access in Corunna
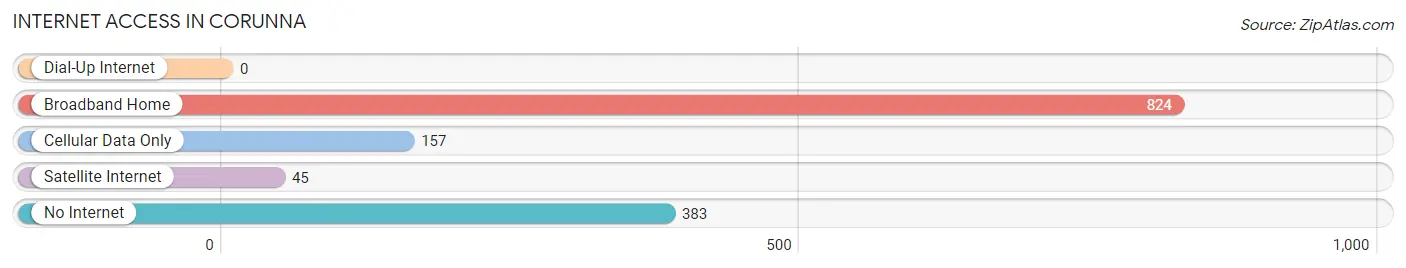
| Internet Type | # Households | % Households |
| Dial-Up Internet | 0 | 0.0% |
| Broadband Home | 824 | 58.7% |
| Cellular Data Only | 157 | 11.2% |
| Satellite Internet | 45 | 3.2% |
| No Internet | 383 | 27.3% |
| Total | 1,403 | 100.0% |
Corunna Summary
Corunna, Michigan is a small city located in Shiawassee County in the southeastern part of the state. It is situated on the Shiawassee River, about 25 miles northeast of Lansing, the state capital. The city has a population of about 4,000 people and is part of the Owosso-Corunna Metropolitan Statistical Area.
History
Corunna was first settled in 1836 by a group of settlers from New York. The city was named after Corunna, Spain, which was the site of a famous battle during the Napoleonic Wars. The city was incorporated in 1871 and has since grown to become a thriving community.
Geography
Corunna is located in the southeastern part of Michigan, about 25 miles northeast of Lansing. The city is situated on the Shiawassee River and is surrounded by rolling hills and farmland. The city has a total area of 4.2 square miles, all of which is land.
Economy
Corunna’s economy is largely based on agriculture and manufacturing. The city is home to several large manufacturing companies, including Corunna Manufacturing, Corunna Tool & Die, and Corunna Automotive. The city also has a thriving agricultural sector, with many local farms producing corn, soybeans, wheat, and other crops.
Demographics
As of the 2010 census, Corunna had a population of 4,039 people. The racial makeup of the city was 95.2% White, 1.2% African American, 0.4% Native American, 0.7% Asian, 0.1% Pacific Islander, 0.7% from other races, and 1.7% from two or more races. Hispanic or Latino of any race were 2.2% of the population.
The median income for a household in Corunna was $41,944, and the median income for a family was $50,917. The per capita income for the city was $20,845. About 11.2% of families and 14.2% of the population were below the poverty line, including 19.2% of those under age 18 and 8.2% of those age 65 or over.
Corunna is a small city with a rich history and a vibrant economy. The city is home to a diverse population and is a great place to live, work, and play. With its close proximity to Lansing and other major cities, Corunna is an ideal place to call home.
Common Questions
What is Per Capita Income in Corunna?
Per Capita income in Corunna is $26,543.
What is the Median Family Income in Corunna?
Median Family Income in Corunna is $64,286.
What is the Median Household income in Corunna?
Median Household Income in Corunna is $43,911.
What is Income or Wage Gap in Corunna?
Income or Wage Gap in Corunna is 26.5%.
Women in Corunna earn 73.5 cents for every dollar earned by a man.
What is Inequality or Gini Index in Corunna?
Inequality or Gini Index in Corunna is 0.42.
What is the Total Population of Corunna?
Total Population of Corunna is 3,057.
What is the Total Male Population of Corunna?
Total Male Population of Corunna is 1,603.
What is the Total Female Population of Corunna?
Total Female Population of Corunna is 1,454.
What is the Ratio of Males per 100 Females in Corunna?
There are 110.25 Males per 100 Females in Corunna.
What is the Ratio of Females per 100 Males in Corunna?
There are 90.70 Females per 100 Males in Corunna.
What is the Median Population Age in Corunna?
Median Population Age in Corunna is 37.4 Years.
What is the Average Family Size in Corunna
Average Family Size in Corunna is 3.0 People.
What is the Average Household Size in Corunna
Average Household Size in Corunna is 2.0 People.
How Large is the Labor Force in Corunna?
There are 1,246 People in the Labor Forcein in Corunna.
What is the Percentage of People in the Labor Force in Corunna?
51.1% of People are in the Labor Force in Corunna.
What is the Unemployment Rate in Corunna?
Unemployment Rate in Corunna is 4.7%.