Colon, MI Map & Demographics
Colon Map
Colon Overview
$26,518
PER CAPITA INCOME
$67,917
AVG FAMILY INCOME
$53,869
AVG HOUSEHOLD INCOME
26.9%
WAGE / INCOME GAP [ % ]
73.1¢/ $1
WAGE / INCOME GAP [ $ ]
$10,535
FAMILY INCOME DEFICIT
0.40
INEQUALITY / GINI INDEX
1,391
TOTAL POPULATION
715
MALE POPULATION
676
FEMALE POPULATION
105.77
MALES / 100 FEMALES
94.55
FEMALES / 100 MALES
37.4
MEDIAN AGE
3.2
AVG FAMILY SIZE
2.4
AVG HOUSEHOLD SIZE
639
LABOR FORCE [ PEOPLE ]
59.8%
PERCENT IN LABOR FORCE
7.0%
UNEMPLOYMENT RATE
Colon Zip Codes
Colon Area Codes
Income in Colon
Income Overview in Colon
Per Capita Income in Colon is $26,518, while median incomes of families and households are $67,917 and $53,869 respectively.
| Characteristic | Number | Measure |
| Per Capita Income | 1,391 | $26,518 |
| Median Family Income | 333 | $67,917 |
| Mean Family Income | 333 | $74,812 |
| Median Household Income | 589 | $53,869 |
| Mean Household Income | 589 | $60,272 |
| Income Deficit | 333 | $10,535 |
| Wage / Income Gap (%) | 1,391 | 26.91% |
| Wage / Income Gap ($) | 1,391 | 73.09¢ per $1 |
| Gini / Inequality Index | 1,391 | 0.40 |
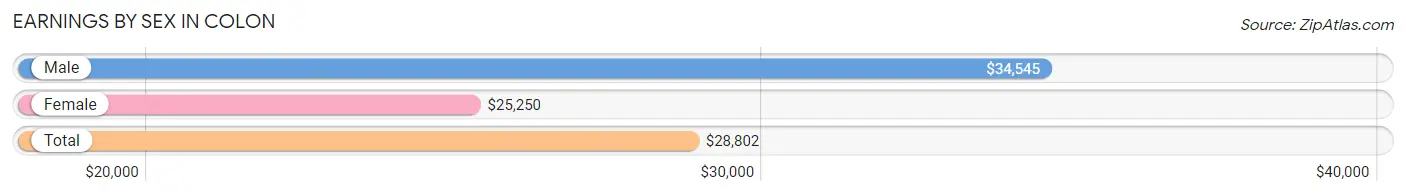
Earnings by Sex in Colon
Average Earnings in Colon are $28,802, $34,545 for men and $25,250 for women, a difference of 26.9%.
| Sex | Number | Average Earnings |
| Male | 360 (54.3%) | $34,545 |
| Female | 303 (45.7%) | $25,250 |
| Total | 663 (100.0%) | $28,802 |
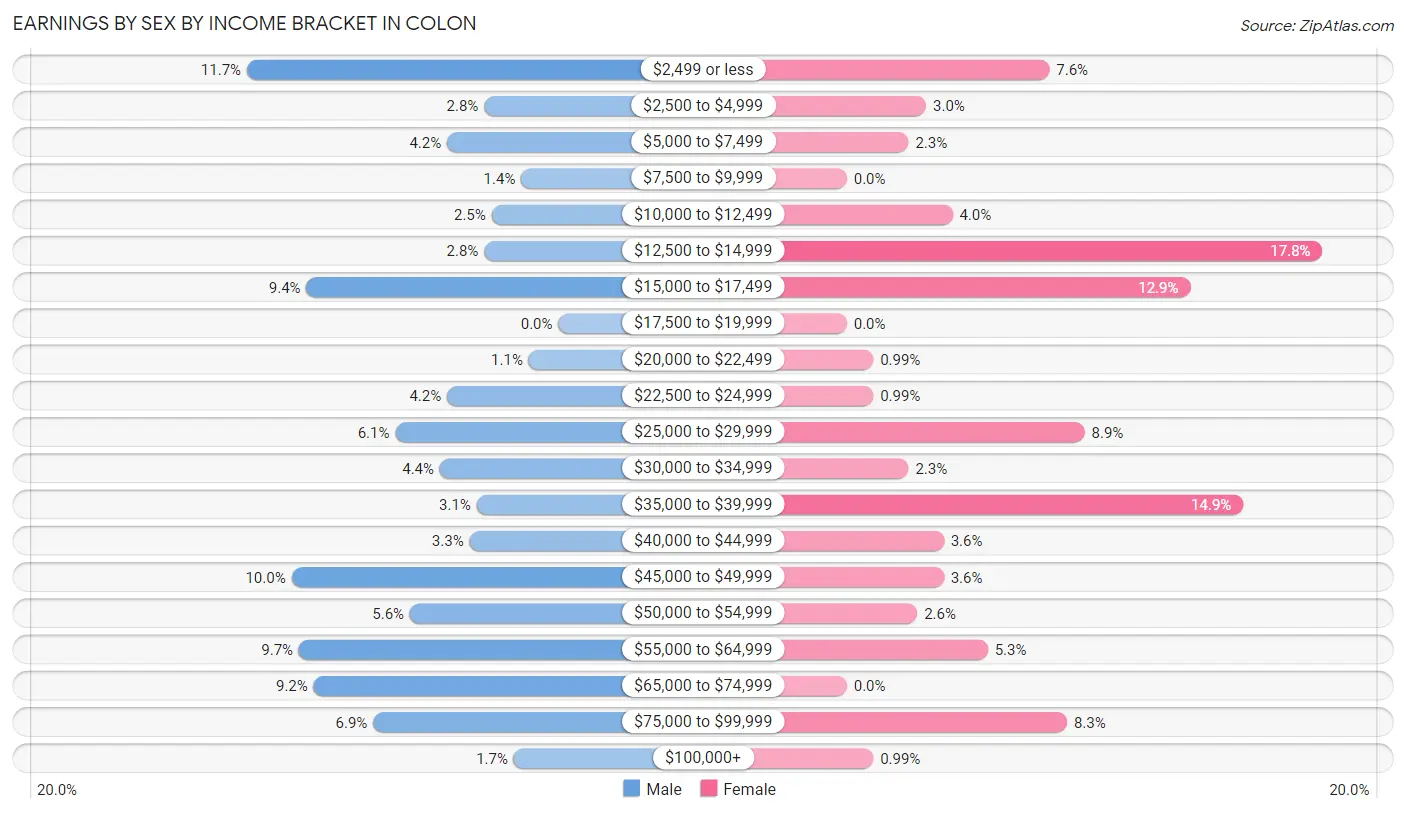
Earnings by Sex by Income Bracket in Colon
The most common earnings brackets in Colon are $2,499 or less for men (42 | 11.7%) and $12,500 to $14,999 for women (54 | 17.8%).
| Income | Male | Female |
| $2,499 or less | 42 (11.7%) | 23 (7.6%) |
| $2,500 to $4,999 | 10 (2.8%) | 9 (3.0%) |
| $5,000 to $7,499 | 15 (4.2%) | 7 (2.3%) |
| $7,500 to $9,999 | 5 (1.4%) | 0 (0.0%) |
| $10,000 to $12,499 | 9 (2.5%) | 12 (4.0%) |
| $12,500 to $14,999 | 10 (2.8%) | 54 (17.8%) |
| $15,000 to $17,499 | 34 (9.4%) | 39 (12.9%) |
| $17,500 to $19,999 | 0 (0.0%) | 0 (0.0%) |
| $20,000 to $22,499 | 4 (1.1%) | 3 (1.0%) |
| $22,500 to $24,999 | 15 (4.2%) | 3 (1.0%) |
| $25,000 to $29,999 | 22 (6.1%) | 27 (8.9%) |
| $30,000 to $34,999 | 16 (4.4%) | 7 (2.3%) |
| $35,000 to $39,999 | 11 (3.1%) | 45 (14.8%) |
| $40,000 to $44,999 | 12 (3.3%) | 11 (3.6%) |
| $45,000 to $49,999 | 36 (10.0%) | 11 (3.6%) |
| $50,000 to $54,999 | 20 (5.6%) | 8 (2.6%) |
| $55,000 to $64,999 | 35 (9.7%) | 16 (5.3%) |
| $65,000 to $74,999 | 33 (9.2%) | 0 (0.0%) |
| $75,000 to $99,999 | 25 (6.9%) | 25 (8.3%) |
| $100,000+ | 6 (1.7%) | 3 (1.0%) |
| Total | 360 (100.0%) | 303 (100.0%) |
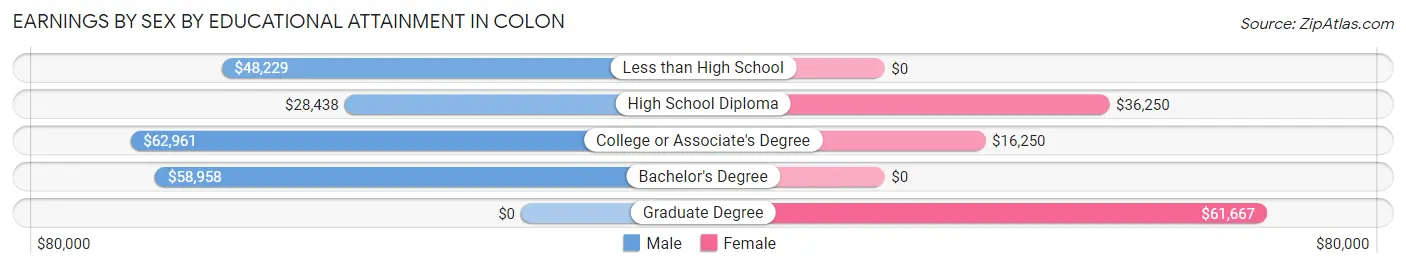
Earnings by Sex by Educational Attainment in Colon
Average earnings in Colon are $48,450 for men and $26,500 for women, a difference of 45.3%. Men with an educational attainment of college or associate's degree enjoy the highest average annual earnings of $62,961, while those with high school diploma education earn the least with $28,438. Women with an educational attainment of graduate degree earn the most with the average annual earnings of $61,667, while those with college or associate's degree education have the smallest earnings of $16,250.
| Educational Attainment | Male Income | Female Income |
| Less than High School | $48,229 | $0 |
| High School Diploma | $28,438 | $36,250 |
| College or Associate's Degree | $62,961 | $16,250 |
| Bachelor's Degree | $58,958 | $0 |
| Graduate Degree | - | - |
| Total | $48,450 | $26,500 |
Family Income in Colon
Family Income Brackets in Colon
According to the Colon family income data, there are 96 families falling into the $50,000 to $74,999 income range, which is the most common income bracket and makes up 28.8% of all families. Conversely, the less than $10,000 income bracket is the least frequent group with only 9 families (2.7%) belonging to this category.
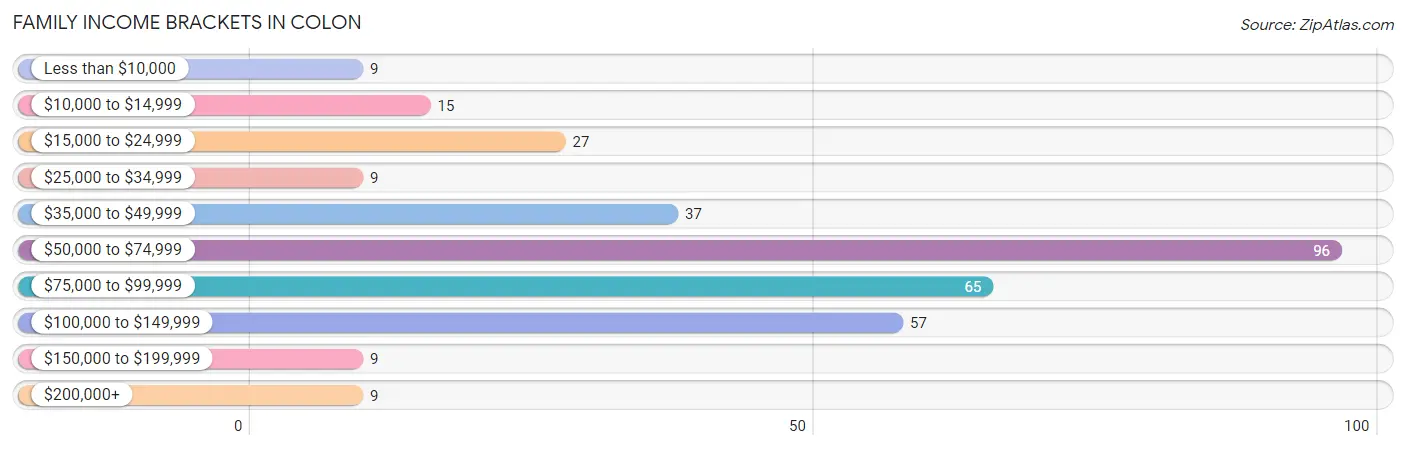
| Income Bracket | # Families | % Families |
| Less than $10,000 | 9 | 2.7% |
| $10,000 to $14,999 | 15 | 4.5% |
| $15,000 to $24,999 | 27 | 8.1% |
| $25,000 to $34,999 | 9 | 2.7% |
| $35,000 to $49,999 | 37 | 11.1% |
| $50,000 to $74,999 | 96 | 28.8% |
| $75,000 to $99,999 | 65 | 19.5% |
| $100,000 to $149,999 | 57 | 17.1% |
| $150,000 to $199,999 | 9 | 2.7% |
| $200,000+ | 9 | 2.7% |
Family Income by Famaliy Size in Colon
5-person families (36 | 10.8%) account for the highest median family income in Colon with $101,019 per family, while 2-person families (153 | 46.0%) have the highest median income of $28,688 per family member.
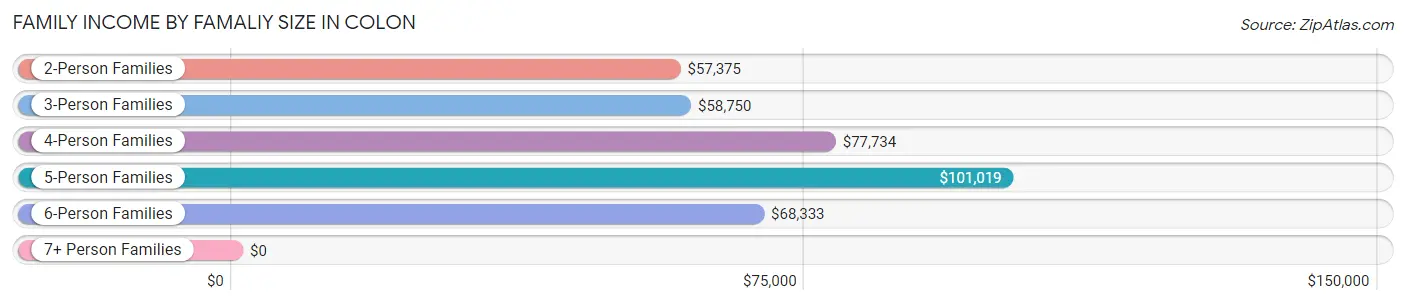
| Income Bracket | # Families | Median Income |
| 2-Person Families | 153 (46.0%) | $57,375 |
| 3-Person Families | 56 (16.8%) | $58,750 |
| 4-Person Families | 61 (18.3%) | $77,734 |
| 5-Person Families | 36 (10.8%) | $101,019 |
| 6-Person Families | 18 (5.4%) | $68,333 |
| 7+ Person Families | 9 (2.7%) | $0 |
| Total | 333 (100.0%) | $67,917 |
Family Income by Number of Earners in Colon
The median family income in Colon is $67,917, with families comprising 3+ earners (51) having the highest median family income of $101,157, while families with no earners (81) have the lowest median family income of $41,023, accounting for 15.3% and 24.3% of families, respectively.
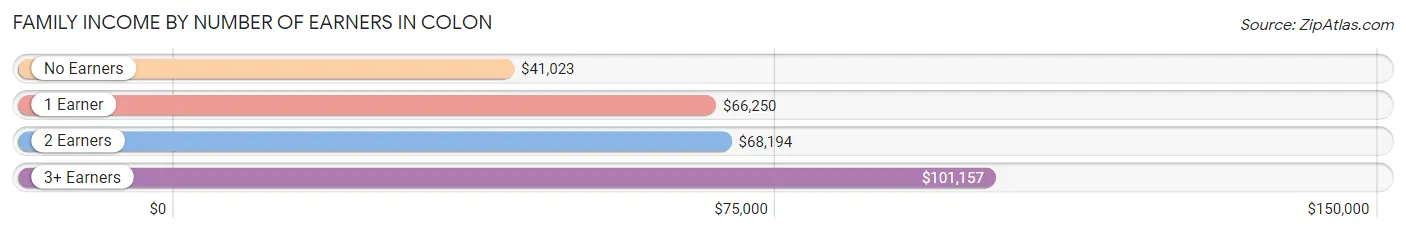
| Number of Earners | # Families | Median Income |
| No Earners | 81 (24.3%) | $41,023 |
| 1 Earner | 110 (33.0%) | $66,250 |
| 2 Earners | 91 (27.3%) | $68,194 |
| 3+ Earners | 51 (15.3%) | $101,157 |
| Total | 333 (100.0%) | $67,917 |
Household Income in Colon
Household Income Brackets in Colon
With 125 households falling in the category, the $50,000 to $74,999 income range is the most frequent in Colon, accounting for 21.2% of all households. In contrast, only 9 households (1.5%) fall into the $150,000 to $199,999 income bracket, making it the least populous group.
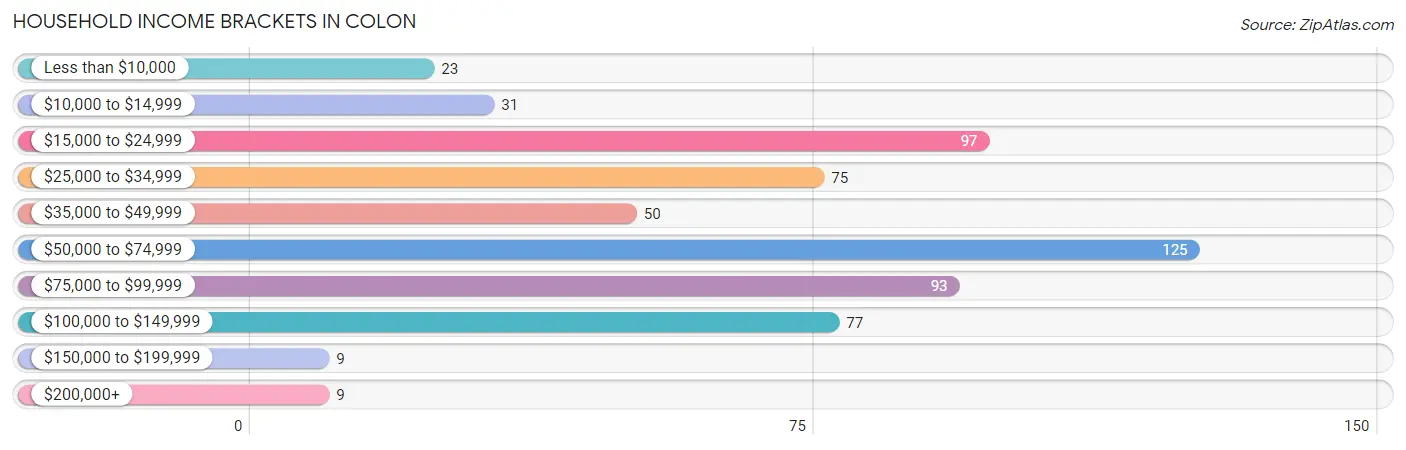
| Income Bracket | # Households | % Households |
| Less than $10,000 | 23 | 3.9% |
| $10,000 to $14,999 | 31 | 5.3% |
| $15,000 to $24,999 | 97 | 16.5% |
| $25,000 to $34,999 | 75 | 12.7% |
| $35,000 to $49,999 | 50 | 8.5% |
| $50,000 to $74,999 | 125 | 21.2% |
| $75,000 to $99,999 | 93 | 15.8% |
| $100,000 to $149,999 | 77 | 13.1% |
| $150,000 to $199,999 | 9 | 1.5% |
| $200,000+ | 9 | 1.5% |
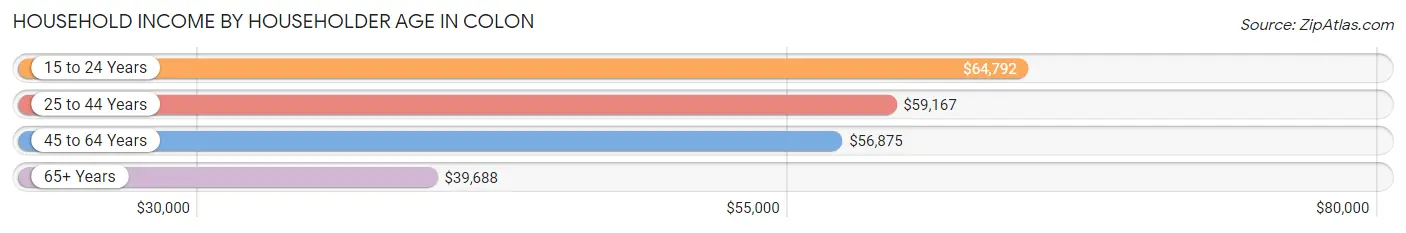
Household Income by Householder Age in Colon
The median household income in Colon is $53,869, with the highest median household income of $64,792 found in the 15 to 24 years age bracket for the primary householder. A total of 51 households (8.7%) fall into this category. Meanwhile, the 65+ years age bracket for the primary householder has the lowest median household income of $39,688, with 229 households (38.9%) in this group.
| Income Bracket | # Households | Median Income |
| 15 to 24 Years | 51 (8.7%) | $64,792 |
| 25 to 44 Years | 154 (26.2%) | $59,167 |
| 45 to 64 Years | 155 (26.3%) | $56,875 |
| 65+ Years | 229 (38.9%) | $39,688 |
| Total | 589 (100.0%) | $53,869 |
Poverty in Colon
Income Below Poverty by Sex and Age in Colon
With 10.5% poverty level for males and 19.9% for females among the residents of Colon, 6 to 11 year old males and 16 and 17 year old females are the most vulnerable to poverty, with 27 males (34.6%) and 5 females (100.0%) in their respective age groups living below the poverty level.
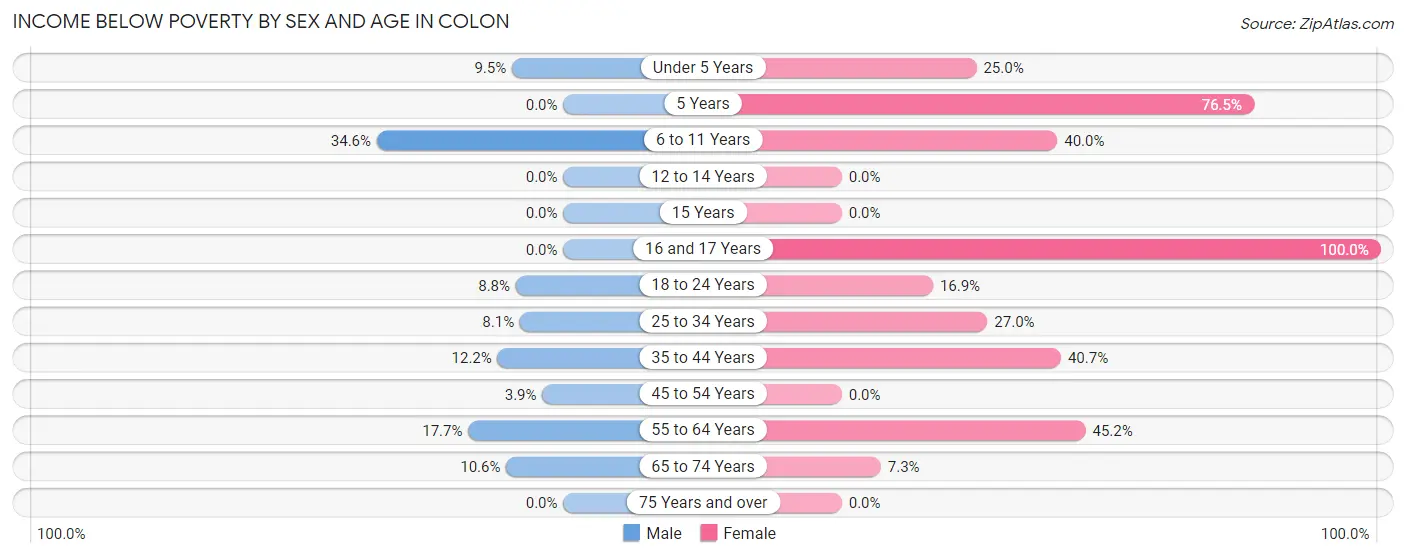
| Age Bracket | Male | Female |
| Under 5 Years | 4 (9.5%) | 19 (25.0%) |
| 5 Years | 0 (0.0%) | 13 (76.5%) |
| 6 to 11 Years | 27 (34.6%) | 8 (40.0%) |
| 12 to 14 Years | 0 (0.0%) | 0 (0.0%) |
| 15 Years | 0 (0.0%) | 0 (0.0%) |
| 16 and 17 Years | 0 (0.0%) | 5 (100.0%) |
| 18 to 24 Years | 9 (8.8%) | 11 (16.9%) |
| 25 to 34 Years | 7 (8.1%) | 20 (27.0%) |
| 35 to 44 Years | 10 (12.2%) | 24 (40.7%) |
| 45 to 54 Years | 3 (3.9%) | 0 (0.0%) |
| 55 to 64 Years | 6 (17.6%) | 19 (45.2%) |
| 65 to 74 Years | 9 (10.6%) | 10 (7.2%) |
| 75 Years and over | 0 (0.0%) | 0 (0.0%) |
| Total | 75 (10.5%) | 129 (19.9%) |
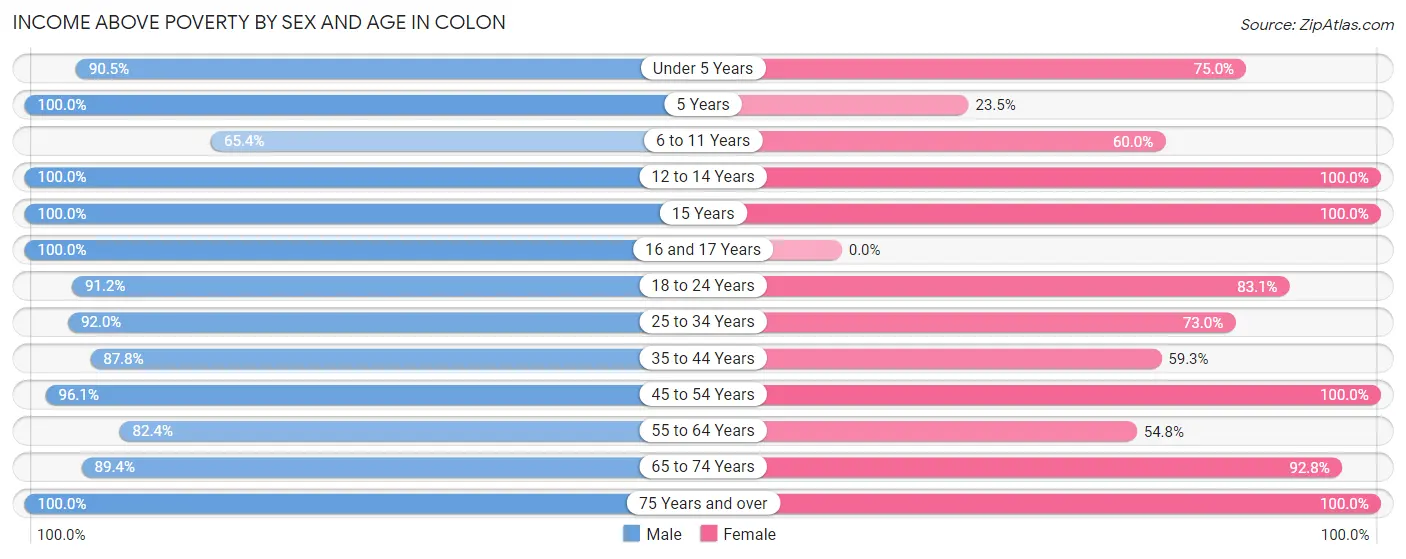
Income Above Poverty by Sex and Age in Colon
According to the poverty statistics in Colon, males aged 5 years and females aged 12 to 14 years are the age groups that are most secure financially, with 100.0% of males and 100.0% of females in these age groups living above the poverty line.
| Age Bracket | Male | Female |
| Under 5 Years | 38 (90.5%) | 57 (75.0%) |
| 5 Years | 17 (100.0%) | 4 (23.5%) |
| 6 to 11 Years | 51 (65.4%) | 12 (60.0%) |
| 12 to 14 Years | 16 (100.0%) | 12 (100.0%) |
| 15 Years | 4 (100.0%) | 15 (100.0%) |
| 16 and 17 Years | 19 (100.0%) | 0 (0.0%) |
| 18 to 24 Years | 93 (91.2%) | 54 (83.1%) |
| 25 to 34 Years | 80 (91.9%) | 54 (73.0%) |
| 35 to 44 Years | 72 (87.8%) | 35 (59.3%) |
| 45 to 54 Years | 74 (96.1%) | 91 (100.0%) |
| 55 to 64 Years | 28 (82.4%) | 23 (54.8%) |
| 65 to 74 Years | 76 (89.4%) | 128 (92.7%) |
| 75 Years and over | 72 (100.0%) | 36 (100.0%) |
| Total | 640 (89.5%) | 521 (80.1%) |
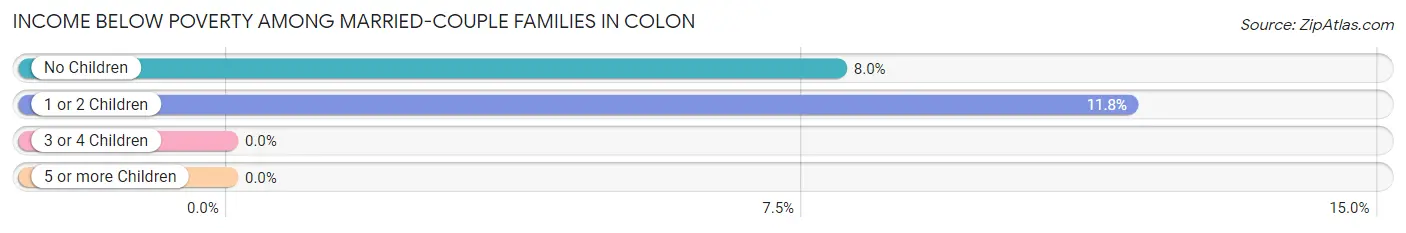
Income Below Poverty Among Married-Couple Families in Colon
The poverty statistics for married-couple families in Colon show that 8.2% or 22 of the total 267 families live below the poverty line. Families with 1 or 2 children have the highest poverty rate of 11.8%, comprising of 10 families. On the other hand, families with 3 or 4 children have the lowest poverty rate of 0.0%, which includes 0 families.
| Children | Above Poverty | Below Poverty |
| No Children | 139 (92.0%) | 12 (8.0%) |
| 1 or 2 Children | 75 (88.2%) | 10 (11.8%) |
| 3 or 4 Children | 31 (100.0%) | 0 (0.0%) |
| 5 or more Children | 0 (0.0%) | 0 (0.0%) |
| Total | 245 (91.8%) | 22 (8.2%) |
Income Below Poverty Among Single-Parent Households in Colon
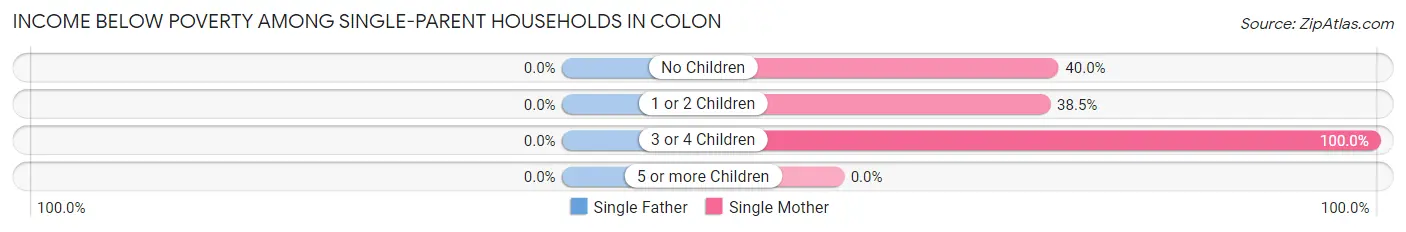
| Children | Single Father | Single Mother |
| No Children | 0 (0.0%) | 6 (40.0%) |
| 1 or 2 Children | 0 (0.0%) | 5 (38.5%) |
| 3 or 4 Children | 0 (0.0%) | 18 (100.0%) |
| 5 or more Children | 0 (0.0%) | 0 (0.0%) |
| Total | 0 (0.0%) | 29 (63.0%) |
Income Below Poverty Among Married-Couple vs Single-Parent Households in Colon
The poverty data for Colon shows that 22 of the married-couple family households (8.2%) and 29 of the single-parent households (43.9%) are living below the poverty level. Within the married-couple family households, those with 1 or 2 children have the highest poverty rate, with 10 households (11.8%) falling below the poverty line. Among the single-parent households, those with 3 or 4 children have the highest poverty rate, with 18 household (100.0%) living below poverty.
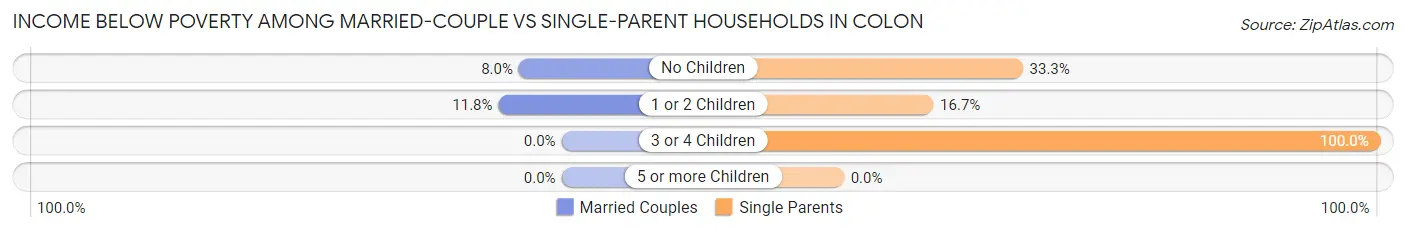
| Children | Married-Couple Families | Single-Parent Households |
| No Children | 12 (8.0%) | 6 (33.3%) |
| 1 or 2 Children | 10 (11.8%) | 5 (16.7%) |
| 3 or 4 Children | 0 (0.0%) | 18 (100.0%) |
| 5 or more Children | 0 (0.0%) | 0 (0.0%) |
| Total | 22 (8.2%) | 29 (43.9%) |
Race in Colon
The most populous races in Colon are White / Caucasian (1,292 | 92.9%), Two or more Races (90 | 6.5%), and Hispanic or Latino (7 | 0.5%).
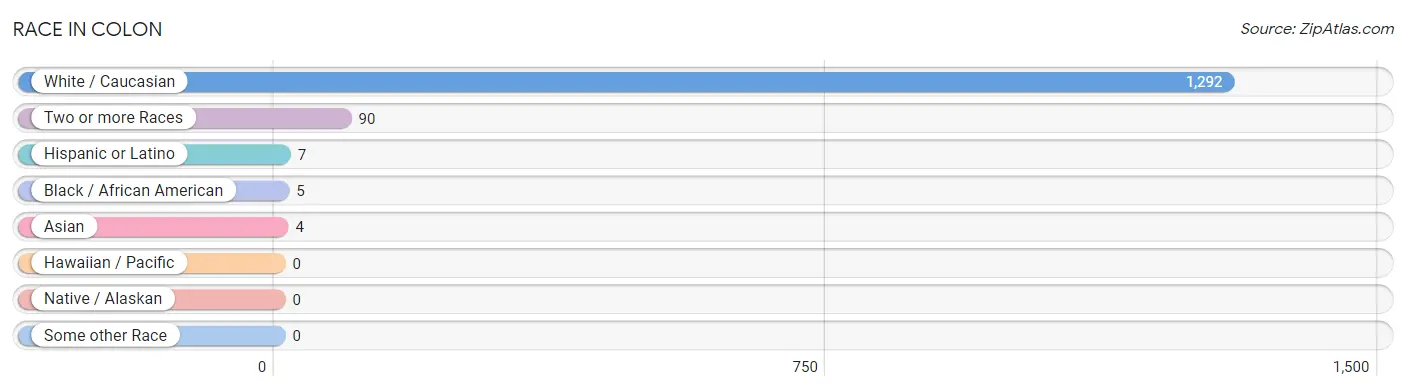
| Race | # Population | % Population |
| Asian | 4 | 0.3% |
| Black / African American | 5 | 0.4% |
| Hawaiian / Pacific | 0 | 0.0% |
| Hispanic or Latino | 7 | 0.5% |
| Native / Alaskan | 0 | 0.0% |
| White / Caucasian | 1,292 | 92.9% |
| Two or more Races | 90 | 6.5% |
| Some other Race | 0 | 0.0% |
| Total | 1,391 | 100.0% |
Ancestry in Colon
The most populous ancestries reported in Colon are German (398 | 28.6%), European (249 | 17.9%), Irish (129 | 9.3%), English (113 | 8.1%), and Dutch (82 | 5.9%), together accounting for 69.8% of all Colon residents.
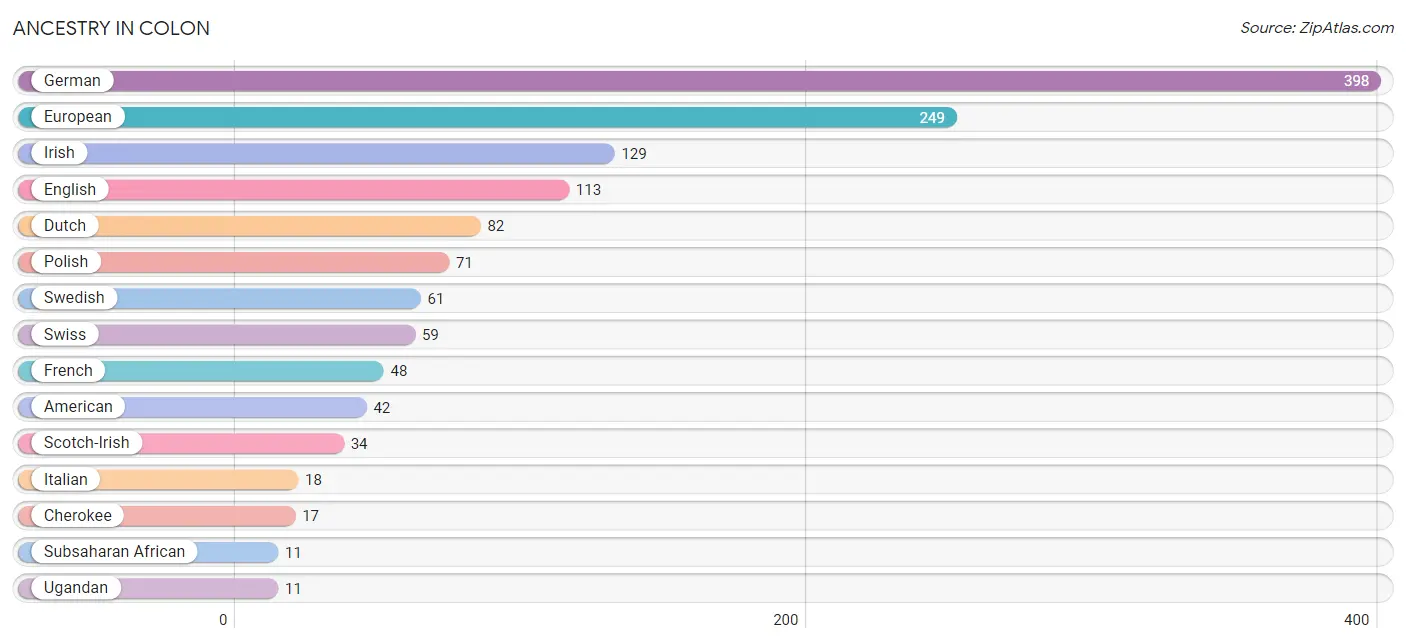
| Ancestry | # Population | % Population |
| American | 42 | 3.0% |
| British | 6 | 0.4% |
| Bulgarian | 4 | 0.3% |
| Burmese | 4 | 0.3% |
| Canadian | 4 | 0.3% |
| Cherokee | 17 | 1.2% |
| Dutch | 82 | 5.9% |
| English | 113 | 8.1% |
| European | 249 | 17.9% |
| French | 48 | 3.5% |
| German | 398 | 28.6% |
| Greek | 9 | 0.6% |
| Irish | 129 | 9.3% |
| Italian | 18 | 1.3% |
| Mexican | 7 | 0.5% |
| Norwegian | 10 | 0.7% |
| Pennsylvania German | 4 | 0.3% |
| Polish | 71 | 5.1% |
| Scotch-Irish | 34 | 2.4% |
| Scottish | 10 | 0.7% |
| Sri Lankan | 7 | 0.5% |
| Subsaharan African | 11 | 0.8% |
| Swedish | 61 | 4.4% |
| Swiss | 59 | 4.2% |
| Ugandan | 11 | 0.8% |
| Ukrainian | 10 | 0.7% | View All 26 Rows |
Immigrants in Colon
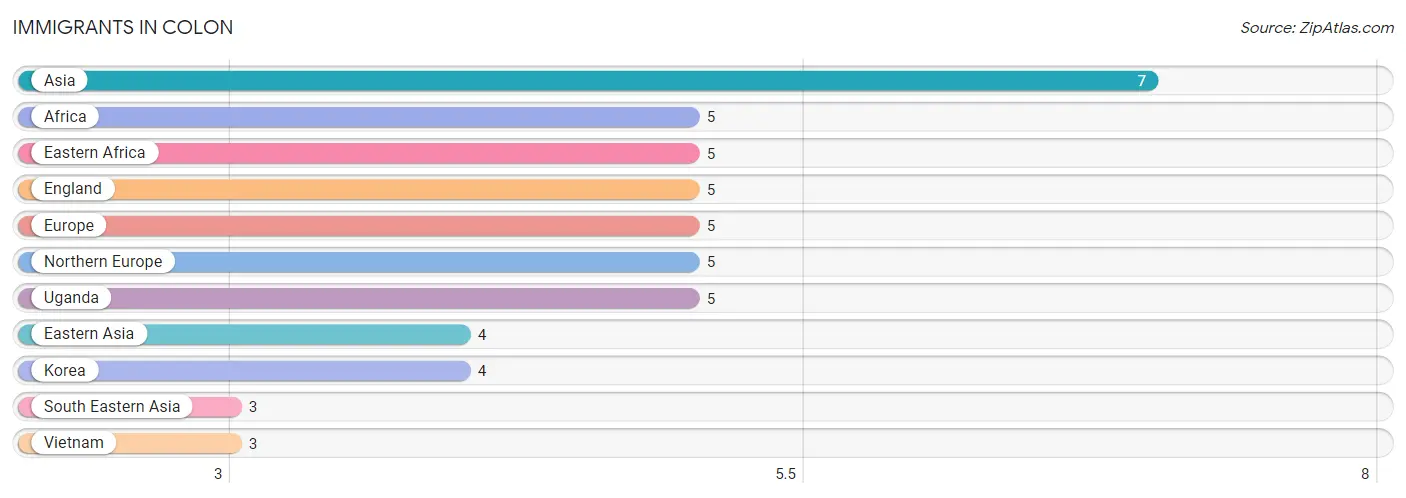
The most numerous immigrant groups reported in Colon came from Asia (7 | 0.5%), Africa (5 | 0.4%), Eastern Africa (5 | 0.4%), England (5 | 0.4%), and Europe (5 | 0.4%), together accounting for 1.9% of all Colon residents.
| Immigration Origin | # Population | % Population |
| Africa | 5 | 0.4% |
| Asia | 7 | 0.5% |
| Eastern Africa | 5 | 0.4% |
| Eastern Asia | 4 | 0.3% |
| England | 5 | 0.4% |
| Europe | 5 | 0.4% |
| Korea | 4 | 0.3% |
| Northern Europe | 5 | 0.4% |
| South Eastern Asia | 3 | 0.2% |
| Uganda | 5 | 0.4% |
| Vietnam | 3 | 0.2% | View All 11 Rows |
Sex and Age in Colon
Sex and Age in Colon
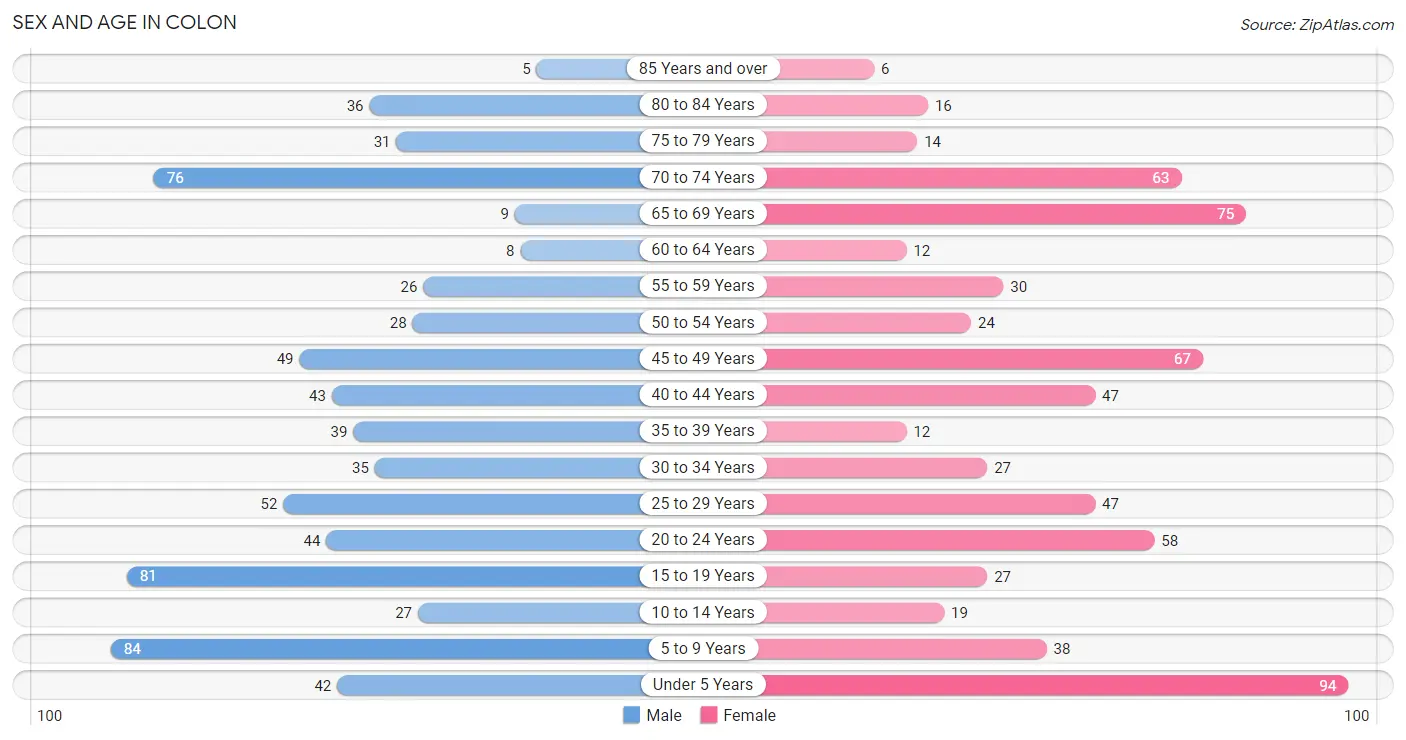
The most populous age groups in Colon are 5 to 9 Years (84 | 11.7%) for men and Under 5 Years (94 | 13.9%) for women.
| Age Bracket | Male | Female |
| Under 5 Years | 42 (5.9%) | 94 (13.9%) |
| 5 to 9 Years | 84 (11.7%) | 38 (5.6%) |
| 10 to 14 Years | 27 (3.8%) | 19 (2.8%) |
| 15 to 19 Years | 81 (11.3%) | 27 (4.0%) |
| 20 to 24 Years | 44 (6.1%) | 58 (8.6%) |
| 25 to 29 Years | 52 (7.3%) | 47 (7.0%) |
| 30 to 34 Years | 35 (4.9%) | 27 (4.0%) |
| 35 to 39 Years | 39 (5.4%) | 12 (1.8%) |
| 40 to 44 Years | 43 (6.0%) | 47 (7.0%) |
| 45 to 49 Years | 49 (6.9%) | 67 (9.9%) |
| 50 to 54 Years | 28 (3.9%) | 24 (3.5%) |
| 55 to 59 Years | 26 (3.6%) | 30 (4.4%) |
| 60 to 64 Years | 8 (1.1%) | 12 (1.8%) |
| 65 to 69 Years | 9 (1.3%) | 75 (11.1%) |
| 70 to 74 Years | 76 (10.6%) | 63 (9.3%) |
| 75 to 79 Years | 31 (4.3%) | 14 (2.1%) |
| 80 to 84 Years | 36 (5.0%) | 16 (2.4%) |
| 85 Years and over | 5 (0.7%) | 6 (0.9%) |
| Total | 715 (100.0%) | 676 (100.0%) |
Families and Households in Colon
Median Family Size in Colon
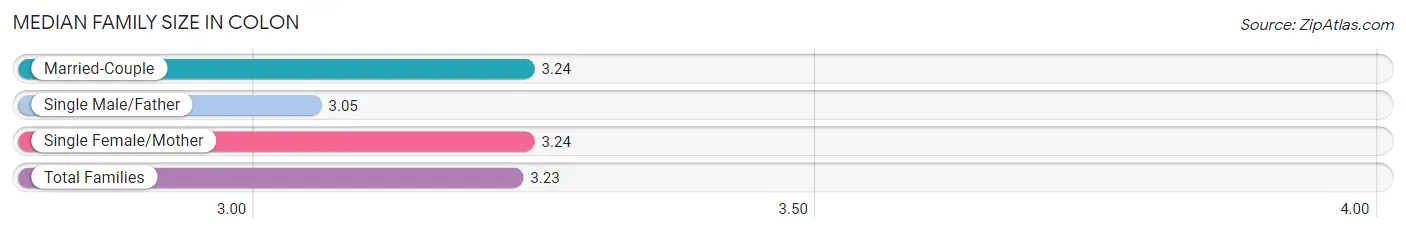
The median family size in Colon is 3.23 persons per family, with married-couple families (267 | 80.2%) accounting for the largest median family size of 3.24 persons per family. On the other hand, single male/father families (20 | 6.0%) represent the smallest median family size with 3.05 persons per family.
| Family Type | # Families | Family Size |
| Married-Couple | 267 (80.2%) | 3.24 |
| Single Male/Father | 20 (6.0%) | 3.05 |
| Single Female/Mother | 46 (13.8%) | 3.24 |
| Total Families | 333 (100.0%) | 3.23 |
Median Household Size in Colon
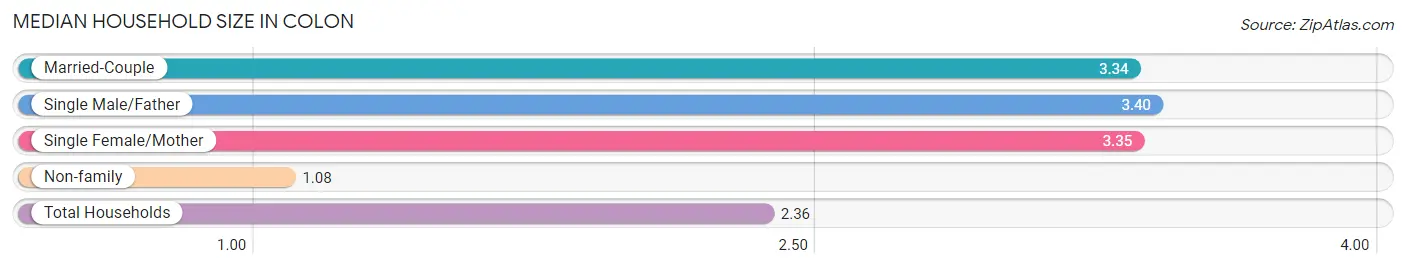
The median household size in Colon is 2.36 persons per household, with single male/father households (20 | 3.4%) accounting for the largest median household size of 3.4 persons per household. non-family households (256 | 43.5%) represent the smallest median household size with 1.08 persons per household.
| Household Type | # Households | Household Size |
| Married-Couple | 267 (45.3%) | 3.34 |
| Single Male/Father | 20 (3.4%) | 3.40 |
| Single Female/Mother | 46 (7.8%) | 3.35 |
| Non-family | 256 (43.5%) | 1.08 |
| Total Households | 589 (100.0%) | 2.36 |
Household Size by Marriage Status in Colon
Out of a total of 589 households in Colon, 333 (56.5%) are family households, while 256 (43.5%) are nonfamily households. The most numerous type of family households are 2-person households, comprising 153, and the most common type of nonfamily households are 1-person households, comprising 238.
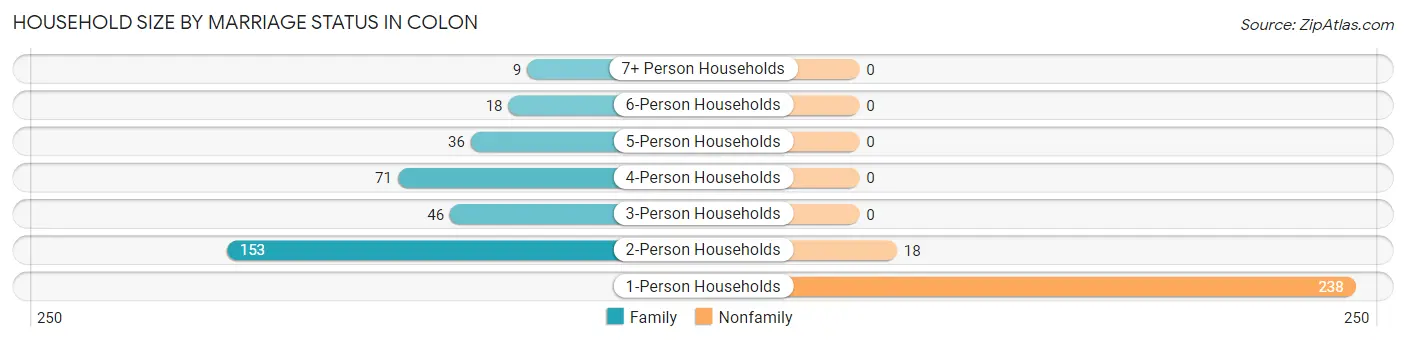
| Household Size | Family Households | Nonfamily Households |
| 1-Person Households | - | 238 (40.4%) |
| 2-Person Households | 153 (26.0%) | 18 (3.1%) |
| 3-Person Households | 46 (7.8%) | 0 (0.0%) |
| 4-Person Households | 71 (12.0%) | 0 (0.0%) |
| 5-Person Households | 36 (6.1%) | 0 (0.0%) |
| 6-Person Households | 18 (3.1%) | 0 (0.0%) |
| 7+ Person Households | 9 (1.5%) | 0 (0.0%) |
| Total | 333 (56.5%) | 256 (43.5%) |
Female Fertility in Colon
Fertility by Age in Colon
Average fertility rate in Colon is 70.0 births per 1,000 women. Women in the age bracket of 20 to 34 years have the highest fertility rate with 159.0 births per 1,000 women. Women in the age bracket of 20 to 34 years acount for 100.0% of all women with births.
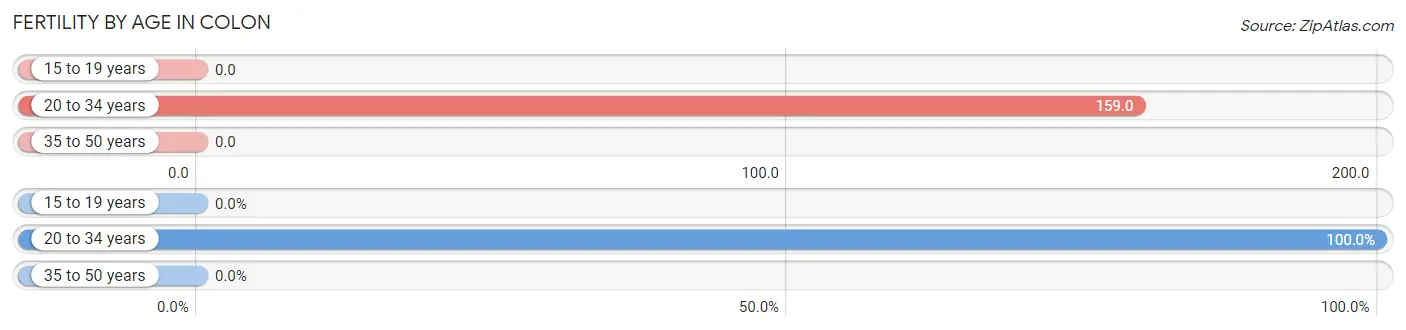
| Age Bracket | Women with Births | Births / 1,000 Women |
| 15 to 19 years | 0 (0.0%) | 0.0 |
| 20 to 34 years | 21 (100.0%) | 159.0 |
| 35 to 50 years | 0 (0.0%) | 0.0 |
| Total | 21 (100.0%) | 70.0 |
Fertility by Age by Marriage Status in Colon
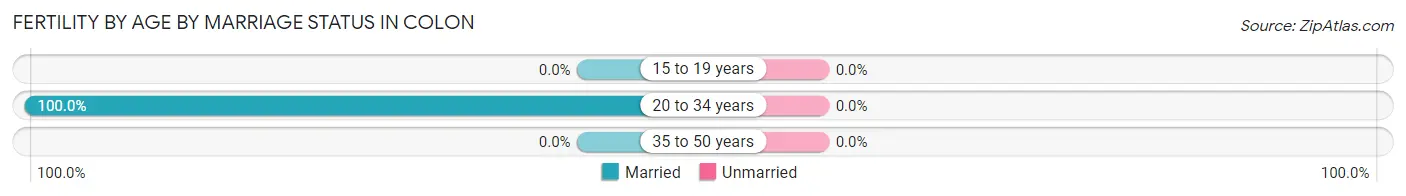
| Age Bracket | Married | Unmarried |
| 15 to 19 years | 0 (0.0%) | 0 (0.0%) |
| 20 to 34 years | 21 (100.0%) | 0 (0.0%) |
| 35 to 50 years | 0 (0.0%) | 0 (0.0%) |
| Total | 21 (100.0%) | 0 (0.0%) |
Fertility by Education in Colon
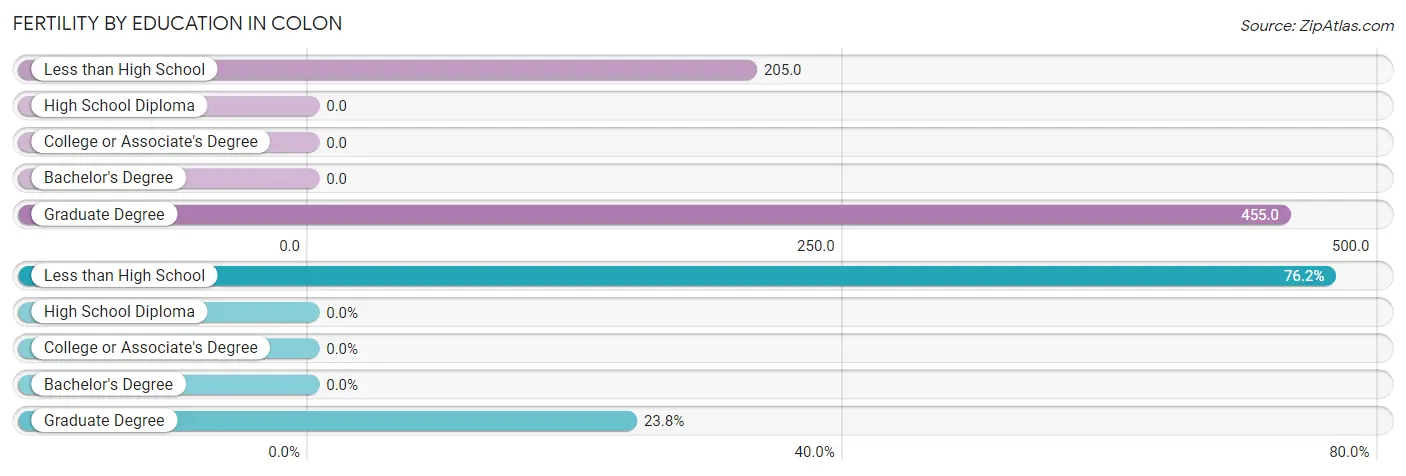
| Educational Attainment | Women with Births | Births / 1,000 Women |
| Less than High School | 16 (76.2%) | 205.0 |
| High School Diploma | 0 (0.0%) | 0.0 |
| College or Associate's Degree | 0 (0.0%) | 0.0 |
| Bachelor's Degree | 0 (0.0%) | 0.0 |
| Graduate Degree | 5 (23.8%) | 455.0 |
| Total | 21 (100.0%) | 70.0 |
Fertility by Education by Marriage Status in Colon
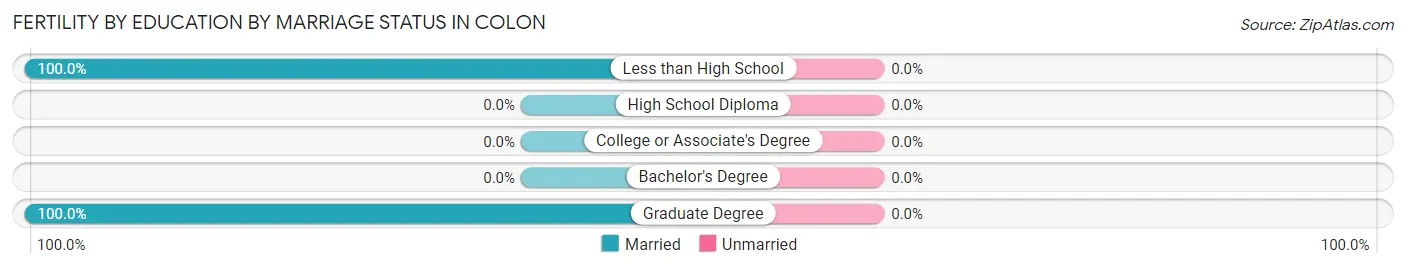
| Educational Attainment | Married | Unmarried |
| Less than High School | 16 (100.0%) | 0 (0.0%) |
| High School Diploma | 0 (0.0%) | 0 (0.0%) |
| College or Associate's Degree | 0 (0.0%) | 0 (0.0%) |
| Bachelor's Degree | 0 (0.0%) | 0 (0.0%) |
| Graduate Degree | 5 (100.0%) | 0 (0.0%) |
| Total | 21 (100.0%) | 0 (0.0%) |
Employment Characteristics in Colon
Employment by Class of Employer in Colon
Among the 528 employed individuals in Colon, private company employees (385 | 72.9%), not-for-profit organizations (74 | 14.0%), and self-employed (not incorporated) (28 | 5.3%) make up the most common classes of employment.
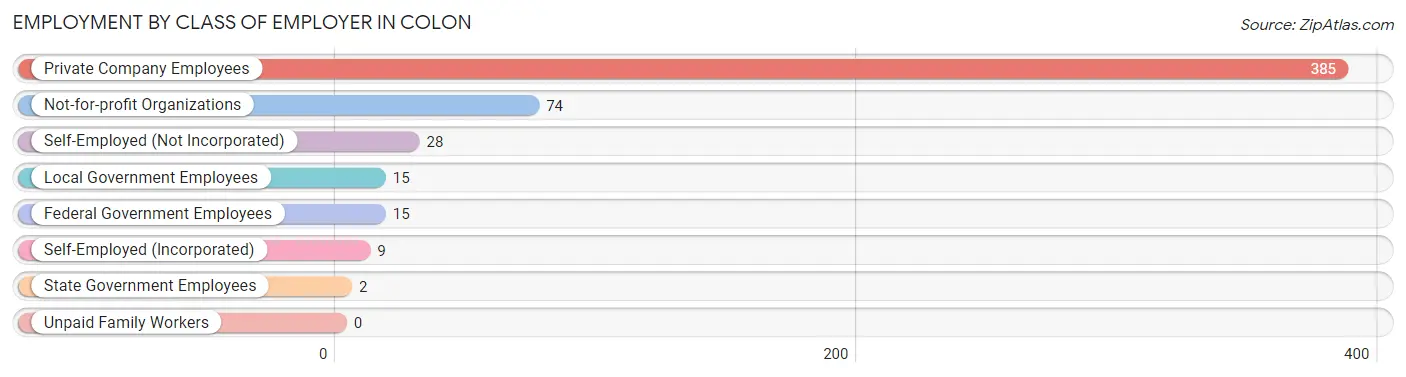
| Employer Class | # Employees | % Employees |
| Private Company Employees | 385 | 72.9% |
| Self-Employed (Incorporated) | 9 | 1.7% |
| Self-Employed (Not Incorporated) | 28 | 5.3% |
| Not-for-profit Organizations | 74 | 14.0% |
| Local Government Employees | 15 | 2.8% |
| State Government Employees | 2 | 0.4% |
| Federal Government Employees | 15 | 2.8% |
| Unpaid Family Workers | 0 | 0.0% |
| Total | 528 | 100.0% |
Employment Status by Age in Colon
According to the labor force statistics for Colon, out of the total population over 16 years of age (1,068), 59.8% or 639 individuals are in the labor force, with 7.0% or 45 of them unemployed. The age group with the highest labor force participation rate is 45 to 54 years, with 97.0% or 163 individuals in the labor force. Within the labor force, the 16 to 19 years age range has the highest percentage of unemployed individuals, with 50.8% or 33 of them being unemployed.
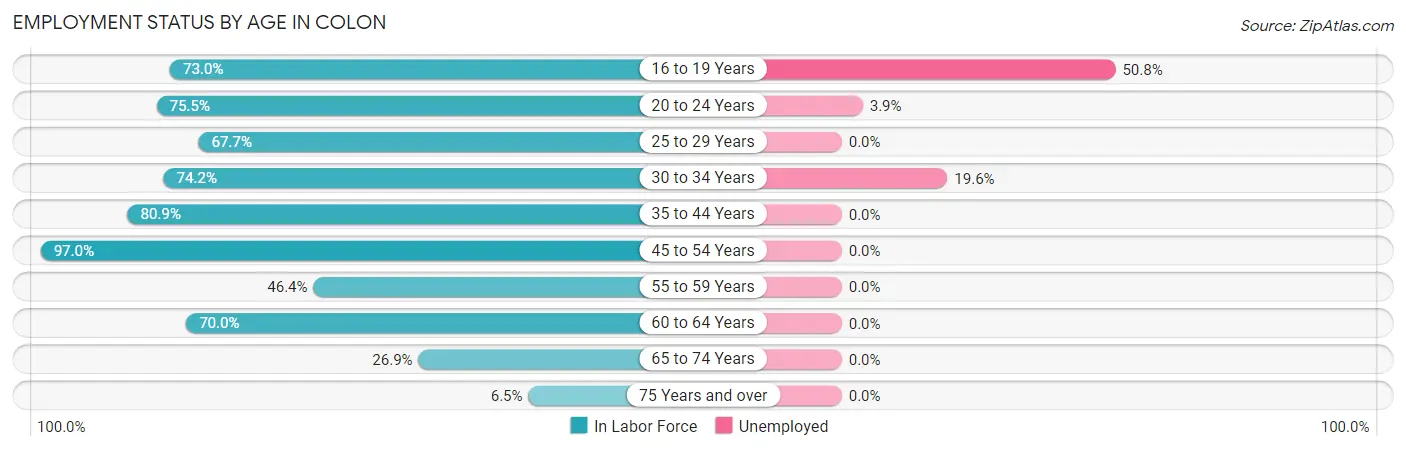
| Age Bracket | In Labor Force | Unemployed |
| 16 to 19 Years | 65 (73.0%) | 33 (50.8%) |
| 20 to 24 Years | 77 (75.5%) | 3 (3.9%) |
| 25 to 29 Years | 67 (67.7%) | 0 (0.0%) |
| 30 to 34 Years | 46 (74.2%) | 9 (19.6%) |
| 35 to 44 Years | 114 (80.9%) | 0 (0.0%) |
| 45 to 54 Years | 163 (97.0%) | 0 (0.0%) |
| 55 to 59 Years | 26 (46.4%) | 0 (0.0%) |
| 60 to 64 Years | 14 (70.0%) | 0 (0.0%) |
| 65 to 74 Years | 60 (26.9%) | 0 (0.0%) |
| 75 Years and over | 7 (6.5%) | 0 (0.0%) |
| Total | 639 (59.8%) | 45 (7.0%) |
Employment Status by Educational Attainment in Colon
According to labor force statistics for Colon, 78.8% of individuals (430) out of the total population between 25 and 64 years of age (546) are in the labor force, with 2.1% or 9 of them being unemployed. The group with the highest labor force participation rate are those with the educational attainment of bachelor's degree or higher, with 95.8% or 69 individuals in the labor force. Within the labor force, individuals with bachelor's degree or higher education have the highest percentage of unemployment, with 7.2% or 5 of them being unemployed.
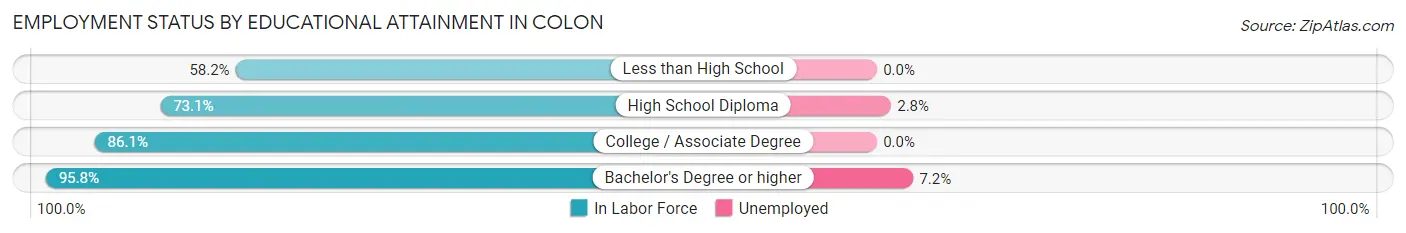
| Educational Attainment | In Labor Force | Unemployed |
| Less than High School | 46 (58.2%) | 0 (0.0%) |
| High School Diploma | 141 (73.1%) | 5 (2.8%) |
| College / Associate Degree | 174 (86.1%) | 0 (0.0%) |
| Bachelor's Degree or higher | 69 (95.8%) | 5 (7.2%) |
| Total | 430 (78.8%) | 11 (2.1%) |
Employment Occupations by Sex in Colon
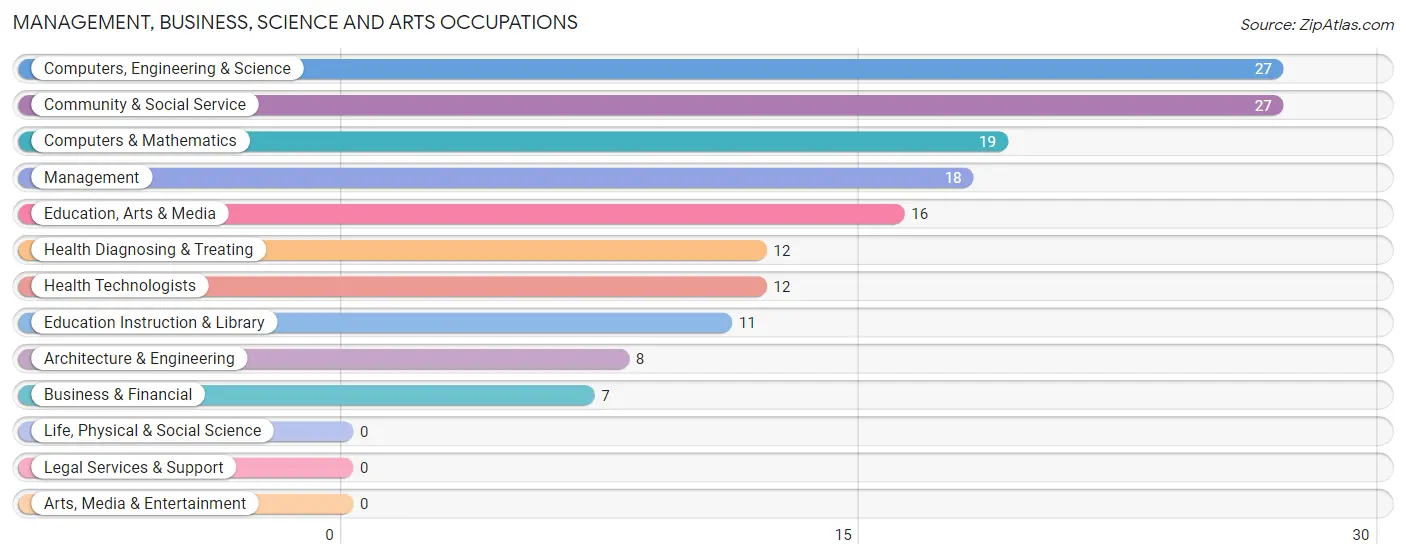
Management, Business, Science and Arts Occupations
The most common Management, Business, Science and Arts occupations in Colon are Computers, Engineering & Science (27 | 4.5%), Community & Social Service (27 | 4.5%), Computers & Mathematics (19 | 3.2%), Management (18 | 3.0%), and Education, Arts & Media (16 | 2.7%).
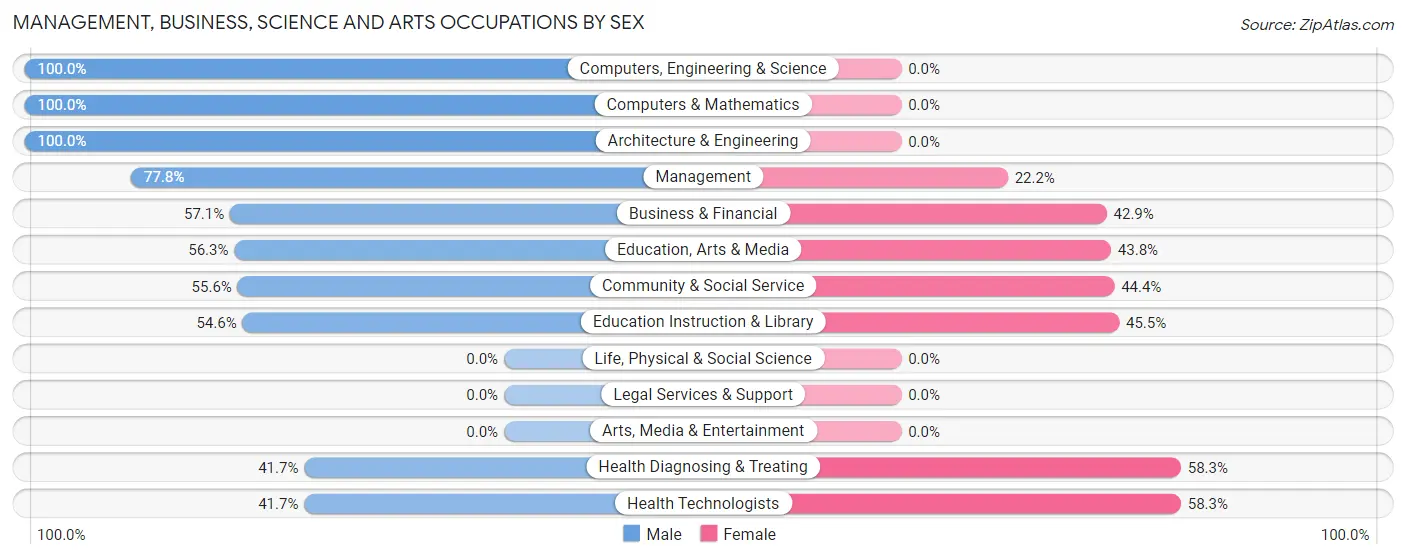
Management, Business, Science and Arts Occupations by Sex
Within the Management, Business, Science and Arts occupations in Colon, the most male-oriented occupations are Computers, Engineering & Science (100.0%), Computers & Mathematics (100.0%), and Architecture & Engineering (100.0%), while the most female-oriented occupations are Health Diagnosing & Treating (58.3%), Health Technologists (58.3%), and Education Instruction & Library (45.5%).
| Occupation | Male | Female |
| Management | 14 (77.8%) | 4 (22.2%) |
| Business & Financial | 4 (57.1%) | 3 (42.9%) |
| Computers, Engineering & Science | 27 (100.0%) | 0 (0.0%) |
| Computers & Mathematics | 19 (100.0%) | 0 (0.0%) |
| Architecture & Engineering | 8 (100.0%) | 0 (0.0%) |
| Life, Physical & Social Science | 0 (0.0%) | 0 (0.0%) |
| Community & Social Service | 15 (55.6%) | 12 (44.4%) |
| Education, Arts & Media | 9 (56.2%) | 7 (43.8%) |
| Legal Services & Support | 0 (0.0%) | 0 (0.0%) |
| Education Instruction & Library | 6 (54.5%) | 5 (45.5%) |
| Arts, Media & Entertainment | 0 (0.0%) | 0 (0.0%) |
| Health Diagnosing & Treating | 5 (41.7%) | 7 (58.3%) |
| Health Technologists | 5 (41.7%) | 7 (58.3%) |
| Total (Category) | 65 (71.4%) | 26 (28.6%) |
| Total (Overall) | 311 (52.4%) | 283 (47.6%) |
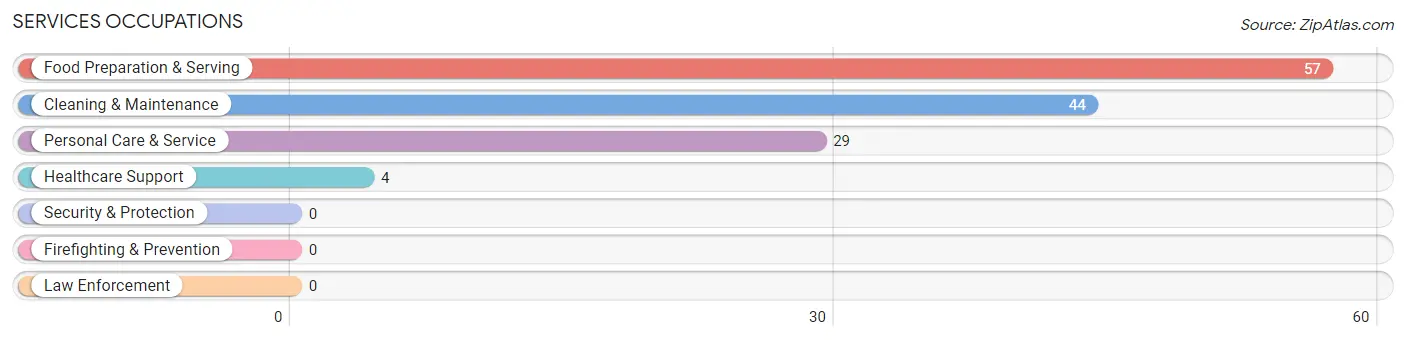
Services Occupations
The most common Services occupations in Colon are Food Preparation & Serving (57 | 9.6%), Cleaning & Maintenance (44 | 7.4%), Personal Care & Service (29 | 4.9%), and Healthcare Support (4 | 0.7%).
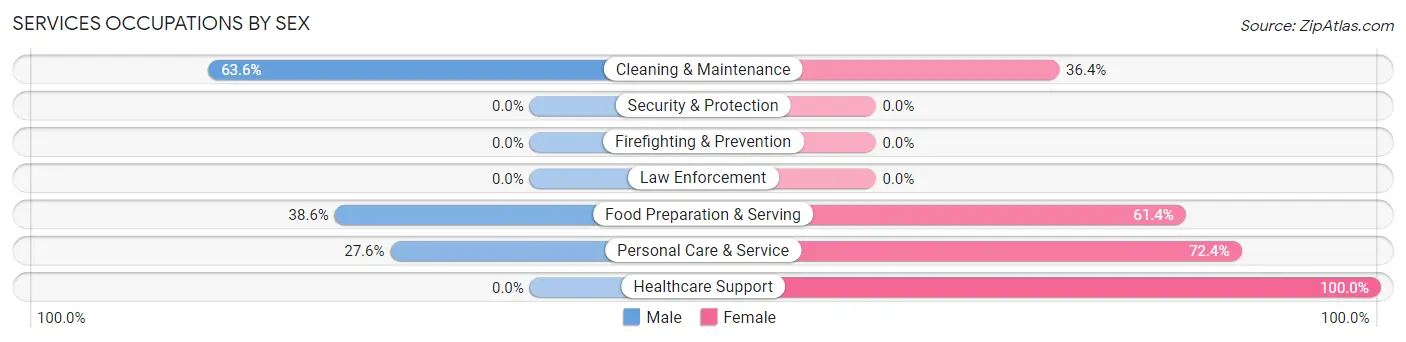
Services Occupations by Sex
Within the Services occupations in Colon, the most male-oriented occupations are Cleaning & Maintenance (63.6%), Food Preparation & Serving (38.6%), and Personal Care & Service (27.6%), while the most female-oriented occupations are Healthcare Support (100.0%), Personal Care & Service (72.4%), and Food Preparation & Serving (61.4%).
| Occupation | Male | Female |
| Healthcare Support | 0 (0.0%) | 4 (100.0%) |
| Security & Protection | 0 (0.0%) | 0 (0.0%) |
| Firefighting & Prevention | 0 (0.0%) | 0 (0.0%) |
| Law Enforcement | 0 (0.0%) | 0 (0.0%) |
| Food Preparation & Serving | 22 (38.6%) | 35 (61.4%) |
| Cleaning & Maintenance | 28 (63.6%) | 16 (36.4%) |
| Personal Care & Service | 8 (27.6%) | 21 (72.4%) |
| Total (Category) | 58 (43.3%) | 76 (56.7%) |
| Total (Overall) | 311 (52.4%) | 283 (47.6%) |
Sales and Office Occupations
The most common Sales and Office occupations in Colon are Office & Administration (92 | 15.5%), and Sales & Related (47 | 7.9%).

Sales and Office Occupations by Sex
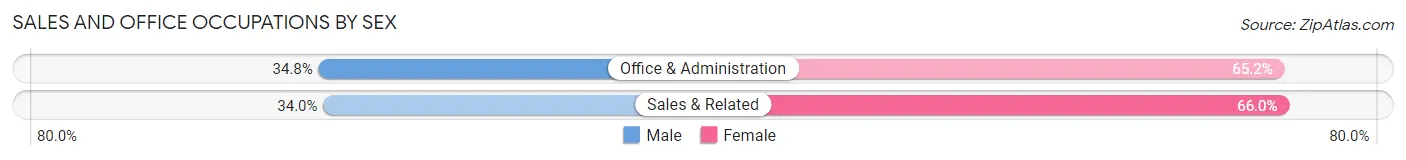
| Occupation | Male | Female |
| Sales & Related | 16 (34.0%) | 31 (66.0%) |
| Office & Administration | 32 (34.8%) | 60 (65.2%) |
| Total (Category) | 48 (34.5%) | 91 (65.5%) |
| Total (Overall) | 311 (52.4%) | 283 (47.6%) |
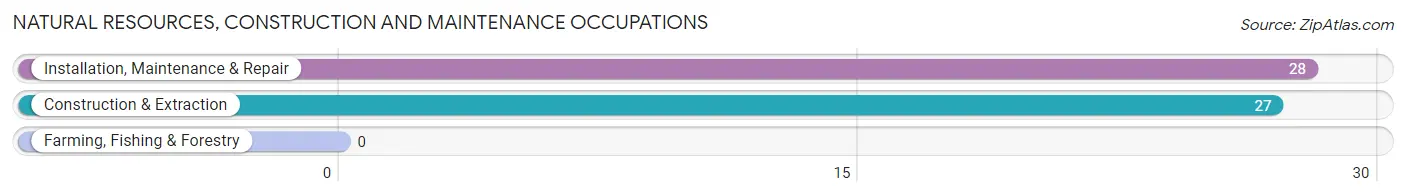
Natural Resources, Construction and Maintenance Occupations
The most common Natural Resources, Construction and Maintenance occupations in Colon are Installation, Maintenance & Repair (28 | 4.7%), and Construction & Extraction (27 | 4.5%).
Natural Resources, Construction and Maintenance Occupations by Sex
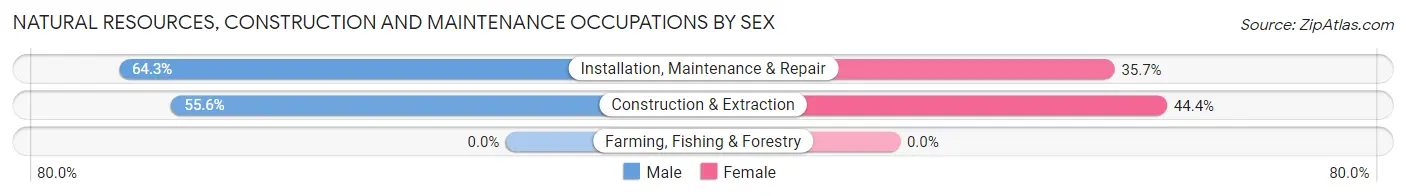
| Occupation | Male | Female |
| Farming, Fishing & Forestry | 0 (0.0%) | 0 (0.0%) |
| Construction & Extraction | 15 (55.6%) | 12 (44.4%) |
| Installation, Maintenance & Repair | 18 (64.3%) | 10 (35.7%) |
| Total (Category) | 33 (60.0%) | 22 (40.0%) |
| Total (Overall) | 311 (52.4%) | 283 (47.6%) |
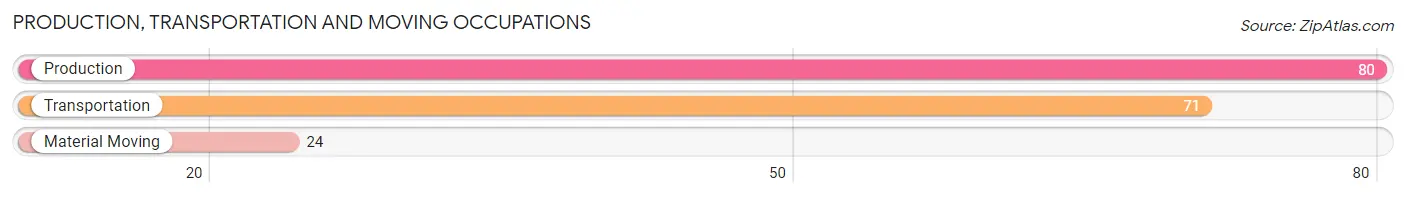
Production, Transportation and Moving Occupations
The most common Production, Transportation and Moving occupations in Colon are Production (80 | 13.5%), Transportation (71 | 11.9%), and Material Moving (24 | 4.0%).
Production, Transportation and Moving Occupations by Sex
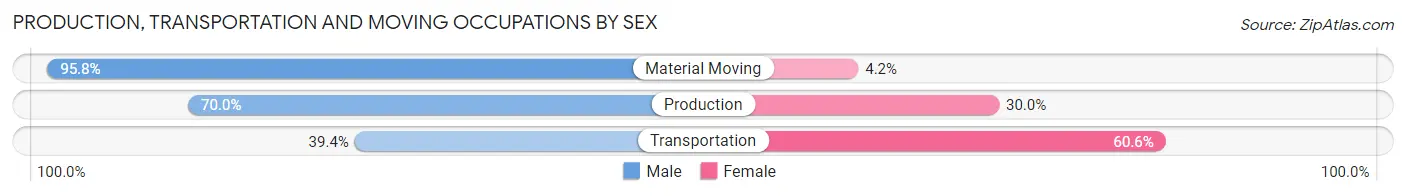
| Occupation | Male | Female |
| Production | 56 (70.0%) | 24 (30.0%) |
| Transportation | 28 (39.4%) | 43 (60.6%) |
| Material Moving | 23 (95.8%) | 1 (4.2%) |
| Total (Category) | 107 (61.1%) | 68 (38.9%) |
| Total (Overall) | 311 (52.4%) | 283 (47.6%) |
Employment Industries by Sex in Colon
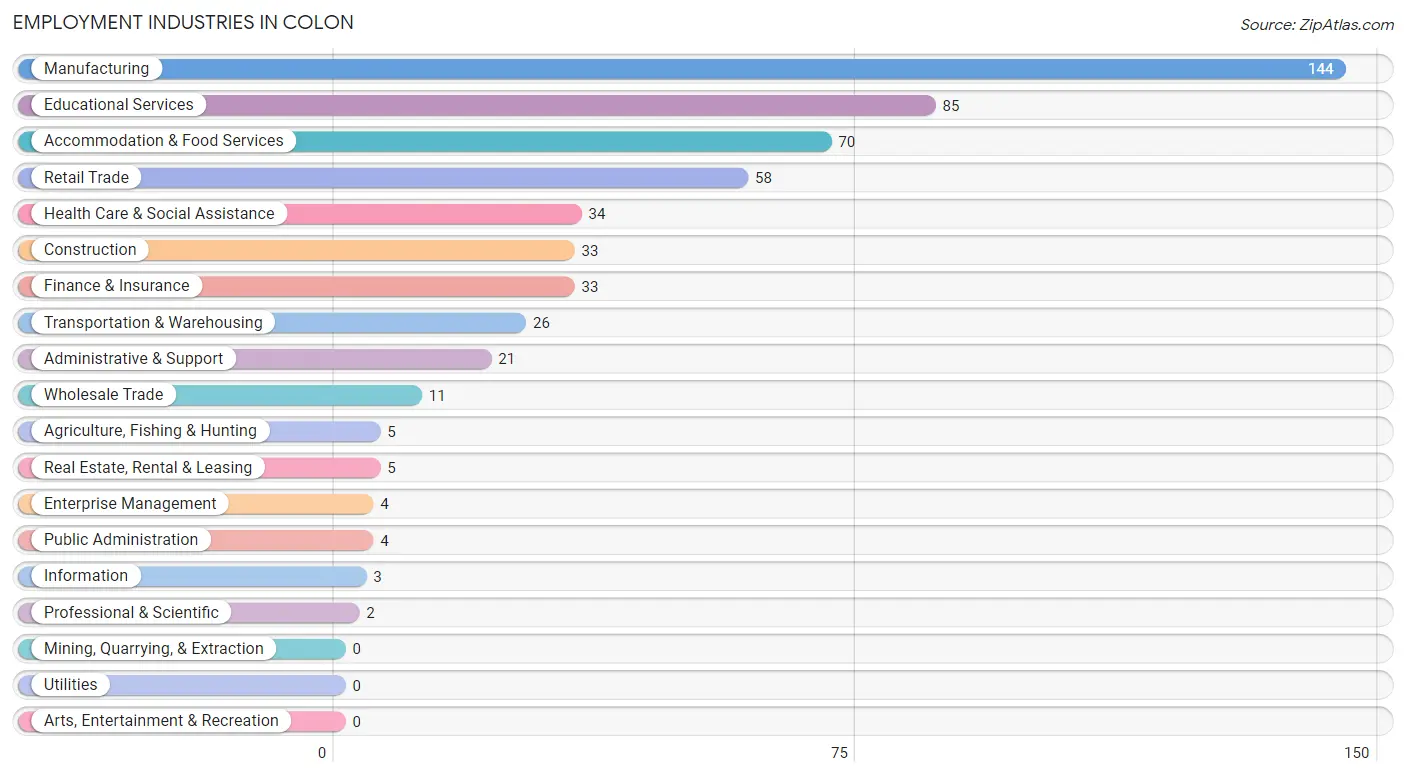
Employment Industries in Colon
The major employment industries in Colon include Manufacturing (144 | 24.2%), Educational Services (85 | 14.3%), Accommodation & Food Services (70 | 11.8%), Retail Trade (58 | 9.8%), and Health Care & Social Assistance (34 | 5.7%).
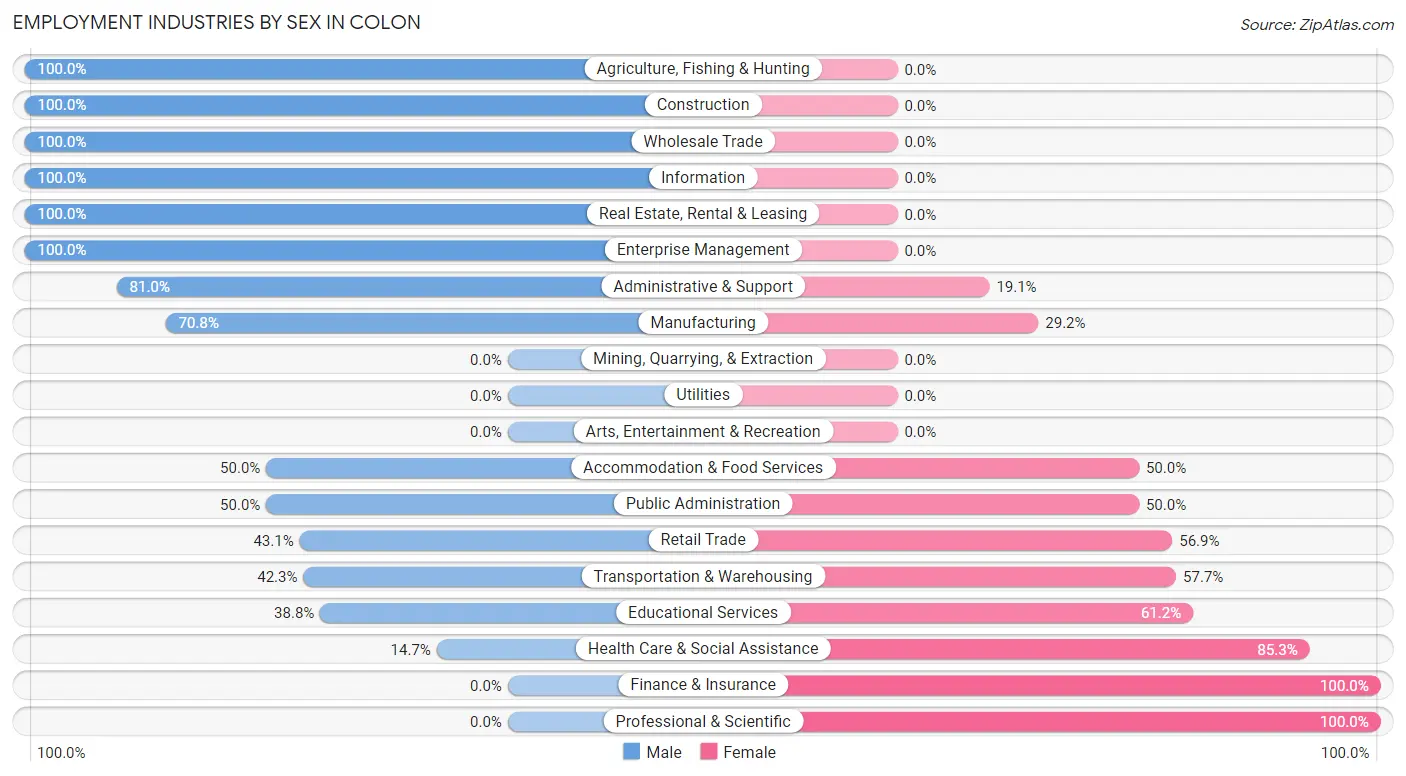
Employment Industries by Sex in Colon
The Colon industries that see more men than women are Agriculture, Fishing & Hunting (100.0%), Construction (100.0%), and Wholesale Trade (100.0%), whereas the industries that tend to have a higher number of women are Finance & Insurance (100.0%), Professional & Scientific (100.0%), and Health Care & Social Assistance (85.3%).
| Industry | Male | Female |
| Agriculture, Fishing & Hunting | 5 (100.0%) | 0 (0.0%) |
| Mining, Quarrying, & Extraction | 0 (0.0%) | 0 (0.0%) |
| Construction | 33 (100.0%) | 0 (0.0%) |
| Manufacturing | 102 (70.8%) | 42 (29.2%) |
| Wholesale Trade | 11 (100.0%) | 0 (0.0%) |
| Retail Trade | 25 (43.1%) | 33 (56.9%) |
| Transportation & Warehousing | 11 (42.3%) | 15 (57.7%) |
| Utilities | 0 (0.0%) | 0 (0.0%) |
| Information | 3 (100.0%) | 0 (0.0%) |
| Finance & Insurance | 0 (0.0%) | 33 (100.0%) |
| Real Estate, Rental & Leasing | 5 (100.0%) | 0 (0.0%) |
| Professional & Scientific | 0 (0.0%) | 2 (100.0%) |
| Enterprise Management | 4 (100.0%) | 0 (0.0%) |
| Administrative & Support | 17 (80.9%) | 4 (19.1%) |
| Educational Services | 33 (38.8%) | 52 (61.2%) |
| Health Care & Social Assistance | 5 (14.7%) | 29 (85.3%) |
| Arts, Entertainment & Recreation | 0 (0.0%) | 0 (0.0%) |
| Accommodation & Food Services | 35 (50.0%) | 35 (50.0%) |
| Public Administration | 2 (50.0%) | 2 (50.0%) |
| Total | 311 (52.4%) | 283 (47.6%) |
Education in Colon
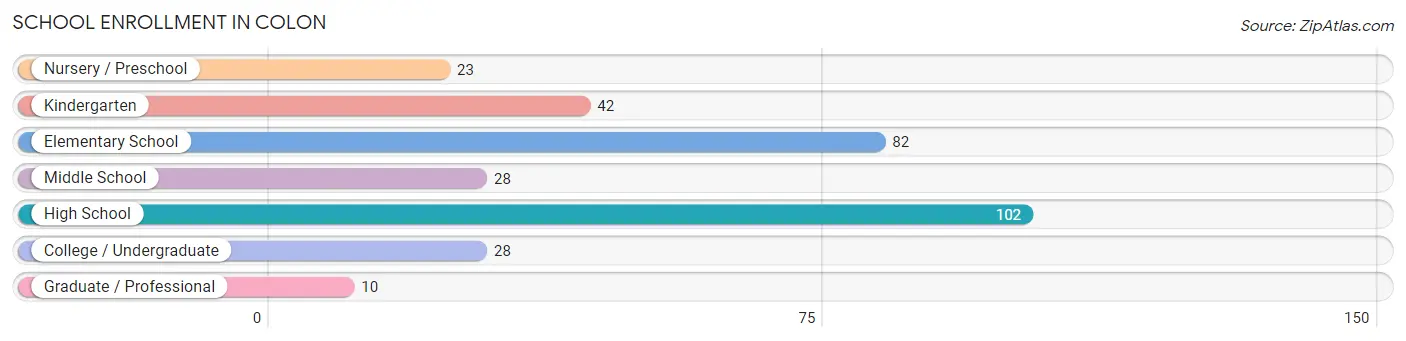
School Enrollment in Colon
The most common levels of schooling among the 315 students in Colon are high school (102 | 32.4%), elementary school (82 | 26.0%), and kindergarten (42 | 13.3%).
| School Level | # Students | % Students |
| Nursery / Preschool | 23 | 7.3% |
| Kindergarten | 42 | 13.3% |
| Elementary School | 82 | 26.0% |
| Middle School | 28 | 8.9% |
| High School | 102 | 32.4% |
| College / Undergraduate | 28 | 8.9% |
| Graduate / Professional | 10 | 3.2% |
| Total | 315 | 100.0% |
School Enrollment by Age by Funding Source in Colon
Out of a total of 315 students who are enrolled in schools in Colon, 13 (4.1%) attend a private institution, while the remaining 302 (95.9%) are enrolled in public schools. The age group of 25 to 34 year olds has the highest likelihood of being enrolled in private schools, with 5 (55.6% in the age bracket) enrolled. Conversely, the age group of 3 to 4 year olds has the lowest likelihood of being enrolled in a private school, with 23 (100.0% in the age bracket) attending a public institution.
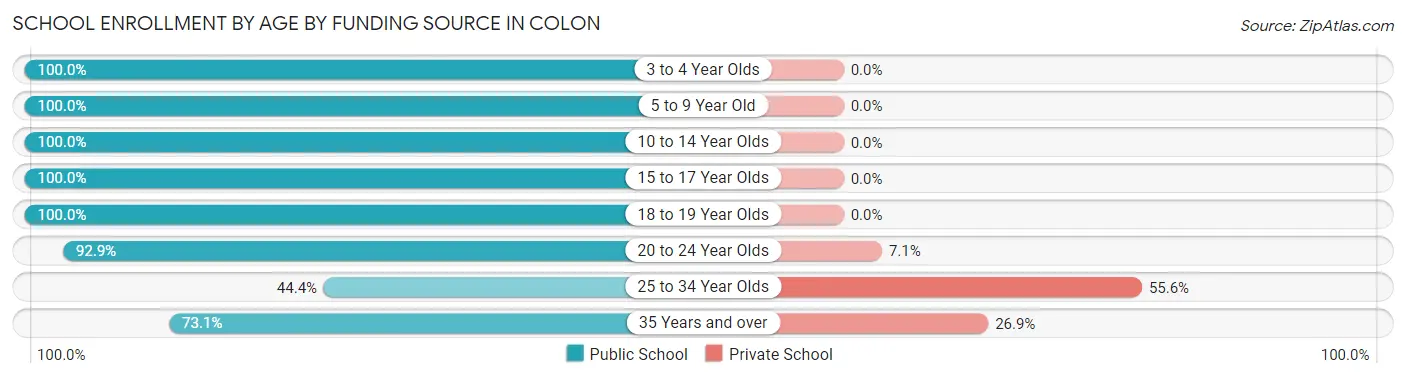
| Age Bracket | Public School | Private School |
| 3 to 4 Year Olds | 23 (100.0%) | 0 (0.0%) |
| 5 to 9 Year Old | 111 (100.0%) | 0 (0.0%) |
| 10 to 14 Year Olds | 46 (100.0%) | 0 (0.0%) |
| 15 to 17 Year Olds | 43 (100.0%) | 0 (0.0%) |
| 18 to 19 Year Olds | 43 (100.0%) | 0 (0.0%) |
| 20 to 24 Year Olds | 13 (92.9%) | 1 (7.1%) |
| 25 to 34 Year Olds | 4 (44.4%) | 5 (55.6%) |
| 35 Years and over | 19 (73.1%) | 7 (26.9%) |
| Total | 302 (95.9%) | 13 (4.1%) |
Educational Attainment by Field of Study in Colon
Education (60 | 33.0%), business (25 | 13.7%), computers & mathematics (23 | 12.6%), science & technology (17 | 9.3%), and arts & humanities (15 | 8.2%) are the most common fields of study among 182 individuals in Colon who have obtained a bachelor's degree or higher.
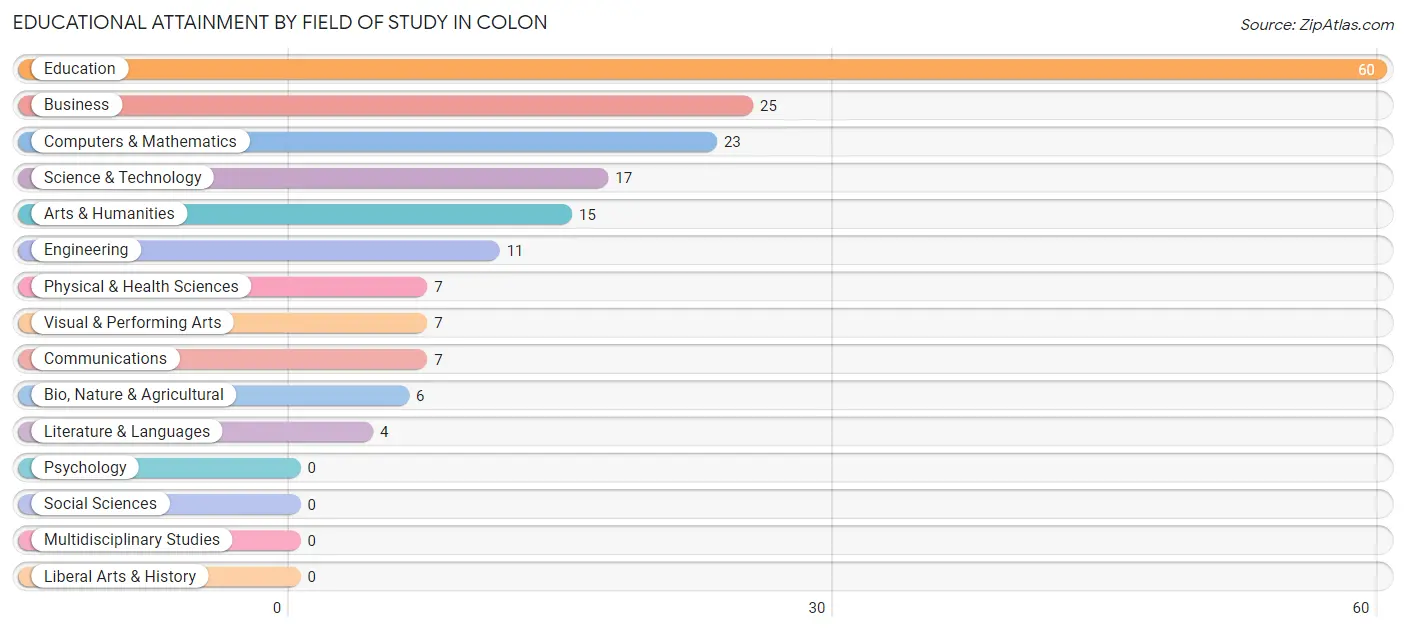
| Field of Study | # Graduates | % Graduates |
| Computers & Mathematics | 23 | 12.6% |
| Bio, Nature & Agricultural | 6 | 3.3% |
| Physical & Health Sciences | 7 | 3.8% |
| Psychology | 0 | 0.0% |
| Social Sciences | 0 | 0.0% |
| Engineering | 11 | 6.0% |
| Multidisciplinary Studies | 0 | 0.0% |
| Science & Technology | 17 | 9.3% |
| Business | 25 | 13.7% |
| Education | 60 | 33.0% |
| Literature & Languages | 4 | 2.2% |
| Liberal Arts & History | 0 | 0.0% |
| Visual & Performing Arts | 7 | 3.8% |
| Communications | 7 | 3.8% |
| Arts & Humanities | 15 | 8.2% |
| Total | 182 | 100.0% |
Transportation & Commute in Colon
Vehicle Availability by Sex in Colon
The most prevalent vehicle ownership categories in Colon are males with 2 vehicles (124, accounting for 42.3%) and females with 2 vehicles (65, making up 52.8%).
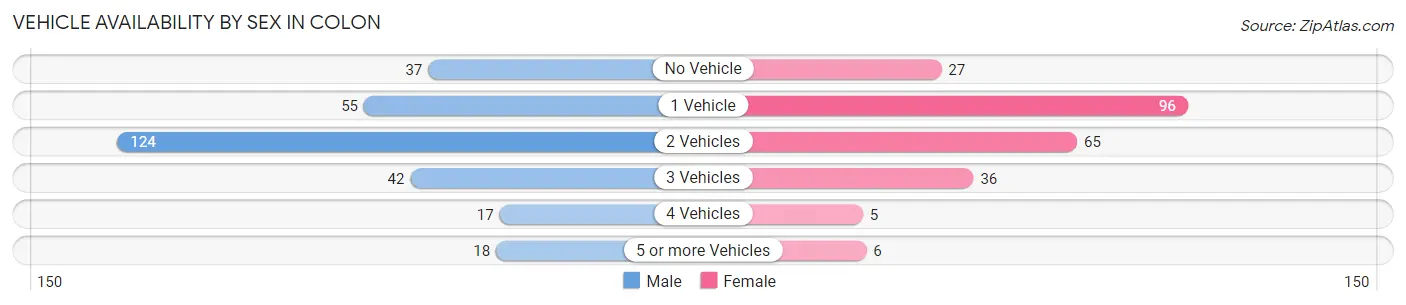
| Vehicles Available | Male | Female |
| No Vehicle | 37 (12.6%) | 27 (11.5%) |
| 1 Vehicle | 55 (18.8%) | 96 (40.8%) |
| 2 Vehicles | 124 (42.3%) | 65 (27.7%) |
| 3 Vehicles | 42 (14.3%) | 36 (15.3%) |
| 4 Vehicles | 17 (5.8%) | 5 (2.1%) |
| 5 or more Vehicles | 18 (6.1%) | 6 (2.5%) |
| Total | 293 (100.0%) | 235 (100.0%) |
Commute Time in Colon
The most frequently occuring commute durations in Colon are 30 to 34 minutes (95 commuters, 20.6%), 5 to 9 minutes (69 commuters, 14.9%), and 20 to 24 minutes (63 commuters, 13.6%).
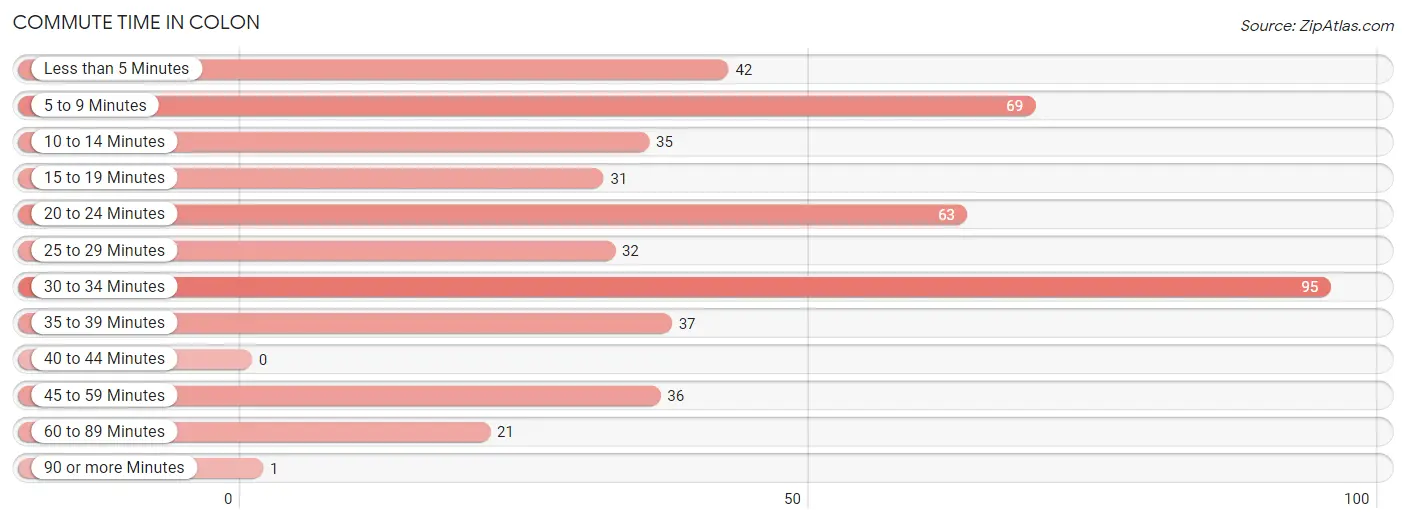
| Commute Time | # Commuters | % Commuters |
| Less than 5 Minutes | 42 | 9.1% |
| 5 to 9 Minutes | 69 | 14.9% |
| 10 to 14 Minutes | 35 | 7.6% |
| 15 to 19 Minutes | 31 | 6.7% |
| 20 to 24 Minutes | 63 | 13.6% |
| 25 to 29 Minutes | 32 | 6.9% |
| 30 to 34 Minutes | 95 | 20.6% |
| 35 to 39 Minutes | 37 | 8.0% |
| 40 to 44 Minutes | 0 | 0.0% |
| 45 to 59 Minutes | 36 | 7.8% |
| 60 to 89 Minutes | 21 | 4.5% |
| 90 or more Minutes | 1 | 0.2% |
Commute Time by Sex in Colon
The most common commute times in Colon are 30 to 34 minutes (52 commuters, 19.9%) for males and 30 to 34 minutes (43 commuters, 21.4%) for females.
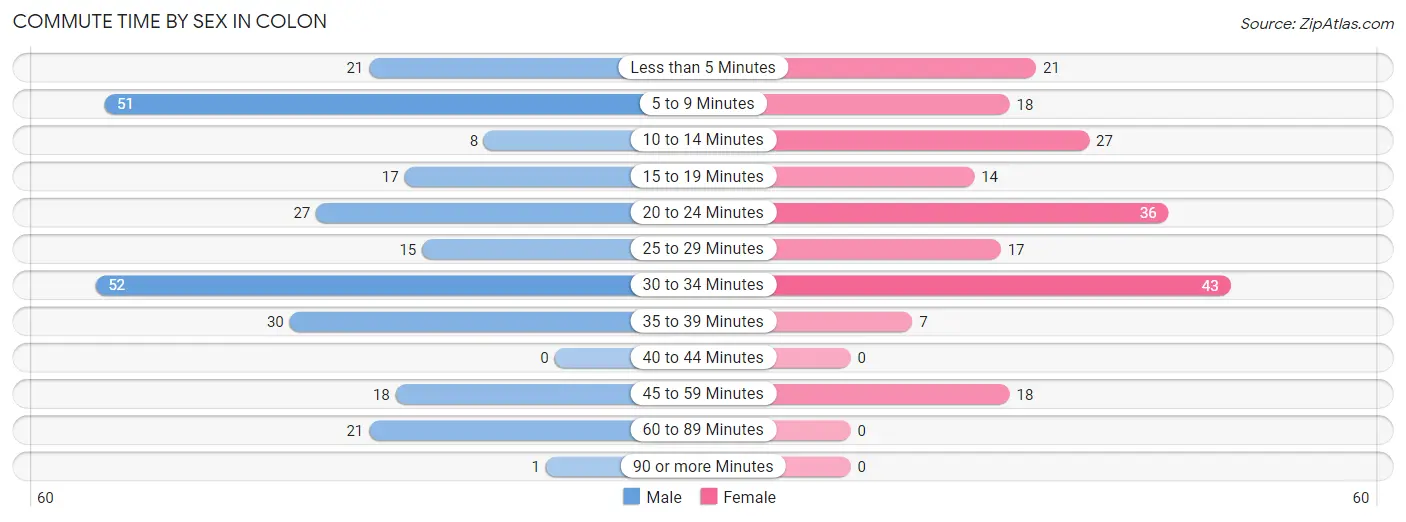
| Commute Time | Male | Female |
| Less than 5 Minutes | 21 (8.1%) | 21 (10.4%) |
| 5 to 9 Minutes | 51 (19.5%) | 18 (9.0%) |
| 10 to 14 Minutes | 8 (3.1%) | 27 (13.4%) |
| 15 to 19 Minutes | 17 (6.5%) | 14 (7.0%) |
| 20 to 24 Minutes | 27 (10.3%) | 36 (17.9%) |
| 25 to 29 Minutes | 15 (5.8%) | 17 (8.5%) |
| 30 to 34 Minutes | 52 (19.9%) | 43 (21.4%) |
| 35 to 39 Minutes | 30 (11.5%) | 7 (3.5%) |
| 40 to 44 Minutes | 0 (0.0%) | 0 (0.0%) |
| 45 to 59 Minutes | 18 (6.9%) | 18 (9.0%) |
| 60 to 89 Minutes | 21 (8.1%) | 0 (0.0%) |
| 90 or more Minutes | 1 (0.4%) | 0 (0.0%) |
Time of Departure to Work by Sex in Colon
The most frequent times of departure to work in Colon are 12:00 AM to 4:59 AM (51, 19.5%) for males and 6:30 AM to 6:59 AM (47, 23.4%) for females.
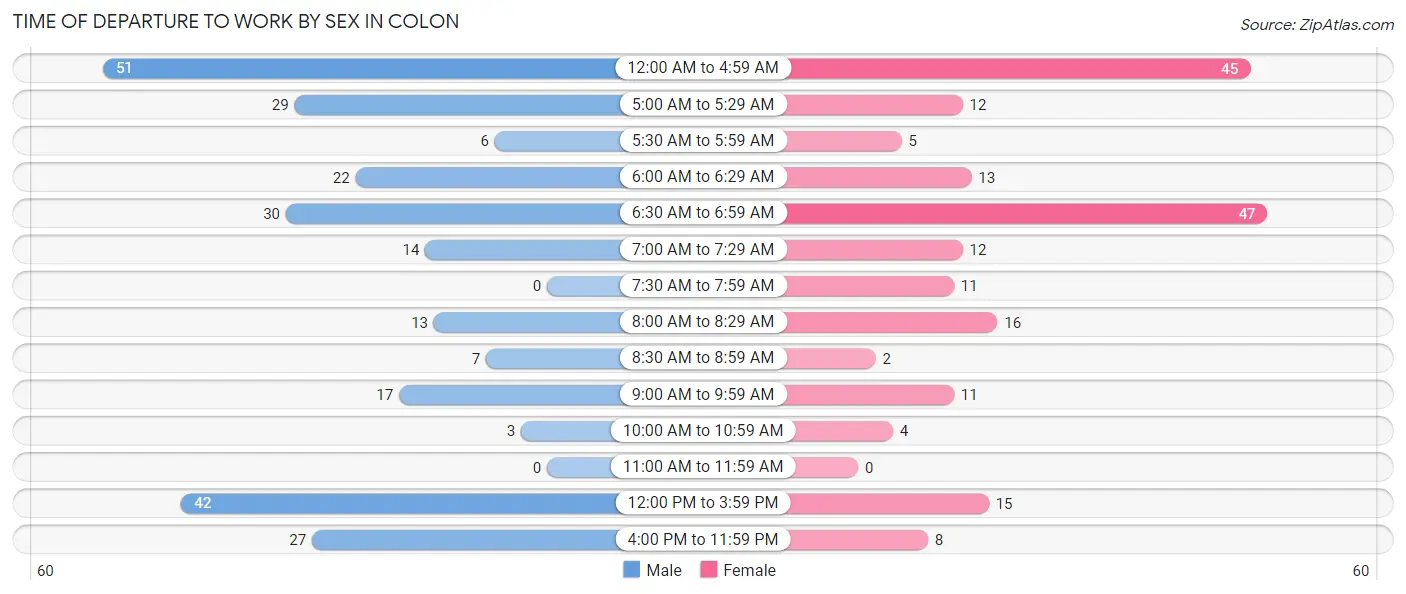
| Time of Departure | Male | Female |
| 12:00 AM to 4:59 AM | 51 (19.5%) | 45 (22.4%) |
| 5:00 AM to 5:29 AM | 29 (11.1%) | 12 (6.0%) |
| 5:30 AM to 5:59 AM | 6 (2.3%) | 5 (2.5%) |
| 6:00 AM to 6:29 AM | 22 (8.4%) | 13 (6.5%) |
| 6:30 AM to 6:59 AM | 30 (11.5%) | 47 (23.4%) |
| 7:00 AM to 7:29 AM | 14 (5.4%) | 12 (6.0%) |
| 7:30 AM to 7:59 AM | 0 (0.0%) | 11 (5.5%) |
| 8:00 AM to 8:29 AM | 13 (5.0%) | 16 (8.0%) |
| 8:30 AM to 8:59 AM | 7 (2.7%) | 2 (1.0%) |
| 9:00 AM to 9:59 AM | 17 (6.5%) | 11 (5.5%) |
| 10:00 AM to 10:59 AM | 3 (1.1%) | 4 (2.0%) |
| 11:00 AM to 11:59 AM | 0 (0.0%) | 0 (0.0%) |
| 12:00 PM to 3:59 PM | 42 (16.1%) | 15 (7.5%) |
| 4:00 PM to 11:59 PM | 27 (10.3%) | 8 (4.0%) |
| Total | 261 (100.0%) | 201 (100.0%) |
Housing Occupancy in Colon
Occupancy by Ownership in Colon
Of the total 589 dwellings in Colon, owner-occupied units account for 397 (67.4%), while renter-occupied units make up 192 (32.6%).
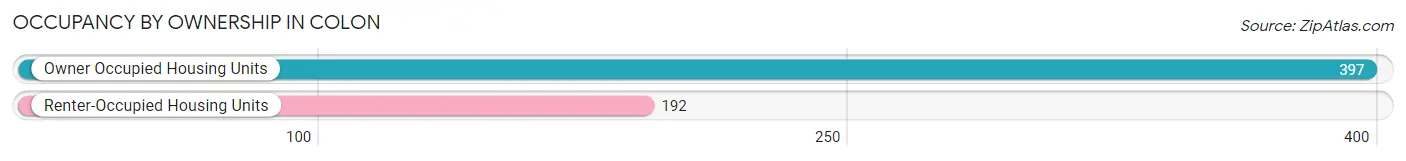
| Occupancy | # Housing Units | % Housing Units |
| Owner Occupied Housing Units | 397 | 67.4% |
| Renter-Occupied Housing Units | 192 | 32.6% |
| Total Occupied Housing Units | 589 | 100.0% |
Occupancy by Household Size in Colon
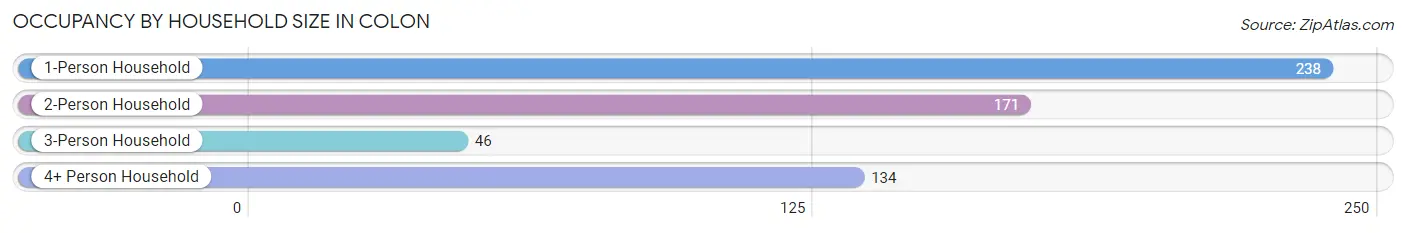
| Household Size | # Housing Units | % Housing Units |
| 1-Person Household | 238 | 40.4% |
| 2-Person Household | 171 | 29.0% |
| 3-Person Household | 46 | 7.8% |
| 4+ Person Household | 134 | 22.8% |
| Total Housing Units | 589 | 100.0% |
Occupancy by Ownership by Household Size in Colon
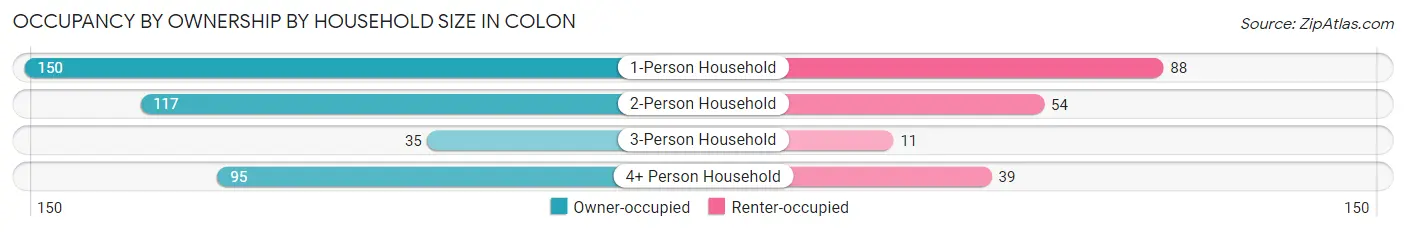
| Household Size | Owner-occupied | Renter-occupied |
| 1-Person Household | 150 (63.0%) | 88 (37.0%) |
| 2-Person Household | 117 (68.4%) | 54 (31.6%) |
| 3-Person Household | 35 (76.1%) | 11 (23.9%) |
| 4+ Person Household | 95 (70.9%) | 39 (29.1%) |
| Total Housing Units | 397 (67.4%) | 192 (32.6%) |
Occupancy by Educational Attainment in Colon
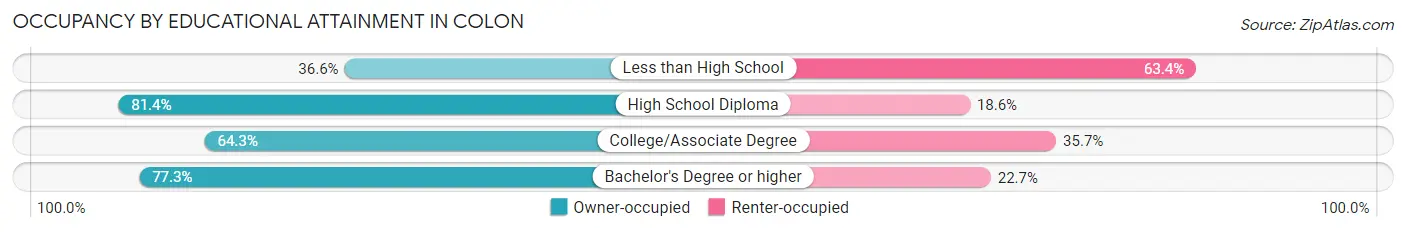
| Household Size | Owner-occupied | Renter-occupied |
| Less than High School | 30 (36.6%) | 52 (63.4%) |
| High School Diploma | 127 (81.4%) | 29 (18.6%) |
| College/Associate Degree | 155 (64.3%) | 86 (35.7%) |
| Bachelor's Degree or higher | 85 (77.3%) | 25 (22.7%) |
Occupancy by Age of Householder in Colon
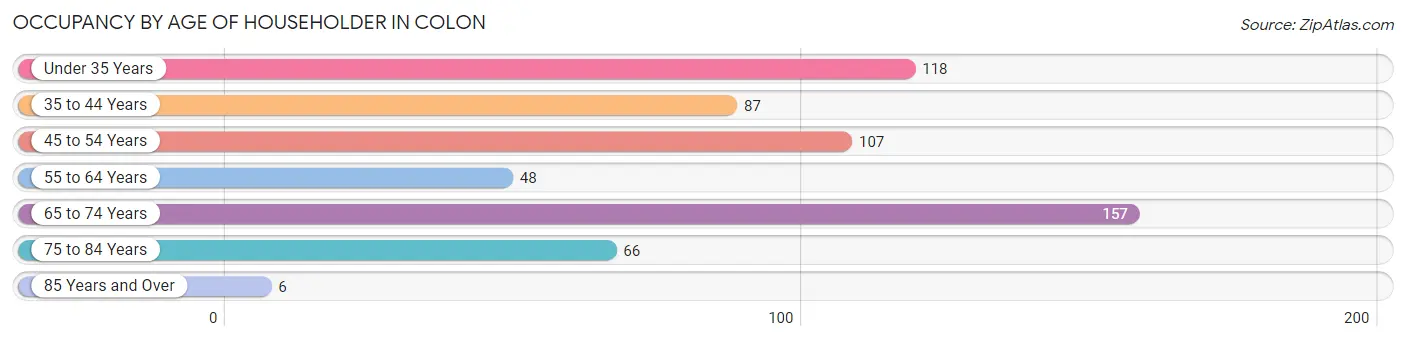
| Age Bracket | # Households | % Households |
| Under 35 Years | 118 | 20.0% |
| 35 to 44 Years | 87 | 14.8% |
| 45 to 54 Years | 107 | 18.2% |
| 55 to 64 Years | 48 | 8.2% |
| 65 to 74 Years | 157 | 26.7% |
| 75 to 84 Years | 66 | 11.2% |
| 85 Years and Over | 6 | 1.0% |
| Total | 589 | 100.0% |
Housing Finances in Colon
Median Income by Occupancy in Colon
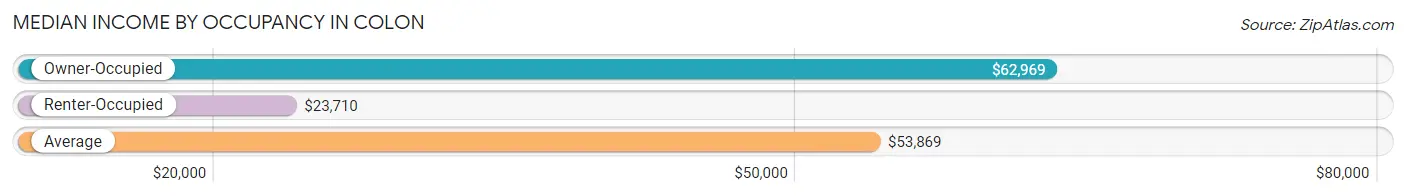
| Occupancy Type | # Households | Median Income |
| Owner-Occupied | 397 (67.4%) | $62,969 |
| Renter-Occupied | 192 (32.6%) | $23,710 |
| Average | 589 (100.0%) | $53,869 |
Occupancy by Householder Income Bracket in Colon
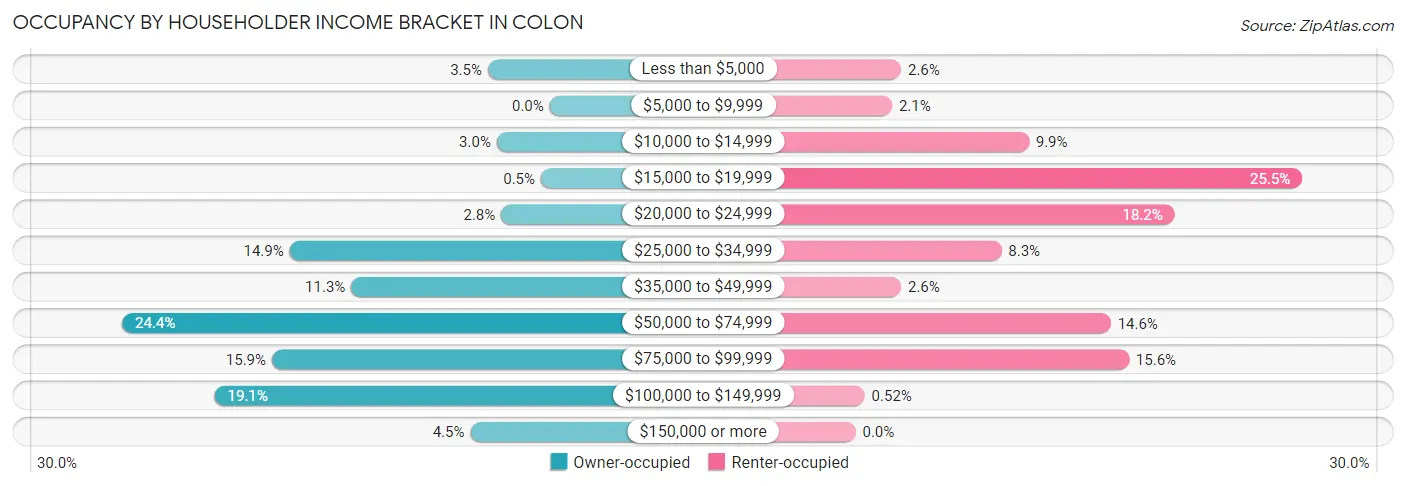
| Income Bracket | Owner-occupied | Renter-occupied |
| Less than $5,000 | 14 (3.5%) | 5 (2.6%) |
| $5,000 to $9,999 | 0 (0.0%) | 4 (2.1%) |
| $10,000 to $14,999 | 12 (3.0%) | 19 (9.9%) |
| $15,000 to $19,999 | 2 (0.5%) | 49 (25.5%) |
| $20,000 to $24,999 | 11 (2.8%) | 35 (18.2%) |
| $25,000 to $34,999 | 59 (14.9%) | 16 (8.3%) |
| $35,000 to $49,999 | 45 (11.3%) | 5 (2.6%) |
| $50,000 to $74,999 | 97 (24.4%) | 28 (14.6%) |
| $75,000 to $99,999 | 63 (15.9%) | 30 (15.6%) |
| $100,000 to $149,999 | 76 (19.1%) | 1 (0.5%) |
| $150,000 or more | 18 (4.5%) | 0 (0.0%) |
| Total | 397 (100.0%) | 192 (100.0%) |
Monthly Housing Cost Tiers in Colon
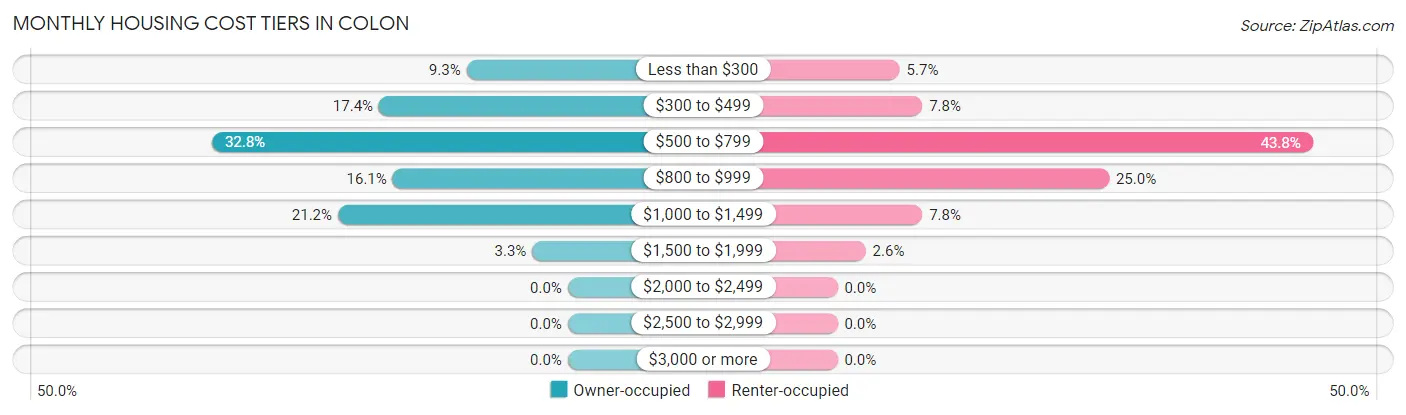
| Monthly Cost | Owner-occupied | Renter-occupied |
| Less than $300 | 37 (9.3%) | 11 (5.7%) |
| $300 to $499 | 69 (17.4%) | 15 (7.8%) |
| $500 to $799 | 130 (32.8%) | 84 (43.8%) |
| $800 to $999 | 64 (16.1%) | 48 (25.0%) |
| $1,000 to $1,499 | 84 (21.2%) | 15 (7.8%) |
| $1,500 to $1,999 | 13 (3.3%) | 5 (2.6%) |
| $2,000 to $2,499 | 0 (0.0%) | 0 (0.0%) |
| $2,500 to $2,999 | 0 (0.0%) | 0 (0.0%) |
| $3,000 or more | 0 (0.0%) | 0 (0.0%) |
| Total | 397 (100.0%) | 192 (100.0%) |
Physical Housing Characteristics in Colon
Housing Structures in Colon
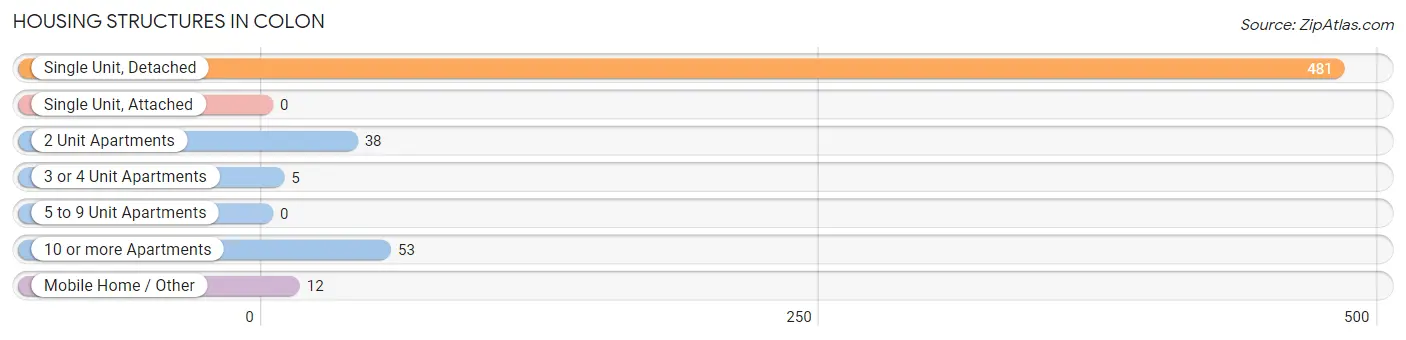
| Structure Type | # Housing Units | % Housing Units |
| Single Unit, Detached | 481 | 81.7% |
| Single Unit, Attached | 0 | 0.0% |
| 2 Unit Apartments | 38 | 6.5% |
| 3 or 4 Unit Apartments | 5 | 0.9% |
| 5 to 9 Unit Apartments | 0 | 0.0% |
| 10 or more Apartments | 53 | 9.0% |
| Mobile Home / Other | 12 | 2.0% |
| Total | 589 | 100.0% |
Housing Structures by Occupancy in Colon
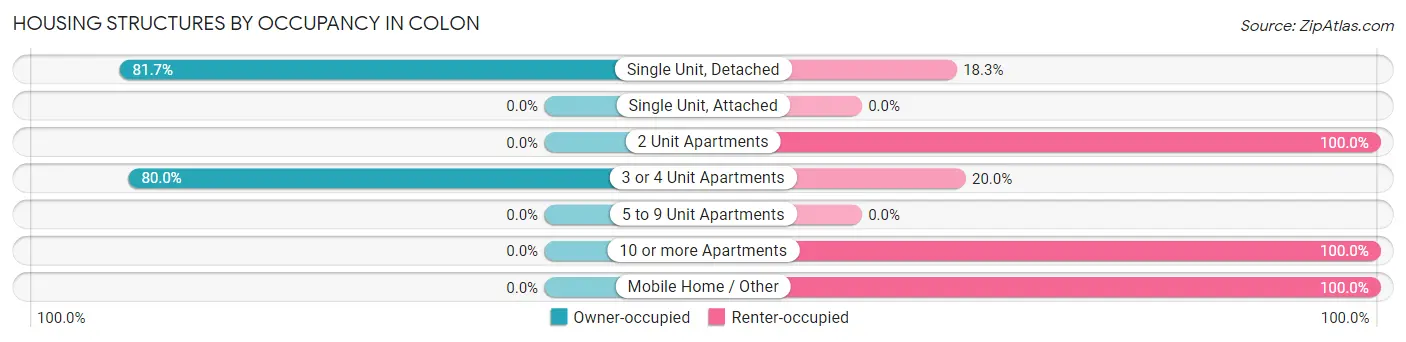
| Structure Type | Owner-occupied | Renter-occupied |
| Single Unit, Detached | 393 (81.7%) | 88 (18.3%) |
| Single Unit, Attached | 0 (0.0%) | 0 (0.0%) |
| 2 Unit Apartments | 0 (0.0%) | 38 (100.0%) |
| 3 or 4 Unit Apartments | 4 (80.0%) | 1 (20.0%) |
| 5 to 9 Unit Apartments | 0 (0.0%) | 0 (0.0%) |
| 10 or more Apartments | 0 (0.0%) | 53 (100.0%) |
| Mobile Home / Other | 0 (0.0%) | 12 (100.0%) |
| Total | 397 (67.4%) | 192 (32.6%) |
Housing Structures by Number of Rooms in Colon
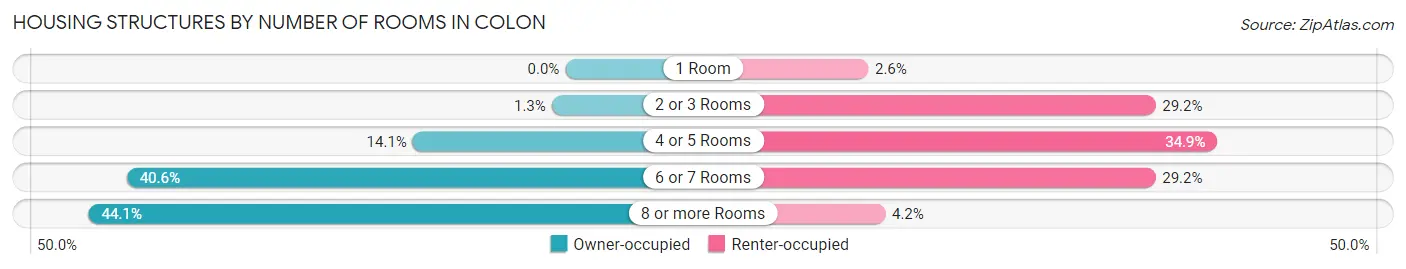
| Number of Rooms | Owner-occupied | Renter-occupied |
| 1 Room | 0 (0.0%) | 5 (2.6%) |
| 2 or 3 Rooms | 5 (1.3%) | 56 (29.2%) |
| 4 or 5 Rooms | 56 (14.1%) | 67 (34.9%) |
| 6 or 7 Rooms | 161 (40.6%) | 56 (29.2%) |
| 8 or more Rooms | 175 (44.1%) | 8 (4.2%) |
| Total | 397 (100.0%) | 192 (100.0%) |
Housing Structure by Heating Type in Colon
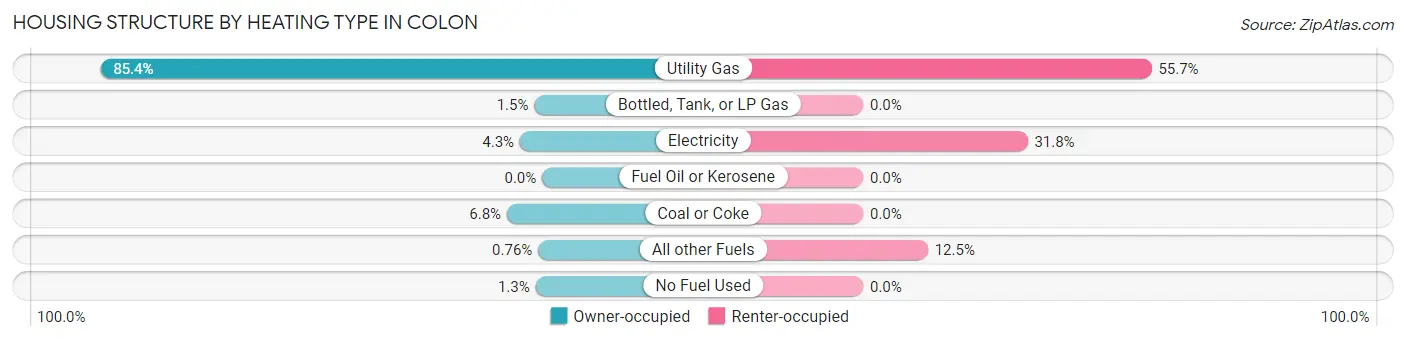
| Heating Type | Owner-occupied | Renter-occupied |
| Utility Gas | 339 (85.4%) | 107 (55.7%) |
| Bottled, Tank, or LP Gas | 6 (1.5%) | 0 (0.0%) |
| Electricity | 17 (4.3%) | 61 (31.8%) |
| Fuel Oil or Kerosene | 0 (0.0%) | 0 (0.0%) |
| Coal or Coke | 27 (6.8%) | 0 (0.0%) |
| All other Fuels | 3 (0.8%) | 24 (12.5%) |
| No Fuel Used | 5 (1.3%) | 0 (0.0%) |
| Total | 397 (100.0%) | 192 (100.0%) |
Household Vehicle Usage in Colon
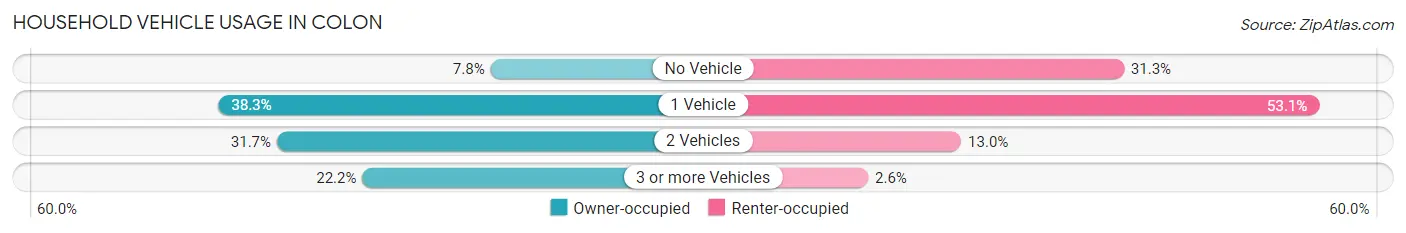
| Vehicles per Household | Owner-occupied | Renter-occupied |
| No Vehicle | 31 (7.8%) | 60 (31.2%) |
| 1 Vehicle | 152 (38.3%) | 102 (53.1%) |
| 2 Vehicles | 126 (31.7%) | 25 (13.0%) |
| 3 or more Vehicles | 88 (22.2%) | 5 (2.6%) |
| Total | 397 (100.0%) | 192 (100.0%) |
Real Estate & Mortgages in Colon
Real Estate and Mortgage Overview in Colon
| Characteristic | Without Mortgage | With Mortgage |
| Housing Units | 154 | 243 |
| Median Property Value | $161,500 | $109,700 |
| Median Household Income | $66,429 | $8 |
| Monthly Housing Costs | $413 | $0 |
| Real Estate Taxes | $1,529 | $3 |
Property Value by Mortgage Status in Colon
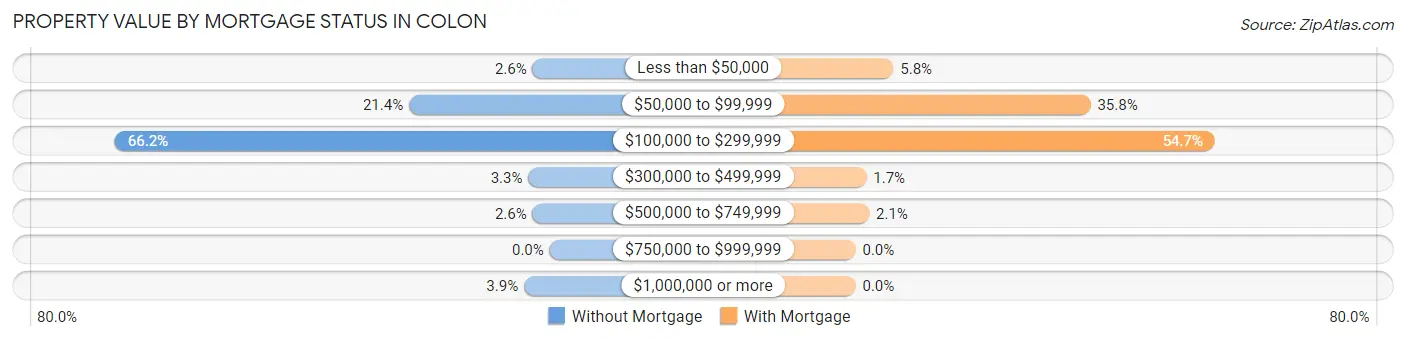
| Property Value | Without Mortgage | With Mortgage |
| Less than $50,000 | 4 (2.6%) | 14 (5.8%) |
| $50,000 to $99,999 | 33 (21.4%) | 87 (35.8%) |
| $100,000 to $299,999 | 102 (66.2%) | 133 (54.7%) |
| $300,000 to $499,999 | 5 (3.3%) | 4 (1.7%) |
| $500,000 to $749,999 | 4 (2.6%) | 5 (2.1%) |
| $750,000 to $999,999 | 0 (0.0%) | 0 (0.0%) |
| $1,000,000 or more | 6 (3.9%) | 0 (0.0%) |
| Total | 154 (100.0%) | 243 (100.0%) |
Household Income by Mortgage Status in Colon
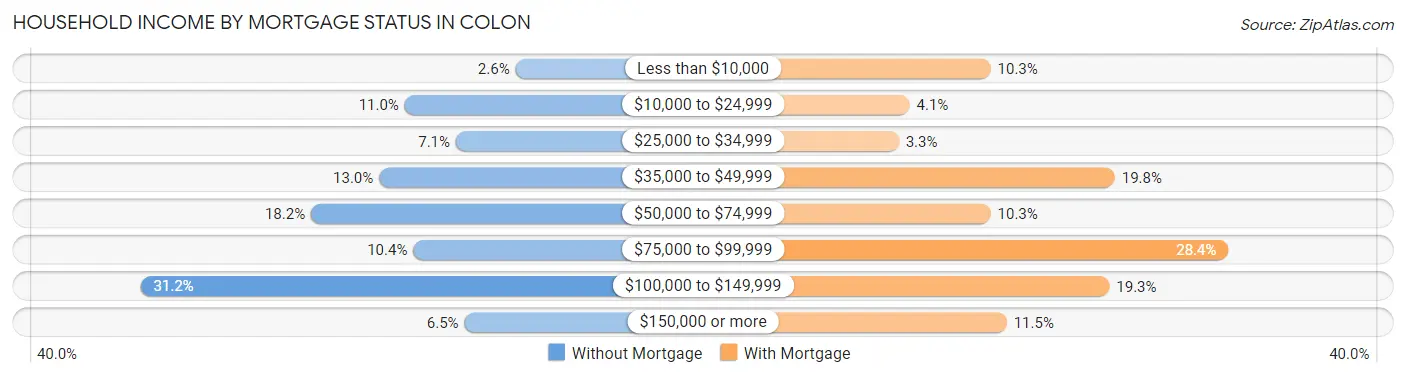
| Household Income | Without Mortgage | With Mortgage |
| Less than $10,000 | 4 (2.6%) | 25 (10.3%) |
| $10,000 to $24,999 | 17 (11.0%) | 10 (4.1%) |
| $25,000 to $34,999 | 11 (7.1%) | 8 (3.3%) |
| $35,000 to $49,999 | 20 (13.0%) | 48 (19.8%) |
| $50,000 to $74,999 | 28 (18.2%) | 25 (10.3%) |
| $75,000 to $99,999 | 16 (10.4%) | 69 (28.4%) |
| $100,000 to $149,999 | 48 (31.2%) | 47 (19.3%) |
| $150,000 or more | 10 (6.5%) | 28 (11.5%) |
| Total | 154 (100.0%) | 243 (100.0%) |
Property Value to Household Income Ratio in Colon
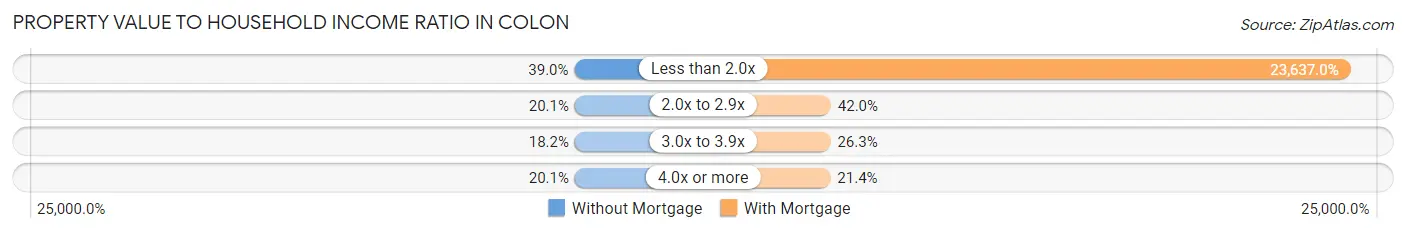
| Value-to-Income Ratio | Without Mortgage | With Mortgage |
| Less than 2.0x | 60 (39.0%) | 57,438 (23,637.0%) |
| 2.0x to 2.9x | 31 (20.1%) | 102 (42.0%) |
| 3.0x to 3.9x | 28 (18.2%) | 64 (26.3%) |
| 4.0x or more | 31 (20.1%) | 52 (21.4%) |
| Total | 154 (100.0%) | 243 (100.0%) |
Real Estate Taxes by Mortgage Status in Colon
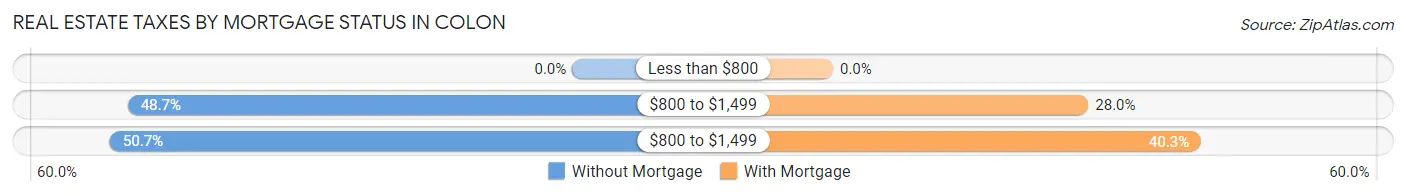
| Property Taxes | Without Mortgage | With Mortgage |
| Less than $800 | 0 (0.0%) | 0 (0.0%) |
| $800 to $1,499 | 75 (48.7%) | 68 (28.0%) |
| $800 to $1,499 | 78 (50.6%) | 98 (40.3%) |
| Total | 154 (100.0%) | 243 (100.0%) |
Health & Disability in Colon
Health Insurance Coverage by Age in Colon
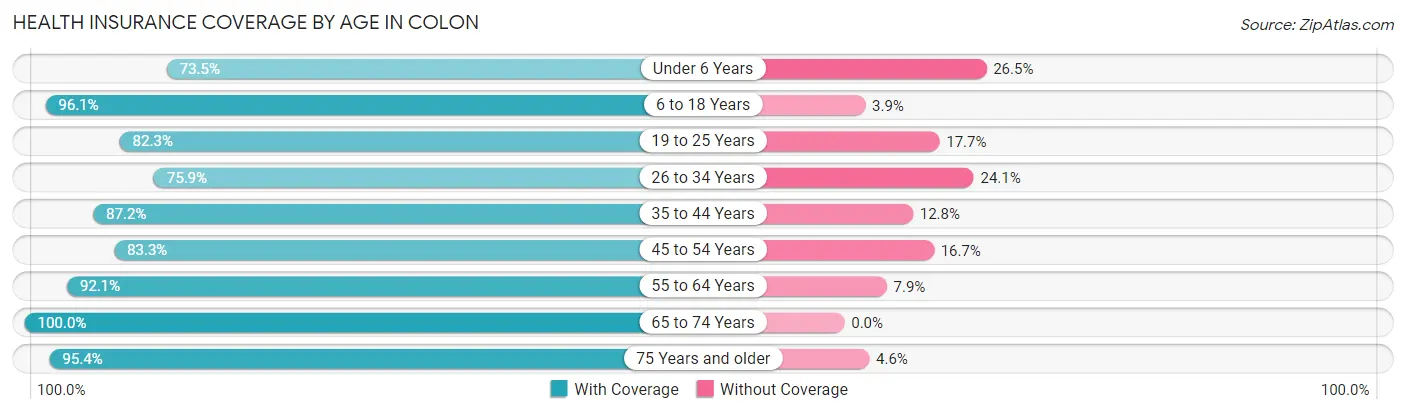
| Age Bracket | With Coverage | Without Coverage |
| Under 6 Years | 125 (73.5%) | 45 (26.5%) |
| 6 to 18 Years | 198 (96.1%) | 8 (3.9%) |
| 19 to 25 Years | 130 (82.3%) | 28 (17.7%) |
| 26 to 34 Years | 107 (75.9%) | 34 (24.1%) |
| 35 to 44 Years | 123 (87.2%) | 18 (12.8%) |
| 45 to 54 Years | 140 (83.3%) | 28 (16.7%) |
| 55 to 64 Years | 70 (92.1%) | 6 (7.9%) |
| 65 to 74 Years | 223 (100.0%) | 0 (0.0%) |
| 75 Years and older | 103 (95.4%) | 5 (4.6%) |
| Total | 1,219 (87.6%) | 172 (12.4%) |
Health Insurance Coverage by Citizenship Status in Colon
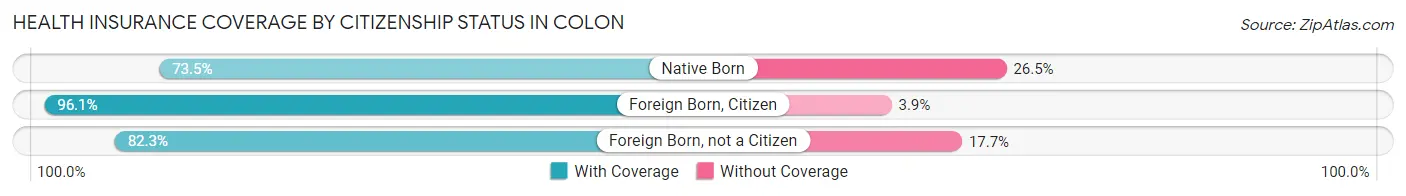
| Citizenship Status | With Coverage | Without Coverage |
| Native Born | 125 (73.5%) | 45 (26.5%) |
| Foreign Born, Citizen | 198 (96.1%) | 8 (3.9%) |
| Foreign Born, not a Citizen | 130 (82.3%) | 28 (17.7%) |
Health Insurance Coverage by Household Income in Colon
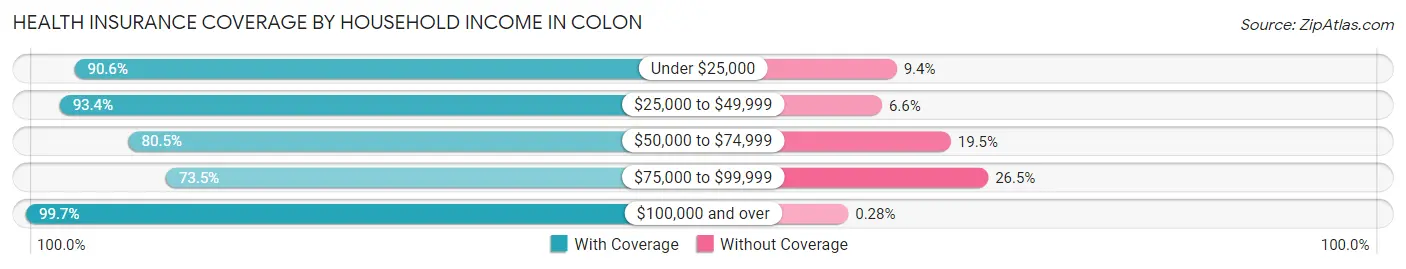
| Household Income | With Coverage | Without Coverage |
| Under $25,000 | 242 (90.6%) | 25 (9.4%) |
| $25,000 to $49,999 | 170 (93.4%) | 12 (6.6%) |
| $50,000 to $74,999 | 260 (80.5%) | 63 (19.5%) |
| $75,000 to $99,999 | 197 (73.5%) | 71 (26.5%) |
| $100,000 and over | 350 (99.7%) | 1 (0.3%) |
Public vs Private Health Insurance Coverage by Age in Colon
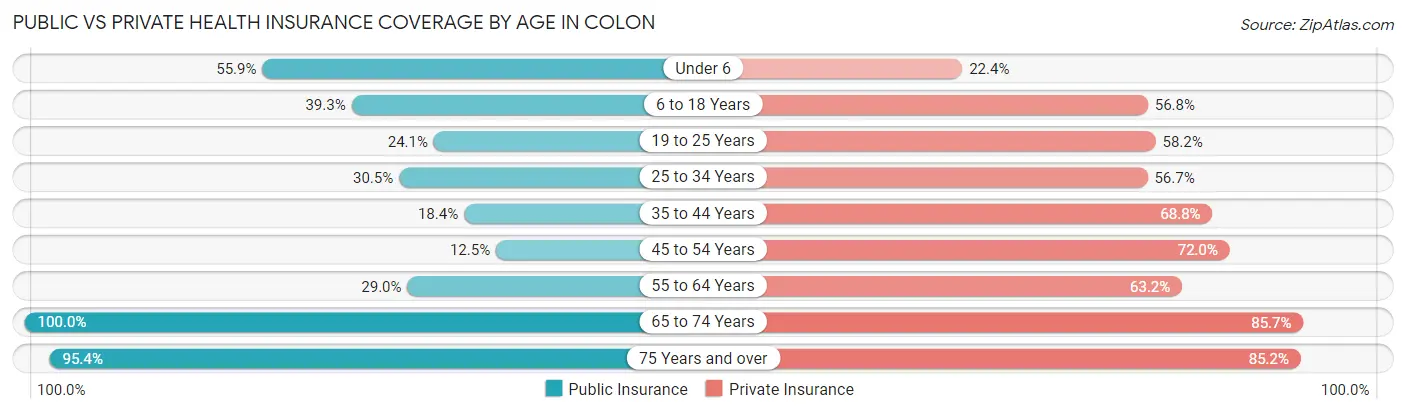
| Age Bracket | Public Insurance | Private Insurance |
| Under 6 | 95 (55.9%) | 38 (22.4%) |
| 6 to 18 Years | 81 (39.3%) | 117 (56.8%) |
| 19 to 25 Years | 38 (24.0%) | 92 (58.2%) |
| 25 to 34 Years | 43 (30.5%) | 80 (56.7%) |
| 35 to 44 Years | 26 (18.4%) | 97 (68.8%) |
| 45 to 54 Years | 21 (12.5%) | 121 (72.0%) |
| 55 to 64 Years | 22 (28.9%) | 48 (63.2%) |
| 65 to 74 Years | 223 (100.0%) | 191 (85.7%) |
| 75 Years and over | 103 (95.4%) | 92 (85.2%) |
| Total | 652 (46.9%) | 876 (63.0%) |
Disability Status by Sex by Age in Colon
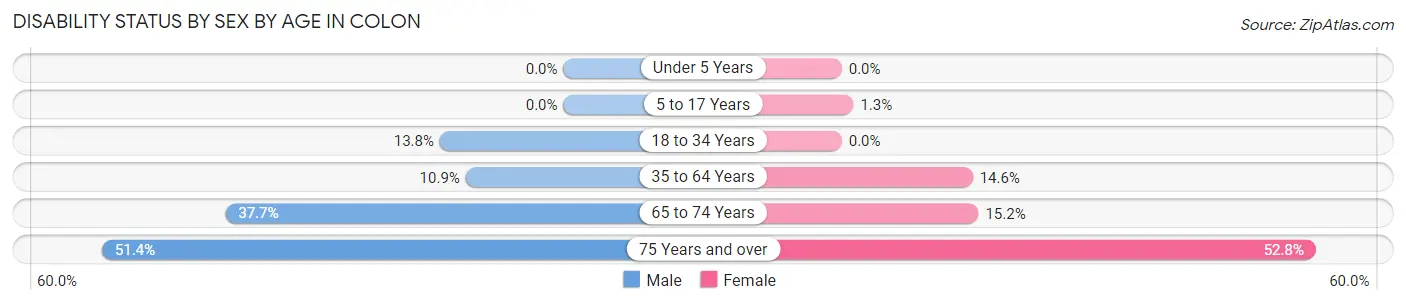
| Age Bracket | Male | Female |
| Under 5 Years | 0 (0.0%) | 0 (0.0%) |
| 5 to 17 Years | 0 (0.0%) | 1 (1.3%) |
| 18 to 34 Years | 26 (13.8%) | 0 (0.0%) |
| 35 to 64 Years | 21 (10.9%) | 28 (14.6%) |
| 65 to 74 Years | 32 (37.7%) | 21 (15.2%) |
| 75 Years and over | 37 (51.4%) | 19 (52.8%) |
Disability Class by Sex by Age in Colon
Disability Class: Hearing Difficulty
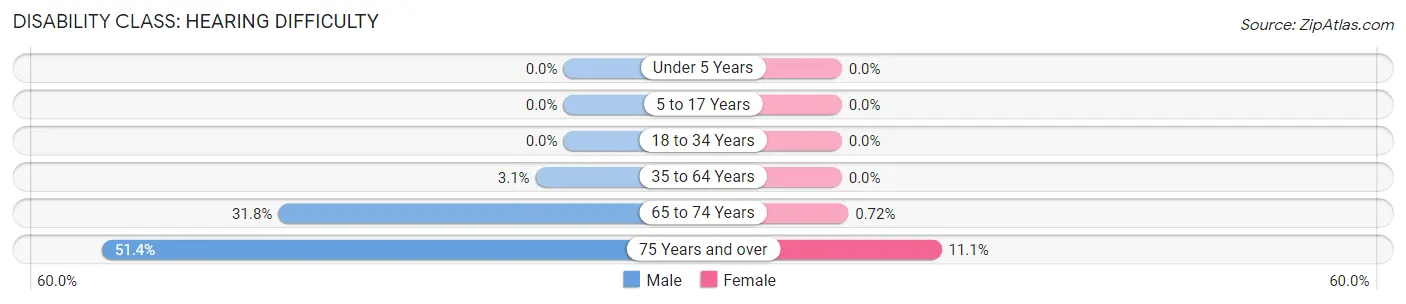
| Age Bracket | Male | Female |
| Under 5 Years | 0 (0.0%) | 0 (0.0%) |
| 5 to 17 Years | 0 (0.0%) | 0 (0.0%) |
| 18 to 34 Years | 0 (0.0%) | 0 (0.0%) |
| 35 to 64 Years | 6 (3.1%) | 0 (0.0%) |
| 65 to 74 Years | 27 (31.8%) | 1 (0.7%) |
| 75 Years and over | 37 (51.4%) | 4 (11.1%) |
Disability Class: Vision Difficulty
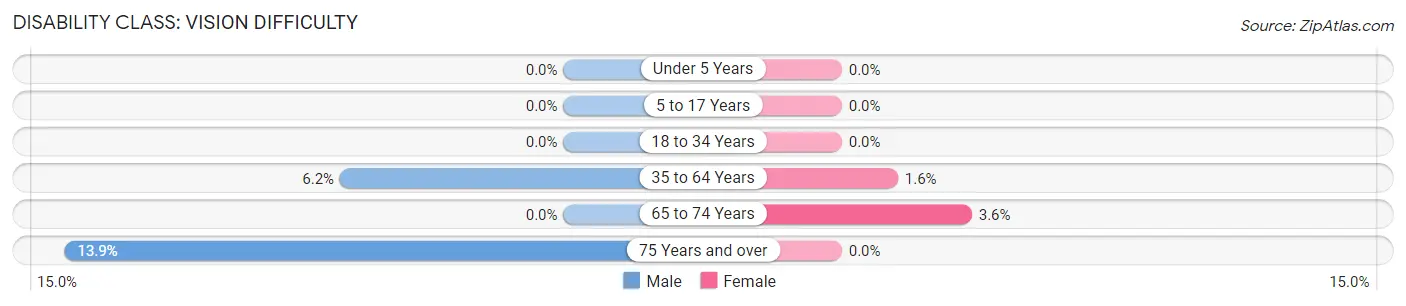
| Age Bracket | Male | Female |
| Under 5 Years | 0 (0.0%) | 0 (0.0%) |
| 5 to 17 Years | 0 (0.0%) | 0 (0.0%) |
| 18 to 34 Years | 0 (0.0%) | 0 (0.0%) |
| 35 to 64 Years | 12 (6.2%) | 3 (1.6%) |
| 65 to 74 Years | 0 (0.0%) | 5 (3.6%) |
| 75 Years and over | 10 (13.9%) | 0 (0.0%) |
Disability Class: Cognitive Difficulty
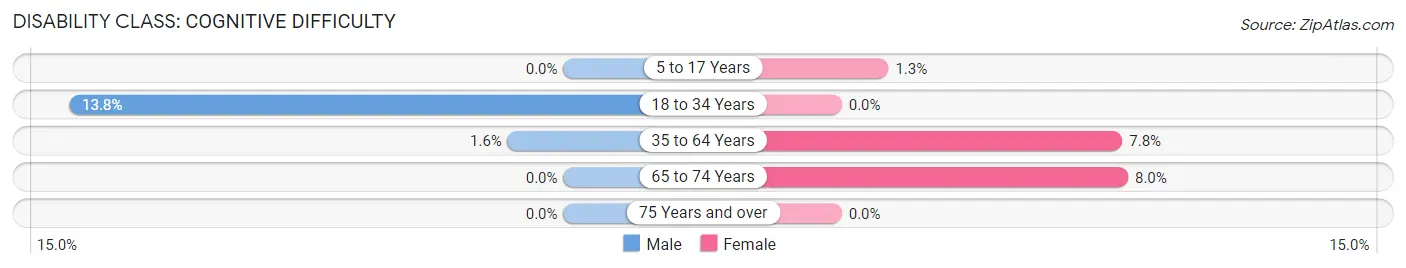
| Age Bracket | Male | Female |
| 5 to 17 Years | 0 (0.0%) | 1 (1.3%) |
| 18 to 34 Years | 26 (13.8%) | 0 (0.0%) |
| 35 to 64 Years | 3 (1.5%) | 15 (7.8%) |
| 65 to 74 Years | 0 (0.0%) | 11 (8.0%) |
| 75 Years and over | 0 (0.0%) | 0 (0.0%) |
Disability Class: Ambulatory Difficulty
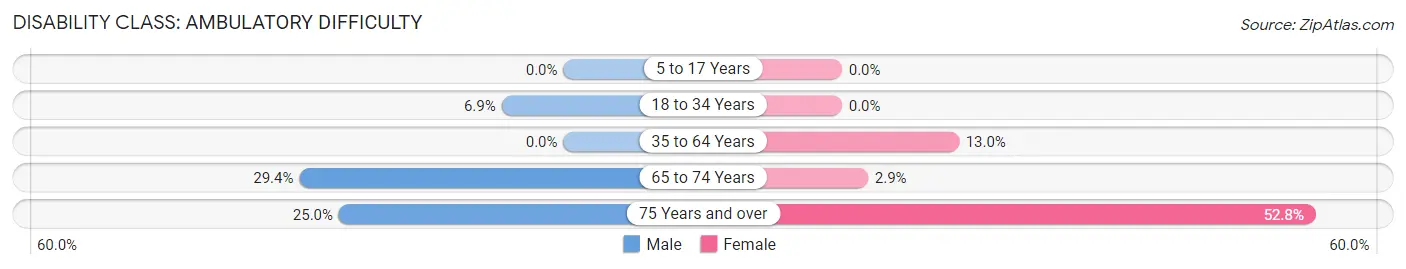
| Age Bracket | Male | Female |
| 5 to 17 Years | 0 (0.0%) | 0 (0.0%) |
| 18 to 34 Years | 13 (6.9%) | 0 (0.0%) |
| 35 to 64 Years | 0 (0.0%) | 25 (13.0%) |
| 65 to 74 Years | 25 (29.4%) | 4 (2.9%) |
| 75 Years and over | 18 (25.0%) | 19 (52.8%) |
Disability Class: Self-Care Difficulty
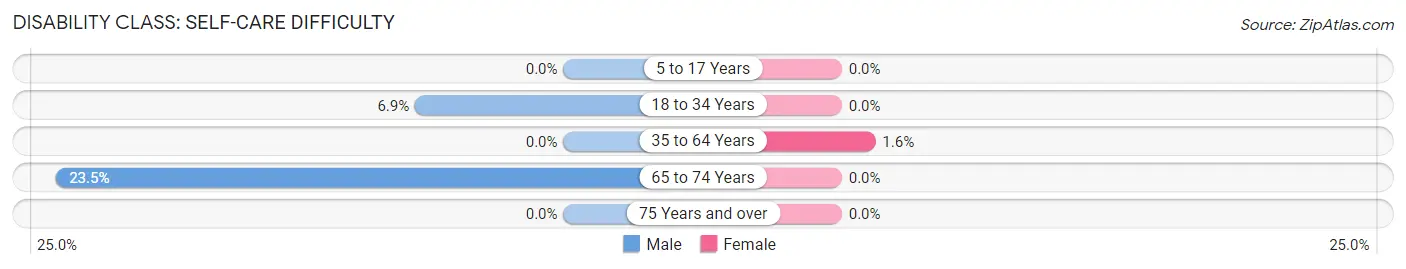
| Age Bracket | Male | Female |
| 5 to 17 Years | 0 (0.0%) | 0 (0.0%) |
| 18 to 34 Years | 13 (6.9%) | 0 (0.0%) |
| 35 to 64 Years | 0 (0.0%) | 3 (1.6%) |
| 65 to 74 Years | 20 (23.5%) | 0 (0.0%) |
| 75 Years and over | 0 (0.0%) | 0 (0.0%) |
Technology Access in Colon
Computing Device Access in Colon
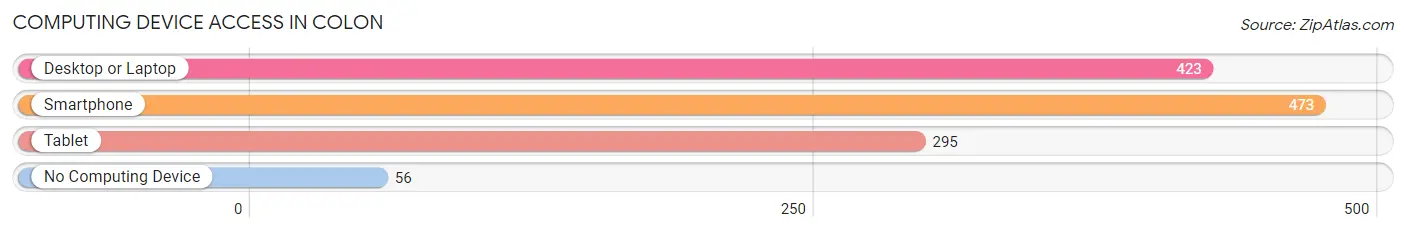
| Device Type | # Households | % Households |
| Desktop or Laptop | 423 | 71.8% |
| Smartphone | 473 | 80.3% |
| Tablet | 295 | 50.1% |
| No Computing Device | 56 | 9.5% |
| Total | 589 | 100.0% |
Internet Access in Colon
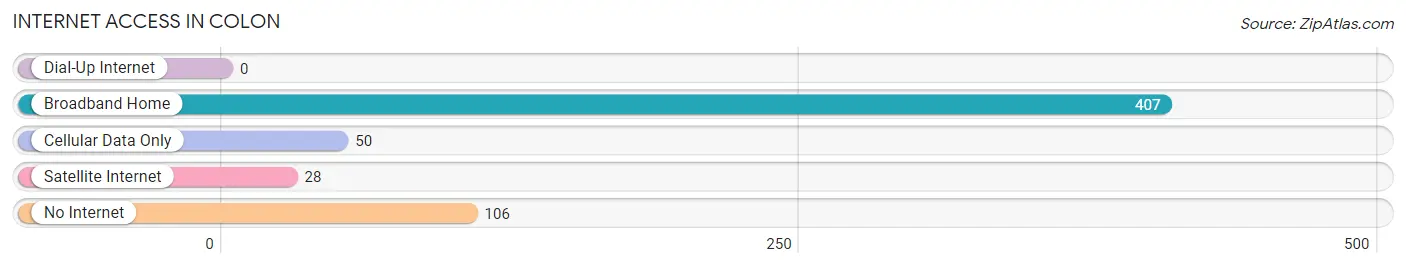
| Internet Type | # Households | % Households |
| Dial-Up Internet | 0 | 0.0% |
| Broadband Home | 407 | 69.1% |
| Cellular Data Only | 50 | 8.5% |
| Satellite Internet | 28 | 4.8% |
| No Internet | 106 | 18.0% |
| Total | 589 | 100.0% |
Colon Summary
Colon, Michigan is a small village located in St. Joseph County in the south-central part of the state. It is situated on the banks of the St. Joseph River, approximately 10 miles east of the city of Kalamazoo. The village has a population of 1,068 as of the 2010 census, and is the home of the world-famous Magic Capital of the World, the annual Magic Festival, and the International Shrine Clown Association.
History
Colon was first settled in 1831 by a group of settlers from New York. The village was named after the nearby St. Joseph River, which was named after the Spanish explorer, Father Francisco Colon. The village was incorporated in 1867 and was the first village in St. Joseph County to be incorporated.
The village was a major stop on the Michigan Central Railroad, which ran from Detroit to Chicago. The railroad brought many new settlers to the area, and the village grew rapidly. By the late 1800s, Colon had become a major center for the production of furniture, and the village was home to several furniture factories.
In the early 1900s, Colon became known as the Magic Capital of the World. This was due to the presence of several prominent magicians, including Harry Blackstone Sr., who lived in the village. The village also became home to the annual Magic Festival, which is held every summer and attracts magicians from around the world.
Geography
Colon is located in the south-central part of Michigan, approximately 10 miles east of the city of Kalamazoo. The village is situated on the banks of the St. Joseph River, and is surrounded by rolling hills and farmland. The village is located in St. Joseph County, and is part of the Kalamazoo-Portage Metropolitan Statistical Area.
The village has a total area of 1.2 square miles, all of which is land. The village is located at an elevation of 845 feet above sea level.
Economy
The economy of Colon is largely based on agriculture and tourism. The village is home to several farms, which produce a variety of crops, including corn, soybeans, and wheat. The village is also home to several tourist attractions, including the Magic Festival, the International Shrine Clown Association, and the Magic Capital of the World.
The village is also home to several small businesses, including restaurants, retail stores, and service providers. The village is also home to several manufacturing companies, including a furniture factory and a plastics factory.
Demographics
As of the 2010 census, the village had a population of 1,068. The racial makeup of the village was 97.2% White, 0.7% African American, 0.3% Native American, 0.2% Asian, 0.1% Pacific Islander, 0.3% from other races, and 1.2% from two or more races. Hispanic or Latino of any race were 1.2% of the population.
The median income for a household in the village was $37,500, and the median income for a family was $45,000. The per capita income for the village was $18,845. About 8.3% of families and 10.2% of the population were below the poverty line, including 14.3% of those under age 18 and 5.3% of those age 65 or over.
Common Questions
What is Per Capita Income in Colon?
Per Capita income in Colon is $26,518.
What is the Median Family Income in Colon?
Median Family Income in Colon is $67,917.
What is the Median Household income in Colon?
Median Household Income in Colon is $53,869.
What is Income or Wage Gap in Colon?
Income or Wage Gap in Colon is 26.9%.
Women in Colon earn 73.1 cents for every dollar earned by a man.
What is Family Income Deficit in Colon?
Family Income Deficit in Colon is $10,535.
Families that are below poverty line in Colon earn $10,535 less on average than the poverty threshold level.
What is Inequality or Gini Index in Colon?
Inequality or Gini Index in Colon is 0.40.
What is the Total Population of Colon?
Total Population of Colon is 1,391.
What is the Total Male Population of Colon?
Total Male Population of Colon is 715.
What is the Total Female Population of Colon?
Total Female Population of Colon is 676.
What is the Ratio of Males per 100 Females in Colon?
There are 105.77 Males per 100 Females in Colon.
What is the Ratio of Females per 100 Males in Colon?
There are 94.55 Females per 100 Males in Colon.
What is the Median Population Age in Colon?
Median Population Age in Colon is 37.4 Years.
What is the Average Family Size in Colon
Average Family Size in Colon is 3.2 People.
What is the Average Household Size in Colon
Average Household Size in Colon is 2.4 People.
How Large is the Labor Force in Colon?
There are 639 People in the Labor Forcein in Colon.
What is the Percentage of People in the Labor Force in Colon?
59.8% of People are in the Labor Force in Colon.
What is the Unemployment Rate in Colon?
Unemployment Rate in Colon is 7.0%.