Coloma, MI Map & Demographics
Coloma Map
Coloma Overview
$31,018
PER CAPITA INCOME
$84,231
AVG FAMILY INCOME
$60,481
AVG HOUSEHOLD INCOME
14.5%
WAGE / INCOME GAP [ % ]
85.5¢/ $1
WAGE / INCOME GAP [ $ ]
0.36
INEQUALITY / GINI INDEX
1,171
TOTAL POPULATION
598
MALE POPULATION
573
FEMALE POPULATION
104.36
MALES / 100 FEMALES
95.82
FEMALES / 100 MALES
36.6
MEDIAN AGE
3.3
AVG FAMILY SIZE
2.4
AVG HOUSEHOLD SIZE
597
LABOR FORCE [ PEOPLE ]
66.3%
PERCENT IN LABOR FORCE
4.2%
UNEMPLOYMENT RATE
Coloma Zip Codes
Coloma Area Codes
Income in Coloma
Income Overview in Coloma
Per Capita Income in Coloma is $31,018, while median incomes of families and households are $84,231 and $60,481 respectively.
| Characteristic | Number | Measure |
| Per Capita Income | 1,171 | $31,018 |
| Median Family Income | 268 | $84,231 |
| Mean Family Income | 268 | $84,721 |
| Median Household Income | 487 | $60,481 |
| Mean Household Income | 487 | $71,827 |
| Income Deficit | 268 | $0 |
| Wage / Income Gap (%) | 1,171 | 14.47% |
| Wage / Income Gap ($) | 1,171 | 85.53¢ per $1 |
| Gini / Inequality Index | 1,171 | 0.36 |
Earnings by Sex in Coloma
Average Earnings in Coloma are $34,632, $39,063 for men and $33,409 for women, a difference of 14.5%.
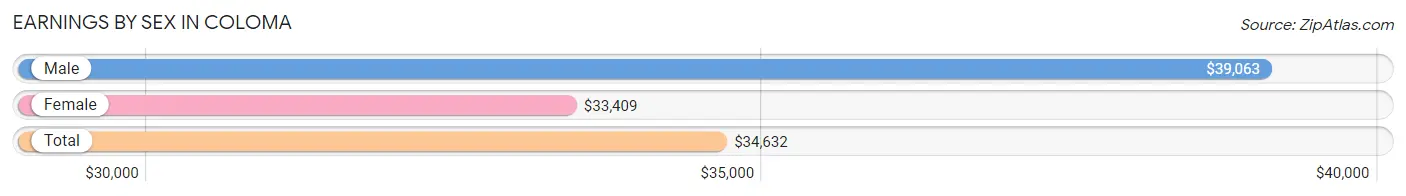
| Sex | Number | Average Earnings |
| Male | 345 (56.5%) | $39,063 |
| Female | 266 (43.5%) | $33,409 |
| Total | 611 (100.0%) | $34,632 |
Earnings by Sex by Income Bracket in Coloma
The most common earnings brackets in Coloma are $75,000 to $99,999 for men (57 | 16.5%) and $50,000 to $54,999 for women (27 | 10.2%).
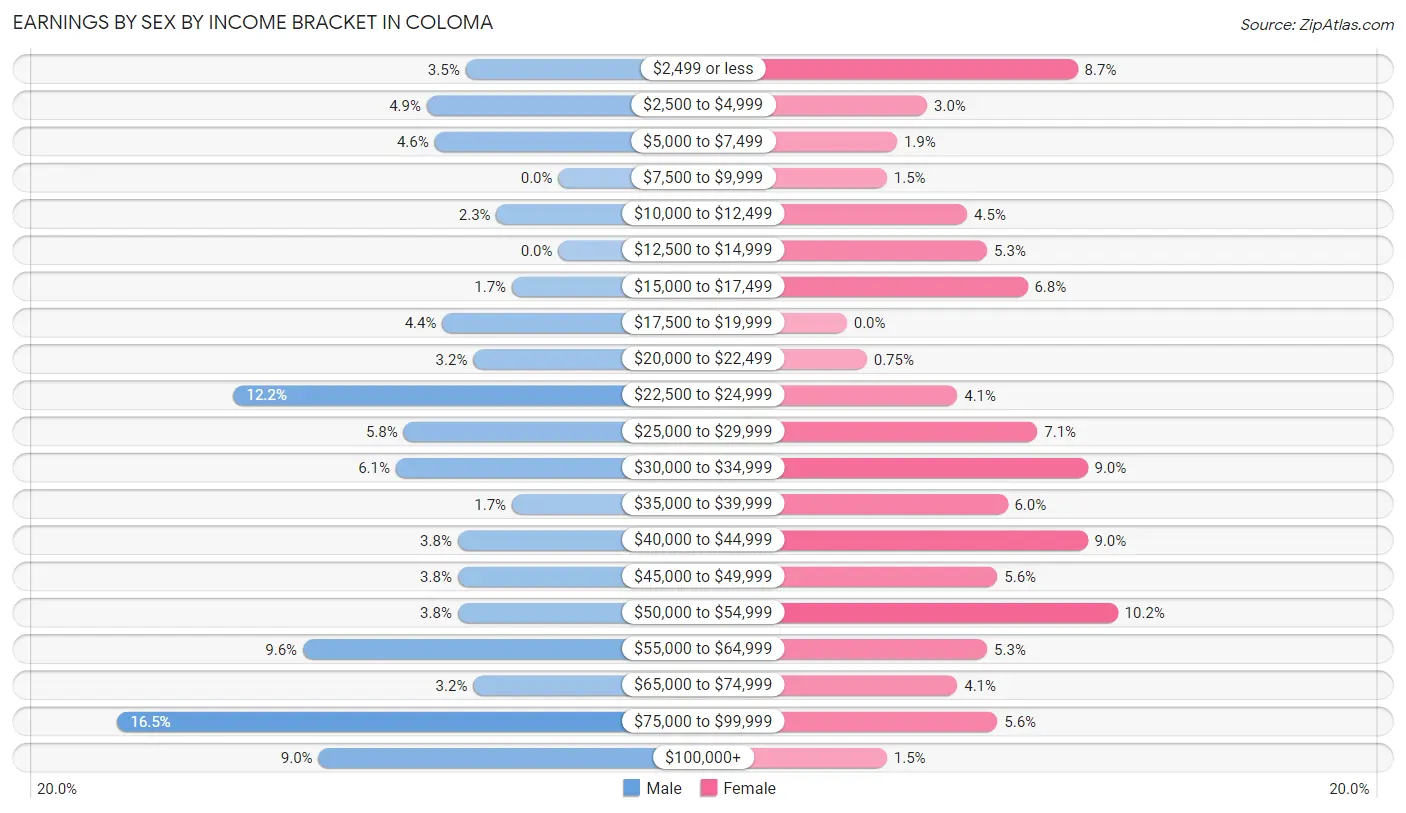
| Income | Male | Female |
| $2,499 or less | 12 (3.5%) | 23 (8.6%) |
| $2,500 to $4,999 | 17 (4.9%) | 8 (3.0%) |
| $5,000 to $7,499 | 16 (4.6%) | 5 (1.9%) |
| $7,500 to $9,999 | 0 (0.0%) | 4 (1.5%) |
| $10,000 to $12,499 | 8 (2.3%) | 12 (4.5%) |
| $12,500 to $14,999 | 0 (0.0%) | 14 (5.3%) |
| $15,000 to $17,499 | 6 (1.7%) | 18 (6.8%) |
| $17,500 to $19,999 | 15 (4.3%) | 0 (0.0%) |
| $20,000 to $22,499 | 11 (3.2%) | 2 (0.7%) |
| $22,500 to $24,999 | 42 (12.2%) | 11 (4.1%) |
| $25,000 to $29,999 | 20 (5.8%) | 19 (7.1%) |
| $30,000 to $34,999 | 21 (6.1%) | 24 (9.0%) |
| $35,000 to $39,999 | 6 (1.7%) | 16 (6.0%) |
| $40,000 to $44,999 | 13 (3.8%) | 24 (9.0%) |
| $45,000 to $49,999 | 13 (3.8%) | 15 (5.6%) |
| $50,000 to $54,999 | 13 (3.8%) | 27 (10.2%) |
| $55,000 to $64,999 | 33 (9.6%) | 14 (5.3%) |
| $65,000 to $74,999 | 11 (3.2%) | 11 (4.1%) |
| $75,000 to $99,999 | 57 (16.5%) | 15 (5.6%) |
| $100,000+ | 31 (9.0%) | 4 (1.5%) |
| Total | 345 (100.0%) | 266 (100.0%) |
Earnings by Sex by Educational Attainment in Coloma
Average earnings in Coloma are $48,333 for men and $34,545 for women, a difference of 28.5%. Men with an educational attainment of bachelor's degree enjoy the highest average annual earnings of $87,917, while those with college or associate's degree education earn the least with $29,583. Women with an educational attainment of graduate degree earn the most with the average annual earnings of $50,833, while those with college or associate's degree education have the smallest earnings of $26,250.
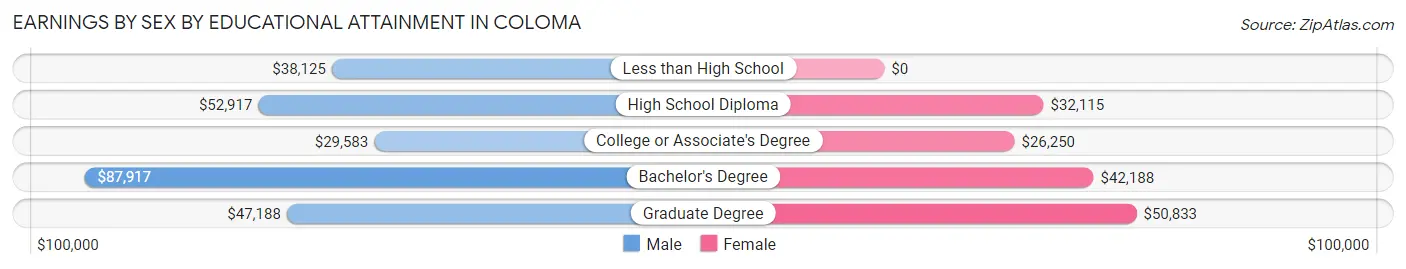
| Educational Attainment | Male Income | Female Income |
| Less than High School | $38,125 | $0 |
| High School Diploma | $52,917 | $32,115 |
| College or Associate's Degree | $29,583 | $26,250 |
| Bachelor's Degree | $87,917 | $42,188 |
| Graduate Degree | $47,188 | $50,833 |
| Total | $48,333 | $34,545 |
Family Income in Coloma
Family Income Brackets in Coloma
According to the Coloma family income data, there are 74 families falling into the $75,000 to $99,999 income range, which is the most common income bracket and makes up 27.6% of all families.
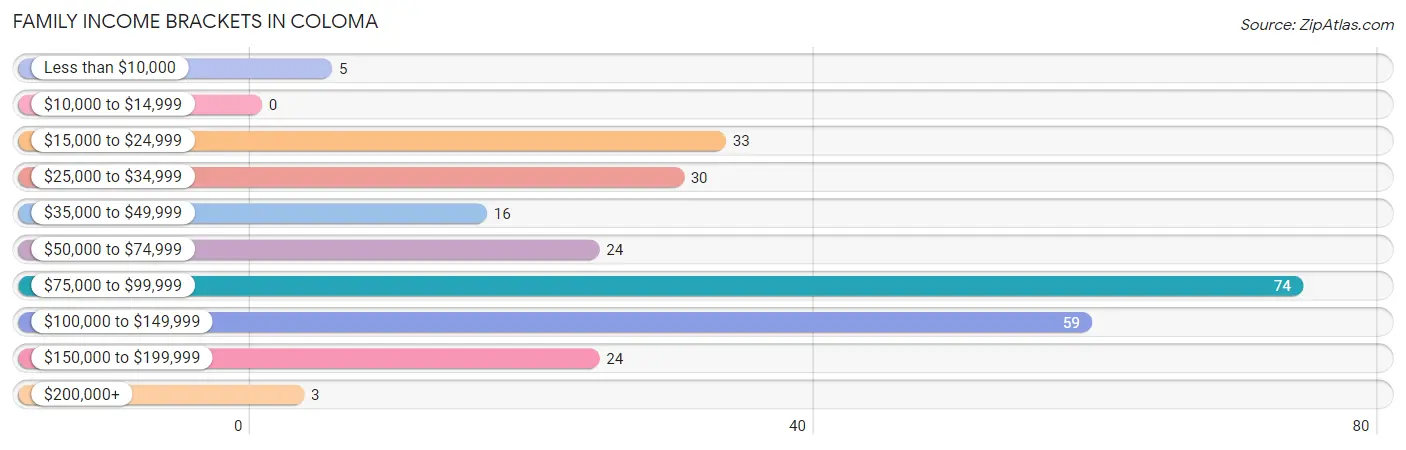
| Income Bracket | # Families | % Families |
| Less than $10,000 | 5 | 1.9% |
| $10,000 to $14,999 | 0 | 0.0% |
| $15,000 to $24,999 | 33 | 12.3% |
| $25,000 to $34,999 | 30 | 11.2% |
| $35,000 to $49,999 | 16 | 6.0% |
| $50,000 to $74,999 | 24 | 9.0% |
| $75,000 to $99,999 | 74 | 27.6% |
| $100,000 to $149,999 | 59 | 22.0% |
| $150,000 to $199,999 | 24 | 9.0% |
| $200,000+ | 3 | 1.1% |
Family Income by Famaliy Size in Coloma
4-person families (51 | 19.0%) account for the highest median family income in Coloma with $128,750 per family, while 2-person families (121 | 45.2%) have the highest median income of $40,729 per family member.
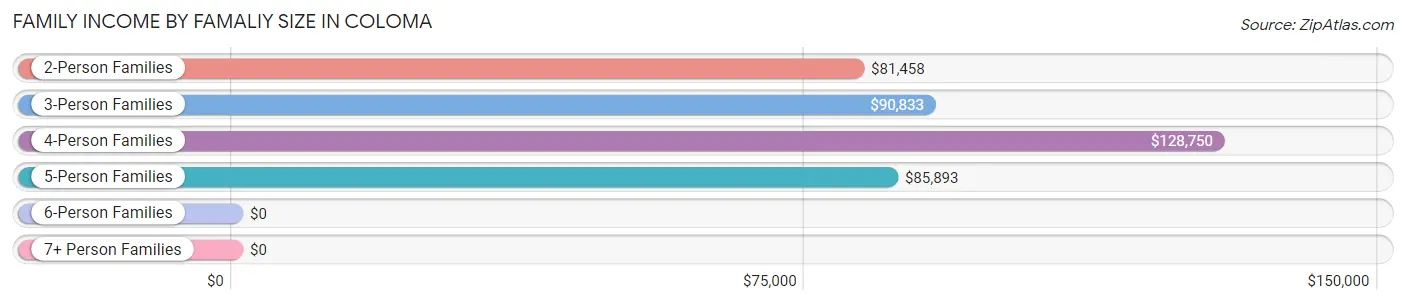
| Income Bracket | # Families | Median Income |
| 2-Person Families | 121 (45.2%) | $81,458 |
| 3-Person Families | 56 (20.9%) | $90,833 |
| 4-Person Families | 51 (19.0%) | $128,750 |
| 5-Person Families | 31 (11.6%) | $85,893 |
| 6-Person Families | 9 (3.4%) | $0 |
| 7+ Person Families | 0 (0.0%) | $0 |
| Total | 268 (100.0%) | $84,231 |
Family Income by Number of Earners in Coloma
The median family income in Coloma is $84,231, with families comprising 3+ earners (12) having the highest median family income of $161,500, while families with 1 earner (89) have the lowest median family income of $51,875, accounting for 4.5% and 33.2% of families, respectively.
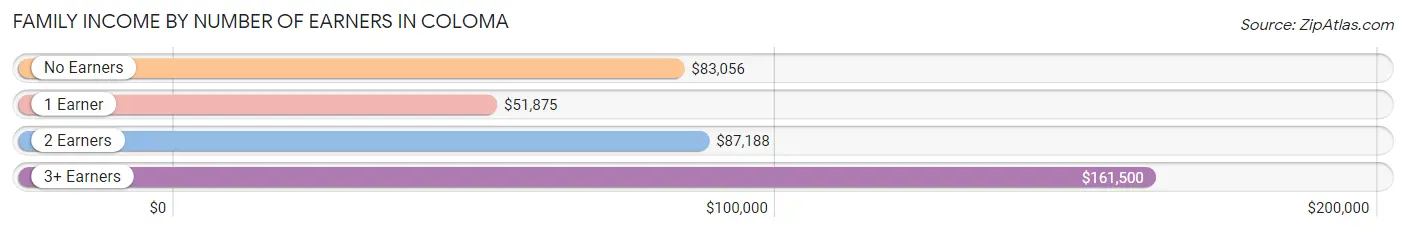
| Number of Earners | # Families | Median Income |
| No Earners | 38 (14.2%) | $83,056 |
| 1 Earner | 89 (33.2%) | $51,875 |
| 2 Earners | 129 (48.1%) | $87,188 |
| 3+ Earners | 12 (4.5%) | $161,500 |
| Total | 268 (100.0%) | $84,231 |
Household Income in Coloma
Household Income Brackets in Coloma
With 99 households falling in the category, the $50,000 to $74,999 income range is the most frequent in Coloma, accounting for 20.3% of all households. In contrast, only 3 households (0.6%) fall into the $10,000 to $14,999 income bracket, making it the least populous group.
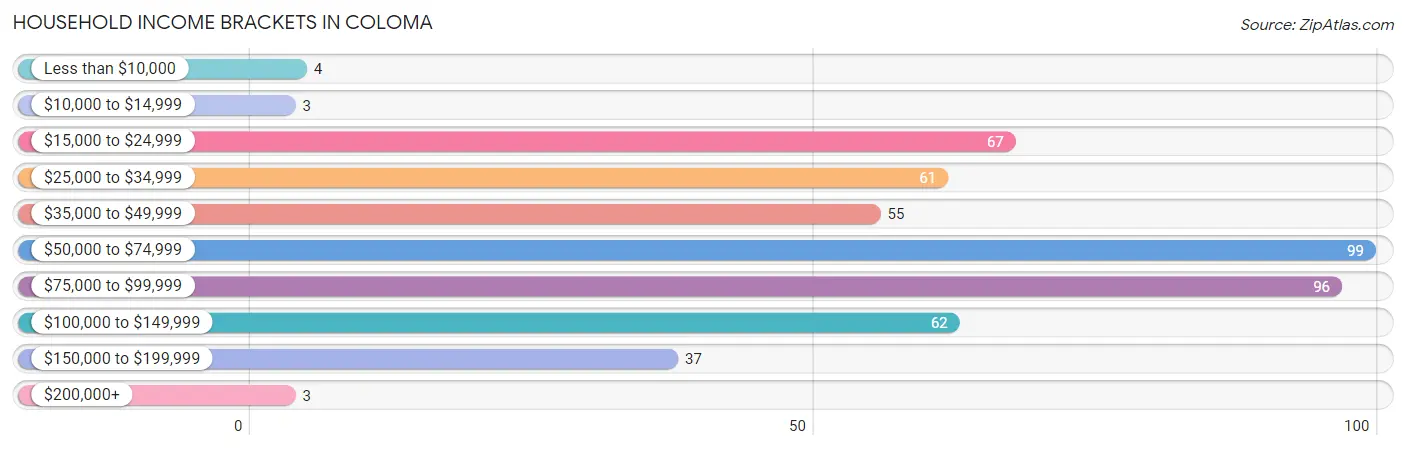
| Income Bracket | # Households | % Households |
| Less than $10,000 | 4 | 0.8% |
| $10,000 to $14,999 | 3 | 0.6% |
| $15,000 to $24,999 | 67 | 13.8% |
| $25,000 to $34,999 | 61 | 12.5% |
| $35,000 to $49,999 | 55 | 11.3% |
| $50,000 to $74,999 | 99 | 20.3% |
| $75,000 to $99,999 | 96 | 19.7% |
| $100,000 to $149,999 | 62 | 12.7% |
| $150,000 to $199,999 | 37 | 7.6% |
| $200,000+ | 3 | 0.6% |
Household Income by Householder Age in Coloma
The median household income in Coloma is $60,481, with the highest median household income of $78,295 found in the 25 to 44 years age bracket for the primary householder. A total of 181 households (37.2%) fall into this category. Meanwhile, the 65+ years age bracket for the primary householder has the lowest median household income of $48,333, with 144 households (29.6%) in this group.
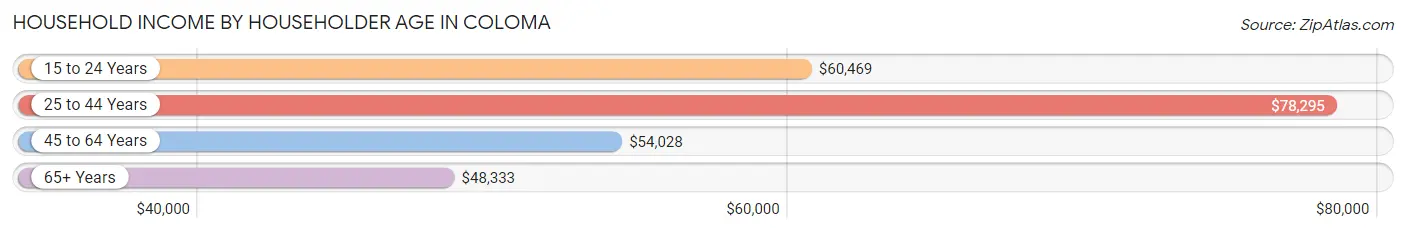
| Income Bracket | # Households | Median Income |
| 15 to 24 Years | 15 (3.1%) | $60,469 |
| 25 to 44 Years | 181 (37.2%) | $78,295 |
| 45 to 64 Years | 147 (30.2%) | $54,028 |
| 65+ Years | 144 (29.6%) | $48,333 |
| Total | 487 (100.0%) | $60,481 |
Poverty in Coloma
Income Below Poverty by Sex and Age in Coloma
With 12.1% poverty level for males and 10.7% for females among the residents of Coloma, 12 to 14 year old males and 6 to 11 year old females are the most vulnerable to poverty, with 8 males (47.1%) and 14 females (41.2%) in their respective age groups living below the poverty level.
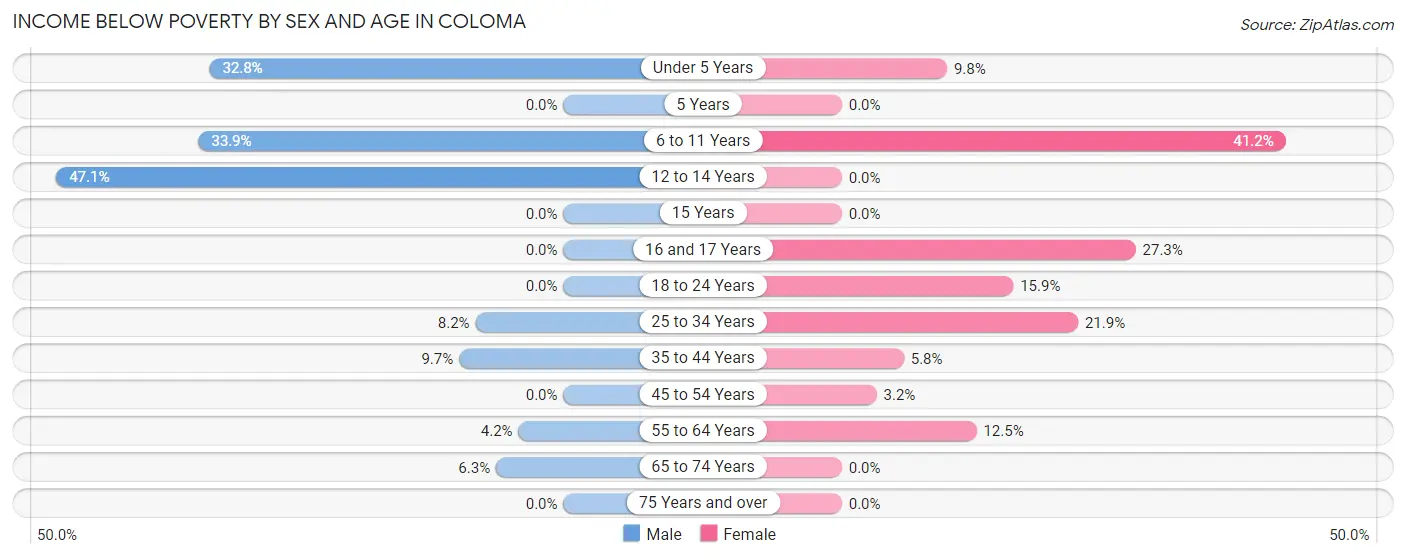
| Age Bracket | Male | Female |
| Under 5 Years | 22 (32.8%) | 4 (9.8%) |
| 5 Years | 0 (0.0%) | 0 (0.0%) |
| 6 to 11 Years | 21 (33.9%) | 14 (41.2%) |
| 12 to 14 Years | 8 (47.1%) | 0 (0.0%) |
| 15 Years | 0 (0.0%) | 0 (0.0%) |
| 16 and 17 Years | 0 (0.0%) | 6 (27.3%) |
| 18 to 24 Years | 0 (0.0%) | 7 (15.9%) |
| 25 to 34 Years | 8 (8.2%) | 16 (21.9%) |
| 35 to 44 Years | 6 (9.7%) | 5 (5.8%) |
| 45 to 54 Years | 0 (0.0%) | 2 (3.2%) |
| 55 to 64 Years | 3 (4.2%) | 7 (12.5%) |
| 65 to 74 Years | 4 (6.2%) | 0 (0.0%) |
| 75 Years and over | 0 (0.0%) | 0 (0.0%) |
| Total | 72 (12.1%) | 61 (10.7%) |
Income Above Poverty by Sex and Age in Coloma
According to the poverty statistics in Coloma, males aged 5 years and females aged 5 years are the age groups that are most secure financially, with 100.0% of males and 100.0% of females in these age groups living above the poverty line.
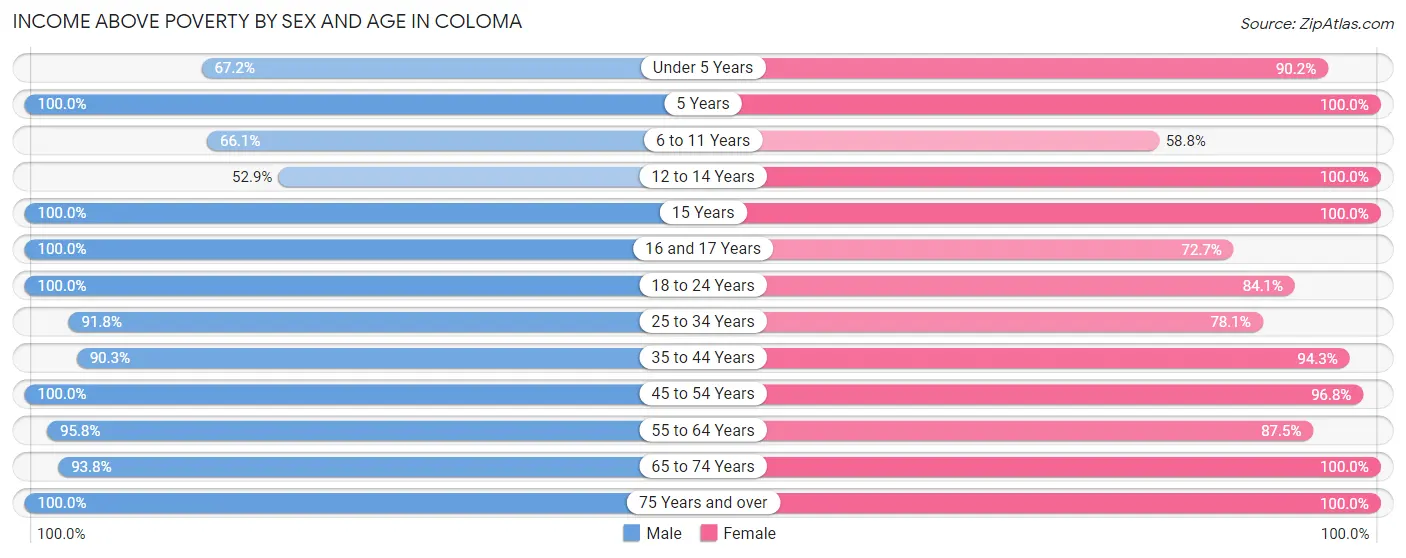
| Age Bracket | Male | Female |
| Under 5 Years | 45 (67.2%) | 37 (90.2%) |
| 5 Years | 12 (100.0%) | 1 (100.0%) |
| 6 to 11 Years | 41 (66.1%) | 20 (58.8%) |
| 12 to 14 Years | 9 (52.9%) | 19 (100.0%) |
| 15 Years | 1 (100.0%) | 12 (100.0%) |
| 16 and 17 Years | 5 (100.0%) | 16 (72.7%) |
| 18 to 24 Years | 54 (100.0%) | 37 (84.1%) |
| 25 to 34 Years | 90 (91.8%) | 57 (78.1%) |
| 35 to 44 Years | 56 (90.3%) | 82 (94.3%) |
| 45 to 54 Years | 57 (100.0%) | 60 (96.8%) |
| 55 to 64 Years | 69 (95.8%) | 49 (87.5%) |
| 65 to 74 Years | 60 (93.8%) | 91 (100.0%) |
| 75 Years and over | 25 (100.0%) | 28 (100.0%) |
| Total | 524 (87.9%) | 509 (89.3%) |
Income Below Poverty Among Married-Couple Families in Coloma
The poverty statistics for married-couple families in Coloma show that 4.5% or 9 of the total 202 families live below the poverty line. Families with 3 or 4 children have the highest poverty rate of 15.6%, comprising of 5 families. On the other hand, families with no children have the lowest poverty rate of 0.0%, which includes 0 families.
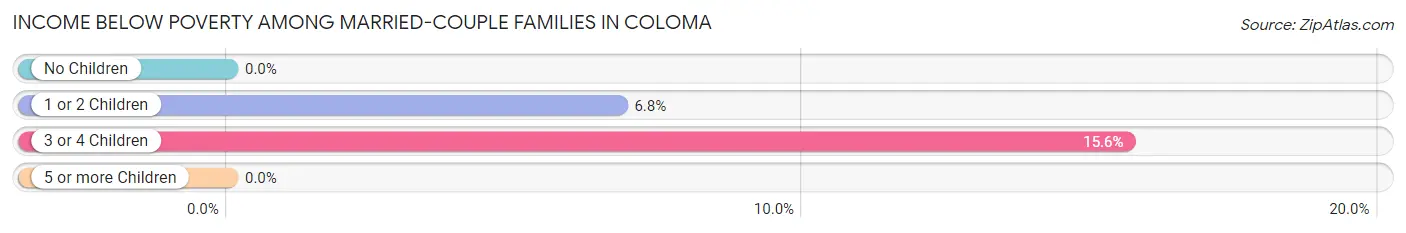
| Children | Above Poverty | Below Poverty |
| No Children | 111 (100.0%) | 0 (0.0%) |
| 1 or 2 Children | 55 (93.2%) | 4 (6.8%) |
| 3 or 4 Children | 27 (84.4%) | 5 (15.6%) |
| 5 or more Children | 0 (0.0%) | 0 (0.0%) |
| Total | 193 (95.5%) | 9 (4.5%) |
Income Below Poverty Among Single-Parent Households in Coloma
According to the poverty data in Coloma, 14.3% or 3 single-father households and 33.3% or 15 single-mother households are living below the poverty line. Among single-father households, those with 1 or 2 children have the highest poverty rate, with 3 households (30.0%) experiencing poverty. Likewise, among single-mother households, those with 3 or 4 children have the highest poverty rate, with 10 households (76.9%) falling below the poverty line.
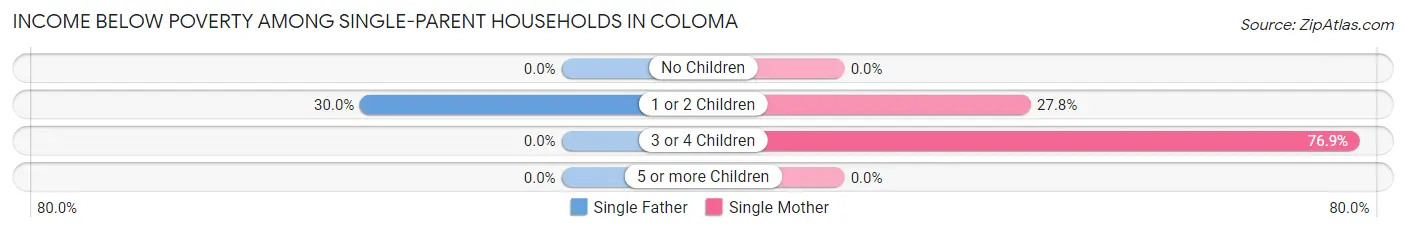
| Children | Single Father | Single Mother |
| No Children | 0 (0.0%) | 0 (0.0%) |
| 1 or 2 Children | 3 (30.0%) | 5 (27.8%) |
| 3 or 4 Children | 0 (0.0%) | 10 (76.9%) |
| 5 or more Children | 0 (0.0%) | 0 (0.0%) |
| Total | 3 (14.3%) | 15 (33.3%) |
Income Below Poverty Among Married-Couple vs Single-Parent Households in Coloma
The poverty data for Coloma shows that 9 of the married-couple family households (4.5%) and 18 of the single-parent households (27.3%) are living below the poverty level. Within the married-couple family households, those with 3 or 4 children have the highest poverty rate, with 5 households (15.6%) falling below the poverty line. Among the single-parent households, those with 3 or 4 children have the highest poverty rate, with 10 household (76.9%) living below poverty.
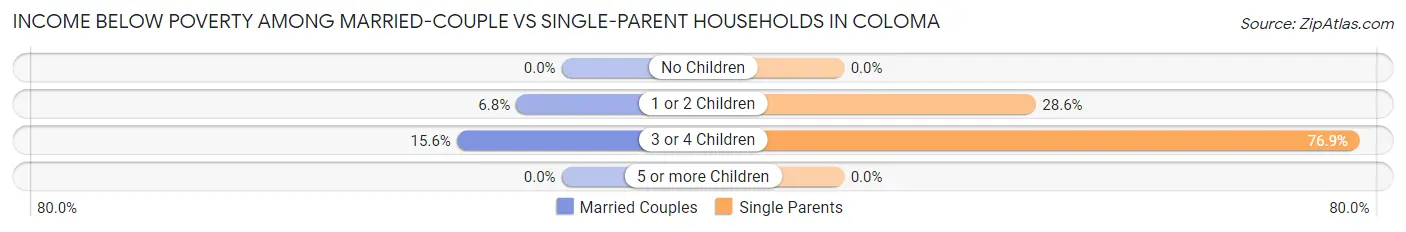
| Children | Married-Couple Families | Single-Parent Households |
| No Children | 0 (0.0%) | 0 (0.0%) |
| 1 or 2 Children | 4 (6.8%) | 8 (28.6%) |
| 3 or 4 Children | 5 (15.6%) | 10 (76.9%) |
| 5 or more Children | 0 (0.0%) | 0 (0.0%) |
| Total | 9 (4.5%) | 18 (27.3%) |
Race in Coloma
The most populous races in Coloma are White / Caucasian (1,065 | 90.9%), Two or more Races (62 | 5.3%), and Hispanic or Latino (53 | 4.5%).
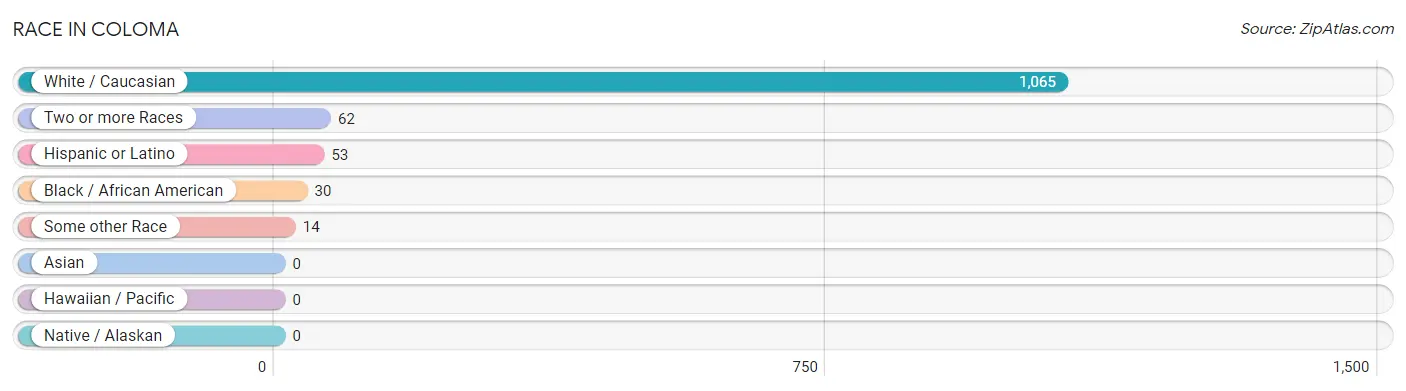
| Race | # Population | % Population |
| Asian | 0 | 0.0% |
| Black / African American | 30 | 2.6% |
| Hawaiian / Pacific | 0 | 0.0% |
| Hispanic or Latino | 53 | 4.5% |
| Native / Alaskan | 0 | 0.0% |
| White / Caucasian | 1,065 | 90.9% |
| Two or more Races | 62 | 5.3% |
| Some other Race | 14 | 1.2% |
| Total | 1,171 | 100.0% |
Ancestry in Coloma
The most populous ancestries reported in Coloma are German (281 | 24.0%), English (125 | 10.7%), Irish (125 | 10.7%), Dutch (61 | 5.2%), and Polish (58 | 5.0%), together accounting for 55.5% of all Coloma residents.
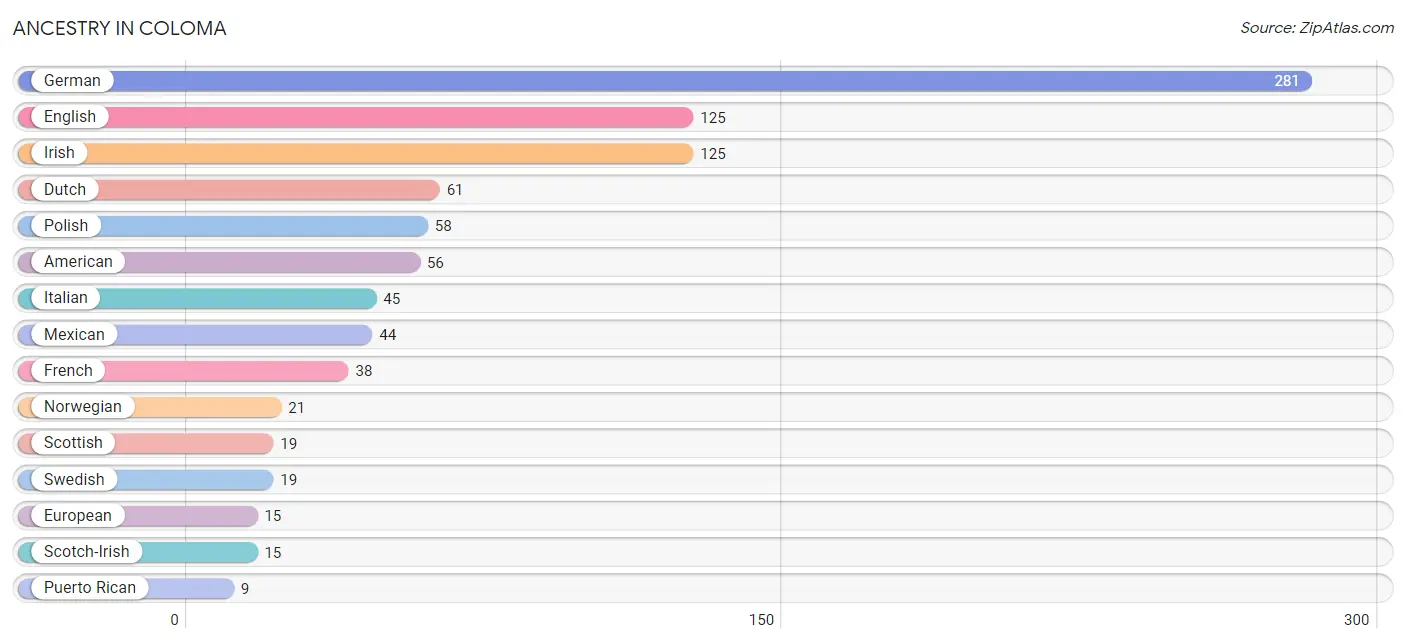
| Ancestry | # Population | % Population |
| African | 3 | 0.3% |
| American | 56 | 4.8% |
| British | 5 | 0.4% |
| Canadian | 3 | 0.3% |
| Cherokee | 3 | 0.3% |
| Chippewa | 3 | 0.3% |
| Danish | 3 | 0.3% |
| Dutch | 61 | 5.2% |
| English | 125 | 10.7% |
| European | 15 | 1.3% |
| Finnish | 2 | 0.2% |
| French | 38 | 3.3% |
| French Canadian | 1 | 0.1% |
| German | 281 | 24.0% |
| Greek | 2 | 0.2% |
| Hungarian | 2 | 0.2% |
| Irish | 125 | 10.7% |
| Italian | 45 | 3.8% |
| Latvian | 1 | 0.1% |
| Mexican | 44 | 3.8% |
| Norwegian | 21 | 1.8% |
| Polish | 58 | 5.0% |
| Puerto Rican | 9 | 0.8% |
| Russian | 2 | 0.2% |
| Scandinavian | 3 | 0.3% |
| Scotch-Irish | 15 | 1.3% |
| Scottish | 19 | 1.6% |
| Serbian | 9 | 0.8% |
| Slovak | 4 | 0.3% |
| Subsaharan African | 3 | 0.3% |
| Swedish | 19 | 1.6% | View All 31 Rows |
Immigrants in Coloma
The most numerous immigrant groups reported in Coloma came from Europe (3 | 0.3%), Germany (2 | 0.2%), Western Europe (2 | 0.2%), Canada (1 | 0.1%), and Central America (1 | 0.1%), together accounting for 0.8% of all Coloma residents.
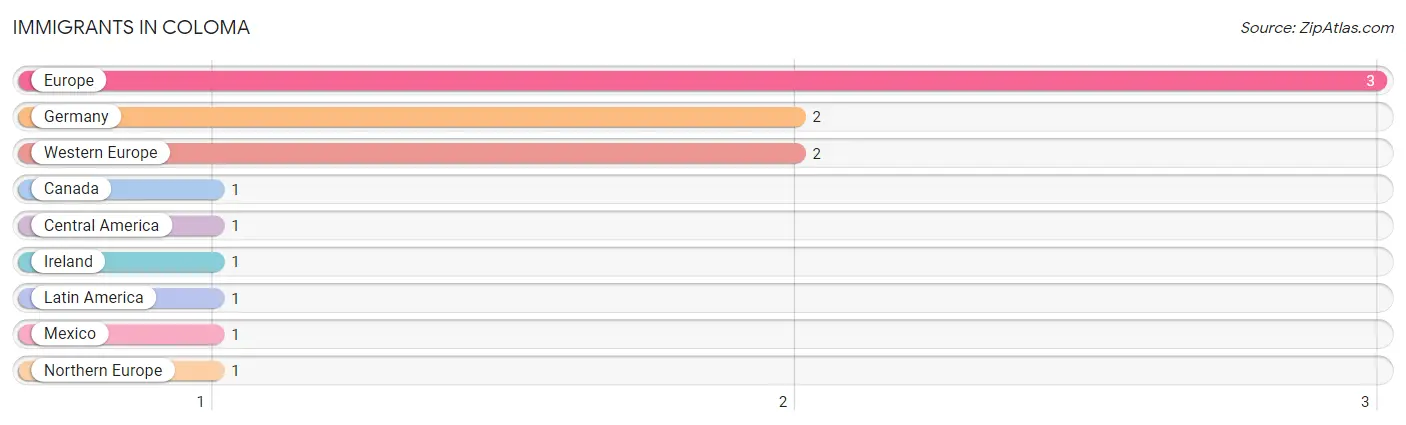
| Immigration Origin | # Population | % Population |
| Canada | 1 | 0.1% |
| Central America | 1 | 0.1% |
| Europe | 3 | 0.3% |
| Germany | 2 | 0.2% |
| Ireland | 1 | 0.1% |
| Latin America | 1 | 0.1% |
| Mexico | 1 | 0.1% |
| Northern Europe | 1 | 0.1% |
| Western Europe | 2 | 0.2% | View All 9 Rows |
Sex and Age in Coloma
Sex and Age in Coloma
The most populous age groups in Coloma are Under 5 Years (67 | 11.2%) for men and 70 to 74 Years (57 | 10.0%) for women.
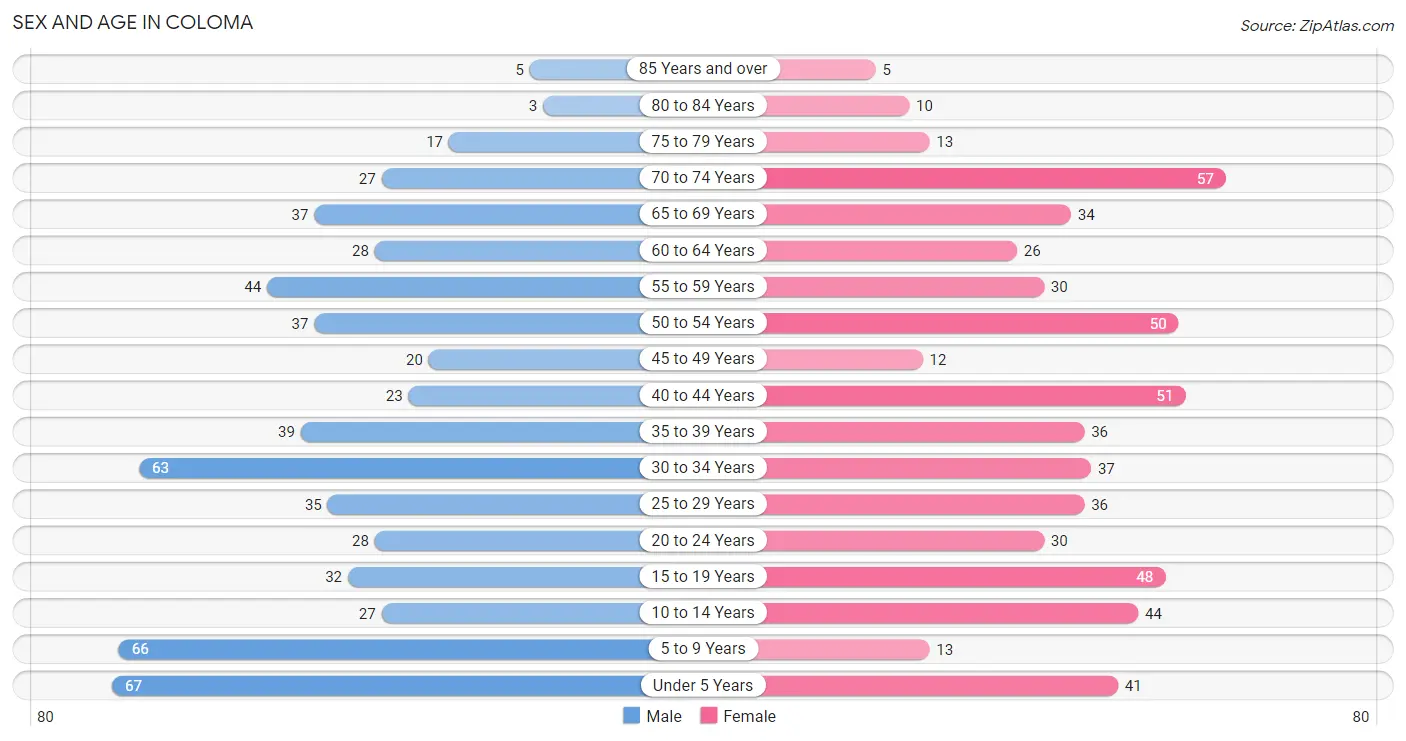
| Age Bracket | Male | Female |
| Under 5 Years | 67 (11.2%) | 41 (7.2%) |
| 5 to 9 Years | 66 (11.0%) | 13 (2.3%) |
| 10 to 14 Years | 27 (4.5%) | 44 (7.7%) |
| 15 to 19 Years | 32 (5.3%) | 48 (8.4%) |
| 20 to 24 Years | 28 (4.7%) | 30 (5.2%) |
| 25 to 29 Years | 35 (5.9%) | 36 (6.3%) |
| 30 to 34 Years | 63 (10.5%) | 37 (6.5%) |
| 35 to 39 Years | 39 (6.5%) | 36 (6.3%) |
| 40 to 44 Years | 23 (3.8%) | 51 (8.9%) |
| 45 to 49 Years | 20 (3.3%) | 12 (2.1%) |
| 50 to 54 Years | 37 (6.2%) | 50 (8.7%) |
| 55 to 59 Years | 44 (7.4%) | 30 (5.2%) |
| 60 to 64 Years | 28 (4.7%) | 26 (4.5%) |
| 65 to 69 Years | 37 (6.2%) | 34 (5.9%) |
| 70 to 74 Years | 27 (4.5%) | 57 (10.0%) |
| 75 to 79 Years | 17 (2.8%) | 13 (2.3%) |
| 80 to 84 Years | 3 (0.5%) | 10 (1.8%) |
| 85 Years and over | 5 (0.8%) | 5 (0.9%) |
| Total | 598 (100.0%) | 573 (100.0%) |
Families and Households in Coloma
Median Family Size in Coloma
The median family size in Coloma is 3.32 persons per family, with single male/father families (21 | 7.8%) accounting for the largest median family size of 3.48 persons per family. On the other hand, married-couple families (202 | 75.4%) represent the smallest median family size with 3.28 persons per family.
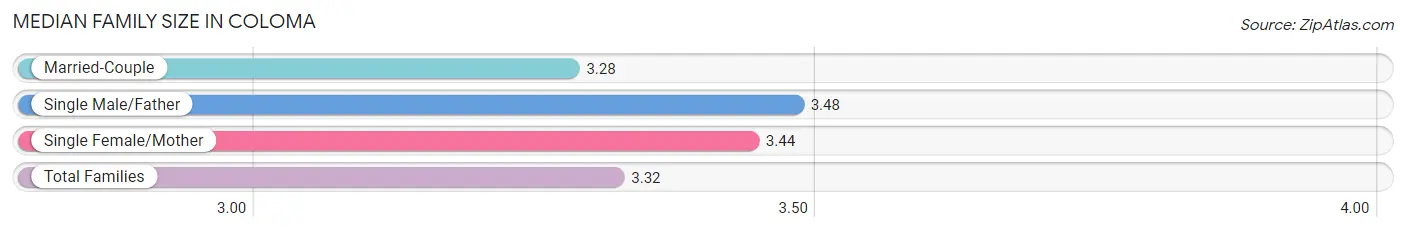
| Family Type | # Families | Family Size |
| Married-Couple | 202 (75.4%) | 3.28 |
| Single Male/Father | 21 (7.8%) | 3.48 |
| Single Female/Mother | 45 (16.8%) | 3.44 |
| Total Families | 268 (100.0%) | 3.32 |
Median Household Size in Coloma
The median household size in Coloma is 2.40 persons per household, with single female/mother households (45 | 9.2%) accounting for the largest median household size of 3.64 persons per household. non-family households (219 | 45.0%) represent the smallest median household size with 1.21 persons per household.
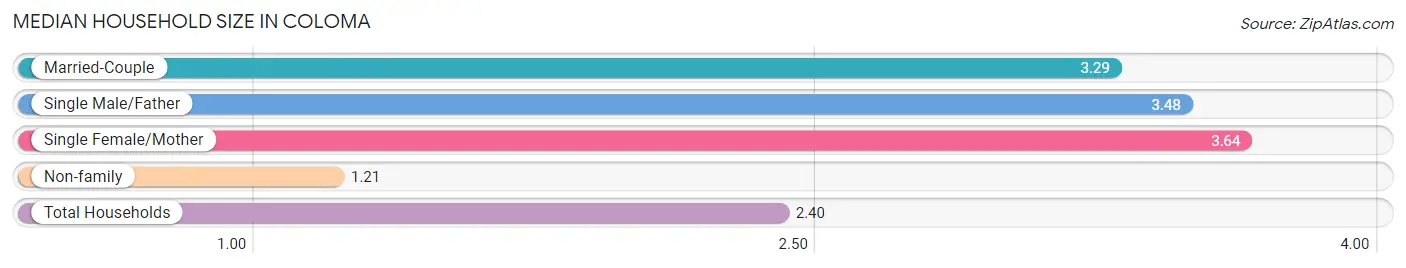
| Household Type | # Households | Household Size |
| Married-Couple | 202 (41.5%) | 3.29 |
| Single Male/Father | 21 (4.3%) | 3.48 |
| Single Female/Mother | 45 (9.2%) | 3.64 |
| Non-family | 219 (45.0%) | 1.21 |
| Total Households | 487 (100.0%) | 2.40 |
Household Size by Marriage Status in Coloma
Out of a total of 487 households in Coloma, 268 (55.0%) are family households, while 219 (45.0%) are nonfamily households. The most numerous type of family households are 2-person households, comprising 121, and the most common type of nonfamily households are 1-person households, comprising 184.
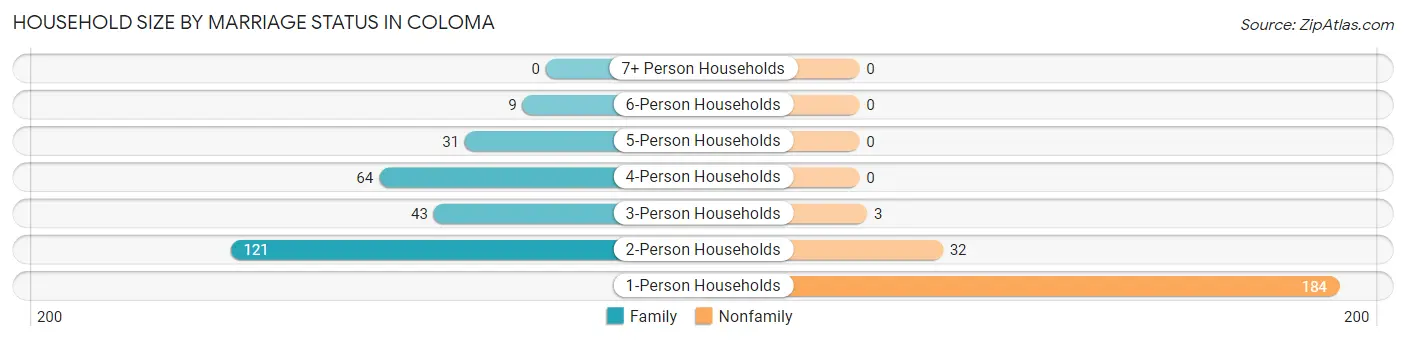
| Household Size | Family Households | Nonfamily Households |
| 1-Person Households | - | 184 (37.8%) |
| 2-Person Households | 121 (24.8%) | 32 (6.6%) |
| 3-Person Households | 43 (8.8%) | 3 (0.6%) |
| 4-Person Households | 64 (13.1%) | 0 (0.0%) |
| 5-Person Households | 31 (6.4%) | 0 (0.0%) |
| 6-Person Households | 9 (1.8%) | 0 (0.0%) |
| 7+ Person Households | 0 (0.0%) | 0 (0.0%) |
| Total | 268 (55.0%) | 219 (45.0%) |
Female Fertility in Coloma
Fertility by Age in Coloma
Average fertility rate in Coloma is 55.0 births per 1,000 women. Women in the age bracket of 20 to 34 years have the highest fertility rate with 146.0 births per 1,000 women. Women in the age bracket of 20 to 34 years acount for 100.0% of all women with births.
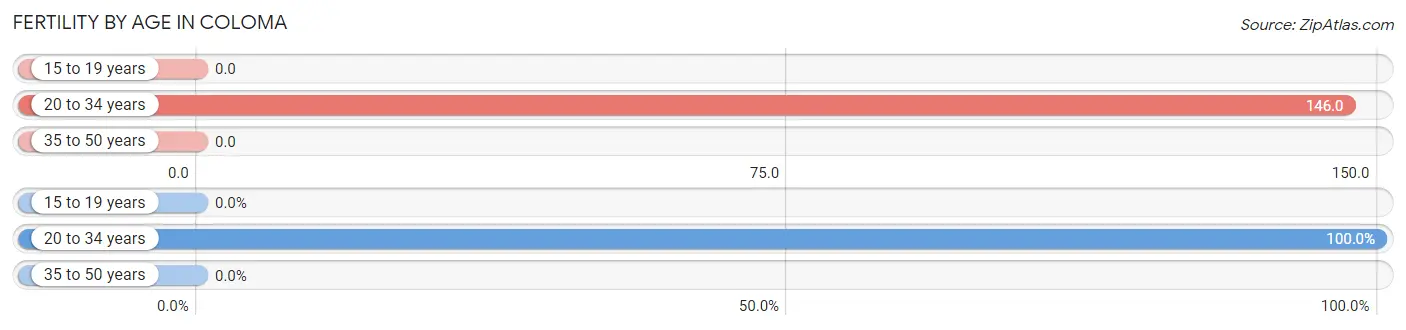
| Age Bracket | Women with Births | Births / 1,000 Women |
| 15 to 19 years | 0 (0.0%) | 0.0 |
| 20 to 34 years | 15 (100.0%) | 146.0 |
| 35 to 50 years | 0 (0.0%) | 0.0 |
| Total | 15 (100.0%) | 55.0 |
Fertility by Age by Marriage Status in Coloma
73.3% of women with births (15) in Coloma are married. The highest percentage of unmarried women with births falls into 20 to 34 years age bracket with 26.7% of them unmarried at the time of birth, while the lowest percentage of unmarried women with births belong to 20 to 34 years age bracket with 26.7% of them unmarried.
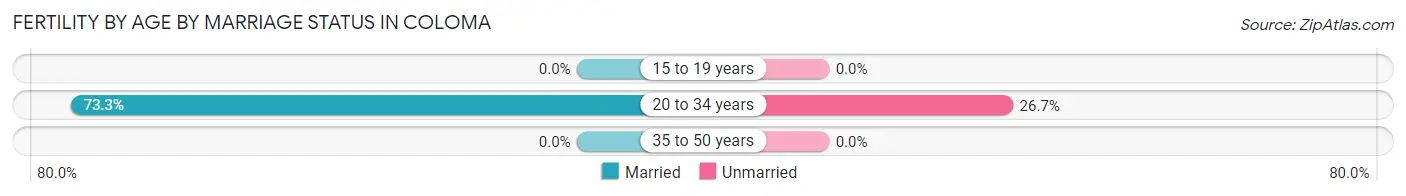
| Age Bracket | Married | Unmarried |
| 15 to 19 years | 0 (0.0%) | 0 (0.0%) |
| 20 to 34 years | 11 (73.3%) | 4 (26.7%) |
| 35 to 50 years | 0 (0.0%) | 0 (0.0%) |
| Total | 11 (73.3%) | 4 (26.7%) |
Fertility by Education in Coloma
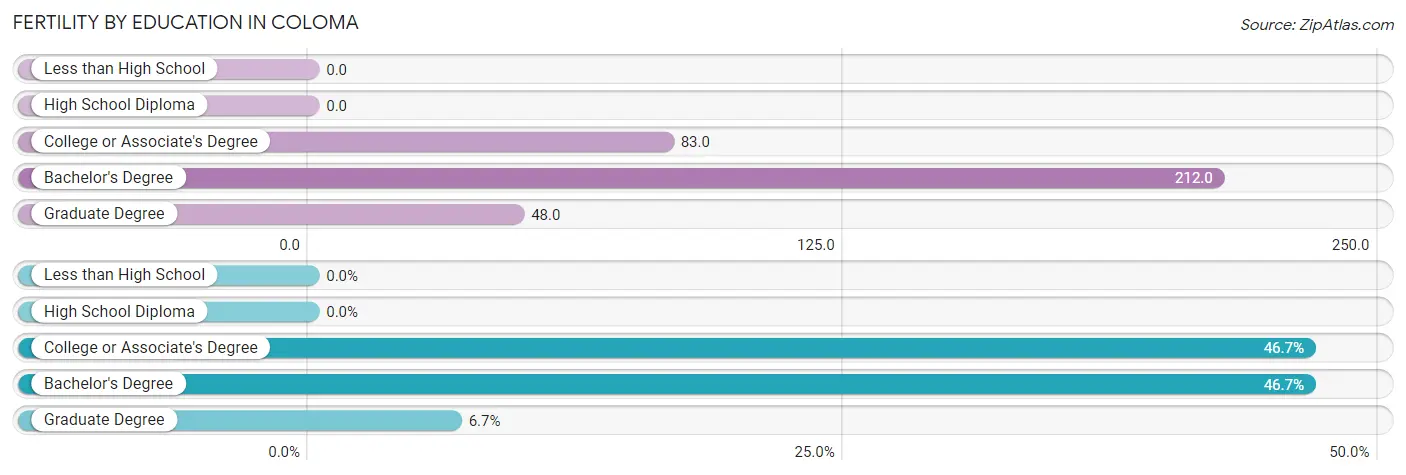
| Educational Attainment | Women with Births | Births / 1,000 Women |
| Less than High School | 0 (0.0%) | 0.0 |
| High School Diploma | 0 (0.0%) | 0.0 |
| College or Associate's Degree | 7 (46.7%) | 83.0 |
| Bachelor's Degree | 7 (46.7%) | 212.0 |
| Graduate Degree | 1 (6.7%) | 48.0 |
| Total | 15 (100.0%) | 55.0 |
Fertility by Education by Marriage Status in Coloma
26.7% of women with births in Coloma are unmarried. Women with the educational attainment of college or associate's degree are most likely to be married with 100.0% of them married at childbirth, while women with the educational attainment of bachelor's degree are least likely to be married with 57.1% of them unmarried at childbirth.
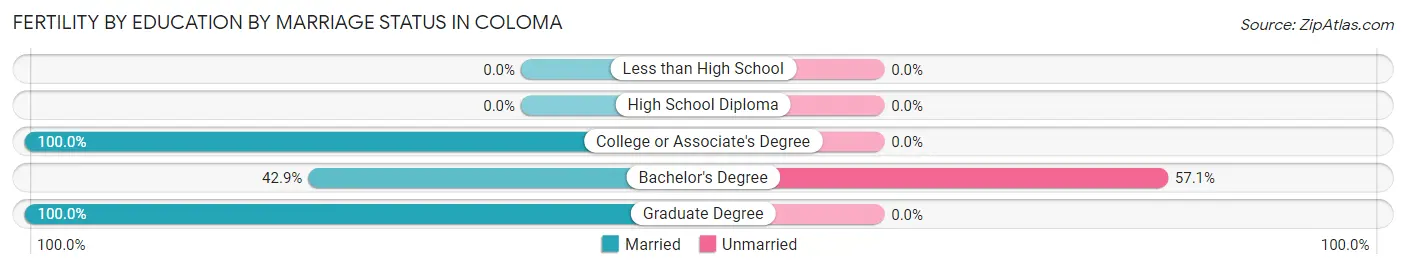
| Educational Attainment | Married | Unmarried |
| Less than High School | 0 (0.0%) | 0 (0.0%) |
| High School Diploma | 0 (0.0%) | 0 (0.0%) |
| College or Associate's Degree | 7 (100.0%) | 0 (0.0%) |
| Bachelor's Degree | 3 (42.9%) | 4 (57.1%) |
| Graduate Degree | 1 (100.0%) | 0 (0.0%) |
| Total | 11 (73.3%) | 4 (26.7%) |
Employment Characteristics in Coloma
Employment by Class of Employer in Coloma
Among the 568 employed individuals in Coloma, private company employees (415 | 73.1%), not-for-profit organizations (49 | 8.6%), and local government employees (41 | 7.2%) make up the most common classes of employment.
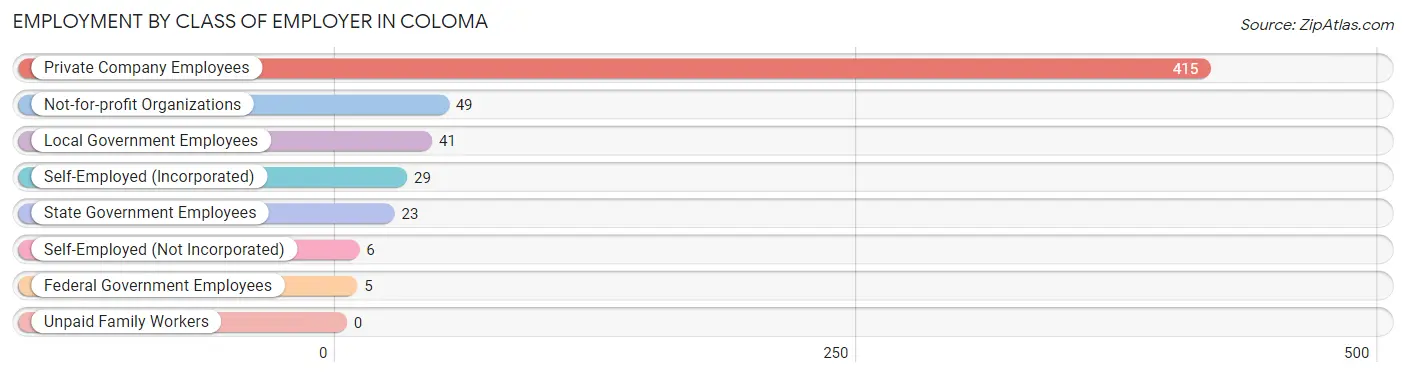
| Employer Class | # Employees | % Employees |
| Private Company Employees | 415 | 73.1% |
| Self-Employed (Incorporated) | 29 | 5.1% |
| Self-Employed (Not Incorporated) | 6 | 1.1% |
| Not-for-profit Organizations | 49 | 8.6% |
| Local Government Employees | 41 | 7.2% |
| State Government Employees | 23 | 4.1% |
| Federal Government Employees | 5 | 0.9% |
| Unpaid Family Workers | 0 | 0.0% |
| Total | 568 | 100.0% |
Employment Status by Age in Coloma
According to the labor force statistics for Coloma, out of the total population over 16 years of age (900), 66.3% or 597 individuals are in the labor force, with 4.2% or 25 of them unemployed. The age group with the highest labor force participation rate is 45 to 54 years, with 87.4% or 104 individuals in the labor force. Within the labor force, the 75 years and over age range has the highest percentage of unemployed individuals, with 50.0% or 3 of them being unemployed.
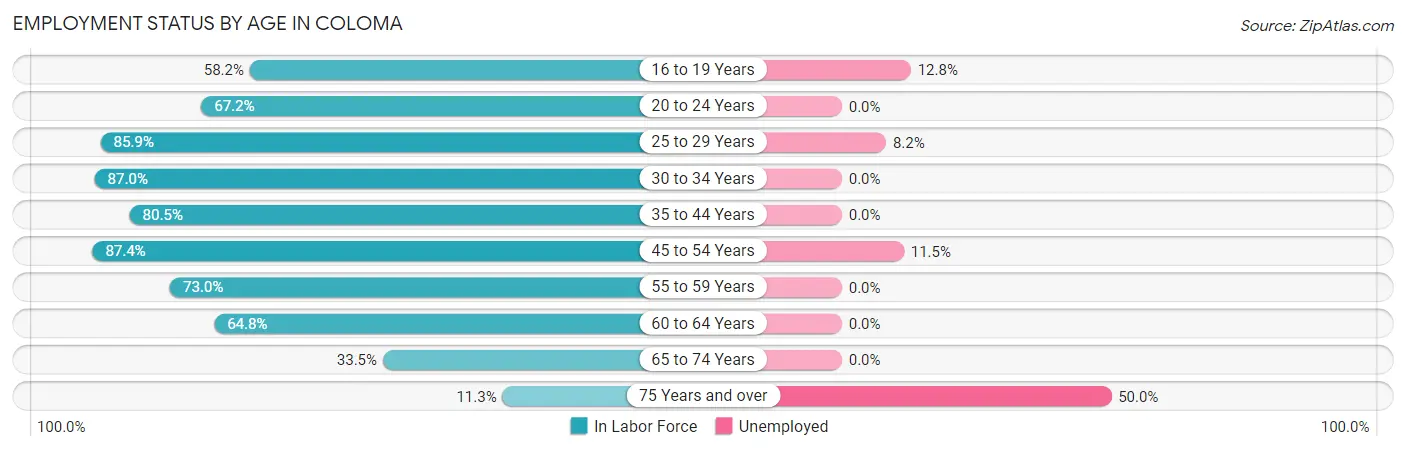
| Age Bracket | In Labor Force | Unemployed |
| 16 to 19 Years | 39 (58.2%) | 5 (12.8%) |
| 20 to 24 Years | 39 (67.2%) | 0 (0.0%) |
| 25 to 29 Years | 61 (85.9%) | 5 (8.2%) |
| 30 to 34 Years | 87 (87.0%) | 0 (0.0%) |
| 35 to 44 Years | 120 (80.5%) | 0 (0.0%) |
| 45 to 54 Years | 104 (87.4%) | 12 (11.5%) |
| 55 to 59 Years | 54 (73.0%) | 0 (0.0%) |
| 60 to 64 Years | 35 (64.8%) | 0 (0.0%) |
| 65 to 74 Years | 52 (33.5%) | 0 (0.0%) |
| 75 Years and over | 6 (11.3%) | 3 (50.0%) |
| Total | 597 (66.3%) | 25 (4.2%) |
Employment Status by Educational Attainment in Coloma
According to labor force statistics for Coloma, 81.3% of individuals (461) out of the total population between 25 and 64 years of age (567) are in the labor force, with 3.7% or 17 of them being unemployed. The group with the highest labor force participation rate are those with the educational attainment of bachelor's degree or higher, with 85.0% or 113 individuals in the labor force. Within the labor force, individuals with college / associate degree education have the highest percentage of unemployment, with 7.3% or 12 of them being unemployed.
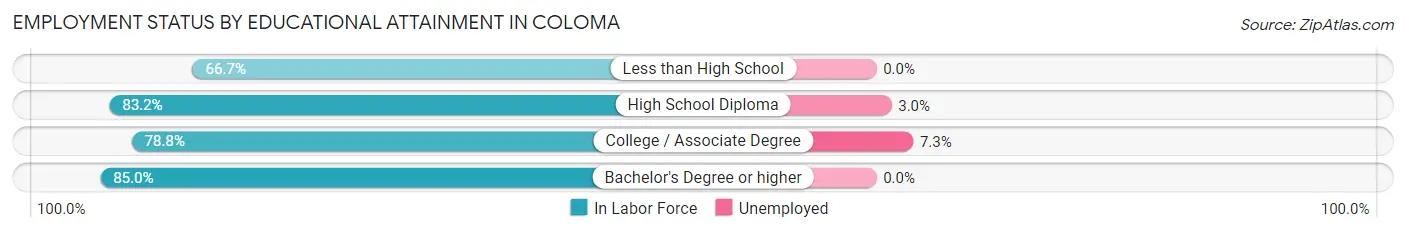
| Educational Attainment | In Labor Force | Unemployed |
| Less than High School | 16 (66.7%) | 0 (0.0%) |
| High School Diploma | 168 (83.2%) | 6 (3.0%) |
| College / Associate Degree | 164 (78.8%) | 15 (7.3%) |
| Bachelor's Degree or higher | 113 (85.0%) | 0 (0.0%) |
| Total | 461 (81.3%) | 21 (3.7%) |
Employment Occupations by Sex in Coloma
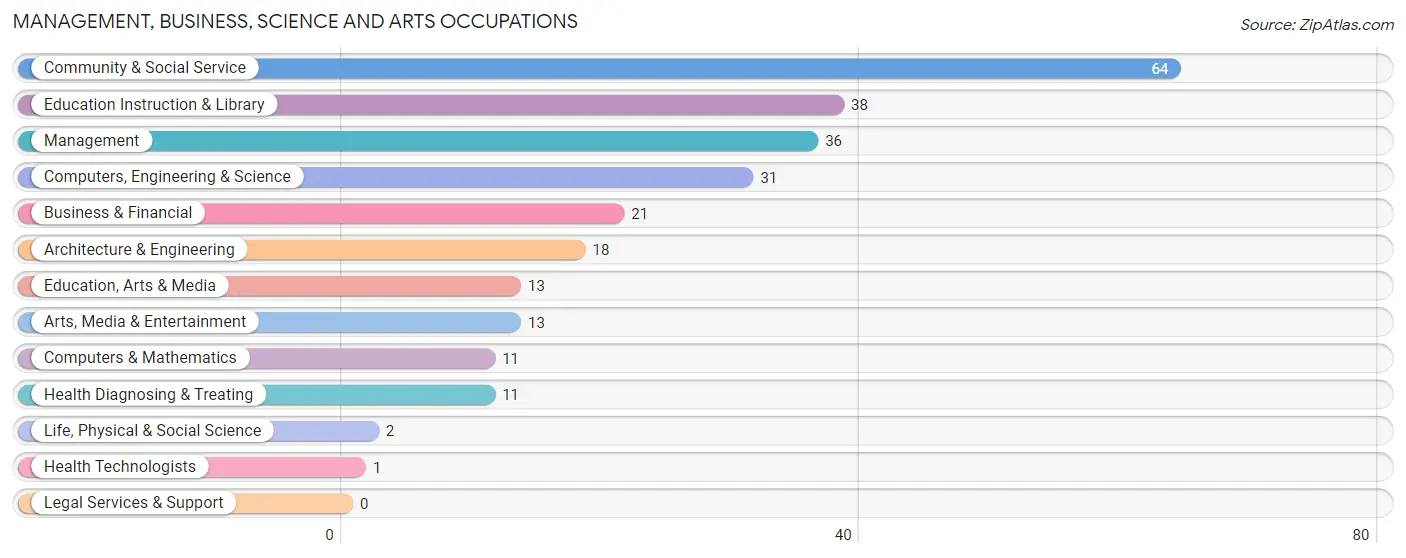
Management, Business, Science and Arts Occupations
The most common Management, Business, Science and Arts occupations in Coloma are Community & Social Service (64 | 11.2%), Education Instruction & Library (38 | 6.6%), Management (36 | 6.3%), Computers, Engineering & Science (31 | 5.4%), and Business & Financial (21 | 3.7%).
Management, Business, Science and Arts Occupations by Sex
Within the Management, Business, Science and Arts occupations in Coloma, the most male-oriented occupations are Life, Physical & Social Science (100.0%), Architecture & Engineering (94.4%), and Computers, Engineering & Science (77.4%), while the most female-oriented occupations are Health Diagnosing & Treating (100.0%), Health Technologists (100.0%), and Education Instruction & Library (71.1%).
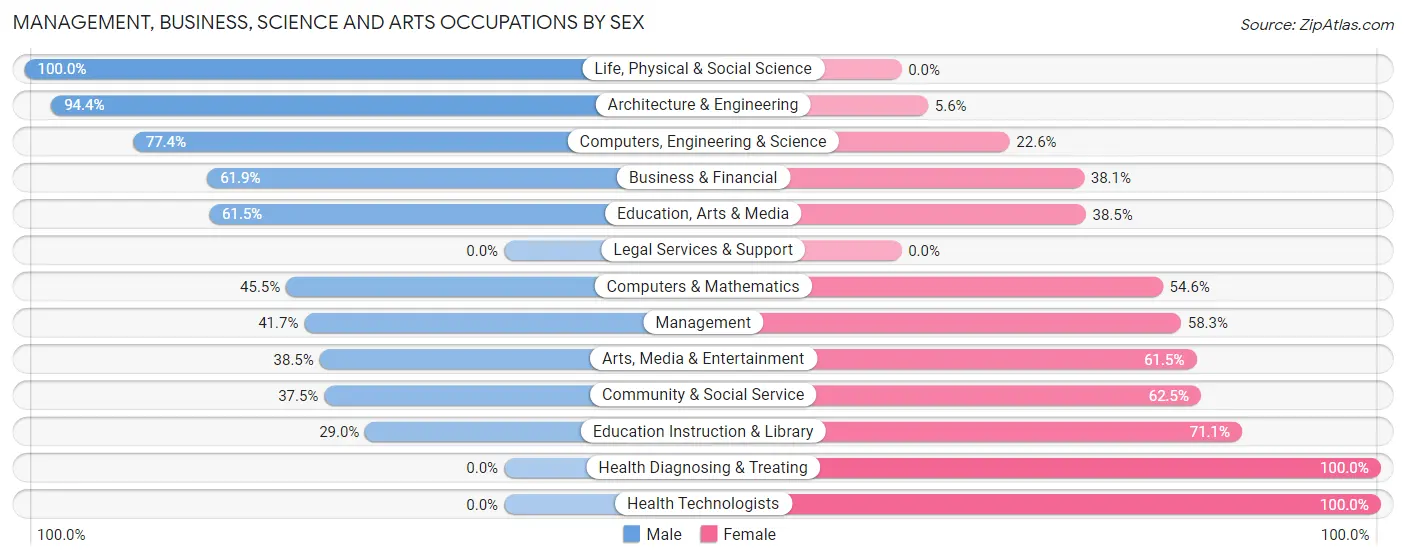
| Occupation | Male | Female |
| Management | 15 (41.7%) | 21 (58.3%) |
| Business & Financial | 13 (61.9%) | 8 (38.1%) |
| Computers, Engineering & Science | 24 (77.4%) | 7 (22.6%) |
| Computers & Mathematics | 5 (45.5%) | 6 (54.5%) |
| Architecture & Engineering | 17 (94.4%) | 1 (5.6%) |
| Life, Physical & Social Science | 2 (100.0%) | 0 (0.0%) |
| Community & Social Service | 24 (37.5%) | 40 (62.5%) |
| Education, Arts & Media | 8 (61.5%) | 5 (38.5%) |
| Legal Services & Support | 0 (0.0%) | 0 (0.0%) |
| Education Instruction & Library | 11 (28.9%) | 27 (71.1%) |
| Arts, Media & Entertainment | 5 (38.5%) | 8 (61.5%) |
| Health Diagnosing & Treating | 0 (0.0%) | 11 (100.0%) |
| Health Technologists | 0 (0.0%) | 1 (100.0%) |
| Total (Category) | 76 (46.6%) | 87 (53.4%) |
| Total (Overall) | 329 (57.5%) | 243 (42.5%) |
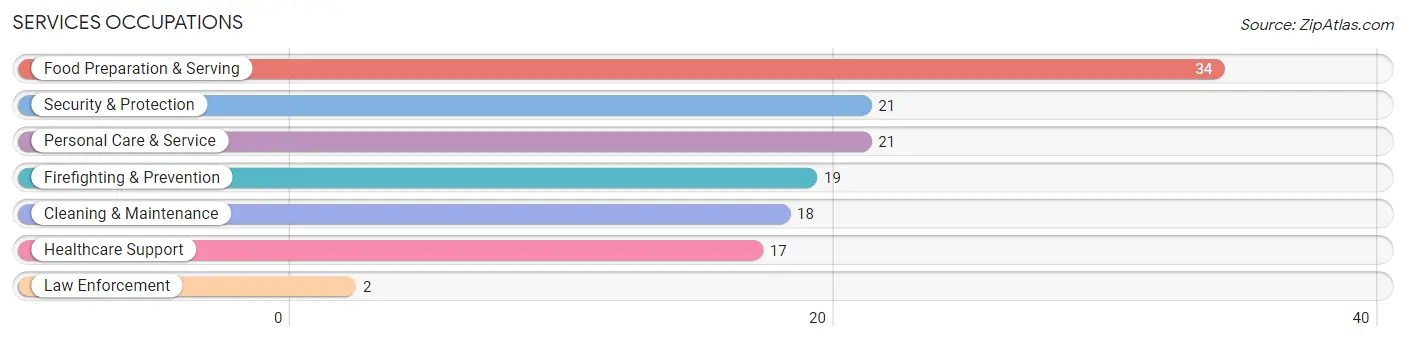
Services Occupations
The most common Services occupations in Coloma are Food Preparation & Serving (34 | 5.9%), Security & Protection (21 | 3.7%), Personal Care & Service (21 | 3.7%), Firefighting & Prevention (19 | 3.3%), and Cleaning & Maintenance (18 | 3.2%).
Services Occupations by Sex
Within the Services occupations in Coloma, the most male-oriented occupations are Law Enforcement (100.0%), Cleaning & Maintenance (100.0%), and Security & Protection (71.4%), while the most female-oriented occupations are Healthcare Support (100.0%), Personal Care & Service (90.5%), and Food Preparation & Serving (32.4%).
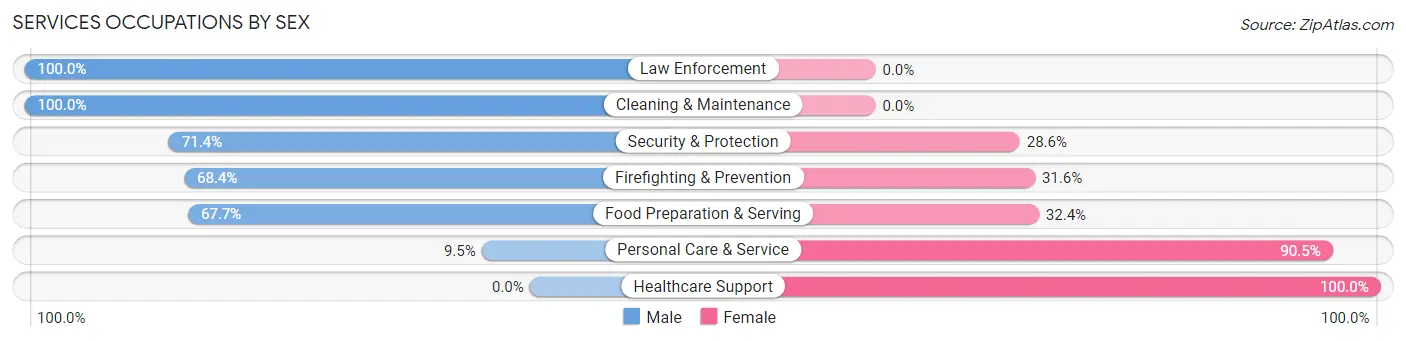
| Occupation | Male | Female |
| Healthcare Support | 0 (0.0%) | 17 (100.0%) |
| Security & Protection | 15 (71.4%) | 6 (28.6%) |
| Firefighting & Prevention | 13 (68.4%) | 6 (31.6%) |
| Law Enforcement | 2 (100.0%) | 0 (0.0%) |
| Food Preparation & Serving | 23 (67.6%) | 11 (32.4%) |
| Cleaning & Maintenance | 18 (100.0%) | 0 (0.0%) |
| Personal Care & Service | 2 (9.5%) | 19 (90.5%) |
| Total (Category) | 58 (52.2%) | 53 (47.7%) |
| Total (Overall) | 329 (57.5%) | 243 (42.5%) |
Sales and Office Occupations
The most common Sales and Office occupations in Coloma are Office & Administration (80 | 14.0%), and Sales & Related (46 | 8.0%).
Sales and Office Occupations by Sex
| Occupation | Male | Female |
| Sales & Related | 25 (54.3%) | 21 (45.7%) |
| Office & Administration | 14 (17.5%) | 66 (82.5%) |
| Total (Category) | 39 (30.9%) | 87 (69.1%) |
| Total (Overall) | 329 (57.5%) | 243 (42.5%) |
Natural Resources, Construction and Maintenance Occupations
The most common Natural Resources, Construction and Maintenance occupations in Coloma are Construction & Extraction (33 | 5.8%), and Installation, Maintenance & Repair (27 | 4.7%).
Natural Resources, Construction and Maintenance Occupations by Sex
| Occupation | Male | Female |
| Farming, Fishing & Forestry | 0 (0.0%) | 0 (0.0%) |
| Construction & Extraction | 32 (97.0%) | 1 (3.0%) |
| Installation, Maintenance & Repair | 27 (100.0%) | 0 (0.0%) |
| Total (Category) | 59 (98.3%) | 1 (1.7%) |
| Total (Overall) | 329 (57.5%) | 243 (42.5%) |
Production, Transportation and Moving Occupations
The most common Production, Transportation and Moving occupations in Coloma are Production (81 | 14.2%), Material Moving (20 | 3.5%), and Transportation (11 | 1.9%).
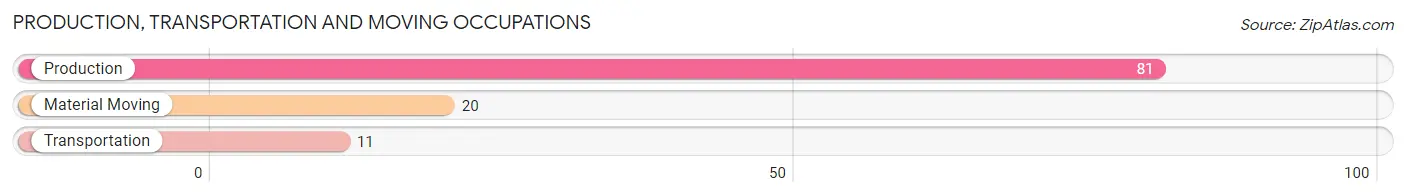
Production, Transportation and Moving Occupations by Sex
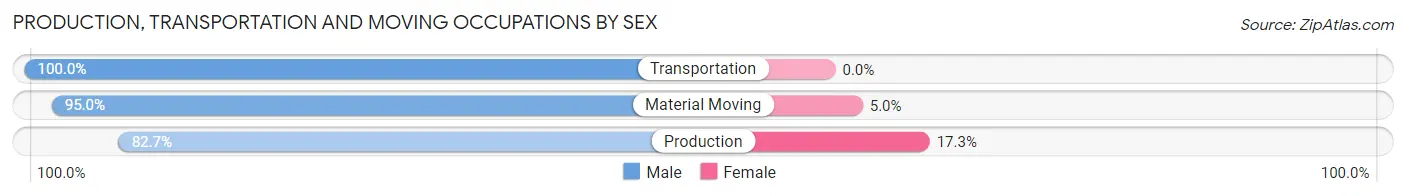
| Occupation | Male | Female |
| Production | 67 (82.7%) | 14 (17.3%) |
| Transportation | 11 (100.0%) | 0 (0.0%) |
| Material Moving | 19 (95.0%) | 1 (5.0%) |
| Total (Category) | 97 (86.6%) | 15 (13.4%) |
| Total (Overall) | 329 (57.5%) | 243 (42.5%) |
Employment Industries by Sex in Coloma
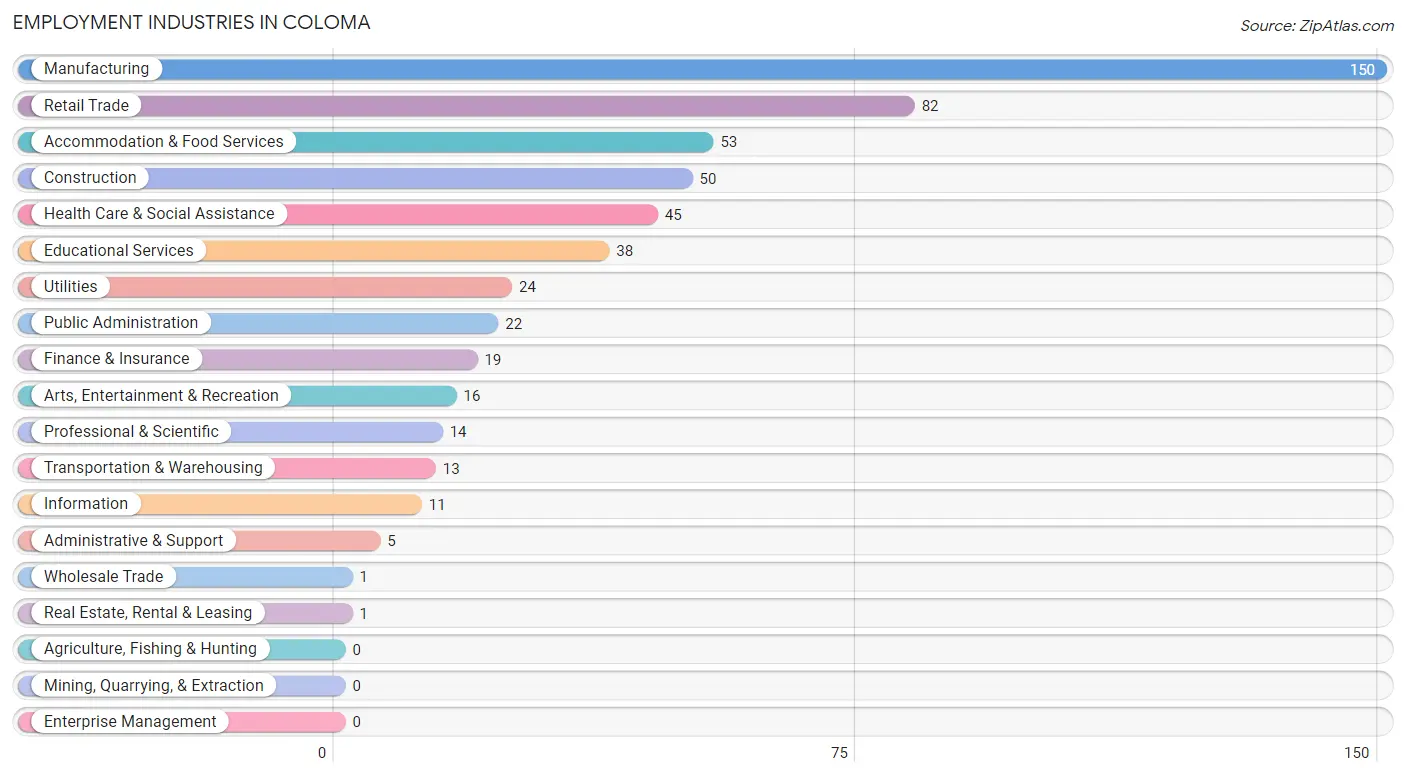
Employment Industries in Coloma
The major employment industries in Coloma include Manufacturing (150 | 26.2%), Retail Trade (82 | 14.3%), Accommodation & Food Services (53 | 9.3%), Construction (50 | 8.7%), and Health Care & Social Assistance (45 | 7.9%).
Employment Industries by Sex in Coloma
The Coloma industries that see more men than women are Real Estate, Rental & Leasing (100.0%), Administrative & Support (100.0%), and Finance & Insurance (89.5%), whereas the industries that tend to have a higher number of women are Wholesale Trade (100.0%), Health Care & Social Assistance (100.0%), and Educational Services (65.8%).
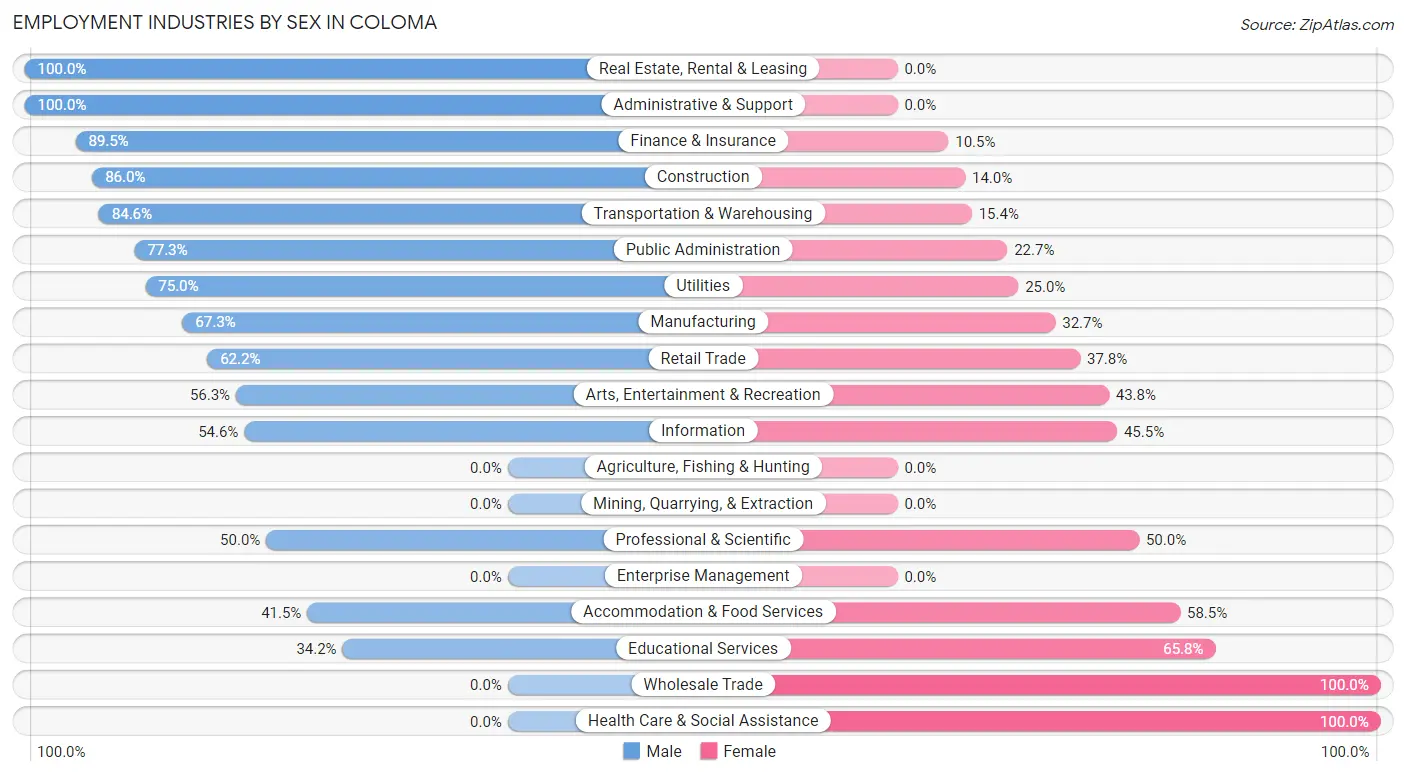
| Industry | Male | Female |
| Agriculture, Fishing & Hunting | 0 (0.0%) | 0 (0.0%) |
| Mining, Quarrying, & Extraction | 0 (0.0%) | 0 (0.0%) |
| Construction | 43 (86.0%) | 7 (14.0%) |
| Manufacturing | 101 (67.3%) | 49 (32.7%) |
| Wholesale Trade | 0 (0.0%) | 1 (100.0%) |
| Retail Trade | 51 (62.2%) | 31 (37.8%) |
| Transportation & Warehousing | 11 (84.6%) | 2 (15.4%) |
| Utilities | 18 (75.0%) | 6 (25.0%) |
| Information | 6 (54.5%) | 5 (45.5%) |
| Finance & Insurance | 17 (89.5%) | 2 (10.5%) |
| Real Estate, Rental & Leasing | 1 (100.0%) | 0 (0.0%) |
| Professional & Scientific | 7 (50.0%) | 7 (50.0%) |
| Enterprise Management | 0 (0.0%) | 0 (0.0%) |
| Administrative & Support | 5 (100.0%) | 0 (0.0%) |
| Educational Services | 13 (34.2%) | 25 (65.8%) |
| Health Care & Social Assistance | 0 (0.0%) | 45 (100.0%) |
| Arts, Entertainment & Recreation | 9 (56.2%) | 7 (43.8%) |
| Accommodation & Food Services | 22 (41.5%) | 31 (58.5%) |
| Public Administration | 17 (77.3%) | 5 (22.7%) |
| Total | 329 (57.5%) | 243 (42.5%) |
Education in Coloma
School Enrollment in Coloma
The most common levels of schooling among the 256 students in Coloma are high school (78 | 30.5%), elementary school (63 | 24.6%), and middle school (50 | 19.5%).
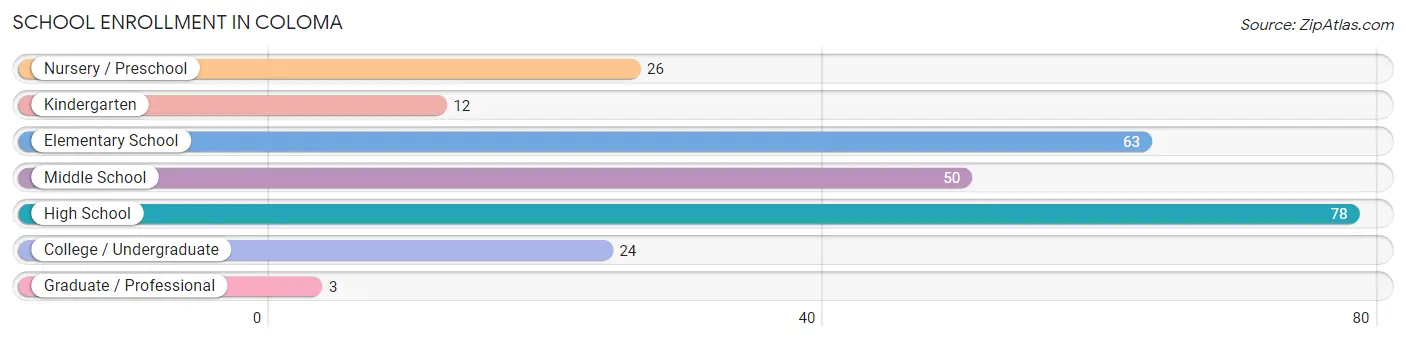
| School Level | # Students | % Students |
| Nursery / Preschool | 26 | 10.2% |
| Kindergarten | 12 | 4.7% |
| Elementary School | 63 | 24.6% |
| Middle School | 50 | 19.5% |
| High School | 78 | 30.5% |
| College / Undergraduate | 24 | 9.4% |
| Graduate / Professional | 3 | 1.2% |
| Total | 256 | 100.0% |
School Enrollment by Age by Funding Source in Coloma
Out of a total of 256 students who are enrolled in schools in Coloma, 18 (7.0%) attend a private institution, while the remaining 238 (93.0%) are enrolled in public schools. The age group of 3 to 4 year olds has the highest likelihood of being enrolled in private schools, with 10 (62.5% in the age bracket) enrolled. Conversely, the age group of 15 to 17 year olds has the lowest likelihood of being enrolled in a private school, with 40 (100.0% in the age bracket) attending a public institution.
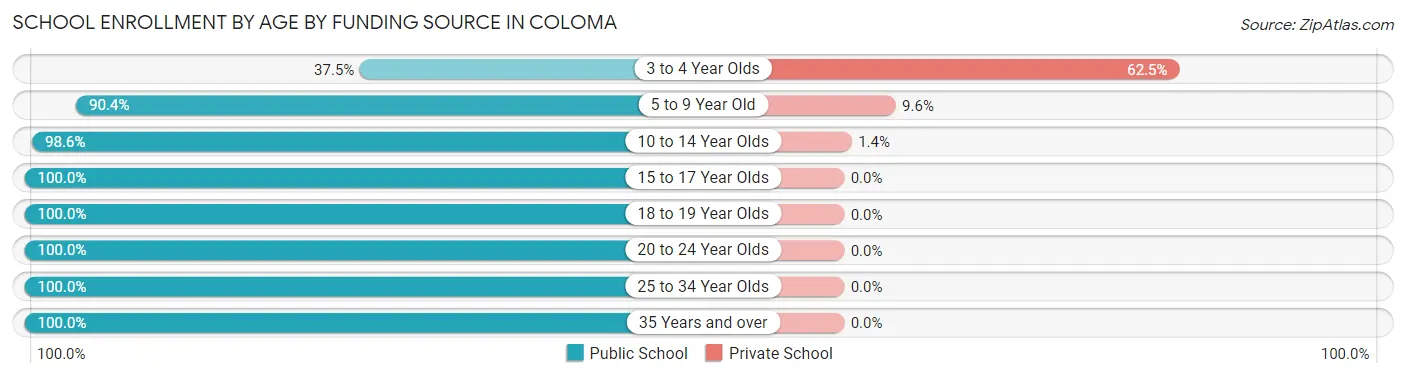
| Age Bracket | Public School | Private School |
| 3 to 4 Year Olds | 6 (37.5%) | 10 (62.5%) |
| 5 to 9 Year Old | 66 (90.4%) | 7 (9.6%) |
| 10 to 14 Year Olds | 70 (98.6%) | 1 (1.4%) |
| 15 to 17 Year Olds | 40 (100.0%) | 0 (0.0%) |
| 18 to 19 Year Olds | 20 (100.0%) | 0 (0.0%) |
| 20 to 24 Year Olds | 23 (100.0%) | 0 (0.0%) |
| 25 to 34 Year Olds | 8 (100.0%) | 0 (0.0%) |
| 35 Years and over | 5 (100.0%) | 0 (0.0%) |
| Total | 238 (93.0%) | 18 (7.0%) |
Educational Attainment by Field of Study in Coloma
Education (43 | 27.7%), business (20 | 12.9%), visual & performing arts (15 | 9.7%), arts & humanities (14 | 9.0%), and psychology (13 | 8.4%) are the most common fields of study among 155 individuals in Coloma who have obtained a bachelor's degree or higher.
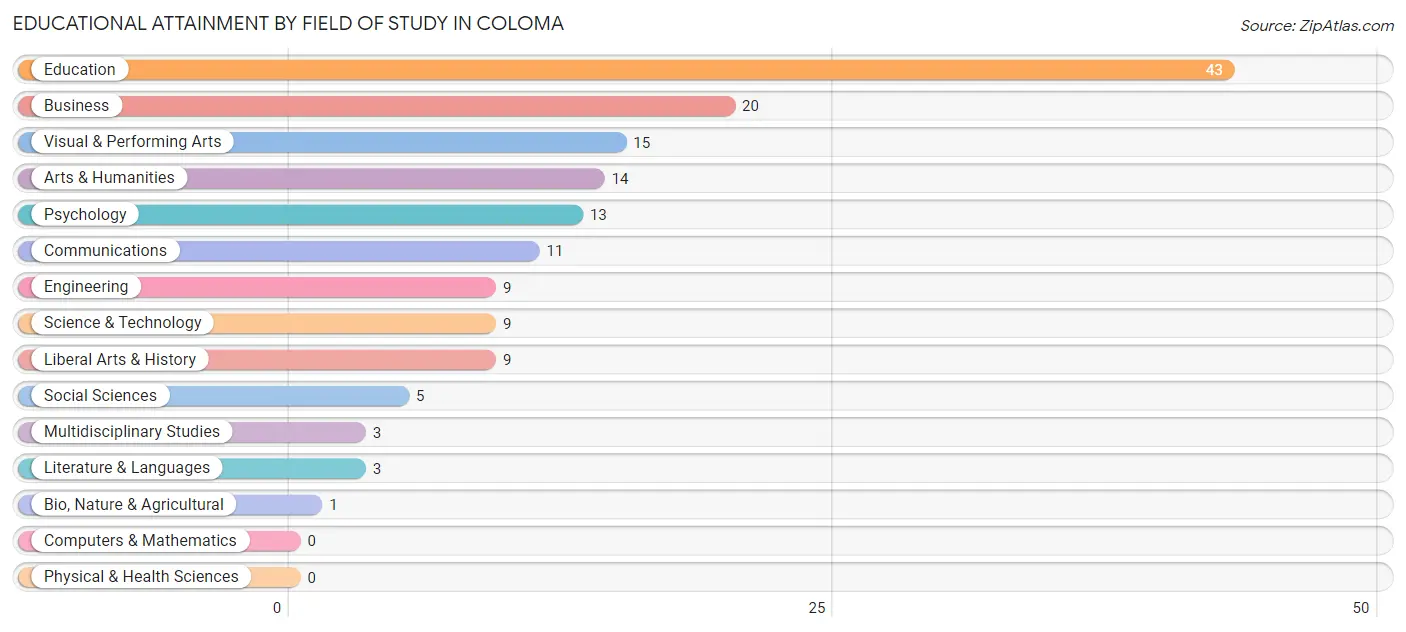
| Field of Study | # Graduates | % Graduates |
| Computers & Mathematics | 0 | 0.0% |
| Bio, Nature & Agricultural | 1 | 0.6% |
| Physical & Health Sciences | 0 | 0.0% |
| Psychology | 13 | 8.4% |
| Social Sciences | 5 | 3.2% |
| Engineering | 9 | 5.8% |
| Multidisciplinary Studies | 3 | 1.9% |
| Science & Technology | 9 | 5.8% |
| Business | 20 | 12.9% |
| Education | 43 | 27.7% |
| Literature & Languages | 3 | 1.9% |
| Liberal Arts & History | 9 | 5.8% |
| Visual & Performing Arts | 15 | 9.7% |
| Communications | 11 | 7.1% |
| Arts & Humanities | 14 | 9.0% |
| Total | 155 | 100.0% |
Transportation & Commute in Coloma
Vehicle Availability by Sex in Coloma
The most prevalent vehicle ownership categories in Coloma are males with 2 vehicles (161, accounting for 49.5%) and females with 2 vehicles (92, making up 66.3%).
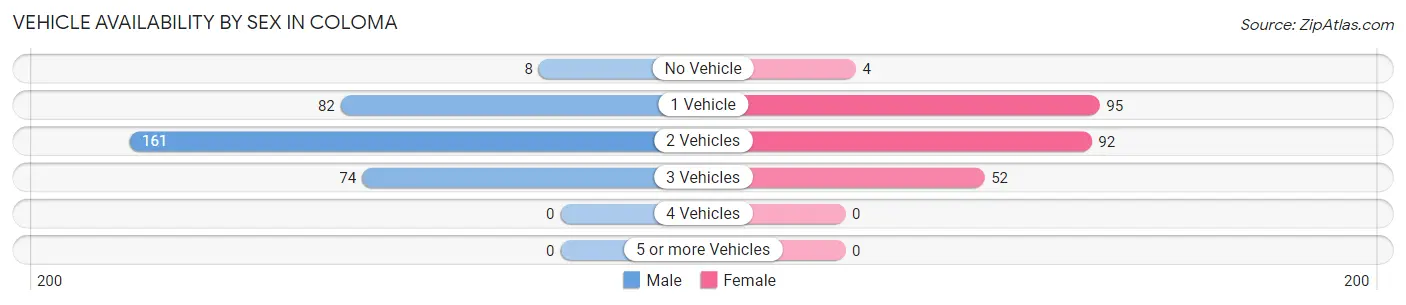
| Vehicles Available | Male | Female |
| No Vehicle | 8 (2.5%) | 4 (1.7%) |
| 1 Vehicle | 82 (25.2%) | 95 (39.1%) |
| 2 Vehicles | 161 (49.5%) | 92 (37.9%) |
| 3 Vehicles | 74 (22.8%) | 52 (21.4%) |
| 4 Vehicles | 0 (0.0%) | 0 (0.0%) |
| 5 or more Vehicles | 0 (0.0%) | 0 (0.0%) |
| Total | 325 (100.0%) | 243 (100.0%) |
Commute Time in Coloma
The most frequently occuring commute durations in Coloma are 15 to 19 minutes (100 commuters, 18.4%), 5 to 9 minutes (84 commuters, 15.5%), and 20 to 24 minutes (83 commuters, 15.3%).
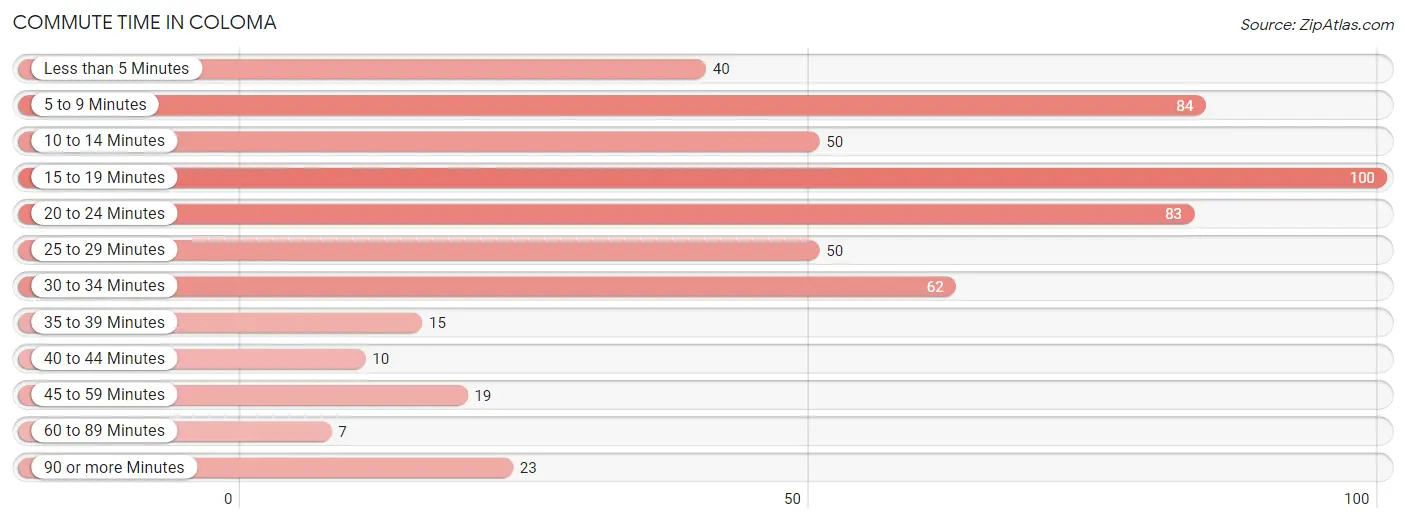
| Commute Time | # Commuters | % Commuters |
| Less than 5 Minutes | 40 | 7.4% |
| 5 to 9 Minutes | 84 | 15.5% |
| 10 to 14 Minutes | 50 | 9.2% |
| 15 to 19 Minutes | 100 | 18.4% |
| 20 to 24 Minutes | 83 | 15.3% |
| 25 to 29 Minutes | 50 | 9.2% |
| 30 to 34 Minutes | 62 | 11.4% |
| 35 to 39 Minutes | 15 | 2.8% |
| 40 to 44 Minutes | 10 | 1.8% |
| 45 to 59 Minutes | 19 | 3.5% |
| 60 to 89 Minutes | 7 | 1.3% |
| 90 or more Minutes | 23 | 4.2% |
Commute Time by Sex in Coloma
The most common commute times in Coloma are 5 to 9 minutes (57 commuters, 18.4%) for males and 15 to 19 minutes (58 commuters, 24.8%) for females.
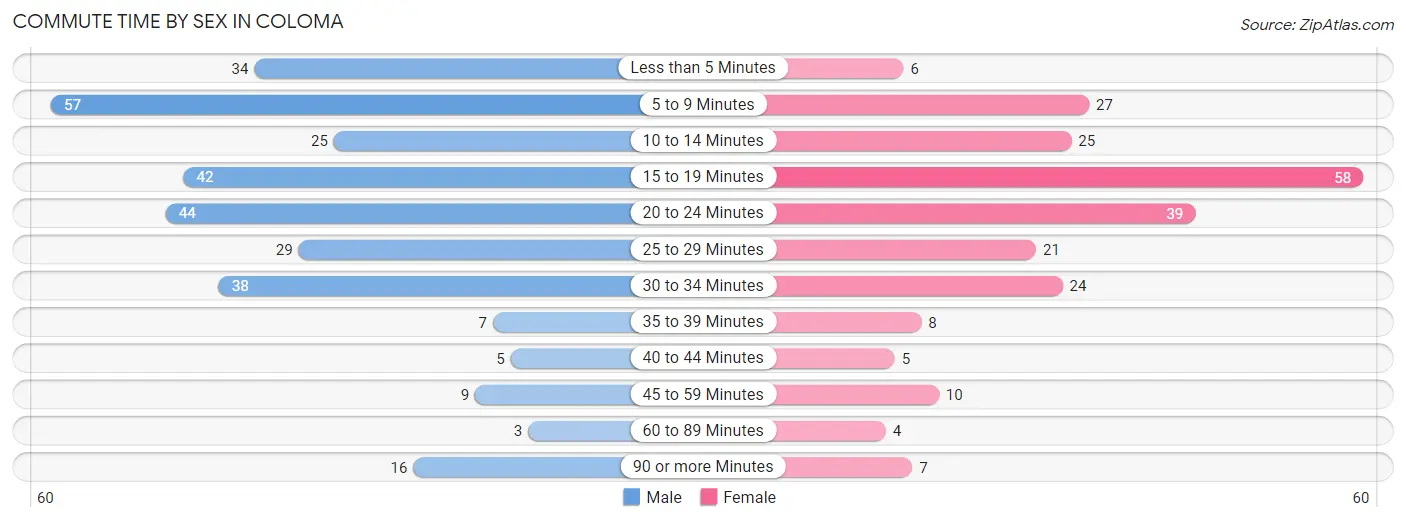
| Commute Time | Male | Female |
| Less than 5 Minutes | 34 (11.0%) | 6 (2.6%) |
| 5 to 9 Minutes | 57 (18.4%) | 27 (11.5%) |
| 10 to 14 Minutes | 25 (8.1%) | 25 (10.7%) |
| 15 to 19 Minutes | 42 (13.6%) | 58 (24.8%) |
| 20 to 24 Minutes | 44 (14.2%) | 39 (16.7%) |
| 25 to 29 Minutes | 29 (9.4%) | 21 (9.0%) |
| 30 to 34 Minutes | 38 (12.3%) | 24 (10.3%) |
| 35 to 39 Minutes | 7 (2.3%) | 8 (3.4%) |
| 40 to 44 Minutes | 5 (1.6%) | 5 (2.1%) |
| 45 to 59 Minutes | 9 (2.9%) | 10 (4.3%) |
| 60 to 89 Minutes | 3 (1.0%) | 4 (1.7%) |
| 90 or more Minutes | 16 (5.2%) | 7 (3.0%) |
Time of Departure to Work by Sex in Coloma
The most frequent times of departure to work in Coloma are 7:00 AM to 7:29 AM (55, 17.8%) for males and 7:00 AM to 7:29 AM (73, 31.2%) for females.
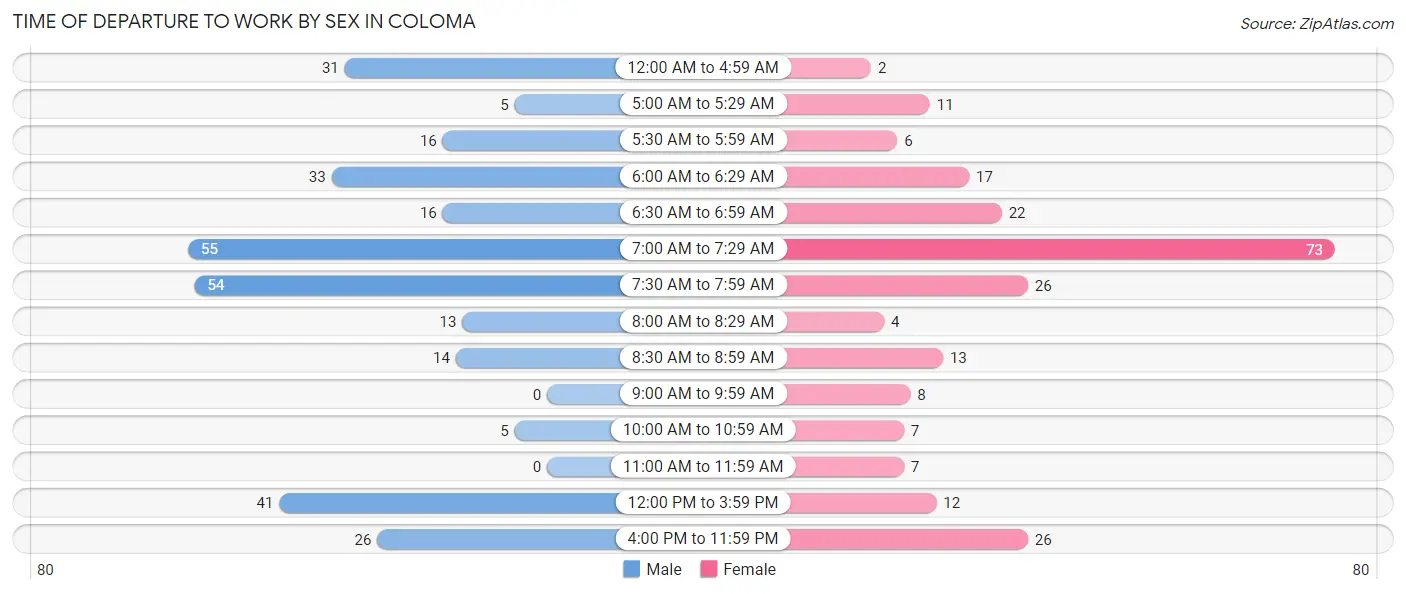
| Time of Departure | Male | Female |
| 12:00 AM to 4:59 AM | 31 (10.0%) | 2 (0.9%) |
| 5:00 AM to 5:29 AM | 5 (1.6%) | 11 (4.7%) |
| 5:30 AM to 5:59 AM | 16 (5.2%) | 6 (2.6%) |
| 6:00 AM to 6:29 AM | 33 (10.7%) | 17 (7.3%) |
| 6:30 AM to 6:59 AM | 16 (5.2%) | 22 (9.4%) |
| 7:00 AM to 7:29 AM | 55 (17.8%) | 73 (31.2%) |
| 7:30 AM to 7:59 AM | 54 (17.5%) | 26 (11.1%) |
| 8:00 AM to 8:29 AM | 13 (4.2%) | 4 (1.7%) |
| 8:30 AM to 8:59 AM | 14 (4.5%) | 13 (5.6%) |
| 9:00 AM to 9:59 AM | 0 (0.0%) | 8 (3.4%) |
| 10:00 AM to 10:59 AM | 5 (1.6%) | 7 (3.0%) |
| 11:00 AM to 11:59 AM | 0 (0.0%) | 7 (3.0%) |
| 12:00 PM to 3:59 PM | 41 (13.3%) | 12 (5.1%) |
| 4:00 PM to 11:59 PM | 26 (8.4%) | 26 (11.1%) |
| Total | 309 (100.0%) | 234 (100.0%) |
Housing Occupancy in Coloma
Occupancy by Ownership in Coloma
Of the total 487 dwellings in Coloma, owner-occupied units account for 347 (71.3%), while renter-occupied units make up 140 (28.7%).
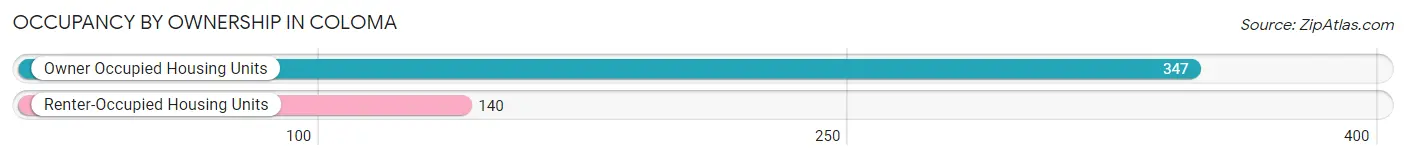
| Occupancy | # Housing Units | % Housing Units |
| Owner Occupied Housing Units | 347 | 71.3% |
| Renter-Occupied Housing Units | 140 | 28.7% |
| Total Occupied Housing Units | 487 | 100.0% |
Occupancy by Household Size in Coloma
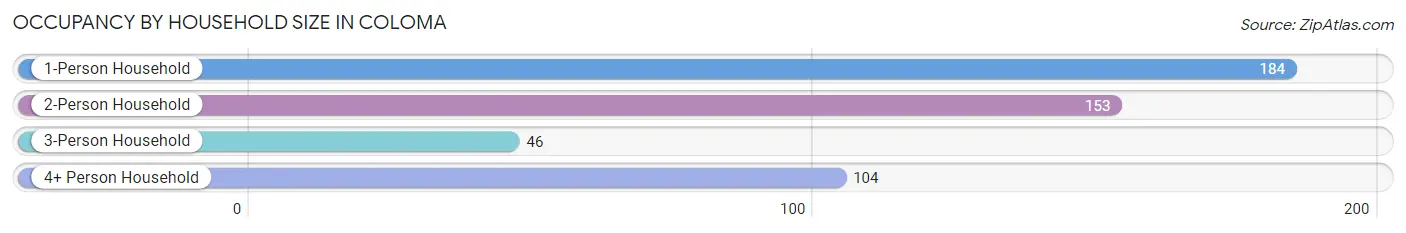
| Household Size | # Housing Units | % Housing Units |
| 1-Person Household | 184 | 37.8% |
| 2-Person Household | 153 | 31.4% |
| 3-Person Household | 46 | 9.5% |
| 4+ Person Household | 104 | 21.4% |
| Total Housing Units | 487 | 100.0% |
Occupancy by Ownership by Household Size in Coloma
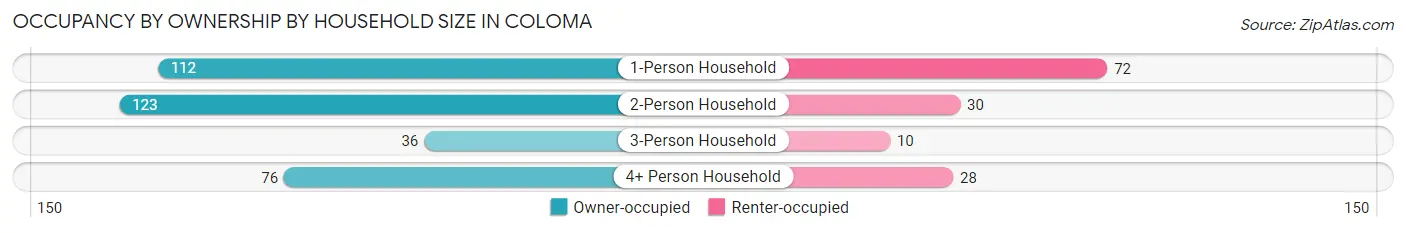
| Household Size | Owner-occupied | Renter-occupied |
| 1-Person Household | 112 (60.9%) | 72 (39.1%) |
| 2-Person Household | 123 (80.4%) | 30 (19.6%) |
| 3-Person Household | 36 (78.3%) | 10 (21.7%) |
| 4+ Person Household | 76 (73.1%) | 28 (26.9%) |
| Total Housing Units | 347 (71.3%) | 140 (28.7%) |
Occupancy by Educational Attainment in Coloma
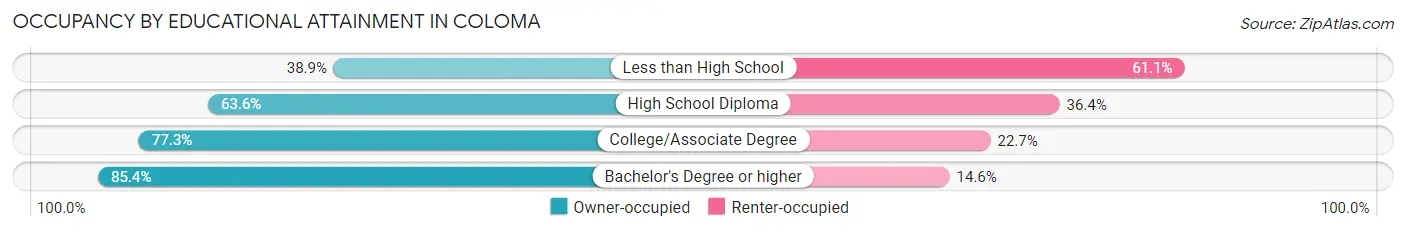
| Household Size | Owner-occupied | Renter-occupied |
| Less than High School | 14 (38.9%) | 22 (61.1%) |
| High School Diploma | 112 (63.6%) | 64 (36.4%) |
| College/Associate Degree | 133 (77.3%) | 39 (22.7%) |
| Bachelor's Degree or higher | 88 (85.4%) | 15 (14.6%) |
Occupancy by Age of Householder in Coloma
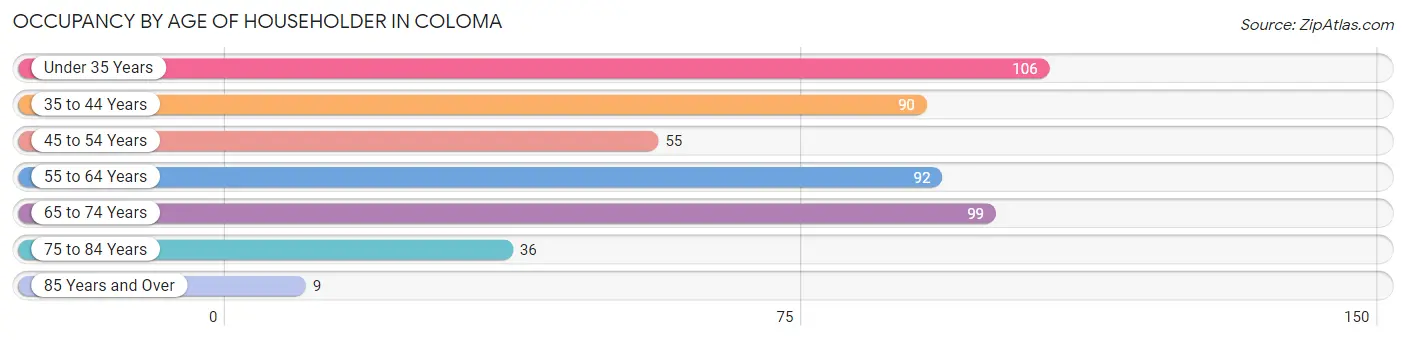
| Age Bracket | # Households | % Households |
| Under 35 Years | 106 | 21.8% |
| 35 to 44 Years | 90 | 18.5% |
| 45 to 54 Years | 55 | 11.3% |
| 55 to 64 Years | 92 | 18.9% |
| 65 to 74 Years | 99 | 20.3% |
| 75 to 84 Years | 36 | 7.4% |
| 85 Years and Over | 9 | 1.8% |
| Total | 487 | 100.0% |
Housing Finances in Coloma
Median Income by Occupancy in Coloma
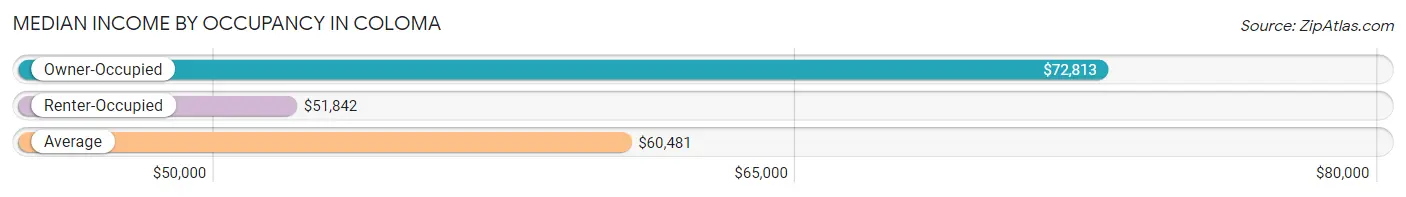
| Occupancy Type | # Households | Median Income |
| Owner-Occupied | 347 (71.3%) | $72,813 |
| Renter-Occupied | 140 (28.7%) | $51,842 |
| Average | 487 (100.0%) | $60,481 |
Occupancy by Householder Income Bracket in Coloma
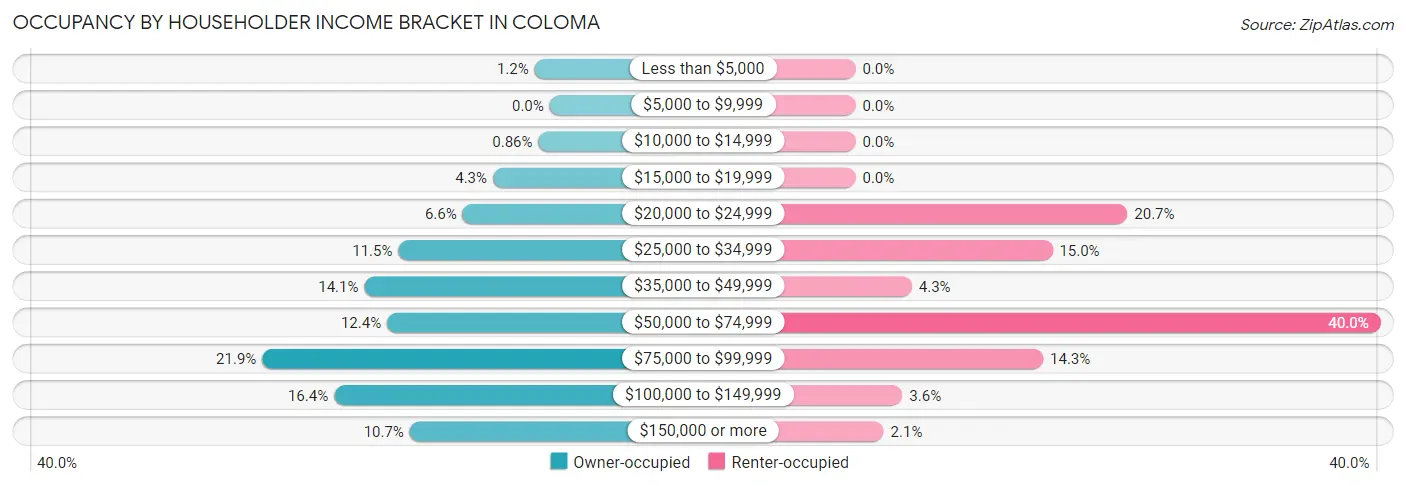
| Income Bracket | Owner-occupied | Renter-occupied |
| Less than $5,000 | 4 (1.1%) | 0 (0.0%) |
| $5,000 to $9,999 | 0 (0.0%) | 0 (0.0%) |
| $10,000 to $14,999 | 3 (0.9%) | 0 (0.0%) |
| $15,000 to $19,999 | 15 (4.3%) | 0 (0.0%) |
| $20,000 to $24,999 | 23 (6.6%) | 29 (20.7%) |
| $25,000 to $34,999 | 40 (11.5%) | 21 (15.0%) |
| $35,000 to $49,999 | 49 (14.1%) | 6 (4.3%) |
| $50,000 to $74,999 | 43 (12.4%) | 56 (40.0%) |
| $75,000 to $99,999 | 76 (21.9%) | 20 (14.3%) |
| $100,000 to $149,999 | 57 (16.4%) | 5 (3.6%) |
| $150,000 or more | 37 (10.7%) | 3 (2.1%) |
| Total | 347 (100.0%) | 140 (100.0%) |
Monthly Housing Cost Tiers in Coloma
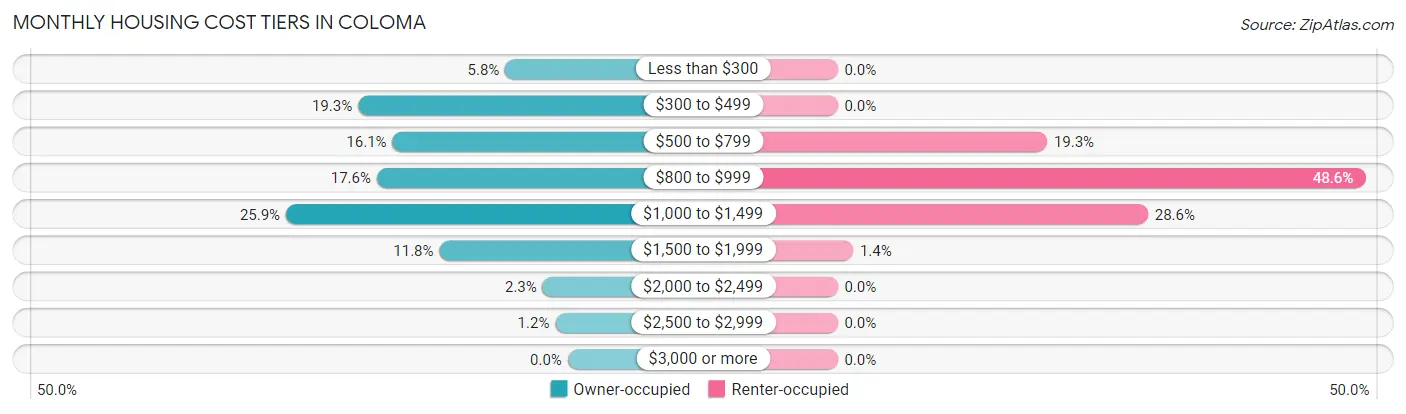
| Monthly Cost | Owner-occupied | Renter-occupied |
| Less than $300 | 20 (5.8%) | 0 (0.0%) |
| $300 to $499 | 67 (19.3%) | 0 (0.0%) |
| $500 to $799 | 56 (16.1%) | 27 (19.3%) |
| $800 to $999 | 61 (17.6%) | 68 (48.6%) |
| $1,000 to $1,499 | 90 (25.9%) | 40 (28.6%) |
| $1,500 to $1,999 | 41 (11.8%) | 2 (1.4%) |
| $2,000 to $2,499 | 8 (2.3%) | 0 (0.0%) |
| $2,500 to $2,999 | 4 (1.1%) | 0 (0.0%) |
| $3,000 or more | 0 (0.0%) | 0 (0.0%) |
| Total | 347 (100.0%) | 140 (100.0%) |
Physical Housing Characteristics in Coloma
Housing Structures in Coloma
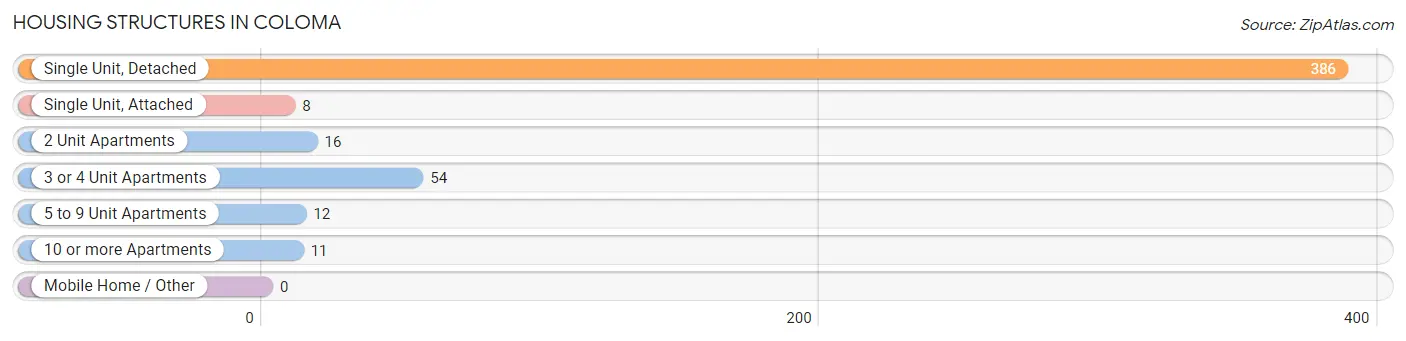
| Structure Type | # Housing Units | % Housing Units |
| Single Unit, Detached | 386 | 79.3% |
| Single Unit, Attached | 8 | 1.6% |
| 2 Unit Apartments | 16 | 3.3% |
| 3 or 4 Unit Apartments | 54 | 11.1% |
| 5 to 9 Unit Apartments | 12 | 2.5% |
| 10 or more Apartments | 11 | 2.3% |
| Mobile Home / Other | 0 | 0.0% |
| Total | 487 | 100.0% |
Housing Structures by Occupancy in Coloma
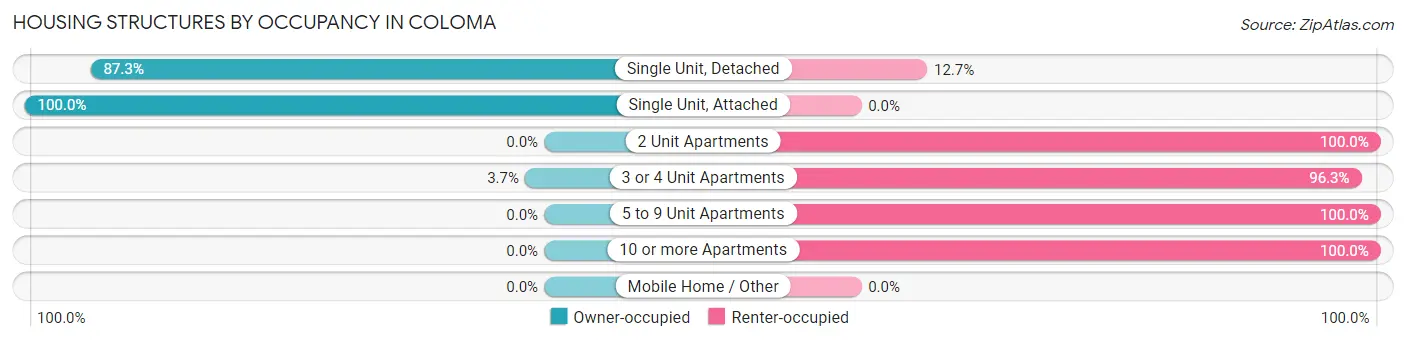
| Structure Type | Owner-occupied | Renter-occupied |
| Single Unit, Detached | 337 (87.3%) | 49 (12.7%) |
| Single Unit, Attached | 8 (100.0%) | 0 (0.0%) |
| 2 Unit Apartments | 0 (0.0%) | 16 (100.0%) |
| 3 or 4 Unit Apartments | 2 (3.7%) | 52 (96.3%) |
| 5 to 9 Unit Apartments | 0 (0.0%) | 12 (100.0%) |
| 10 or more Apartments | 0 (0.0%) | 11 (100.0%) |
| Mobile Home / Other | 0 (0.0%) | 0 (0.0%) |
| Total | 347 (71.3%) | 140 (28.7%) |
Housing Structures by Number of Rooms in Coloma
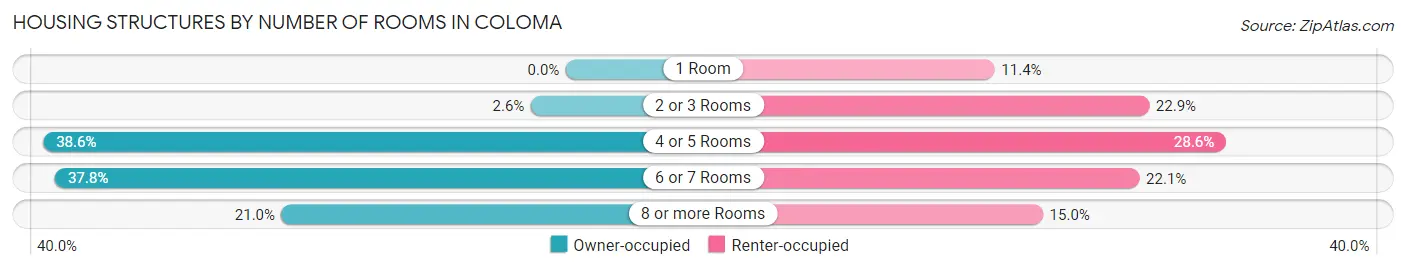
| Number of Rooms | Owner-occupied | Renter-occupied |
| 1 Room | 0 (0.0%) | 16 (11.4%) |
| 2 or 3 Rooms | 9 (2.6%) | 32 (22.9%) |
| 4 or 5 Rooms | 134 (38.6%) | 40 (28.6%) |
| 6 or 7 Rooms | 131 (37.8%) | 31 (22.1%) |
| 8 or more Rooms | 73 (21.0%) | 21 (15.0%) |
| Total | 347 (100.0%) | 140 (100.0%) |
Housing Structure by Heating Type in Coloma
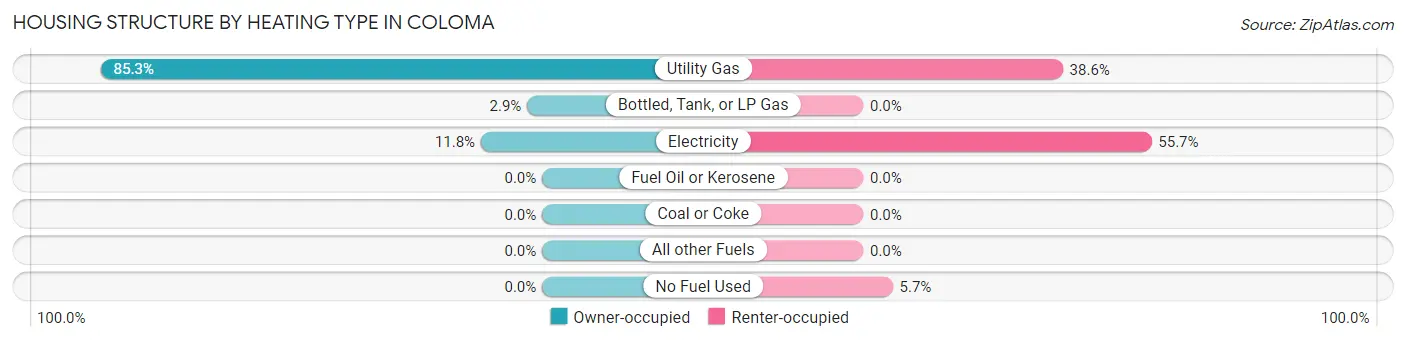
| Heating Type | Owner-occupied | Renter-occupied |
| Utility Gas | 296 (85.3%) | 54 (38.6%) |
| Bottled, Tank, or LP Gas | 10 (2.9%) | 0 (0.0%) |
| Electricity | 41 (11.8%) | 78 (55.7%) |
| Fuel Oil or Kerosene | 0 (0.0%) | 0 (0.0%) |
| Coal or Coke | 0 (0.0%) | 0 (0.0%) |
| All other Fuels | 0 (0.0%) | 0 (0.0%) |
| No Fuel Used | 0 (0.0%) | 8 (5.7%) |
| Total | 347 (100.0%) | 140 (100.0%) |
Household Vehicle Usage in Coloma
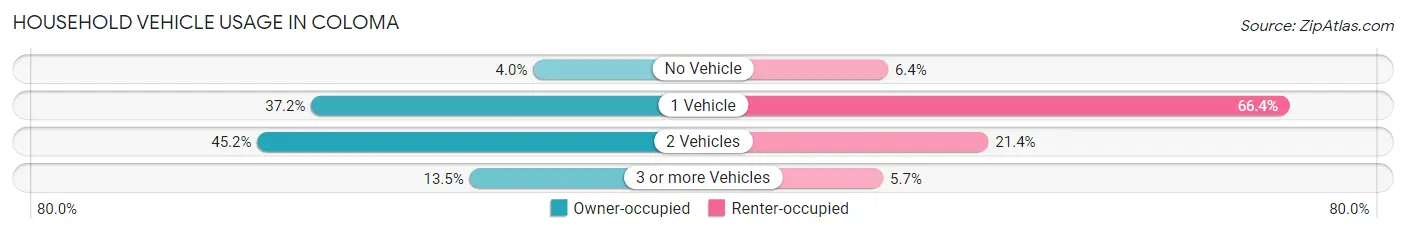
| Vehicles per Household | Owner-occupied | Renter-occupied |
| No Vehicle | 14 (4.0%) | 9 (6.4%) |
| 1 Vehicle | 129 (37.2%) | 93 (66.4%) |
| 2 Vehicles | 157 (45.2%) | 30 (21.4%) |
| 3 or more Vehicles | 47 (13.5%) | 8 (5.7%) |
| Total | 347 (100.0%) | 140 (100.0%) |
Real Estate & Mortgages in Coloma
Real Estate and Mortgage Overview in Coloma
| Characteristic | Without Mortgage | With Mortgage |
| Housing Units | 118 | 229 |
| Median Property Value | $152,600 | $144,000 |
| Median Household Income | $41,111 | $29 |
| Monthly Housing Costs | $387 | $0 |
| Real Estate Taxes | $1,784 | $8 |
Property Value by Mortgage Status in Coloma
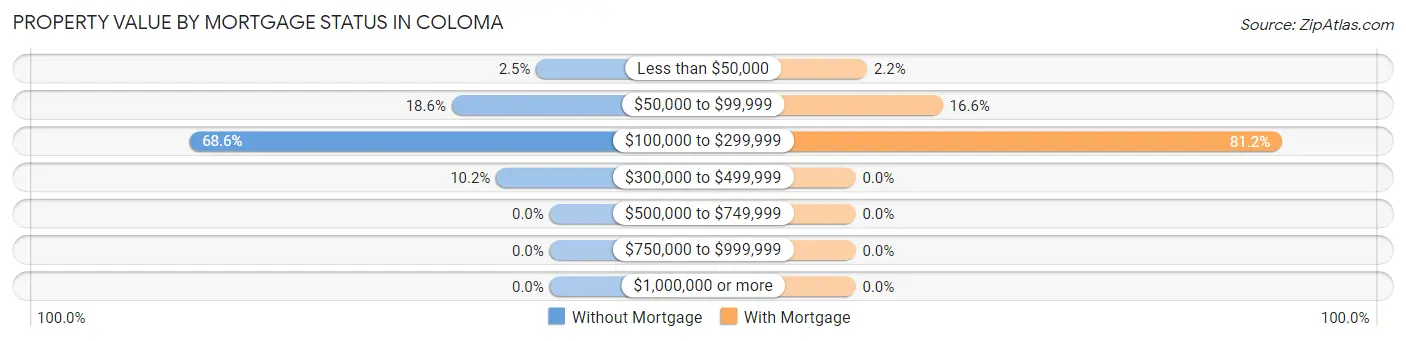
| Property Value | Without Mortgage | With Mortgage |
| Less than $50,000 | 3 (2.5%) | 5 (2.2%) |
| $50,000 to $99,999 | 22 (18.6%) | 38 (16.6%) |
| $100,000 to $299,999 | 81 (68.6%) | 186 (81.2%) |
| $300,000 to $499,999 | 12 (10.2%) | 0 (0.0%) |
| $500,000 to $749,999 | 0 (0.0%) | 0 (0.0%) |
| $750,000 to $999,999 | 0 (0.0%) | 0 (0.0%) |
| $1,000,000 or more | 0 (0.0%) | 0 (0.0%) |
| Total | 118 (100.0%) | 229 (100.0%) |
Household Income by Mortgage Status in Coloma
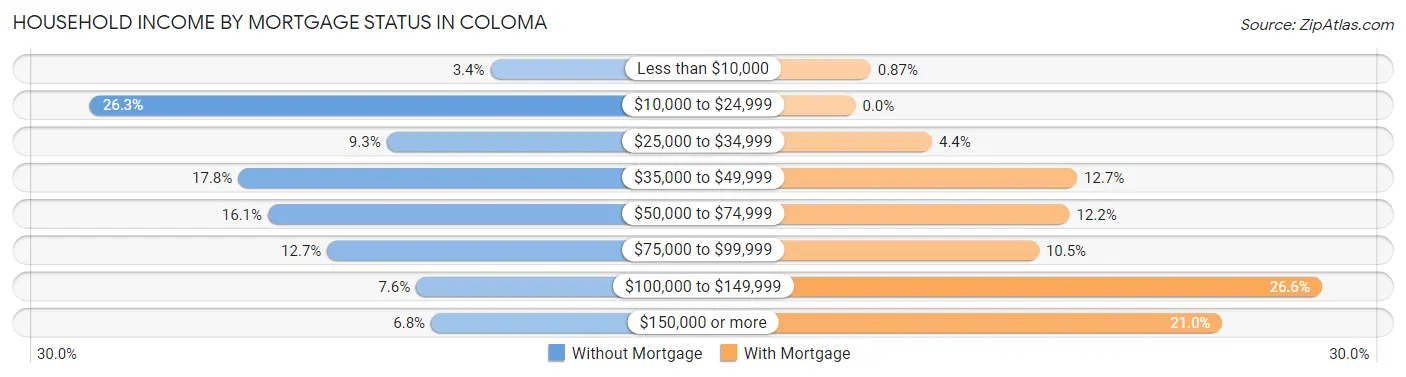
| Household Income | Without Mortgage | With Mortgage |
| Less than $10,000 | 4 (3.4%) | 2 (0.9%) |
| $10,000 to $24,999 | 31 (26.3%) | 0 (0.0%) |
| $25,000 to $34,999 | 11 (9.3%) | 10 (4.4%) |
| $35,000 to $49,999 | 21 (17.8%) | 29 (12.7%) |
| $50,000 to $74,999 | 19 (16.1%) | 28 (12.2%) |
| $75,000 to $99,999 | 15 (12.7%) | 24 (10.5%) |
| $100,000 to $149,999 | 9 (7.6%) | 61 (26.6%) |
| $150,000 or more | 8 (6.8%) | 48 (21.0%) |
| Total | 118 (100.0%) | 229 (100.0%) |
Property Value to Household Income Ratio in Coloma
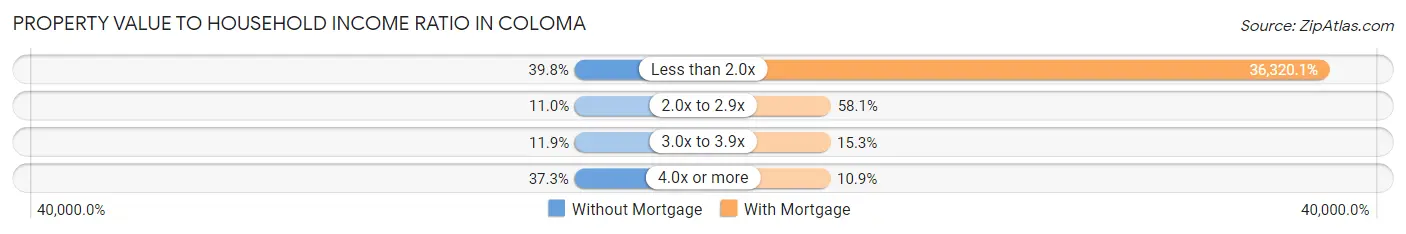
| Value-to-Income Ratio | Without Mortgage | With Mortgage |
| Less than 2.0x | 47 (39.8%) | 83,173 (36,320.1%) |
| 2.0x to 2.9x | 13 (11.0%) | 133 (58.1%) |
| 3.0x to 3.9x | 14 (11.9%) | 35 (15.3%) |
| 4.0x or more | 44 (37.3%) | 25 (10.9%) |
| Total | 118 (100.0%) | 229 (100.0%) |
Real Estate Taxes by Mortgage Status in Coloma
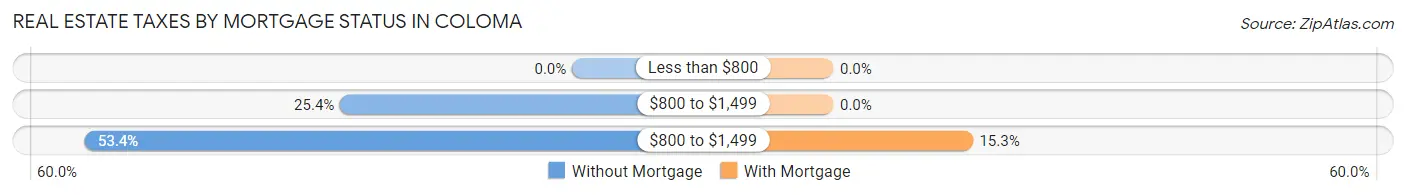
| Property Taxes | Without Mortgage | With Mortgage |
| Less than $800 | 0 (0.0%) | 0 (0.0%) |
| $800 to $1,499 | 30 (25.4%) | 0 (0.0%) |
| $800 to $1,499 | 63 (53.4%) | 35 (15.3%) |
| Total | 118 (100.0%) | 229 (100.0%) |
Health & Disability in Coloma
Health Insurance Coverage by Age in Coloma
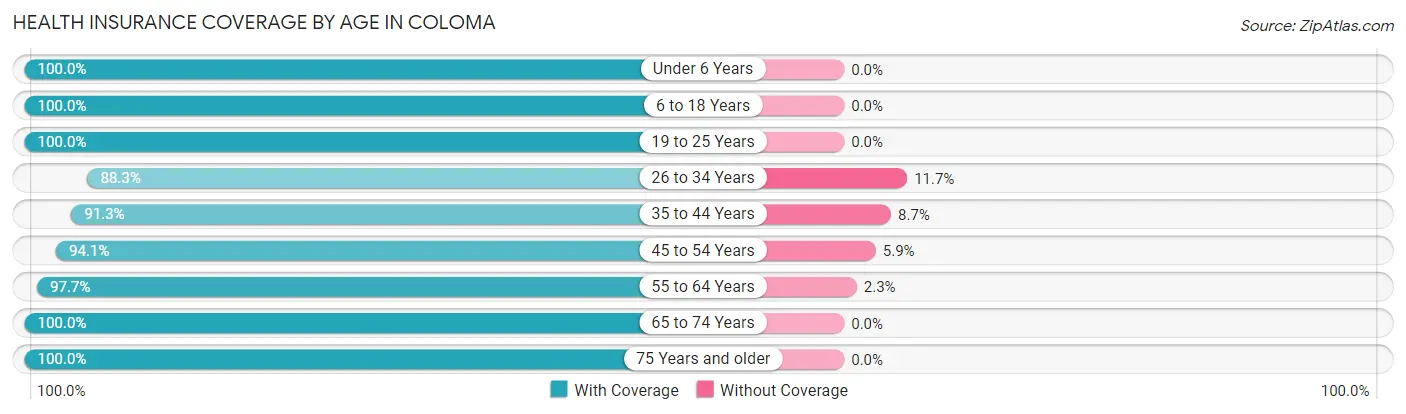
| Age Bracket | With Coverage | Without Coverage |
| Under 6 Years | 121 (100.0%) | 0 (0.0%) |
| 6 to 18 Years | 217 (100.0%) | 0 (0.0%) |
| 19 to 25 Years | 67 (100.0%) | 0 (0.0%) |
| 26 to 34 Years | 143 (88.3%) | 19 (11.7%) |
| 35 to 44 Years | 136 (91.3%) | 13 (8.7%) |
| 45 to 54 Years | 112 (94.1%) | 7 (5.9%) |
| 55 to 64 Years | 125 (97.7%) | 3 (2.3%) |
| 65 to 74 Years | 155 (100.0%) | 0 (0.0%) |
| 75 Years and older | 53 (100.0%) | 0 (0.0%) |
| Total | 1,129 (96.4%) | 42 (3.6%) |
Health Insurance Coverage by Citizenship Status in Coloma
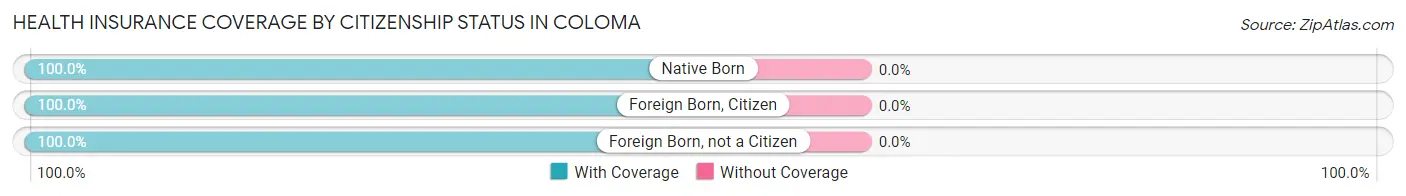
| Citizenship Status | With Coverage | Without Coverage |
| Native Born | 121 (100.0%) | 0 (0.0%) |
| Foreign Born, Citizen | 217 (100.0%) | 0 (0.0%) |
| Foreign Born, not a Citizen | 67 (100.0%) | 0 (0.0%) |
Health Insurance Coverage by Household Income in Coloma
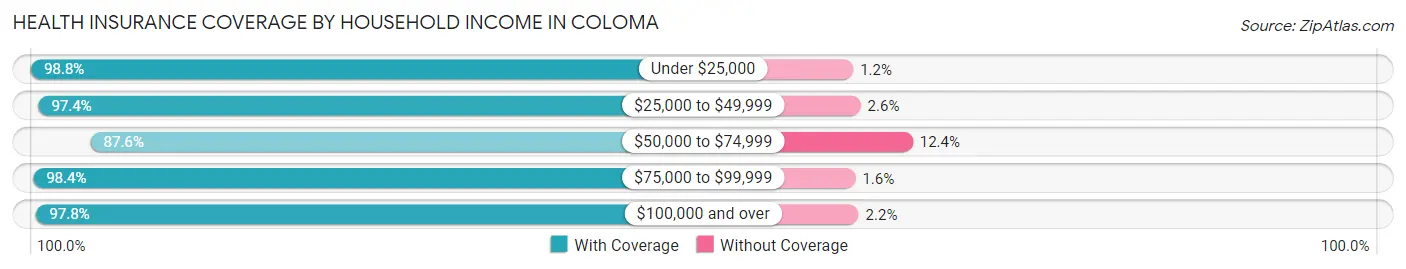
| Household Income | With Coverage | Without Coverage |
| Under $25,000 | 164 (98.8%) | 2 (1.2%) |
| $25,000 to $49,999 | 187 (97.4%) | 5 (2.6%) |
| $50,000 to $74,999 | 163 (87.6%) | 23 (12.4%) |
| $75,000 to $99,999 | 304 (98.4%) | 5 (1.6%) |
| $100,000 and over | 308 (97.8%) | 7 (2.2%) |
Public vs Private Health Insurance Coverage by Age in Coloma
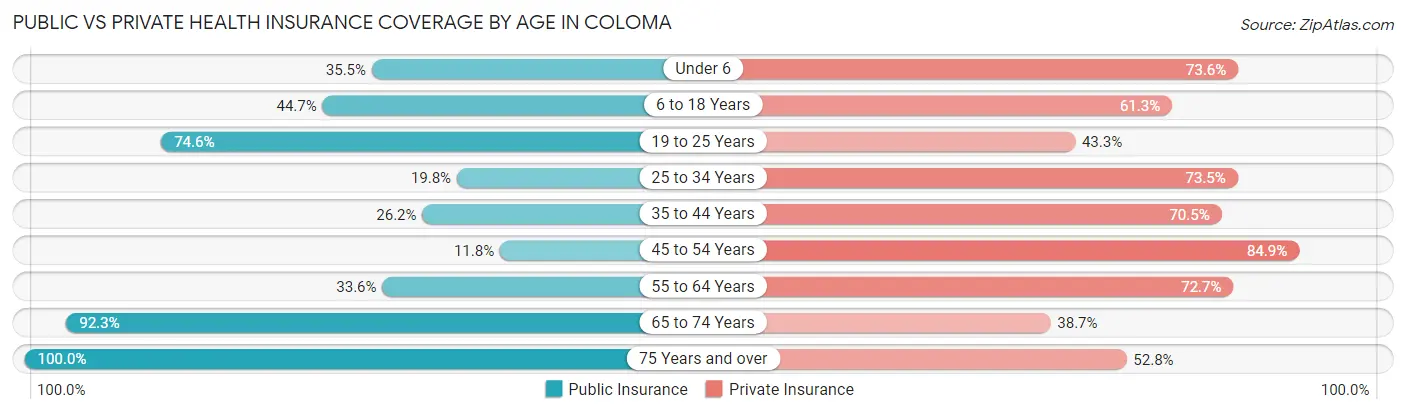
| Age Bracket | Public Insurance | Private Insurance |
| Under 6 | 43 (35.5%) | 89 (73.6%) |
| 6 to 18 Years | 97 (44.7%) | 133 (61.3%) |
| 19 to 25 Years | 50 (74.6%) | 29 (43.3%) |
| 25 to 34 Years | 32 (19.8%) | 119 (73.5%) |
| 35 to 44 Years | 39 (26.2%) | 105 (70.5%) |
| 45 to 54 Years | 14 (11.8%) | 101 (84.9%) |
| 55 to 64 Years | 43 (33.6%) | 93 (72.7%) |
| 65 to 74 Years | 143 (92.3%) | 60 (38.7%) |
| 75 Years and over | 53 (100.0%) | 28 (52.8%) |
| Total | 514 (43.9%) | 757 (64.6%) |
Disability Status by Sex by Age in Coloma
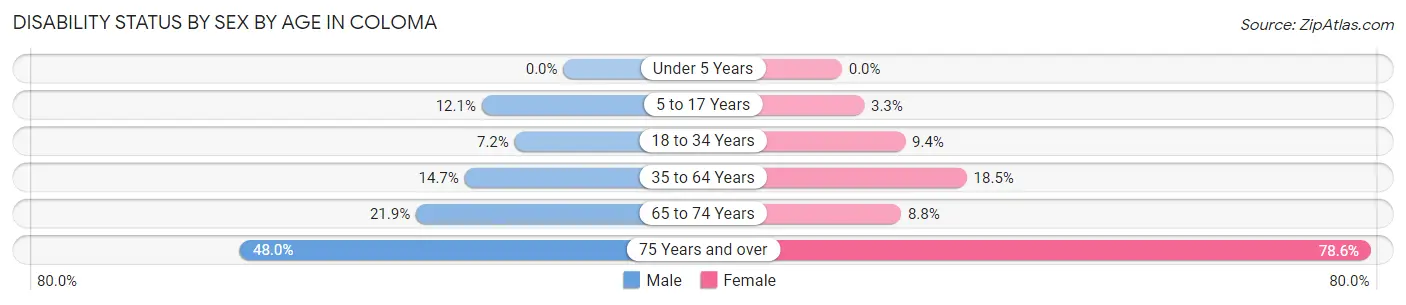
| Age Bracket | Male | Female |
| Under 5 Years | 0 (0.0%) | 0 (0.0%) |
| 5 to 17 Years | 12 (12.1%) | 3 (3.3%) |
| 18 to 34 Years | 11 (7.2%) | 11 (9.4%) |
| 35 to 64 Years | 28 (14.7%) | 38 (18.5%) |
| 65 to 74 Years | 14 (21.9%) | 8 (8.8%) |
| 75 Years and over | 12 (48.0%) | 22 (78.6%) |
Disability Class by Sex by Age in Coloma
Disability Class: Hearing Difficulty
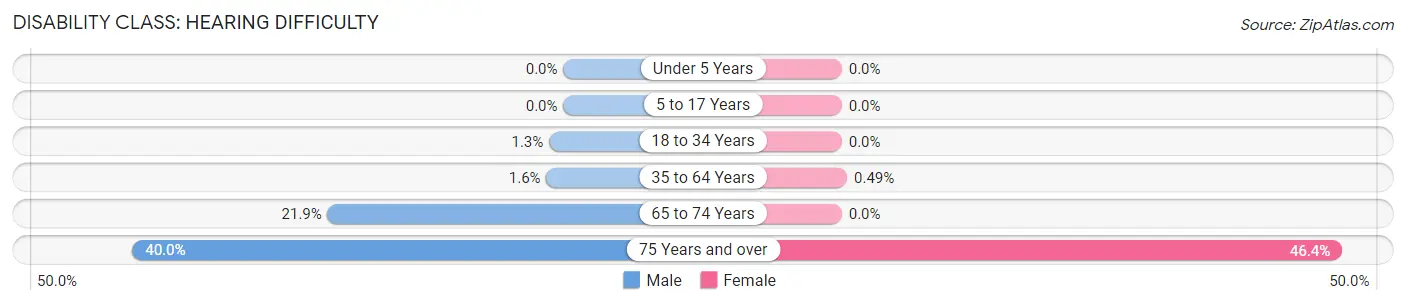
| Age Bracket | Male | Female |
| Under 5 Years | 0 (0.0%) | 0 (0.0%) |
| 5 to 17 Years | 0 (0.0%) | 0 (0.0%) |
| 18 to 34 Years | 2 (1.3%) | 0 (0.0%) |
| 35 to 64 Years | 3 (1.6%) | 1 (0.5%) |
| 65 to 74 Years | 14 (21.9%) | 0 (0.0%) |
| 75 Years and over | 10 (40.0%) | 13 (46.4%) |
Disability Class: Vision Difficulty
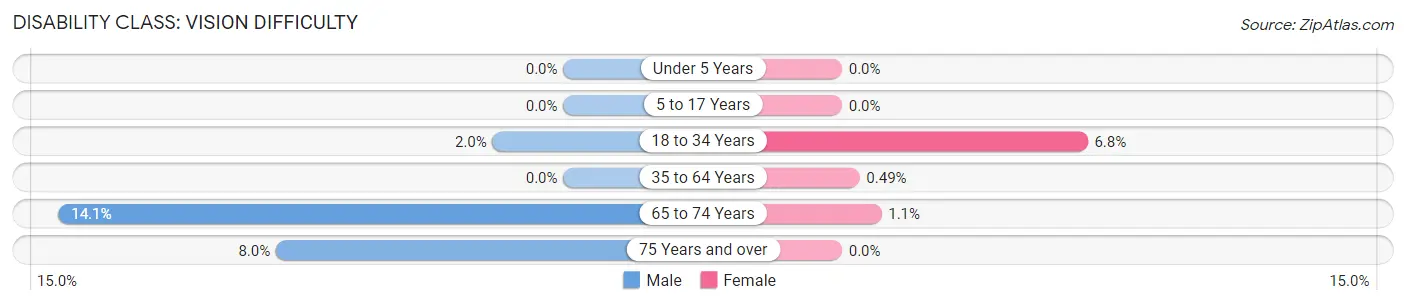
| Age Bracket | Male | Female |
| Under 5 Years | 0 (0.0%) | 0 (0.0%) |
| 5 to 17 Years | 0 (0.0%) | 0 (0.0%) |
| 18 to 34 Years | 3 (2.0%) | 8 (6.8%) |
| 35 to 64 Years | 0 (0.0%) | 1 (0.5%) |
| 65 to 74 Years | 9 (14.1%) | 1 (1.1%) |
| 75 Years and over | 2 (8.0%) | 0 (0.0%) |
Disability Class: Cognitive Difficulty
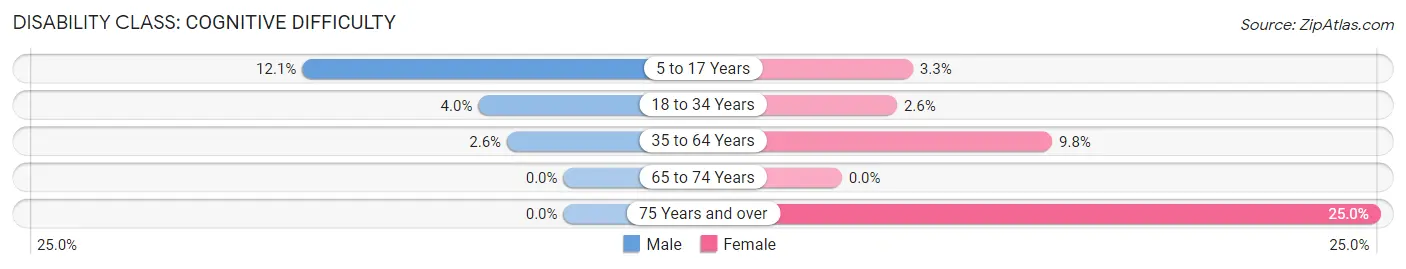
| Age Bracket | Male | Female |
| 5 to 17 Years | 12 (12.1%) | 3 (3.3%) |
| 18 to 34 Years | 6 (4.0%) | 3 (2.6%) |
| 35 to 64 Years | 5 (2.6%) | 20 (9.8%) |
| 65 to 74 Years | 0 (0.0%) | 0 (0.0%) |
| 75 Years and over | 0 (0.0%) | 7 (25.0%) |
Disability Class: Ambulatory Difficulty
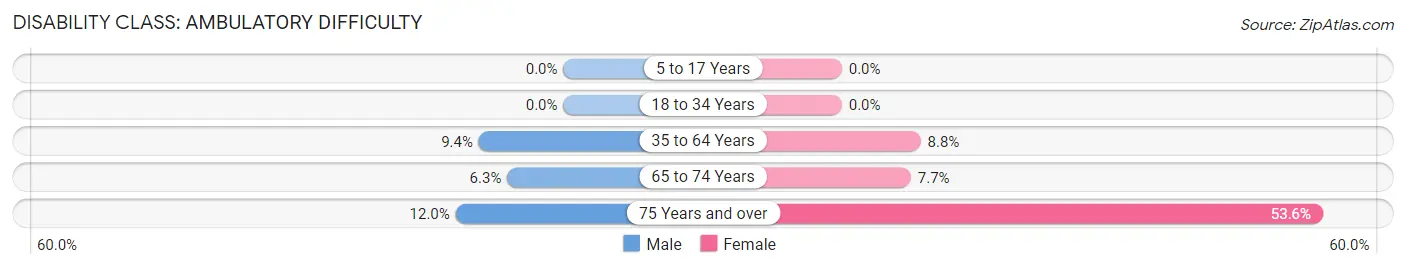
| Age Bracket | Male | Female |
| 5 to 17 Years | 0 (0.0%) | 0 (0.0%) |
| 18 to 34 Years | 0 (0.0%) | 0 (0.0%) |
| 35 to 64 Years | 18 (9.4%) | 18 (8.8%) |
| 65 to 74 Years | 4 (6.2%) | 7 (7.7%) |
| 75 Years and over | 3 (12.0%) | 15 (53.6%) |
Disability Class: Self-Care Difficulty
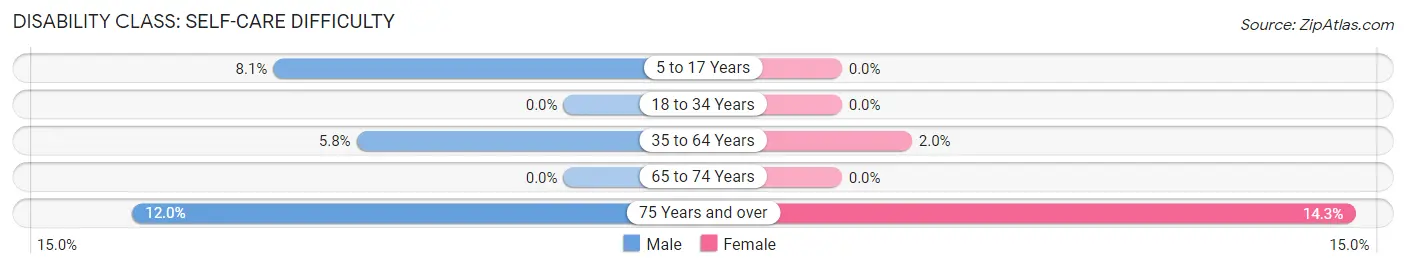
| Age Bracket | Male | Female |
| 5 to 17 Years | 8 (8.1%) | 0 (0.0%) |
| 18 to 34 Years | 0 (0.0%) | 0 (0.0%) |
| 35 to 64 Years | 11 (5.8%) | 4 (1.9%) |
| 65 to 74 Years | 0 (0.0%) | 0 (0.0%) |
| 75 Years and over | 3 (12.0%) | 4 (14.3%) |
Technology Access in Coloma
Computing Device Access in Coloma
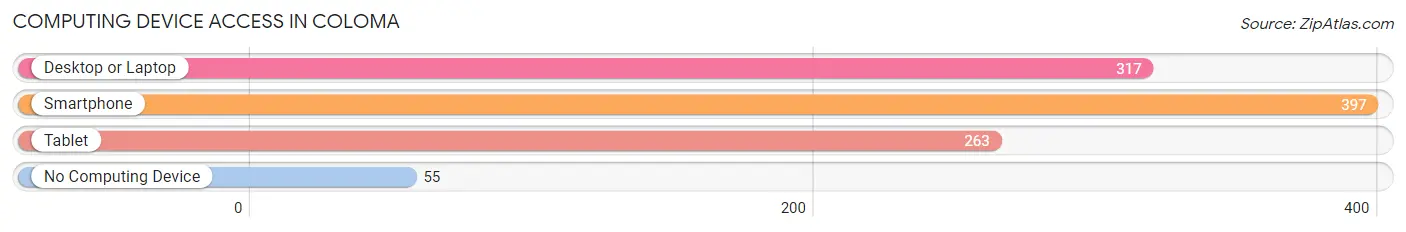
| Device Type | # Households | % Households |
| Desktop or Laptop | 317 | 65.1% |
| Smartphone | 397 | 81.5% |
| Tablet | 263 | 54.0% |
| No Computing Device | 55 | 11.3% |
| Total | 487 | 100.0% |
Internet Access in Coloma
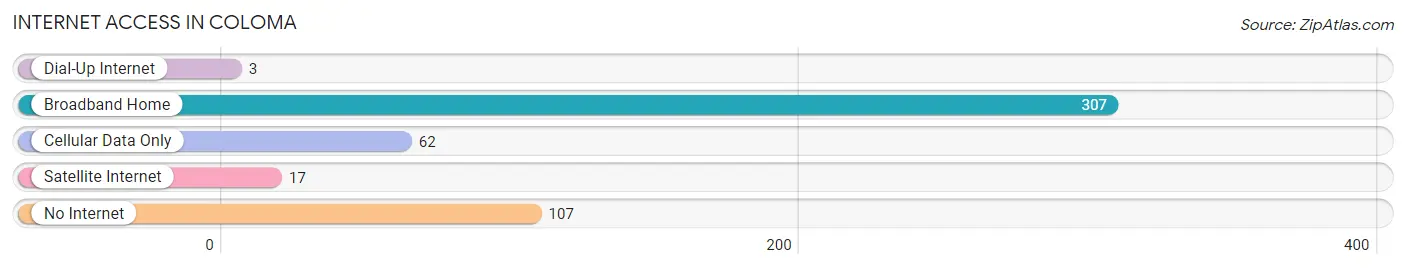
| Internet Type | # Households | % Households |
| Dial-Up Internet | 3 | 0.6% |
| Broadband Home | 307 | 63.0% |
| Cellular Data Only | 62 | 12.7% |
| Satellite Internet | 17 | 3.5% |
| No Internet | 107 | 22.0% |
| Total | 487 | 100.0% |
Coloma Summary
Coloma is a small city located in Berrien County, Michigan. It is situated on the banks of the Paw Paw River, about 10 miles east of the city of St. Joseph. The city has a population of 2,945 people, according to the 2010 census.
Geography
Coloma is located in southwestern Michigan, in the southwestern corner of Berrien County. It is situated on the banks of the Paw Paw River, about 10 miles east of the city of St. Joseph. The city is bordered by the townships of Watervliet to the north, Bainbridge to the east, and Hagar to the south. The city covers an area of 2.2 square miles, all of which is land.
The terrain of Coloma is generally flat, with some rolling hills in the northern part of the city. The city is located in the Central Lowlands region of Michigan, and is part of the Great Lakes Plain. The climate of Coloma is humid continental, with warm summers and cold winters. The average annual temperature is around 50°F, and the average annual precipitation is around 33 inches.
Economy
Coloma’s economy is largely based on agriculture and manufacturing. The city is home to several large agricultural operations, including the Coloma Farms, which produces corn, soybeans, and wheat. The city is also home to several manufacturing companies, including the Coloma Manufacturing Company, which produces automotive parts, and the Coloma Tool and Die Company, which produces industrial tools and dies.
The city is also home to several retail stores, restaurants, and other businesses. The city is served by the Coloma-Watervliet School District, which provides educational services to the city’s students.
Demographics
According to the 2010 census, Coloma has a population of 2,945 people. The racial makeup of the city is 94.3% White, 1.2% African American, 0.7% Native American, 0.4% Asian, 0.1% Pacific Islander, 1.2% from other races, and 2.1% from two or more races. Hispanic or Latino of any race were 3.2% of the population.
The median household income in Coloma is $41,944, and the median family income is $50,917. The per capita income in Coloma is $20,845. About 11.3% of the population is below the poverty line.
Coloma is served by the Coloma-Watervliet School District, which provides educational services to the city’s students. The district has two elementary schools, one middle school, and one high school. The city is also home to Lake Michigan College, which offers a variety of associate’s and bachelor’s degree programs.
Coloma is a small city with a rich history and a diverse economy. The city is home to several large agricultural operations, manufacturing companies, and retail stores. The city is served by the Coloma-Watervliet School District, which provides educational services to the city’s students. The city has a population of 2,945 people, according to the 2010 census, and the median household income is $41,944.
Common Questions
What is Per Capita Income in Coloma?
Per Capita income in Coloma is $31,018.
What is the Median Family Income in Coloma?
Median Family Income in Coloma is $84,231.
What is the Median Household income in Coloma?
Median Household Income in Coloma is $60,481.
What is Income or Wage Gap in Coloma?
Income or Wage Gap in Coloma is 14.5%.
Women in Coloma earn 85.5 cents for every dollar earned by a man.
What is Inequality or Gini Index in Coloma?
Inequality or Gini Index in Coloma is 0.36.
What is the Total Population of Coloma?
Total Population of Coloma is 1,171.
What is the Total Male Population of Coloma?
Total Male Population of Coloma is 598.
What is the Total Female Population of Coloma?
Total Female Population of Coloma is 573.
What is the Ratio of Males per 100 Females in Coloma?
There are 104.36 Males per 100 Females in Coloma.
What is the Ratio of Females per 100 Males in Coloma?
There are 95.82 Females per 100 Males in Coloma.
What is the Median Population Age in Coloma?
Median Population Age in Coloma is 36.6 Years.
What is the Average Family Size in Coloma
Average Family Size in Coloma is 3.3 People.
What is the Average Household Size in Coloma
Average Household Size in Coloma is 2.4 People.
How Large is the Labor Force in Coloma?
There are 597 People in the Labor Forcein in Coloma.
What is the Percentage of People in the Labor Force in Coloma?
66.3% of People are in the Labor Force in Coloma.
What is the Unemployment Rate in Coloma?
Unemployment Rate in Coloma is 4.2%.