Clare, MI Map & Demographics
Clare Map
Clare Overview
$27,113
PER CAPITA INCOME
$50,685
AVG FAMILY INCOME
$41,384
AVG HOUSEHOLD INCOME
30.1%
WAGE / INCOME GAP [ % ]
69.9¢/ $1
WAGE / INCOME GAP [ $ ]
0.44
INEQUALITY / GINI INDEX
3,367
TOTAL POPULATION
1,291
MALE POPULATION
2,076
FEMALE POPULATION
62.19
MALES / 100 FEMALES
160.81
FEMALES / 100 MALES
43.2
MEDIAN AGE
3.5
AVG FAMILY SIZE
2.3
AVG HOUSEHOLD SIZE
1,441
LABOR FORCE [ PEOPLE ]
53.6%
PERCENT IN LABOR FORCE
6.7%
UNEMPLOYMENT RATE
Clare Zip Codes
Clare Area Codes
Income in Clare
Income Overview in Clare
Per Capita Income in Clare is $27,113, while median incomes of families and households are $50,685 and $41,384 respectively.
| Characteristic | Number | Measure |
| Per Capita Income | 3,367 | $27,113 |
| Median Family Income | 691 | $50,685 |
| Mean Family Income | 691 | $74,102 |
| Median Household Income | 1,405 | $41,384 |
| Mean Household Income | 1,405 | $60,566 |
| Income Deficit | 691 | $0 |
| Wage / Income Gap (%) | 3,367 | 30.08% |
| Wage / Income Gap ($) | 3,367 | 69.92¢ per $1 |
| Gini / Inequality Index | 3,367 | 0.44 |
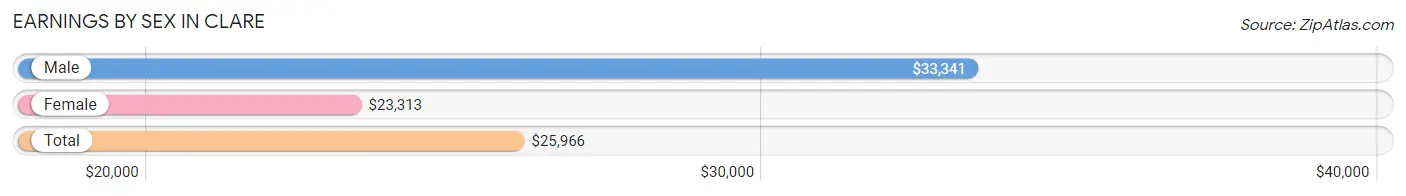
Earnings by Sex in Clare
Average Earnings in Clare are $25,966, $33,341 for men and $23,313 for women, a difference of 30.1%.
| Sex | Number | Average Earnings |
| Male | 647 (41.4%) | $33,341 |
| Female | 916 (58.6%) | $23,313 |
| Total | 1,563 (100.0%) | $25,966 |
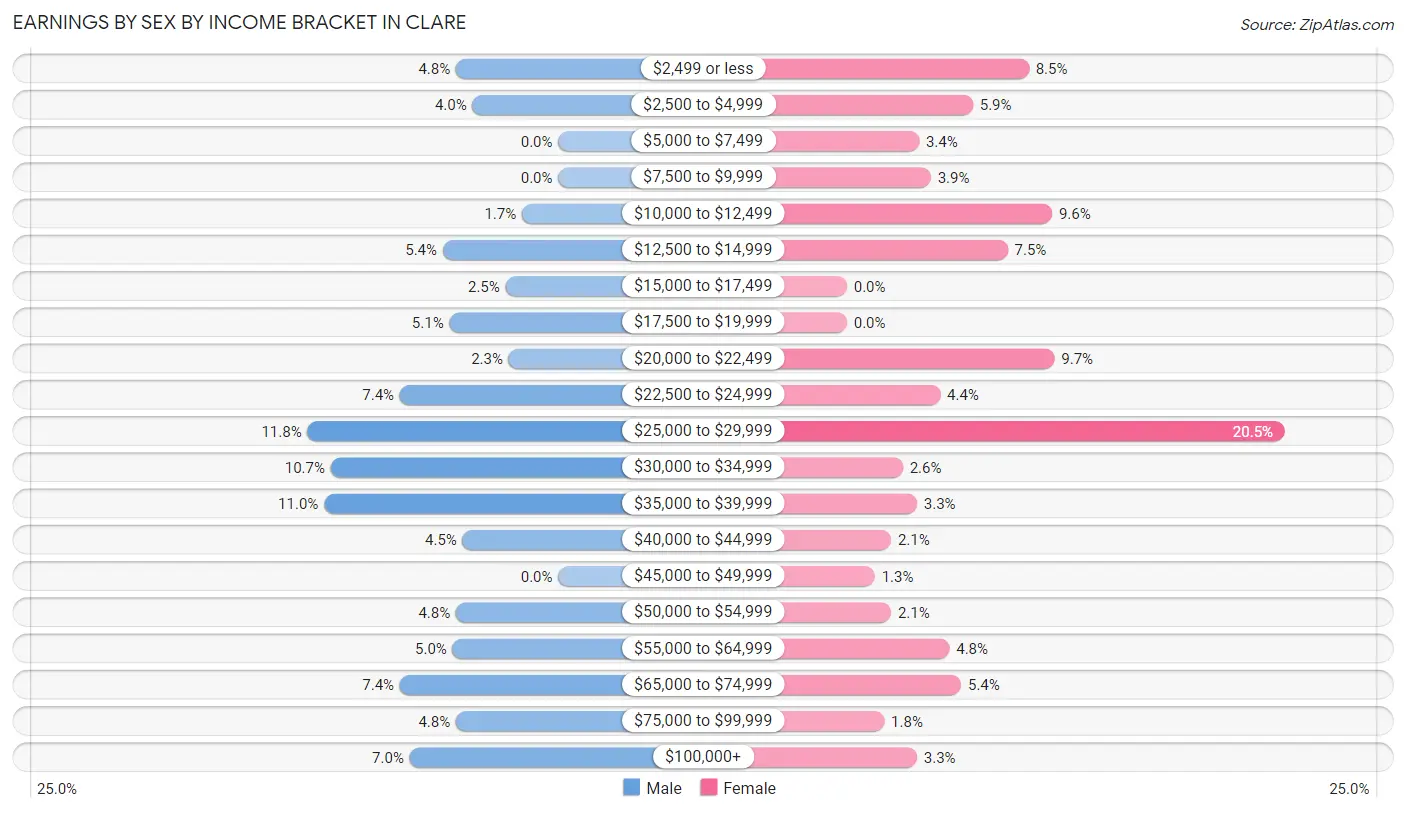
Earnings by Sex by Income Bracket in Clare
The most common earnings brackets in Clare are $25,000 to $29,999 for men (76 | 11.7%) and $25,000 to $29,999 for women (188 | 20.5%).
| Income | Male | Female |
| $2,499 or less | 31 (4.8%) | 78 (8.5%) |
| $2,500 to $4,999 | 26 (4.0%) | 54 (5.9%) |
| $5,000 to $7,499 | 0 (0.0%) | 31 (3.4%) |
| $7,500 to $9,999 | 0 (0.0%) | 36 (3.9%) |
| $10,000 to $12,499 | 11 (1.7%) | 88 (9.6%) |
| $12,500 to $14,999 | 35 (5.4%) | 69 (7.5%) |
| $15,000 to $17,499 | 16 (2.5%) | 0 (0.0%) |
| $17,500 to $19,999 | 33 (5.1%) | 0 (0.0%) |
| $20,000 to $22,499 | 15 (2.3%) | 89 (9.7%) |
| $22,500 to $24,999 | 48 (7.4%) | 40 (4.4%) |
| $25,000 to $29,999 | 76 (11.7%) | 188 (20.5%) |
| $30,000 to $34,999 | 69 (10.7%) | 24 (2.6%) |
| $35,000 to $39,999 | 71 (11.0%) | 30 (3.3%) |
| $40,000 to $44,999 | 29 (4.5%) | 19 (2.1%) |
| $45,000 to $49,999 | 0 (0.0%) | 12 (1.3%) |
| $50,000 to $54,999 | 31 (4.8%) | 19 (2.1%) |
| $55,000 to $64,999 | 32 (5.0%) | 44 (4.8%) |
| $65,000 to $74,999 | 48 (7.4%) | 49 (5.3%) |
| $75,000 to $99,999 | 31 (4.8%) | 16 (1.8%) |
| $100,000+ | 45 (7.0%) | 30 (3.3%) |
| Total | 647 (100.0%) | 916 (100.0%) |
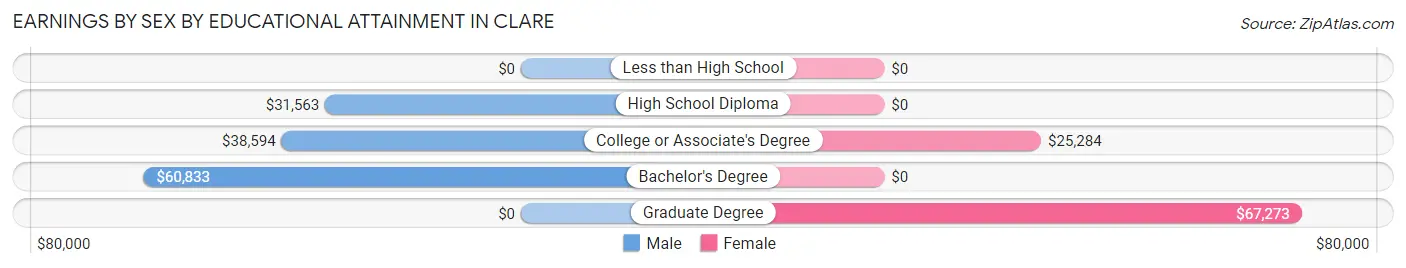
Earnings by Sex by Educational Attainment in Clare
Average earnings in Clare are $35,298 for men and $25,231 for women, a difference of 28.5%. Men with an educational attainment of bachelor's degree enjoy the highest average annual earnings of $60,833, while those with high school diploma education earn the least with $31,563. Women with an educational attainment of graduate degree earn the most with the average annual earnings of $67,273, while those with college or associate's degree education have the smallest earnings of $25,284.
| Educational Attainment | Male Income | Female Income |
| Less than High School | - | - |
| High School Diploma | $31,563 | $0 |
| College or Associate's Degree | $38,594 | $25,284 |
| Bachelor's Degree | $60,833 | $0 |
| Graduate Degree | - | - |
| Total | $35,298 | $25,231 |
Family Income in Clare
Family Income Brackets in Clare
According to the Clare family income data, there are 166 families falling into the $15,000 to $24,999 income range, which is the most common income bracket and makes up 24.0% of all families. Conversely, the less than $10,000 income bracket is the least frequent group with only 10 families (1.5%) belonging to this category.
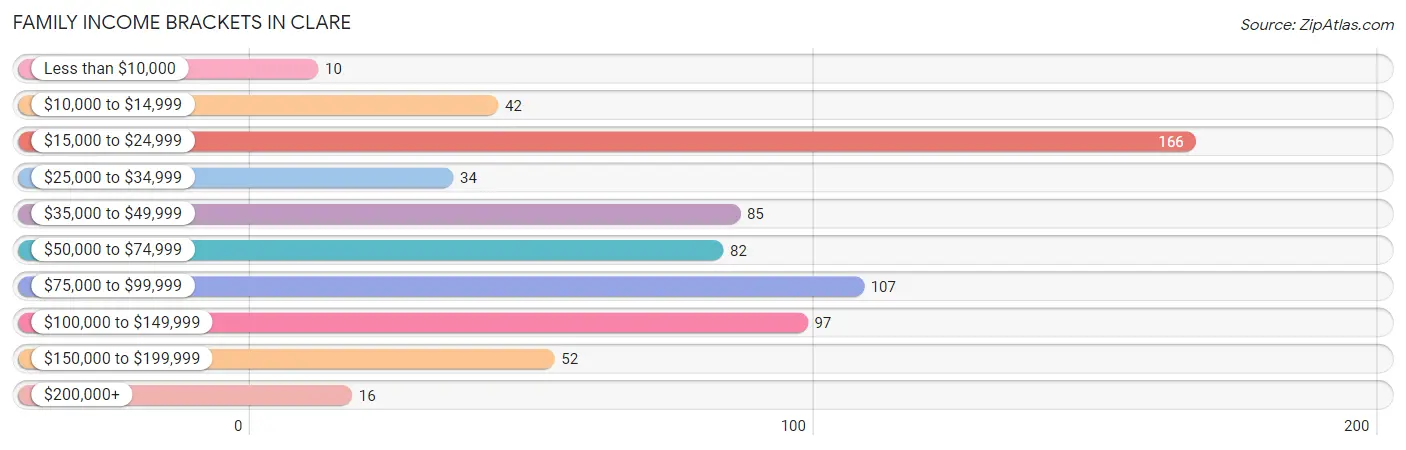
| Income Bracket | # Families | % Families |
| Less than $10,000 | 10 | 1.4% |
| $10,000 to $14,999 | 42 | 6.1% |
| $15,000 to $24,999 | 166 | 24.0% |
| $25,000 to $34,999 | 34 | 4.9% |
| $35,000 to $49,999 | 85 | 12.3% |
| $50,000 to $74,999 | 82 | 11.9% |
| $75,000 to $99,999 | 107 | 15.5% |
| $100,000 to $149,999 | 97 | 14.0% |
| $150,000 to $199,999 | 52 | 7.5% |
| $200,000+ | 16 | 2.3% |
Family Income by Famaliy Size in Clare
4-person families (109 | 15.8%) account for the highest median family income in Clare with $76,142 per family, while 2-person families (289 | 41.8%) have the highest median income of $25,312 per family member.
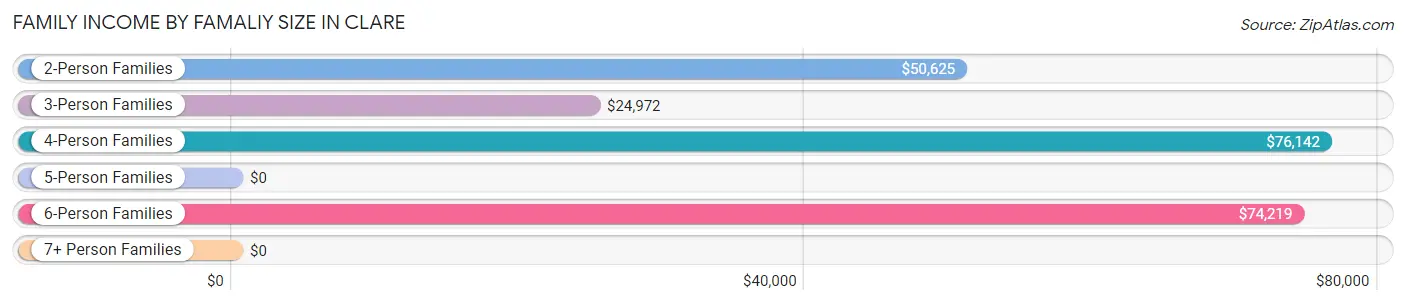
| Income Bracket | # Families | Median Income |
| 2-Person Families | 289 (41.8%) | $50,625 |
| 3-Person Families | 220 (31.8%) | $24,972 |
| 4-Person Families | 109 (15.8%) | $76,142 |
| 5-Person Families | 44 (6.4%) | $0 |
| 6-Person Families | 29 (4.2%) | $74,219 |
| 7+ Person Families | 0 (0.0%) | $0 |
| Total | 691 (100.0%) | $50,685 |
Family Income by Number of Earners in Clare
The median family income in Clare is $50,685, with families comprising 2 earners (197) having the highest median family income of $84,350, while families with 1 earner (245) have the lowest median family income of $24,280, accounting for 28.5% and 35.5% of families, respectively.
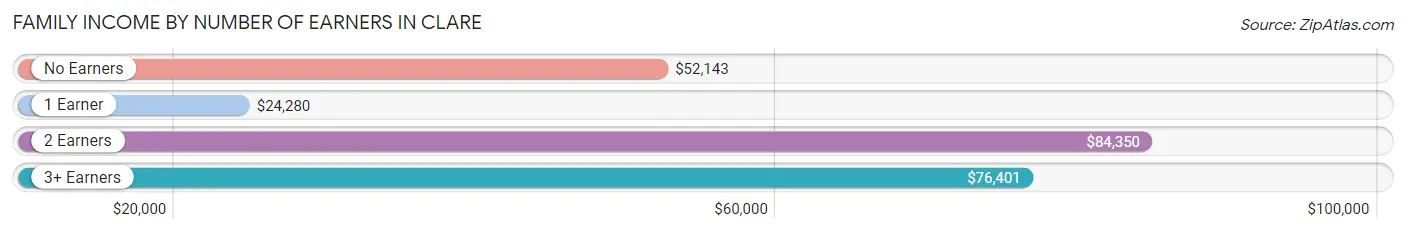
| Number of Earners | # Families | Median Income |
| No Earners | 156 (22.6%) | $52,143 |
| 1 Earner | 245 (35.5%) | $24,280 |
| 2 Earners | 197 (28.5%) | $84,350 |
| 3+ Earners | 93 (13.5%) | $76,401 |
| Total | 691 (100.0%) | $50,685 |
Household Income in Clare
Household Income Brackets in Clare
With 246 households falling in the category, the $35,000 to $49,999 income range is the most frequent in Clare, accounting for 17.5% of all households. In contrast, only 15 households (1.1%) fall into the $200,000+ income bracket, making it the least populous group.
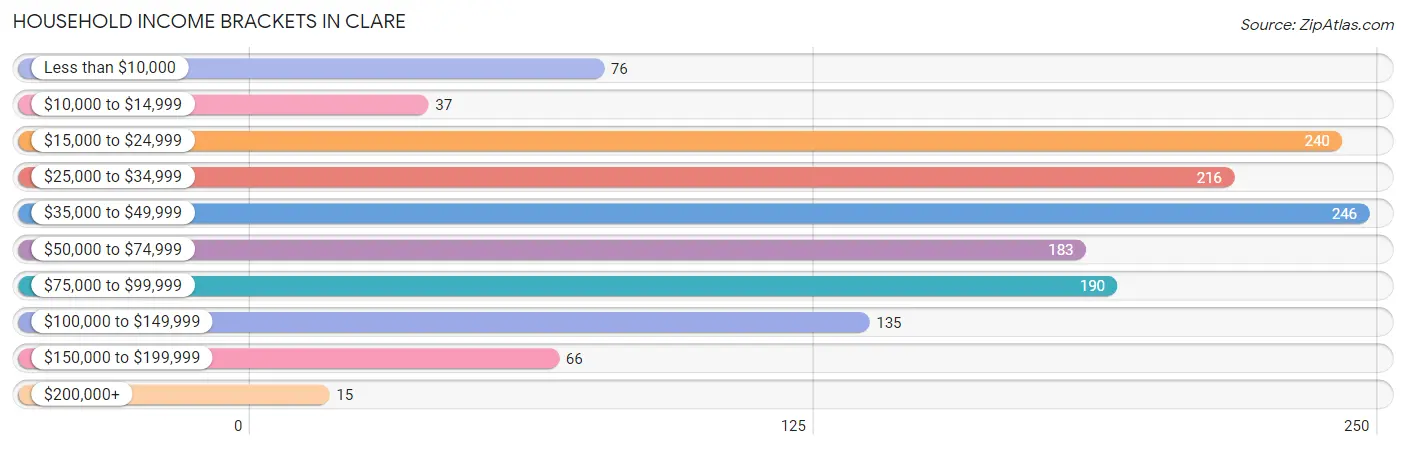
| Income Bracket | # Households | % Households |
| Less than $10,000 | 76 | 5.4% |
| $10,000 to $14,999 | 37 | 2.6% |
| $15,000 to $24,999 | 240 | 17.1% |
| $25,000 to $34,999 | 216 | 15.4% |
| $35,000 to $49,999 | 246 | 17.5% |
| $50,000 to $74,999 | 183 | 13.0% |
| $75,000 to $99,999 | 190 | 13.5% |
| $100,000 to $149,999 | 135 | 9.6% |
| $150,000 to $199,999 | 66 | 4.7% |
| $200,000+ | 15 | 1.1% |
Household Income by Householder Age in Clare
The median household income in Clare is $41,384, with the highest median household income of $52,621 found in the 45 to 64 years age bracket for the primary householder. A total of 505 households (35.9%) fall into this category. Meanwhile, the 15 to 24 years age bracket for the primary householder has the lowest median household income of $0, with 30 households (2.1%) in this group.
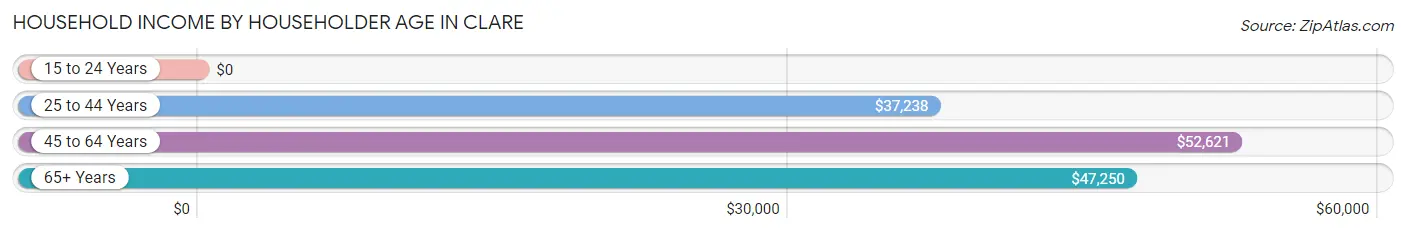
| Income Bracket | # Households | Median Income |
| 15 to 24 Years | 30 (2.1%) | $0 |
| 25 to 44 Years | 335 (23.8%) | $37,238 |
| 45 to 64 Years | 505 (35.9%) | $52,621 |
| 65+ Years | 535 (38.1%) | $47,250 |
| Total | 1,405 (100.0%) | $41,384 |
Poverty in Clare
Income Below Poverty by Sex and Age in Clare
With 15.2% poverty level for males and 23.3% for females among the residents of Clare, 55 to 64 year old males and 5 year old females are the most vulnerable to poverty, with 65 males (47.4%) and 56 females (73.7%) in their respective age groups living below the poverty level.
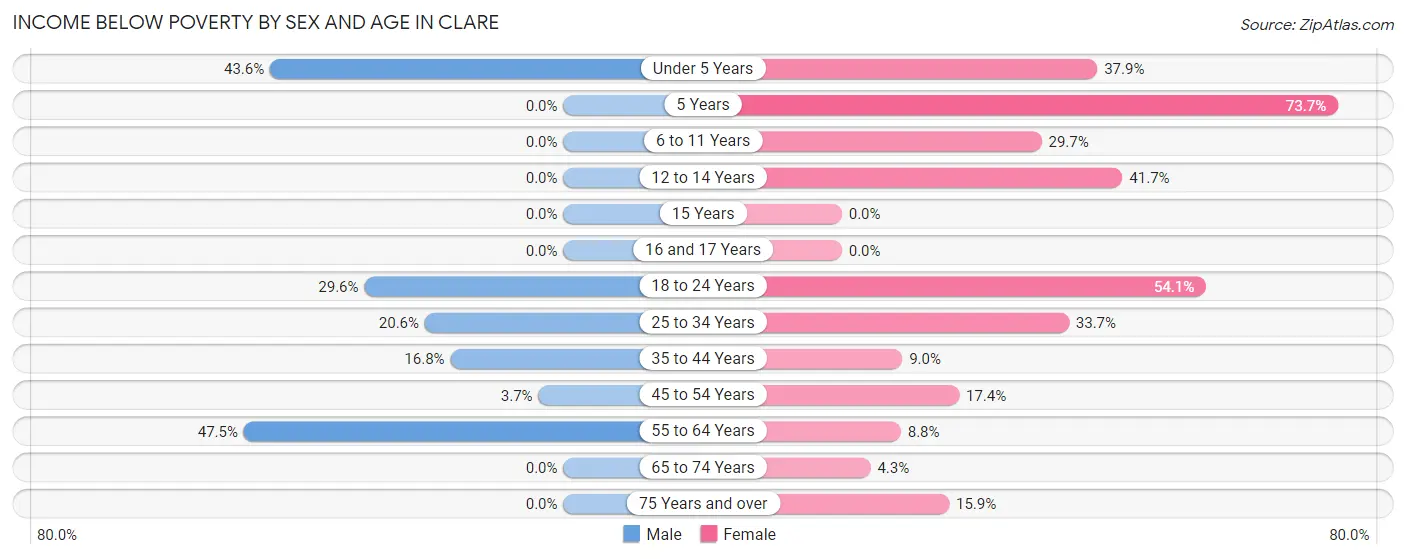
| Age Bracket | Male | Female |
| Under 5 Years | 27 (43.5%) | 33 (37.9%) |
| 5 Years | 0 (0.0%) | 56 (73.7%) |
| 6 to 11 Years | 0 (0.0%) | 78 (29.7%) |
| 12 to 14 Years | 0 (0.0%) | 10 (41.7%) |
| 15 Years | 0 (0.0%) | 0 (0.0%) |
| 16 and 17 Years | 0 (0.0%) | 0 (0.0%) |
| 18 to 24 Years | 26 (29.5%) | 53 (54.1%) |
| 25 to 34 Years | 37 (20.6%) | 115 (33.7%) |
| 35 to 44 Years | 28 (16.8%) | 13 (9.0%) |
| 45 to 54 Years | 9 (3.7%) | 55 (17.4%) |
| 55 to 64 Years | 65 (47.4%) | 12 (8.8%) |
| 65 to 74 Years | 0 (0.0%) | 12 (4.3%) |
| 75 Years and over | 0 (0.0%) | 32 (15.9%) |
| Total | 192 (15.2%) | 469 (23.3%) |
Income Above Poverty by Sex and Age in Clare
According to the poverty statistics in Clare, males aged 6 to 11 years and females aged 15 years are the age groups that are most secure financially, with 100.0% of males and 100.0% of females in these age groups living above the poverty line.
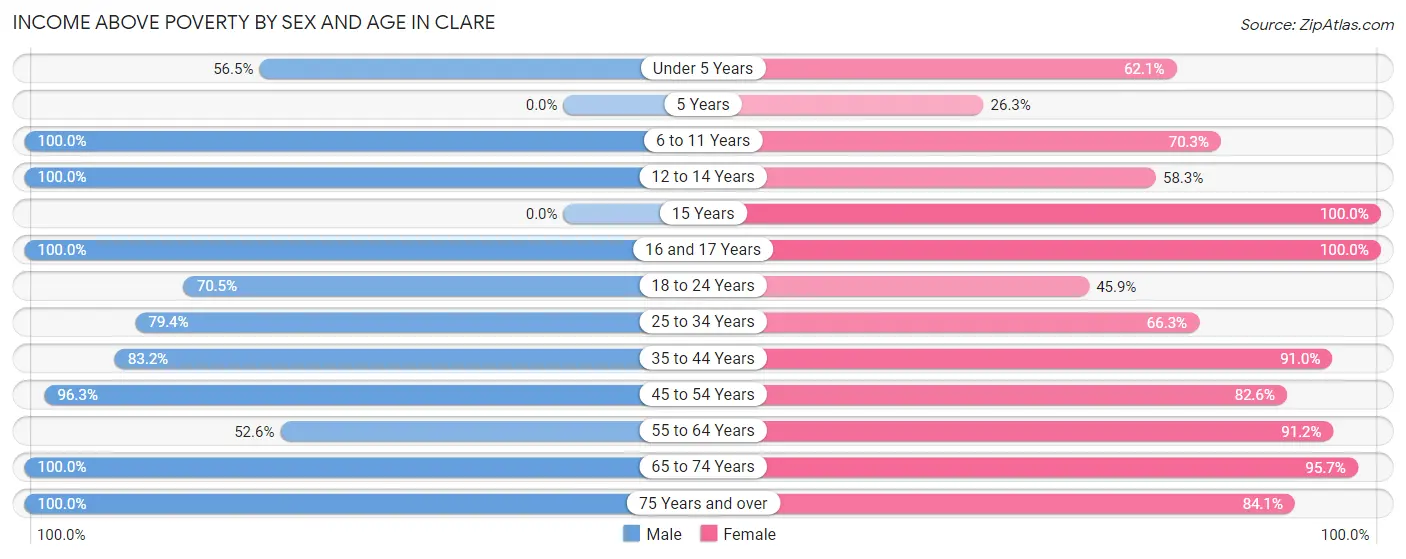
| Age Bracket | Male | Female |
| Under 5 Years | 35 (56.5%) | 54 (62.1%) |
| 5 Years | 0 (0.0%) | 20 (26.3%) |
| 6 to 11 Years | 89 (100.0%) | 185 (70.3%) |
| 12 to 14 Years | 55 (100.0%) | 14 (58.3%) |
| 15 Years | 0 (0.0%) | 22 (100.0%) |
| 16 and 17 Years | 42 (100.0%) | 22 (100.0%) |
| 18 to 24 Years | 62 (70.5%) | 45 (45.9%) |
| 25 to 34 Years | 143 (79.4%) | 226 (66.3%) |
| 35 to 44 Years | 139 (83.2%) | 132 (91.0%) |
| 45 to 54 Years | 234 (96.3%) | 261 (82.6%) |
| 55 to 64 Years | 72 (52.5%) | 125 (91.2%) |
| 65 to 74 Years | 102 (100.0%) | 270 (95.7%) |
| 75 Years and over | 98 (100.0%) | 169 (84.1%) |
| Total | 1,071 (84.8%) | 1,545 (76.7%) |
Income Below Poverty Among Married-Couple Families in Clare
The poverty statistics for married-couple families in Clare show that 11.4% or 51 of the total 447 families live below the poverty line. Families with 3 or 4 children have the highest poverty rate of 17.5%, comprising of 10 families. On the other hand, families with 1 or 2 children have the lowest poverty rate of 0.0%, which includes 0 families.
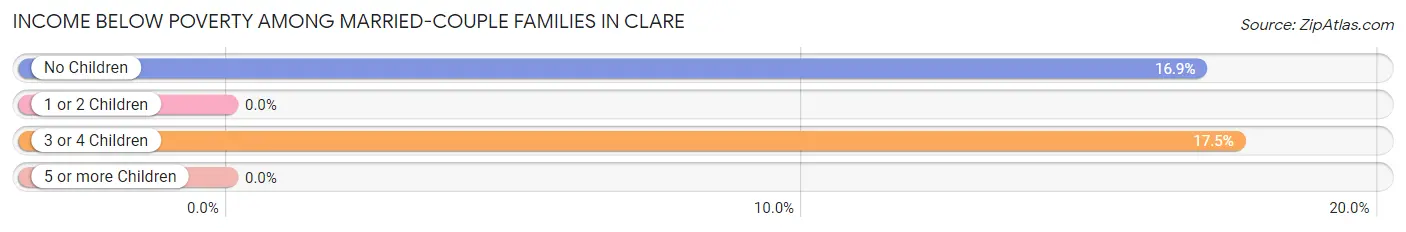
| Children | Above Poverty | Below Poverty |
| No Children | 202 (83.1%) | 41 (16.9%) |
| 1 or 2 Children | 147 (100.0%) | 0 (0.0%) |
| 3 or 4 Children | 47 (82.5%) | 10 (17.5%) |
| 5 or more Children | 0 (0.0%) | 0 (0.0%) |
| Total | 396 (88.6%) | 51 (11.4%) |
Income Below Poverty Among Single-Parent Households in Clare
According to the poverty data in Clare, 33.3% or 11 single-father households and 54.5% or 115 single-mother households are living below the poverty line. Among single-father households, those with no children have the highest poverty rate, with 11 households (100.0%) experiencing poverty. Likewise, among single-mother households, those with 1 or 2 children have the highest poverty rate, with 115 households (79.9%) falling below the poverty line.
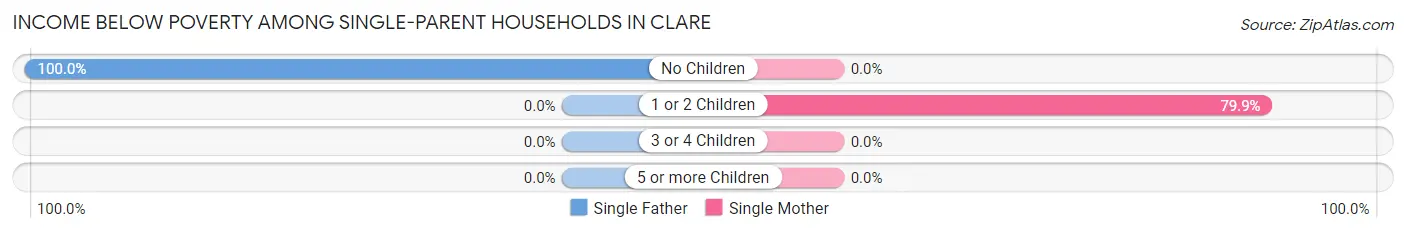
| Children | Single Father | Single Mother |
| No Children | 11 (100.0%) | 0 (0.0%) |
| 1 or 2 Children | 0 (0.0%) | 115 (79.9%) |
| 3 or 4 Children | 0 (0.0%) | 0 (0.0%) |
| 5 or more Children | 0 (0.0%) | 0 (0.0%) |
| Total | 11 (33.3%) | 115 (54.5%) |
Income Below Poverty Among Married-Couple vs Single-Parent Households in Clare
The poverty data for Clare shows that 51 of the married-couple family households (11.4%) and 126 of the single-parent households (51.6%) are living below the poverty level. Within the married-couple family households, those with 3 or 4 children have the highest poverty rate, with 10 households (17.5%) falling below the poverty line. Among the single-parent households, those with 1 or 2 children have the highest poverty rate, with 115 household (69.3%) living below poverty.
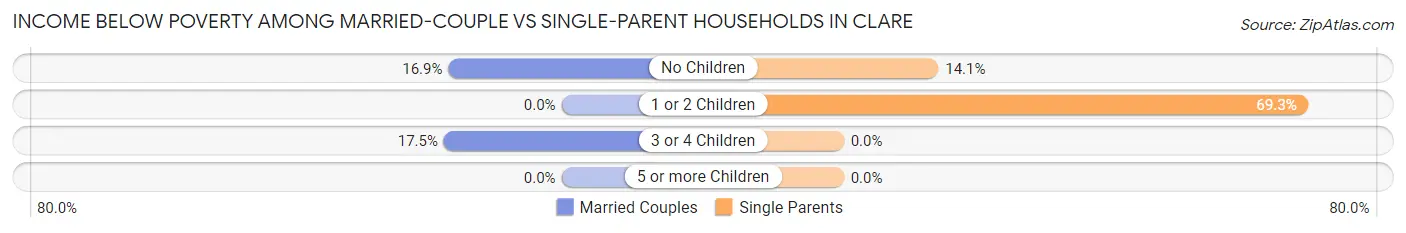
| Children | Married-Couple Families | Single-Parent Households |
| No Children | 41 (16.9%) | 11 (14.1%) |
| 1 or 2 Children | 0 (0.0%) | 115 (69.3%) |
| 3 or 4 Children | 10 (17.5%) | 0 (0.0%) |
| 5 or more Children | 0 (0.0%) | 0 (0.0%) |
| Total | 51 (11.4%) | 126 (51.6%) |
Race in Clare
The most populous races in Clare are White / Caucasian (2,928 | 87.0%), Two or more Races (386 | 11.5%), and Hispanic or Latino (194 | 5.8%).
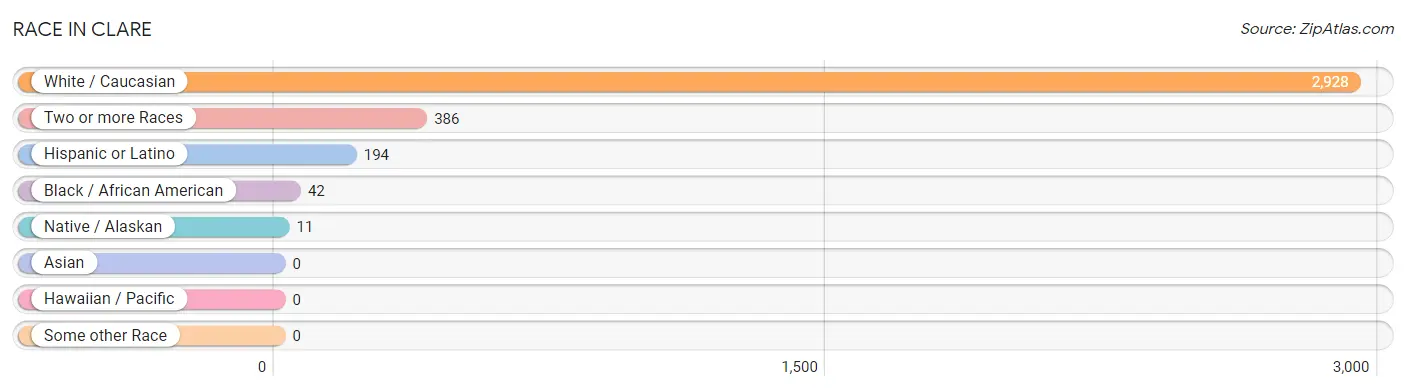
| Race | # Population | % Population |
| Asian | 0 | 0.0% |
| Black / African American | 42 | 1.3% |
| Hawaiian / Pacific | 0 | 0.0% |
| Hispanic or Latino | 194 | 5.8% |
| Native / Alaskan | 11 | 0.3% |
| White / Caucasian | 2,928 | 87.0% |
| Two or more Races | 386 | 11.5% |
| Some other Race | 0 | 0.0% |
| Total | 3,367 | 100.0% |
Ancestry in Clare
The most populous ancestries reported in Clare are English (1,038 | 30.8%), German (949 | 28.2%), Irish (557 | 16.5%), Mexican (194 | 5.8%), and American (118 | 3.5%), together accounting for 84.8% of all Clare residents.
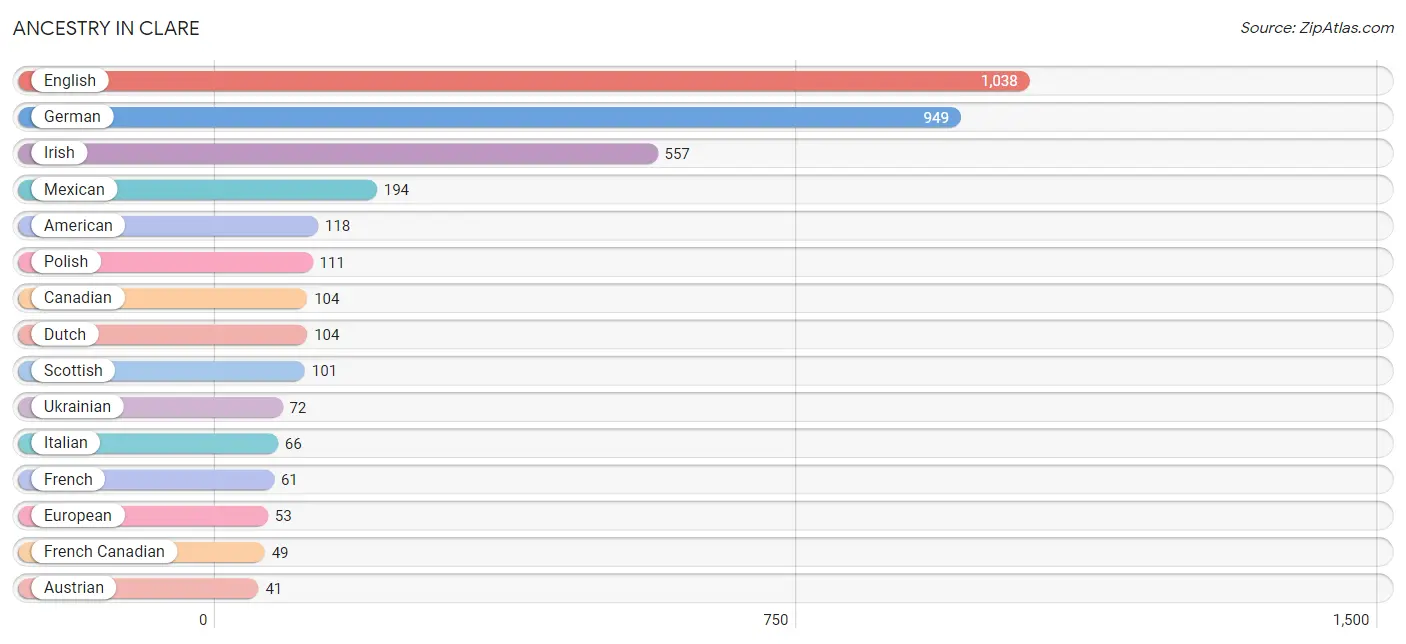
| Ancestry | # Population | % Population |
| African | 15 | 0.4% |
| American | 118 | 3.5% |
| Austrian | 41 | 1.2% |
| British | 9 | 0.3% |
| Canadian | 104 | 3.1% |
| Cherokee | 3 | 0.1% |
| Chippewa | 13 | 0.4% |
| Czech | 24 | 0.7% |
| Dutch | 104 | 3.1% |
| English | 1,038 | 30.8% |
| European | 53 | 1.6% |
| French | 61 | 1.8% |
| French Canadian | 49 | 1.5% |
| German | 949 | 28.2% |
| Hungarian | 22 | 0.6% |
| Irish | 557 | 16.5% |
| Italian | 66 | 2.0% |
| Mexican | 194 | 5.8% |
| Nigerian | 22 | 0.6% |
| Norwegian | 10 | 0.3% |
| Polish | 111 | 3.3% |
| Scandinavian | 12 | 0.4% |
| Scottish | 101 | 3.0% |
| Slavic | 4 | 0.1% |
| Subsaharan African | 37 | 1.1% |
| Swedish | 16 | 0.5% |
| Ukrainian | 72 | 2.1% |
| Welsh | 9 | 0.3% | View All 28 Rows |
Immigrants in Clare
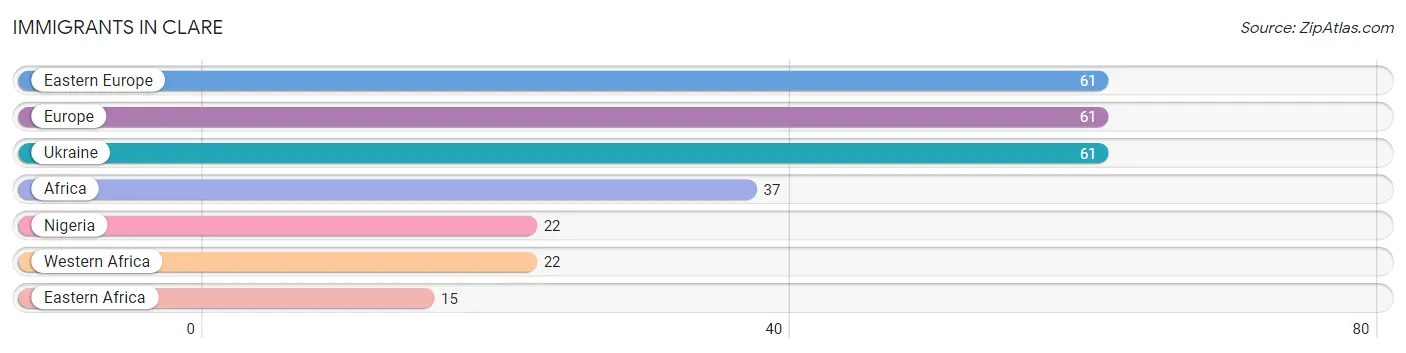
The most numerous immigrant groups reported in Clare came from Eastern Europe (61 | 1.8%), Europe (61 | 1.8%), Ukraine (61 | 1.8%), Africa (37 | 1.1%), and Nigeria (22 | 0.6%), together accounting for 7.2% of all Clare residents.
| Immigration Origin | # Population | % Population |
| Africa | 37 | 1.1% |
| Eastern Africa | 15 | 0.4% |
| Eastern Europe | 61 | 1.8% |
| Europe | 61 | 1.8% |
| Nigeria | 22 | 0.6% |
| Ukraine | 61 | 1.8% |
| Western Africa | 22 | 0.6% | View All 7 Rows |
Sex and Age in Clare
Sex and Age in Clare
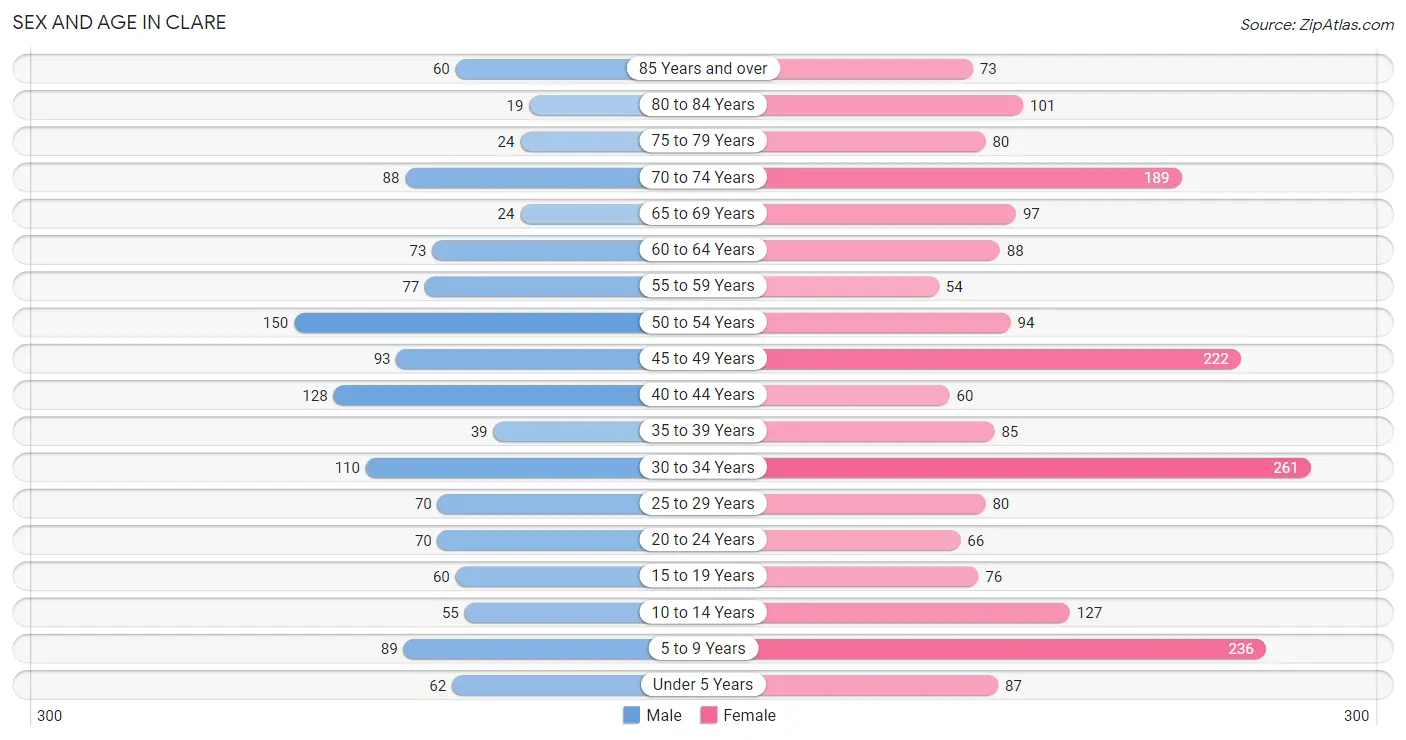
The most populous age groups in Clare are 50 to 54 Years (150 | 11.6%) for men and 30 to 34 Years (261 | 12.6%) for women.
| Age Bracket | Male | Female |
| Under 5 Years | 62 (4.8%) | 87 (4.2%) |
| 5 to 9 Years | 89 (6.9%) | 236 (11.4%) |
| 10 to 14 Years | 55 (4.3%) | 127 (6.1%) |
| 15 to 19 Years | 60 (4.6%) | 76 (3.7%) |
| 20 to 24 Years | 70 (5.4%) | 66 (3.2%) |
| 25 to 29 Years | 70 (5.4%) | 80 (3.8%) |
| 30 to 34 Years | 110 (8.5%) | 261 (12.6%) |
| 35 to 39 Years | 39 (3.0%) | 85 (4.1%) |
| 40 to 44 Years | 128 (9.9%) | 60 (2.9%) |
| 45 to 49 Years | 93 (7.2%) | 222 (10.7%) |
| 50 to 54 Years | 150 (11.6%) | 94 (4.5%) |
| 55 to 59 Years | 77 (6.0%) | 54 (2.6%) |
| 60 to 64 Years | 73 (5.7%) | 88 (4.2%) |
| 65 to 69 Years | 24 (1.9%) | 97 (4.7%) |
| 70 to 74 Years | 88 (6.8%) | 189 (9.1%) |
| 75 to 79 Years | 24 (1.9%) | 80 (3.8%) |
| 80 to 84 Years | 19 (1.5%) | 101 (4.9%) |
| 85 Years and over | 60 (4.6%) | 73 (3.5%) |
| Total | 1,291 (100.0%) | 2,076 (100.0%) |
Families and Households in Clare
Median Family Size in Clare
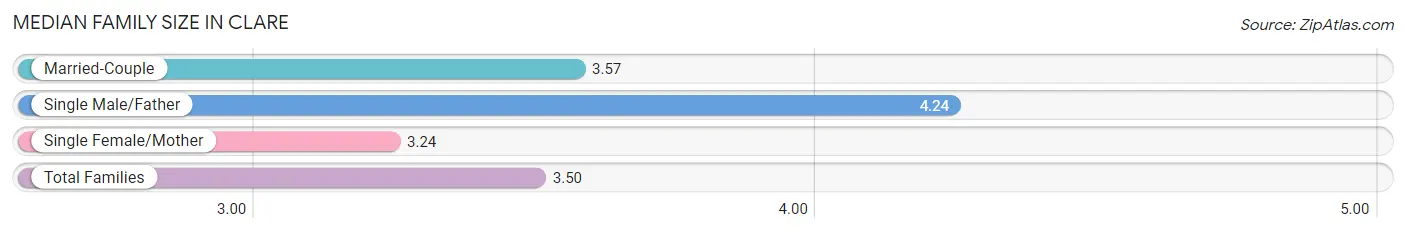
The median family size in Clare is 3.50 persons per family, with single male/father families (33 | 4.8%) accounting for the largest median family size of 4.24 persons per family. On the other hand, single female/mother families (211 | 30.5%) represent the smallest median family size with 3.24 persons per family.
| Family Type | # Families | Family Size |
| Married-Couple | 447 (64.7%) | 3.57 |
| Single Male/Father | 33 (4.8%) | 4.24 |
| Single Female/Mother | 211 (30.5%) | 3.24 |
| Total Families | 691 (100.0%) | 3.50 |
Median Household Size in Clare
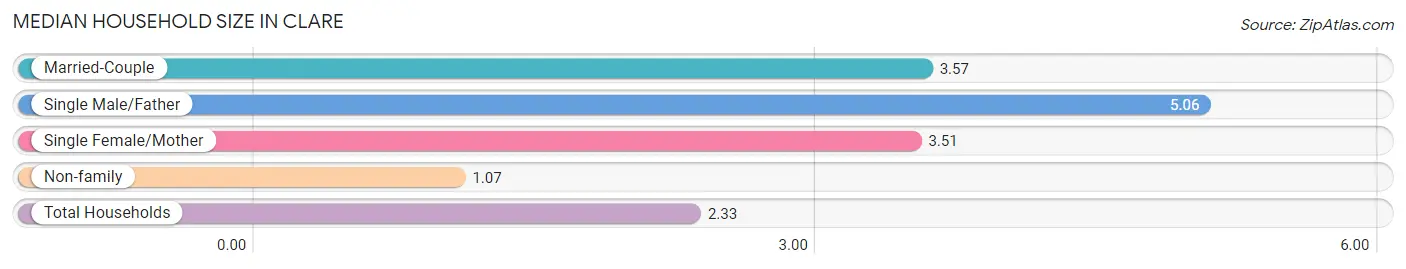
The median household size in Clare is 2.33 persons per household, with single male/father households (33 | 2.4%) accounting for the largest median household size of 5.06 persons per household. non-family households (714 | 50.8%) represent the smallest median household size with 1.07 persons per household.
| Household Type | # Households | Household Size |
| Married-Couple | 447 (31.8%) | 3.57 |
| Single Male/Father | 33 (2.4%) | 5.06 |
| Single Female/Mother | 211 (15.0%) | 3.51 |
| Non-family | 714 (50.8%) | 1.07 |
| Total Households | 1,405 (100.0%) | 2.33 |
Household Size by Marriage Status in Clare
Out of a total of 1,405 households in Clare, 691 (49.2%) are family households, while 714 (50.8%) are nonfamily households. The most numerous type of family households are 2-person households, comprising 276, and the most common type of nonfamily households are 1-person households, comprising 656.
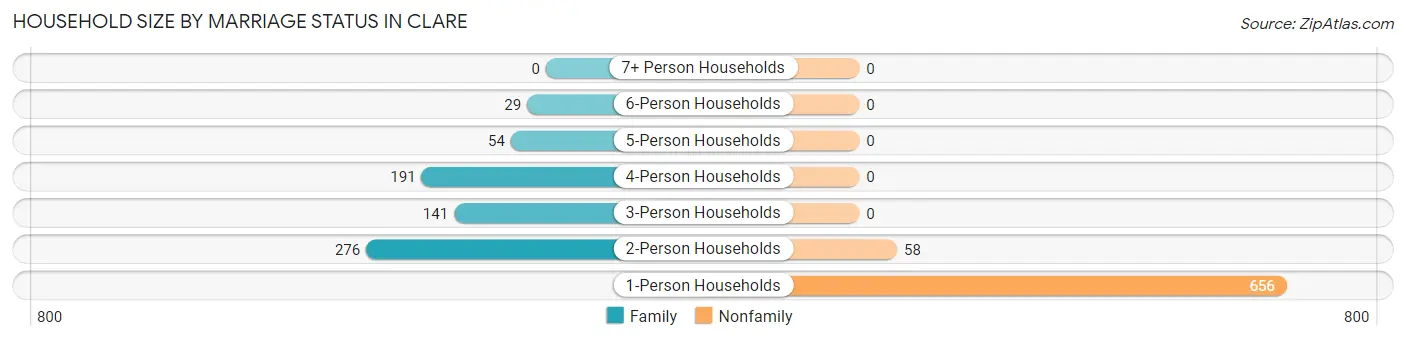
| Household Size | Family Households | Nonfamily Households |
| 1-Person Households | - | 656 (46.7%) |
| 2-Person Households | 276 (19.6%) | 58 (4.1%) |
| 3-Person Households | 141 (10.0%) | 0 (0.0%) |
| 4-Person Households | 191 (13.6%) | 0 (0.0%) |
| 5-Person Households | 54 (3.8%) | 0 (0.0%) |
| 6-Person Households | 29 (2.1%) | 0 (0.0%) |
| 7+ Person Households | 0 (0.0%) | 0 (0.0%) |
| Total | 691 (49.2%) | 714 (50.8%) |
Female Fertility in Clare
Fertility by Age in Clare
Average fertility rate in Clare is 67.0 births per 1,000 women. Women in the age bracket of 20 to 34 years have the highest fertility rate with 118.0 births per 1,000 women. Women in the age bracket of 20 to 34 years acount for 84.2% of all women with births.
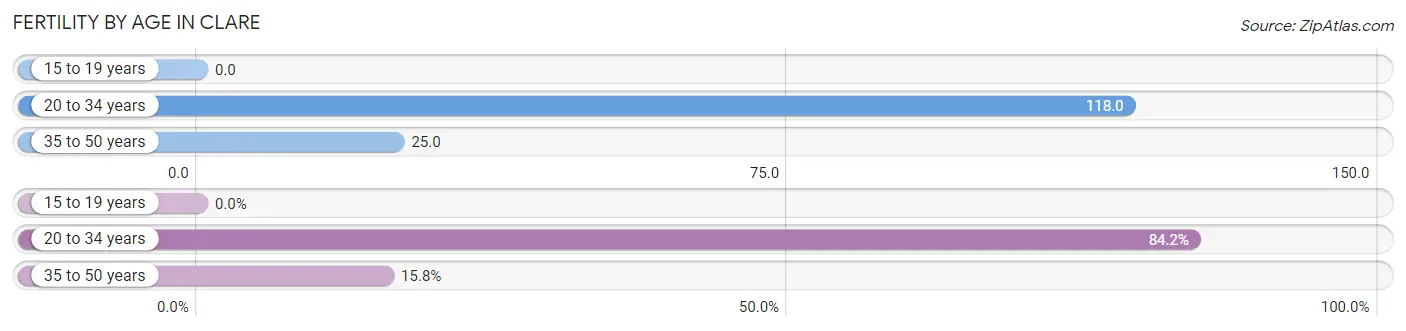
| Age Bracket | Women with Births | Births / 1,000 Women |
| 15 to 19 years | 0 (0.0%) | 0.0 |
| 20 to 34 years | 48 (84.2%) | 118.0 |
| 35 to 50 years | 9 (15.8%) | 25.0 |
| Total | 57 (100.0%) | 67.0 |
Fertility by Age by Marriage Status in Clare
35.1% of women with births (57) in Clare are married. The highest percentage of unmarried women with births falls into 20 to 34 years age bracket with 77.1% of them unmarried at the time of birth, while the lowest percentage of unmarried women with births belong to 35 to 50 years age bracket with 0.0% of them unmarried.
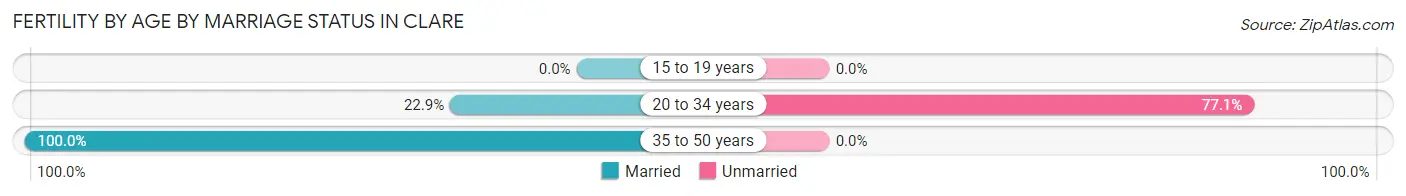
| Age Bracket | Married | Unmarried |
| 15 to 19 years | 0 (0.0%) | 0 (0.0%) |
| 20 to 34 years | 11 (22.9%) | 37 (77.1%) |
| 35 to 50 years | 9 (100.0%) | 0 (0.0%) |
| Total | 20 (35.1%) | 37 (64.9%) |
Fertility by Education in Clare
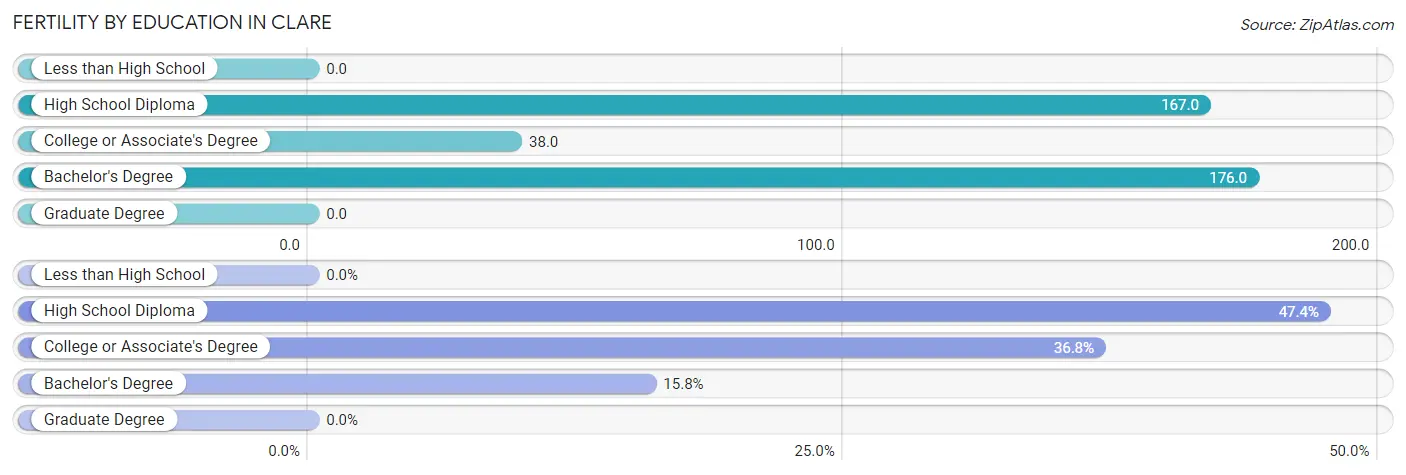
| Educational Attainment | Women with Births | Births / 1,000 Women |
| Less than High School | 0 (0.0%) | 0.0 |
| High School Diploma | 27 (47.4%) | 167.0 |
| College or Associate's Degree | 21 (36.8%) | 38.0 |
| Bachelor's Degree | 9 (15.8%) | 176.0 |
| Graduate Degree | 0 (0.0%) | 0.0 |
| Total | 57 (100.0%) | 67.0 |
Fertility by Education by Marriage Status in Clare
64.9% of women with births in Clare are unmarried. Women with the educational attainment of bachelor's degree are most likely to be married with 100.0% of them married at childbirth, while women with the educational attainment of high school diploma are least likely to be married with 100.0% of them unmarried at childbirth.
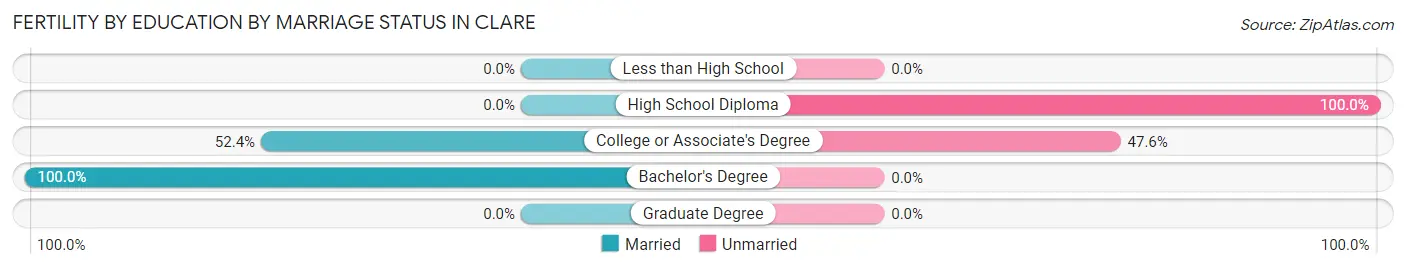
| Educational Attainment | Married | Unmarried |
| Less than High School | 0 (0.0%) | 0 (0.0%) |
| High School Diploma | 0 (0.0%) | 27 (100.0%) |
| College or Associate's Degree | 11 (52.4%) | 10 (47.6%) |
| Bachelor's Degree | 9 (100.0%) | 0 (0.0%) |
| Graduate Degree | 0 (0.0%) | 0 (0.0%) |
| Total | 20 (35.1%) | 37 (64.9%) |
Employment Characteristics in Clare
Employment by Class of Employer in Clare
Among the 1,265 employed individuals in Clare, private company employees (809 | 63.9%), not-for-profit organizations (178 | 14.1%), and local government employees (107 | 8.5%) make up the most common classes of employment.
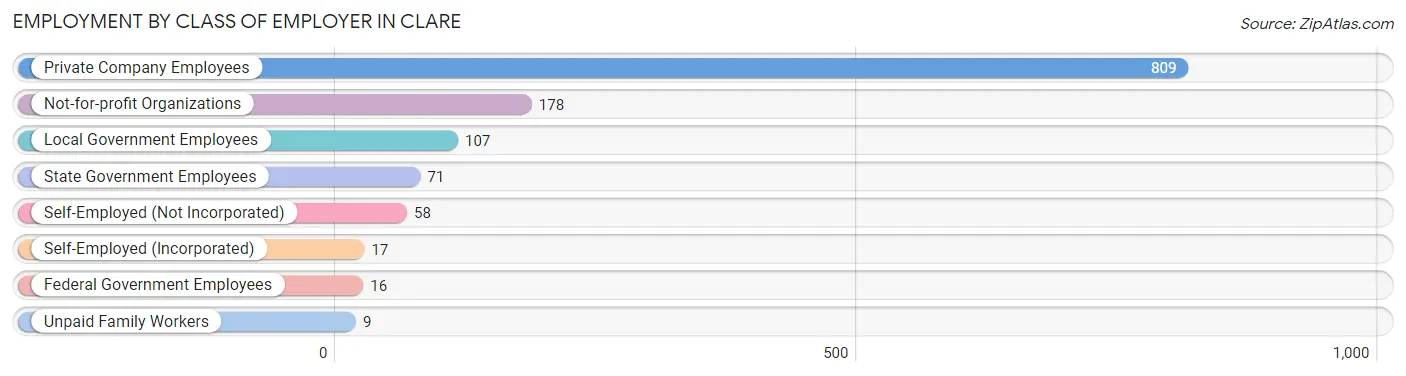
| Employer Class | # Employees | % Employees |
| Private Company Employees | 809 | 63.9% |
| Self-Employed (Incorporated) | 17 | 1.3% |
| Self-Employed (Not Incorporated) | 58 | 4.6% |
| Not-for-profit Organizations | 178 | 14.1% |
| Local Government Employees | 107 | 8.5% |
| State Government Employees | 71 | 5.6% |
| Federal Government Employees | 16 | 1.3% |
| Unpaid Family Workers | 9 | 0.7% |
| Total | 1,265 | 100.0% |
Employment Status by Age in Clare
According to the labor force statistics for Clare, out of the total population over 16 years of age (2,689), 53.6% or 1,441 individuals are in the labor force, with 6.7% or 97 of them unemployed. The age group with the highest labor force participation rate is 30 to 34 years, with 83.0% or 308 individuals in the labor force. Within the labor force, the 60 to 64 years age range has the highest percentage of unemployed individuals, with 40.0% or 26 of them being unemployed.
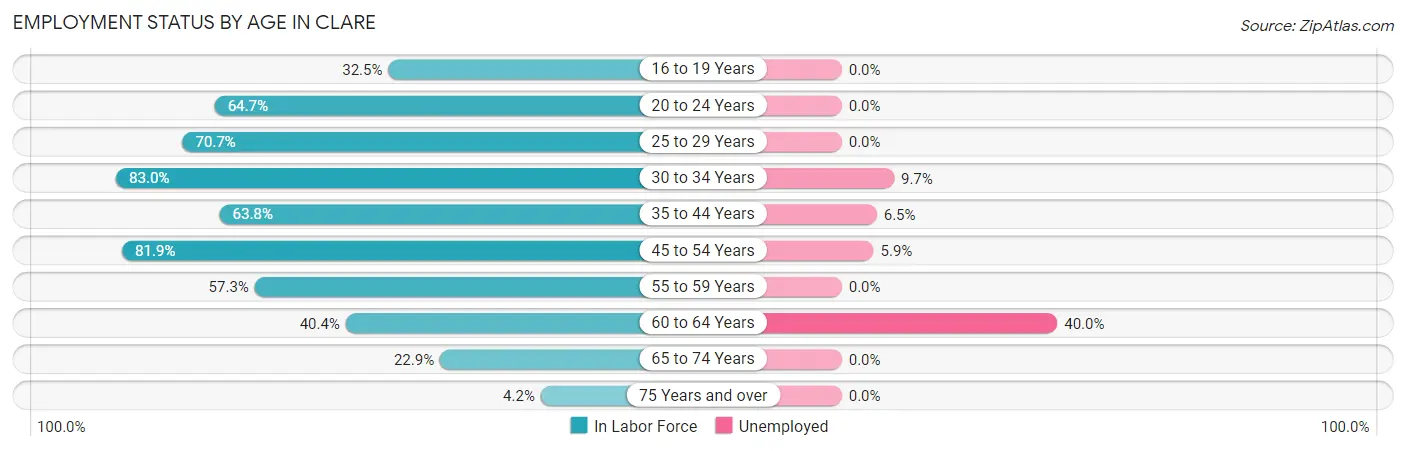
| Age Bracket | In Labor Force | Unemployed |
| 16 to 19 Years | 37 (32.5%) | 0 (0.0%) |
| 20 to 24 Years | 88 (64.7%) | 0 (0.0%) |
| 25 to 29 Years | 106 (70.7%) | 0 (0.0%) |
| 30 to 34 Years | 308 (83.0%) | 30 (9.7%) |
| 35 to 44 Years | 199 (63.8%) | 13 (6.5%) |
| 45 to 54 Years | 458 (81.9%) | 27 (5.9%) |
| 55 to 59 Years | 75 (57.3%) | 0 (0.0%) |
| 60 to 64 Years | 65 (40.4%) | 26 (40.0%) |
| 65 to 74 Years | 91 (22.9%) | 0 (0.0%) |
| 75 Years and over | 15 (4.2%) | 0 (0.0%) |
| Total | 1,441 (53.6%) | 97 (6.7%) |
Employment Status by Educational Attainment in Clare
According to labor force statistics for Clare, 71.9% of individuals (1,211) out of the total population between 25 and 64 years of age (1,684) are in the labor force, with 7.9% or 96 of them being unemployed. The group with the highest labor force participation rate are those with the educational attainment of bachelor's degree or higher, with 94.2% or 295 individuals in the labor force. Within the labor force, individuals with less than high school education have the highest percentage of unemployment, with 31.9% or 22 of them being unemployed.
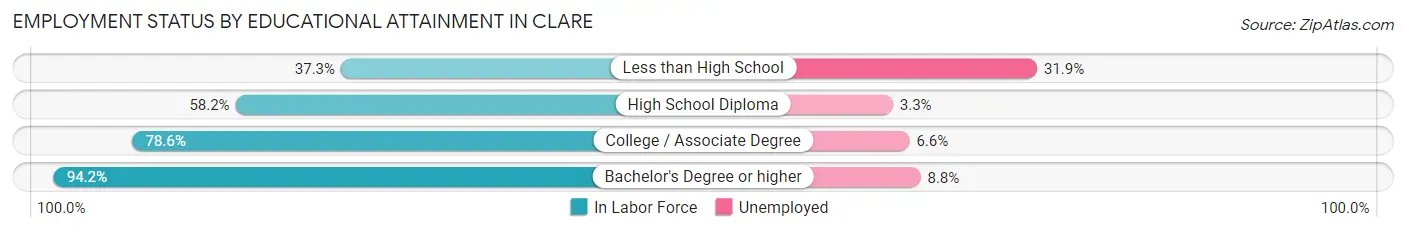
| Educational Attainment | In Labor Force | Unemployed |
| Less than High School | 69 (37.3%) | 59 (31.9%) |
| High School Diploma | 242 (58.2%) | 14 (3.3%) |
| College / Associate Degree | 605 (78.6%) | 51 (6.6%) |
| Bachelor's Degree or higher | 295 (94.2%) | 28 (8.8%) |
| Total | 1,211 (71.9%) | 133 (7.9%) |
Employment Occupations by Sex in Clare
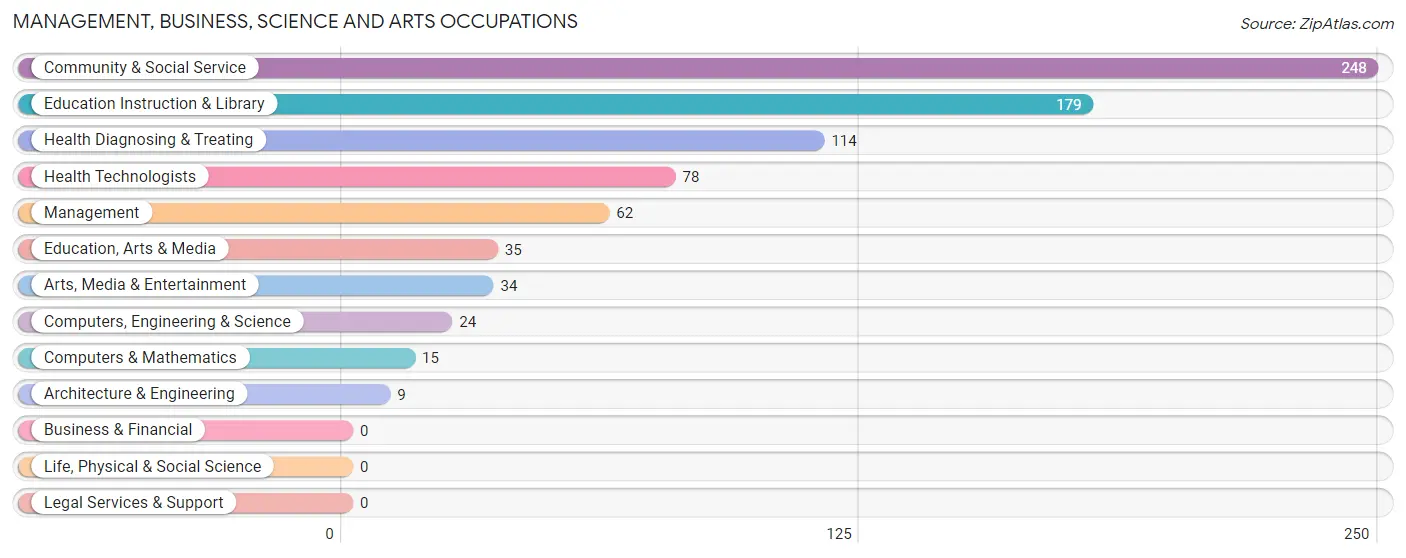
Management, Business, Science and Arts Occupations
The most common Management, Business, Science and Arts occupations in Clare are Community & Social Service (248 | 18.4%), Education Instruction & Library (179 | 13.3%), Health Diagnosing & Treating (114 | 8.5%), Health Technologists (78 | 5.8%), and Management (62 | 4.6%).
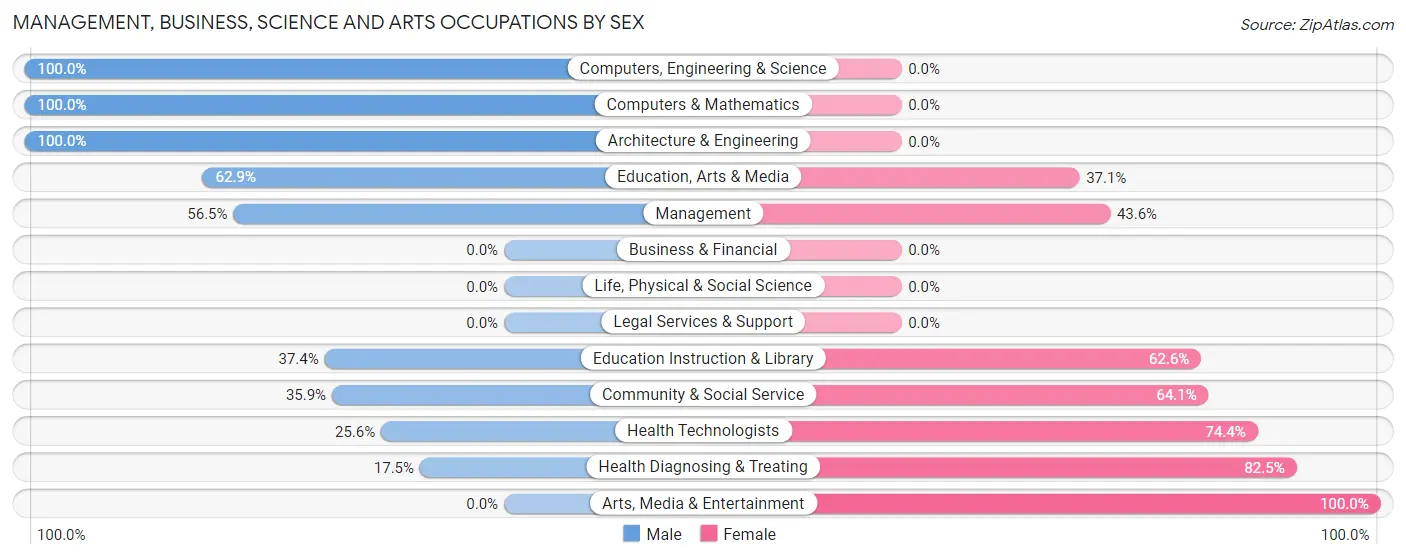
Management, Business, Science and Arts Occupations by Sex
Within the Management, Business, Science and Arts occupations in Clare, the most male-oriented occupations are Computers, Engineering & Science (100.0%), Computers & Mathematics (100.0%), and Architecture & Engineering (100.0%), while the most female-oriented occupations are Arts, Media & Entertainment (100.0%), Health Diagnosing & Treating (82.5%), and Health Technologists (74.4%).
| Occupation | Male | Female |
| Management | 35 (56.5%) | 27 (43.5%) |
| Business & Financial | 0 (0.0%) | 0 (0.0%) |
| Computers, Engineering & Science | 24 (100.0%) | 0 (0.0%) |
| Computers & Mathematics | 15 (100.0%) | 0 (0.0%) |
| Architecture & Engineering | 9 (100.0%) | 0 (0.0%) |
| Life, Physical & Social Science | 0 (0.0%) | 0 (0.0%) |
| Community & Social Service | 89 (35.9%) | 159 (64.1%) |
| Education, Arts & Media | 22 (62.9%) | 13 (37.1%) |
| Legal Services & Support | 0 (0.0%) | 0 (0.0%) |
| Education Instruction & Library | 67 (37.4%) | 112 (62.6%) |
| Arts, Media & Entertainment | 0 (0.0%) | 34 (100.0%) |
| Health Diagnosing & Treating | 20 (17.5%) | 94 (82.5%) |
| Health Technologists | 20 (25.6%) | 58 (74.4%) |
| Total (Category) | 168 (37.5%) | 280 (62.5%) |
| Total (Overall) | 569 (42.3%) | 777 (57.7%) |
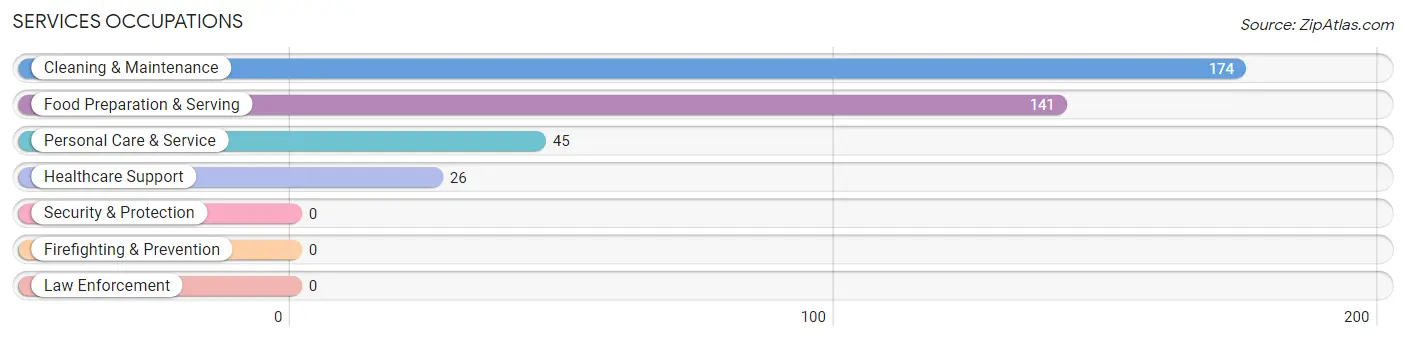
Services Occupations
The most common Services occupations in Clare are Cleaning & Maintenance (174 | 12.9%), Food Preparation & Serving (141 | 10.5%), Personal Care & Service (45 | 3.3%), and Healthcare Support (26 | 1.9%).
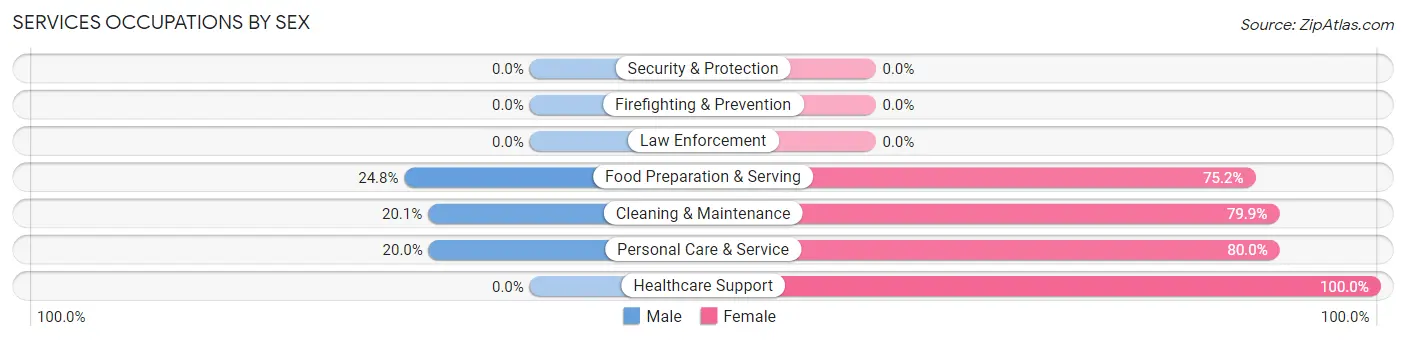
Services Occupations by Sex
Within the Services occupations in Clare, the most male-oriented occupations are Food Preparation & Serving (24.8%), Cleaning & Maintenance (20.1%), and Personal Care & Service (20.0%), while the most female-oriented occupations are Healthcare Support (100.0%), Personal Care & Service (80.0%), and Cleaning & Maintenance (79.9%).
| Occupation | Male | Female |
| Healthcare Support | 0 (0.0%) | 26 (100.0%) |
| Security & Protection | 0 (0.0%) | 0 (0.0%) |
| Firefighting & Prevention | 0 (0.0%) | 0 (0.0%) |
| Law Enforcement | 0 (0.0%) | 0 (0.0%) |
| Food Preparation & Serving | 35 (24.8%) | 106 (75.2%) |
| Cleaning & Maintenance | 35 (20.1%) | 139 (79.9%) |
| Personal Care & Service | 9 (20.0%) | 36 (80.0%) |
| Total (Category) | 79 (20.5%) | 307 (79.5%) |
| Total (Overall) | 569 (42.3%) | 777 (57.7%) |
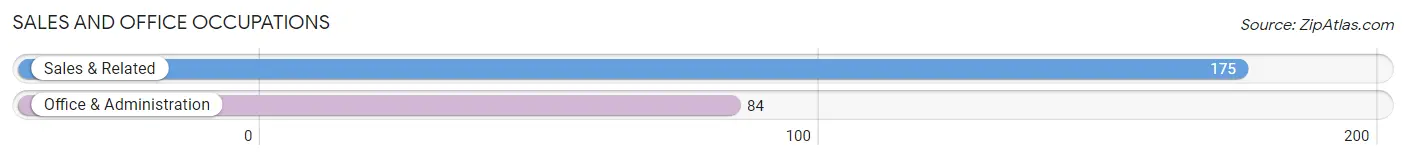
Sales and Office Occupations
The most common Sales and Office occupations in Clare are Sales & Related (175 | 13.0%), and Office & Administration (84 | 6.2%).
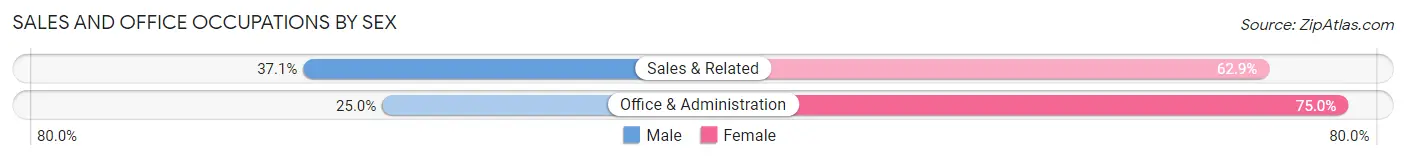
Sales and Office Occupations by Sex
| Occupation | Male | Female |
| Sales & Related | 65 (37.1%) | 110 (62.9%) |
| Office & Administration | 21 (25.0%) | 63 (75.0%) |
| Total (Category) | 86 (33.2%) | 173 (66.8%) |
| Total (Overall) | 569 (42.3%) | 777 (57.7%) |
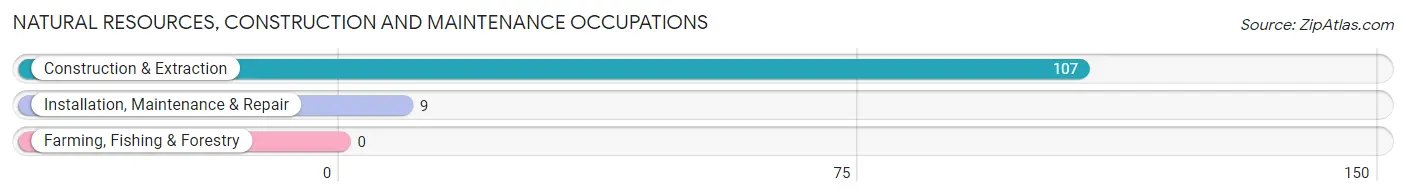
Natural Resources, Construction and Maintenance Occupations
The most common Natural Resources, Construction and Maintenance occupations in Clare are Construction & Extraction (107 | 8.0%), and Installation, Maintenance & Repair (9 | 0.7%).
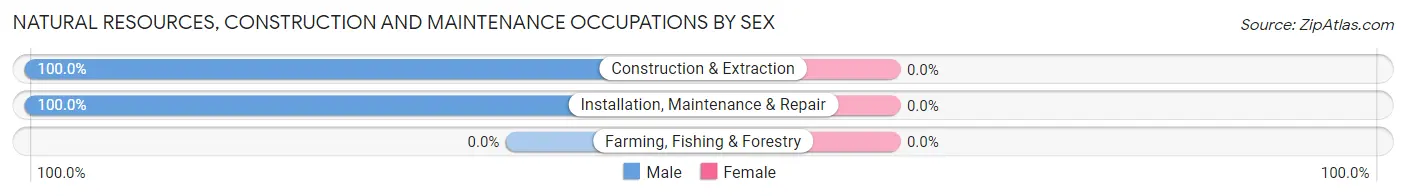
Natural Resources, Construction and Maintenance Occupations by Sex
| Occupation | Male | Female |
| Farming, Fishing & Forestry | 0 (0.0%) | 0 (0.0%) |
| Construction & Extraction | 107 (100.0%) | 0 (0.0%) |
| Installation, Maintenance & Repair | 9 (100.0%) | 0 (0.0%) |
| Total (Category) | 116 (100.0%) | 0 (0.0%) |
| Total (Overall) | 569 (42.3%) | 777 (57.7%) |
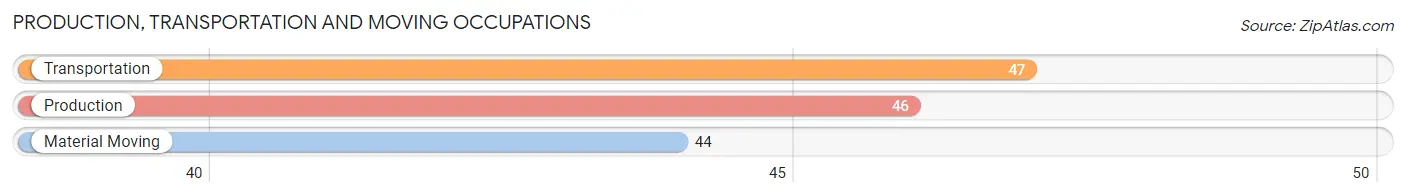
Production, Transportation and Moving Occupations
The most common Production, Transportation and Moving occupations in Clare are Transportation (47 | 3.5%), Production (46 | 3.4%), and Material Moving (44 | 3.3%).
Production, Transportation and Moving Occupations by Sex
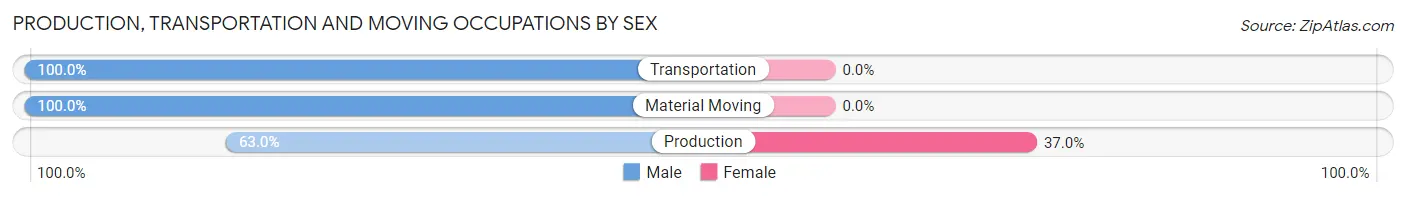
| Occupation | Male | Female |
| Production | 29 (63.0%) | 17 (37.0%) |
| Transportation | 47 (100.0%) | 0 (0.0%) |
| Material Moving | 44 (100.0%) | 0 (0.0%) |
| Total (Category) | 120 (87.6%) | 17 (12.4%) |
| Total (Overall) | 569 (42.3%) | 777 (57.7%) |
Employment Industries by Sex in Clare
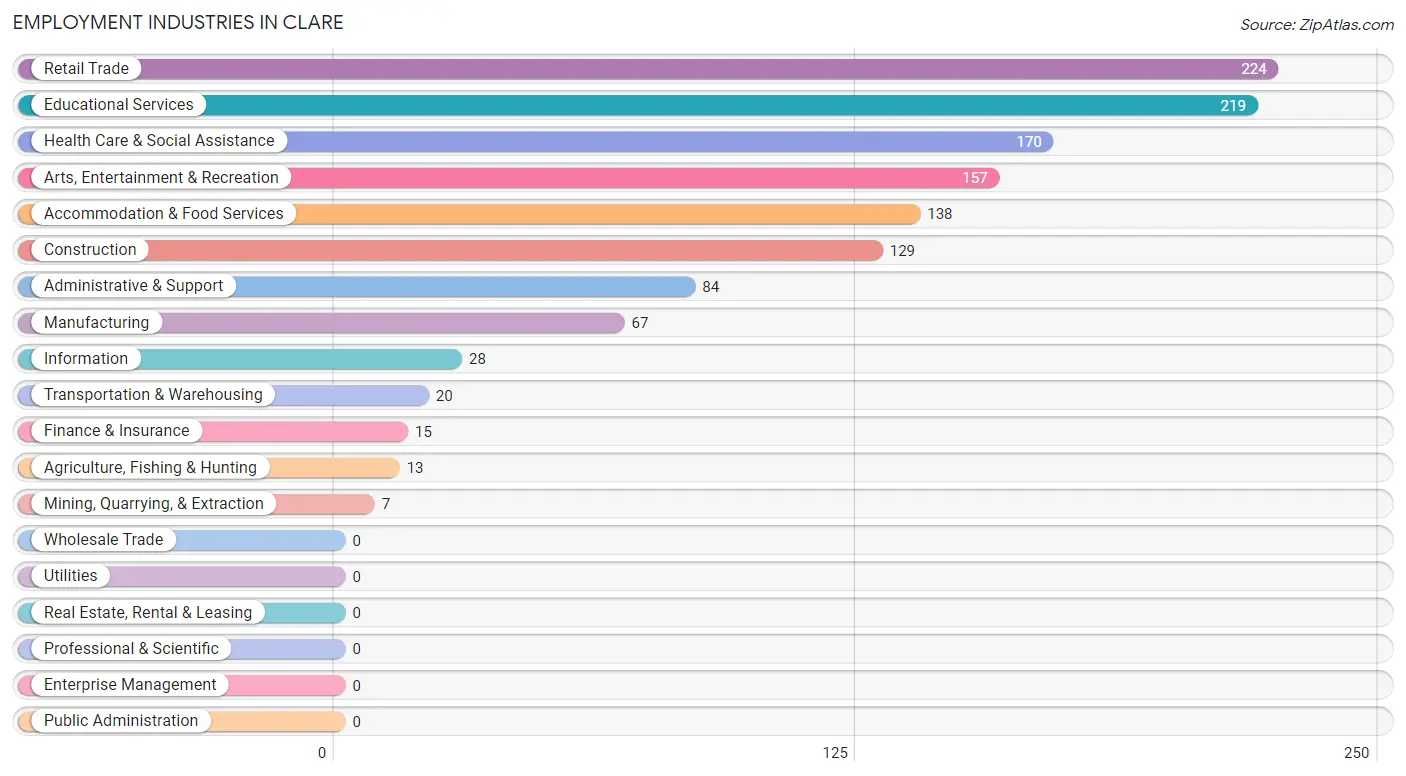
Employment Industries in Clare
The major employment industries in Clare include Retail Trade (224 | 16.6%), Educational Services (219 | 16.3%), Health Care & Social Assistance (170 | 12.6%), Arts, Entertainment & Recreation (157 | 11.7%), and Accommodation & Food Services (138 | 10.2%).
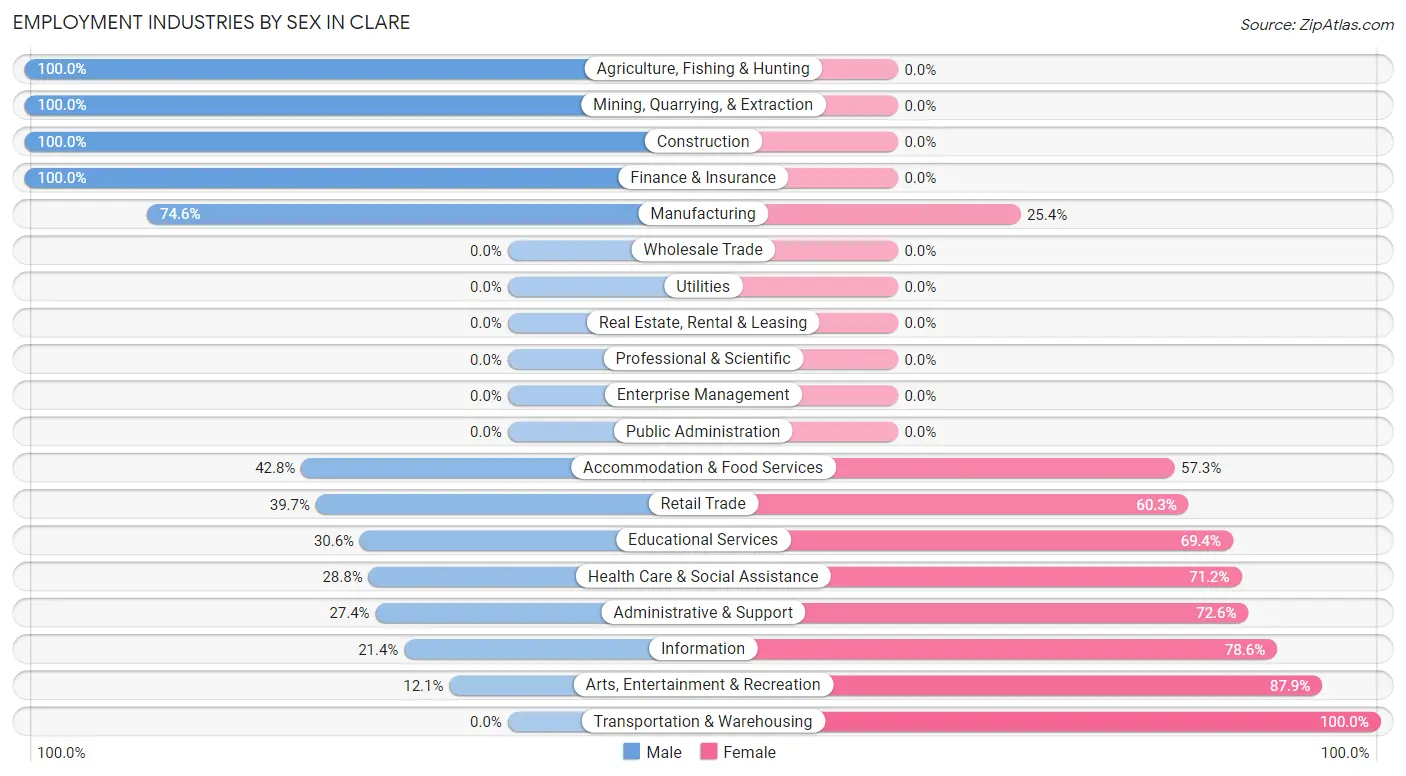
Employment Industries by Sex in Clare
The Clare industries that see more men than women are Agriculture, Fishing & Hunting (100.0%), Mining, Quarrying, & Extraction (100.0%), and Construction (100.0%), whereas the industries that tend to have a higher number of women are Transportation & Warehousing (100.0%), Arts, Entertainment & Recreation (87.9%), and Information (78.6%).
| Industry | Male | Female |
| Agriculture, Fishing & Hunting | 13 (100.0%) | 0 (0.0%) |
| Mining, Quarrying, & Extraction | 7 (100.0%) | 0 (0.0%) |
| Construction | 129 (100.0%) | 0 (0.0%) |
| Manufacturing | 50 (74.6%) | 17 (25.4%) |
| Wholesale Trade | 0 (0.0%) | 0 (0.0%) |
| Retail Trade | 89 (39.7%) | 135 (60.3%) |
| Transportation & Warehousing | 0 (0.0%) | 20 (100.0%) |
| Utilities | 0 (0.0%) | 0 (0.0%) |
| Information | 6 (21.4%) | 22 (78.6%) |
| Finance & Insurance | 15 (100.0%) | 0 (0.0%) |
| Real Estate, Rental & Leasing | 0 (0.0%) | 0 (0.0%) |
| Professional & Scientific | 0 (0.0%) | 0 (0.0%) |
| Enterprise Management | 0 (0.0%) | 0 (0.0%) |
| Administrative & Support | 23 (27.4%) | 61 (72.6%) |
| Educational Services | 67 (30.6%) | 152 (69.4%) |
| Health Care & Social Assistance | 49 (28.8%) | 121 (71.2%) |
| Arts, Entertainment & Recreation | 19 (12.1%) | 138 (87.9%) |
| Accommodation & Food Services | 59 (42.7%) | 79 (57.3%) |
| Public Administration | 0 (0.0%) | 0 (0.0%) |
| Total | 569 (42.3%) | 777 (57.7%) |
Education in Clare
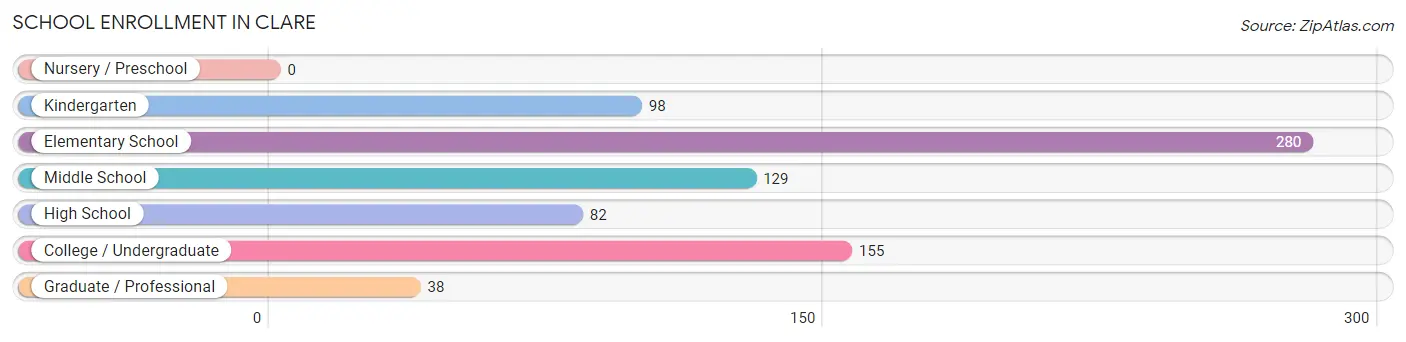
School Enrollment in Clare
The most common levels of schooling among the 782 students in Clare are elementary school (280 | 35.8%), college / undergraduate (155 | 19.8%), and middle school (129 | 16.5%).
| School Level | # Students | % Students |
| Nursery / Preschool | 0 | 0.0% |
| Kindergarten | 98 | 12.5% |
| Elementary School | 280 | 35.8% |
| Middle School | 129 | 16.5% |
| High School | 82 | 10.5% |
| College / Undergraduate | 155 | 19.8% |
| Graduate / Professional | 38 | 4.9% |
| Total | 782 | 100.0% |
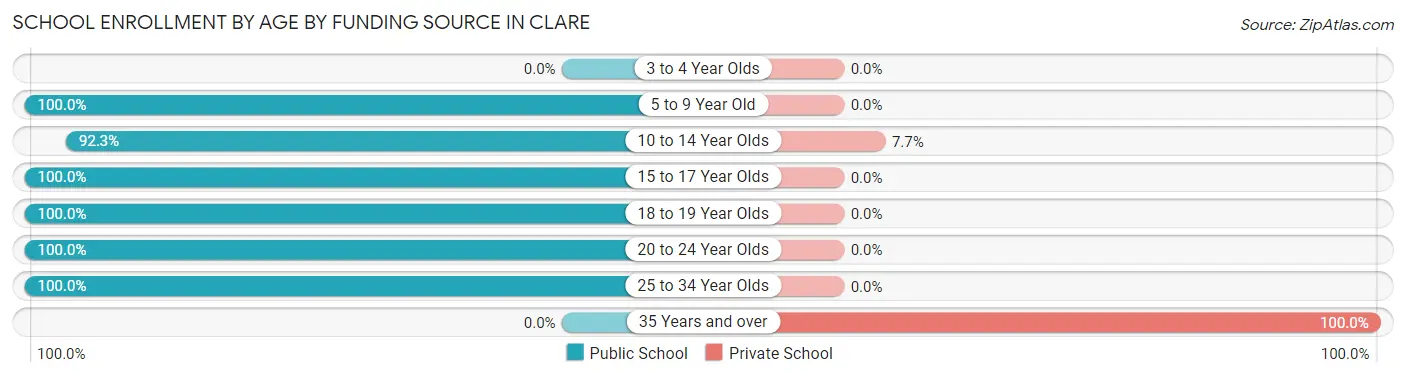
School Enrollment by Age by Funding Source in Clare
Out of a total of 782 students who are enrolled in schools in Clare, 29 (3.7%) attend a private institution, while the remaining 753 (96.3%) are enrolled in public schools. The age group of 35 years and over has the highest likelihood of being enrolled in private schools, with 15 (100.0% in the age bracket) enrolled. Conversely, the age group of 5 to 9 year old has the lowest likelihood of being enrolled in a private school, with 325 (100.0% in the age bracket) attending a public institution.
| Age Bracket | Public School | Private School |
| 3 to 4 Year Olds | 0 (0.0%) | 0 (0.0%) |
| 5 to 9 Year Old | 325 (100.0%) | 0 (0.0%) |
| 10 to 14 Year Olds | 168 (92.3%) | 14 (7.7%) |
| 15 to 17 Year Olds | 86 (100.0%) | 0 (0.0%) |
| 18 to 19 Year Olds | 50 (100.0%) | 0 (0.0%) |
| 20 to 24 Year Olds | 13 (100.0%) | 0 (0.0%) |
| 25 to 34 Year Olds | 111 (100.0%) | 0 (0.0%) |
| 35 Years and over | 0 (0.0%) | 15 (100.0%) |
| Total | 753 (96.3%) | 29 (3.7%) |
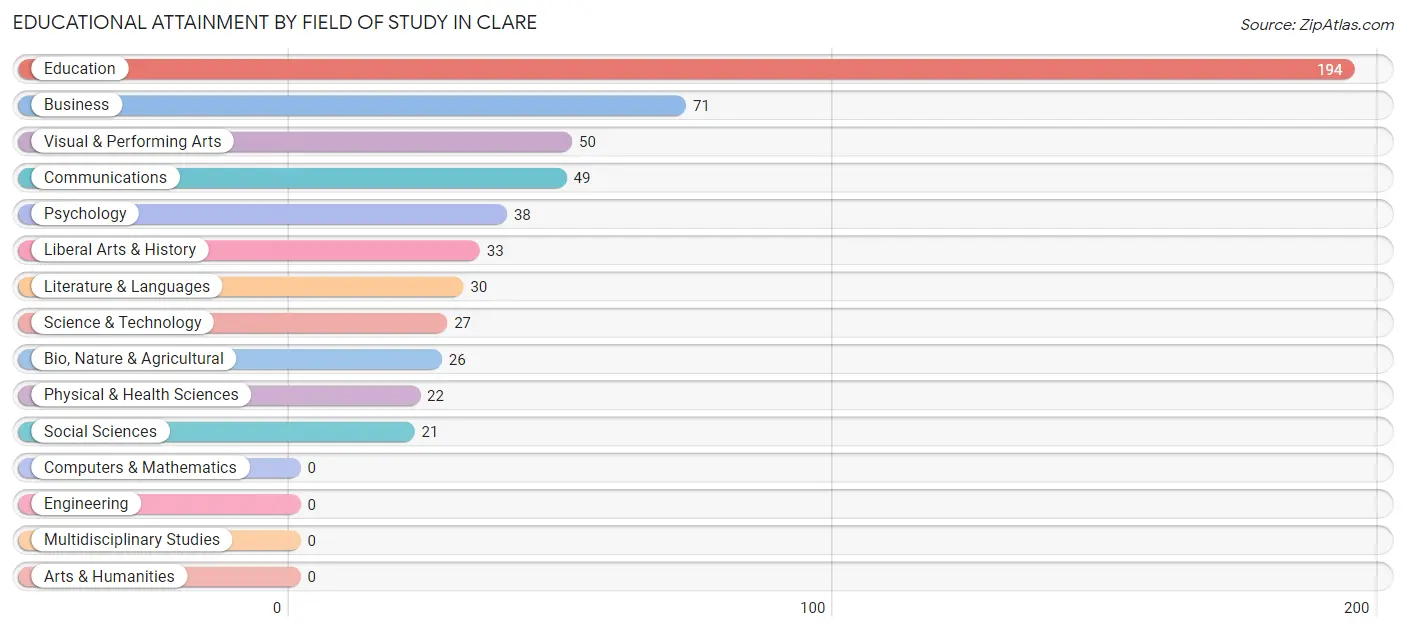
Educational Attainment by Field of Study in Clare
Education (194 | 34.6%), business (71 | 12.7%), visual & performing arts (50 | 8.9%), communications (49 | 8.7%), and psychology (38 | 6.8%) are the most common fields of study among 561 individuals in Clare who have obtained a bachelor's degree or higher.
| Field of Study | # Graduates | % Graduates |
| Computers & Mathematics | 0 | 0.0% |
| Bio, Nature & Agricultural | 26 | 4.6% |
| Physical & Health Sciences | 22 | 3.9% |
| Psychology | 38 | 6.8% |
| Social Sciences | 21 | 3.7% |
| Engineering | 0 | 0.0% |
| Multidisciplinary Studies | 0 | 0.0% |
| Science & Technology | 27 | 4.8% |
| Business | 71 | 12.7% |
| Education | 194 | 34.6% |
| Literature & Languages | 30 | 5.3% |
| Liberal Arts & History | 33 | 5.9% |
| Visual & Performing Arts | 50 | 8.9% |
| Communications | 49 | 8.7% |
| Arts & Humanities | 0 | 0.0% |
| Total | 561 | 100.0% |
Transportation & Commute in Clare
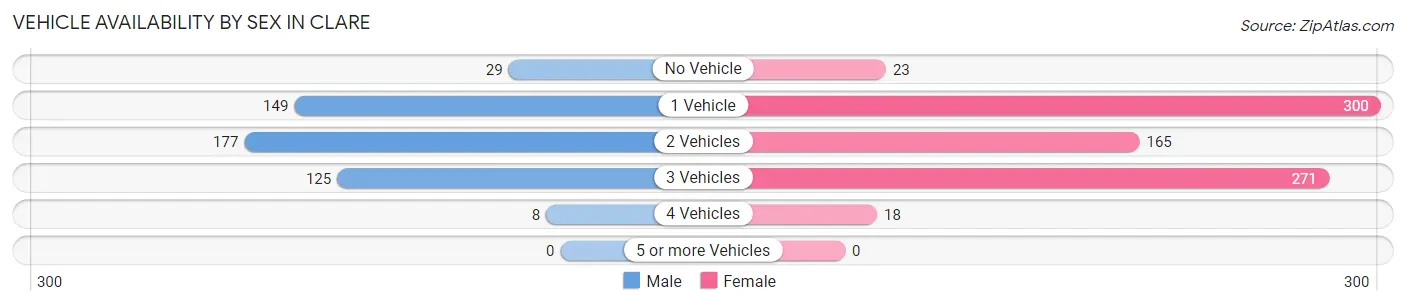
Vehicle Availability by Sex in Clare
The most prevalent vehicle ownership categories in Clare are males with 2 vehicles (177, accounting for 36.3%) and females with 2 vehicles (165, making up 22.8%).
| Vehicles Available | Male | Female |
| No Vehicle | 29 (5.9%) | 23 (3.0%) |
| 1 Vehicle | 149 (30.5%) | 300 (38.6%) |
| 2 Vehicles | 177 (36.3%) | 165 (21.2%) |
| 3 Vehicles | 125 (25.6%) | 271 (34.9%) |
| 4 Vehicles | 8 (1.6%) | 18 (2.3%) |
| 5 or more Vehicles | 0 (0.0%) | 0 (0.0%) |
| Total | 488 (100.0%) | 777 (100.0%) |
Commute Time in Clare
The most frequently occuring commute durations in Clare are 5 to 9 minutes (244 commuters, 20.9%), 20 to 24 minutes (183 commuters, 15.7%), and 15 to 19 minutes (163 commuters, 14.0%).
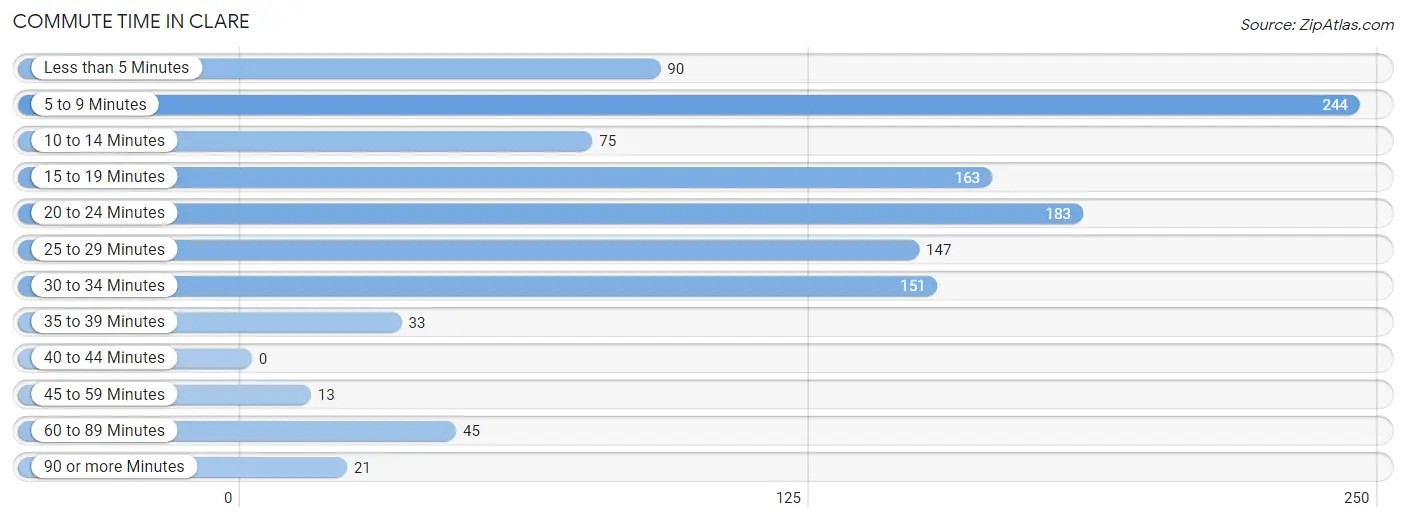
| Commute Time | # Commuters | % Commuters |
| Less than 5 Minutes | 90 | 7.7% |
| 5 to 9 Minutes | 244 | 20.9% |
| 10 to 14 Minutes | 75 | 6.4% |
| 15 to 19 Minutes | 163 | 14.0% |
| 20 to 24 Minutes | 183 | 15.7% |
| 25 to 29 Minutes | 147 | 12.6% |
| 30 to 34 Minutes | 151 | 13.0% |
| 35 to 39 Minutes | 33 | 2.8% |
| 40 to 44 Minutes | 0 | 0.0% |
| 45 to 59 Minutes | 13 | 1.1% |
| 60 to 89 Minutes | 45 | 3.9% |
| 90 or more Minutes | 21 | 1.8% |
Commute Time by Sex in Clare
The most common commute times in Clare are 5 to 9 minutes (136 commuters, 28.8%) for males and 15 to 19 minutes (131 commuters, 18.9%) for females.
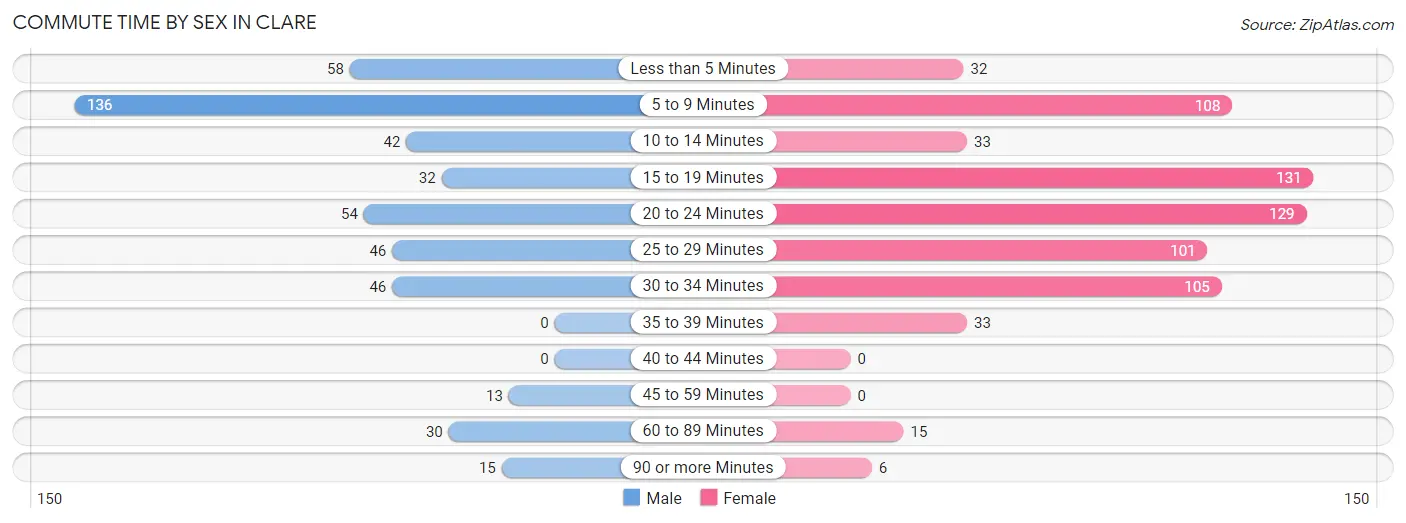
| Commute Time | Male | Female |
| Less than 5 Minutes | 58 (12.3%) | 32 (4.6%) |
| 5 to 9 Minutes | 136 (28.8%) | 108 (15.6%) |
| 10 to 14 Minutes | 42 (8.9%) | 33 (4.8%) |
| 15 to 19 Minutes | 32 (6.8%) | 131 (18.9%) |
| 20 to 24 Minutes | 54 (11.4%) | 129 (18.6%) |
| 25 to 29 Minutes | 46 (9.8%) | 101 (14.6%) |
| 30 to 34 Minutes | 46 (9.8%) | 105 (15.1%) |
| 35 to 39 Minutes | 0 (0.0%) | 33 (4.8%) |
| 40 to 44 Minutes | 0 (0.0%) | 0 (0.0%) |
| 45 to 59 Minutes | 13 (2.8%) | 0 (0.0%) |
| 60 to 89 Minutes | 30 (6.4%) | 15 (2.2%) |
| 90 or more Minutes | 15 (3.2%) | 6 (0.9%) |
Time of Departure to Work by Sex in Clare
The most frequent times of departure to work in Clare are 7:30 AM to 7:59 AM (68, 14.4%) for males and 9:00 AM to 9:59 AM (228, 32.9%) for females.
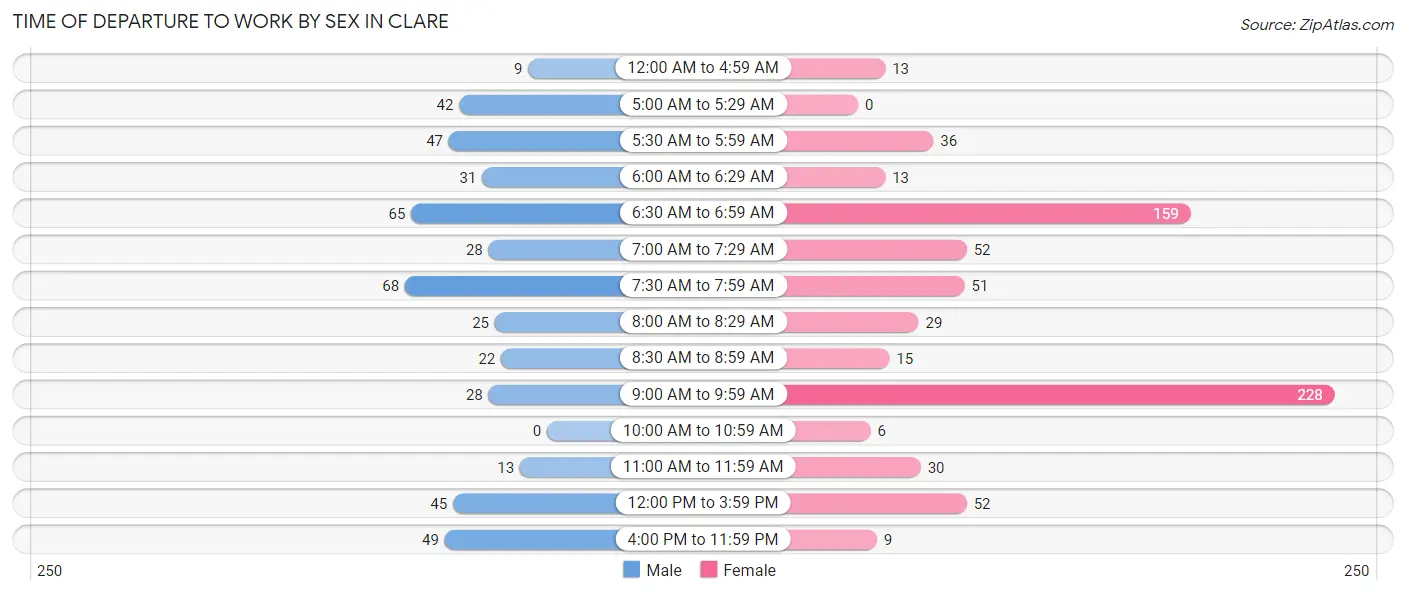
| Time of Departure | Male | Female |
| 12:00 AM to 4:59 AM | 9 (1.9%) | 13 (1.9%) |
| 5:00 AM to 5:29 AM | 42 (8.9%) | 0 (0.0%) |
| 5:30 AM to 5:59 AM | 47 (10.0%) | 36 (5.2%) |
| 6:00 AM to 6:29 AM | 31 (6.6%) | 13 (1.9%) |
| 6:30 AM to 6:59 AM | 65 (13.8%) | 159 (22.9%) |
| 7:00 AM to 7:29 AM | 28 (5.9%) | 52 (7.5%) |
| 7:30 AM to 7:59 AM | 68 (14.4%) | 51 (7.4%) |
| 8:00 AM to 8:29 AM | 25 (5.3%) | 29 (4.2%) |
| 8:30 AM to 8:59 AM | 22 (4.7%) | 15 (2.2%) |
| 9:00 AM to 9:59 AM | 28 (5.9%) | 228 (32.9%) |
| 10:00 AM to 10:59 AM | 0 (0.0%) | 6 (0.9%) |
| 11:00 AM to 11:59 AM | 13 (2.8%) | 30 (4.3%) |
| 12:00 PM to 3:59 PM | 45 (9.5%) | 52 (7.5%) |
| 4:00 PM to 11:59 PM | 49 (10.4%) | 9 (1.3%) |
| Total | 472 (100.0%) | 693 (100.0%) |
Housing Occupancy in Clare
Occupancy by Ownership in Clare
Of the total 1,405 dwellings in Clare, owner-occupied units account for 841 (59.9%), while renter-occupied units make up 564 (40.1%).
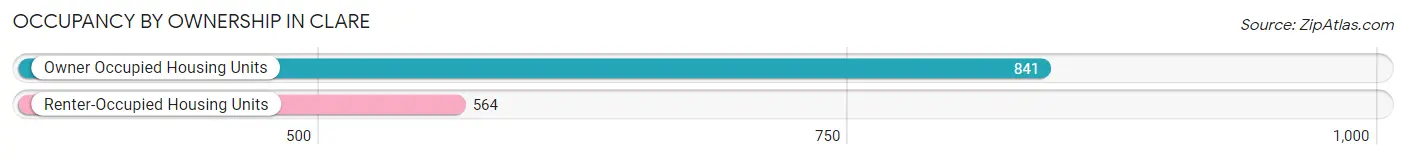
| Occupancy | # Housing Units | % Housing Units |
| Owner Occupied Housing Units | 841 | 59.9% |
| Renter-Occupied Housing Units | 564 | 40.1% |
| Total Occupied Housing Units | 1,405 | 100.0% |
Occupancy by Household Size in Clare
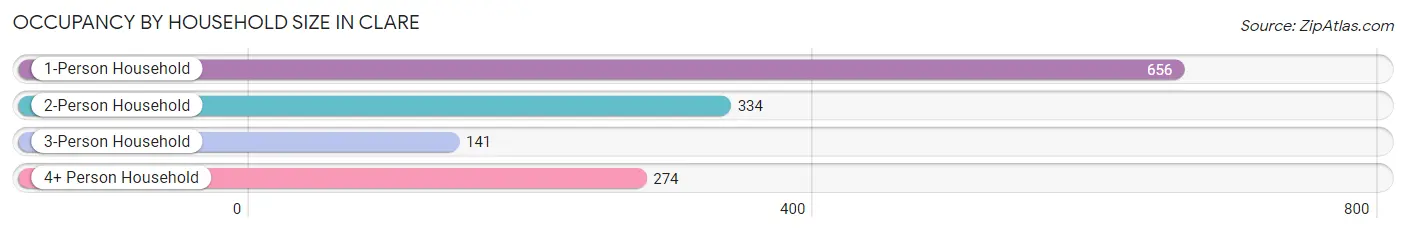
| Household Size | # Housing Units | % Housing Units |
| 1-Person Household | 656 | 46.7% |
| 2-Person Household | 334 | 23.8% |
| 3-Person Household | 141 | 10.0% |
| 4+ Person Household | 274 | 19.5% |
| Total Housing Units | 1,405 | 100.0% |
Occupancy by Ownership by Household Size in Clare
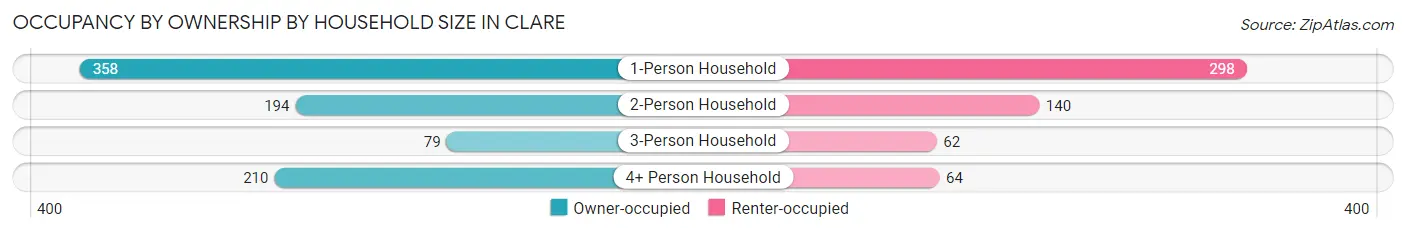
| Household Size | Owner-occupied | Renter-occupied |
| 1-Person Household | 358 (54.6%) | 298 (45.4%) |
| 2-Person Household | 194 (58.1%) | 140 (41.9%) |
| 3-Person Household | 79 (56.0%) | 62 (44.0%) |
| 4+ Person Household | 210 (76.6%) | 64 (23.4%) |
| Total Housing Units | 841 (59.9%) | 564 (40.1%) |
Occupancy by Educational Attainment in Clare
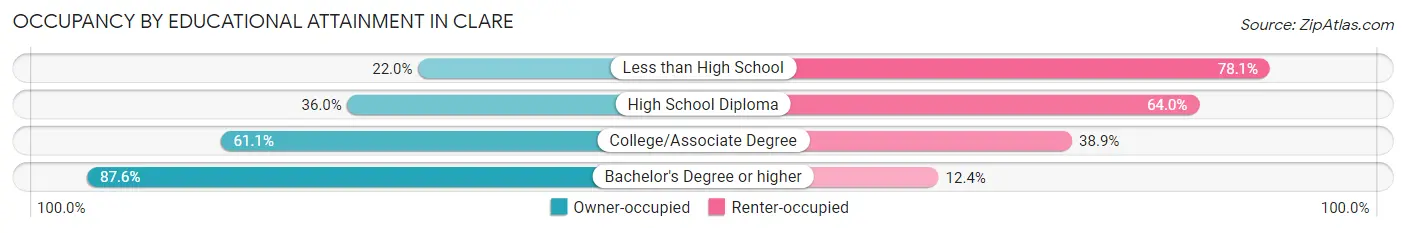
| Household Size | Owner-occupied | Renter-occupied |
| Less than High School | 18 (22.0%) | 64 (78.0%) |
| High School Diploma | 114 (36.0%) | 203 (64.0%) |
| College/Associate Degree | 398 (61.1%) | 253 (38.9%) |
| Bachelor's Degree or higher | 311 (87.6%) | 44 (12.4%) |
Occupancy by Age of Householder in Clare
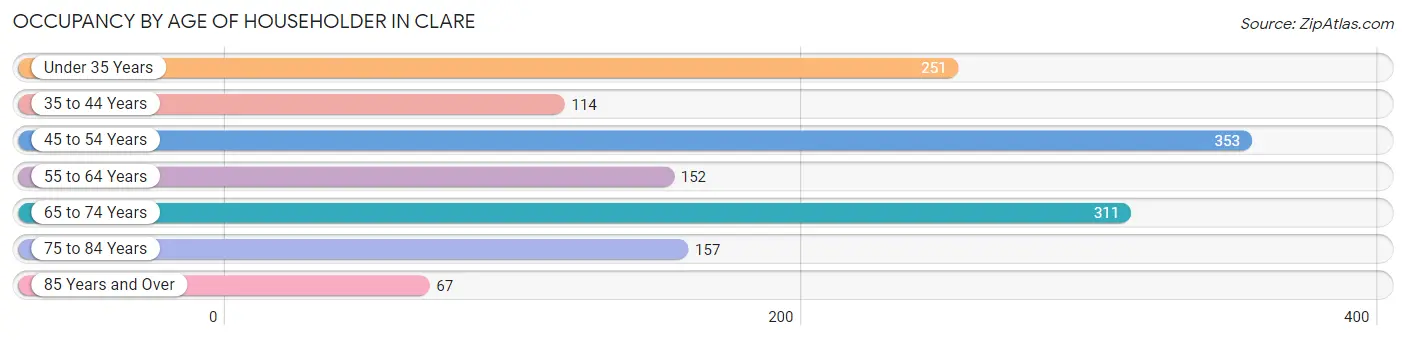
| Age Bracket | # Households | % Households |
| Under 35 Years | 251 | 17.9% |
| 35 to 44 Years | 114 | 8.1% |
| 45 to 54 Years | 353 | 25.1% |
| 55 to 64 Years | 152 | 10.8% |
| 65 to 74 Years | 311 | 22.1% |
| 75 to 84 Years | 157 | 11.2% |
| 85 Years and Over | 67 | 4.8% |
| Total | 1,405 | 100.0% |
Housing Finances in Clare
Median Income by Occupancy in Clare
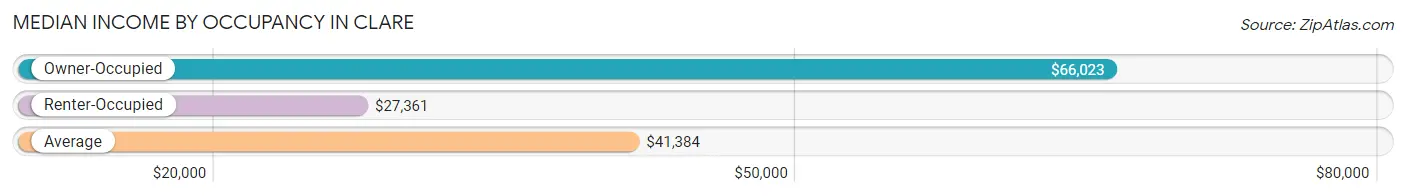
| Occupancy Type | # Households | Median Income |
| Owner-Occupied | 841 (59.9%) | $66,023 |
| Renter-Occupied | 564 (40.1%) | $27,361 |
| Average | 1,405 (100.0%) | $41,384 |
Occupancy by Householder Income Bracket in Clare
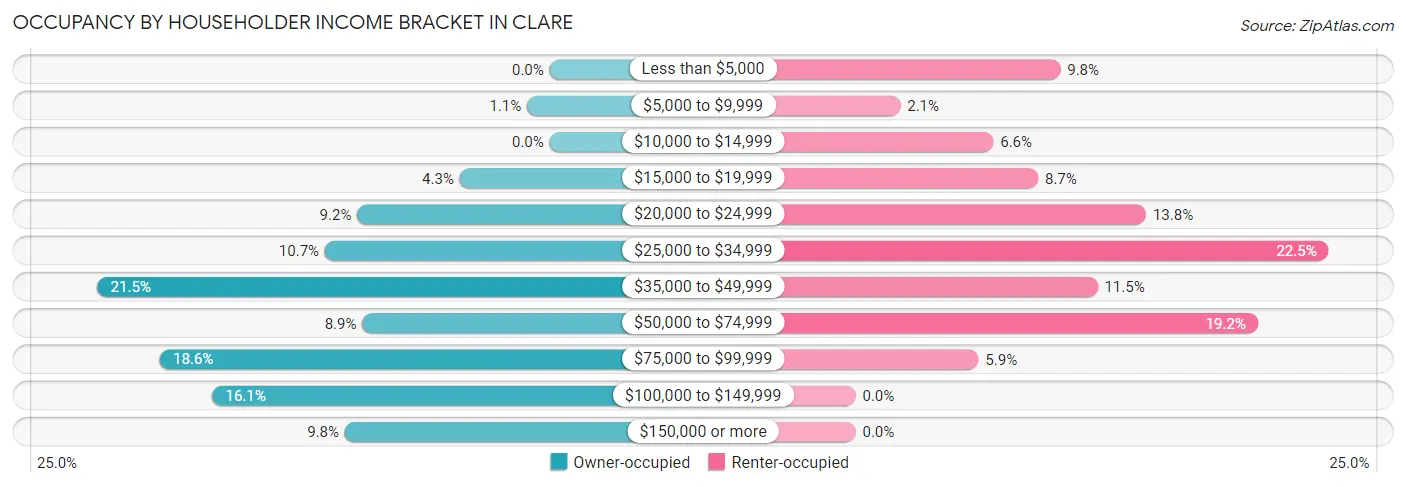
| Income Bracket | Owner-occupied | Renter-occupied |
| Less than $5,000 | 0 (0.0%) | 55 (9.8%) |
| $5,000 to $9,999 | 9 (1.1%) | 12 (2.1%) |
| $10,000 to $14,999 | 0 (0.0%) | 37 (6.6%) |
| $15,000 to $19,999 | 36 (4.3%) | 49 (8.7%) |
| $20,000 to $24,999 | 77 (9.2%) | 78 (13.8%) |
| $25,000 to $34,999 | 90 (10.7%) | 127 (22.5%) |
| $35,000 to $49,999 | 181 (21.5%) | 65 (11.5%) |
| $50,000 to $74,999 | 75 (8.9%) | 108 (19.2%) |
| $75,000 to $99,999 | 156 (18.5%) | 33 (5.9%) |
| $100,000 to $149,999 | 135 (16.1%) | 0 (0.0%) |
| $150,000 or more | 82 (9.8%) | 0 (0.0%) |
| Total | 841 (100.0%) | 564 (100.0%) |
Monthly Housing Cost Tiers in Clare
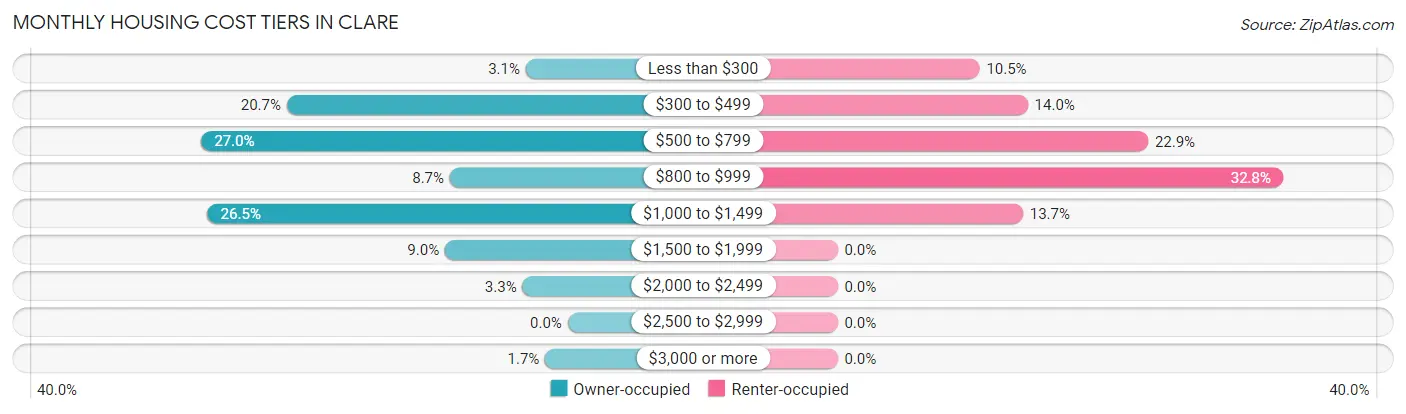
| Monthly Cost | Owner-occupied | Renter-occupied |
| Less than $300 | 26 (3.1%) | 59 (10.5%) |
| $300 to $499 | 174 (20.7%) | 79 (14.0%) |
| $500 to $799 | 227 (27.0%) | 129 (22.9%) |
| $800 to $999 | 73 (8.7%) | 185 (32.8%) |
| $1,000 to $1,499 | 223 (26.5%) | 77 (13.7%) |
| $1,500 to $1,999 | 76 (9.0%) | 0 (0.0%) |
| $2,000 to $2,499 | 28 (3.3%) | 0 (0.0%) |
| $2,500 to $2,999 | 0 (0.0%) | 0 (0.0%) |
| $3,000 or more | 14 (1.7%) | 0 (0.0%) |
| Total | 841 (100.0%) | 564 (100.0%) |
Physical Housing Characteristics in Clare
Housing Structures in Clare
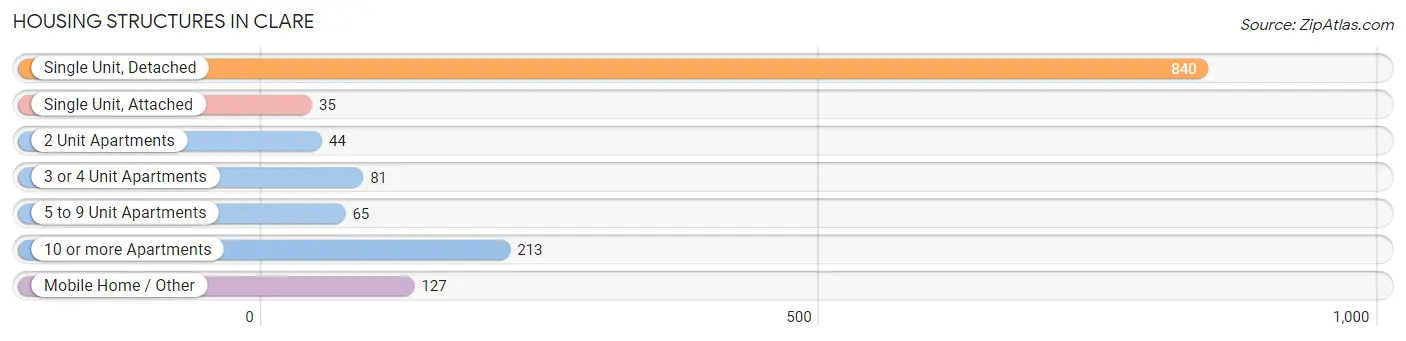
| Structure Type | # Housing Units | % Housing Units |
| Single Unit, Detached | 840 | 59.8% |
| Single Unit, Attached | 35 | 2.5% |
| 2 Unit Apartments | 44 | 3.1% |
| 3 or 4 Unit Apartments | 81 | 5.8% |
| 5 to 9 Unit Apartments | 65 | 4.6% |
| 10 or more Apartments | 213 | 15.2% |
| Mobile Home / Other | 127 | 9.0% |
| Total | 1,405 | 100.0% |
Housing Structures by Occupancy in Clare
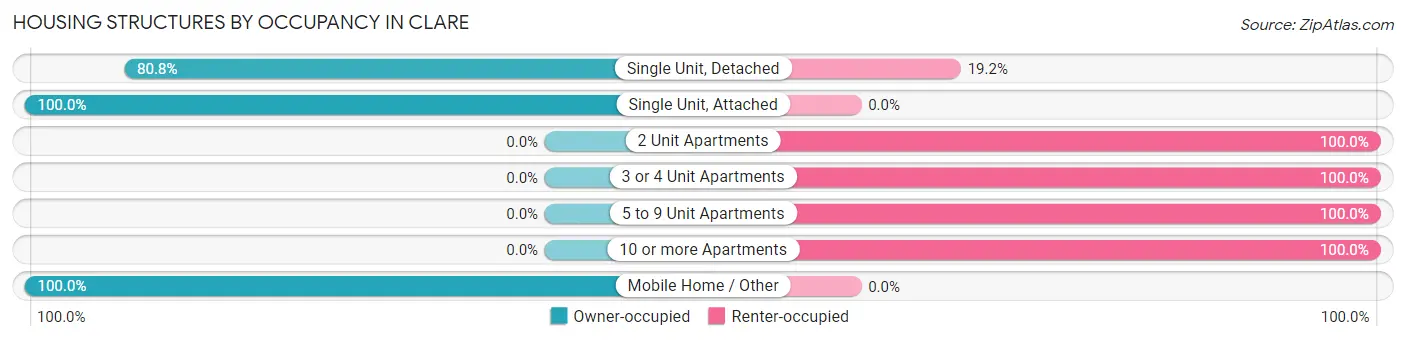
| Structure Type | Owner-occupied | Renter-occupied |
| Single Unit, Detached | 679 (80.8%) | 161 (19.2%) |
| Single Unit, Attached | 35 (100.0%) | 0 (0.0%) |
| 2 Unit Apartments | 0 (0.0%) | 44 (100.0%) |
| 3 or 4 Unit Apartments | 0 (0.0%) | 81 (100.0%) |
| 5 to 9 Unit Apartments | 0 (0.0%) | 65 (100.0%) |
| 10 or more Apartments | 0 (0.0%) | 213 (100.0%) |
| Mobile Home / Other | 127 (100.0%) | 0 (0.0%) |
| Total | 841 (59.9%) | 564 (40.1%) |
Housing Structures by Number of Rooms in Clare
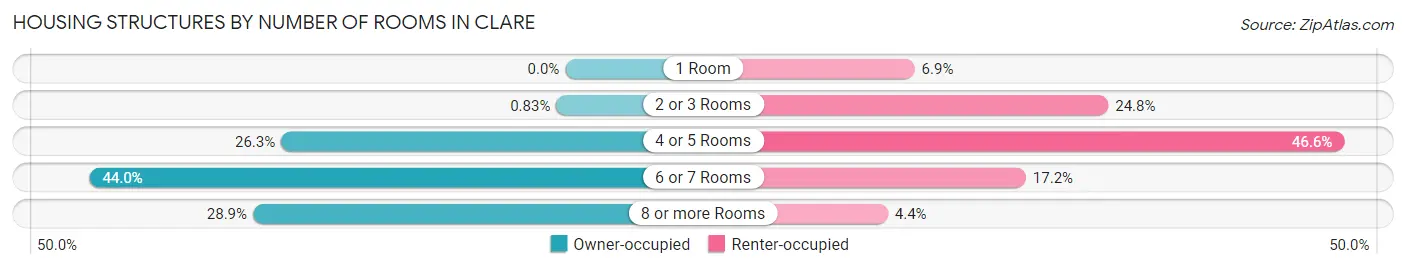
| Number of Rooms | Owner-occupied | Renter-occupied |
| 1 Room | 0 (0.0%) | 39 (6.9%) |
| 2 or 3 Rooms | 7 (0.8%) | 140 (24.8%) |
| 4 or 5 Rooms | 221 (26.3%) | 263 (46.6%) |
| 6 or 7 Rooms | 370 (44.0%) | 97 (17.2%) |
| 8 or more Rooms | 243 (28.9%) | 25 (4.4%) |
| Total | 841 (100.0%) | 564 (100.0%) |
Housing Structure by Heating Type in Clare
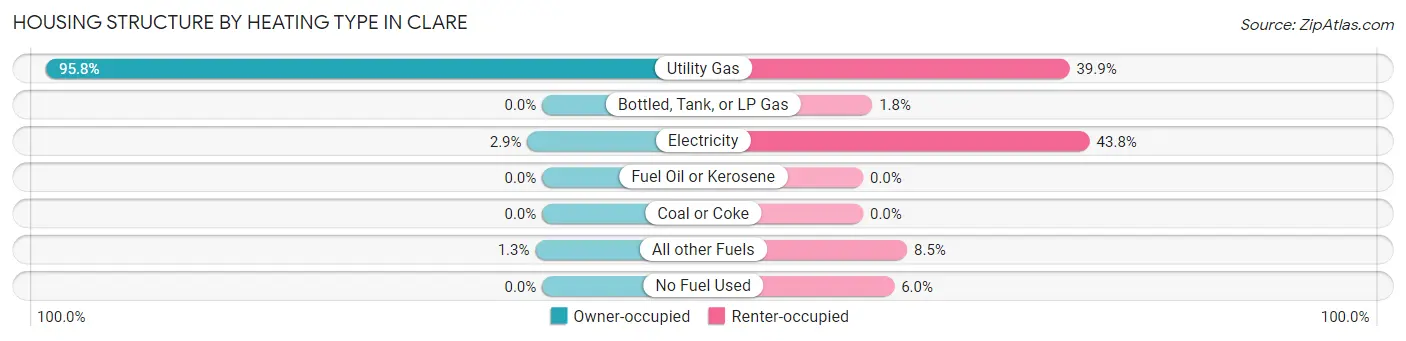
| Heating Type | Owner-occupied | Renter-occupied |
| Utility Gas | 806 (95.8%) | 225 (39.9%) |
| Bottled, Tank, or LP Gas | 0 (0.0%) | 10 (1.8%) |
| Electricity | 24 (2.9%) | 247 (43.8%) |
| Fuel Oil or Kerosene | 0 (0.0%) | 0 (0.0%) |
| Coal or Coke | 0 (0.0%) | 0 (0.0%) |
| All other Fuels | 11 (1.3%) | 48 (8.5%) |
| No Fuel Used | 0 (0.0%) | 34 (6.0%) |
| Total | 841 (100.0%) | 564 (100.0%) |
Household Vehicle Usage in Clare
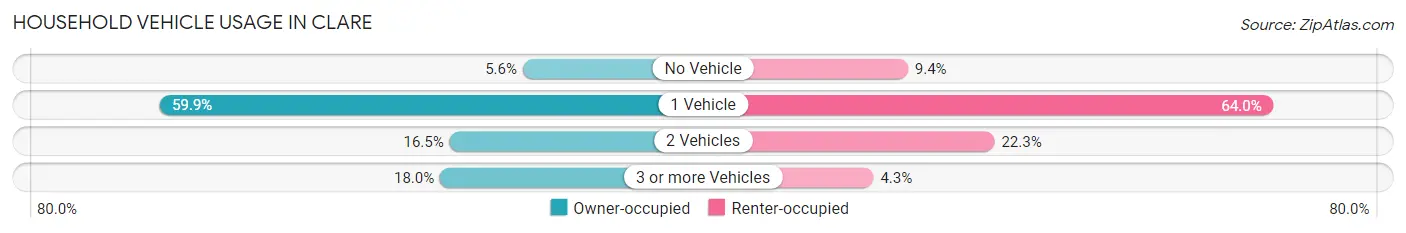
| Vehicles per Household | Owner-occupied | Renter-occupied |
| No Vehicle | 47 (5.6%) | 53 (9.4%) |
| 1 Vehicle | 504 (59.9%) | 361 (64.0%) |
| 2 Vehicles | 139 (16.5%) | 126 (22.3%) |
| 3 or more Vehicles | 151 (17.9%) | 24 (4.3%) |
| Total | 841 (100.0%) | 564 (100.0%) |
Real Estate & Mortgages in Clare
Real Estate and Mortgage Overview in Clare
| Characteristic | Without Mortgage | With Mortgage |
| Housing Units | 436 | 405 |
| Median Property Value | $146,600 | $114,400 |
| Median Household Income | $39,167 | $68 |
| Monthly Housing Costs | $525 | $14 |
| Real Estate Taxes | $2,647 | $10 |
Property Value by Mortgage Status in Clare
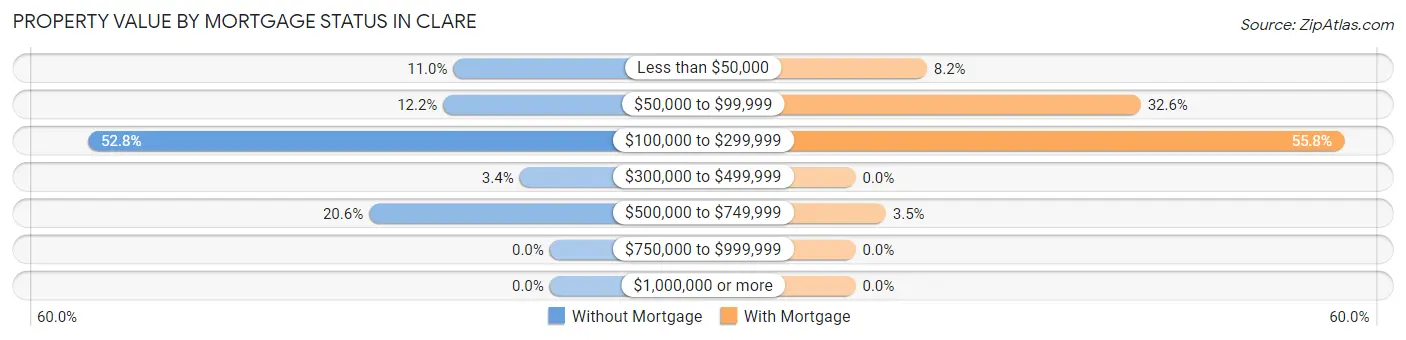
| Property Value | Without Mortgage | With Mortgage |
| Less than $50,000 | 48 (11.0%) | 33 (8.2%) |
| $50,000 to $99,999 | 53 (12.2%) | 132 (32.6%) |
| $100,000 to $299,999 | 230 (52.7%) | 226 (55.8%) |
| $300,000 to $499,999 | 15 (3.4%) | 0 (0.0%) |
| $500,000 to $749,999 | 90 (20.6%) | 14 (3.5%) |
| $750,000 to $999,999 | 0 (0.0%) | 0 (0.0%) |
| $1,000,000 or more | 0 (0.0%) | 0 (0.0%) |
| Total | 436 (100.0%) | 405 (100.0%) |
Household Income by Mortgage Status in Clare
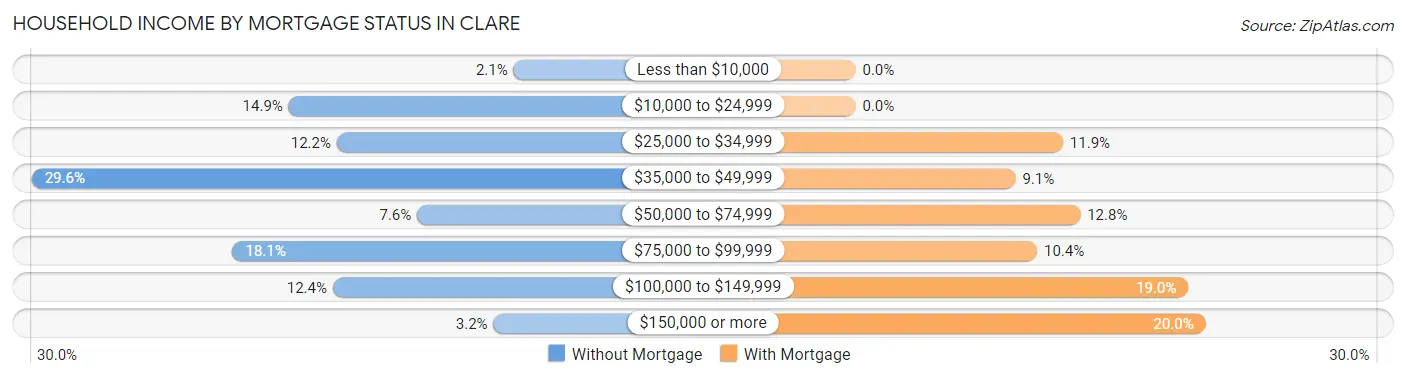
| Household Income | Without Mortgage | With Mortgage |
| Less than $10,000 | 9 (2.1%) | 0 (0.0%) |
| $10,000 to $24,999 | 65 (14.9%) | 0 (0.0%) |
| $25,000 to $34,999 | 53 (12.2%) | 48 (11.8%) |
| $35,000 to $49,999 | 129 (29.6%) | 37 (9.1%) |
| $50,000 to $74,999 | 33 (7.6%) | 52 (12.8%) |
| $75,000 to $99,999 | 79 (18.1%) | 42 (10.4%) |
| $100,000 to $149,999 | 54 (12.4%) | 77 (19.0%) |
| $150,000 or more | 14 (3.2%) | 81 (20.0%) |
| Total | 436 (100.0%) | 405 (100.0%) |
Property Value to Household Income Ratio in Clare
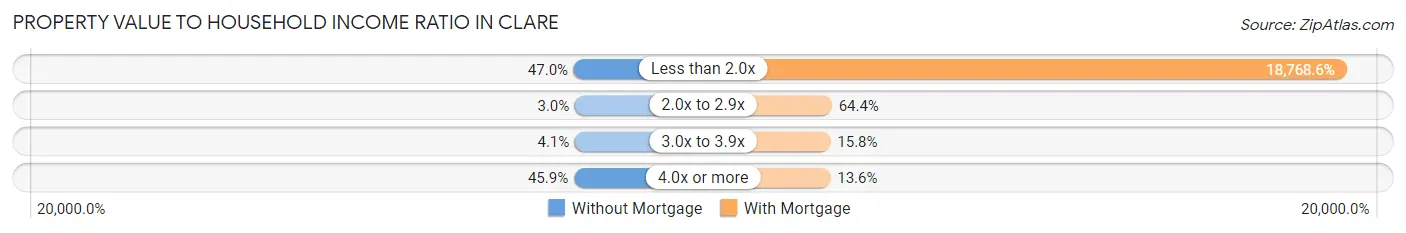
| Value-to-Income Ratio | Without Mortgage | With Mortgage |
| Less than 2.0x | 205 (47.0%) | 76,013 (18,768.6%) |
| 2.0x to 2.9x | 13 (3.0%) | 261 (64.4%) |
| 3.0x to 3.9x | 18 (4.1%) | 64 (15.8%) |
| 4.0x or more | 200 (45.9%) | 55 (13.6%) |
| Total | 436 (100.0%) | 405 (100.0%) |
Real Estate Taxes by Mortgage Status in Clare
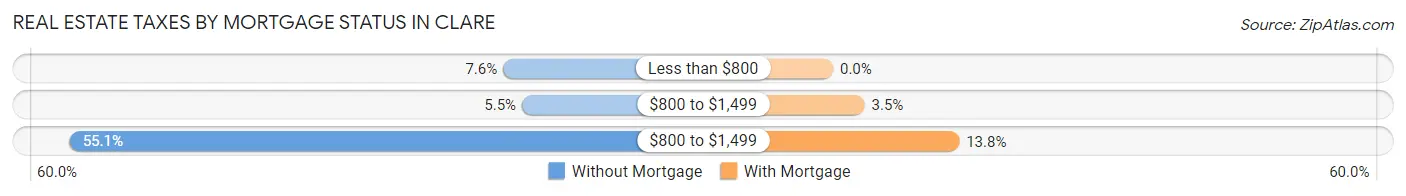
| Property Taxes | Without Mortgage | With Mortgage |
| Less than $800 | 33 (7.6%) | 0 (0.0%) |
| $800 to $1,499 | 24 (5.5%) | 14 (3.5%) |
| $800 to $1,499 | 240 (55.0%) | 56 (13.8%) |
| Total | 436 (100.0%) | 405 (100.0%) |
Health & Disability in Clare
Health Insurance Coverage by Age in Clare
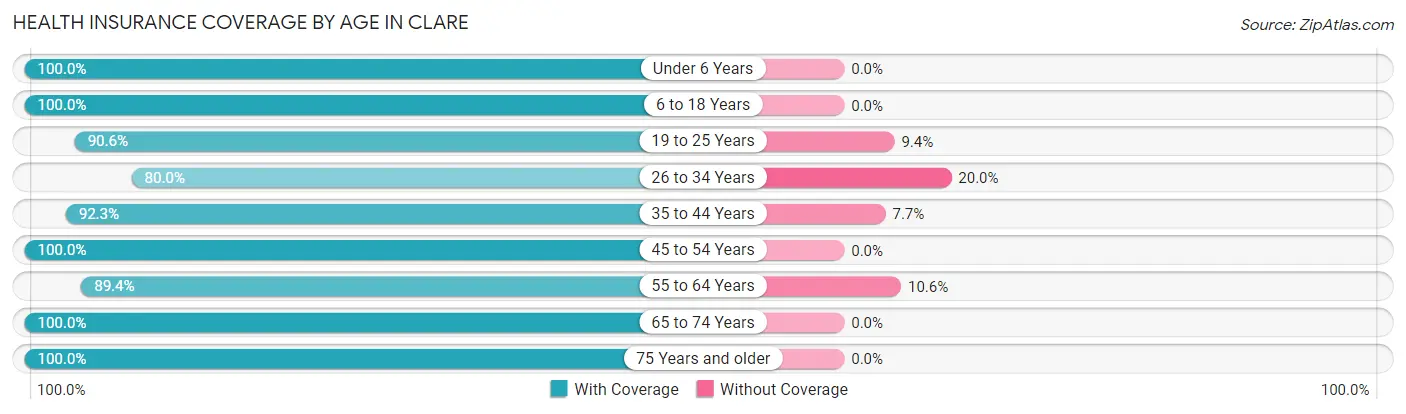
| Age Bracket | With Coverage | Without Coverage |
| Under 6 Years | 225 (100.0%) | 0 (0.0%) |
| 6 to 18 Years | 535 (100.0%) | 0 (0.0%) |
| 19 to 25 Years | 184 (90.6%) | 19 (9.4%) |
| 26 to 34 Years | 389 (80.0%) | 97 (20.0%) |
| 35 to 44 Years | 288 (92.3%) | 24 (7.7%) |
| 45 to 54 Years | 559 (100.0%) | 0 (0.0%) |
| 55 to 64 Years | 245 (89.4%) | 29 (10.6%) |
| 65 to 74 Years | 384 (100.0%) | 0 (0.0%) |
| 75 Years and older | 299 (100.0%) | 0 (0.0%) |
| Total | 3,108 (94.8%) | 169 (5.2%) |
Health Insurance Coverage by Citizenship Status in Clare
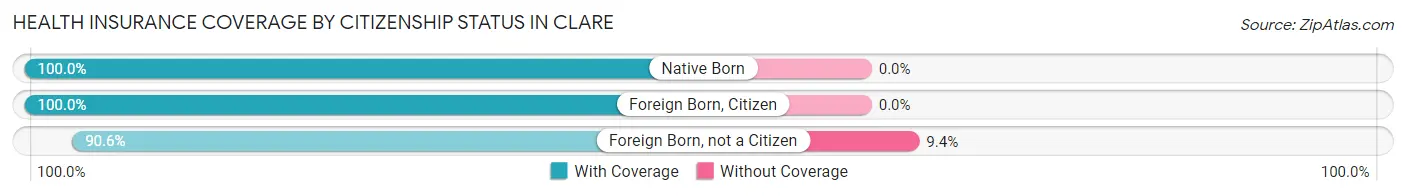
| Citizenship Status | With Coverage | Without Coverage |
| Native Born | 225 (100.0%) | 0 (0.0%) |
| Foreign Born, Citizen | 535 (100.0%) | 0 (0.0%) |
| Foreign Born, not a Citizen | 184 (90.6%) | 19 (9.4%) |
Health Insurance Coverage by Household Income in Clare
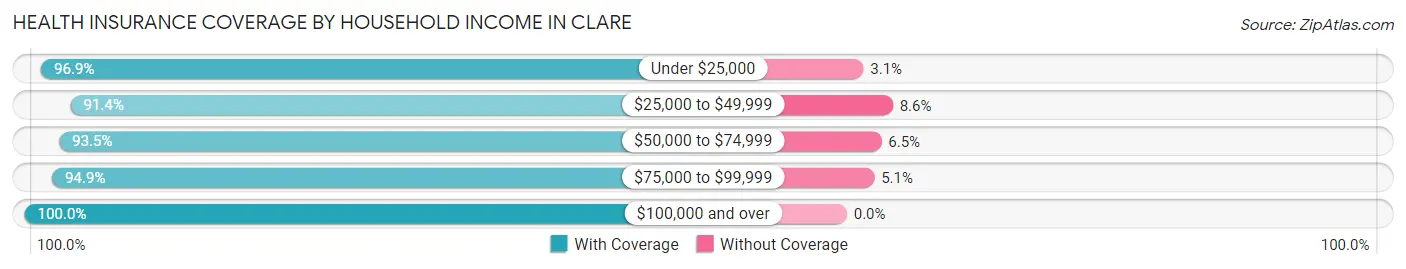
| Household Income | With Coverage | Without Coverage |
| Under $25,000 | 563 (96.9%) | 18 (3.1%) |
| $25,000 to $49,999 | 957 (91.4%) | 90 (8.6%) |
| $50,000 to $74,999 | 419 (93.5%) | 29 (6.5%) |
| $75,000 to $99,999 | 591 (94.9%) | 32 (5.1%) |
| $100,000 and over | 569 (100.0%) | 0 (0.0%) |
Public vs Private Health Insurance Coverage by Age in Clare
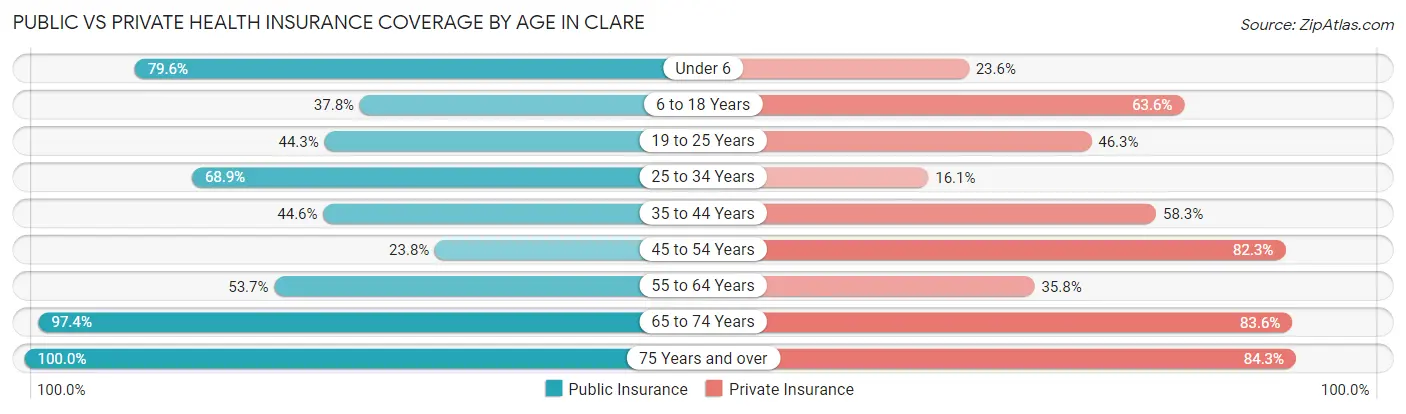
| Age Bracket | Public Insurance | Private Insurance |
| Under 6 | 179 (79.6%) | 53 (23.6%) |
| 6 to 18 Years | 202 (37.8%) | 340 (63.5%) |
| 19 to 25 Years | 90 (44.3%) | 94 (46.3%) |
| 25 to 34 Years | 335 (68.9%) | 78 (16.1%) |
| 35 to 44 Years | 139 (44.6%) | 182 (58.3%) |
| 45 to 54 Years | 133 (23.8%) | 460 (82.3%) |
| 55 to 64 Years | 147 (53.6%) | 98 (35.8%) |
| 65 to 74 Years | 374 (97.4%) | 321 (83.6%) |
| 75 Years and over | 299 (100.0%) | 252 (84.3%) |
| Total | 1,898 (57.9%) | 1,878 (57.3%) |
Disability Status by Sex by Age in Clare
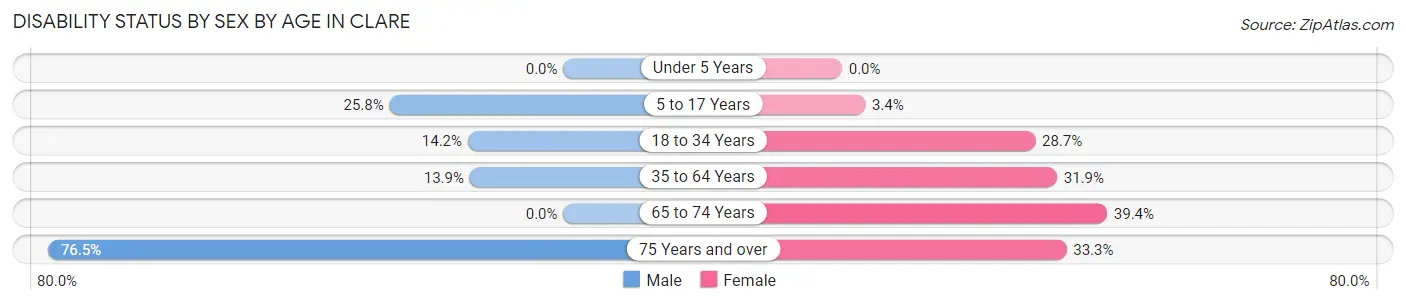
| Age Bracket | Male | Female |
| Under 5 Years | 0 (0.0%) | 0 (0.0%) |
| 5 to 17 Years | 48 (25.8%) | 14 (3.4%) |
| 18 to 34 Years | 38 (14.2%) | 126 (28.7%) |
| 35 to 64 Years | 76 (13.9%) | 191 (31.9%) |
| 65 to 74 Years | 0 (0.0%) | 111 (39.4%) |
| 75 Years and over | 75 (76.5%) | 67 (33.3%) |
Disability Class by Sex by Age in Clare
Disability Class: Hearing Difficulty
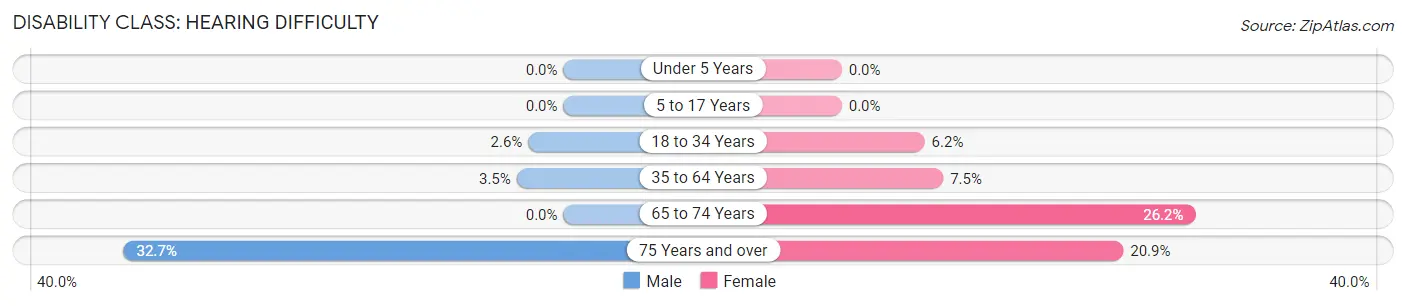
| Age Bracket | Male | Female |
| Under 5 Years | 0 (0.0%) | 0 (0.0%) |
| 5 to 17 Years | 0 (0.0%) | 0 (0.0%) |
| 18 to 34 Years | 7 (2.6%) | 27 (6.1%) |
| 35 to 64 Years | 19 (3.5%) | 45 (7.5%) |
| 65 to 74 Years | 0 (0.0%) | 74 (26.2%) |
| 75 Years and over | 32 (32.7%) | 42 (20.9%) |
Disability Class: Vision Difficulty
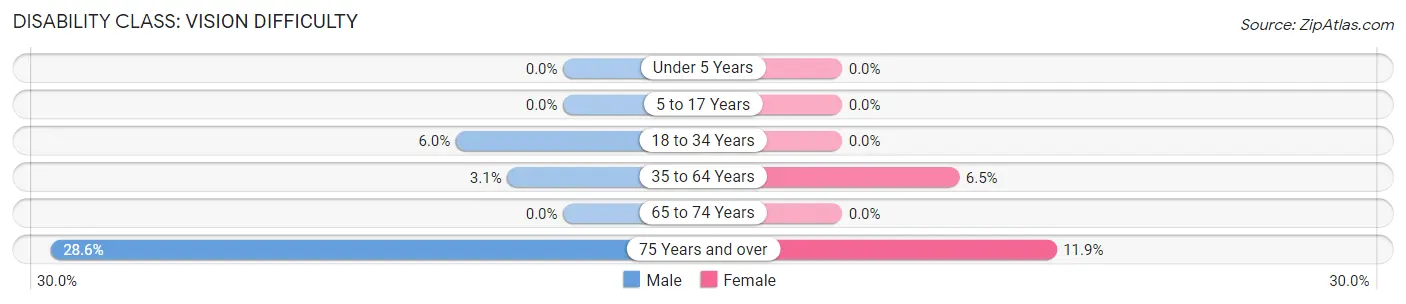
| Age Bracket | Male | Female |
| Under 5 Years | 0 (0.0%) | 0 (0.0%) |
| 5 to 17 Years | 0 (0.0%) | 0 (0.0%) |
| 18 to 34 Years | 16 (6.0%) | 0 (0.0%) |
| 35 to 64 Years | 17 (3.1%) | 39 (6.5%) |
| 65 to 74 Years | 0 (0.0%) | 0 (0.0%) |
| 75 Years and over | 28 (28.6%) | 24 (11.9%) |
Disability Class: Cognitive Difficulty
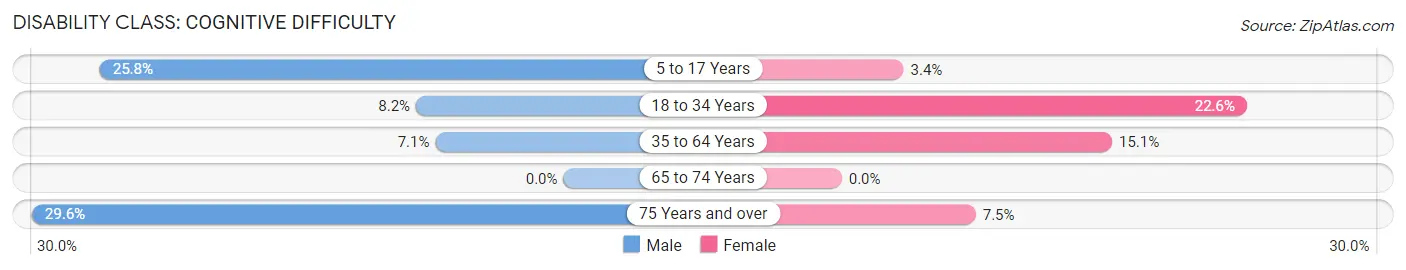
| Age Bracket | Male | Female |
| 5 to 17 Years | 48 (25.8%) | 14 (3.4%) |
| 18 to 34 Years | 22 (8.2%) | 99 (22.6%) |
| 35 to 64 Years | 39 (7.1%) | 90 (15.0%) |
| 65 to 74 Years | 0 (0.0%) | 0 (0.0%) |
| 75 Years and over | 29 (29.6%) | 15 (7.5%) |
Disability Class: Ambulatory Difficulty
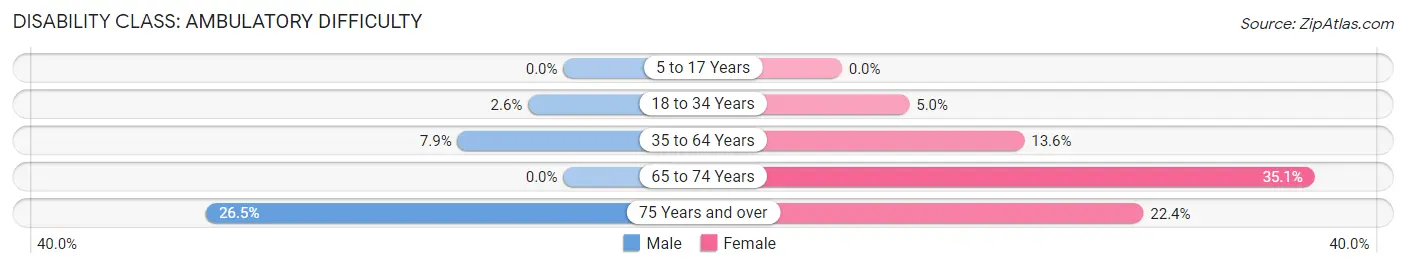
| Age Bracket | Male | Female |
| 5 to 17 Years | 0 (0.0%) | 0 (0.0%) |
| 18 to 34 Years | 7 (2.6%) | 22 (5.0%) |
| 35 to 64 Years | 43 (7.9%) | 81 (13.6%) |
| 65 to 74 Years | 0 (0.0%) | 99 (35.1%) |
| 75 Years and over | 26 (26.5%) | 45 (22.4%) |
Disability Class: Self-Care Difficulty
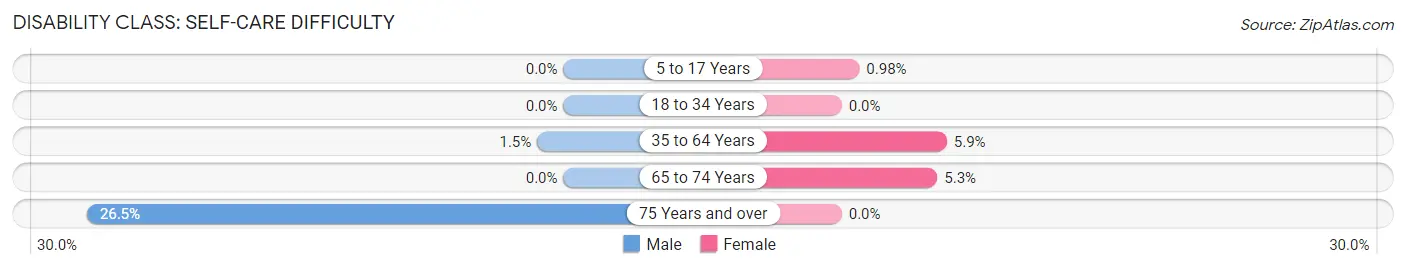
| Age Bracket | Male | Female |
| 5 to 17 Years | 0 (0.0%) | 4 (1.0%) |
| 18 to 34 Years | 0 (0.0%) | 0 (0.0%) |
| 35 to 64 Years | 8 (1.5%) | 35 (5.9%) |
| 65 to 74 Years | 0 (0.0%) | 15 (5.3%) |
| 75 Years and over | 26 (26.5%) | 0 (0.0%) |
Technology Access in Clare
Computing Device Access in Clare
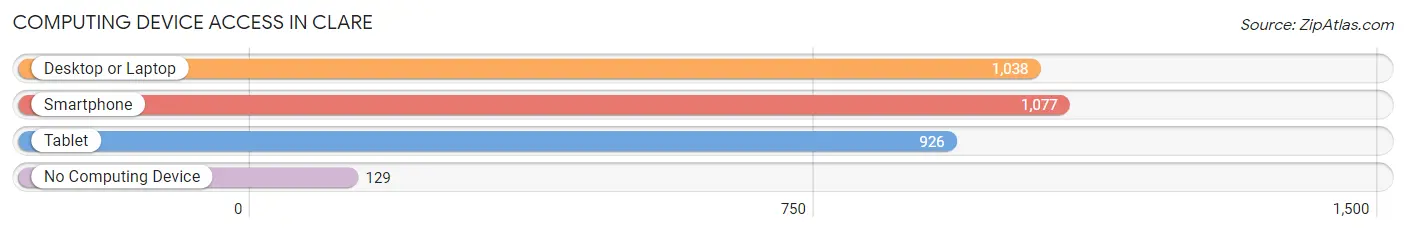
| Device Type | # Households | % Households |
| Desktop or Laptop | 1,038 | 73.9% |
| Smartphone | 1,077 | 76.6% |
| Tablet | 926 | 65.9% |
| No Computing Device | 129 | 9.2% |
| Total | 1,405 | 100.0% |
Internet Access in Clare
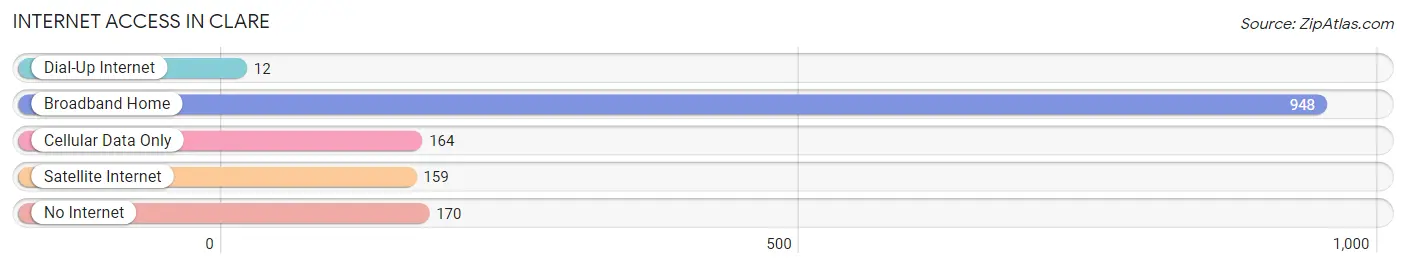
| Internet Type | # Households | % Households |
| Dial-Up Internet | 12 | 0.9% |
| Broadband Home | 948 | 67.5% |
| Cellular Data Only | 164 | 11.7% |
| Satellite Internet | 159 | 11.3% |
| No Internet | 170 | 12.1% |
| Total | 1,405 | 100.0% |
Clare Summary
Clare, Michigan is a small city located in the central part of the state, in Clare County. It is situated on the banks of the Tobacco River, and is surrounded by rolling hills and farmland. The city has a population of approximately 5,000 people, and is the county seat of Clare County.
History
Clare was first settled in 1854 by a group of settlers from New York. The city was named after the county, which was named after General Charles P. Clare, a veteran of the War of 1812. The city was incorporated in 1871, and the first mayor was elected in 1872.
In the late 19th century, Clare was a thriving lumber town, with several sawmills and lumber yards. The city was also home to a number of other businesses, including a brickyard, a flour mill, and a tannery.
In the early 20th century, Clare began to experience a decline in its lumber industry, and the city began to focus on other industries, such as agriculture and manufacturing. The city was also home to a number of small businesses, such as grocery stores, restaurants, and clothing stores.
Geography
Clare is located in the central part of Michigan, in Clare County. The city is situated on the banks of the Tobacco River, and is surrounded by rolling hills and farmland. The city has a total area of 4.2 square miles, and is located approximately 40 miles north of Lansing, the state capital.
The climate in Clare is generally mild, with cold winters and warm summers. The average temperature in the winter is around 25 degrees Fahrenheit, and the average temperature in the summer is around 75 degrees Fahrenheit.
Economy
Clare’s economy is largely based on agriculture and manufacturing. The city is home to a number of small businesses, such as grocery stores, restaurants, and clothing stores. The city is also home to a number of manufacturing companies, such as automotive parts, furniture, and plastics.
The city is also home to a number of educational institutions, including Clare High School, Clare Middle School, and Clare Elementary School. The city is also home to a number of churches, including the First United Methodist Church, the First Presbyterian Church, and the First Baptist Church.
Demographics
As of the 2010 census, the population of Clare was 5,095. The racial makeup of the city was 95.3% White, 0.7% African American, 0.3% Native American, 0.7% Asian, 0.1% Pacific Islander, 1.2% from other races, and 1.7% from two or more races. Hispanic or Latino of any race were 3.2% of the population.
The median income for a household in Clare was $37,917, and the median income for a family was $45,938. The per capita income for the city was $19,945. About 11.2% of families and 14.2% of the population were below the poverty line, including 19.2% of those under age 18 and 8.2% of those age 65 or over.
Clare is a small city with a rich history and a diverse economy. The city is home to a number of small businesses, educational institutions, and churches, and is surrounded by rolling hills and farmland. The city has a population of approximately 5,000 people, and is the county seat of Clare County.
Common Questions
What is Per Capita Income in Clare?
Per Capita income in Clare is $27,113.
What is the Median Family Income in Clare?
Median Family Income in Clare is $50,685.
What is the Median Household income in Clare?
Median Household Income in Clare is $41,384.
What is Income or Wage Gap in Clare?
Income or Wage Gap in Clare is 30.1%.
Women in Clare earn 69.9 cents for every dollar earned by a man.
What is Inequality or Gini Index in Clare?
Inequality or Gini Index in Clare is 0.44.
What is the Total Population of Clare?
Total Population of Clare is 3,367.
What is the Total Male Population of Clare?
Total Male Population of Clare is 1,291.
What is the Total Female Population of Clare?
Total Female Population of Clare is 2,076.
What is the Ratio of Males per 100 Females in Clare?
There are 62.19 Males per 100 Females in Clare.
What is the Ratio of Females per 100 Males in Clare?
There are 160.81 Females per 100 Males in Clare.
What is the Median Population Age in Clare?
Median Population Age in Clare is 43.2 Years.
What is the Average Family Size in Clare
Average Family Size in Clare is 3.5 People.
What is the Average Household Size in Clare
Average Household Size in Clare is 2.3 People.
How Large is the Labor Force in Clare?
There are 1,441 People in the Labor Forcein in Clare.
What is the Percentage of People in the Labor Force in Clare?
53.6% of People are in the Labor Force in Clare.
What is the Unemployment Rate in Clare?
Unemployment Rate in Clare is 6.7%.