Caseville, MI Map & Demographics
Caseville Map
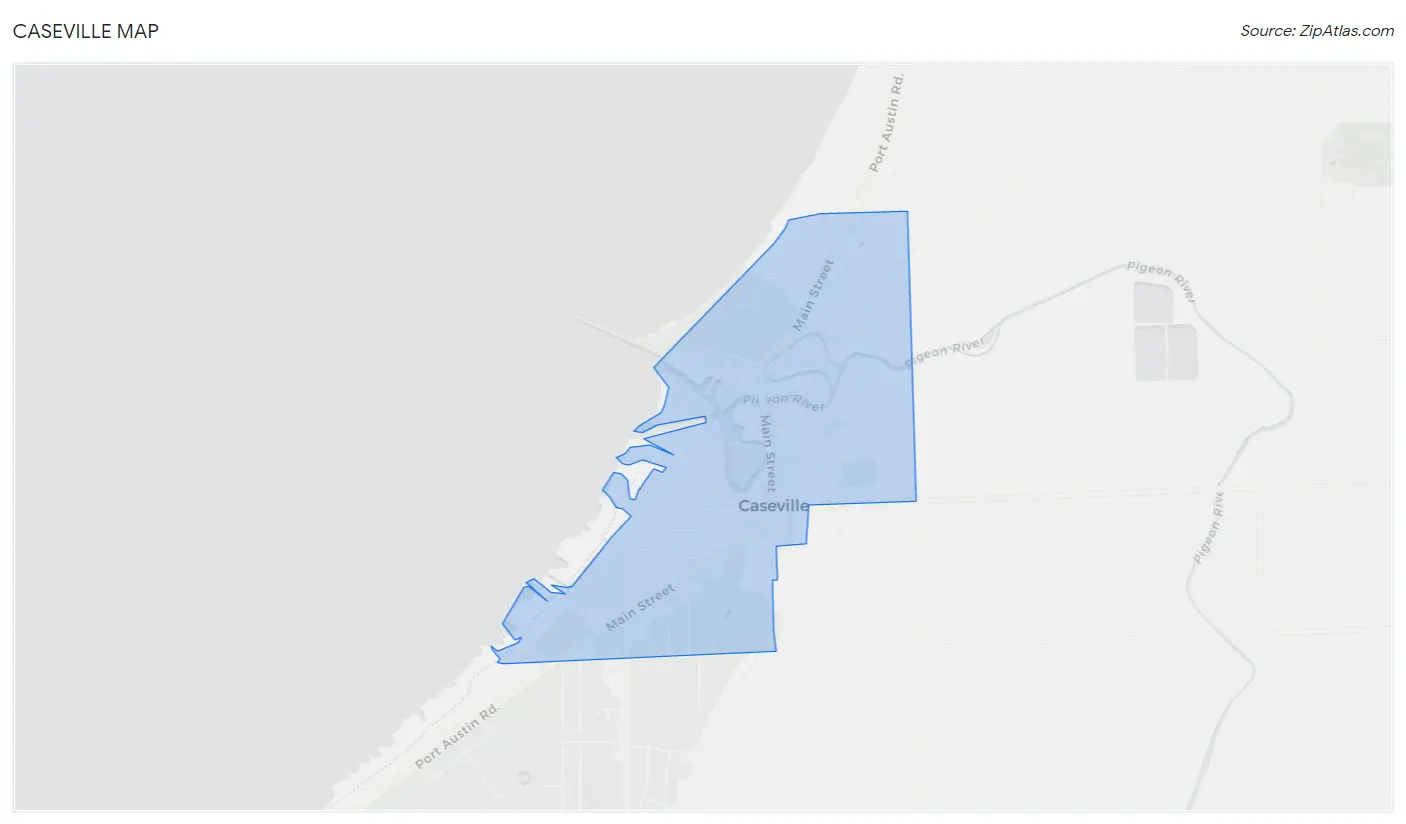
Caseville Overview
$35,984
PER CAPITA INCOME
$72,917
AVG FAMILY INCOME
$52,917
AVG HOUSEHOLD INCOME
28.8%
WAGE / INCOME GAP [ % ]
71.2¢/ $1
WAGE / INCOME GAP [ $ ]
$4,963
FAMILY INCOME DEFICIT
0.40
INEQUALITY / GINI INDEX
674
TOTAL POPULATION
332
MALE POPULATION
342
FEMALE POPULATION
97.08
MALES / 100 FEMALES
103.01
FEMALES / 100 MALES
60.8
MEDIAN AGE
2.3
AVG FAMILY SIZE
1.8
AVG HOUSEHOLD SIZE
270
LABOR FORCE [ PEOPLE ]
42.8%
PERCENT IN LABOR FORCE
3.7%
UNEMPLOYMENT RATE
Caseville Zip Codes
Caseville Area Codes
Income in Caseville
Income Overview in Caseville
Per Capita Income in Caseville is $35,984, while median incomes of families and households are $72,917 and $52,917 respectively.
| Characteristic | Number | Measure |
| Per Capita Income | 674 | $35,984 |
| Median Family Income | 173 | $72,917 |
| Mean Family Income | 173 | $78,264 |
| Median Household Income | 373 | $52,917 |
| Mean Household Income | 373 | $62,952 |
| Income Deficit | 173 | $4,963 |
| Wage / Income Gap (%) | 674 | 28.75% |
| Wage / Income Gap ($) | 674 | 71.25¢ per $1 |
| Gini / Inequality Index | 674 | 0.40 |
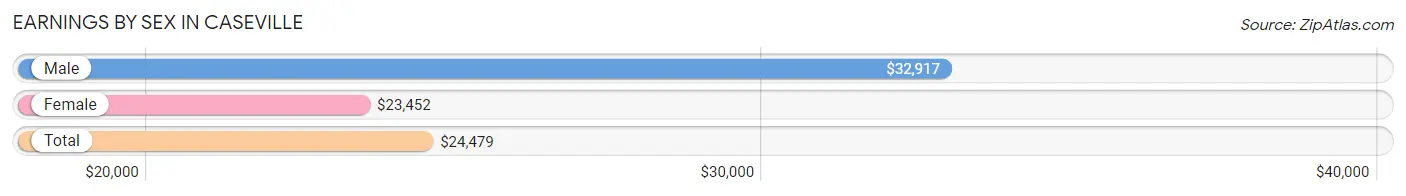
Earnings by Sex in Caseville
Average Earnings in Caseville are $24,479, $32,917 for men and $23,452 for women, a difference of 28.7%.
| Sex | Number | Average Earnings |
| Male | 150 (49.0%) | $32,917 |
| Female | 156 (51.0%) | $23,452 |
| Total | 306 (100.0%) | $24,479 |
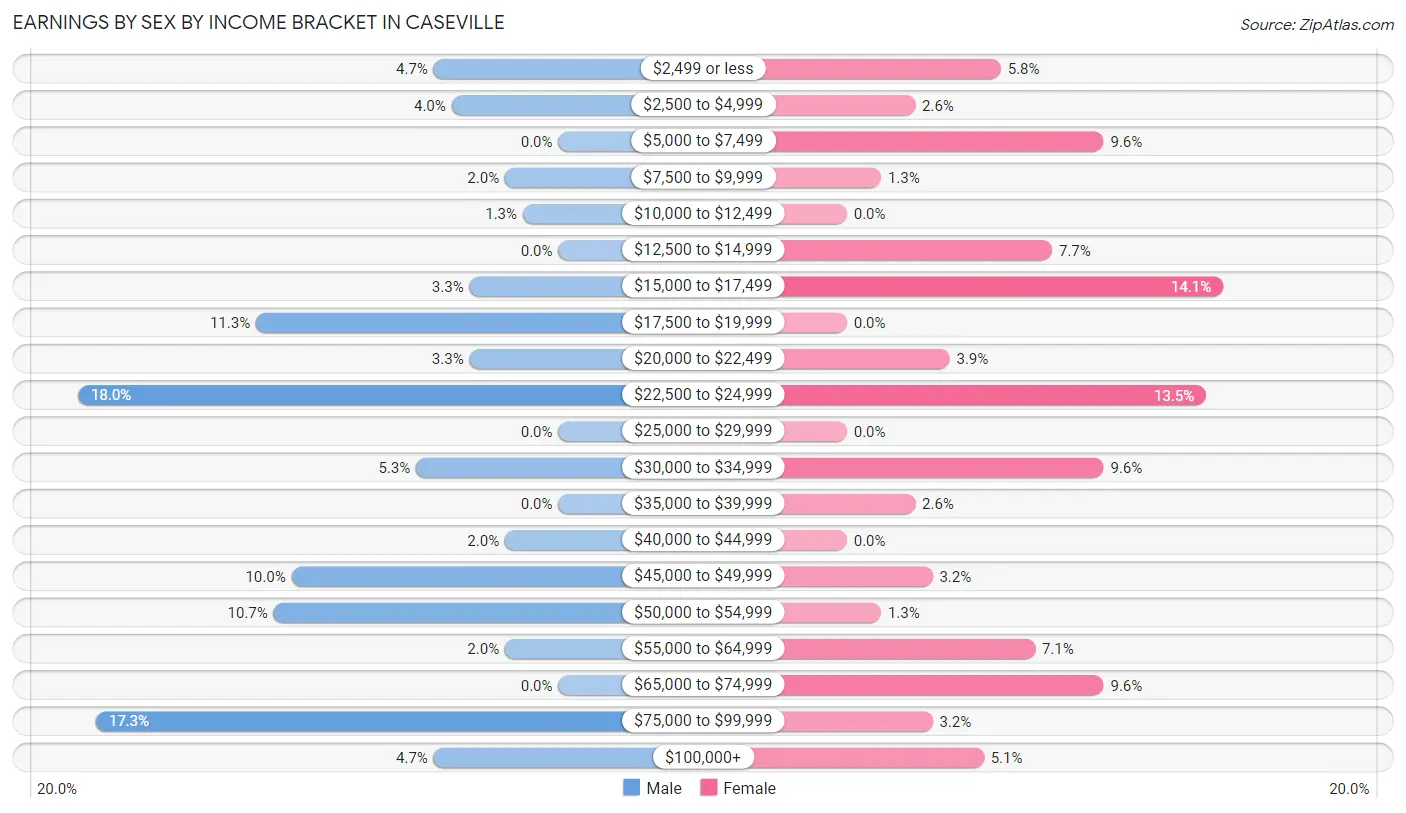
Earnings by Sex by Income Bracket in Caseville
The most common earnings brackets in Caseville are $22,500 to $24,999 for men (27 | 18.0%) and $15,000 to $17,499 for women (22 | 14.1%).
| Income | Male | Female |
| $2,499 or less | 7 (4.7%) | 9 (5.8%) |
| $2,500 to $4,999 | 6 (4.0%) | 4 (2.6%) |
| $5,000 to $7,499 | 0 (0.0%) | 15 (9.6%) |
| $7,500 to $9,999 | 3 (2.0%) | 2 (1.3%) |
| $10,000 to $12,499 | 2 (1.3%) | 0 (0.0%) |
| $12,500 to $14,999 | 0 (0.0%) | 12 (7.7%) |
| $15,000 to $17,499 | 5 (3.3%) | 22 (14.1%) |
| $17,500 to $19,999 | 17 (11.3%) | 0 (0.0%) |
| $20,000 to $22,499 | 5 (3.3%) | 6 (3.8%) |
| $22,500 to $24,999 | 27 (18.0%) | 21 (13.5%) |
| $25,000 to $29,999 | 0 (0.0%) | 0 (0.0%) |
| $30,000 to $34,999 | 8 (5.3%) | 15 (9.6%) |
| $35,000 to $39,999 | 0 (0.0%) | 4 (2.6%) |
| $40,000 to $44,999 | 3 (2.0%) | 0 (0.0%) |
| $45,000 to $49,999 | 15 (10.0%) | 5 (3.2%) |
| $50,000 to $54,999 | 16 (10.7%) | 2 (1.3%) |
| $55,000 to $64,999 | 3 (2.0%) | 11 (7.0%) |
| $65,000 to $74,999 | 0 (0.0%) | 15 (9.6%) |
| $75,000 to $99,999 | 26 (17.3%) | 5 (3.2%) |
| $100,000+ | 7 (4.7%) | 8 (5.1%) |
| Total | 150 (100.0%) | 156 (100.0%) |
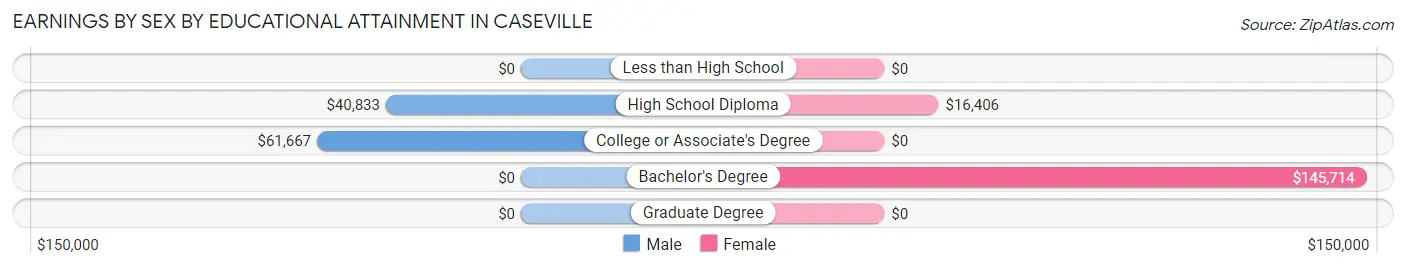
Earnings by Sex by Educational Attainment in Caseville
Average earnings in Caseville are $49,531 for men and $22,083 for women, a difference of 55.4%. Men with an educational attainment of college or associate's degree enjoy the highest average annual earnings of $61,667, while those with high school diploma education earn the least with $40,833. Women with an educational attainment of bachelor's degree earn the most with the average annual earnings of $145,714, while those with high school diploma education have the smallest earnings of $16,406.
| Educational Attainment | Male Income | Female Income |
| Less than High School | - | - |
| High School Diploma | $40,833 | $16,406 |
| College or Associate's Degree | $61,667 | $0 |
| Bachelor's Degree | - | - |
| Graduate Degree | - | - |
| Total | $49,531 | $22,083 |
Family Income in Caseville
Family Income Brackets in Caseville
According to the Caseville family income data, there are 49 families falling into the $50,000 to $74,999 income range, which is the most common income bracket and makes up 28.3% of all families.
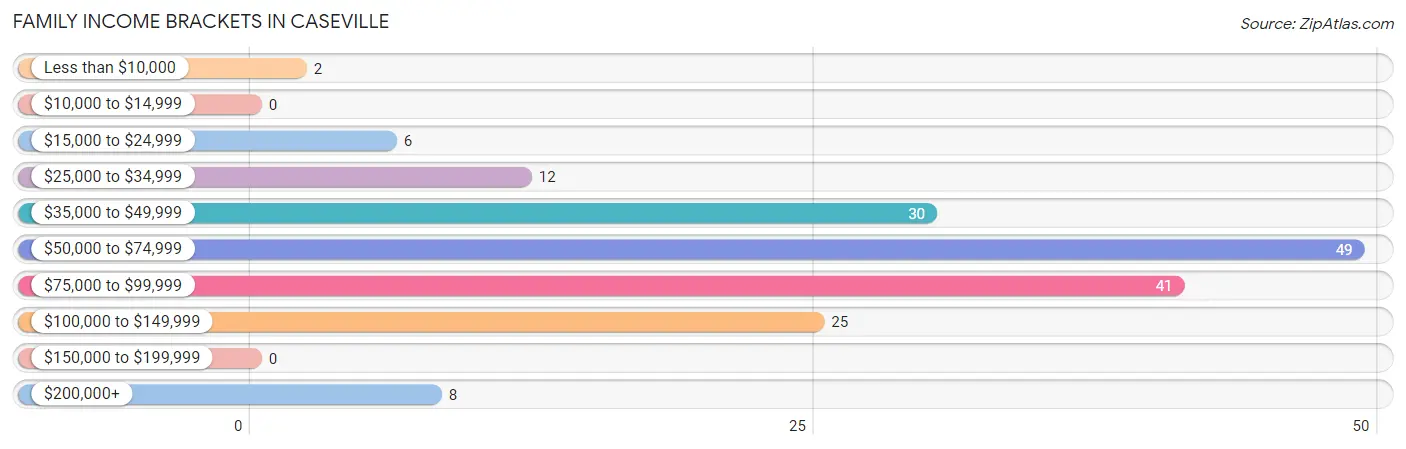
| Income Bracket | # Families | % Families |
| Less than $10,000 | 2 | 1.2% |
| $10,000 to $14,999 | 0 | 0.0% |
| $15,000 to $24,999 | 6 | 3.5% |
| $25,000 to $34,999 | 12 | 6.9% |
| $35,000 to $49,999 | 30 | 17.3% |
| $50,000 to $74,999 | 49 | 28.3% |
| $75,000 to $99,999 | 41 | 23.7% |
| $100,000 to $149,999 | 25 | 14.5% |
| $150,000 to $199,999 | 0 | 0.0% |
| $200,000+ | 8 | 4.6% |
Family Income by Famaliy Size in Caseville
4-person families (11 | 6.4%) account for the highest median family income in Caseville with $235,893 per family, while 4-person families (11 | 6.4%) have the highest median income of $58,973 per family member.
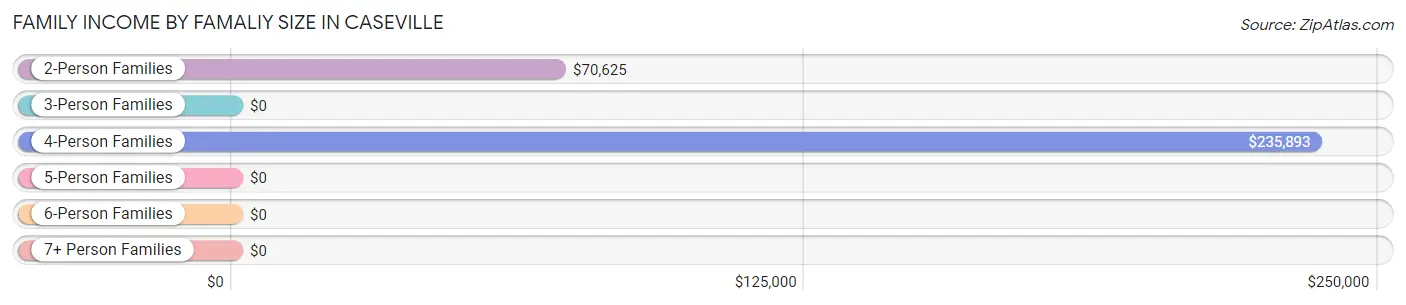
| Income Bracket | # Families | Median Income |
| 2-Person Families | 149 (86.1%) | $70,625 |
| 3-Person Families | 11 (6.4%) | $0 |
| 4-Person Families | 11 (6.4%) | $235,893 |
| 5-Person Families | 0 (0.0%) | $0 |
| 6-Person Families | 2 (1.2%) | $0 |
| 7+ Person Families | 0 (0.0%) | $0 |
| Total | 173 (100.0%) | $72,917 |
Family Income by Number of Earners in Caseville
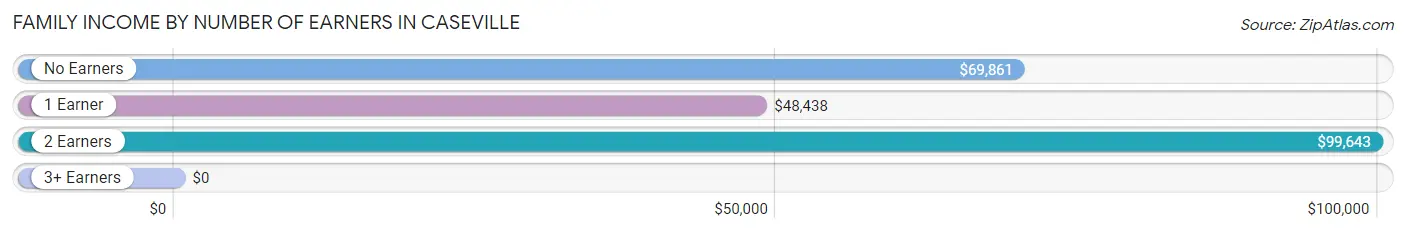
| Number of Earners | # Families | Median Income |
| No Earners | 79 (45.7%) | $69,861 |
| 1 Earner | 39 (22.5%) | $48,438 |
| 2 Earners | 54 (31.2%) | $99,643 |
| 3+ Earners | 1 (0.6%) | $0 |
| Total | 173 (100.0%) | $72,917 |
Household Income in Caseville
Household Income Brackets in Caseville
With 85 households falling in the category, the $50,000 to $74,999 income range is the most frequent in Caseville, accounting for 22.8% of all households.
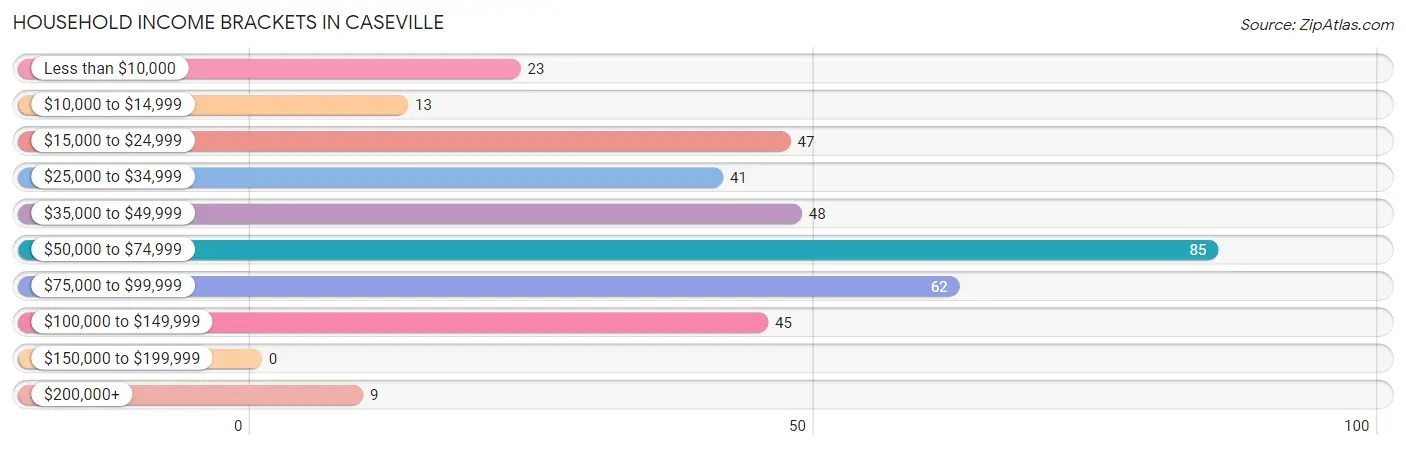
| Income Bracket | # Households | % Households |
| Less than $10,000 | 23 | 6.2% |
| $10,000 to $14,999 | 13 | 3.5% |
| $15,000 to $24,999 | 47 | 12.6% |
| $25,000 to $34,999 | 41 | 11.0% |
| $35,000 to $49,999 | 48 | 12.9% |
| $50,000 to $74,999 | 85 | 22.8% |
| $75,000 to $99,999 | 62 | 16.6% |
| $100,000 to $149,999 | 45 | 12.1% |
| $150,000 to $199,999 | 0 | 0.0% |
| $200,000+ | 9 | 2.4% |
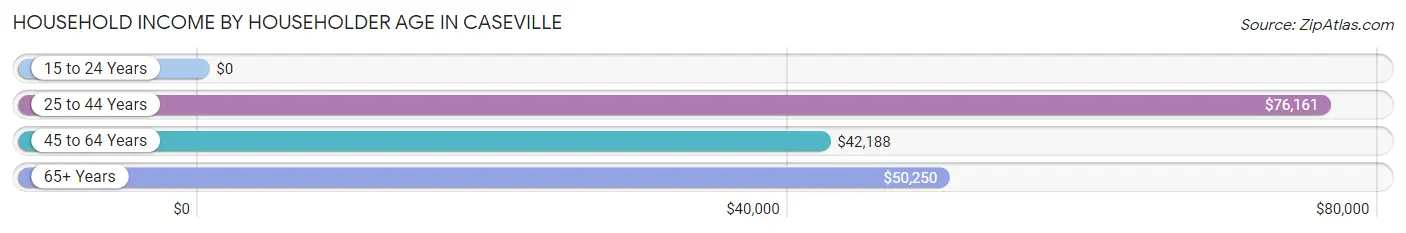
Household Income by Householder Age in Caseville
The median household income in Caseville is $52,917, with the highest median household income of $76,161 found in the 25 to 44 years age bracket for the primary householder. A total of 49 households (13.1%) fall into this category. Meanwhile, the 15 to 24 years age bracket for the primary householder has the lowest median household income of $0, with 29 households (7.8%) in this group.
| Income Bracket | # Households | Median Income |
| 15 to 24 Years | 29 (7.8%) | $0 |
| 25 to 44 Years | 49 (13.1%) | $76,161 |
| 45 to 64 Years | 122 (32.7%) | $42,188 |
| 65+ Years | 173 (46.4%) | $50,250 |
| Total | 373 (100.0%) | $52,917 |
Poverty in Caseville
Income Below Poverty by Sex and Age in Caseville
With 14.5% poverty level for males and 8.0% for females among the residents of Caseville, 45 to 54 year old males and 6 to 11 year old females are the most vulnerable to poverty, with 13 males (41.9%) and 3 females (100.0%) in their respective age groups living below the poverty level.
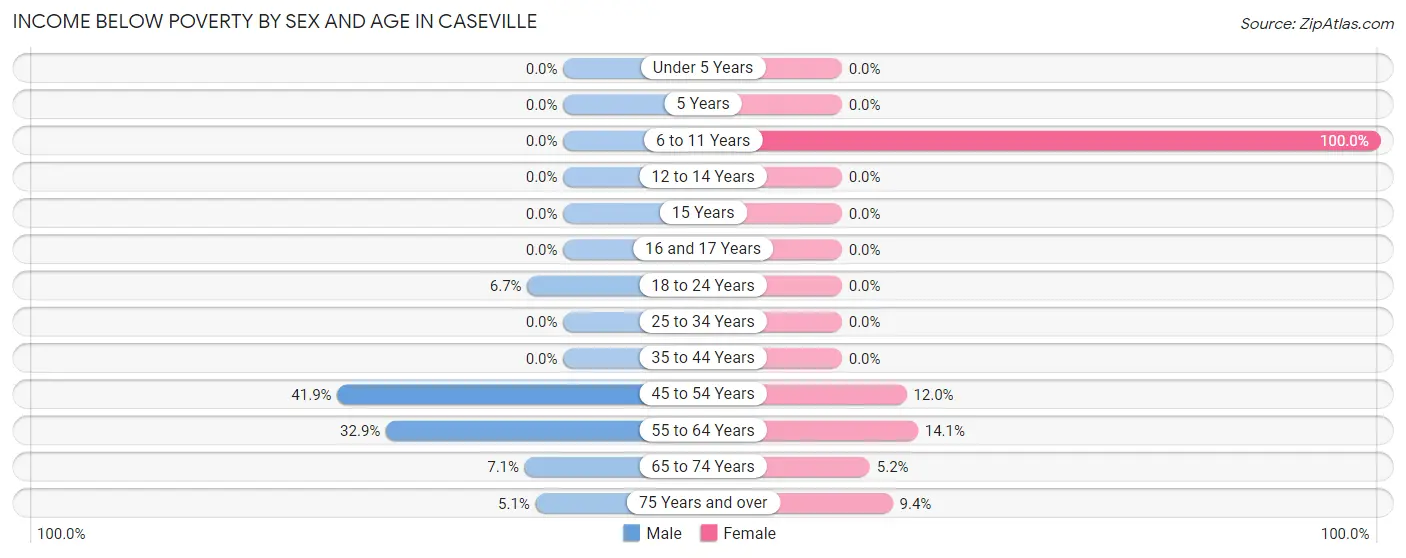
| Age Bracket | Male | Female |
| Under 5 Years | 0 (0.0%) | 0 (0.0%) |
| 5 Years | 0 (0.0%) | 0 (0.0%) |
| 6 to 11 Years | 0 (0.0%) | 3 (100.0%) |
| 12 to 14 Years | 0 (0.0%) | 0 (0.0%) |
| 15 Years | 0 (0.0%) | 0 (0.0%) |
| 16 and 17 Years | 0 (0.0%) | 0 (0.0%) |
| 18 to 24 Years | 3 (6.7%) | 0 (0.0%) |
| 25 to 34 Years | 0 (0.0%) | 0 (0.0%) |
| 35 to 44 Years | 0 (0.0%) | 0 (0.0%) |
| 45 to 54 Years | 13 (41.9%) | 3 (12.0%) |
| 55 to 64 Years | 25 (32.9%) | 11 (14.1%) |
| 65 to 74 Years | 5 (7.1%) | 5 (5.2%) |
| 75 Years and over | 2 (5.1%) | 5 (9.4%) |
| Total | 48 (14.5%) | 27 (8.0%) |
Income Above Poverty by Sex and Age in Caseville
According to the poverty statistics in Caseville, males aged under 5 years and females aged 12 to 14 years are the age groups that are most secure financially, with 100.0% of males and 100.0% of females in these age groups living above the poverty line.
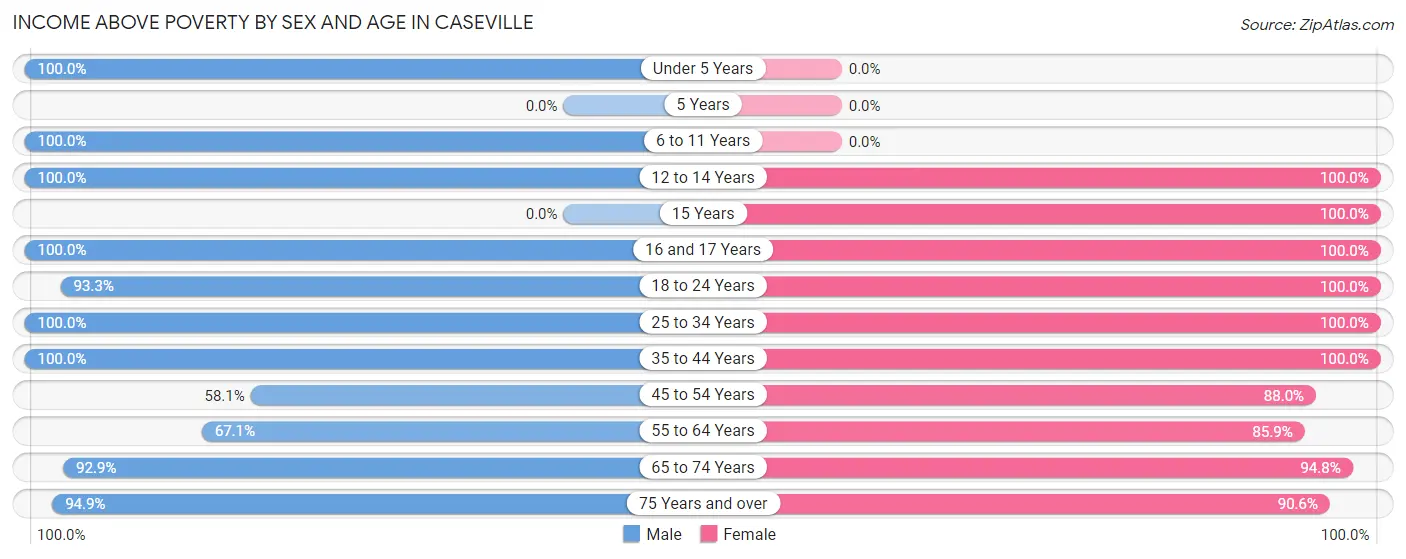
| Age Bracket | Male | Female |
| Under 5 Years | 2 (100.0%) | 0 (0.0%) |
| 5 Years | 0 (0.0%) | 0 (0.0%) |
| 6 to 11 Years | 20 (100.0%) | 0 (0.0%) |
| 12 to 14 Years | 2 (100.0%) | 9 (100.0%) |
| 15 Years | 0 (0.0%) | 2 (100.0%) |
| 16 and 17 Years | 1 (100.0%) | 3 (100.0%) |
| 18 to 24 Years | 42 (93.3%) | 21 (100.0%) |
| 25 to 34 Years | 27 (100.0%) | 42 (100.0%) |
| 35 to 44 Years | 19 (100.0%) | 5 (100.0%) |
| 45 to 54 Years | 18 (58.1%) | 22 (88.0%) |
| 55 to 64 Years | 51 (67.1%) | 67 (85.9%) |
| 65 to 74 Years | 65 (92.9%) | 91 (94.8%) |
| 75 Years and over | 37 (94.9%) | 48 (90.6%) |
| Total | 284 (85.5%) | 310 (92.0%) |
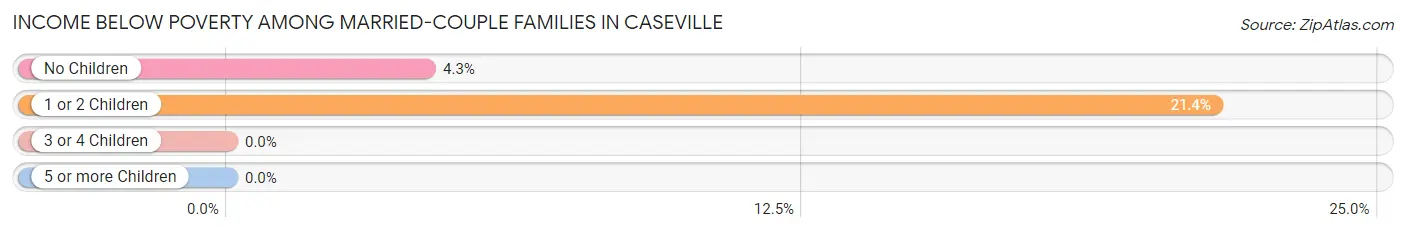
Income Below Poverty Among Married-Couple Families in Caseville
The poverty statistics for married-couple families in Caseville show that 6.1% or 8 of the total 132 families live below the poverty line. Families with 1 or 2 children have the highest poverty rate of 21.4%, comprising of 3 families. On the other hand, families with 3 or 4 children have the lowest poverty rate of 0.0%, which includes 0 families.
| Children | Above Poverty | Below Poverty |
| No Children | 111 (95.7%) | 5 (4.3%) |
| 1 or 2 Children | 11 (78.6%) | 3 (21.4%) |
| 3 or 4 Children | 2 (100.0%) | 0 (0.0%) |
| 5 or more Children | 0 (0.0%) | 0 (0.0%) |
| Total | 124 (93.9%) | 8 (6.1%) |
Income Below Poverty Among Single-Parent Households in Caseville
| Children | Single Father | Single Mother |
| No Children | 0 (0.0%) | 0 (0.0%) |
| 1 or 2 Children | 0 (0.0%) | 0 (0.0%) |
| 3 or 4 Children | 0 (0.0%) | 0 (0.0%) |
| 5 or more Children | 0 (0.0%) | 0 (0.0%) |
| Total | 0 (0.0%) | 0 (0.0%) |
Income Below Poverty Among Married-Couple vs Single-Parent Households in Caseville
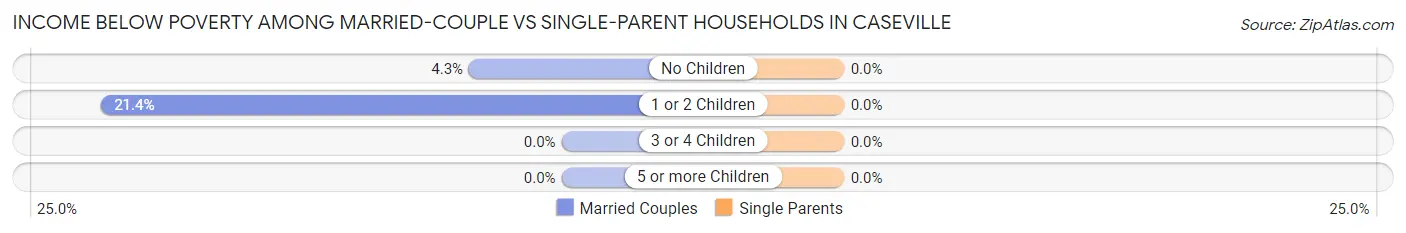
| Children | Married-Couple Families | Single-Parent Households |
| No Children | 5 (4.3%) | 0 (0.0%) |
| 1 or 2 Children | 3 (21.4%) | 0 (0.0%) |
| 3 or 4 Children | 0 (0.0%) | 0 (0.0%) |
| 5 or more Children | 0 (0.0%) | 0 (0.0%) |
| Total | 8 (6.1%) | 0 (0.0%) |
Race in Caseville
The most populous races in Caseville are White / Caucasian (656 | 97.3%), Two or more Races (16 | 2.4%), and Hispanic or Latino (3 | 0.4%).
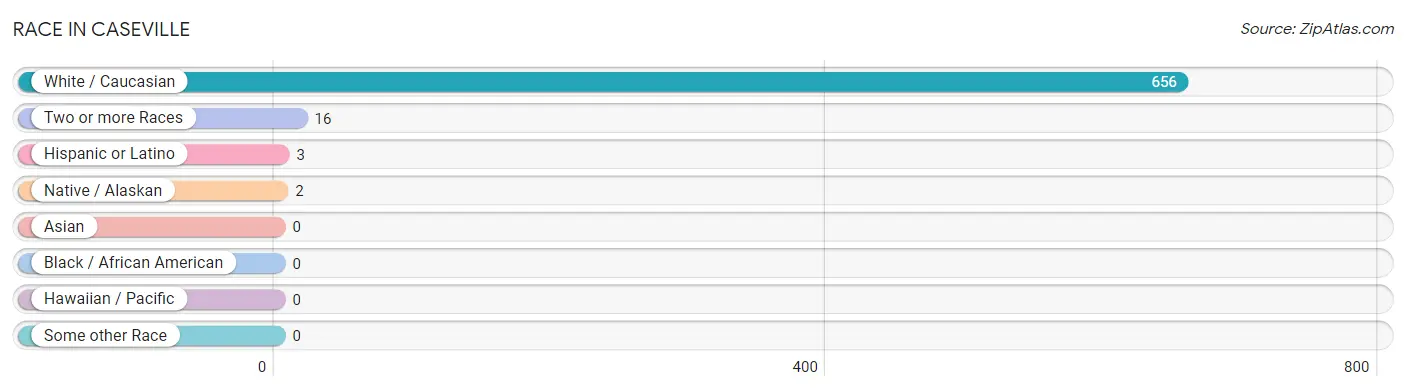
| Race | # Population | % Population |
| Asian | 0 | 0.0% |
| Black / African American | 0 | 0.0% |
| Hawaiian / Pacific | 0 | 0.0% |
| Hispanic or Latino | 3 | 0.4% |
| Native / Alaskan | 2 | 0.3% |
| White / Caucasian | 656 | 97.3% |
| Two or more Races | 16 | 2.4% |
| Some other Race | 0 | 0.0% |
| Total | 674 | 100.0% |
Ancestry in Caseville
The most populous ancestries reported in Caseville are German (207 | 30.7%), Irish (106 | 15.7%), English (90 | 13.4%), Polish (88 | 13.1%), and Italian (47 | 7.0%), together accounting for 79.8% of all Caseville residents.
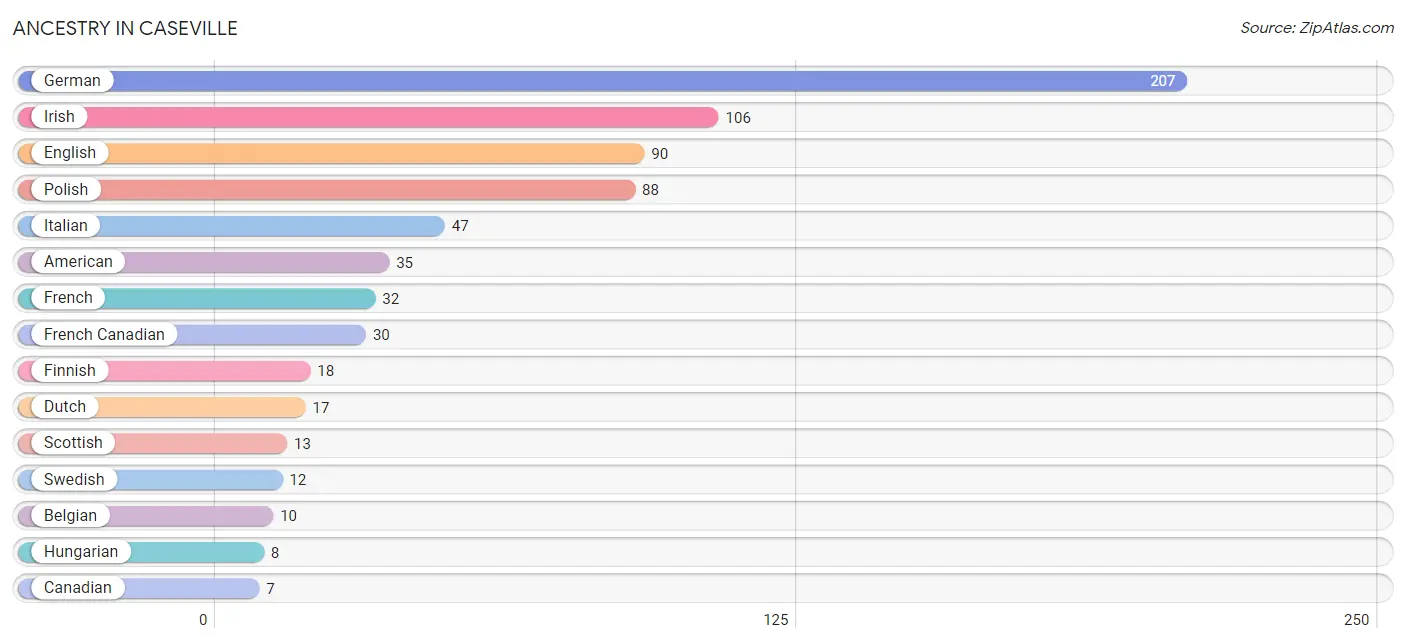
| Ancestry | # Population | % Population |
| American | 35 | 5.2% |
| Belgian | 10 | 1.5% |
| Canadian | 7 | 1.0% |
| Czech | 4 | 0.6% |
| Danish | 5 | 0.7% |
| Dutch | 17 | 2.5% |
| English | 90 | 13.4% |
| Finnish | 18 | 2.7% |
| French | 32 | 4.8% |
| French Canadian | 30 | 4.4% |
| German | 207 | 30.7% |
| Hungarian | 8 | 1.2% |
| Irish | 106 | 15.7% |
| Italian | 47 | 7.0% |
| Northern European | 2 | 0.3% |
| Norwegian | 7 | 1.0% |
| Ottawa | 2 | 0.3% |
| Polish | 88 | 13.1% |
| Russian | 7 | 1.0% |
| Scotch-Irish | 2 | 0.3% |
| Scottish | 13 | 1.9% |
| Slavic | 3 | 0.4% |
| Spanish | 3 | 0.4% |
| Swedish | 12 | 1.8% |
| Welsh | 2 | 0.3% |
| Yugoslavian | 4 | 0.6% | View All 26 Rows |
Immigrants in Caseville
The most numerous immigrant groups reported in Caseville came from Canada (21 | 3.1%), Europe (5 | 0.7%), Italy (5 | 0.7%), and Southern Europe (5 | 0.7%), together accounting for 5.3% of all Caseville residents.
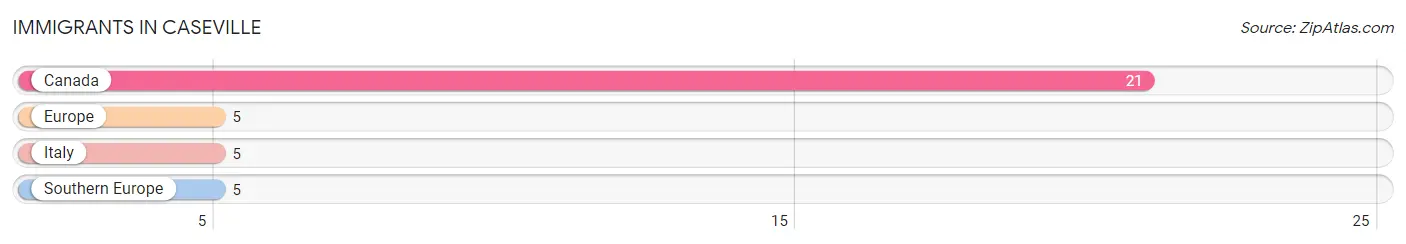
| Immigration Origin | # Population | % Population |
| Canada | 21 | 3.1% |
| Europe | 5 | 0.7% |
| Italy | 5 | 0.7% |
| Southern Europe | 5 | 0.7% | View All 4 Rows |
Sex and Age in Caseville
Sex and Age in Caseville
The most populous age groups in Caseville are 70 to 74 Years (55 | 16.6%) for men and 60 to 64 Years (52 | 15.2%) for women.
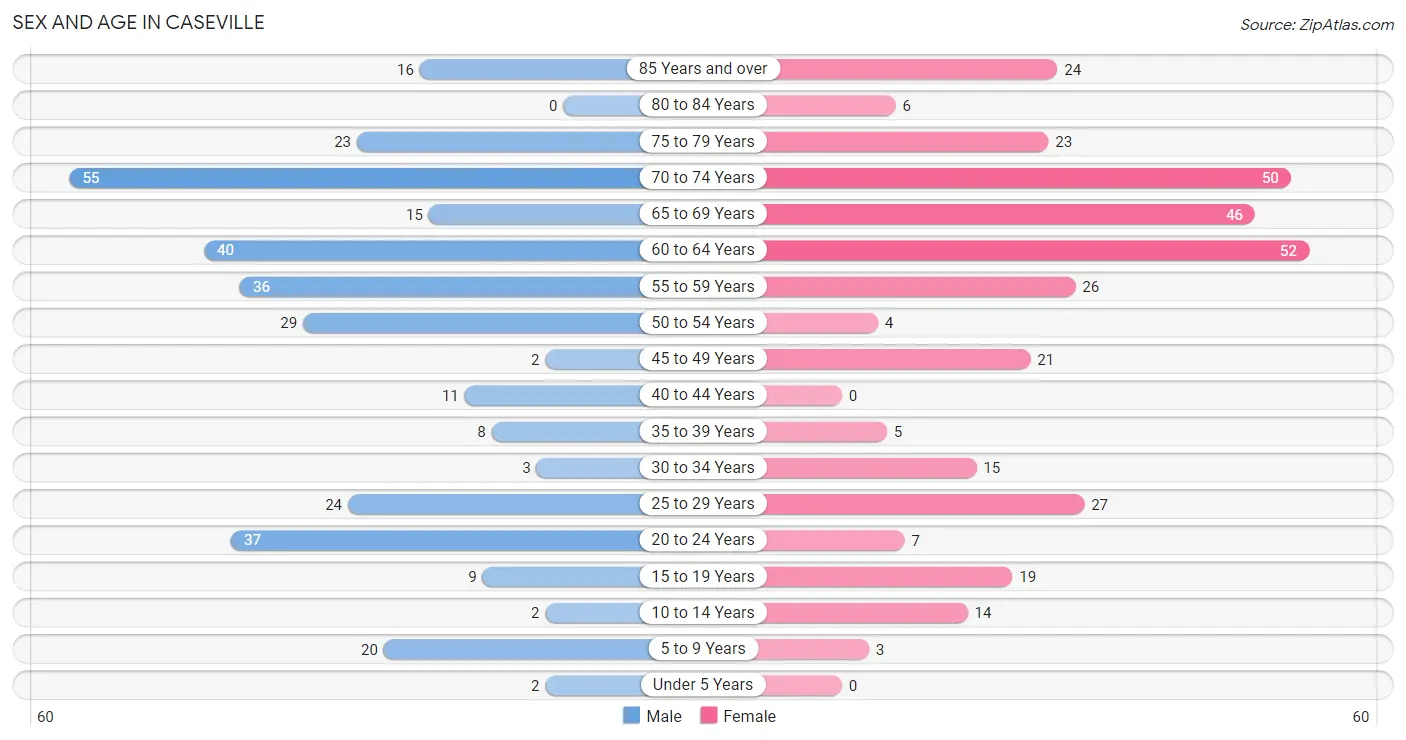
| Age Bracket | Male | Female |
| Under 5 Years | 2 (0.6%) | 0 (0.0%) |
| 5 to 9 Years | 20 (6.0%) | 3 (0.9%) |
| 10 to 14 Years | 2 (0.6%) | 14 (4.1%) |
| 15 to 19 Years | 9 (2.7%) | 19 (5.6%) |
| 20 to 24 Years | 37 (11.1%) | 7 (2.1%) |
| 25 to 29 Years | 24 (7.2%) | 27 (7.9%) |
| 30 to 34 Years | 3 (0.9%) | 15 (4.4%) |
| 35 to 39 Years | 8 (2.4%) | 5 (1.5%) |
| 40 to 44 Years | 11 (3.3%) | 0 (0.0%) |
| 45 to 49 Years | 2 (0.6%) | 21 (6.1%) |
| 50 to 54 Years | 29 (8.7%) | 4 (1.2%) |
| 55 to 59 Years | 36 (10.8%) | 26 (7.6%) |
| 60 to 64 Years | 40 (12.0%) | 52 (15.2%) |
| 65 to 69 Years | 15 (4.5%) | 46 (13.5%) |
| 70 to 74 Years | 55 (16.6%) | 50 (14.6%) |
| 75 to 79 Years | 23 (6.9%) | 23 (6.7%) |
| 80 to 84 Years | 0 (0.0%) | 6 (1.8%) |
| 85 Years and over | 16 (4.8%) | 24 (7.0%) |
| Total | 332 (100.0%) | 342 (100.0%) |
Families and Households in Caseville
Median Family Size in Caseville
The median family size in Caseville is 2.31 persons per family, with married-couple families (132 | 76.3%) accounting for the largest median family size of 2.33 persons per family. On the other hand, single male/father families (6 | 3.5%) represent the smallest median family size with 1.83 persons per family.
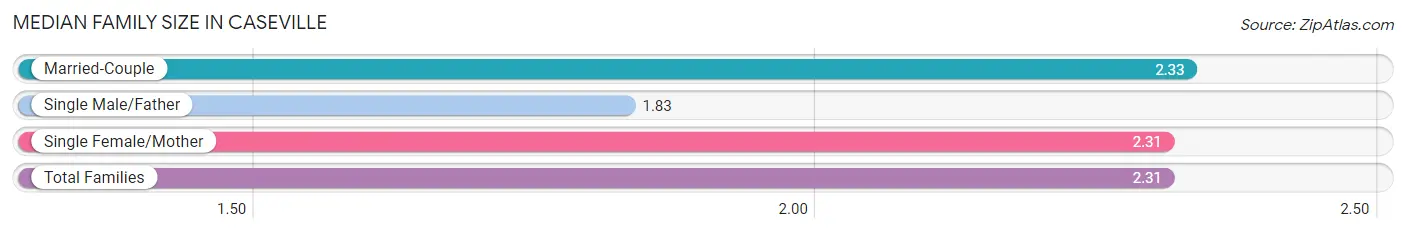
| Family Type | # Families | Family Size |
| Married-Couple | 132 (76.3%) | 2.33 |
| Single Male/Father | 6 (3.5%) | 1.83 |
| Single Female/Mother | 35 (20.2%) | 2.31 |
| Total Families | 173 (100.0%) | 2.31 |
Median Household Size in Caseville
The median household size in Caseville is 1.81 persons per household, with single male/father households (6 | 1.6%) accounting for the largest median household size of 3.5 persons per household. non-family households (200 | 53.6%) represent the smallest median household size with 1.32 persons per household.
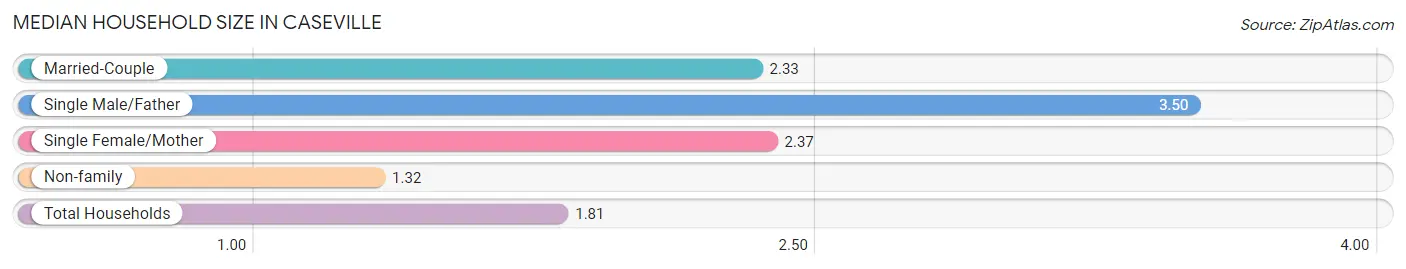
| Household Type | # Households | Household Size |
| Married-Couple | 132 (35.4%) | 2.33 |
| Single Male/Father | 6 (1.6%) | 3.50 |
| Single Female/Mother | 35 (9.4%) | 2.37 |
| Non-family | 200 (53.6%) | 1.32 |
| Total Households | 373 (100.0%) | 1.81 |
Household Size by Marriage Status in Caseville
Out of a total of 373 households in Caseville, 173 (46.4%) are family households, while 200 (53.6%) are nonfamily households. The most numerous type of family households are 2-person households, comprising 141, and the most common type of nonfamily households are 1-person households, comprising 142.
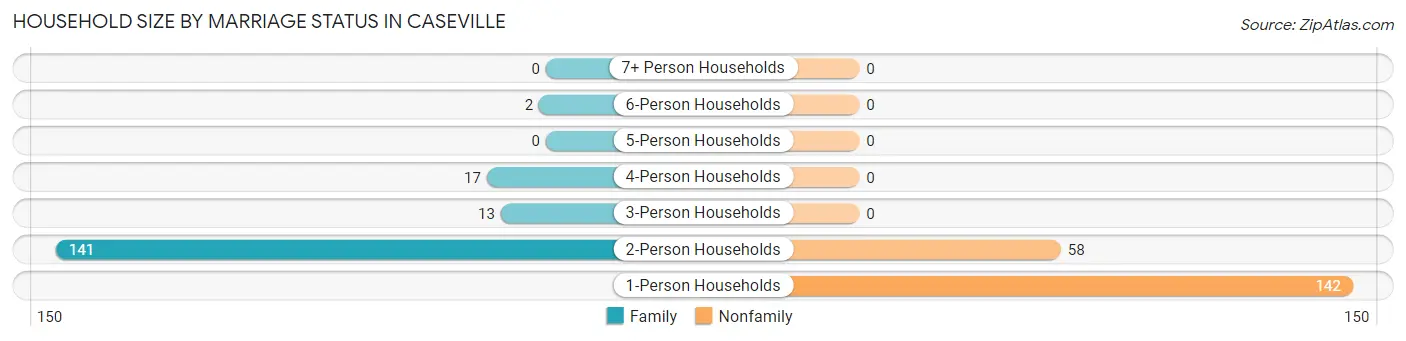
| Household Size | Family Households | Nonfamily Households |
| 1-Person Households | - | 142 (38.1%) |
| 2-Person Households | 141 (37.8%) | 58 (15.5%) |
| 3-Person Households | 13 (3.5%) | 0 (0.0%) |
| 4-Person Households | 17 (4.6%) | 0 (0.0%) |
| 5-Person Households | 0 (0.0%) | 0 (0.0%) |
| 6-Person Households | 2 (0.5%) | 0 (0.0%) |
| 7+ Person Households | 0 (0.0%) | 0 (0.0%) |
| Total | 173 (46.4%) | 200 (53.6%) |
Female Fertility in Caseville
Fertility by Age in Caseville
| Age Bracket | Women with Births | Births / 1,000 Women |
| 15 to 19 years | 0 (0.0%) | 0.0 |
| 20 to 34 years | 0 (0.0%) | 0.0 |
| 35 to 50 years | 0 (0.0%) | 0.0 |
| Total | 0 (0.0%) | 0.0 |
Fertility by Age by Marriage Status in Caseville
| Age Bracket | Married | Unmarried |
| 15 to 19 years | 0 (0.0%) | 0 (0.0%) |
| 20 to 34 years | 0 (0.0%) | 0 (0.0%) |
| 35 to 50 years | 0 (0.0%) | 0 (0.0%) |
| Total | 0 (0.0%) | 0 (0.0%) |
Fertility by Education in Caseville
| Educational Attainment | Women with Births | Births / 1,000 Women |
| Less than High School | 0 (0.0%) | 0.0 |
| High School Diploma | 0 (0.0%) | 0.0 |
| College or Associate's Degree | 0 (0.0%) | 0.0 |
| Bachelor's Degree | 0 (0.0%) | 0.0 |
| Graduate Degree | 0 (0.0%) | 0.0 |
| Total | 0 (0.0%) | 0.0 |
Fertility by Education by Marriage Status in Caseville
| Educational Attainment | Married | Unmarried |
| Less than High School | 0 (0.0%) | 0 (0.0%) |
| High School Diploma | 0 (0.0%) | 0 (0.0%) |
| College or Associate's Degree | 0 (0.0%) | 0 (0.0%) |
| Bachelor's Degree | 0 (0.0%) | 0 (0.0%) |
| Graduate Degree | 0 (0.0%) | 0 (0.0%) |
| Total | 0 (0.0%) | 0 (0.0%) |
Employment Characteristics in Caseville
Employment by Class of Employer in Caseville
Among the 259 employed individuals in Caseville, private company employees (219 | 84.6%), self-employed (not incorporated) (20 | 7.7%), and local government employees (12 | 4.6%) make up the most common classes of employment.
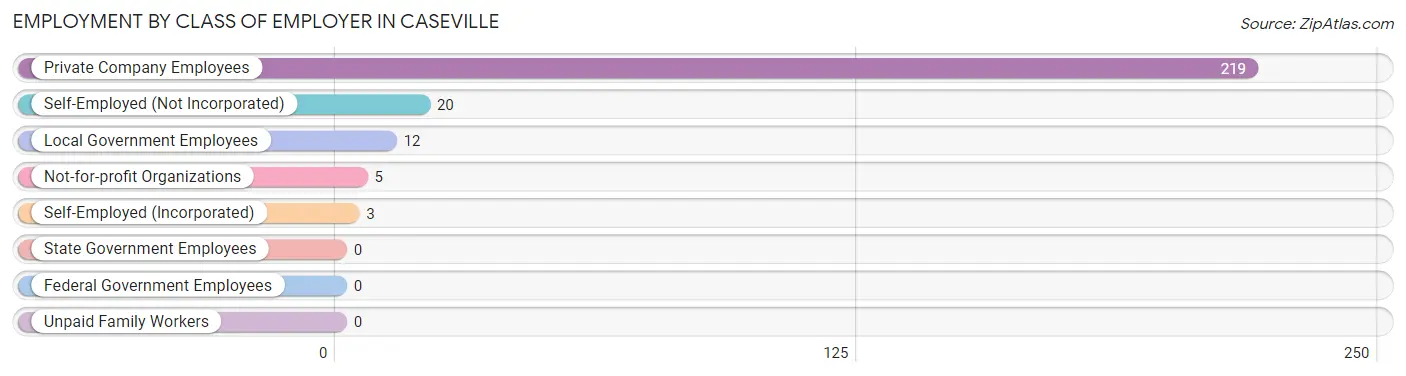
| Employer Class | # Employees | % Employees |
| Private Company Employees | 219 | 84.6% |
| Self-Employed (Incorporated) | 3 | 1.2% |
| Self-Employed (Not Incorporated) | 20 | 7.7% |
| Not-for-profit Organizations | 5 | 1.9% |
| Local Government Employees | 12 | 4.6% |
| State Government Employees | 0 | 0.0% |
| Federal Government Employees | 0 | 0.0% |
| Unpaid Family Workers | 0 | 0.0% |
| Total | 259 | 100.0% |
Employment Status by Age in Caseville
According to the labor force statistics for Caseville, out of the total population over 16 years of age (631), 42.8% or 270 individuals are in the labor force, with 3.7% or 10 of them unemployed. The age group with the highest labor force participation rate is 25 to 29 years, with 94.1% or 48 individuals in the labor force. Within the labor force, the 55 to 59 years age range has the highest percentage of unemployed individuals, with 10.9% or 5 of them being unemployed.
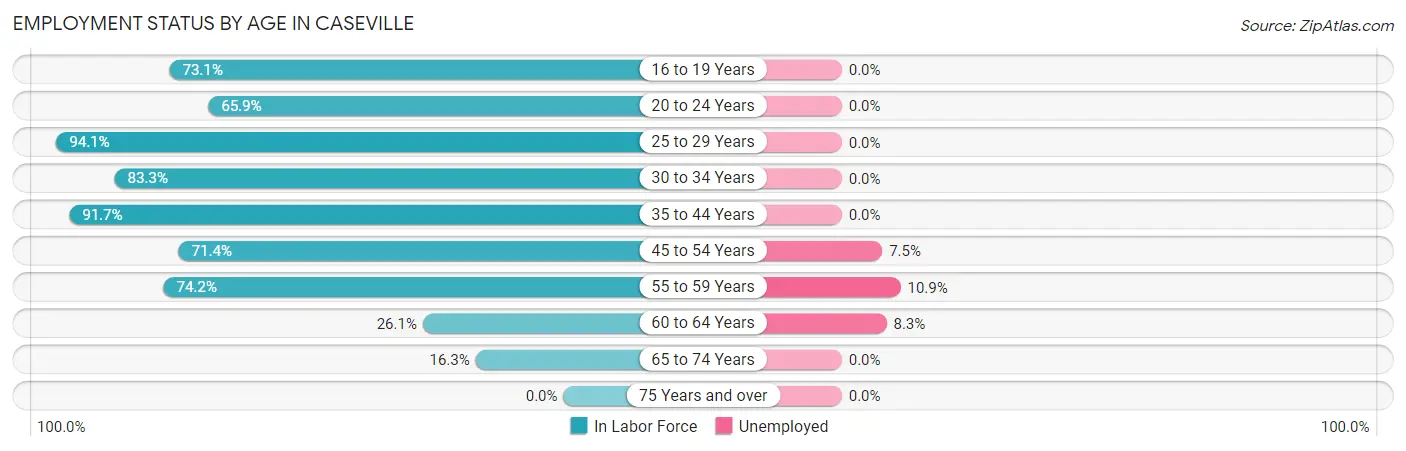
| Age Bracket | In Labor Force | Unemployed |
| 16 to 19 Years | 19 (73.1%) | 0 (0.0%) |
| 20 to 24 Years | 29 (65.9%) | 0 (0.0%) |
| 25 to 29 Years | 48 (94.1%) | 0 (0.0%) |
| 30 to 34 Years | 15 (83.3%) | 0 (0.0%) |
| 35 to 44 Years | 22 (91.7%) | 0 (0.0%) |
| 45 to 54 Years | 40 (71.4%) | 3 (7.5%) |
| 55 to 59 Years | 46 (74.2%) | 5 (10.9%) |
| 60 to 64 Years | 24 (26.1%) | 2 (8.3%) |
| 65 to 74 Years | 27 (16.3%) | 0 (0.0%) |
| 75 Years and over | 0 (0.0%) | 0 (0.0%) |
| Total | 270 (42.8%) | 10 (3.7%) |
Employment Status by Educational Attainment in Caseville
According to labor force statistics for Caseville, 64.4% of individuals (195) out of the total population between 25 and 64 years of age (303) are in the labor force, with 5.1% or 10 of them being unemployed. The group with the highest labor force participation rate are those with the educational attainment of college / associate degree, with 68.6% or 96 individuals in the labor force. Within the labor force, individuals with less than high school education have the highest percentage of unemployment, with 25.0% or 5 of them being unemployed.
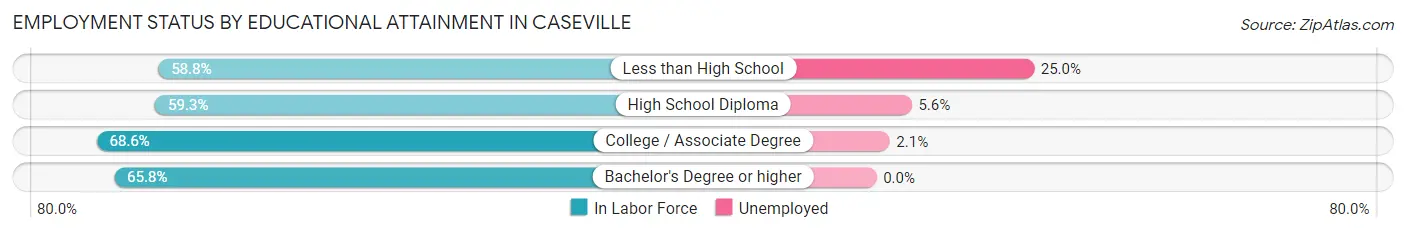
| Educational Attainment | In Labor Force | Unemployed |
| Less than High School | 20 (58.8%) | 8 (25.0%) |
| High School Diploma | 54 (59.3%) | 5 (5.6%) |
| College / Associate Degree | 96 (68.6%) | 3 (2.1%) |
| Bachelor's Degree or higher | 25 (65.8%) | 0 (0.0%) |
| Total | 195 (64.4%) | 15 (5.1%) |
Employment Occupations by Sex in Caseville
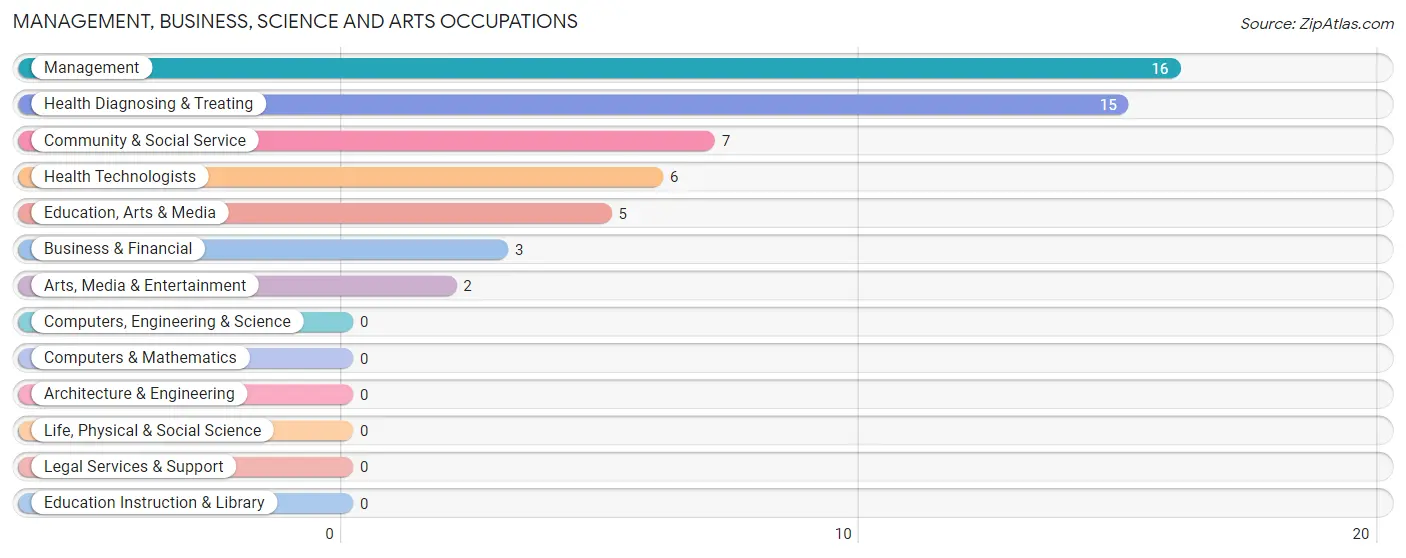
Management, Business, Science and Arts Occupations
The most common Management, Business, Science and Arts occupations in Caseville are Management (16 | 6.1%), Health Diagnosing & Treating (15 | 5.8%), Community & Social Service (7 | 2.7%), Health Technologists (6 | 2.3%), and Education, Arts & Media (5 | 1.9%).
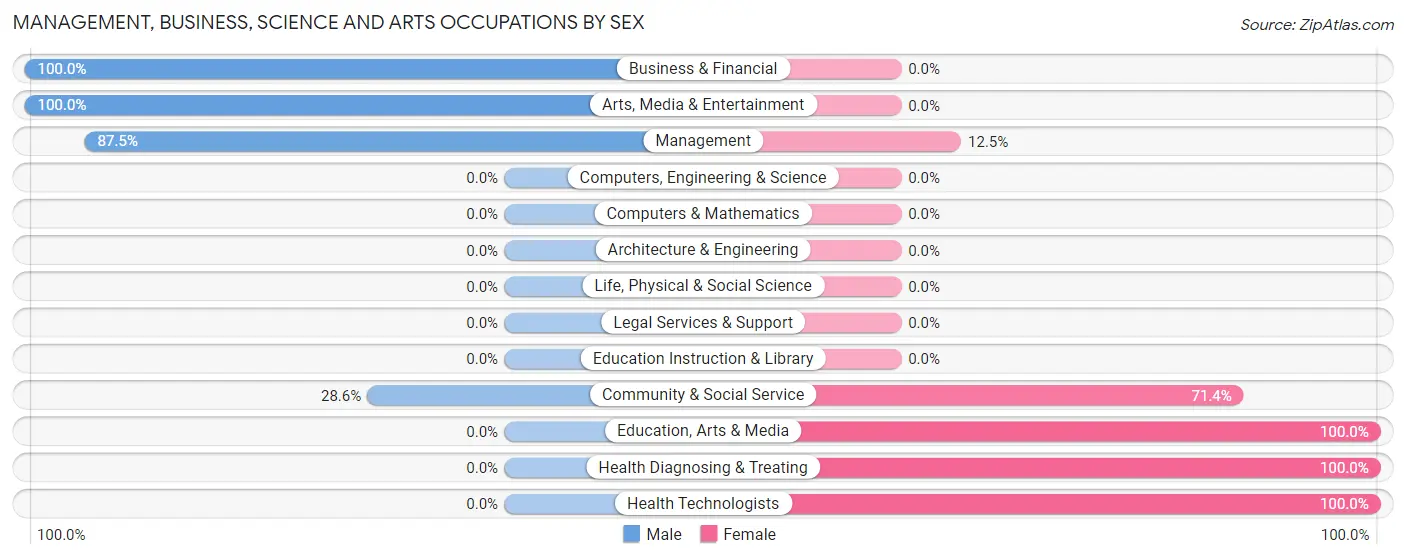
Management, Business, Science and Arts Occupations by Sex
Within the Management, Business, Science and Arts occupations in Caseville, the most male-oriented occupations are Business & Financial (100.0%), Arts, Media & Entertainment (100.0%), and Management (87.5%), while the most female-oriented occupations are Education, Arts & Media (100.0%), Health Diagnosing & Treating (100.0%), and Health Technologists (100.0%).
| Occupation | Male | Female |
| Management | 14 (87.5%) | 2 (12.5%) |
| Business & Financial | 3 (100.0%) | 0 (0.0%) |
| Computers, Engineering & Science | 0 (0.0%) | 0 (0.0%) |
| Computers & Mathematics | 0 (0.0%) | 0 (0.0%) |
| Architecture & Engineering | 0 (0.0%) | 0 (0.0%) |
| Life, Physical & Social Science | 0 (0.0%) | 0 (0.0%) |
| Community & Social Service | 2 (28.6%) | 5 (71.4%) |
| Education, Arts & Media | 0 (0.0%) | 5 (100.0%) |
| Legal Services & Support | 0 (0.0%) | 0 (0.0%) |
| Education Instruction & Library | 0 (0.0%) | 0 (0.0%) |
| Arts, Media & Entertainment | 2 (100.0%) | 0 (0.0%) |
| Health Diagnosing & Treating | 0 (0.0%) | 15 (100.0%) |
| Health Technologists | 0 (0.0%) | 6 (100.0%) |
| Total (Category) | 19 (46.3%) | 22 (53.7%) |
| Total (Overall) | 118 (45.4%) | 142 (54.6%) |
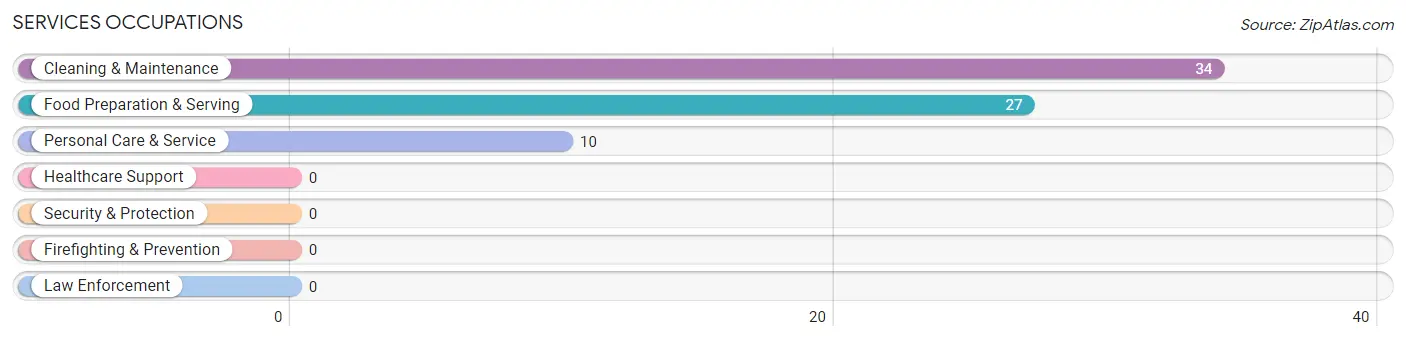
Services Occupations
The most common Services occupations in Caseville are Cleaning & Maintenance (34 | 13.1%), Food Preparation & Serving (27 | 10.4%), and Personal Care & Service (10 | 3.8%).
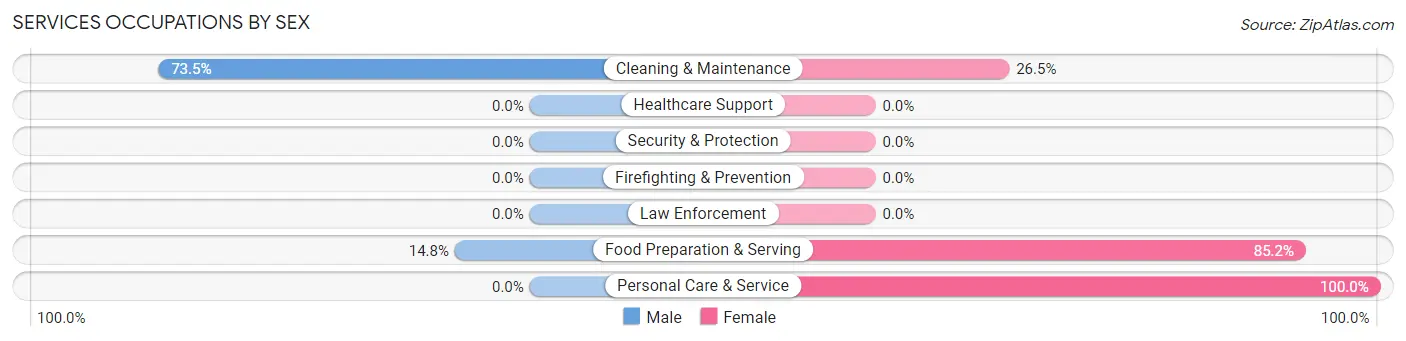
Services Occupations by Sex
Within the Services occupations in Caseville, the most male-oriented occupations are Cleaning & Maintenance (73.5%), and Food Preparation & Serving (14.8%), while the most female-oriented occupations are Personal Care & Service (100.0%), Food Preparation & Serving (85.2%), and Cleaning & Maintenance (26.5%).
| Occupation | Male | Female |
| Healthcare Support | 0 (0.0%) | 0 (0.0%) |
| Security & Protection | 0 (0.0%) | 0 (0.0%) |
| Firefighting & Prevention | 0 (0.0%) | 0 (0.0%) |
| Law Enforcement | 0 (0.0%) | 0 (0.0%) |
| Food Preparation & Serving | 4 (14.8%) | 23 (85.2%) |
| Cleaning & Maintenance | 25 (73.5%) | 9 (26.5%) |
| Personal Care & Service | 0 (0.0%) | 10 (100.0%) |
| Total (Category) | 29 (40.8%) | 42 (59.2%) |
| Total (Overall) | 118 (45.4%) | 142 (54.6%) |
Sales and Office Occupations
The most common Sales and Office occupations in Caseville are Sales & Related (44 | 16.9%), and Office & Administration (44 | 16.9%).

Sales and Office Occupations by Sex

| Occupation | Male | Female |
| Sales & Related | 14 (31.8%) | 30 (68.2%) |
| Office & Administration | 0 (0.0%) | 44 (100.0%) |
| Total (Category) | 14 (15.9%) | 74 (84.1%) |
| Total (Overall) | 118 (45.4%) | 142 (54.6%) |
Natural Resources, Construction and Maintenance Occupations
The most common Natural Resources, Construction and Maintenance occupations in Caseville are Construction & Extraction (23 | 8.8%), Farming, Fishing & Forestry (7 | 2.7%), and Installation, Maintenance & Repair (7 | 2.7%).

Natural Resources, Construction and Maintenance Occupations by Sex

| Occupation | Male | Female |
| Farming, Fishing & Forestry | 7 (100.0%) | 0 (0.0%) |
| Construction & Extraction | 23 (100.0%) | 0 (0.0%) |
| Installation, Maintenance & Repair | 7 (100.0%) | 0 (0.0%) |
| Total (Category) | 37 (100.0%) | 0 (0.0%) |
| Total (Overall) | 118 (45.4%) | 142 (54.6%) |
Production, Transportation and Moving Occupations
The most common Production, Transportation and Moving occupations in Caseville are Material Moving (13 | 5.0%), and Production (10 | 3.8%).
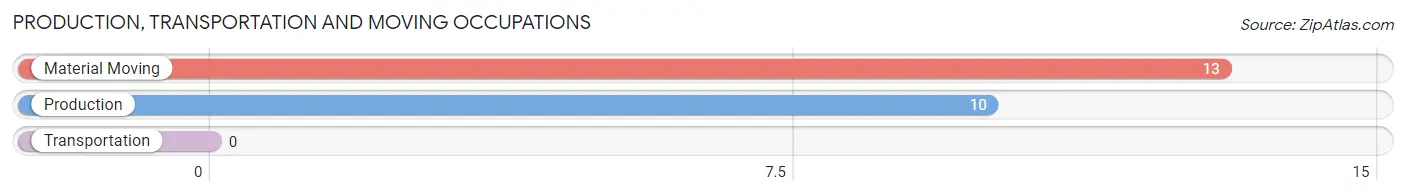
Production, Transportation and Moving Occupations by Sex

| Occupation | Male | Female |
| Production | 6 (60.0%) | 4 (40.0%) |
| Transportation | 0 (0.0%) | 0 (0.0%) |
| Material Moving | 13 (100.0%) | 0 (0.0%) |
| Total (Category) | 19 (82.6%) | 4 (17.4%) |
| Total (Overall) | 118 (45.4%) | 142 (54.6%) |
Employment Industries by Sex in Caseville
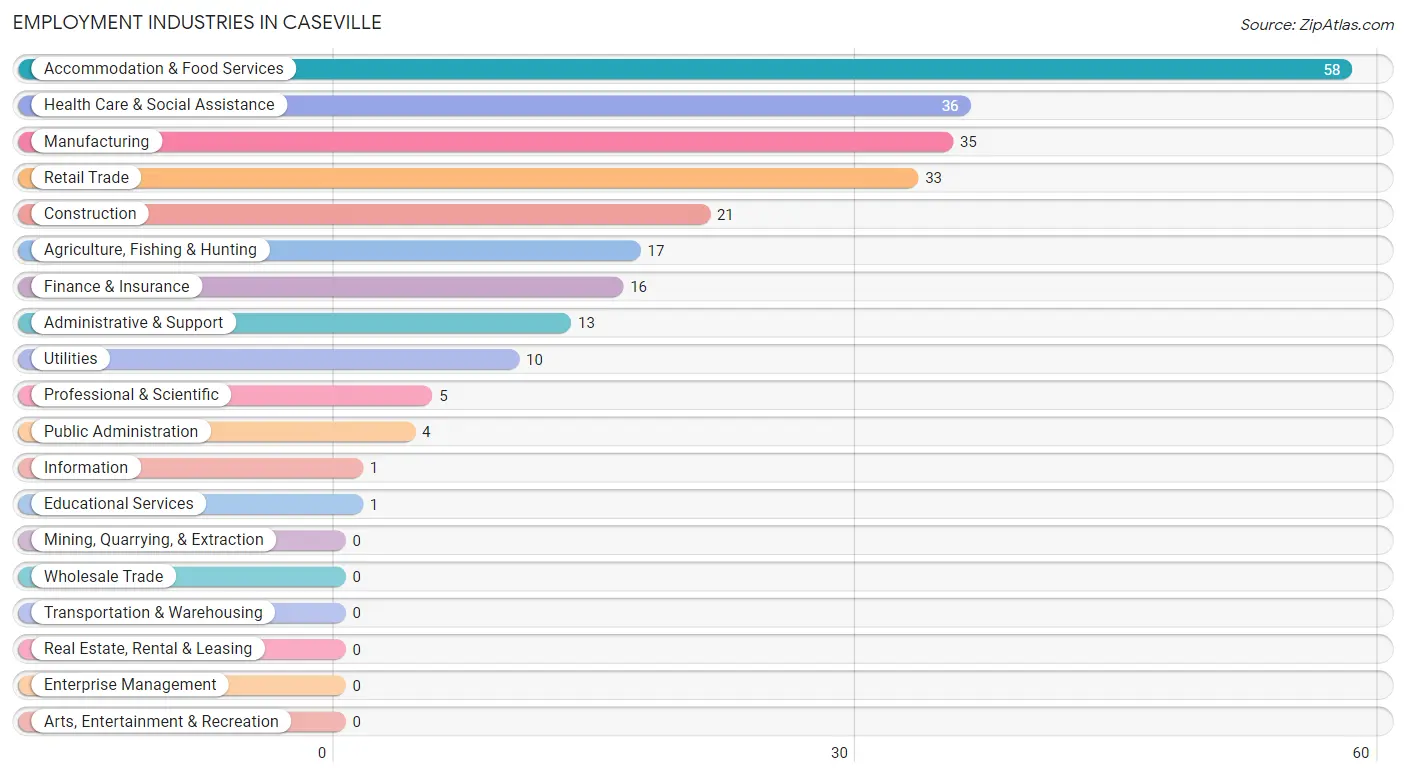
Employment Industries in Caseville
The major employment industries in Caseville include Accommodation & Food Services (58 | 22.3%), Health Care & Social Assistance (36 | 13.9%), Manufacturing (35 | 13.5%), Retail Trade (33 | 12.7%), and Construction (21 | 8.1%).
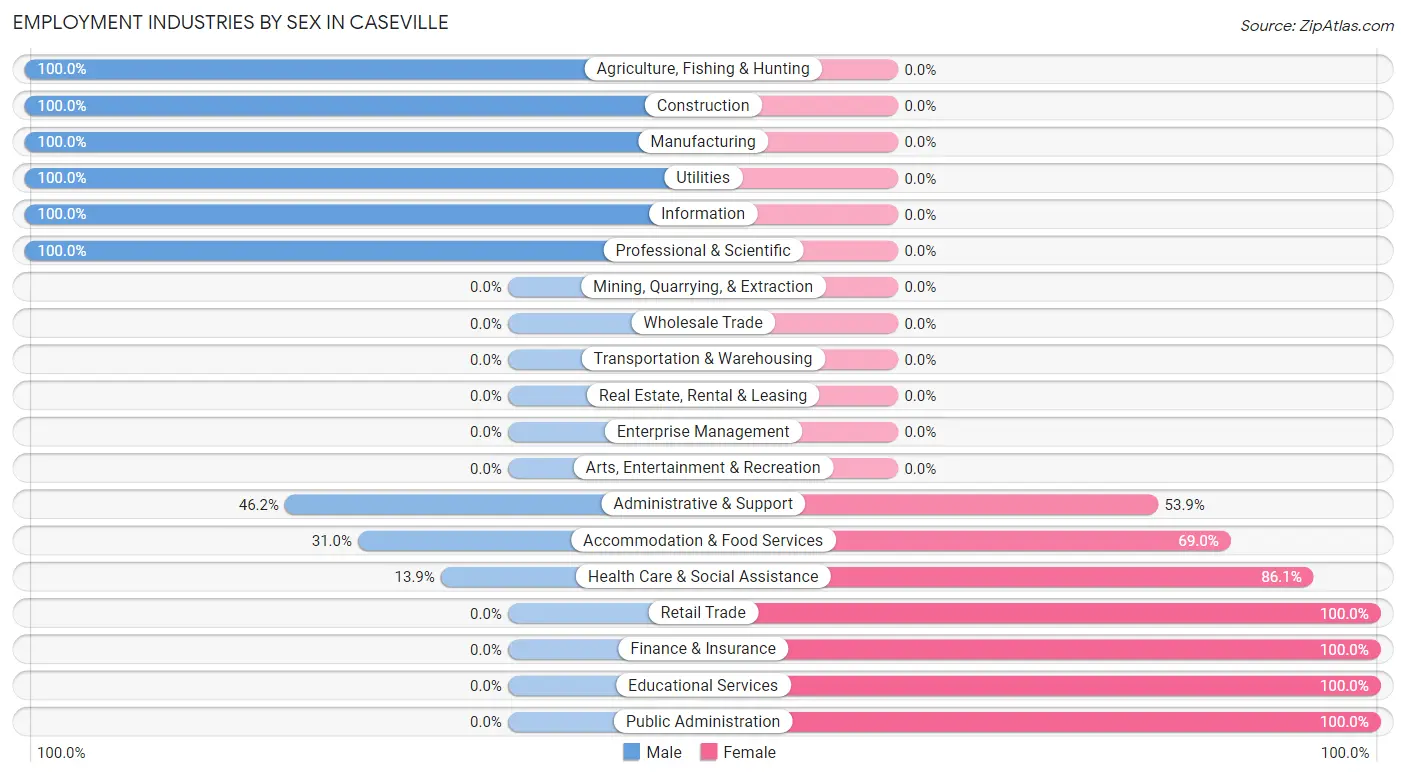
Employment Industries by Sex in Caseville
The Caseville industries that see more men than women are Agriculture, Fishing & Hunting (100.0%), Construction (100.0%), and Manufacturing (100.0%), whereas the industries that tend to have a higher number of women are Retail Trade (100.0%), Finance & Insurance (100.0%), and Educational Services (100.0%).
| Industry | Male | Female |
| Agriculture, Fishing & Hunting | 17 (100.0%) | 0 (0.0%) |
| Mining, Quarrying, & Extraction | 0 (0.0%) | 0 (0.0%) |
| Construction | 21 (100.0%) | 0 (0.0%) |
| Manufacturing | 35 (100.0%) | 0 (0.0%) |
| Wholesale Trade | 0 (0.0%) | 0 (0.0%) |
| Retail Trade | 0 (0.0%) | 33 (100.0%) |
| Transportation & Warehousing | 0 (0.0%) | 0 (0.0%) |
| Utilities | 10 (100.0%) | 0 (0.0%) |
| Information | 1 (100.0%) | 0 (0.0%) |
| Finance & Insurance | 0 (0.0%) | 16 (100.0%) |
| Real Estate, Rental & Leasing | 0 (0.0%) | 0 (0.0%) |
| Professional & Scientific | 5 (100.0%) | 0 (0.0%) |
| Enterprise Management | 0 (0.0%) | 0 (0.0%) |
| Administrative & Support | 6 (46.2%) | 7 (53.8%) |
| Educational Services | 0 (0.0%) | 1 (100.0%) |
| Health Care & Social Assistance | 5 (13.9%) | 31 (86.1%) |
| Arts, Entertainment & Recreation | 0 (0.0%) | 0 (0.0%) |
| Accommodation & Food Services | 18 (31.0%) | 40 (69.0%) |
| Public Administration | 0 (0.0%) | 4 (100.0%) |
| Total | 118 (45.4%) | 142 (54.6%) |
Education in Caseville
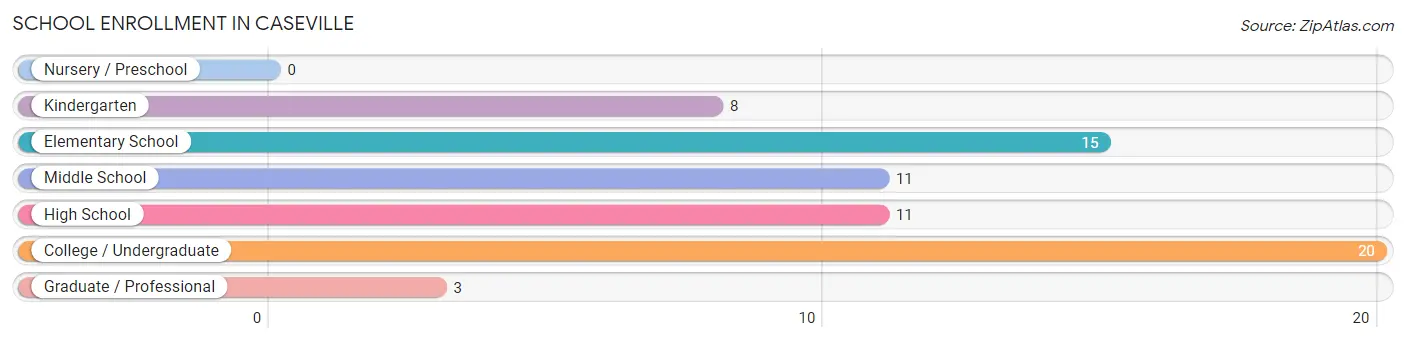
School Enrollment in Caseville
The most common levels of schooling among the 68 students in Caseville are college / undergraduate (20 | 29.4%), elementary school (15 | 22.1%), and middle school (11 | 16.2%).
| School Level | # Students | % Students |
| Nursery / Preschool | 0 | 0.0% |
| Kindergarten | 8 | 11.8% |
| Elementary School | 15 | 22.1% |
| Middle School | 11 | 16.2% |
| High School | 11 | 16.2% |
| College / Undergraduate | 20 | 29.4% |
| Graduate / Professional | 3 | 4.4% |
| Total | 68 | 100.0% |
School Enrollment by Age by Funding Source in Caseville
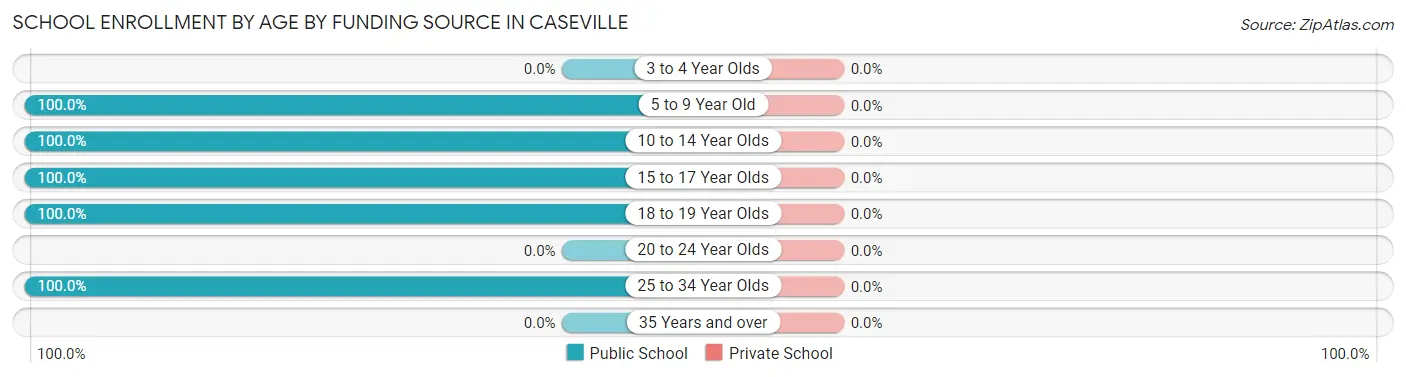
| Age Bracket | Public School | Private School |
| 3 to 4 Year Olds | 0 (0.0%) | 0 (0.0%) |
| 5 to 9 Year Old | 23 (100.0%) | 0 (0.0%) |
| 10 to 14 Year Olds | 16 (100.0%) | 0 (0.0%) |
| 15 to 17 Year Olds | 6 (100.0%) | 0 (0.0%) |
| 18 to 19 Year Olds | 16 (100.0%) | 0 (0.0%) |
| 20 to 24 Year Olds | 0 (0.0%) | 0 (0.0%) |
| 25 to 34 Year Olds | 7 (100.0%) | 0 (0.0%) |
| 35 Years and over | 0 (0.0%) | 0 (0.0%) |
| Total | 68 (100.0%) | 0 (0.0%) |
Educational Attainment by Field of Study in Caseville
Business (19 | 26.0%), arts & humanities (19 | 26.0%), bio, nature & agricultural (10 | 13.7%), education (10 | 13.7%), and literature & languages (4 | 5.5%) are the most common fields of study among 73 individuals in Caseville who have obtained a bachelor's degree or higher.
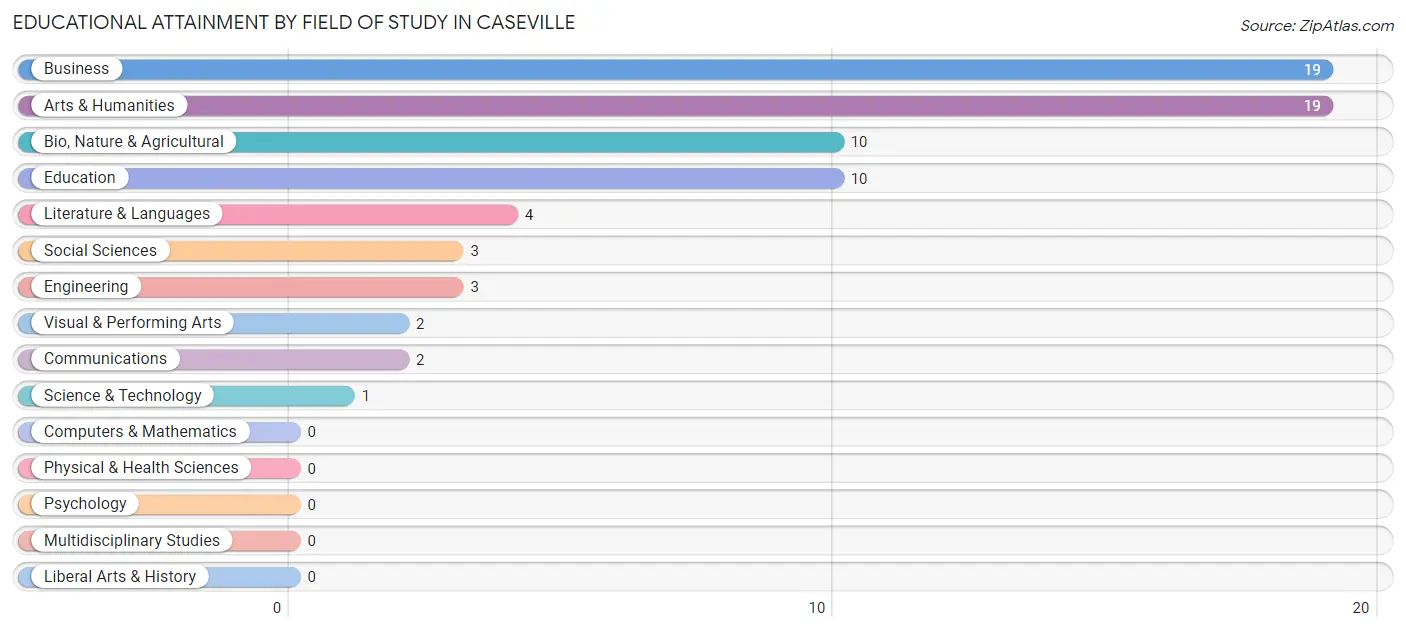
| Field of Study | # Graduates | % Graduates |
| Computers & Mathematics | 0 | 0.0% |
| Bio, Nature & Agricultural | 10 | 13.7% |
| Physical & Health Sciences | 0 | 0.0% |
| Psychology | 0 | 0.0% |
| Social Sciences | 3 | 4.1% |
| Engineering | 3 | 4.1% |
| Multidisciplinary Studies | 0 | 0.0% |
| Science & Technology | 1 | 1.4% |
| Business | 19 | 26.0% |
| Education | 10 | 13.7% |
| Literature & Languages | 4 | 5.5% |
| Liberal Arts & History | 0 | 0.0% |
| Visual & Performing Arts | 2 | 2.7% |
| Communications | 2 | 2.7% |
| Arts & Humanities | 19 | 26.0% |
| Total | 73 | 100.0% |
Transportation & Commute in Caseville
Vehicle Availability by Sex in Caseville
The most prevalent vehicle ownership categories in Caseville are males with 2 vehicles (64, accounting for 54.2%) and females with 2 vehicles (59, making up 45.4%).
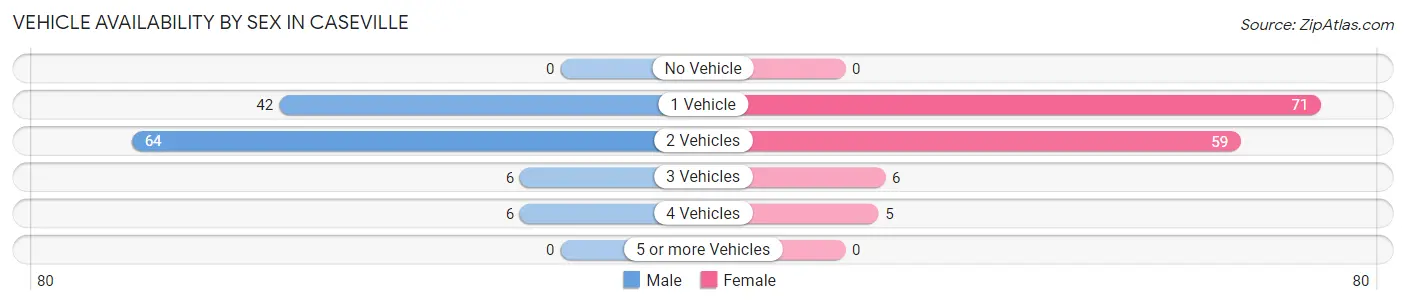
| Vehicles Available | Male | Female |
| No Vehicle | 0 (0.0%) | 0 (0.0%) |
| 1 Vehicle | 42 (35.6%) | 71 (50.3%) |
| 2 Vehicles | 64 (54.2%) | 59 (41.8%) |
| 3 Vehicles | 6 (5.1%) | 6 (4.3%) |
| 4 Vehicles | 6 (5.1%) | 5 (3.5%) |
| 5 or more Vehicles | 0 (0.0%) | 0 (0.0%) |
| Total | 118 (100.0%) | 141 (100.0%) |
Commute Time in Caseville
The most frequently occuring commute durations in Caseville are 15 to 19 minutes (67 commuters, 26.7%), 30 to 34 minutes (66 commuters, 26.3%), and 10 to 14 minutes (29 commuters, 11.6%).
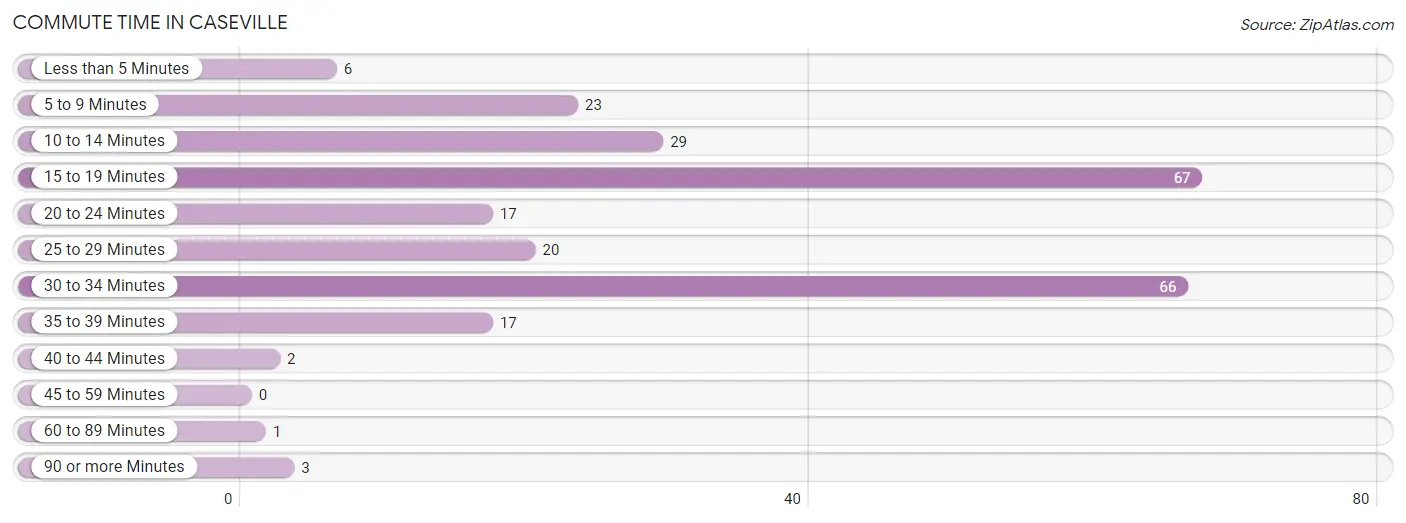
| Commute Time | # Commuters | % Commuters |
| Less than 5 Minutes | 6 | 2.4% |
| 5 to 9 Minutes | 23 | 9.2% |
| 10 to 14 Minutes | 29 | 11.6% |
| 15 to 19 Minutes | 67 | 26.7% |
| 20 to 24 Minutes | 17 | 6.8% |
| 25 to 29 Minutes | 20 | 8.0% |
| 30 to 34 Minutes | 66 | 26.3% |
| 35 to 39 Minutes | 17 | 6.8% |
| 40 to 44 Minutes | 2 | 0.8% |
| 45 to 59 Minutes | 0 | 0.0% |
| 60 to 89 Minutes | 1 | 0.4% |
| 90 or more Minutes | 3 | 1.2% |
Commute Time by Sex in Caseville
The most common commute times in Caseville are 15 to 19 minutes (34 commuters, 30.1%) for males and 30 to 34 minutes (43 commuters, 31.2%) for females.
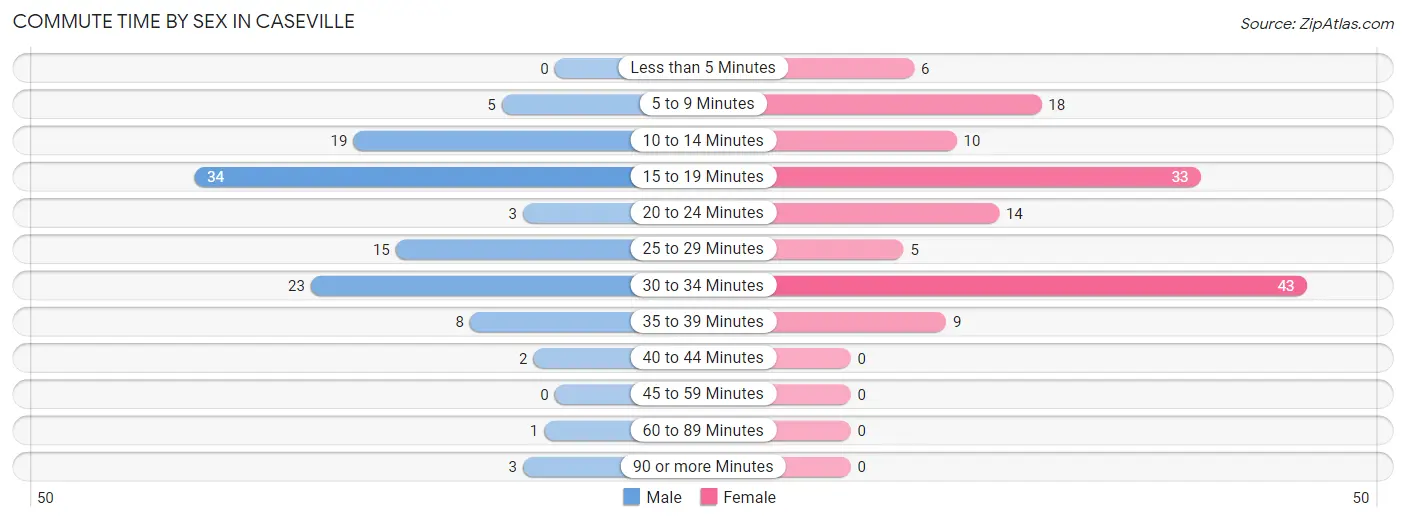
| Commute Time | Male | Female |
| Less than 5 Minutes | 0 (0.0%) | 6 (4.3%) |
| 5 to 9 Minutes | 5 (4.4%) | 18 (13.0%) |
| 10 to 14 Minutes | 19 (16.8%) | 10 (7.2%) |
| 15 to 19 Minutes | 34 (30.1%) | 33 (23.9%) |
| 20 to 24 Minutes | 3 (2.6%) | 14 (10.1%) |
| 25 to 29 Minutes | 15 (13.3%) | 5 (3.6%) |
| 30 to 34 Minutes | 23 (20.3%) | 43 (31.2%) |
| 35 to 39 Minutes | 8 (7.1%) | 9 (6.5%) |
| 40 to 44 Minutes | 2 (1.8%) | 0 (0.0%) |
| 45 to 59 Minutes | 0 (0.0%) | 0 (0.0%) |
| 60 to 89 Minutes | 1 (0.9%) | 0 (0.0%) |
| 90 or more Minutes | 3 (2.6%) | 0 (0.0%) |
Time of Departure to Work by Sex in Caseville
The most frequent times of departure to work in Caseville are 6:00 AM to 6:29 AM (33, 29.2%) for males and 7:00 AM to 7:29 AM (44, 31.9%) for females.
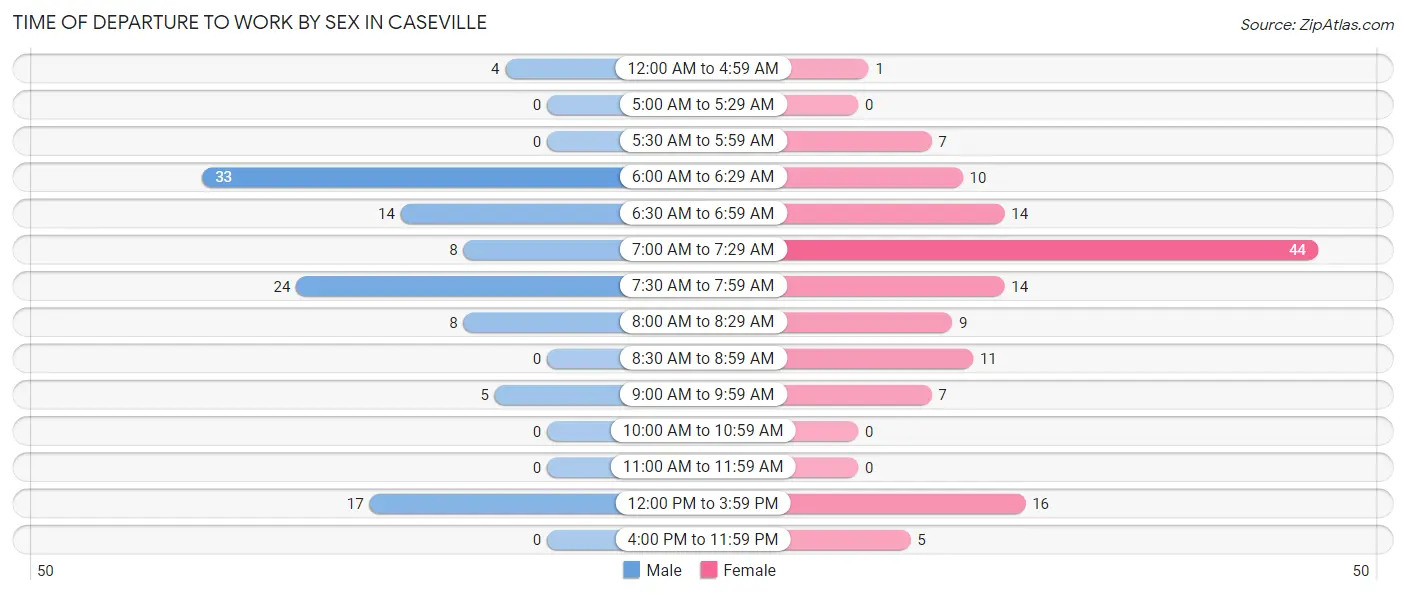
| Time of Departure | Male | Female |
| 12:00 AM to 4:59 AM | 4 (3.5%) | 1 (0.7%) |
| 5:00 AM to 5:29 AM | 0 (0.0%) | 0 (0.0%) |
| 5:30 AM to 5:59 AM | 0 (0.0%) | 7 (5.1%) |
| 6:00 AM to 6:29 AM | 33 (29.2%) | 10 (7.2%) |
| 6:30 AM to 6:59 AM | 14 (12.4%) | 14 (10.1%) |
| 7:00 AM to 7:29 AM | 8 (7.1%) | 44 (31.9%) |
| 7:30 AM to 7:59 AM | 24 (21.2%) | 14 (10.1%) |
| 8:00 AM to 8:29 AM | 8 (7.1%) | 9 (6.5%) |
| 8:30 AM to 8:59 AM | 0 (0.0%) | 11 (8.0%) |
| 9:00 AM to 9:59 AM | 5 (4.4%) | 7 (5.1%) |
| 10:00 AM to 10:59 AM | 0 (0.0%) | 0 (0.0%) |
| 11:00 AM to 11:59 AM | 0 (0.0%) | 0 (0.0%) |
| 12:00 PM to 3:59 PM | 17 (15.0%) | 16 (11.6%) |
| 4:00 PM to 11:59 PM | 0 (0.0%) | 5 (3.6%) |
| Total | 113 (100.0%) | 138 (100.0%) |
Housing Occupancy in Caseville
Occupancy by Ownership in Caseville
Of the total 373 dwellings in Caseville, owner-occupied units account for 271 (72.7%), while renter-occupied units make up 102 (27.4%).
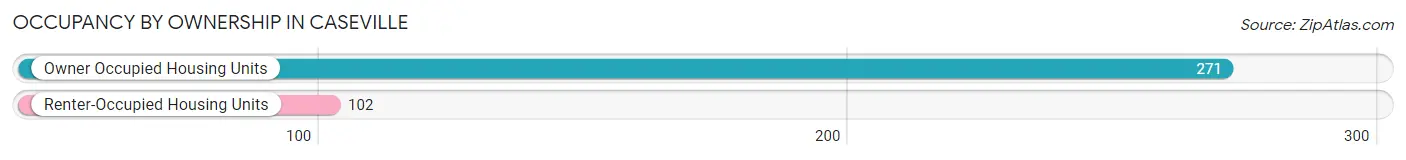
| Occupancy | # Housing Units | % Housing Units |
| Owner Occupied Housing Units | 271 | 72.7% |
| Renter-Occupied Housing Units | 102 | 27.4% |
| Total Occupied Housing Units | 373 | 100.0% |
Occupancy by Household Size in Caseville
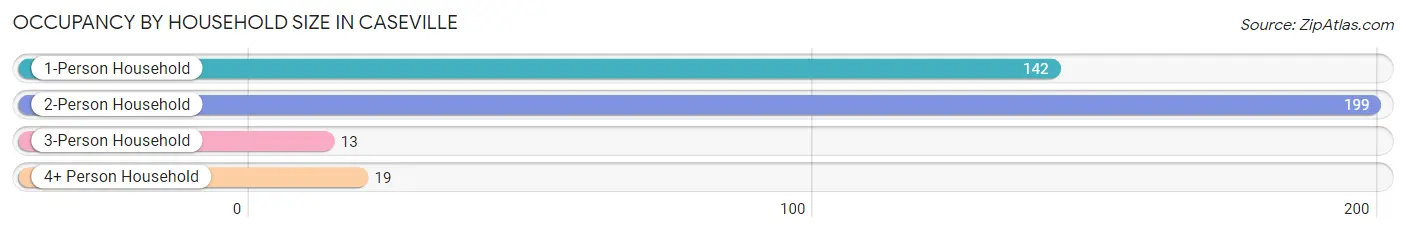
| Household Size | # Housing Units | % Housing Units |
| 1-Person Household | 142 | 38.1% |
| 2-Person Household | 199 | 53.3% |
| 3-Person Household | 13 | 3.5% |
| 4+ Person Household | 19 | 5.1% |
| Total Housing Units | 373 | 100.0% |
Occupancy by Ownership by Household Size in Caseville
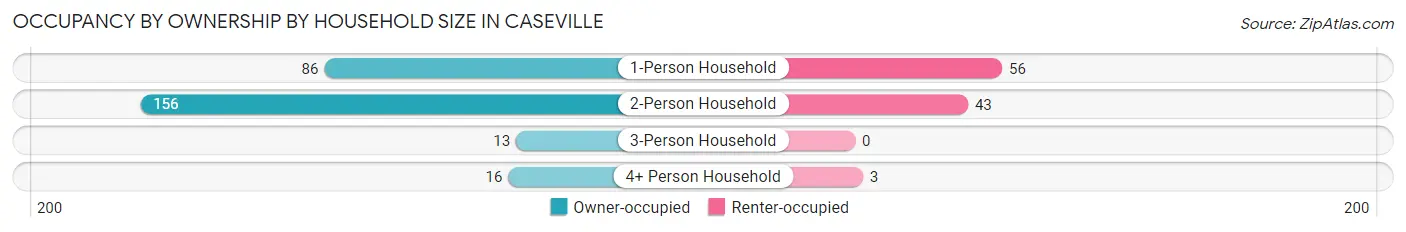
| Household Size | Owner-occupied | Renter-occupied |
| 1-Person Household | 86 (60.6%) | 56 (39.4%) |
| 2-Person Household | 156 (78.4%) | 43 (21.6%) |
| 3-Person Household | 13 (100.0%) | 0 (0.0%) |
| 4+ Person Household | 16 (84.2%) | 3 (15.8%) |
| Total Housing Units | 271 (72.7%) | 102 (27.4%) |
Occupancy by Educational Attainment in Caseville
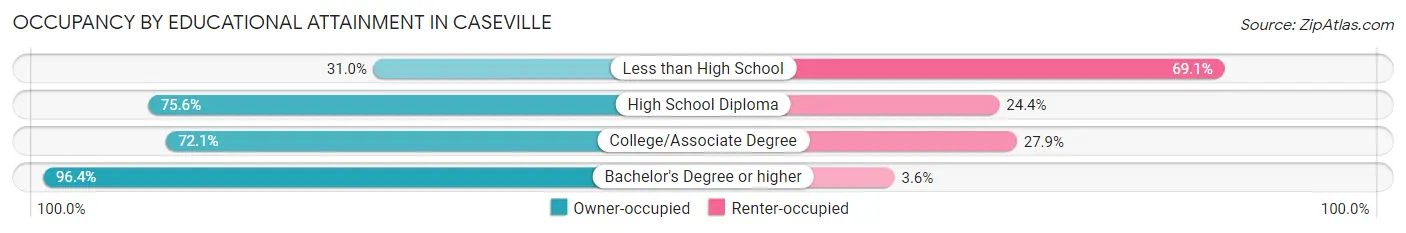
| Household Size | Owner-occupied | Renter-occupied |
| Less than High School | 13 (30.9%) | 29 (69.1%) |
| High School Diploma | 130 (75.6%) | 42 (24.4%) |
| College/Associate Degree | 75 (72.1%) | 29 (27.9%) |
| Bachelor's Degree or higher | 53 (96.4%) | 2 (3.6%) |
Occupancy by Age of Householder in Caseville
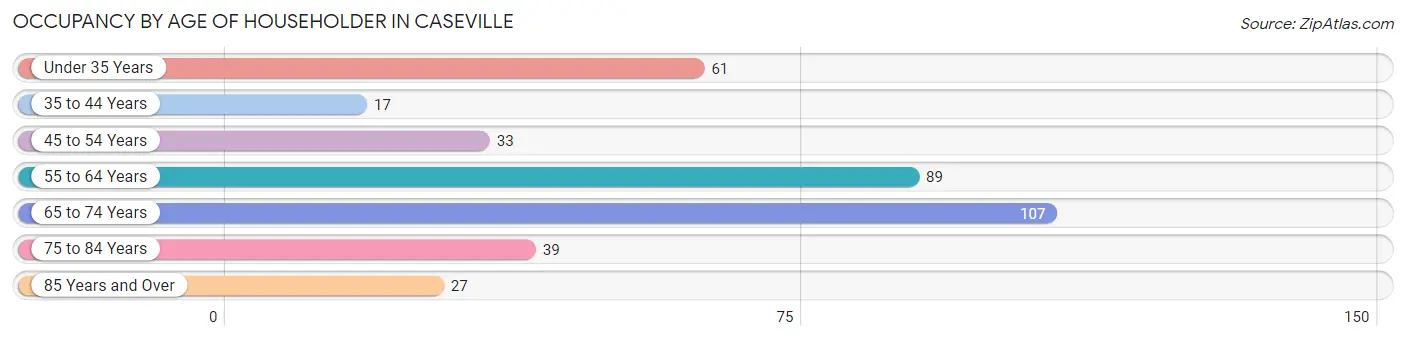
| Age Bracket | # Households | % Households |
| Under 35 Years | 61 | 16.4% |
| 35 to 44 Years | 17 | 4.6% |
| 45 to 54 Years | 33 | 8.8% |
| 55 to 64 Years | 89 | 23.9% |
| 65 to 74 Years | 107 | 28.7% |
| 75 to 84 Years | 39 | 10.5% |
| 85 Years and Over | 27 | 7.2% |
| Total | 373 | 100.0% |
Housing Finances in Caseville
Median Income by Occupancy in Caseville
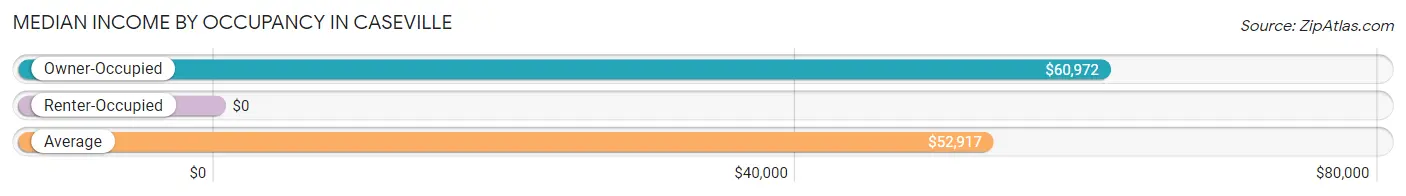
| Occupancy Type | # Households | Median Income |
| Owner-Occupied | 271 (72.7%) | $60,972 |
| Renter-Occupied | 102 (27.4%) | $0 |
| Average | 373 (100.0%) | $52,917 |
Occupancy by Householder Income Bracket in Caseville
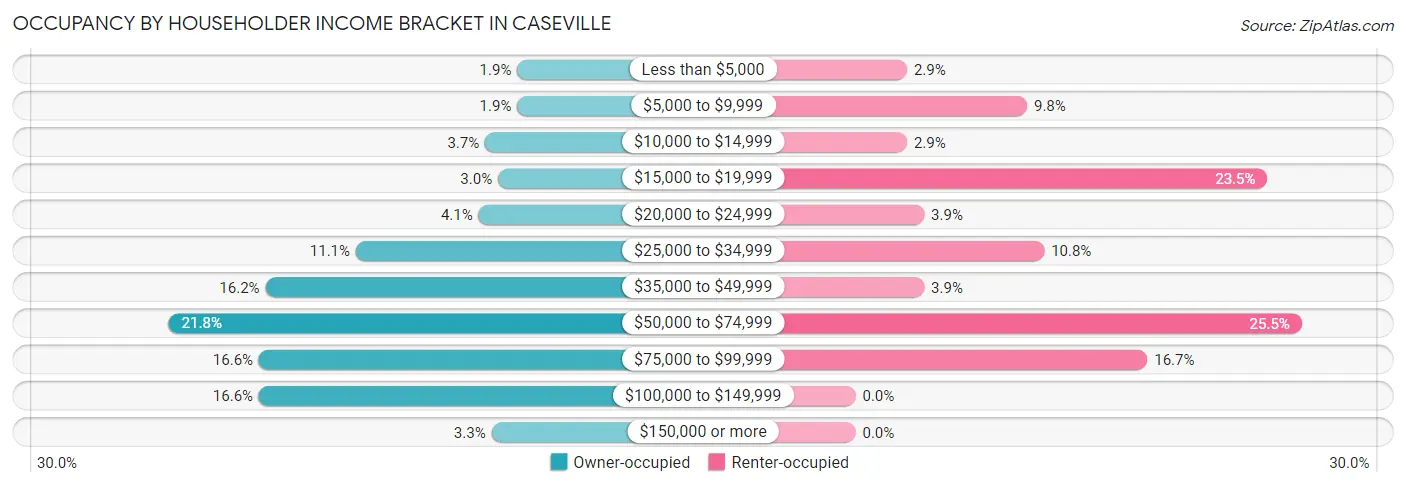
| Income Bracket | Owner-occupied | Renter-occupied |
| Less than $5,000 | 5 (1.8%) | 3 (2.9%) |
| $5,000 to $9,999 | 5 (1.8%) | 10 (9.8%) |
| $10,000 to $14,999 | 10 (3.7%) | 3 (2.9%) |
| $15,000 to $19,999 | 8 (2.9%) | 24 (23.5%) |
| $20,000 to $24,999 | 11 (4.1%) | 4 (3.9%) |
| $25,000 to $34,999 | 30 (11.1%) | 11 (10.8%) |
| $35,000 to $49,999 | 44 (16.2%) | 4 (3.9%) |
| $50,000 to $74,999 | 59 (21.8%) | 26 (25.5%) |
| $75,000 to $99,999 | 45 (16.6%) | 17 (16.7%) |
| $100,000 to $149,999 | 45 (16.6%) | 0 (0.0%) |
| $150,000 or more | 9 (3.3%) | 0 (0.0%) |
| Total | 271 (100.0%) | 102 (100.0%) |
Monthly Housing Cost Tiers in Caseville
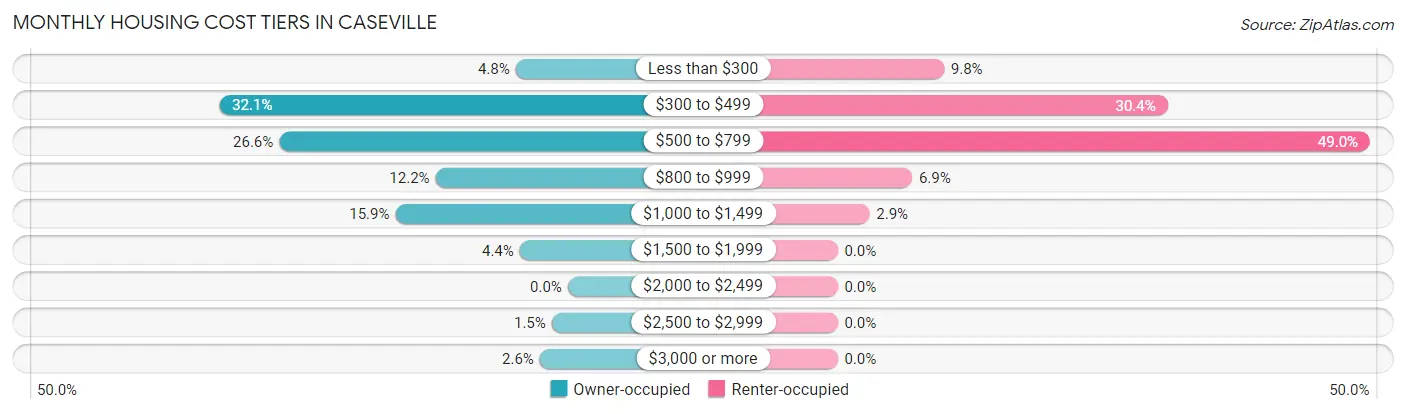
| Monthly Cost | Owner-occupied | Renter-occupied |
| Less than $300 | 13 (4.8%) | 10 (9.8%) |
| $300 to $499 | 87 (32.1%) | 31 (30.4%) |
| $500 to $799 | 72 (26.6%) | 50 (49.0%) |
| $800 to $999 | 33 (12.2%) | 7 (6.9%) |
| $1,000 to $1,499 | 43 (15.9%) | 3 (2.9%) |
| $1,500 to $1,999 | 12 (4.4%) | 0 (0.0%) |
| $2,000 to $2,499 | 0 (0.0%) | 0 (0.0%) |
| $2,500 to $2,999 | 4 (1.5%) | 0 (0.0%) |
| $3,000 or more | 7 (2.6%) | 0 (0.0%) |
| Total | 271 (100.0%) | 102 (100.0%) |
Physical Housing Characteristics in Caseville
Housing Structures in Caseville
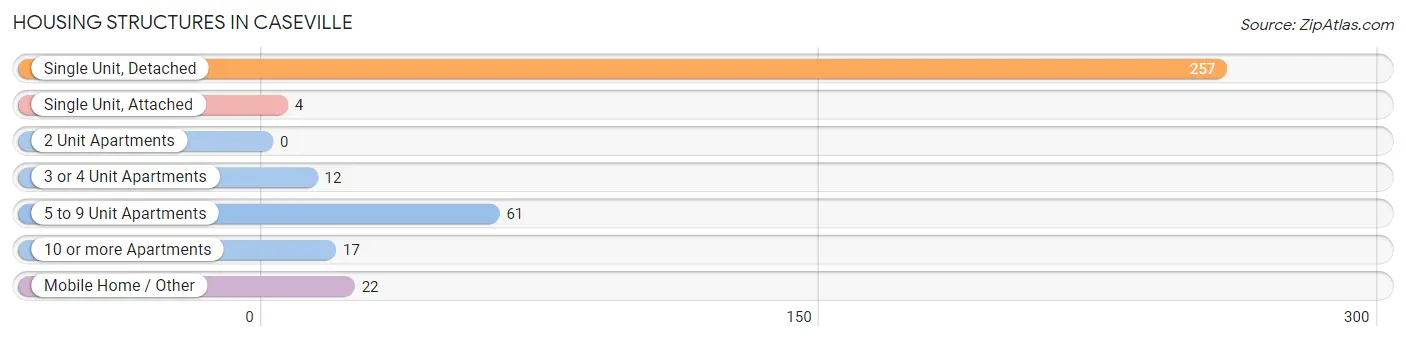
| Structure Type | # Housing Units | % Housing Units |
| Single Unit, Detached | 257 | 68.9% |
| Single Unit, Attached | 4 | 1.1% |
| 2 Unit Apartments | 0 | 0.0% |
| 3 or 4 Unit Apartments | 12 | 3.2% |
| 5 to 9 Unit Apartments | 61 | 16.4% |
| 10 or more Apartments | 17 | 4.6% |
| Mobile Home / Other | 22 | 5.9% |
| Total | 373 | 100.0% |
Housing Structures by Occupancy in Caseville
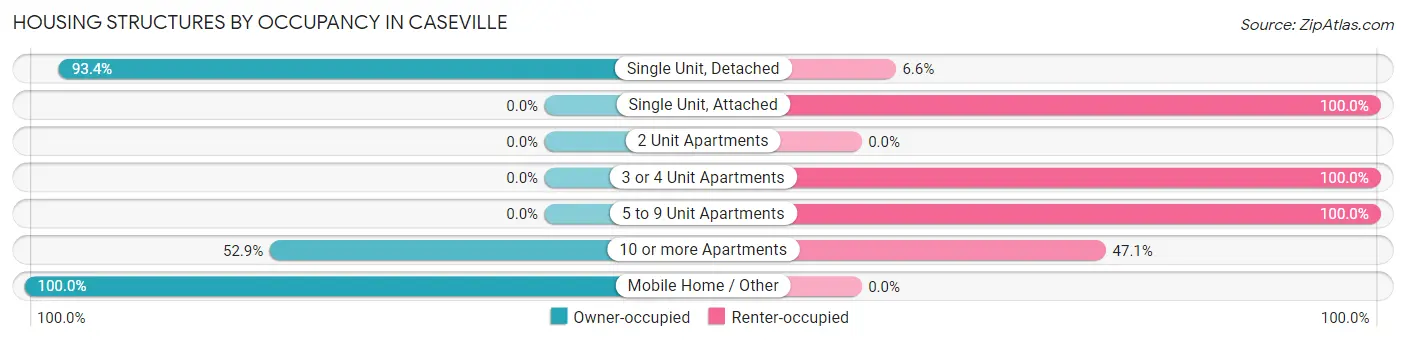
| Structure Type | Owner-occupied | Renter-occupied |
| Single Unit, Detached | 240 (93.4%) | 17 (6.6%) |
| Single Unit, Attached | 0 (0.0%) | 4 (100.0%) |
| 2 Unit Apartments | 0 (0.0%) | 0 (0.0%) |
| 3 or 4 Unit Apartments | 0 (0.0%) | 12 (100.0%) |
| 5 to 9 Unit Apartments | 0 (0.0%) | 61 (100.0%) |
| 10 or more Apartments | 9 (52.9%) | 8 (47.1%) |
| Mobile Home / Other | 22 (100.0%) | 0 (0.0%) |
| Total | 271 (72.7%) | 102 (27.4%) |
Housing Structures by Number of Rooms in Caseville
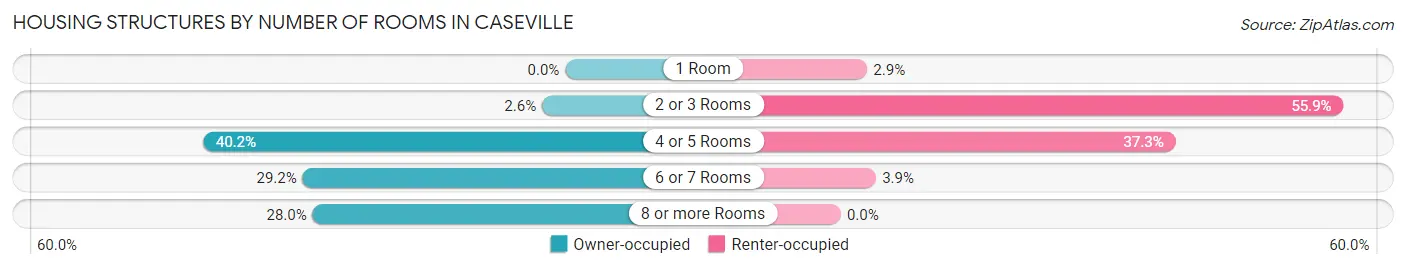
| Number of Rooms | Owner-occupied | Renter-occupied |
| 1 Room | 0 (0.0%) | 3 (2.9%) |
| 2 or 3 Rooms | 7 (2.6%) | 57 (55.9%) |
| 4 or 5 Rooms | 109 (40.2%) | 38 (37.2%) |
| 6 or 7 Rooms | 79 (29.1%) | 4 (3.9%) |
| 8 or more Rooms | 76 (28.0%) | 0 (0.0%) |
| Total | 271 (100.0%) | 102 (100.0%) |
Housing Structure by Heating Type in Caseville
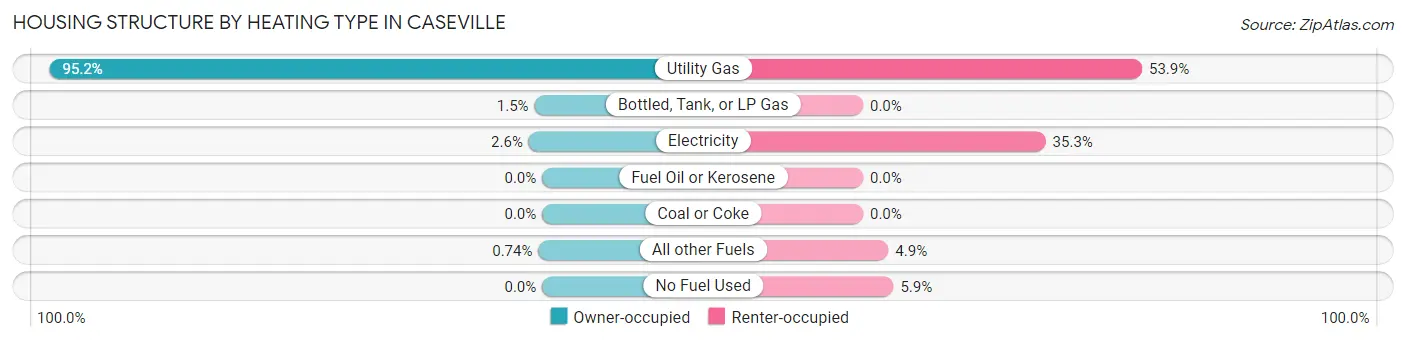
| Heating Type | Owner-occupied | Renter-occupied |
| Utility Gas | 258 (95.2%) | 55 (53.9%) |
| Bottled, Tank, or LP Gas | 4 (1.5%) | 0 (0.0%) |
| Electricity | 7 (2.6%) | 36 (35.3%) |
| Fuel Oil or Kerosene | 0 (0.0%) | 0 (0.0%) |
| Coal or Coke | 0 (0.0%) | 0 (0.0%) |
| All other Fuels | 2 (0.7%) | 5 (4.9%) |
| No Fuel Used | 0 (0.0%) | 6 (5.9%) |
| Total | 271 (100.0%) | 102 (100.0%) |
Household Vehicle Usage in Caseville
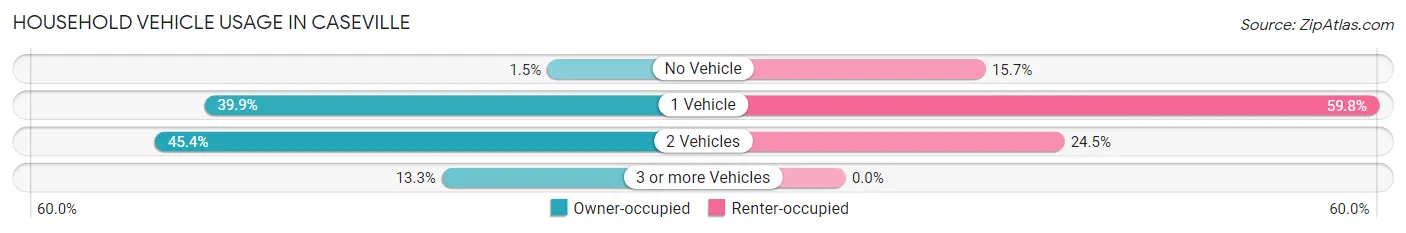
| Vehicles per Household | Owner-occupied | Renter-occupied |
| No Vehicle | 4 (1.5%) | 16 (15.7%) |
| 1 Vehicle | 108 (39.9%) | 61 (59.8%) |
| 2 Vehicles | 123 (45.4%) | 25 (24.5%) |
| 3 or more Vehicles | 36 (13.3%) | 0 (0.0%) |
| Total | 271 (100.0%) | 102 (100.0%) |
Real Estate & Mortgages in Caseville
Real Estate and Mortgage Overview in Caseville
| Characteristic | Without Mortgage | With Mortgage |
| Housing Units | 173 | 98 |
| Median Property Value | $154,500 | $115,600 |
| Median Household Income | $60,938 | $9 |
| Monthly Housing Costs | $470 | $7 |
| Real Estate Taxes | $1,485 | $10 |
Property Value by Mortgage Status in Caseville
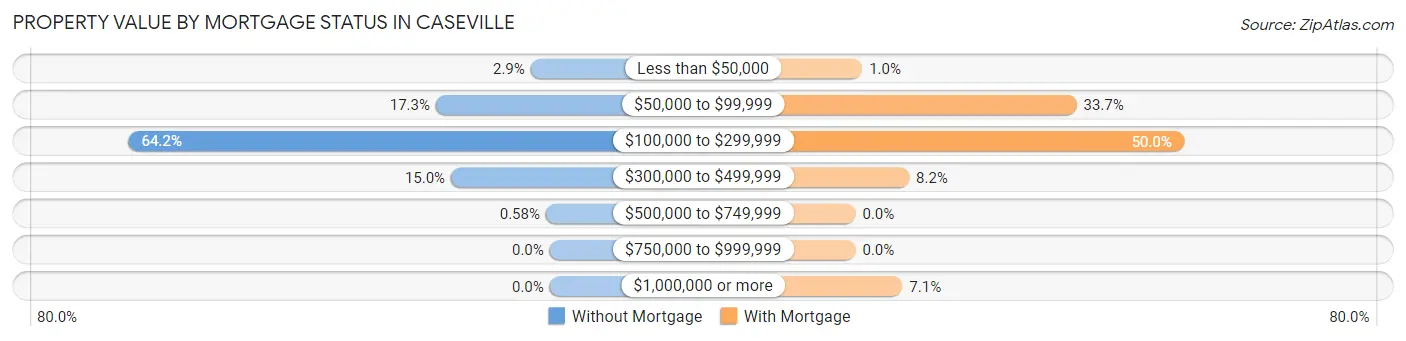
| Property Value | Without Mortgage | With Mortgage |
| Less than $50,000 | 5 (2.9%) | 1 (1.0%) |
| $50,000 to $99,999 | 30 (17.3%) | 33 (33.7%) |
| $100,000 to $299,999 | 111 (64.2%) | 49 (50.0%) |
| $300,000 to $499,999 | 26 (15.0%) | 8 (8.2%) |
| $500,000 to $749,999 | 1 (0.6%) | 0 (0.0%) |
| $750,000 to $999,999 | 0 (0.0%) | 0 (0.0%) |
| $1,000,000 or more | 0 (0.0%) | 7 (7.1%) |
| Total | 173 (100.0%) | 98 (100.0%) |
Household Income by Mortgage Status in Caseville
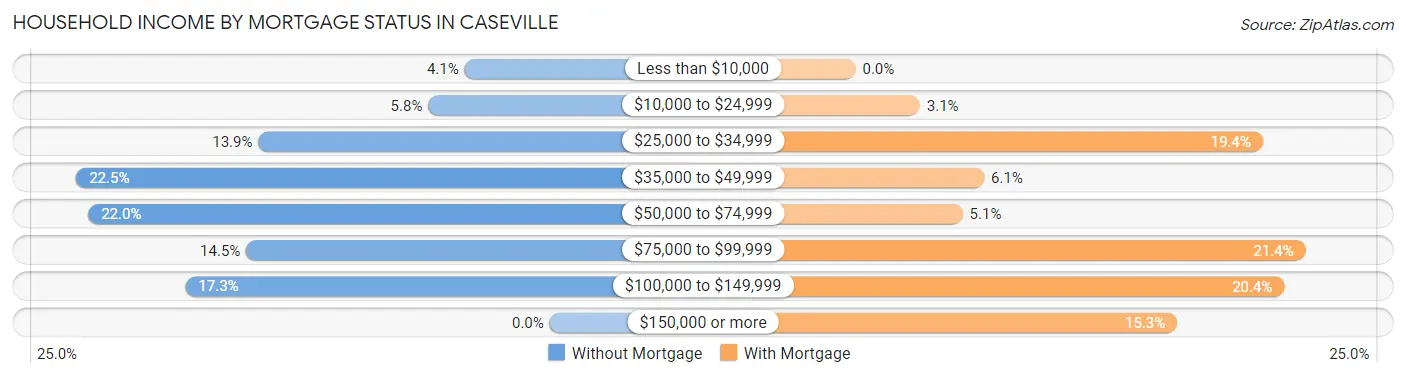
| Household Income | Without Mortgage | With Mortgage |
| Less than $10,000 | 7 (4.1%) | 0 (0.0%) |
| $10,000 to $24,999 | 10 (5.8%) | 3 (3.1%) |
| $25,000 to $34,999 | 24 (13.9%) | 19 (19.4%) |
| $35,000 to $49,999 | 39 (22.5%) | 6 (6.1%) |
| $50,000 to $74,999 | 38 (22.0%) | 5 (5.1%) |
| $75,000 to $99,999 | 25 (14.4%) | 21 (21.4%) |
| $100,000 to $149,999 | 30 (17.3%) | 20 (20.4%) |
| $150,000 or more | 0 (0.0%) | 15 (15.3%) |
| Total | 173 (100.0%) | 98 (100.0%) |
Property Value to Household Income Ratio in Caseville
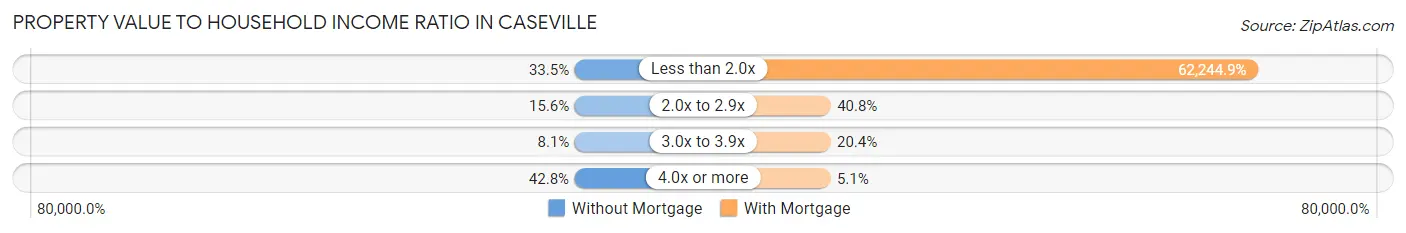
| Value-to-Income Ratio | Without Mortgage | With Mortgage |
| Less than 2.0x | 58 (33.5%) | 61,000 (62,244.9%) |
| 2.0x to 2.9x | 27 (15.6%) | 40 (40.8%) |
| 3.0x to 3.9x | 14 (8.1%) | 20 (20.4%) |
| 4.0x or more | 74 (42.8%) | 5 (5.1%) |
| Total | 173 (100.0%) | 98 (100.0%) |
Real Estate Taxes by Mortgage Status in Caseville
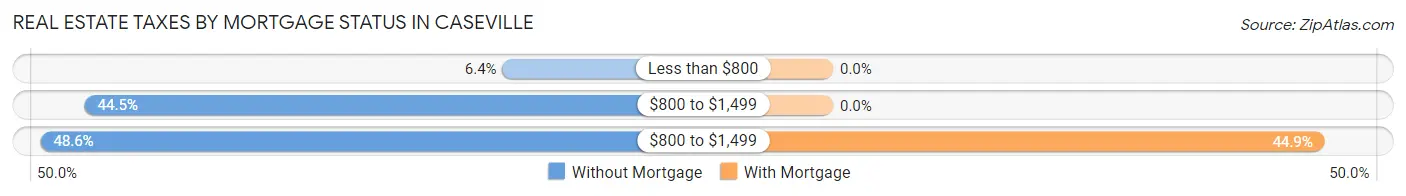
| Property Taxes | Without Mortgage | With Mortgage |
| Less than $800 | 11 (6.4%) | 0 (0.0%) |
| $800 to $1,499 | 77 (44.5%) | 0 (0.0%) |
| $800 to $1,499 | 84 (48.5%) | 44 (44.9%) |
| Total | 173 (100.0%) | 98 (100.0%) |
Health & Disability in Caseville
Health Insurance Coverage by Age in Caseville
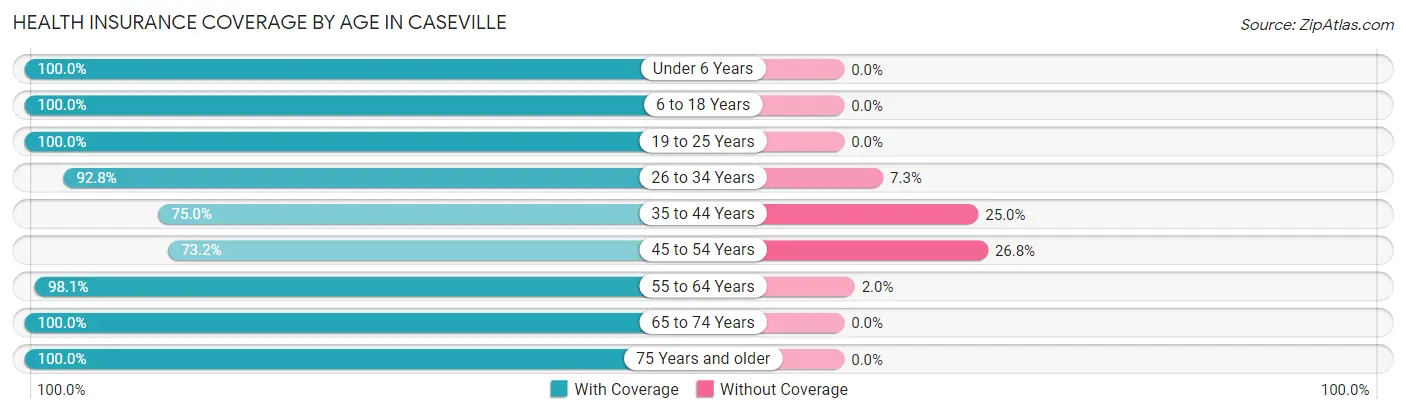
| Age Bracket | With Coverage | Without Coverage |
| Under 6 Years | 2 (100.0%) | 0 (0.0%) |
| 6 to 18 Years | 47 (100.0%) | 0 (0.0%) |
| 19 to 25 Years | 64 (100.0%) | 0 (0.0%) |
| 26 to 34 Years | 64 (92.7%) | 5 (7.2%) |
| 35 to 44 Years | 18 (75.0%) | 6 (25.0%) |
| 45 to 54 Years | 41 (73.2%) | 15 (26.8%) |
| 55 to 64 Years | 151 (98.1%) | 3 (1.9%) |
| 65 to 74 Years | 166 (100.0%) | 0 (0.0%) |
| 75 Years and older | 92 (100.0%) | 0 (0.0%) |
| Total | 645 (95.7%) | 29 (4.3%) |
Health Insurance Coverage by Citizenship Status in Caseville

| Citizenship Status | With Coverage | Without Coverage |
| Native Born | 2 (100.0%) | 0 (0.0%) |
| Foreign Born, Citizen | 47 (100.0%) | 0 (0.0%) |
| Foreign Born, not a Citizen | 64 (100.0%) | 0 (0.0%) |
Health Insurance Coverage by Household Income in Caseville
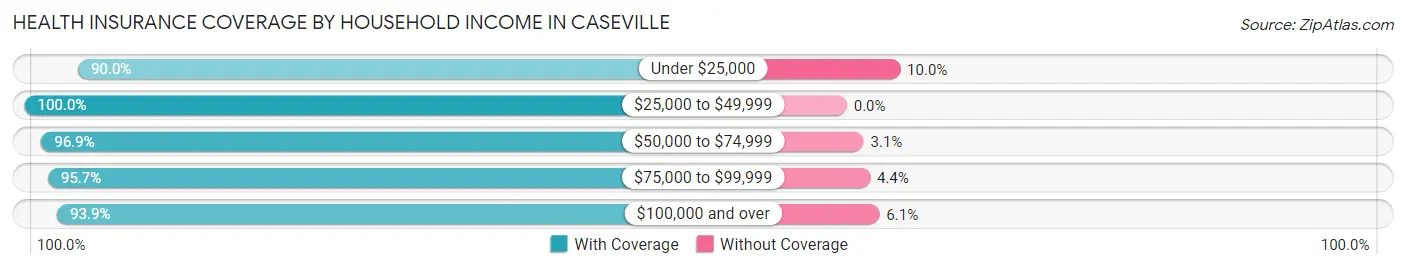
| Household Income | With Coverage | Without Coverage |
| Under $25,000 | 90 (90.0%) | 10 (10.0%) |
| $25,000 to $49,999 | 146 (100.0%) | 0 (0.0%) |
| $50,000 to $74,999 | 154 (96.9%) | 5 (3.1%) |
| $75,000 to $99,999 | 132 (95.7%) | 6 (4.3%) |
| $100,000 and over | 123 (93.9%) | 8 (6.1%) |
Public vs Private Health Insurance Coverage by Age in Caseville
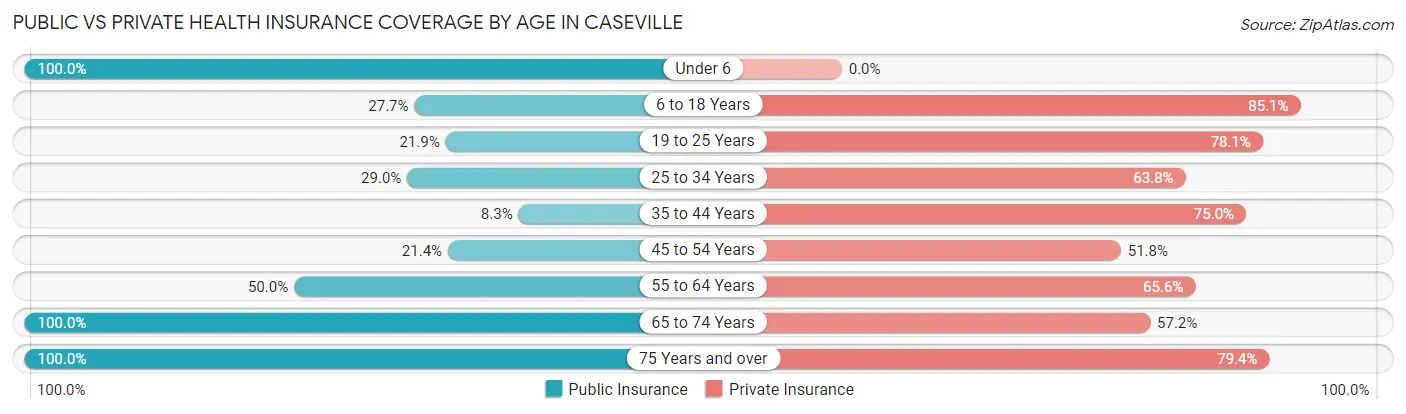
| Age Bracket | Public Insurance | Private Insurance |
| Under 6 | 2 (100.0%) | 0 (0.0%) |
| 6 to 18 Years | 13 (27.7%) | 40 (85.1%) |
| 19 to 25 Years | 14 (21.9%) | 50 (78.1%) |
| 25 to 34 Years | 20 (29.0%) | 44 (63.8%) |
| 35 to 44 Years | 2 (8.3%) | 18 (75.0%) |
| 45 to 54 Years | 12 (21.4%) | 29 (51.8%) |
| 55 to 64 Years | 77 (50.0%) | 101 (65.6%) |
| 65 to 74 Years | 166 (100.0%) | 95 (57.2%) |
| 75 Years and over | 92 (100.0%) | 73 (79.3%) |
| Total | 398 (59.1%) | 450 (66.8%) |
Disability Status by Sex by Age in Caseville
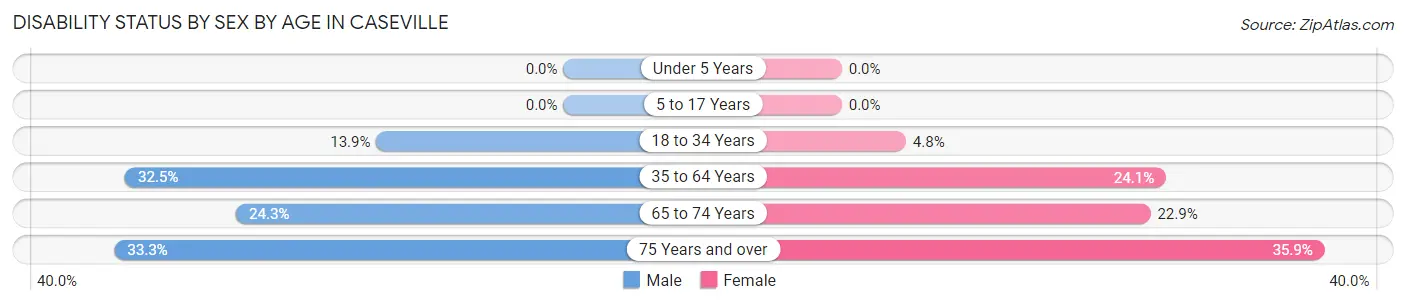
| Age Bracket | Male | Female |
| Under 5 Years | 0 (0.0%) | 0 (0.0%) |
| 5 to 17 Years | 0 (0.0%) | 0 (0.0%) |
| 18 to 34 Years | 10 (13.9%) | 3 (4.8%) |
| 35 to 64 Years | 41 (32.5%) | 26 (24.1%) |
| 65 to 74 Years | 17 (24.3%) | 22 (22.9%) |
| 75 Years and over | 13 (33.3%) | 19 (35.8%) |
Disability Class by Sex by Age in Caseville
Disability Class: Hearing Difficulty
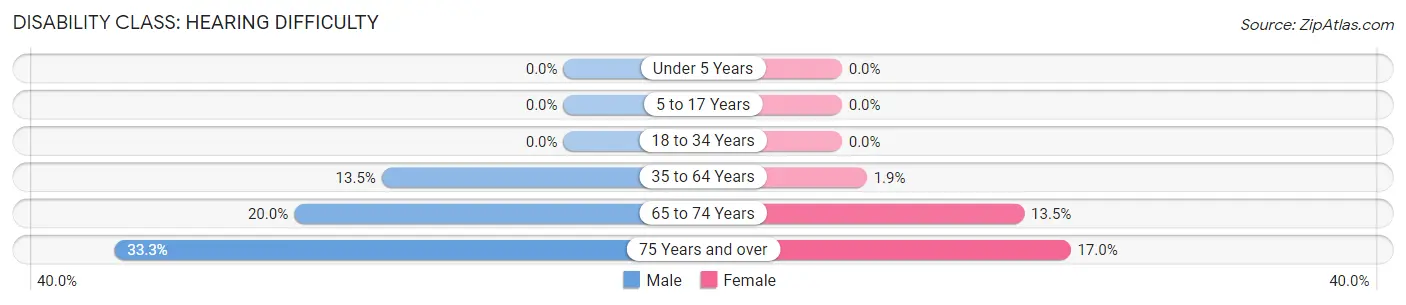
| Age Bracket | Male | Female |
| Under 5 Years | 0 (0.0%) | 0 (0.0%) |
| 5 to 17 Years | 0 (0.0%) | 0 (0.0%) |
| 18 to 34 Years | 0 (0.0%) | 0 (0.0%) |
| 35 to 64 Years | 17 (13.5%) | 2 (1.8%) |
| 65 to 74 Years | 14 (20.0%) | 13 (13.5%) |
| 75 Years and over | 13 (33.3%) | 9 (17.0%) |
Disability Class: Vision Difficulty
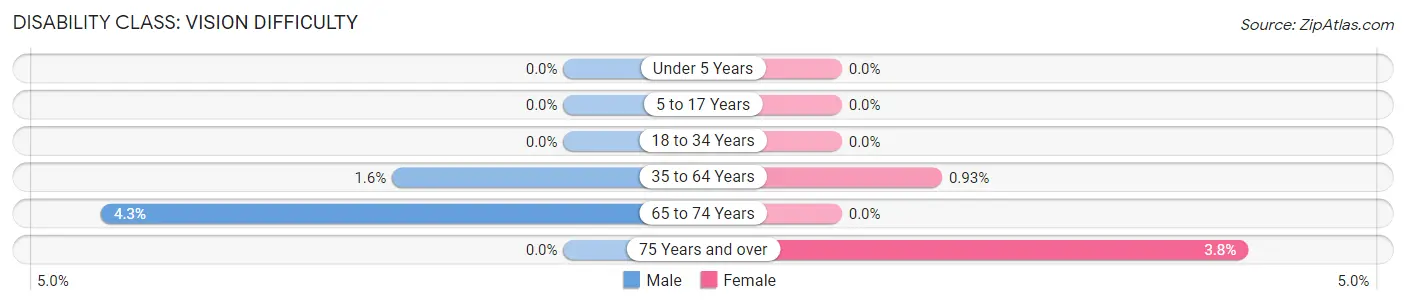
| Age Bracket | Male | Female |
| Under 5 Years | 0 (0.0%) | 0 (0.0%) |
| 5 to 17 Years | 0 (0.0%) | 0 (0.0%) |
| 18 to 34 Years | 0 (0.0%) | 0 (0.0%) |
| 35 to 64 Years | 2 (1.6%) | 1 (0.9%) |
| 65 to 74 Years | 3 (4.3%) | 0 (0.0%) |
| 75 Years and over | 0 (0.0%) | 2 (3.8%) |
Disability Class: Cognitive Difficulty
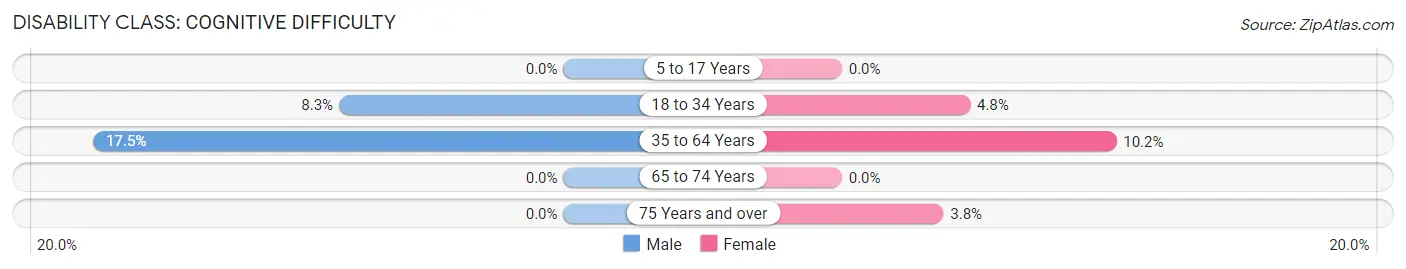
| Age Bracket | Male | Female |
| 5 to 17 Years | 0 (0.0%) | 0 (0.0%) |
| 18 to 34 Years | 6 (8.3%) | 3 (4.8%) |
| 35 to 64 Years | 22 (17.5%) | 11 (10.2%) |
| 65 to 74 Years | 0 (0.0%) | 0 (0.0%) |
| 75 Years and over | 0 (0.0%) | 2 (3.8%) |
Disability Class: Ambulatory Difficulty
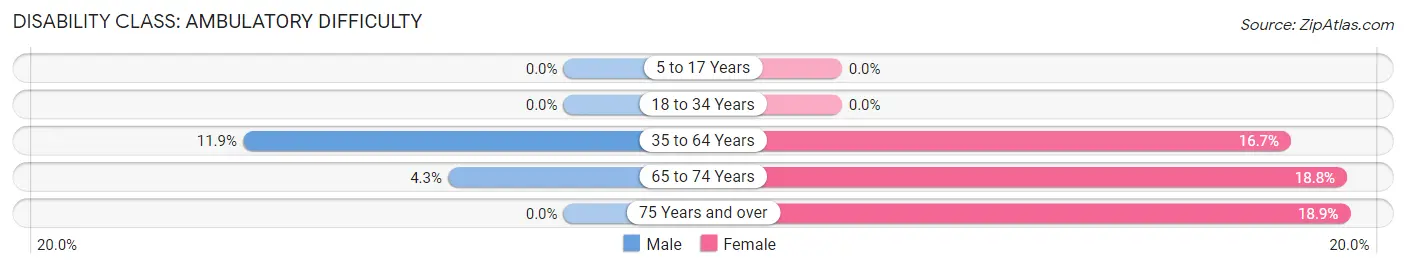
| Age Bracket | Male | Female |
| 5 to 17 Years | 0 (0.0%) | 0 (0.0%) |
| 18 to 34 Years | 0 (0.0%) | 0 (0.0%) |
| 35 to 64 Years | 15 (11.9%) | 18 (16.7%) |
| 65 to 74 Years | 3 (4.3%) | 18 (18.8%) |
| 75 Years and over | 0 (0.0%) | 10 (18.9%) |
Disability Class: Self-Care Difficulty
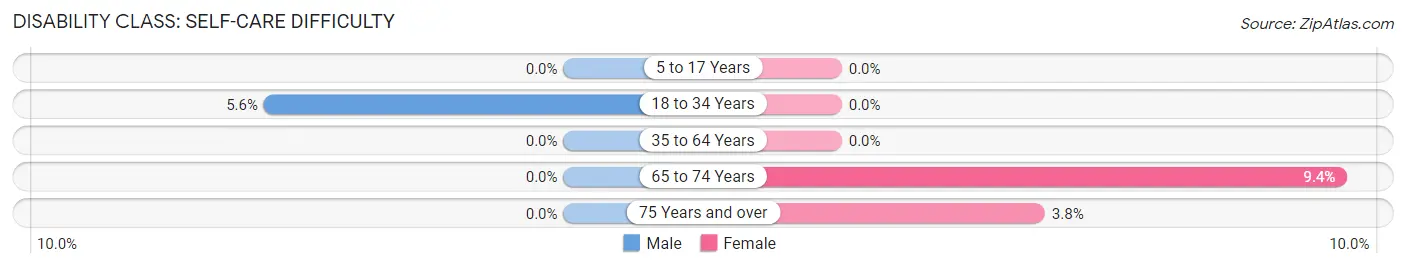
| Age Bracket | Male | Female |
| 5 to 17 Years | 0 (0.0%) | 0 (0.0%) |
| 18 to 34 Years | 4 (5.6%) | 0 (0.0%) |
| 35 to 64 Years | 0 (0.0%) | 0 (0.0%) |
| 65 to 74 Years | 0 (0.0%) | 9 (9.4%) |
| 75 Years and over | 0 (0.0%) | 2 (3.8%) |
Technology Access in Caseville
Computing Device Access in Caseville
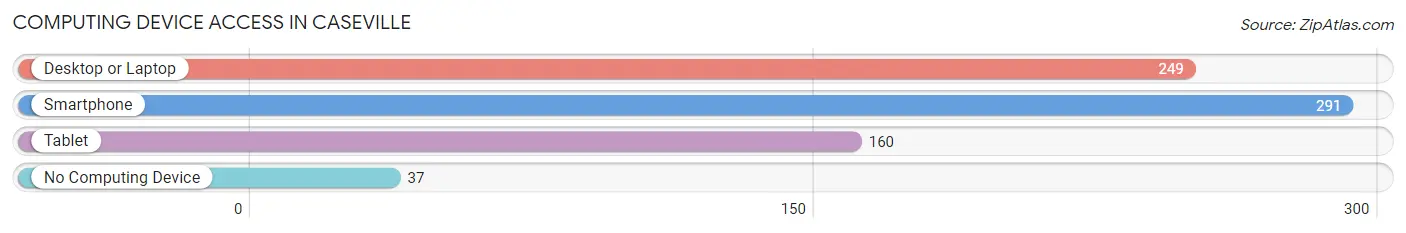
| Device Type | # Households | % Households |
| Desktop or Laptop | 249 | 66.8% |
| Smartphone | 291 | 78.0% |
| Tablet | 160 | 42.9% |
| No Computing Device | 37 | 9.9% |
| Total | 373 | 100.0% |
Internet Access in Caseville
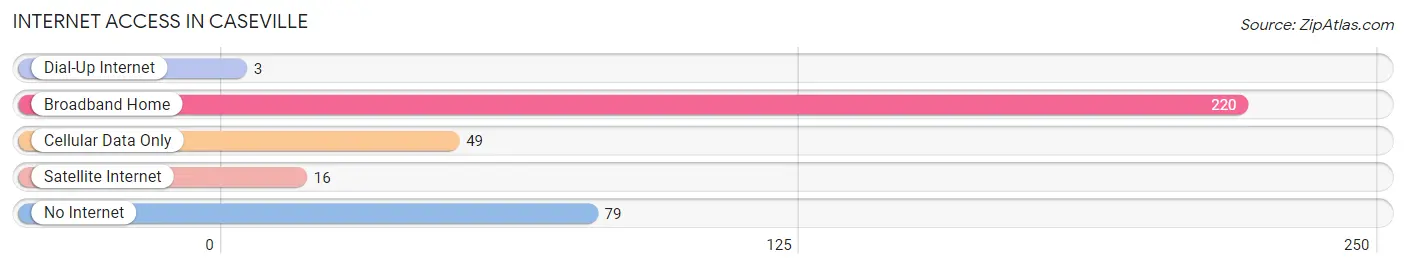
| Internet Type | # Households | % Households |
| Dial-Up Internet | 3 | 0.8% |
| Broadband Home | 220 | 59.0% |
| Cellular Data Only | 49 | 13.1% |
| Satellite Internet | 16 | 4.3% |
| No Internet | 79 | 21.2% |
| Total | 373 | 100.0% |
Caseville Summary
Caseville is a small city located in Huron County, Michigan. It is situated on the shores of Saginaw Bay, a part of Lake Huron. The city is known for its annual Cheeseburger Festival, which is held every August. The population of Caseville was 1,741 at the 2010 census.
History
Caseville was founded in 1854 by William Case, a lumberman from New York. He purchased land from the local Chippewa Indians and built a sawmill on the banks of the Pigeon River. The town was originally called Pigeon River, but was later changed to Caseville in honor of its founder.
The town grew rapidly in the late 19th century, and by the early 20th century it had become a popular summer resort destination. The town was known for its beautiful beaches and its many fishing opportunities.
In the 1950s, the town began to decline as the lumber industry moved away and the population began to decline. In the 1970s, the town was revitalized by the Cheeseburger Festival, which has become a popular annual event.
Geography
Caseville is located at the mouth of the Pigeon River, which empties into Saginaw Bay. The city is situated on the eastern shore of Lake Huron, and is bordered by the towns of Port Austin to the north and Sebewaing to the south.
The city has a total area of 2.2 square miles, all of which is land. The terrain is mostly flat, with some rolling hills. The climate is humid continental, with warm summers and cold winters.
Economy
The economy of Caseville is largely based on tourism. The city is home to several popular tourist attractions, including the Cheeseburger Festival, the Caseville County Park, and the Caseville Lighthouse. The city also has a number of restaurants, bars, and shops.
The city is also home to several manufacturing companies, including a plastics manufacturer and a boat manufacturer. The city is also home to a number of small businesses, including a grocery store, a hardware store, and a pharmacy.
Demographics
As of the 2010 census, the population of Caseville was 1,741. The racial makeup of the city was 97.2% White, 0.7% African American, 0.3% Native American, 0.2% Asian, 0.1% Pacific Islander, 0.3% from other races, and 1.2% from two or more races. Hispanic or Latino of any race were 1.3% of the population.
The median income for a household in the city was $37,917, and the median income for a family was $45,000. The per capita income for the city was $19,945. About 11.2% of families and 14.2% of the population were below the poverty line, including 19.2% of those under age 18 and 8.2% of those age 65 or over.
Common Questions
What is Per Capita Income in Caseville?
Per Capita income in Caseville is $35,984.
What is the Median Family Income in Caseville?
Median Family Income in Caseville is $72,917.
What is the Median Household income in Caseville?
Median Household Income in Caseville is $52,917.
What is Income or Wage Gap in Caseville?
Income or Wage Gap in Caseville is 28.8%.
Women in Caseville earn 71.2 cents for every dollar earned by a man.
What is Family Income Deficit in Caseville?
Family Income Deficit in Caseville is $4,963.
Families that are below poverty line in Caseville earn $4,963 less on average than the poverty threshold level.
What is Inequality or Gini Index in Caseville?
Inequality or Gini Index in Caseville is 0.40.
What is the Total Population of Caseville?
Total Population of Caseville is 674.
What is the Total Male Population of Caseville?
Total Male Population of Caseville is 332.
What is the Total Female Population of Caseville?
Total Female Population of Caseville is 342.
What is the Ratio of Males per 100 Females in Caseville?
There are 97.08 Males per 100 Females in Caseville.
What is the Ratio of Females per 100 Males in Caseville?
There are 103.01 Females per 100 Males in Caseville.
What is the Median Population Age in Caseville?
Median Population Age in Caseville is 60.8 Years.
What is the Average Family Size in Caseville
Average Family Size in Caseville is 2.3 People.
What is the Average Household Size in Caseville
Average Household Size in Caseville is 1.8 People.
How Large is the Labor Force in Caseville?
There are 270 People in the Labor Forcein in Caseville.
What is the Percentage of People in the Labor Force in Caseville?
42.8% of People are in the Labor Force in Caseville.
What is the Unemployment Rate in Caseville?
Unemployment Rate in Caseville is 3.7%.