Capac, MI Map & Demographics
Capac Map
Capac Overview
$27,165
PER CAPITA INCOME
$65,903
AVG FAMILY INCOME
$48,485
AVG HOUSEHOLD INCOME
39.8%
WAGE / INCOME GAP [ % ]
60.2¢/ $1
WAGE / INCOME GAP [ $ ]
0.42
INEQUALITY / GINI INDEX
1,920
TOTAL POPULATION
967
MALE POPULATION
953
FEMALE POPULATION
101.47
MALES / 100 FEMALES
98.55
FEMALES / 100 MALES
37.3
MEDIAN AGE
3.3
AVG FAMILY SIZE
2.5
AVG HOUSEHOLD SIZE
997
LABOR FORCE [ PEOPLE ]
66.4%
PERCENT IN LABOR FORCE
8.0%
UNEMPLOYMENT RATE
Capac Zip Codes
Capac Area Codes
Income in Capac
Income Overview in Capac
Per Capita Income in Capac is $27,165, while median incomes of families and households are $65,903 and $48,485 respectively.
| Characteristic | Number | Measure |
| Per Capita Income | 1,920 | $27,165 |
| Median Family Income | 441 | $65,903 |
| Mean Family Income | 441 | $78,147 |
| Median Household Income | 778 | $48,485 |
| Mean Household Income | 778 | $64,393 |
| Income Deficit | 441 | $0 |
| Wage / Income Gap (%) | 1,920 | 39.79% |
| Wage / Income Gap ($) | 1,920 | 60.21¢ per $1 |
| Gini / Inequality Index | 1,920 | 0.42 |
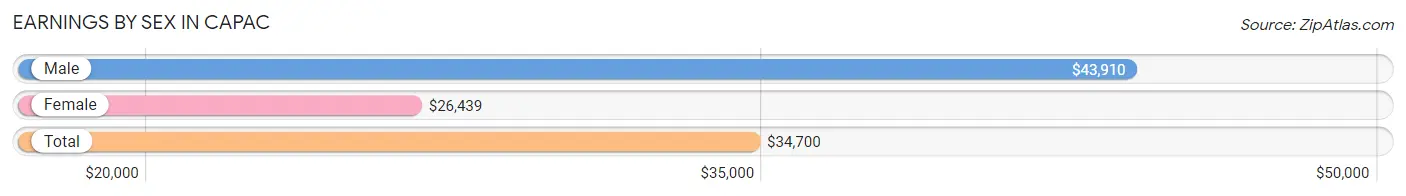
Earnings by Sex in Capac
Average Earnings in Capac are $34,700, $43,910 for men and $26,439 for women, a difference of 39.8%.
| Sex | Number | Average Earnings |
| Male | 562 (56.0%) | $43,910 |
| Female | 442 (44.0%) | $26,439 |
| Total | 1,004 (100.0%) | $34,700 |
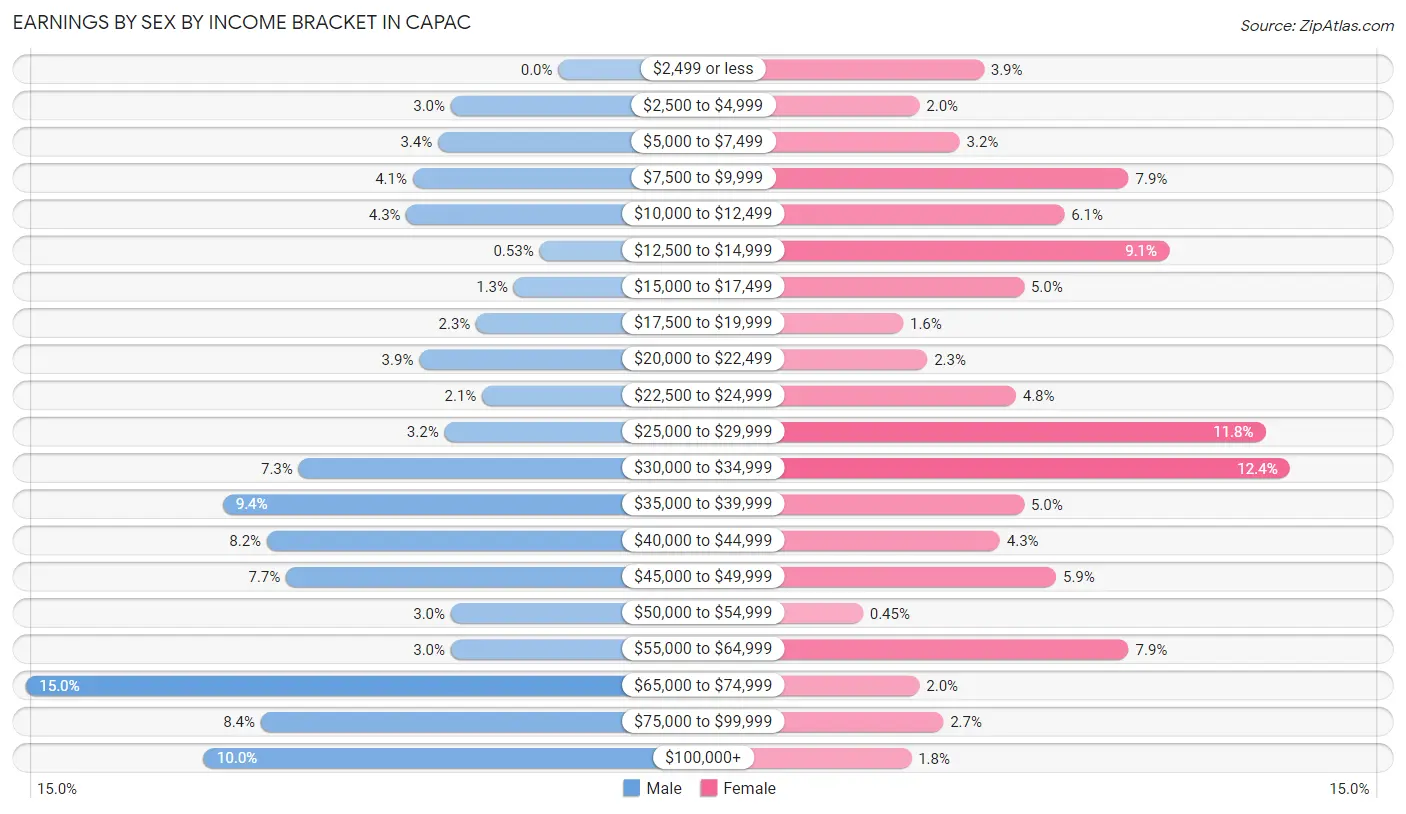
Earnings by Sex by Income Bracket in Capac
The most common earnings brackets in Capac are $65,000 to $74,999 for men (84 | 14.9%) and $30,000 to $34,999 for women (55 | 12.4%).
| Income | Male | Female |
| $2,499 or less | 0 (0.0%) | 17 (3.8%) |
| $2,500 to $4,999 | 17 (3.0%) | 9 (2.0%) |
| $5,000 to $7,499 | 19 (3.4%) | 14 (3.2%) |
| $7,500 to $9,999 | 23 (4.1%) | 35 (7.9%) |
| $10,000 to $12,499 | 24 (4.3%) | 27 (6.1%) |
| $12,500 to $14,999 | 3 (0.5%) | 40 (9.0%) |
| $15,000 to $17,499 | 7 (1.3%) | 22 (5.0%) |
| $17,500 to $19,999 | 13 (2.3%) | 7 (1.6%) |
| $20,000 to $22,499 | 22 (3.9%) | 10 (2.3%) |
| $22,500 to $24,999 | 12 (2.1%) | 21 (4.8%) |
| $25,000 to $29,999 | 18 (3.2%) | 52 (11.8%) |
| $30,000 to $34,999 | 41 (7.3%) | 55 (12.4%) |
| $35,000 to $39,999 | 53 (9.4%) | 22 (5.0%) |
| $40,000 to $44,999 | 46 (8.2%) | 19 (4.3%) |
| $45,000 to $49,999 | 43 (7.6%) | 26 (5.9%) |
| $50,000 to $54,999 | 17 (3.0%) | 2 (0.4%) |
| $55,000 to $64,999 | 17 (3.0%) | 35 (7.9%) |
| $65,000 to $74,999 | 84 (14.9%) | 9 (2.0%) |
| $75,000 to $99,999 | 47 (8.4%) | 12 (2.7%) |
| $100,000+ | 56 (10.0%) | 8 (1.8%) |
| Total | 562 (100.0%) | 442 (100.0%) |
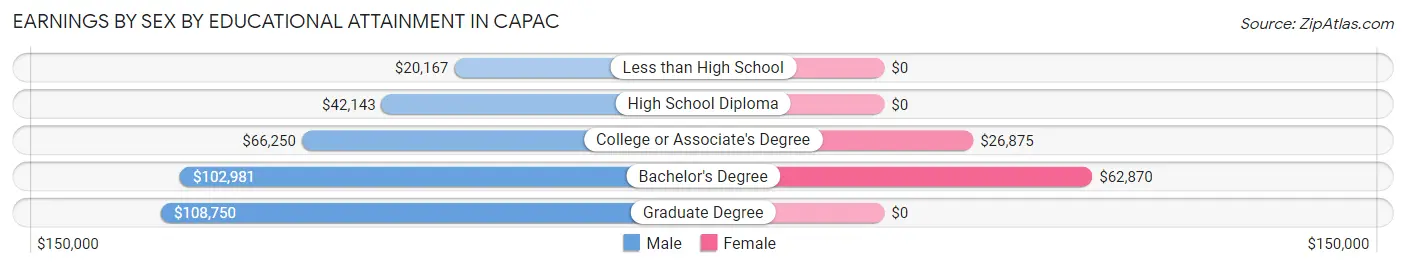
Earnings by Sex by Educational Attainment in Capac
Average earnings in Capac are $48,640 for men and $27,292 for women, a difference of 43.9%. Men with an educational attainment of graduate degree enjoy the highest average annual earnings of $108,750, while those with less than high school education earn the least with $20,167. Women with an educational attainment of bachelor's degree earn the most with the average annual earnings of $62,870, while those with college or associate's degree education have the smallest earnings of $26,875.
| Educational Attainment | Male Income | Female Income |
| Less than High School | $20,167 | $0 |
| High School Diploma | $42,143 | $0 |
| College or Associate's Degree | $66,250 | $26,875 |
| Bachelor's Degree | $102,981 | $62,870 |
| Graduate Degree | $108,750 | $0 |
| Total | $48,640 | $27,292 |
Family Income in Capac
Family Income Brackets in Capac
According to the Capac family income data, there are 83 families falling into the $35,000 to $49,999 income range, which is the most common income bracket and makes up 18.8% of all families. Conversely, the $10,000 to $14,999 income bracket is the least frequent group with only 8 families (1.8%) belonging to this category.
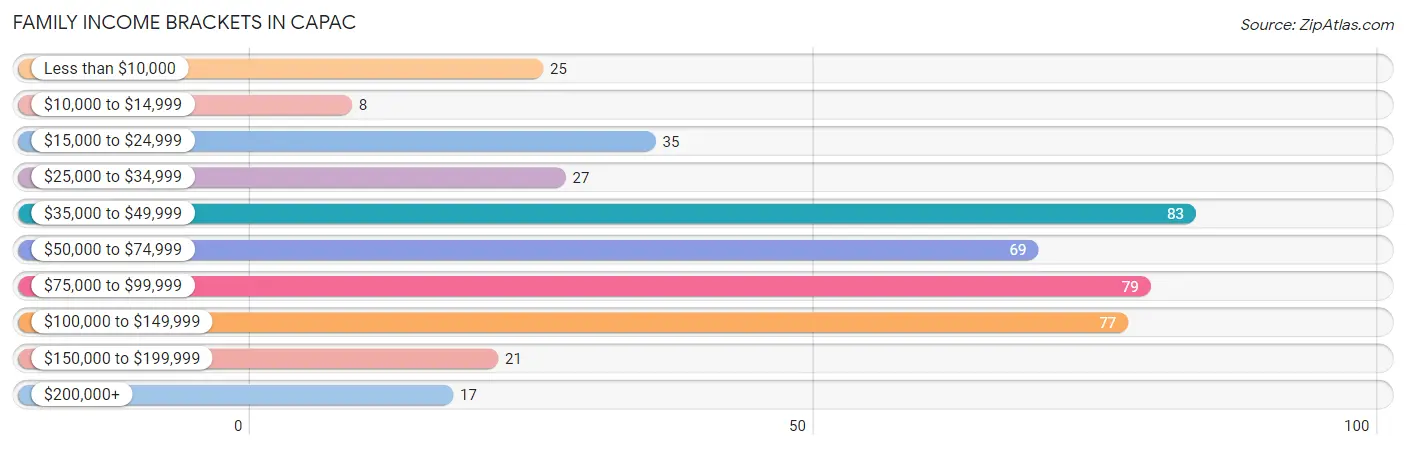
| Income Bracket | # Families | % Families |
| Less than $10,000 | 25 | 5.7% |
| $10,000 to $14,999 | 8 | 1.8% |
| $15,000 to $24,999 | 35 | 7.9% |
| $25,000 to $34,999 | 27 | 6.1% |
| $35,000 to $49,999 | 83 | 18.8% |
| $50,000 to $74,999 | 69 | 15.6% |
| $75,000 to $99,999 | 79 | 17.9% |
| $100,000 to $149,999 | 77 | 17.5% |
| $150,000 to $199,999 | 21 | 4.8% |
| $200,000+ | 17 | 3.9% |
Family Income by Famaliy Size in Capac
6-person families (21 | 4.8%) account for the highest median family income in Capac with $113,472 per family, while 3-person families (81 | 18.4%) have the highest median income of $30,298 per family member.
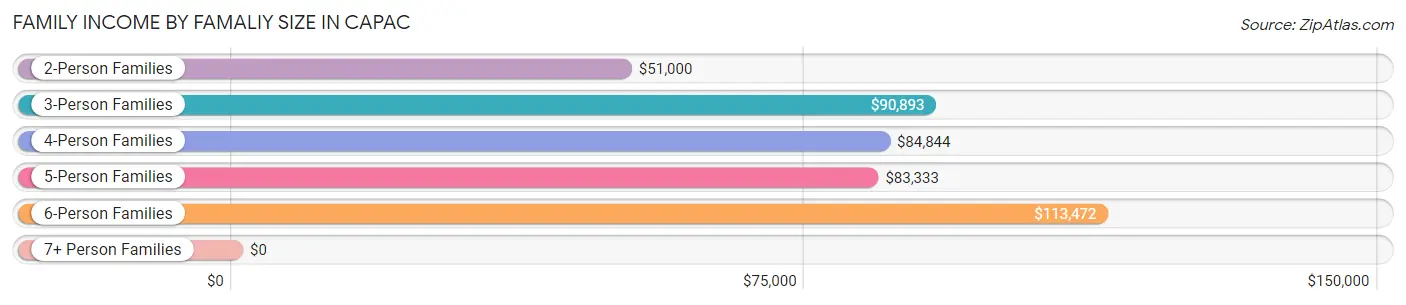
| Income Bracket | # Families | Median Income |
| 2-Person Families | 194 (44.0%) | $51,000 |
| 3-Person Families | 81 (18.4%) | $90,893 |
| 4-Person Families | 115 (26.1%) | $84,844 |
| 5-Person Families | 30 (6.8%) | $83,333 |
| 6-Person Families | 21 (4.8%) | $113,472 |
| 7+ Person Families | 0 (0.0%) | $0 |
| Total | 441 (100.0%) | $65,903 |
Family Income by Number of Earners in Capac
The median family income in Capac is $65,903, with families comprising 3+ earners (83) having the highest median family income of $112,083, while families with no earners (82) have the lowest median family income of $26,786, accounting for 18.8% and 18.6% of families, respectively.
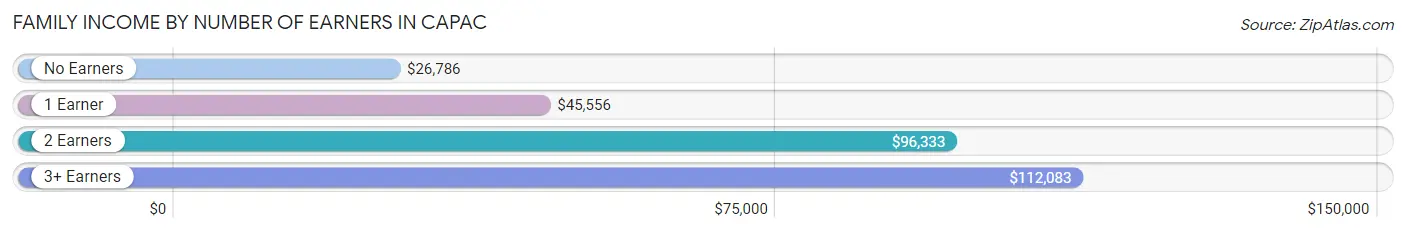
| Number of Earners | # Families | Median Income |
| No Earners | 82 (18.6%) | $26,786 |
| 1 Earner | 134 (30.4%) | $45,556 |
| 2 Earners | 142 (32.2%) | $96,333 |
| 3+ Earners | 83 (18.8%) | $112,083 |
| Total | 441 (100.0%) | $65,903 |
Household Income in Capac
Household Income Brackets in Capac
With 135 households falling in the category, the $35,000 to $49,999 income range is the most frequent in Capac, accounting for 17.3% of all households. In contrast, only 19 households (2.4%) fall into the $200,000+ income bracket, making it the least populous group.
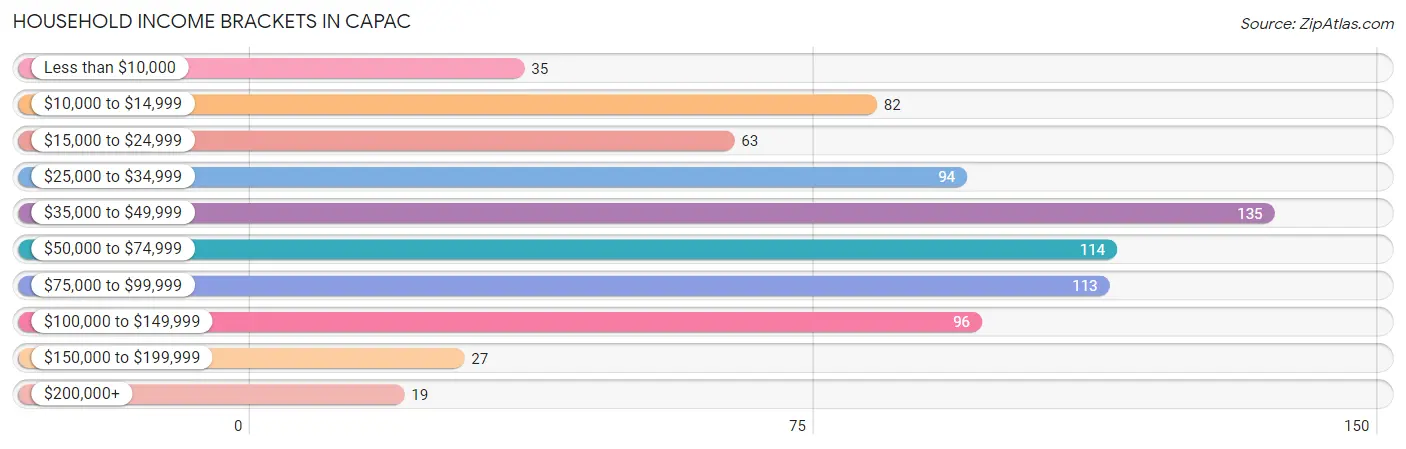
| Income Bracket | # Households | % Households |
| Less than $10,000 | 35 | 4.5% |
| $10,000 to $14,999 | 82 | 10.5% |
| $15,000 to $24,999 | 63 | 8.1% |
| $25,000 to $34,999 | 94 | 12.1% |
| $35,000 to $49,999 | 135 | 17.4% |
| $50,000 to $74,999 | 114 | 14.7% |
| $75,000 to $99,999 | 113 | 14.5% |
| $100,000 to $149,999 | 96 | 12.3% |
| $150,000 to $199,999 | 27 | 3.5% |
| $200,000+ | 19 | 2.4% |
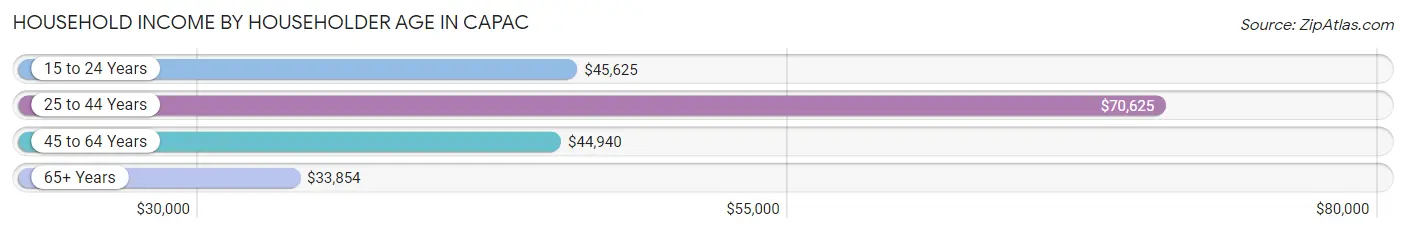
Household Income by Householder Age in Capac
The median household income in Capac is $48,485, with the highest median household income of $70,625 found in the 25 to 44 years age bracket for the primary householder. A total of 234 households (30.1%) fall into this category. Meanwhile, the 65+ years age bracket for the primary householder has the lowest median household income of $33,854, with 199 households (25.6%) in this group.
| Income Bracket | # Households | Median Income |
| 15 to 24 Years | 40 (5.1%) | $45,625 |
| 25 to 44 Years | 234 (30.1%) | $70,625 |
| 45 to 64 Years | 305 (39.2%) | $44,940 |
| 65+ Years | 199 (25.6%) | $33,854 |
| Total | 778 (100.0%) | $48,485 |
Poverty in Capac
Income Below Poverty by Sex and Age in Capac
With 11.5% poverty level for males and 18.2% for females among the residents of Capac, 12 to 14 year old males and 15 year old females are the most vulnerable to poverty, with 15 males (35.7%) and 4 females (40.0%) in their respective age groups living below the poverty level.
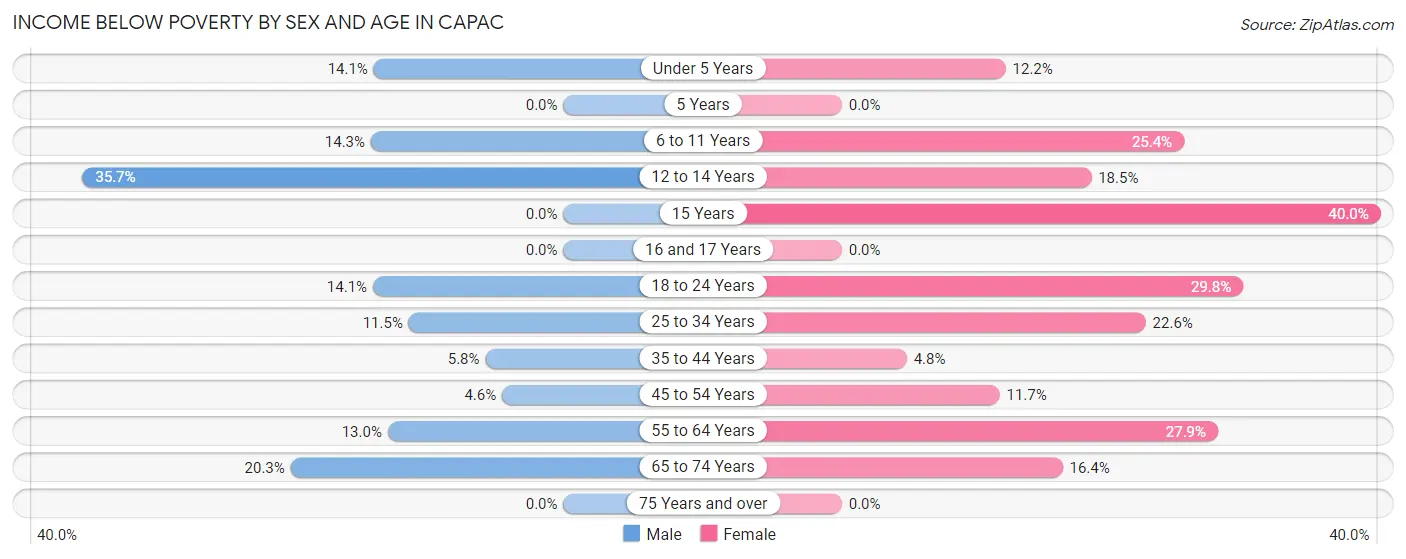
| Age Bracket | Male | Female |
| Under 5 Years | 10 (14.1%) | 9 (12.2%) |
| 5 Years | 0 (0.0%) | 0 (0.0%) |
| 6 to 11 Years | 10 (14.3%) | 16 (25.4%) |
| 12 to 14 Years | 15 (35.7%) | 5 (18.5%) |
| 15 Years | 0 (0.0%) | 4 (40.0%) |
| 16 and 17 Years | 0 (0.0%) | 0 (0.0%) |
| 18 to 24 Years | 14 (14.1%) | 28 (29.8%) |
| 25 to 34 Years | 14 (11.5%) | 30 (22.6%) |
| 35 to 44 Years | 11 (5.8%) | 4 (4.8%) |
| 45 to 54 Years | 4 (4.5%) | 13 (11.7%) |
| 55 to 64 Years | 15 (13.0%) | 43 (27.9%) |
| 65 to 74 Years | 16 (20.3%) | 20 (16.4%) |
| 75 Years and over | 0 (0.0%) | 0 (0.0%) |
| Total | 109 (11.5%) | 172 (18.2%) |
Income Above Poverty by Sex and Age in Capac
According to the poverty statistics in Capac, males aged 5 years and females aged 16 and 17 years are the age groups that are most secure financially, with 100.0% of males and 100.0% of females in these age groups living above the poverty line.
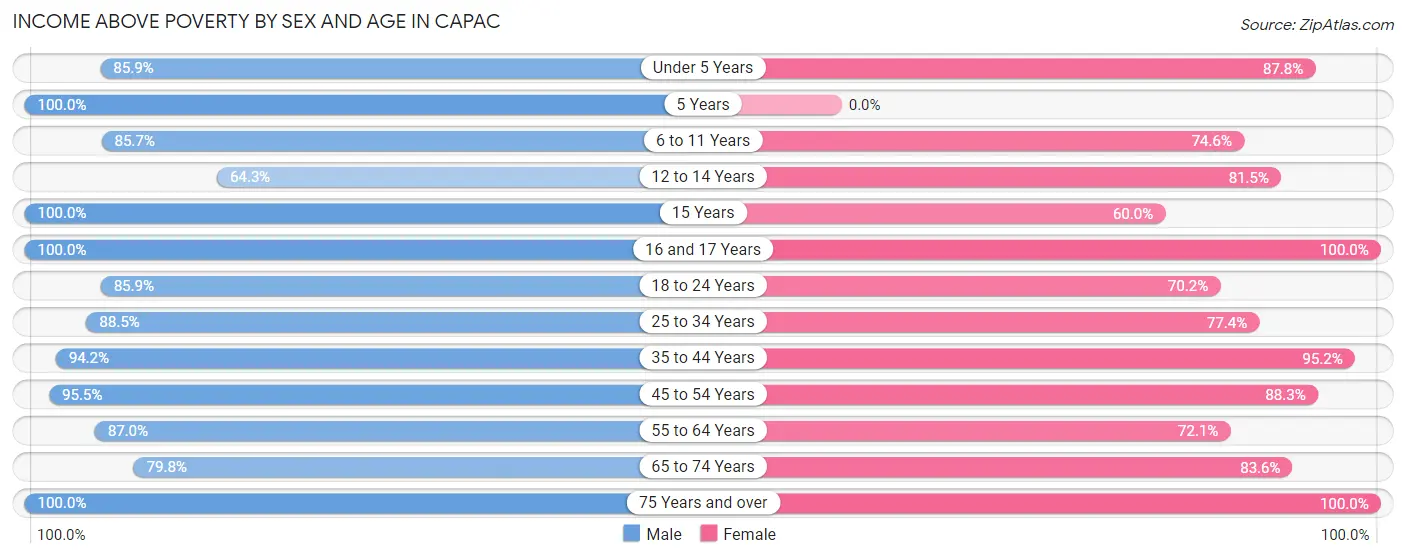
| Age Bracket | Male | Female |
| Under 5 Years | 61 (85.9%) | 65 (87.8%) |
| 5 Years | 24 (100.0%) | 0 (0.0%) |
| 6 to 11 Years | 60 (85.7%) | 47 (74.6%) |
| 12 to 14 Years | 27 (64.3%) | 22 (81.5%) |
| 15 Years | 15 (100.0%) | 6 (60.0%) |
| 16 and 17 Years | 14 (100.0%) | 20 (100.0%) |
| 18 to 24 Years | 85 (85.9%) | 66 (70.2%) |
| 25 to 34 Years | 108 (88.5%) | 103 (77.4%) |
| 35 to 44 Years | 179 (94.2%) | 79 (95.2%) |
| 45 to 54 Years | 84 (95.5%) | 98 (88.3%) |
| 55 to 64 Years | 100 (87.0%) | 111 (72.1%) |
| 65 to 74 Years | 63 (79.7%) | 102 (83.6%) |
| 75 Years and over | 21 (100.0%) | 56 (100.0%) |
| Total | 841 (88.5%) | 775 (81.8%) |
Income Below Poverty Among Married-Couple Families in Capac
The poverty statistics for married-couple families in Capac show that 5.6% or 18 of the total 322 families live below the poverty line. Families with no children have the highest poverty rate of 9.3%, comprising of 18 families. On the other hand, families with 1 or 2 children have the lowest poverty rate of 0.0%, which includes 0 families.
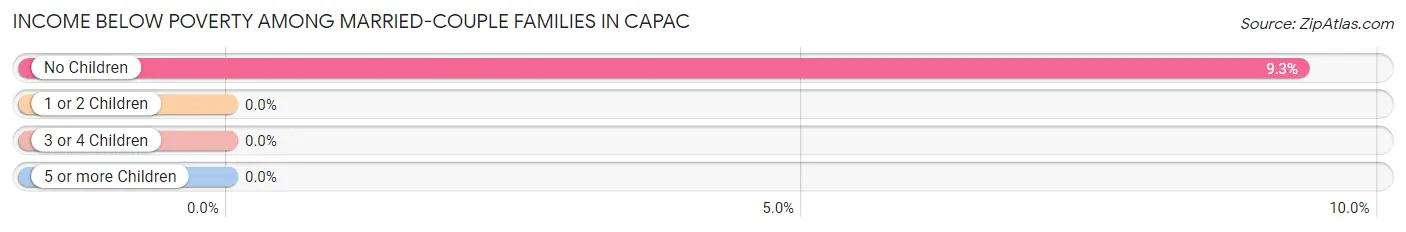
| Children | Above Poverty | Below Poverty |
| No Children | 175 (90.7%) | 18 (9.3%) |
| 1 or 2 Children | 105 (100.0%) | 0 (0.0%) |
| 3 or 4 Children | 24 (100.0%) | 0 (0.0%) |
| 5 or more Children | 0 (0.0%) | 0 (0.0%) |
| Total | 304 (94.4%) | 18 (5.6%) |
Income Below Poverty Among Single-Parent Households in Capac
According to the poverty data in Capac, 21.4% or 6 single-father households and 36.3% or 33 single-mother households are living below the poverty line. Among single-father households, those with 1 or 2 children have the highest poverty rate, with 6 households (28.6%) experiencing poverty. Likewise, among single-mother households, those with 1 or 2 children have the highest poverty rate, with 25 households (53.2%) falling below the poverty line.
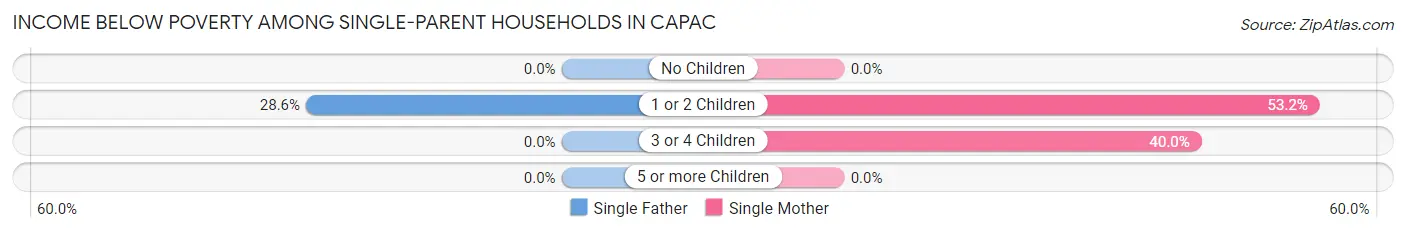
| Children | Single Father | Single Mother |
| No Children | 0 (0.0%) | 0 (0.0%) |
| 1 or 2 Children | 6 (28.6%) | 25 (53.2%) |
| 3 or 4 Children | 0 (0.0%) | 8 (40.0%) |
| 5 or more Children | 0 (0.0%) | 0 (0.0%) |
| Total | 6 (21.4%) | 33 (36.3%) |
Income Below Poverty Among Married-Couple vs Single-Parent Households in Capac
The poverty data for Capac shows that 18 of the married-couple family households (5.6%) and 39 of the single-parent households (32.8%) are living below the poverty level. Within the married-couple family households, those with no children have the highest poverty rate, with 18 households (9.3%) falling below the poverty line. Among the single-parent households, those with 1 or 2 children have the highest poverty rate, with 31 household (45.6%) living below poverty.
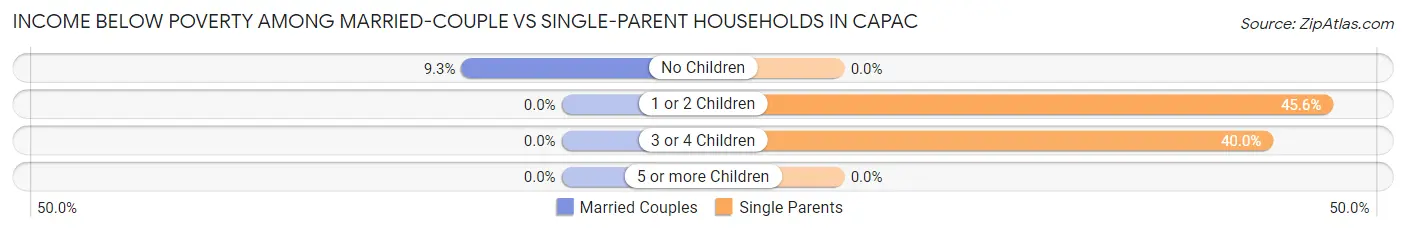
| Children | Married-Couple Families | Single-Parent Households |
| No Children | 18 (9.3%) | 0 (0.0%) |
| 1 or 2 Children | 0 (0.0%) | 31 (45.6%) |
| 3 or 4 Children | 0 (0.0%) | 8 (40.0%) |
| 5 or more Children | 0 (0.0%) | 0 (0.0%) |
| Total | 18 (5.6%) | 39 (32.8%) |
Race in Capac
The most populous races in Capac are White / Caucasian (1,611 | 83.9%), Hispanic or Latino (326 | 17.0%), and Two or more Races (165 | 8.6%).
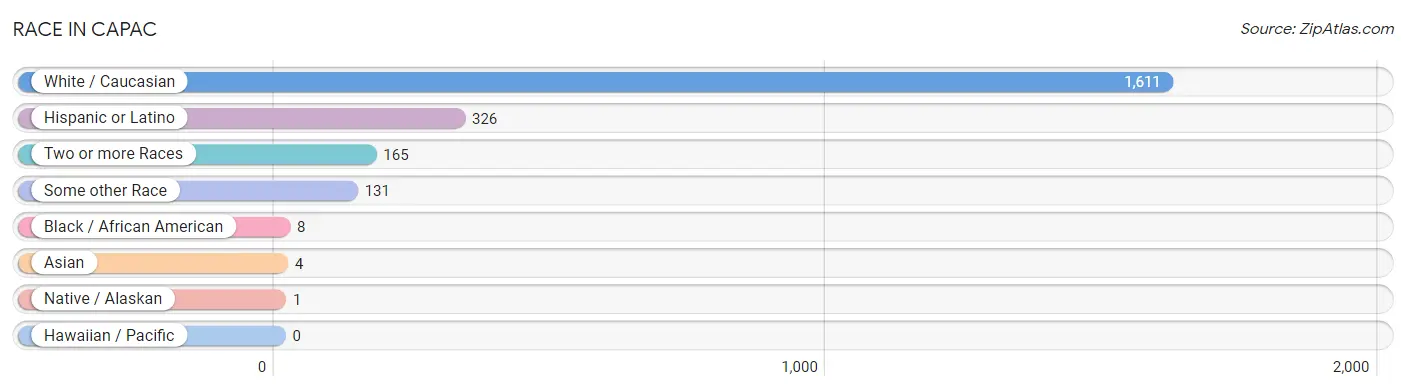
| Race | # Population | % Population |
| Asian | 4 | 0.2% |
| Black / African American | 8 | 0.4% |
| Hawaiian / Pacific | 0 | 0.0% |
| Hispanic or Latino | 326 | 17.0% |
| Native / Alaskan | 1 | 0.1% |
| White / Caucasian | 1,611 | 83.9% |
| Two or more Races | 165 | 8.6% |
| Some other Race | 131 | 6.8% |
| Total | 1,920 | 100.0% |
Ancestry in Capac
The most populous ancestries reported in Capac are German (554 | 28.8%), Mexican (280 | 14.6%), Irish (220 | 11.5%), Polish (207 | 10.8%), and English (204 | 10.6%), together accounting for 76.3% of all Capac residents.
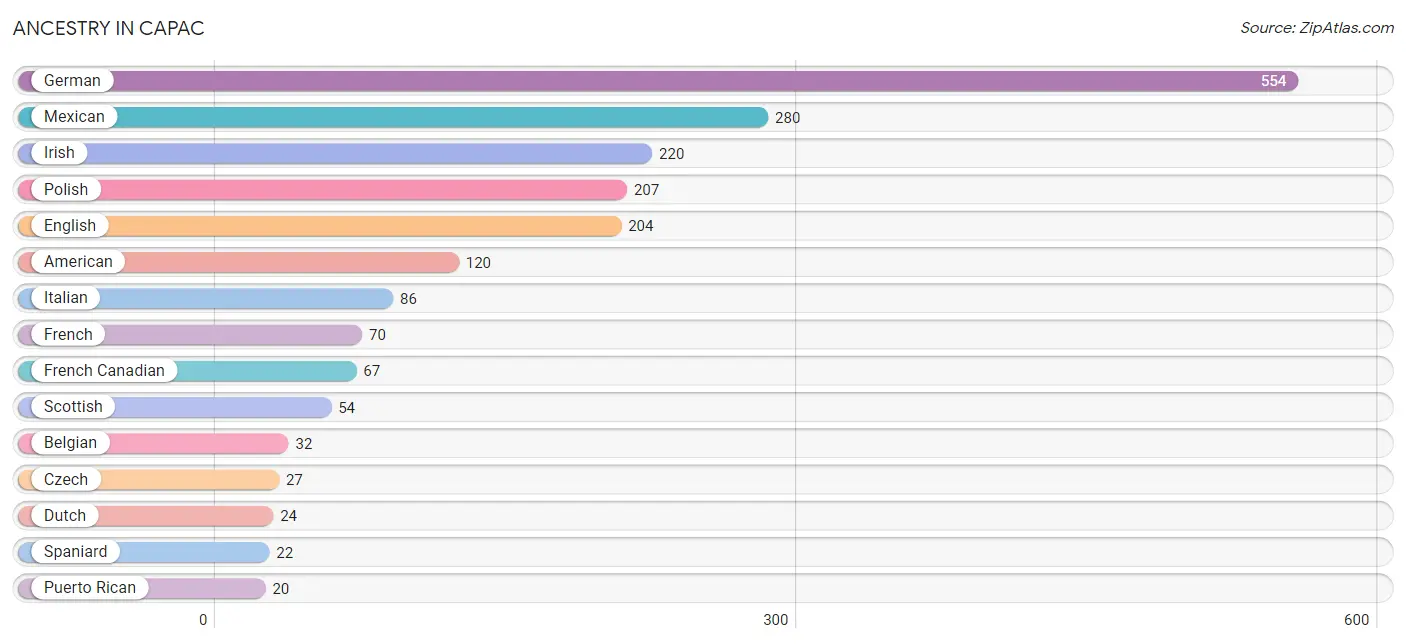
| Ancestry | # Population | % Population |
| American | 120 | 6.2% |
| Arab | 10 | 0.5% |
| Belgian | 32 | 1.7% |
| Blackfeet | 6 | 0.3% |
| Canadian | 4 | 0.2% |
| Croatian | 4 | 0.2% |
| Czech | 27 | 1.4% |
| Dutch | 24 | 1.3% |
| English | 204 | 10.6% |
| European | 17 | 0.9% |
| Finnish | 7 | 0.4% |
| French | 70 | 3.6% |
| French American Indian | 1 | 0.1% |
| French Canadian | 67 | 3.5% |
| German | 554 | 28.8% |
| Hungarian | 3 | 0.2% |
| Irish | 220 | 11.5% |
| Iroquois | 1 | 0.1% |
| Italian | 86 | 4.5% |
| Korean | 4 | 0.2% |
| Lebanese | 3 | 0.2% |
| Mexican | 280 | 14.6% |
| Northern European | 3 | 0.2% |
| Norwegian | 16 | 0.8% |
| Pennsylvania German | 11 | 0.6% |
| Polish | 207 | 10.8% |
| Puerto Rican | 20 | 1.0% |
| Russian | 6 | 0.3% |
| Scandinavian | 1 | 0.1% |
| Scotch-Irish | 4 | 0.2% |
| Scottish | 54 | 2.8% |
| Slavic | 3 | 0.2% |
| Spaniard | 22 | 1.1% |
| Sri Lankan | 10 | 0.5% |
| Syrian | 3 | 0.2% |
| Ukrainian | 11 | 0.6% |
| Welsh | 6 | 0.3% |
| Yugoslavian | 3 | 0.2% | View All 38 Rows |
Immigrants in Capac
The most numerous immigrant groups reported in Capac came from Central America (91 | 4.7%), Latin America (91 | 4.7%), Mexico (91 | 4.7%), Asia (4 | 0.2%), and Philippines (4 | 0.2%), together accounting for 14.6% of all Capac residents.
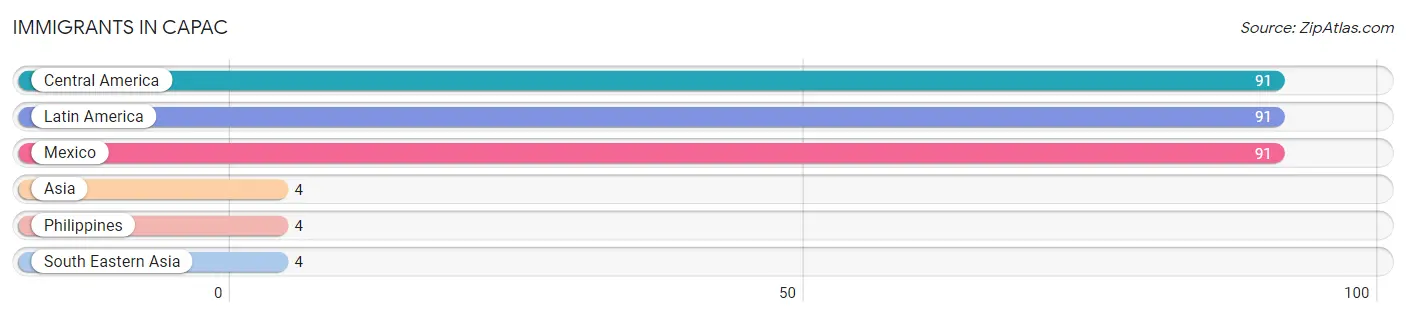
| Immigration Origin | # Population | % Population |
| Asia | 4 | 0.2% |
| Central America | 91 | 4.7% |
| Latin America | 91 | 4.7% |
| Mexico | 91 | 4.7% |
| Philippines | 4 | 0.2% |
| South Eastern Asia | 4 | 0.2% | View All 6 Rows |
Sex and Age in Capac
Sex and Age in Capac
The most populous age groups in Capac are 40 to 44 Years (97 | 10.0%) for men and 65 to 69 Years (100 | 10.5%) for women.
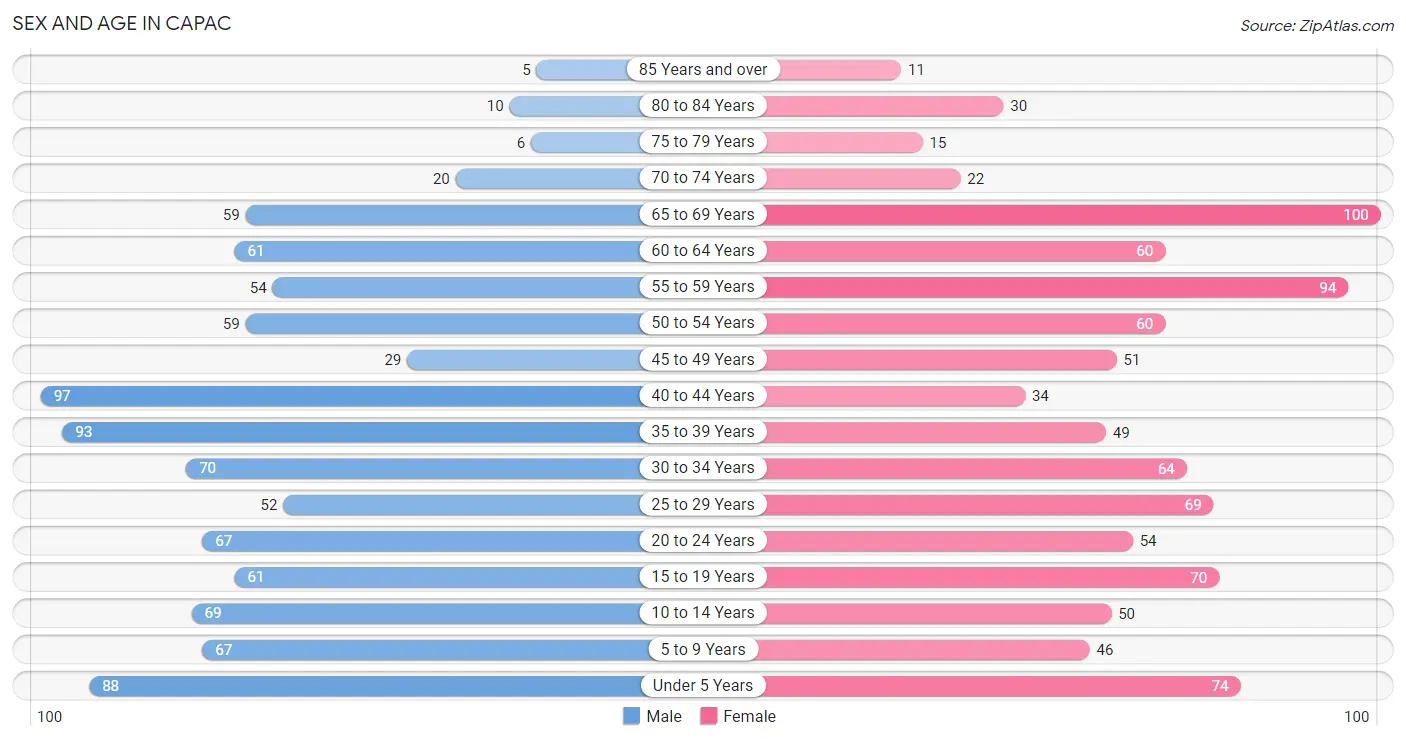
| Age Bracket | Male | Female |
| Under 5 Years | 88 (9.1%) | 74 (7.8%) |
| 5 to 9 Years | 67 (6.9%) | 46 (4.8%) |
| 10 to 14 Years | 69 (7.1%) | 50 (5.2%) |
| 15 to 19 Years | 61 (6.3%) | 70 (7.3%) |
| 20 to 24 Years | 67 (6.9%) | 54 (5.7%) |
| 25 to 29 Years | 52 (5.4%) | 69 (7.2%) |
| 30 to 34 Years | 70 (7.2%) | 64 (6.7%) |
| 35 to 39 Years | 93 (9.6%) | 49 (5.1%) |
| 40 to 44 Years | 97 (10.0%) | 34 (3.6%) |
| 45 to 49 Years | 29 (3.0%) | 51 (5.3%) |
| 50 to 54 Years | 59 (6.1%) | 60 (6.3%) |
| 55 to 59 Years | 54 (5.6%) | 94 (9.9%) |
| 60 to 64 Years | 61 (6.3%) | 60 (6.3%) |
| 65 to 69 Years | 59 (6.1%) | 100 (10.5%) |
| 70 to 74 Years | 20 (2.1%) | 22 (2.3%) |
| 75 to 79 Years | 6 (0.6%) | 15 (1.6%) |
| 80 to 84 Years | 10 (1.0%) | 30 (3.2%) |
| 85 Years and over | 5 (0.5%) | 11 (1.1%) |
| Total | 967 (100.0%) | 953 (100.0%) |
Families and Households in Capac
Median Family Size in Capac
The median family size in Capac is 3.27 persons per family, with married-couple families (322 | 73.0%) accounting for the largest median family size of 3.47 persons per family. On the other hand, single male/father families (28 | 6.4%) represent the smallest median family size with 1.96 persons per family.
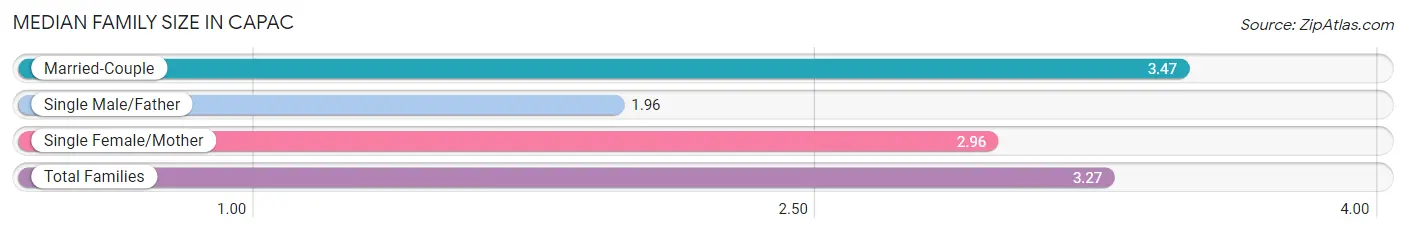
| Family Type | # Families | Family Size |
| Married-Couple | 322 (73.0%) | 3.47 |
| Single Male/Father | 28 (6.4%) | 1.96 |
| Single Female/Mother | 91 (20.6%) | 2.96 |
| Total Families | 441 (100.0%) | 3.27 |
Median Household Size in Capac
The median household size in Capac is 2.47 persons per household, with single female/mother households (91 | 11.7%) accounting for the largest median household size of 3.78 persons per household. non-family households (337 | 43.3%) represent the smallest median household size with 1.09 persons per household.
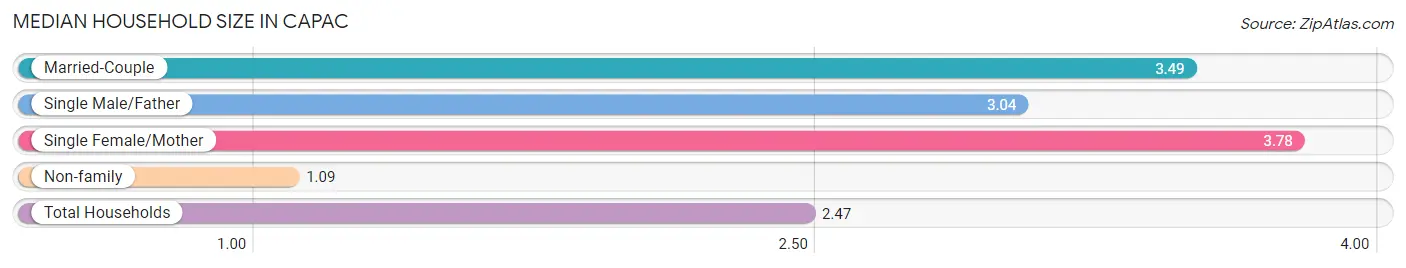
| Household Type | # Households | Household Size |
| Married-Couple | 322 (41.4%) | 3.49 |
| Single Male/Father | 28 (3.6%) | 3.04 |
| Single Female/Mother | 91 (11.7%) | 3.78 |
| Non-family | 337 (43.3%) | 1.09 |
| Total Households | 778 (100.0%) | 2.47 |
Household Size by Marriage Status in Capac
Out of a total of 778 households in Capac, 441 (56.7%) are family households, while 337 (43.3%) are nonfamily households. The most numerous type of family households are 2-person households, comprising 159, and the most common type of nonfamily households are 1-person households, comprising 308.
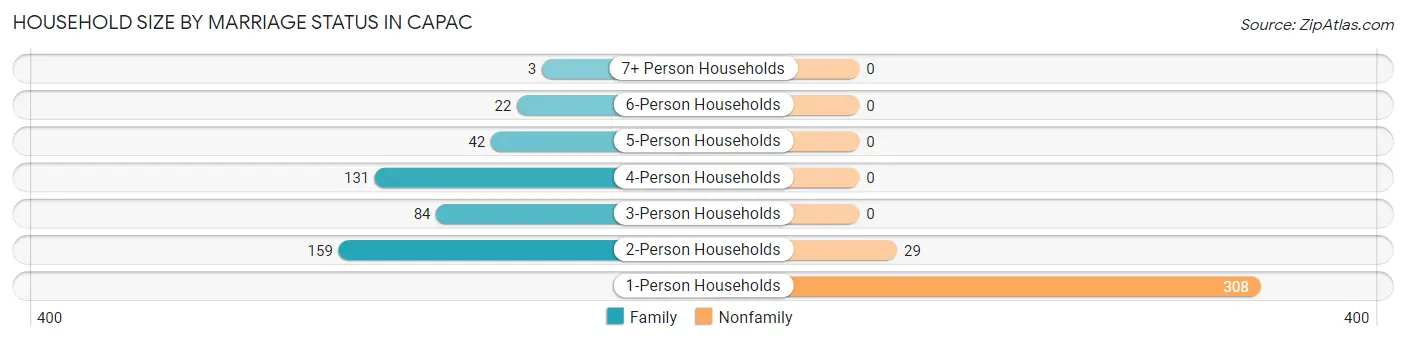
| Household Size | Family Households | Nonfamily Households |
| 1-Person Households | - | 308 (39.6%) |
| 2-Person Households | 159 (20.4%) | 29 (3.7%) |
| 3-Person Households | 84 (10.8%) | 0 (0.0%) |
| 4-Person Households | 131 (16.8%) | 0 (0.0%) |
| 5-Person Households | 42 (5.4%) | 0 (0.0%) |
| 6-Person Households | 22 (2.8%) | 0 (0.0%) |
| 7+ Person Households | 3 (0.4%) | 0 (0.0%) |
| Total | 441 (56.7%) | 337 (43.3%) |
Female Fertility in Capac
Fertility by Age in Capac
Average fertility rate in Capac is 140.0 births per 1,000 women. Women in the age bracket of 20 to 34 years have the highest fertility rate with 294.0 births per 1,000 women. Women in the age bracket of 20 to 34 years acount for 100.0% of all women with births.
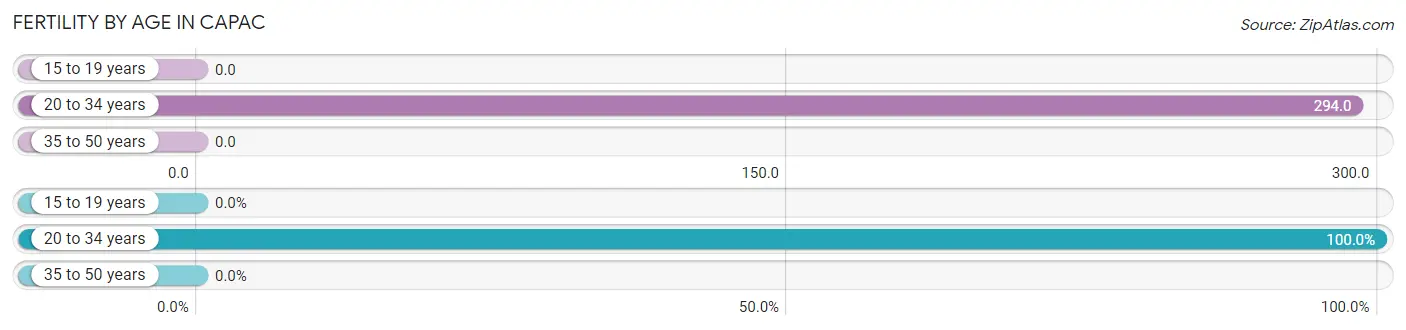
| Age Bracket | Women with Births | Births / 1,000 Women |
| 15 to 19 years | 0 (0.0%) | 0.0 |
| 20 to 34 years | 55 (100.0%) | 294.0 |
| 35 to 50 years | 0 (0.0%) | 0.0 |
| Total | 55 (100.0%) | 140.0 |
Fertility by Age by Marriage Status in Capac
58.2% of women with births (55) in Capac are married. The highest percentage of unmarried women with births falls into 20 to 34 years age bracket with 41.8% of them unmarried at the time of birth, while the lowest percentage of unmarried women with births belong to 20 to 34 years age bracket with 41.8% of them unmarried.
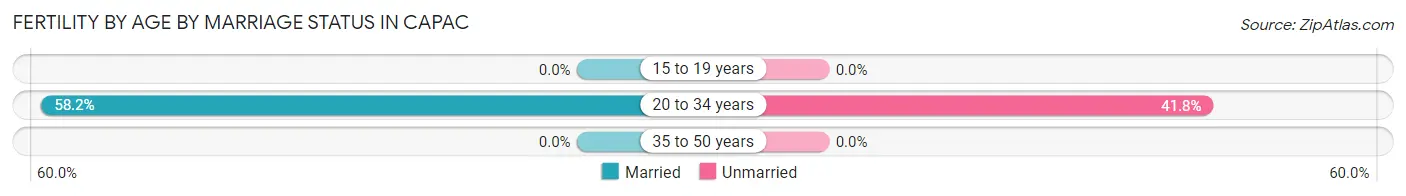
| Age Bracket | Married | Unmarried |
| 15 to 19 years | 0 (0.0%) | 0 (0.0%) |
| 20 to 34 years | 32 (58.2%) | 23 (41.8%) |
| 35 to 50 years | 0 (0.0%) | 0 (0.0%) |
| Total | 32 (58.2%) | 23 (41.8%) |
Fertility by Education in Capac
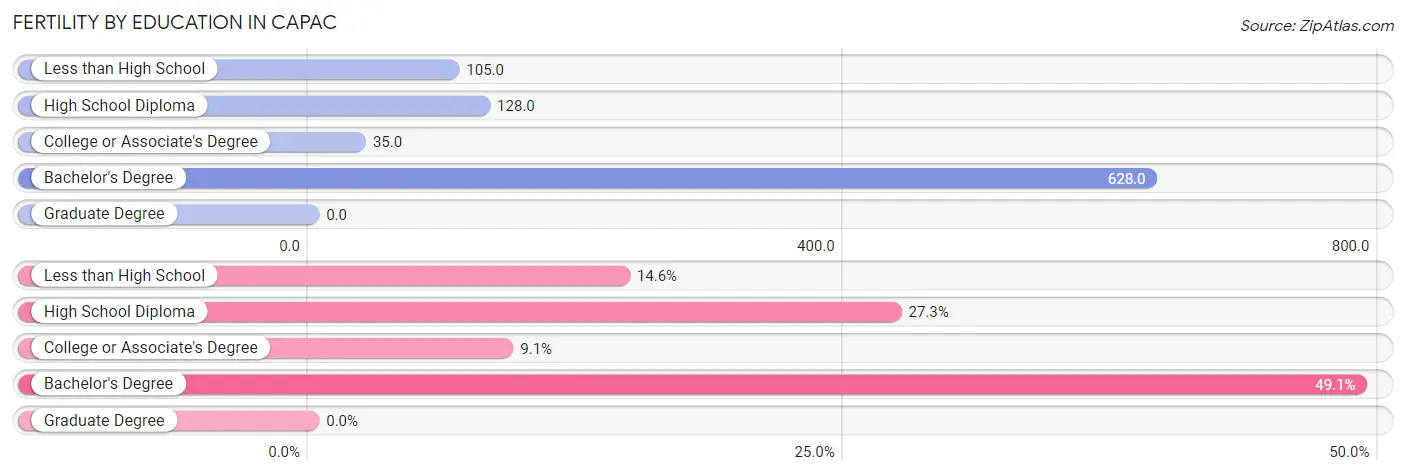
| Educational Attainment | Women with Births | Births / 1,000 Women |
| Less than High School | 8 (14.5%) | 105.0 |
| High School Diploma | 15 (27.3%) | 128.0 |
| College or Associate's Degree | 5 (9.1%) | 35.0 |
| Bachelor's Degree | 27 (49.1%) | 628.0 |
| Graduate Degree | 0 (0.0%) | 0.0 |
| Total | 55 (100.0%) | 140.0 |
Fertility by Education by Marriage Status in Capac
41.8% of women with births in Capac are unmarried. Women with the educational attainment of college or associate's degree are most likely to be married with 100.0% of them married at childbirth, while women with the educational attainment of less than high school are least likely to be married with 100.0% of them unmarried at childbirth.
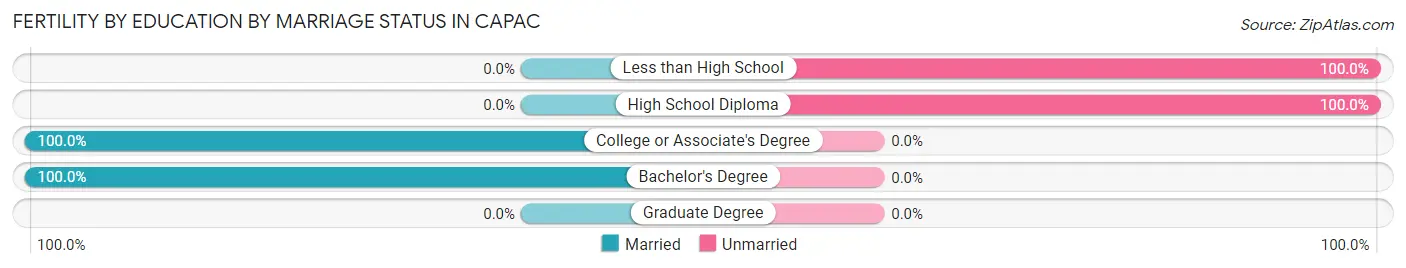
| Educational Attainment | Married | Unmarried |
| Less than High School | 0 (0.0%) | 8 (100.0%) |
| High School Diploma | 0 (0.0%) | 15 (100.0%) |
| College or Associate's Degree | 5 (100.0%) | 0 (0.0%) |
| Bachelor's Degree | 27 (100.0%) | 0 (0.0%) |
| Graduate Degree | 0 (0.0%) | 0 (0.0%) |
| Total | 32 (58.2%) | 23 (41.8%) |
Employment Characteristics in Capac
Employment by Class of Employer in Capac
Among the 881 employed individuals in Capac, private company employees (675 | 76.6%), self-employed (not incorporated) (88 | 10.0%), and not-for-profit organizations (71 | 8.1%) make up the most common classes of employment.
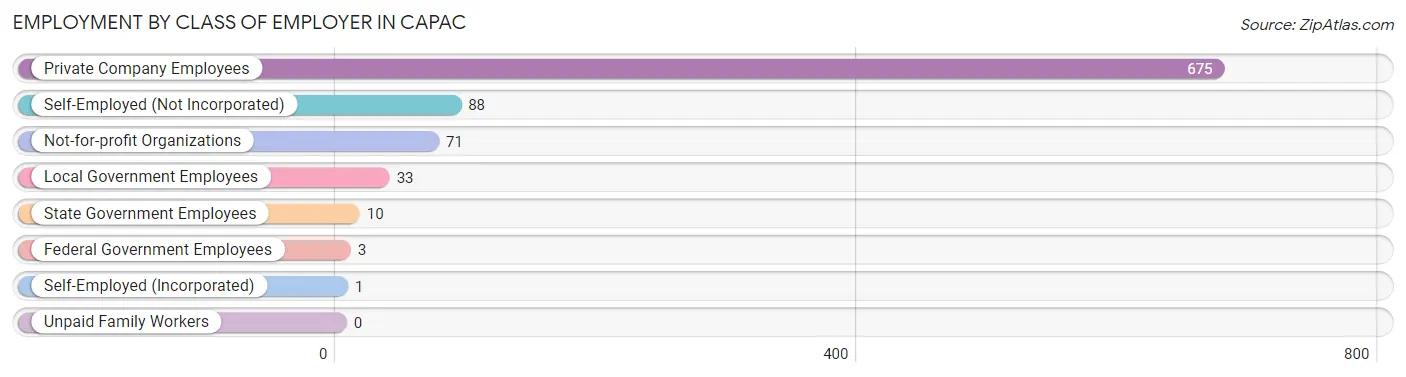
| Employer Class | # Employees | % Employees |
| Private Company Employees | 675 | 76.6% |
| Self-Employed (Incorporated) | 1 | 0.1% |
| Self-Employed (Not Incorporated) | 88 | 10.0% |
| Not-for-profit Organizations | 71 | 8.1% |
| Local Government Employees | 33 | 3.7% |
| State Government Employees | 10 | 1.1% |
| Federal Government Employees | 3 | 0.3% |
| Unpaid Family Workers | 0 | 0.0% |
| Total | 881 | 100.0% |
Employment Status by Age in Capac
According to the labor force statistics for Capac, out of the total population over 16 years of age (1,501), 66.4% or 997 individuals are in the labor force, with 8.0% or 80 of them unemployed. The age group with the highest labor force participation rate is 20 to 24 years, with 95.9% or 116 individuals in the labor force. Within the labor force, the 16 to 19 years age range has the highest percentage of unemployed individuals, with 36.8% or 21 of them being unemployed.
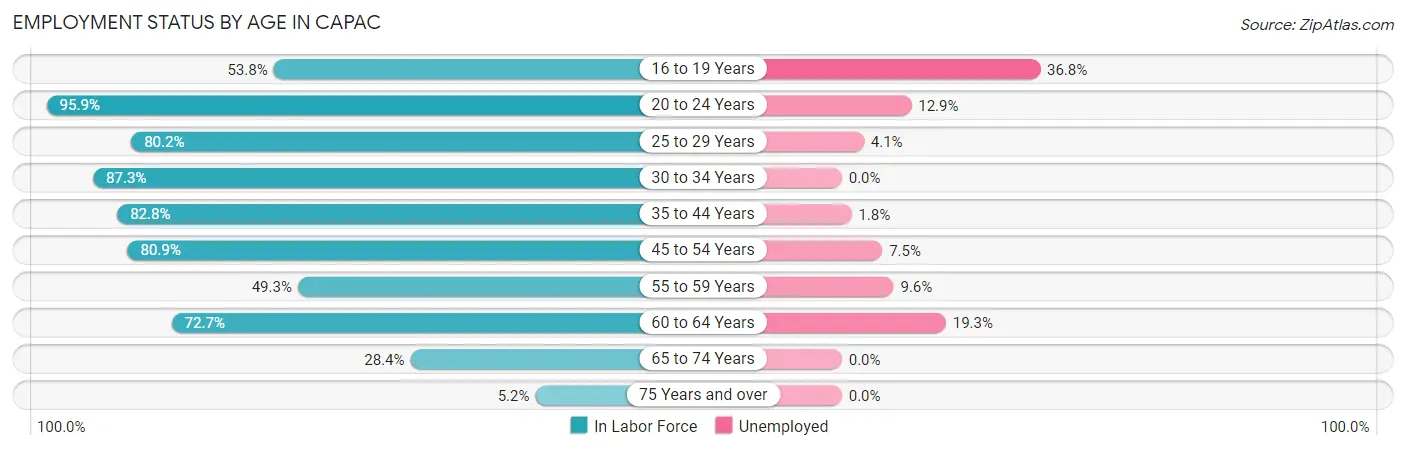
| Age Bracket | In Labor Force | Unemployed |
| 16 to 19 Years | 57 (53.8%) | 21 (36.8%) |
| 20 to 24 Years | 116 (95.9%) | 15 (12.9%) |
| 25 to 29 Years | 97 (80.2%) | 4 (4.1%) |
| 30 to 34 Years | 117 (87.3%) | 0 (0.0%) |
| 35 to 44 Years | 226 (82.8%) | 4 (1.8%) |
| 45 to 54 Years | 161 (80.9%) | 12 (7.5%) |
| 55 to 59 Years | 73 (49.3%) | 7 (9.6%) |
| 60 to 64 Years | 88 (72.7%) | 17 (19.3%) |
| 65 to 74 Years | 57 (28.4%) | 0 (0.0%) |
| 75 Years and over | 4 (5.2%) | 0 (0.0%) |
| Total | 997 (66.4%) | 80 (8.0%) |
Employment Status by Educational Attainment in Capac
According to labor force statistics for Capac, 76.5% of individuals (762) out of the total population between 25 and 64 years of age (996) are in the labor force, with 5.8% or 44 of them being unemployed. The group with the highest labor force participation rate are those with the educational attainment of bachelor's degree or higher, with 90.5% or 105 individuals in the labor force. Within the labor force, individuals with less than high school education have the highest percentage of unemployment, with 12.9% or 9 of them being unemployed.
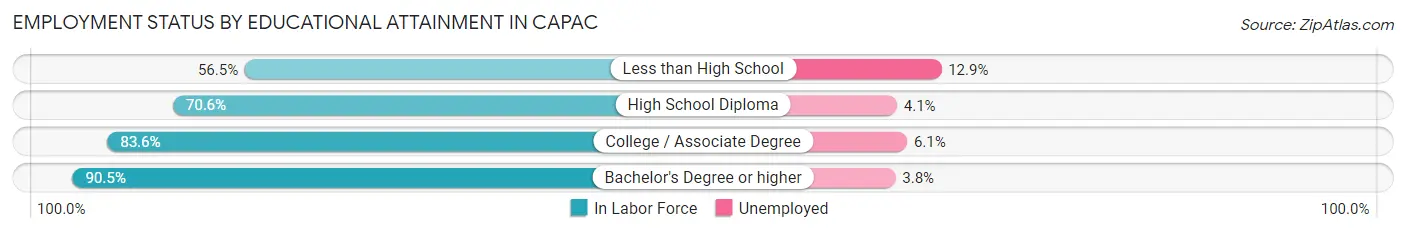
| Educational Attainment | In Labor Force | Unemployed |
| Less than High School | 70 (56.5%) | 16 (12.9%) |
| High School Diploma | 245 (70.6%) | 14 (4.1%) |
| College / Associate Degree | 342 (83.6%) | 25 (6.1%) |
| Bachelor's Degree or higher | 105 (90.5%) | 4 (3.8%) |
| Total | 762 (76.5%) | 58 (5.8%) |
Employment Occupations by Sex in Capac
Management, Business, Science and Arts Occupations
The most common Management, Business, Science and Arts occupations in Capac are Health Diagnosing & Treating (50 | 5.5%), Management (37 | 4.0%), Community & Social Service (37 | 4.0%), Health Technologists (35 | 3.8%), and Business & Financial (22 | 2.4%).
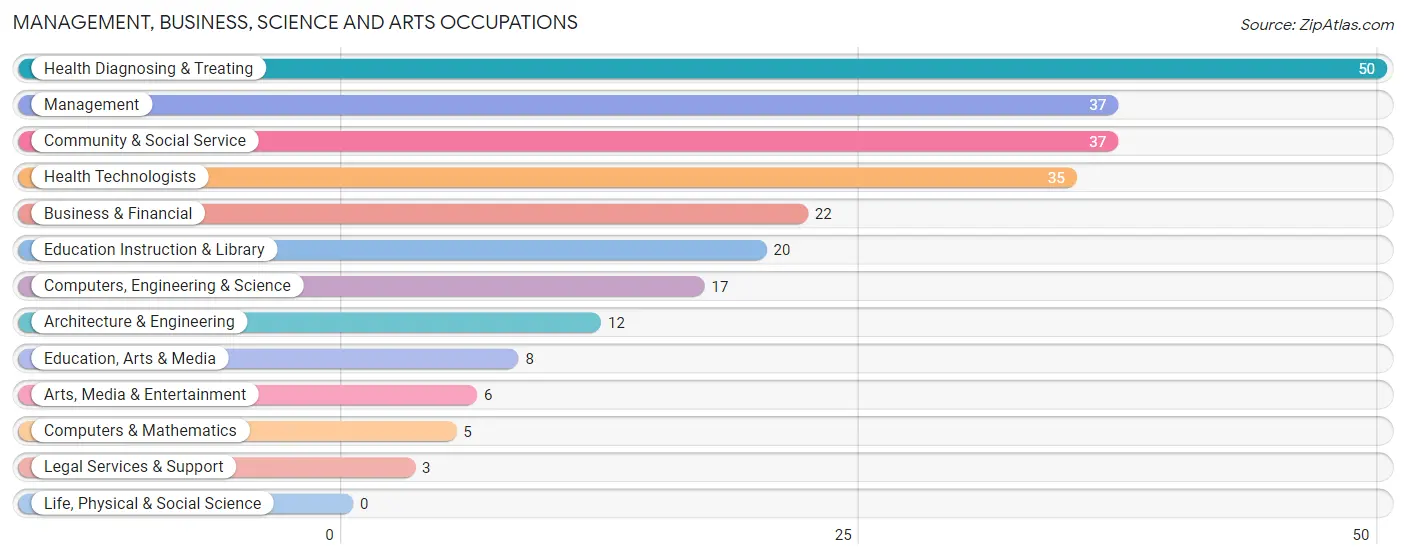
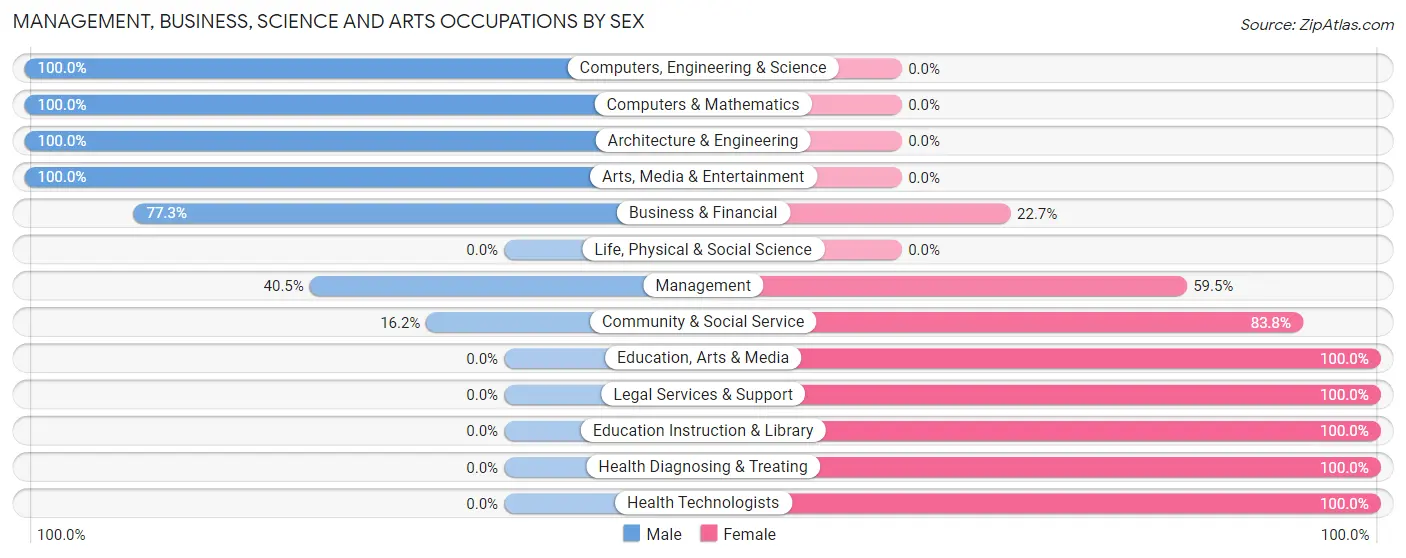
Management, Business, Science and Arts Occupations by Sex
Within the Management, Business, Science and Arts occupations in Capac, the most male-oriented occupations are Computers, Engineering & Science (100.0%), Computers & Mathematics (100.0%), and Architecture & Engineering (100.0%), while the most female-oriented occupations are Education, Arts & Media (100.0%), Legal Services & Support (100.0%), and Education Instruction & Library (100.0%).
| Occupation | Male | Female |
| Management | 15 (40.5%) | 22 (59.5%) |
| Business & Financial | 17 (77.3%) | 5 (22.7%) |
| Computers, Engineering & Science | 17 (100.0%) | 0 (0.0%) |
| Computers & Mathematics | 5 (100.0%) | 0 (0.0%) |
| Architecture & Engineering | 12 (100.0%) | 0 (0.0%) |
| Life, Physical & Social Science | 0 (0.0%) | 0 (0.0%) |
| Community & Social Service | 6 (16.2%) | 31 (83.8%) |
| Education, Arts & Media | 0 (0.0%) | 8 (100.0%) |
| Legal Services & Support | 0 (0.0%) | 3 (100.0%) |
| Education Instruction & Library | 0 (0.0%) | 20 (100.0%) |
| Arts, Media & Entertainment | 6 (100.0%) | 0 (0.0%) |
| Health Diagnosing & Treating | 0 (0.0%) | 50 (100.0%) |
| Health Technologists | 0 (0.0%) | 35 (100.0%) |
| Total (Category) | 55 (33.7%) | 108 (66.3%) |
| Total (Overall) | 504 (55.0%) | 412 (45.0%) |
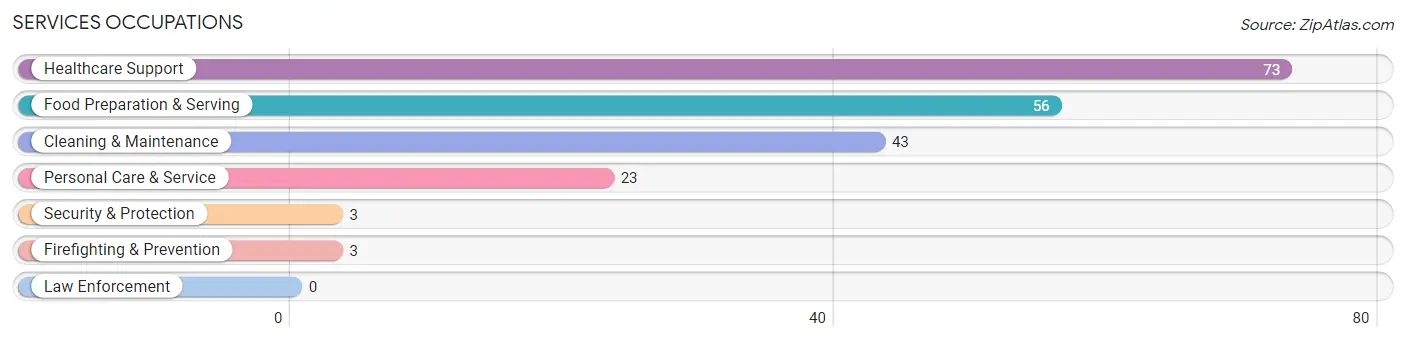
Services Occupations
The most common Services occupations in Capac are Healthcare Support (73 | 8.0%), Food Preparation & Serving (56 | 6.1%), Cleaning & Maintenance (43 | 4.7%), Personal Care & Service (23 | 2.5%), and Security & Protection (3 | 0.3%).
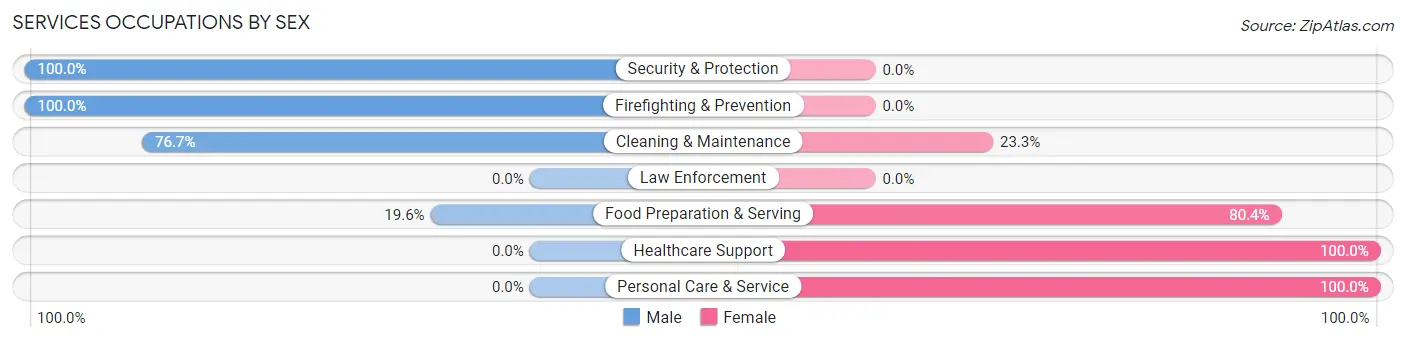
Services Occupations by Sex
Within the Services occupations in Capac, the most male-oriented occupations are Security & Protection (100.0%), Firefighting & Prevention (100.0%), and Cleaning & Maintenance (76.7%), while the most female-oriented occupations are Healthcare Support (100.0%), Personal Care & Service (100.0%), and Food Preparation & Serving (80.4%).
| Occupation | Male | Female |
| Healthcare Support | 0 (0.0%) | 73 (100.0%) |
| Security & Protection | 3 (100.0%) | 0 (0.0%) |
| Firefighting & Prevention | 3 (100.0%) | 0 (0.0%) |
| Law Enforcement | 0 (0.0%) | 0 (0.0%) |
| Food Preparation & Serving | 11 (19.6%) | 45 (80.4%) |
| Cleaning & Maintenance | 33 (76.7%) | 10 (23.3%) |
| Personal Care & Service | 0 (0.0%) | 23 (100.0%) |
| Total (Category) | 47 (23.7%) | 151 (76.3%) |
| Total (Overall) | 504 (55.0%) | 412 (45.0%) |
Sales and Office Occupations
The most common Sales and Office occupations in Capac are Office & Administration (66 | 7.2%), and Sales & Related (61 | 6.7%).
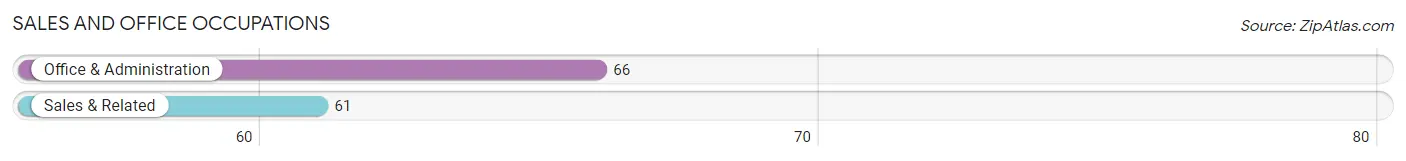
Sales and Office Occupations by Sex
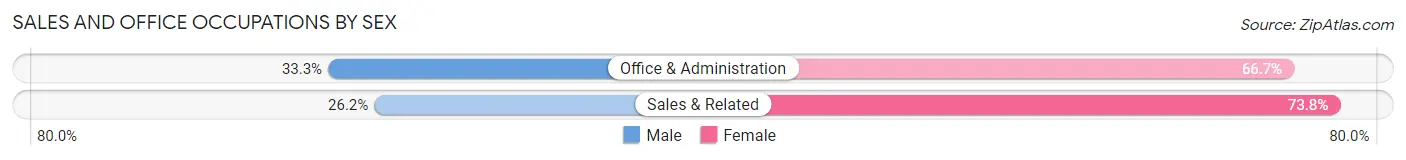
| Occupation | Male | Female |
| Sales & Related | 16 (26.2%) | 45 (73.8%) |
| Office & Administration | 22 (33.3%) | 44 (66.7%) |
| Total (Category) | 38 (29.9%) | 89 (70.1%) |
| Total (Overall) | 504 (55.0%) | 412 (45.0%) |
Natural Resources, Construction and Maintenance Occupations
The most common Natural Resources, Construction and Maintenance occupations in Capac are Construction & Extraction (123 | 13.4%), Installation, Maintenance & Repair (48 | 5.2%), and Farming, Fishing & Forestry (5 | 0.5%).
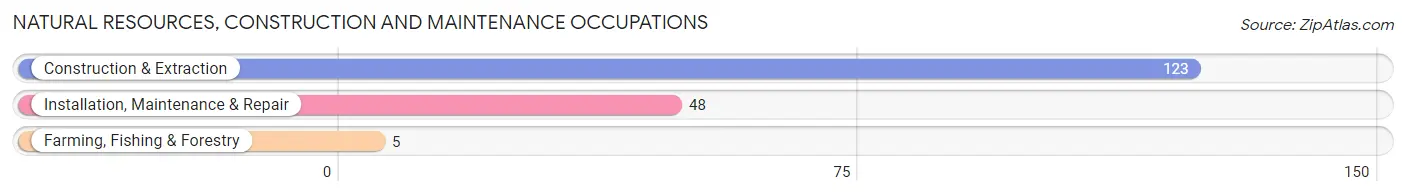
Natural Resources, Construction and Maintenance Occupations by Sex
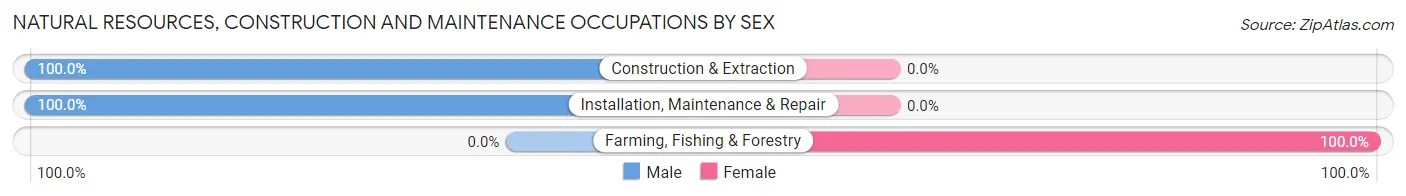
| Occupation | Male | Female |
| Farming, Fishing & Forestry | 0 (0.0%) | 5 (100.0%) |
| Construction & Extraction | 123 (100.0%) | 0 (0.0%) |
| Installation, Maintenance & Repair | 48 (100.0%) | 0 (0.0%) |
| Total (Category) | 171 (97.2%) | 5 (2.8%) |
| Total (Overall) | 504 (55.0%) | 412 (45.0%) |
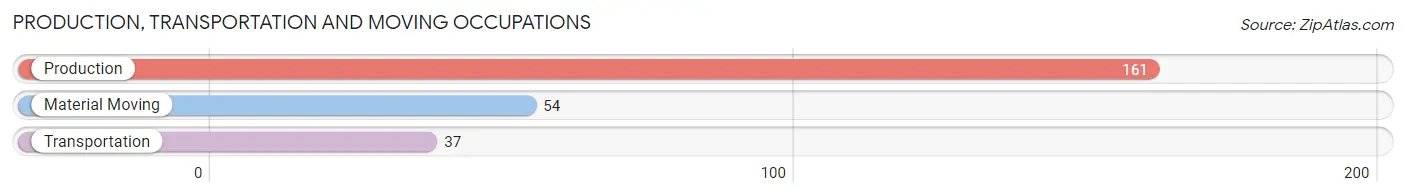
Production, Transportation and Moving Occupations
The most common Production, Transportation and Moving occupations in Capac are Production (161 | 17.6%), Material Moving (54 | 5.9%), and Transportation (37 | 4.0%).
Production, Transportation and Moving Occupations by Sex
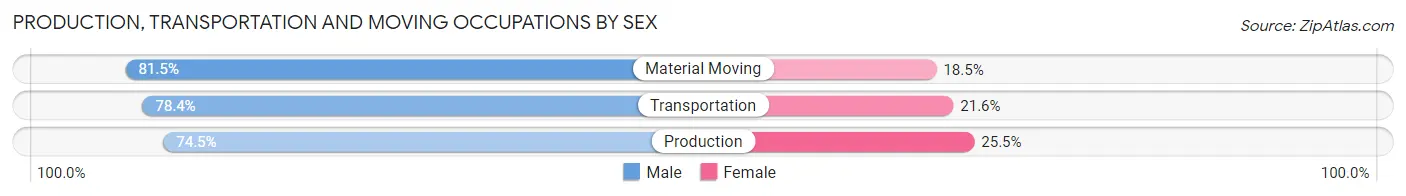
| Occupation | Male | Female |
| Production | 120 (74.5%) | 41 (25.5%) |
| Transportation | 29 (78.4%) | 8 (21.6%) |
| Material Moving | 44 (81.5%) | 10 (18.5%) |
| Total (Category) | 193 (76.6%) | 59 (23.4%) |
| Total (Overall) | 504 (55.0%) | 412 (45.0%) |
Employment Industries by Sex in Capac
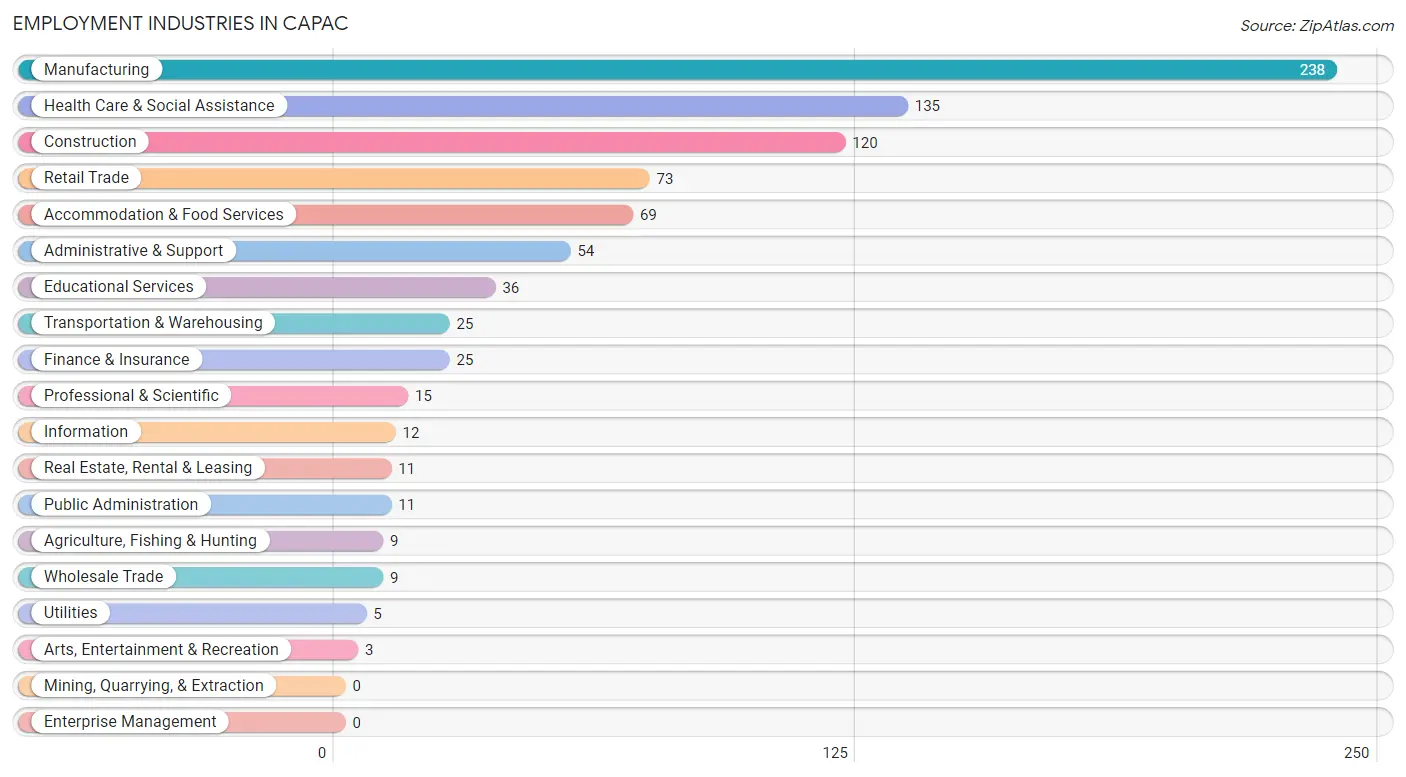
Employment Industries in Capac
The major employment industries in Capac include Manufacturing (238 | 26.0%), Health Care & Social Assistance (135 | 14.7%), Construction (120 | 13.1%), Retail Trade (73 | 8.0%), and Accommodation & Food Services (69 | 7.5%).
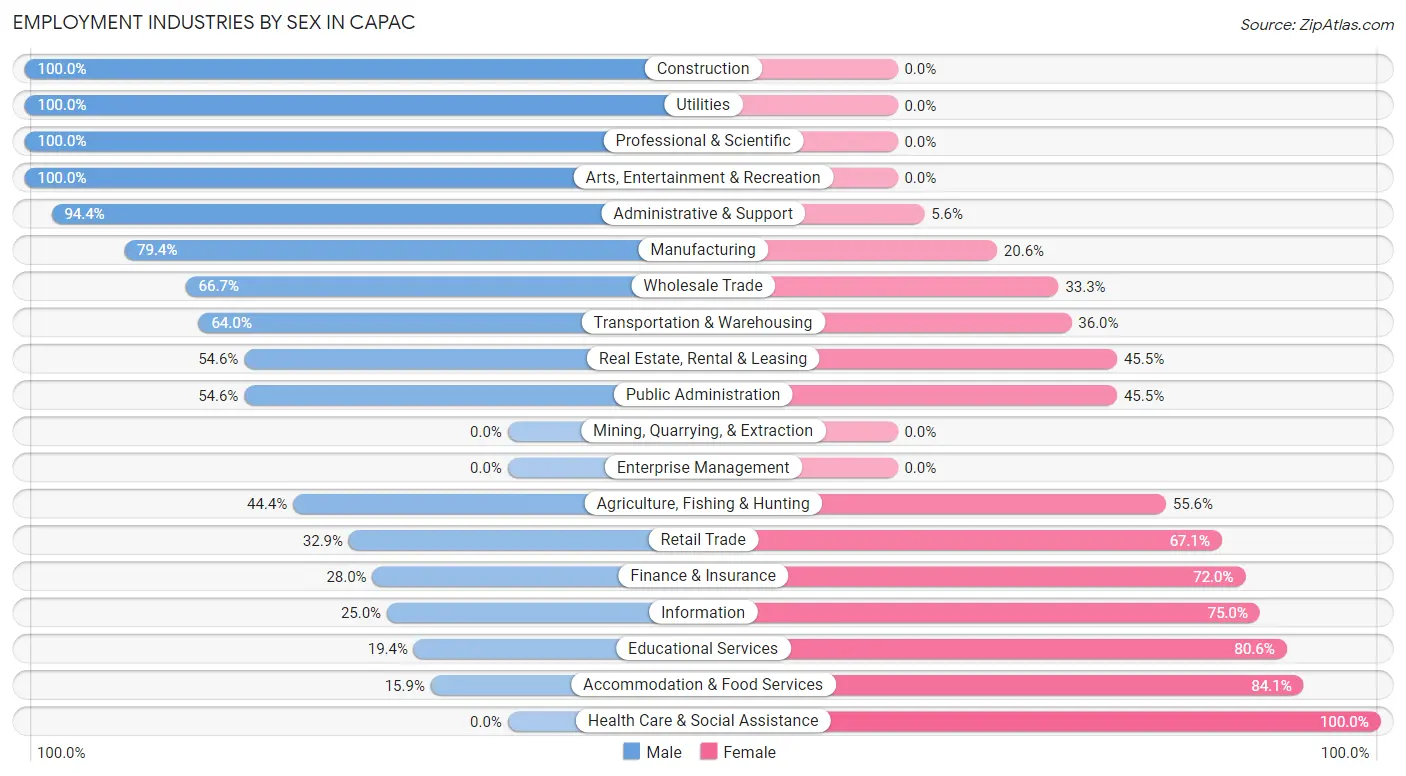
Employment Industries by Sex in Capac
The Capac industries that see more men than women are Construction (100.0%), Utilities (100.0%), and Professional & Scientific (100.0%), whereas the industries that tend to have a higher number of women are Health Care & Social Assistance (100.0%), Accommodation & Food Services (84.1%), and Educational Services (80.6%).
| Industry | Male | Female |
| Agriculture, Fishing & Hunting | 4 (44.4%) | 5 (55.6%) |
| Mining, Quarrying, & Extraction | 0 (0.0%) | 0 (0.0%) |
| Construction | 120 (100.0%) | 0 (0.0%) |
| Manufacturing | 189 (79.4%) | 49 (20.6%) |
| Wholesale Trade | 6 (66.7%) | 3 (33.3%) |
| Retail Trade | 24 (32.9%) | 49 (67.1%) |
| Transportation & Warehousing | 16 (64.0%) | 9 (36.0%) |
| Utilities | 5 (100.0%) | 0 (0.0%) |
| Information | 3 (25.0%) | 9 (75.0%) |
| Finance & Insurance | 7 (28.0%) | 18 (72.0%) |
| Real Estate, Rental & Leasing | 6 (54.5%) | 5 (45.5%) |
| Professional & Scientific | 15 (100.0%) | 0 (0.0%) |
| Enterprise Management | 0 (0.0%) | 0 (0.0%) |
| Administrative & Support | 51 (94.4%) | 3 (5.6%) |
| Educational Services | 7 (19.4%) | 29 (80.6%) |
| Health Care & Social Assistance | 0 (0.0%) | 135 (100.0%) |
| Arts, Entertainment & Recreation | 3 (100.0%) | 0 (0.0%) |
| Accommodation & Food Services | 11 (15.9%) | 58 (84.1%) |
| Public Administration | 6 (54.5%) | 5 (45.5%) |
| Total | 504 (55.0%) | 412 (45.0%) |
Education in Capac
School Enrollment in Capac
The most common levels of schooling among the 369 students in Capac are high school (103 | 27.9%), middle school (91 | 24.7%), and elementary school (84 | 22.8%).
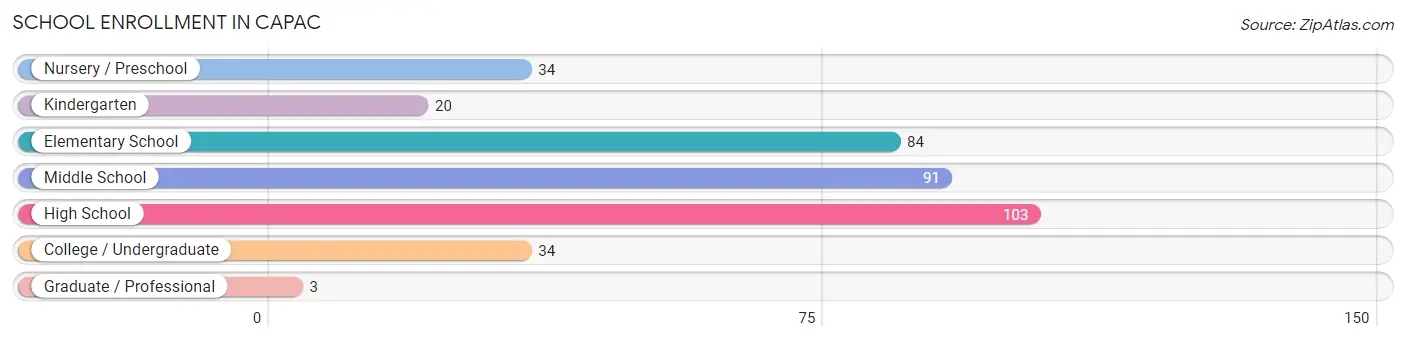
| School Level | # Students | % Students |
| Nursery / Preschool | 34 | 9.2% |
| Kindergarten | 20 | 5.4% |
| Elementary School | 84 | 22.8% |
| Middle School | 91 | 24.7% |
| High School | 103 | 27.9% |
| College / Undergraduate | 34 | 9.2% |
| Graduate / Professional | 3 | 0.8% |
| Total | 369 | 100.0% |
School Enrollment by Age by Funding Source in Capac
Out of a total of 369 students who are enrolled in schools in Capac, 27 (7.3%) attend a private institution, while the remaining 342 (92.7%) are enrolled in public schools. The age group of 3 to 4 year olds has the highest likelihood of being enrolled in private schools, with 4 (26.7% in the age bracket) enrolled. Conversely, the age group of 5 to 9 year old has the lowest likelihood of being enrolled in a private school, with 109 (100.0% in the age bracket) attending a public institution.
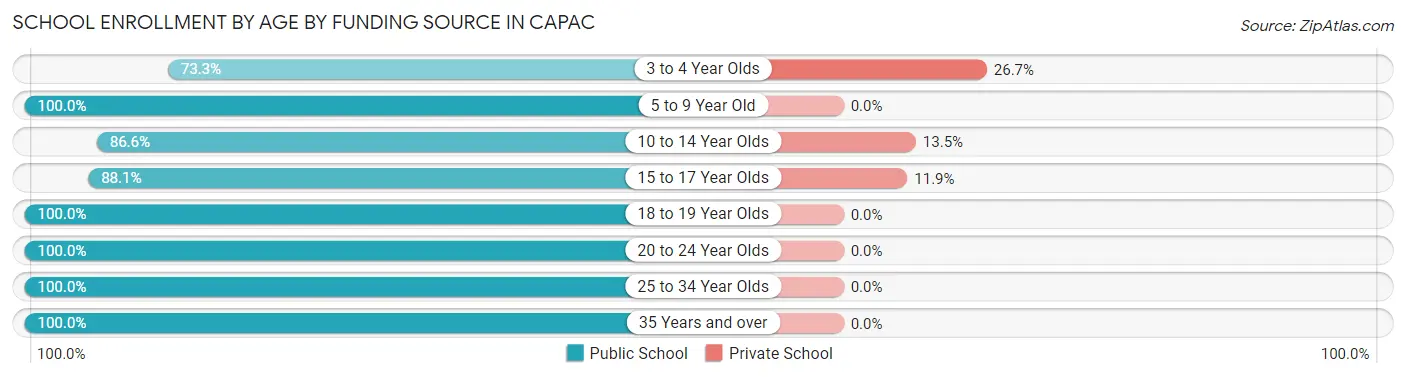
| Age Bracket | Public School | Private School |
| 3 to 4 Year Olds | 11 (73.3%) | 4 (26.7%) |
| 5 to 9 Year Old | 109 (100.0%) | 0 (0.0%) |
| 10 to 14 Year Olds | 103 (86.6%) | 16 (13.5%) |
| 15 to 17 Year Olds | 52 (88.1%) | 7 (11.9%) |
| 18 to 19 Year Olds | 34 (100.0%) | 0 (0.0%) |
| 20 to 24 Year Olds | 11 (100.0%) | 0 (0.0%) |
| 25 to 34 Year Olds | 7 (100.0%) | 0 (0.0%) |
| 35 Years and over | 15 (100.0%) | 0 (0.0%) |
| Total | 342 (92.7%) | 27 (7.3%) |
Educational Attainment by Field of Study in Capac
Business (50 | 30.3%), science & technology (38 | 23.0%), education (31 | 18.8%), communications (16 | 9.7%), and arts & humanities (10 | 6.1%) are the most common fields of study among 165 individuals in Capac who have obtained a bachelor's degree or higher.
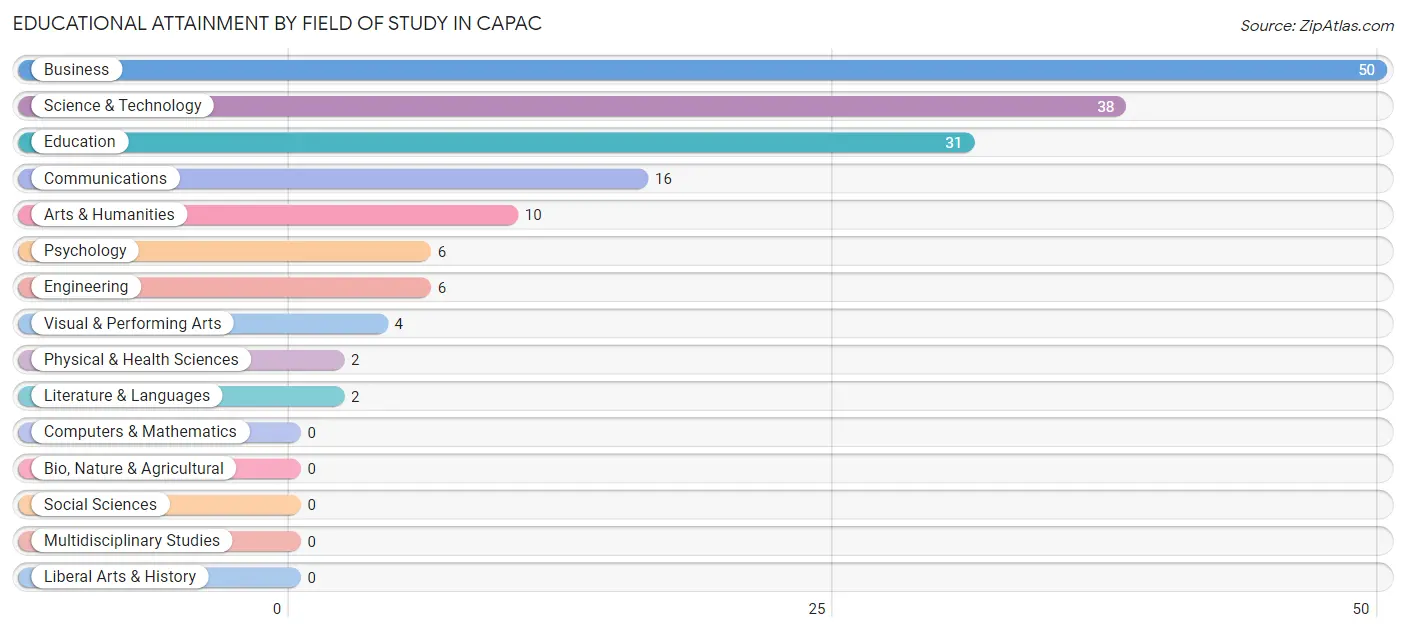
| Field of Study | # Graduates | % Graduates |
| Computers & Mathematics | 0 | 0.0% |
| Bio, Nature & Agricultural | 0 | 0.0% |
| Physical & Health Sciences | 2 | 1.2% |
| Psychology | 6 | 3.6% |
| Social Sciences | 0 | 0.0% |
| Engineering | 6 | 3.6% |
| Multidisciplinary Studies | 0 | 0.0% |
| Science & Technology | 38 | 23.0% |
| Business | 50 | 30.3% |
| Education | 31 | 18.8% |
| Literature & Languages | 2 | 1.2% |
| Liberal Arts & History | 0 | 0.0% |
| Visual & Performing Arts | 4 | 2.4% |
| Communications | 16 | 9.7% |
| Arts & Humanities | 10 | 6.1% |
| Total | 165 | 100.0% |
Transportation & Commute in Capac
Vehicle Availability by Sex in Capac
The most prevalent vehicle ownership categories in Capac are males with 2 vehicles (164, accounting for 32.9%) and females with 2 vehicles (138, making up 42.9%).
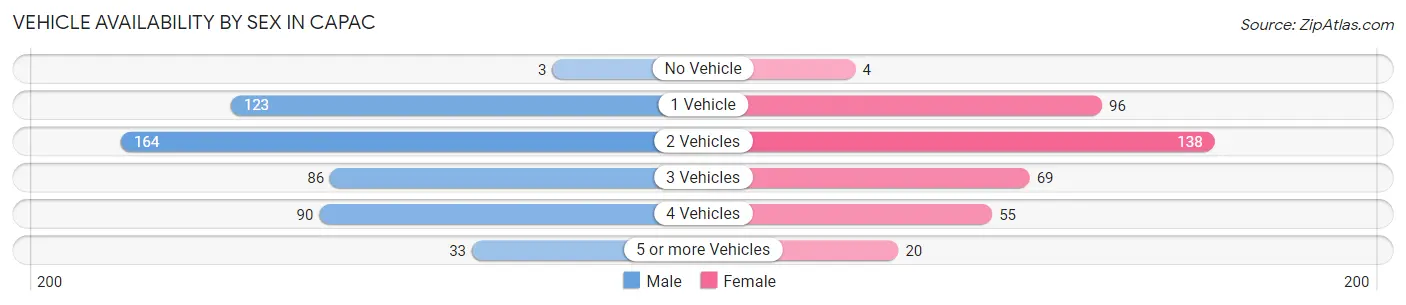
| Vehicles Available | Male | Female |
| No Vehicle | 3 (0.6%) | 4 (1.1%) |
| 1 Vehicle | 123 (24.6%) | 96 (25.1%) |
| 2 Vehicles | 164 (32.9%) | 138 (36.1%) |
| 3 Vehicles | 86 (17.2%) | 69 (18.1%) |
| 4 Vehicles | 90 (18.0%) | 55 (14.4%) |
| 5 or more Vehicles | 33 (6.6%) | 20 (5.2%) |
| Total | 499 (100.0%) | 382 (100.0%) |
Commute Time in Capac
The most frequently occuring commute durations in Capac are 45 to 59 minutes (208 commuters, 24.1%), 30 to 34 minutes (116 commuters, 13.4%), and less than 5 minutes (92 commuters, 10.7%).
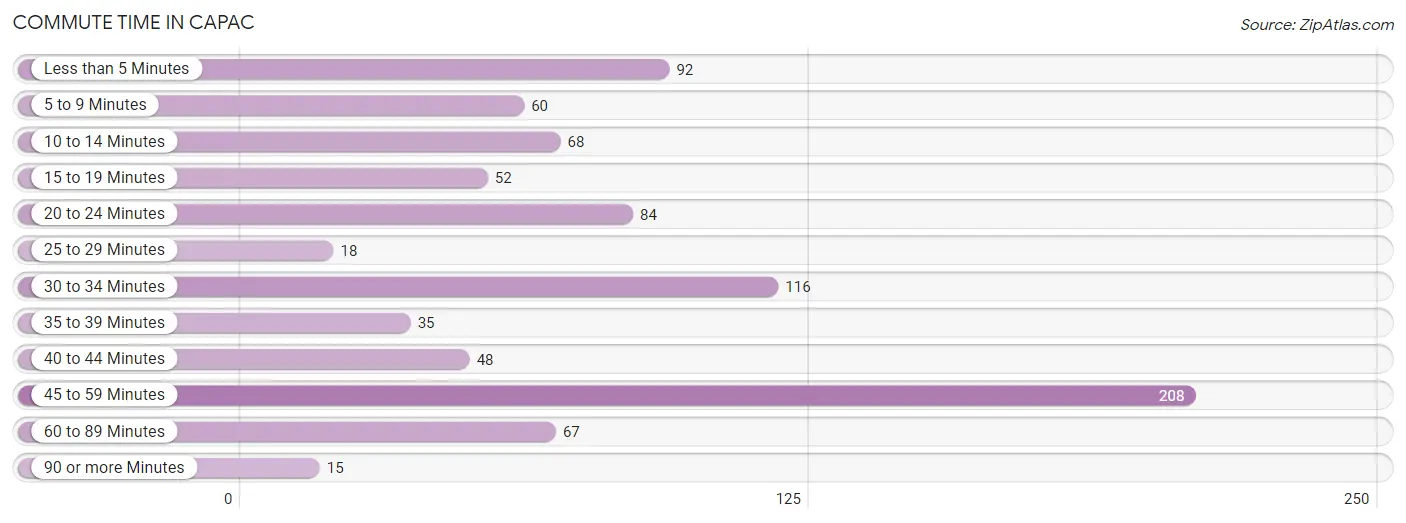
| Commute Time | # Commuters | % Commuters |
| Less than 5 Minutes | 92 | 10.7% |
| 5 to 9 Minutes | 60 | 7.0% |
| 10 to 14 Minutes | 68 | 7.9% |
| 15 to 19 Minutes | 52 | 6.0% |
| 20 to 24 Minutes | 84 | 9.7% |
| 25 to 29 Minutes | 18 | 2.1% |
| 30 to 34 Minutes | 116 | 13.4% |
| 35 to 39 Minutes | 35 | 4.1% |
| 40 to 44 Minutes | 48 | 5.6% |
| 45 to 59 Minutes | 208 | 24.1% |
| 60 to 89 Minutes | 67 | 7.8% |
| 90 or more Minutes | 15 | 1.7% |
Commute Time by Sex in Capac
The most common commute times in Capac are 45 to 59 minutes (151 commuters, 30.7%) for males and less than 5 minutes (86 commuters, 23.1%) for females.
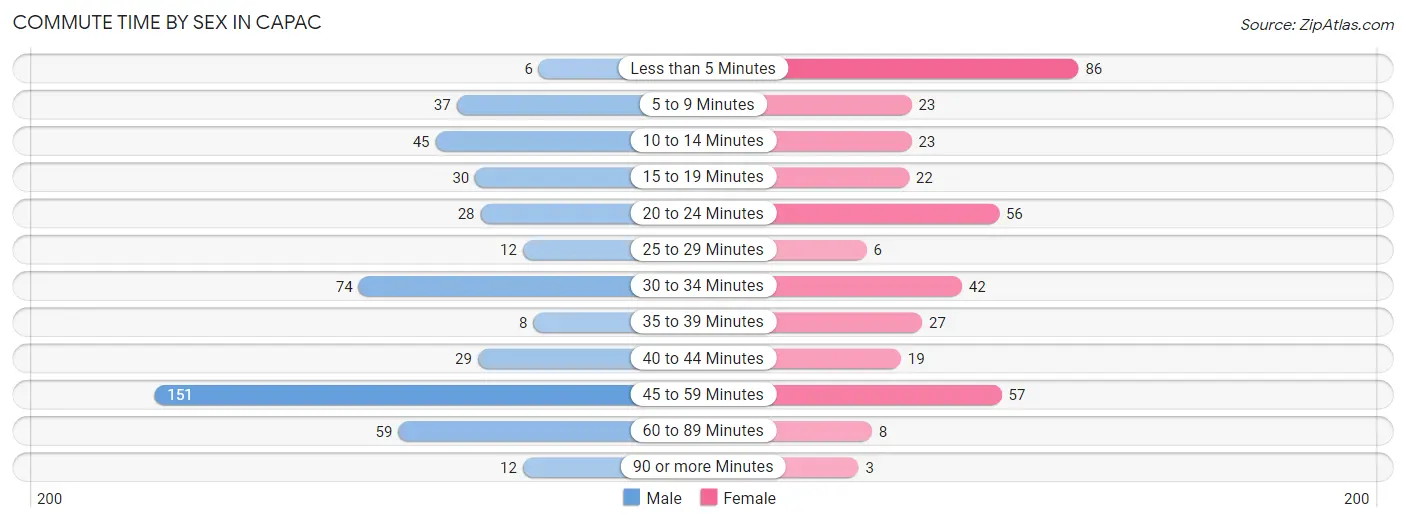
| Commute Time | Male | Female |
| Less than 5 Minutes | 6 (1.2%) | 86 (23.1%) |
| 5 to 9 Minutes | 37 (7.5%) | 23 (6.2%) |
| 10 to 14 Minutes | 45 (9.2%) | 23 (6.2%) |
| 15 to 19 Minutes | 30 (6.1%) | 22 (5.9%) |
| 20 to 24 Minutes | 28 (5.7%) | 56 (15.0%) |
| 25 to 29 Minutes | 12 (2.4%) | 6 (1.6%) |
| 30 to 34 Minutes | 74 (15.1%) | 42 (11.3%) |
| 35 to 39 Minutes | 8 (1.6%) | 27 (7.3%) |
| 40 to 44 Minutes | 29 (5.9%) | 19 (5.1%) |
| 45 to 59 Minutes | 151 (30.7%) | 57 (15.3%) |
| 60 to 89 Minutes | 59 (12.0%) | 8 (2.1%) |
| 90 or more Minutes | 12 (2.4%) | 3 (0.8%) |
Time of Departure to Work by Sex in Capac
The most frequent times of departure to work in Capac are 5:30 AM to 5:59 AM (98, 20.0%) for males and 12:00 PM to 3:59 PM (106, 28.5%) for females.
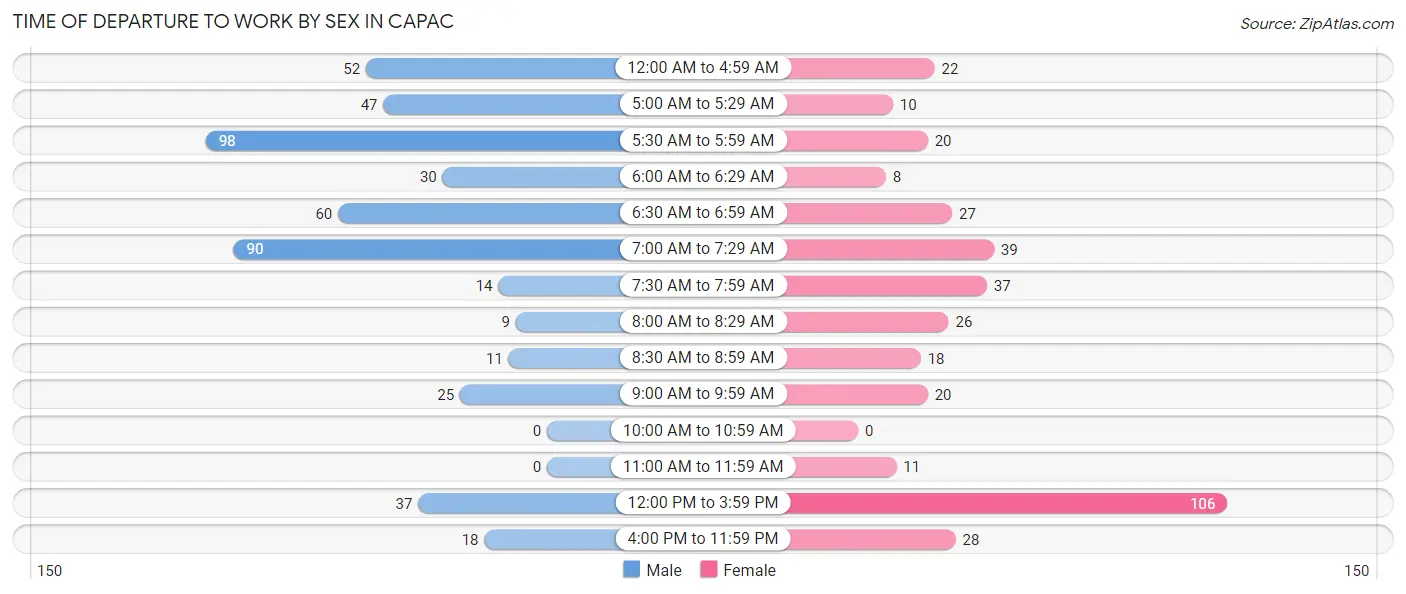
| Time of Departure | Male | Female |
| 12:00 AM to 4:59 AM | 52 (10.6%) | 22 (5.9%) |
| 5:00 AM to 5:29 AM | 47 (9.6%) | 10 (2.7%) |
| 5:30 AM to 5:59 AM | 98 (20.0%) | 20 (5.4%) |
| 6:00 AM to 6:29 AM | 30 (6.1%) | 8 (2.1%) |
| 6:30 AM to 6:59 AM | 60 (12.2%) | 27 (7.3%) |
| 7:00 AM to 7:29 AM | 90 (18.3%) | 39 (10.5%) |
| 7:30 AM to 7:59 AM | 14 (2.9%) | 37 (10.0%) |
| 8:00 AM to 8:29 AM | 9 (1.8%) | 26 (7.0%) |
| 8:30 AM to 8:59 AM | 11 (2.2%) | 18 (4.8%) |
| 9:00 AM to 9:59 AM | 25 (5.1%) | 20 (5.4%) |
| 10:00 AM to 10:59 AM | 0 (0.0%) | 0 (0.0%) |
| 11:00 AM to 11:59 AM | 0 (0.0%) | 11 (3.0%) |
| 12:00 PM to 3:59 PM | 37 (7.5%) | 106 (28.5%) |
| 4:00 PM to 11:59 PM | 18 (3.7%) | 28 (7.5%) |
| Total | 491 (100.0%) | 372 (100.0%) |
Housing Occupancy in Capac
Occupancy by Ownership in Capac
Of the total 778 dwellings in Capac, owner-occupied units account for 500 (64.3%), while renter-occupied units make up 278 (35.7%).
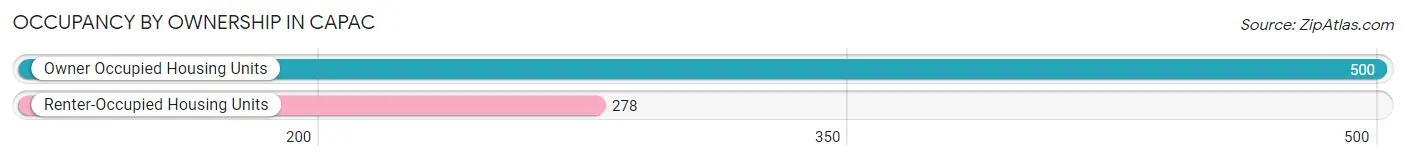
| Occupancy | # Housing Units | % Housing Units |
| Owner Occupied Housing Units | 500 | 64.3% |
| Renter-Occupied Housing Units | 278 | 35.7% |
| Total Occupied Housing Units | 778 | 100.0% |
Occupancy by Household Size in Capac
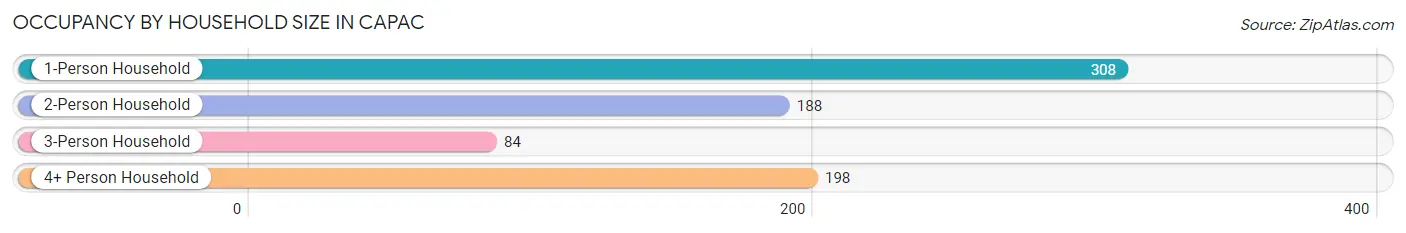
| Household Size | # Housing Units | % Housing Units |
| 1-Person Household | 308 | 39.6% |
| 2-Person Household | 188 | 24.2% |
| 3-Person Household | 84 | 10.8% |
| 4+ Person Household | 198 | 25.5% |
| Total Housing Units | 778 | 100.0% |
Occupancy by Ownership by Household Size in Capac
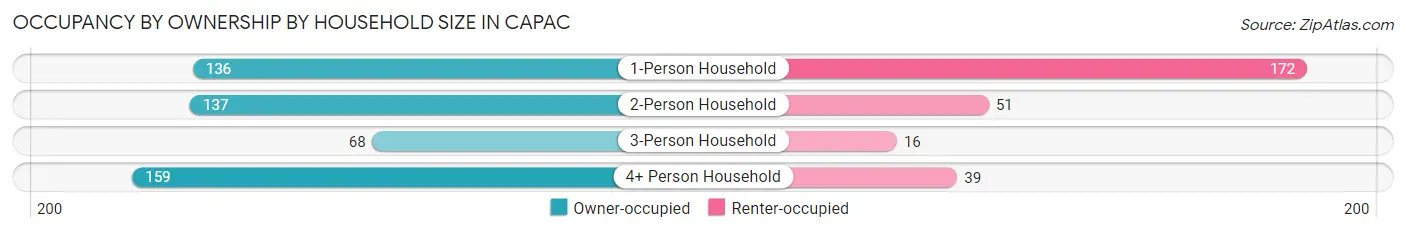
| Household Size | Owner-occupied | Renter-occupied |
| 1-Person Household | 136 (44.2%) | 172 (55.8%) |
| 2-Person Household | 137 (72.9%) | 51 (27.1%) |
| 3-Person Household | 68 (80.9%) | 16 (19.1%) |
| 4+ Person Household | 159 (80.3%) | 39 (19.7%) |
| Total Housing Units | 500 (64.3%) | 278 (35.7%) |
Occupancy by Educational Attainment in Capac
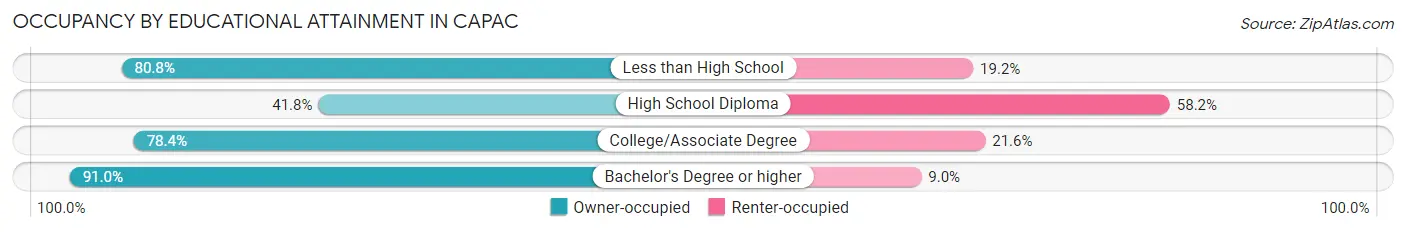
| Household Size | Owner-occupied | Renter-occupied |
| Less than High School | 63 (80.8%) | 15 (19.2%) |
| High School Diploma | 137 (41.8%) | 191 (58.2%) |
| College/Associate Degree | 239 (78.4%) | 66 (21.6%) |
| Bachelor's Degree or higher | 61 (91.0%) | 6 (9.0%) |
Occupancy by Age of Householder in Capac
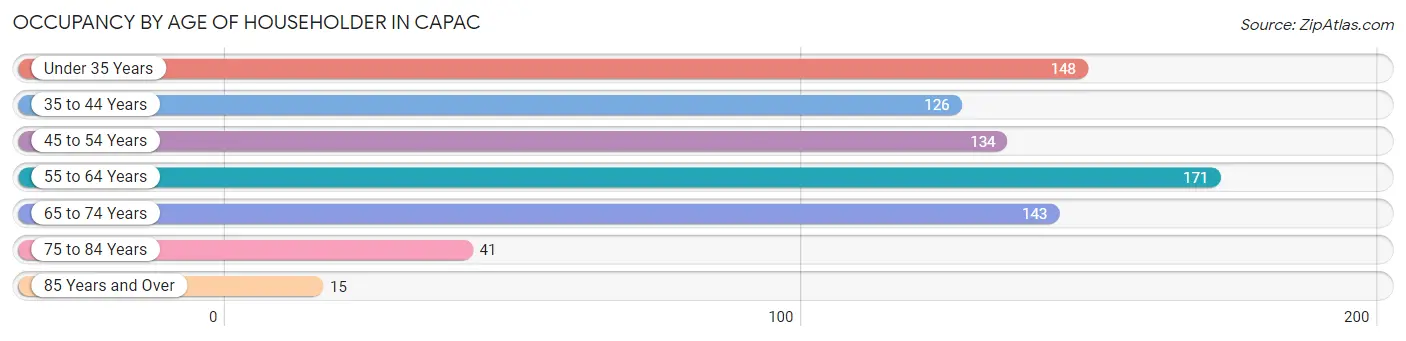
| Age Bracket | # Households | % Households |
| Under 35 Years | 148 | 19.0% |
| 35 to 44 Years | 126 | 16.2% |
| 45 to 54 Years | 134 | 17.2% |
| 55 to 64 Years | 171 | 22.0% |
| 65 to 74 Years | 143 | 18.4% |
| 75 to 84 Years | 41 | 5.3% |
| 85 Years and Over | 15 | 1.9% |
| Total | 778 | 100.0% |
Housing Finances in Capac
Median Income by Occupancy in Capac
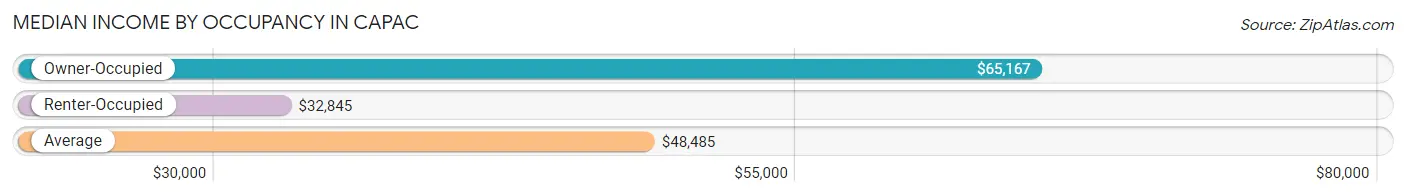
| Occupancy Type | # Households | Median Income |
| Owner-Occupied | 500 (64.3%) | $65,167 |
| Renter-Occupied | 278 (35.7%) | $32,845 |
| Average | 778 (100.0%) | $48,485 |
Occupancy by Householder Income Bracket in Capac
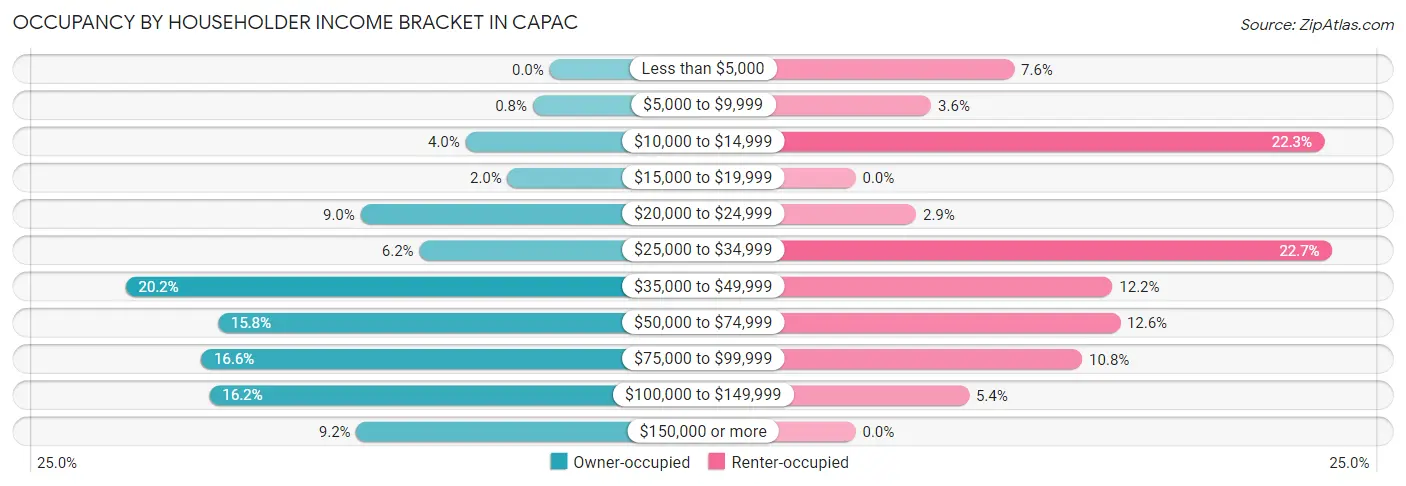
| Income Bracket | Owner-occupied | Renter-occupied |
| Less than $5,000 | 0 (0.0%) | 21 (7.5%) |
| $5,000 to $9,999 | 4 (0.8%) | 10 (3.6%) |
| $10,000 to $14,999 | 20 (4.0%) | 62 (22.3%) |
| $15,000 to $19,999 | 10 (2.0%) | 0 (0.0%) |
| $20,000 to $24,999 | 45 (9.0%) | 8 (2.9%) |
| $25,000 to $34,999 | 31 (6.2%) | 63 (22.7%) |
| $35,000 to $49,999 | 101 (20.2%) | 34 (12.2%) |
| $50,000 to $74,999 | 79 (15.8%) | 35 (12.6%) |
| $75,000 to $99,999 | 83 (16.6%) | 30 (10.8%) |
| $100,000 to $149,999 | 81 (16.2%) | 15 (5.4%) |
| $150,000 or more | 46 (9.2%) | 0 (0.0%) |
| Total | 500 (100.0%) | 278 (100.0%) |
Monthly Housing Cost Tiers in Capac
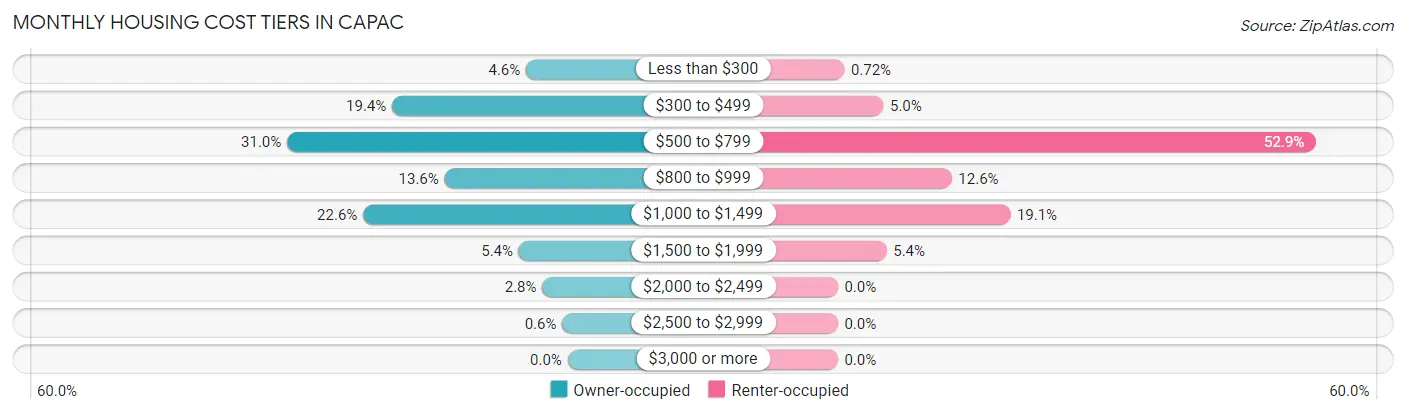
| Monthly Cost | Owner-occupied | Renter-occupied |
| Less than $300 | 23 (4.6%) | 2 (0.7%) |
| $300 to $499 | 97 (19.4%) | 14 (5.0%) |
| $500 to $799 | 155 (31.0%) | 147 (52.9%) |
| $800 to $999 | 68 (13.6%) | 35 (12.6%) |
| $1,000 to $1,499 | 113 (22.6%) | 53 (19.1%) |
| $1,500 to $1,999 | 27 (5.4%) | 15 (5.4%) |
| $2,000 to $2,499 | 14 (2.8%) | 0 (0.0%) |
| $2,500 to $2,999 | 3 (0.6%) | 0 (0.0%) |
| $3,000 or more | 0 (0.0%) | 0 (0.0%) |
| Total | 500 (100.0%) | 278 (100.0%) |
Physical Housing Characteristics in Capac
Housing Structures in Capac
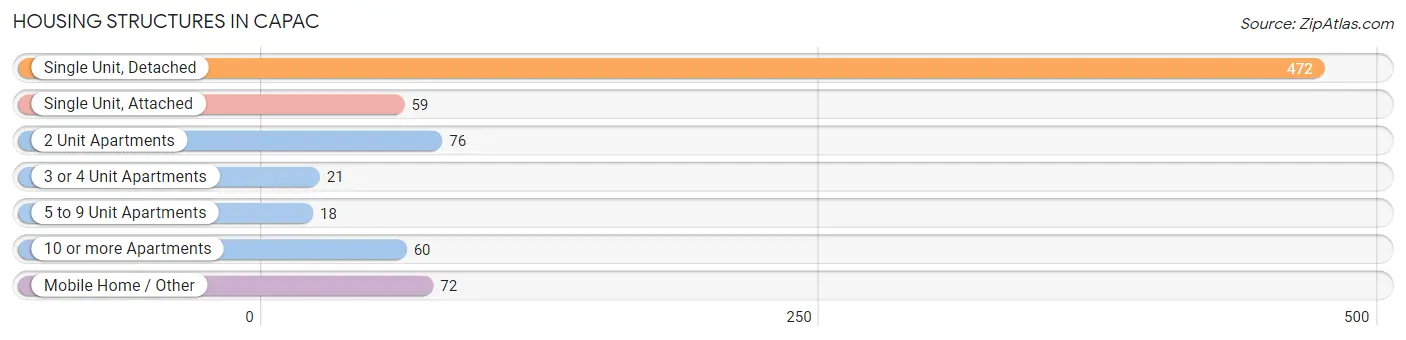
| Structure Type | # Housing Units | % Housing Units |
| Single Unit, Detached | 472 | 60.7% |
| Single Unit, Attached | 59 | 7.6% |
| 2 Unit Apartments | 76 | 9.8% |
| 3 or 4 Unit Apartments | 21 | 2.7% |
| 5 to 9 Unit Apartments | 18 | 2.3% |
| 10 or more Apartments | 60 | 7.7% |
| Mobile Home / Other | 72 | 9.2% |
| Total | 778 | 100.0% |
Housing Structures by Occupancy in Capac
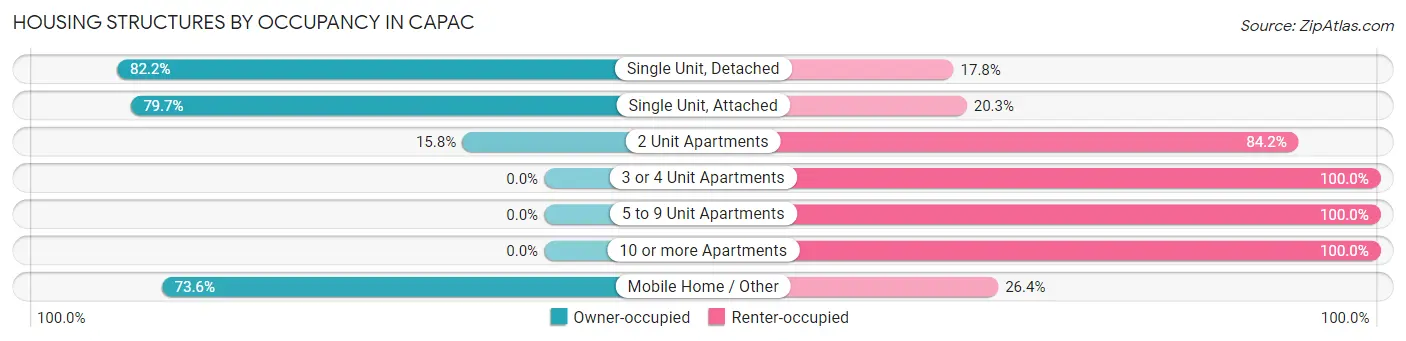
| Structure Type | Owner-occupied | Renter-occupied |
| Single Unit, Detached | 388 (82.2%) | 84 (17.8%) |
| Single Unit, Attached | 47 (79.7%) | 12 (20.3%) |
| 2 Unit Apartments | 12 (15.8%) | 64 (84.2%) |
| 3 or 4 Unit Apartments | 0 (0.0%) | 21 (100.0%) |
| 5 to 9 Unit Apartments | 0 (0.0%) | 18 (100.0%) |
| 10 or more Apartments | 0 (0.0%) | 60 (100.0%) |
| Mobile Home / Other | 53 (73.6%) | 19 (26.4%) |
| Total | 500 (64.3%) | 278 (35.7%) |
Housing Structures by Number of Rooms in Capac
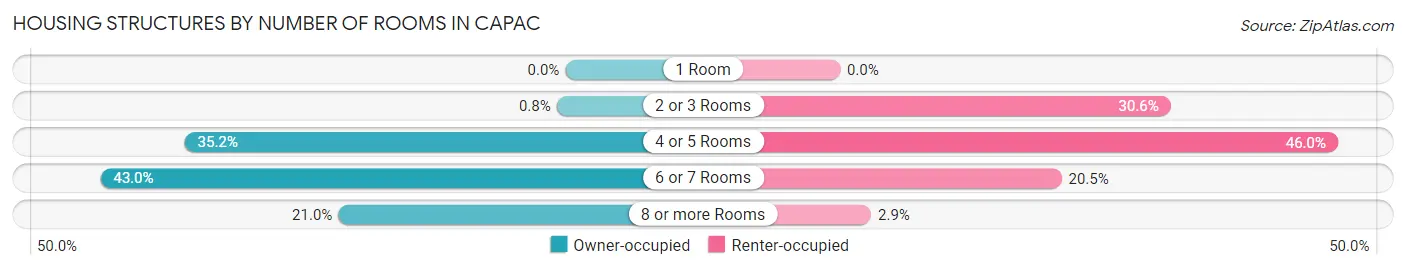
| Number of Rooms | Owner-occupied | Renter-occupied |
| 1 Room | 0 (0.0%) | 0 (0.0%) |
| 2 or 3 Rooms | 4 (0.8%) | 85 (30.6%) |
| 4 or 5 Rooms | 176 (35.2%) | 128 (46.0%) |
| 6 or 7 Rooms | 215 (43.0%) | 57 (20.5%) |
| 8 or more Rooms | 105 (21.0%) | 8 (2.9%) |
| Total | 500 (100.0%) | 278 (100.0%) |
Housing Structure by Heating Type in Capac
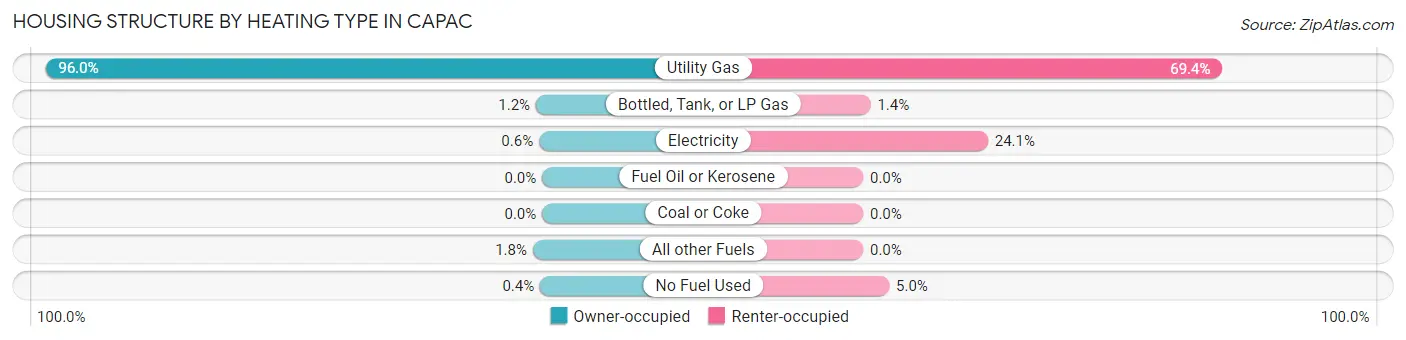
| Heating Type | Owner-occupied | Renter-occupied |
| Utility Gas | 480 (96.0%) | 193 (69.4%) |
| Bottled, Tank, or LP Gas | 6 (1.2%) | 4 (1.4%) |
| Electricity | 3 (0.6%) | 67 (24.1%) |
| Fuel Oil or Kerosene | 0 (0.0%) | 0 (0.0%) |
| Coal or Coke | 0 (0.0%) | 0 (0.0%) |
| All other Fuels | 9 (1.8%) | 0 (0.0%) |
| No Fuel Used | 2 (0.4%) | 14 (5.0%) |
| Total | 500 (100.0%) | 278 (100.0%) |
Household Vehicle Usage in Capac
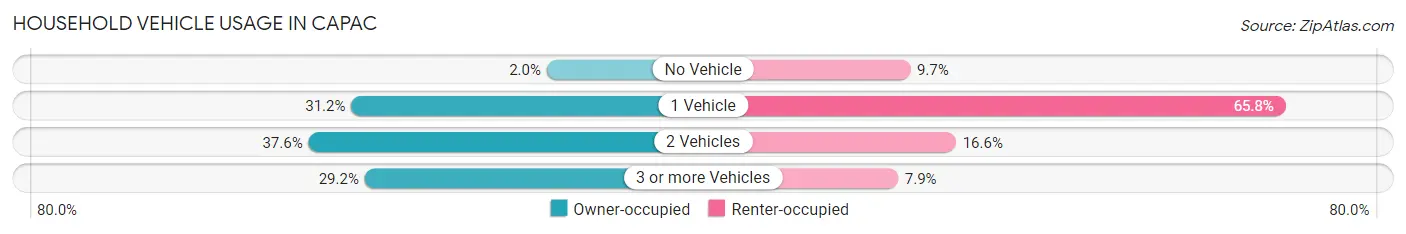
| Vehicles per Household | Owner-occupied | Renter-occupied |
| No Vehicle | 10 (2.0%) | 27 (9.7%) |
| 1 Vehicle | 156 (31.2%) | 183 (65.8%) |
| 2 Vehicles | 188 (37.6%) | 46 (16.6%) |
| 3 or more Vehicles | 146 (29.2%) | 22 (7.9%) |
| Total | 500 (100.0%) | 278 (100.0%) |
Real Estate & Mortgages in Capac
Real Estate and Mortgage Overview in Capac
| Characteristic | Without Mortgage | With Mortgage |
| Housing Units | 244 | 256 |
| Median Property Value | $110,000 | $138,300 |
| Median Household Income | $49,500 | $28 |
| Monthly Housing Costs | $514 | $0 |
| Real Estate Taxes | $1,627 | $41 |
Property Value by Mortgage Status in Capac
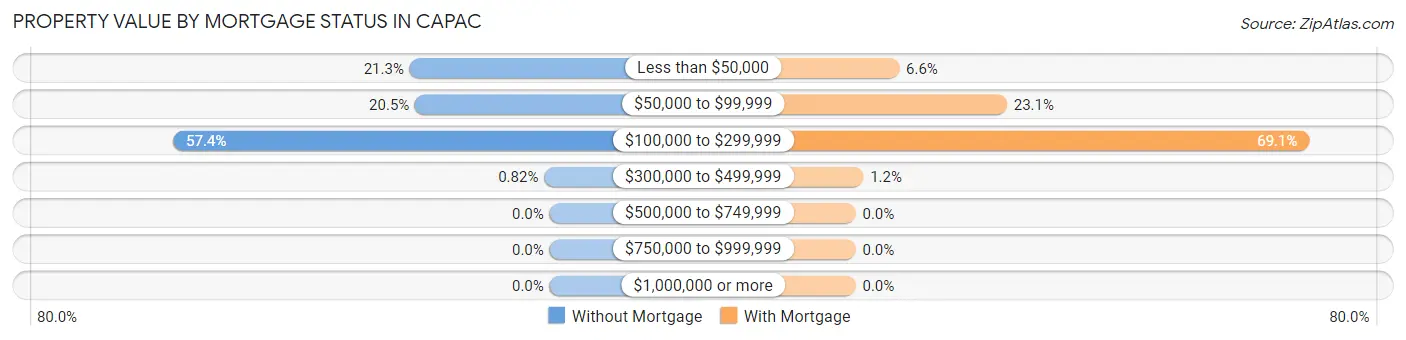
| Property Value | Without Mortgage | With Mortgage |
| Less than $50,000 | 52 (21.3%) | 17 (6.6%) |
| $50,000 to $99,999 | 50 (20.5%) | 59 (23.1%) |
| $100,000 to $299,999 | 140 (57.4%) | 177 (69.1%) |
| $300,000 to $499,999 | 2 (0.8%) | 3 (1.2%) |
| $500,000 to $749,999 | 0 (0.0%) | 0 (0.0%) |
| $750,000 to $999,999 | 0 (0.0%) | 0 (0.0%) |
| $1,000,000 or more | 0 (0.0%) | 0 (0.0%) |
| Total | 244 (100.0%) | 256 (100.0%) |
Household Income by Mortgage Status in Capac
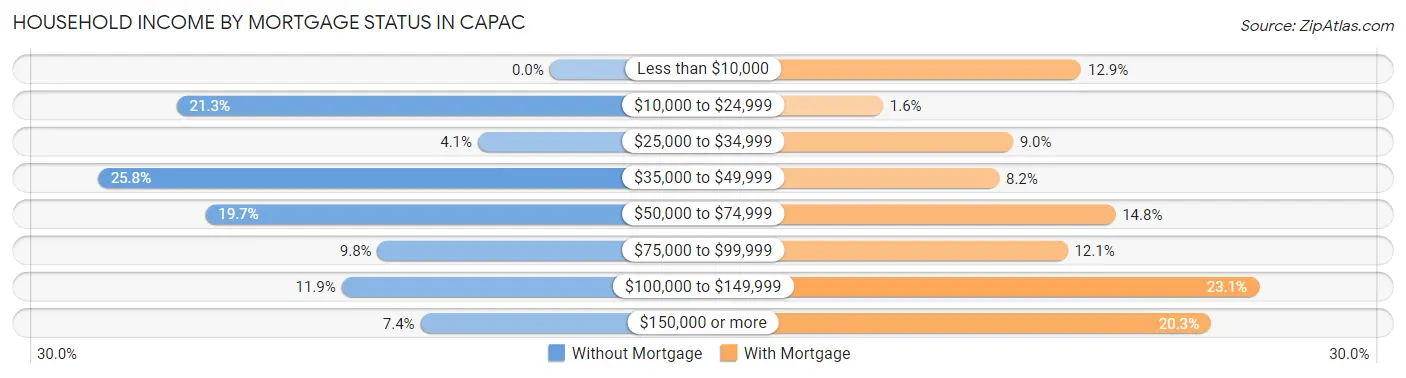
| Household Income | Without Mortgage | With Mortgage |
| Less than $10,000 | 0 (0.0%) | 33 (12.9%) |
| $10,000 to $24,999 | 52 (21.3%) | 4 (1.6%) |
| $25,000 to $34,999 | 10 (4.1%) | 23 (9.0%) |
| $35,000 to $49,999 | 63 (25.8%) | 21 (8.2%) |
| $50,000 to $74,999 | 48 (19.7%) | 38 (14.8%) |
| $75,000 to $99,999 | 24 (9.8%) | 31 (12.1%) |
| $100,000 to $149,999 | 29 (11.9%) | 59 (23.1%) |
| $150,000 or more | 18 (7.4%) | 52 (20.3%) |
| Total | 244 (100.0%) | 256 (100.0%) |
Property Value to Household Income Ratio in Capac
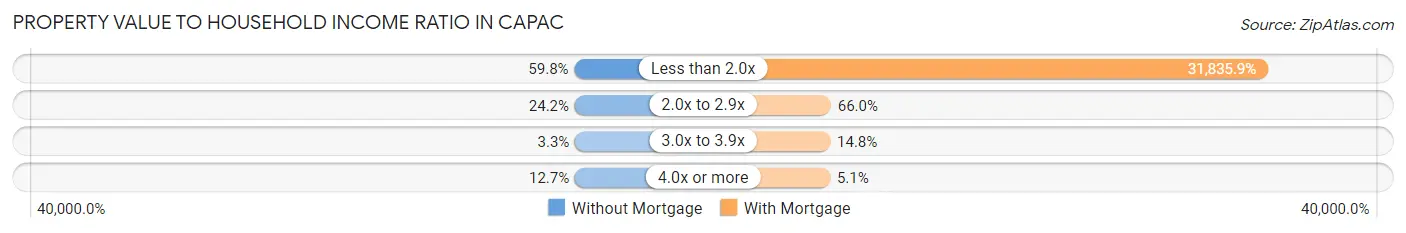
| Value-to-Income Ratio | Without Mortgage | With Mortgage |
| Less than 2.0x | 146 (59.8%) | 81,500 (31,835.9%) |
| 2.0x to 2.9x | 59 (24.2%) | 169 (66.0%) |
| 3.0x to 3.9x | 8 (3.3%) | 38 (14.8%) |
| 4.0x or more | 31 (12.7%) | 13 (5.1%) |
| Total | 244 (100.0%) | 256 (100.0%) |
Real Estate Taxes by Mortgage Status in Capac
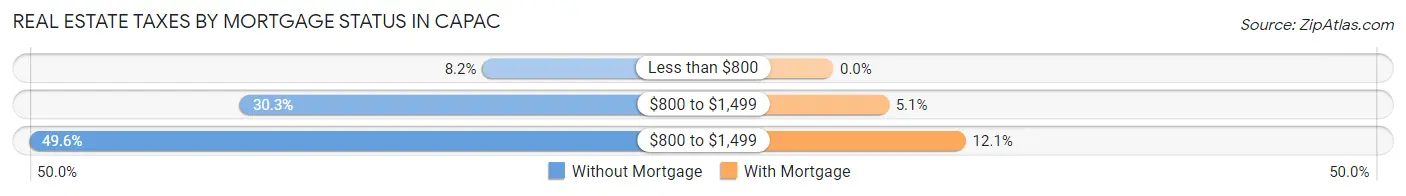
| Property Taxes | Without Mortgage | With Mortgage |
| Less than $800 | 20 (8.2%) | 0 (0.0%) |
| $800 to $1,499 | 74 (30.3%) | 13 (5.1%) |
| $800 to $1,499 | 121 (49.6%) | 31 (12.1%) |
| Total | 244 (100.0%) | 256 (100.0%) |
Health & Disability in Capac
Health Insurance Coverage by Age in Capac
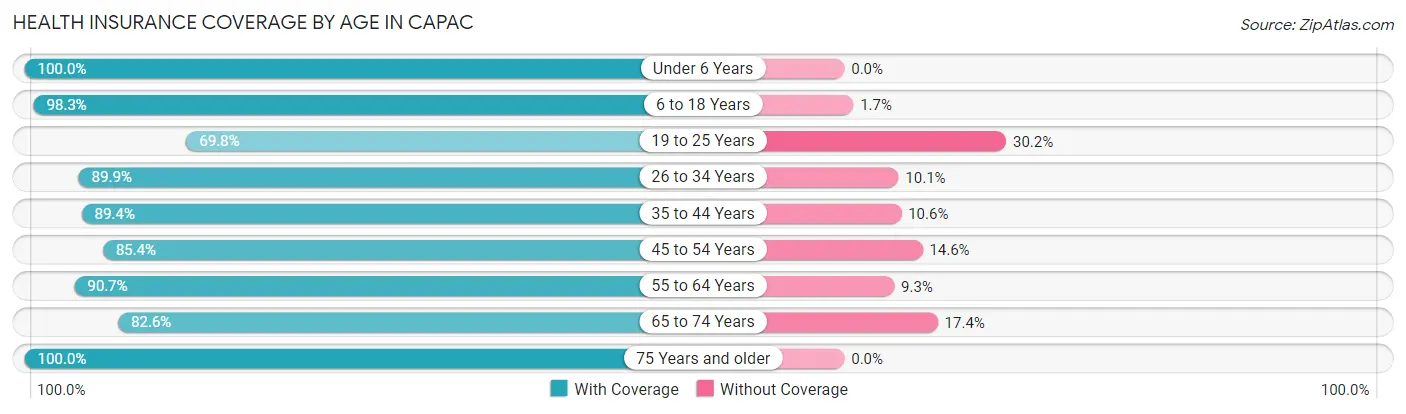
| Age Bracket | With Coverage | Without Coverage |
| Under 6 Years | 192 (100.0%) | 0 (0.0%) |
| 6 to 18 Years | 297 (98.3%) | 5 (1.7%) |
| 19 to 25 Years | 125 (69.8%) | 54 (30.2%) |
| 26 to 34 Years | 205 (89.9%) | 23 (10.1%) |
| 35 to 44 Years | 244 (89.4%) | 29 (10.6%) |
| 45 to 54 Years | 170 (85.4%) | 29 (14.6%) |
| 55 to 64 Years | 244 (90.7%) | 25 (9.3%) |
| 65 to 74 Years | 166 (82.6%) | 35 (17.4%) |
| 75 Years and older | 77 (100.0%) | 0 (0.0%) |
| Total | 1,720 (89.6%) | 200 (10.4%) |
Health Insurance Coverage by Citizenship Status in Capac
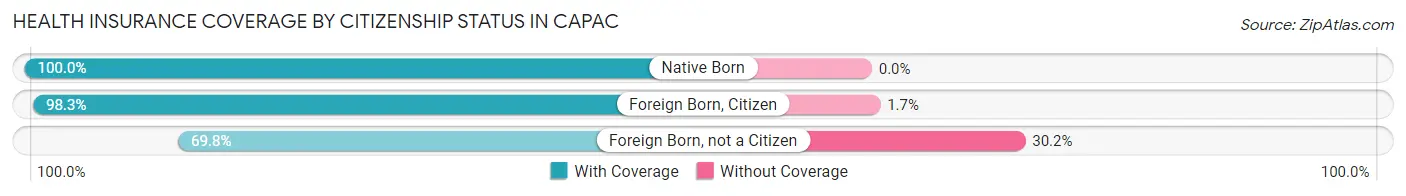
| Citizenship Status | With Coverage | Without Coverage |
| Native Born | 192 (100.0%) | 0 (0.0%) |
| Foreign Born, Citizen | 297 (98.3%) | 5 (1.7%) |
| Foreign Born, not a Citizen | 125 (69.8%) | 54 (30.2%) |
Health Insurance Coverage by Household Income in Capac
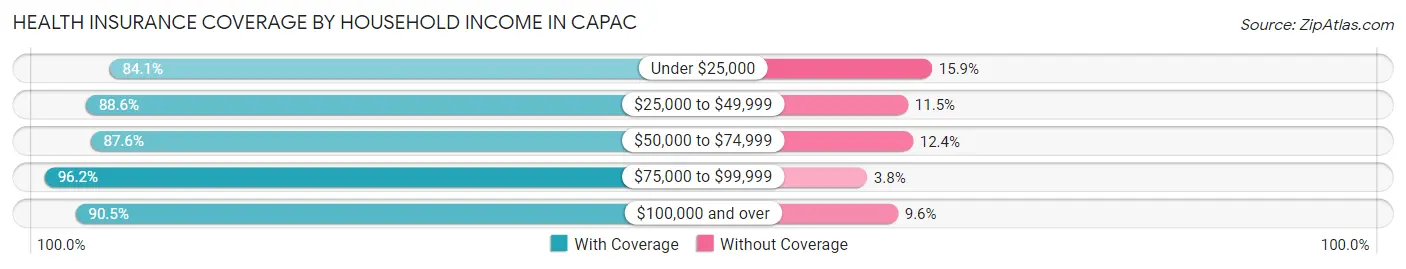
| Household Income | With Coverage | Without Coverage |
| Under $25,000 | 269 (84.1%) | 51 (15.9%) |
| $25,000 to $49,999 | 402 (88.5%) | 52 (11.5%) |
| $50,000 to $74,999 | 234 (87.6%) | 33 (12.4%) |
| $75,000 to $99,999 | 332 (96.2%) | 13 (3.8%) |
| $100,000 and over | 483 (90.4%) | 51 (9.6%) |
Public vs Private Health Insurance Coverage by Age in Capac
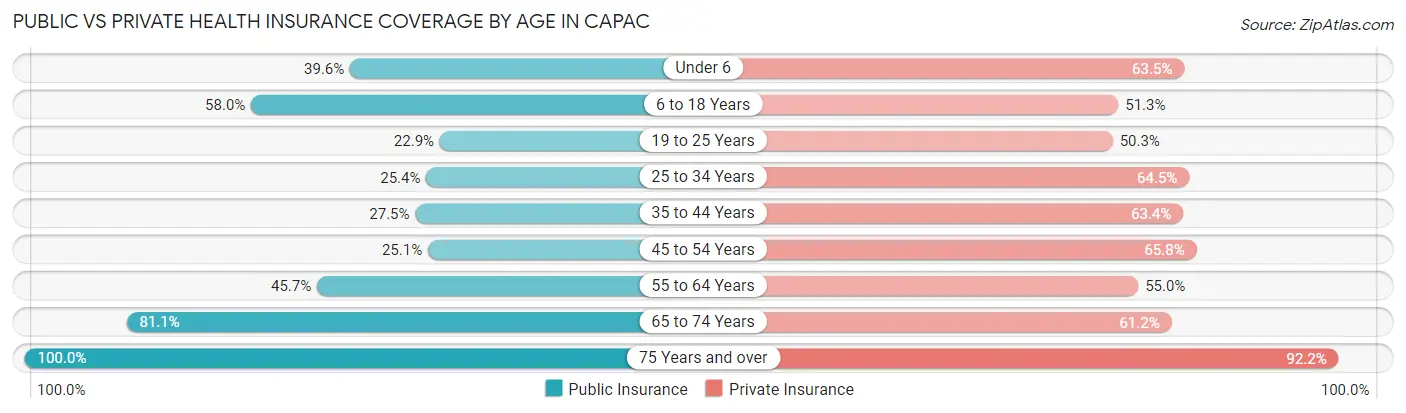
| Age Bracket | Public Insurance | Private Insurance |
| Under 6 | 76 (39.6%) | 122 (63.5%) |
| 6 to 18 Years | 175 (58.0%) | 155 (51.3%) |
| 19 to 25 Years | 41 (22.9%) | 90 (50.3%) |
| 25 to 34 Years | 58 (25.4%) | 147 (64.5%) |
| 35 to 44 Years | 75 (27.5%) | 173 (63.4%) |
| 45 to 54 Years | 50 (25.1%) | 131 (65.8%) |
| 55 to 64 Years | 123 (45.7%) | 148 (55.0%) |
| 65 to 74 Years | 163 (81.1%) | 123 (61.2%) |
| 75 Years and over | 77 (100.0%) | 71 (92.2%) |
| Total | 838 (43.6%) | 1,160 (60.4%) |
Disability Status by Sex by Age in Capac
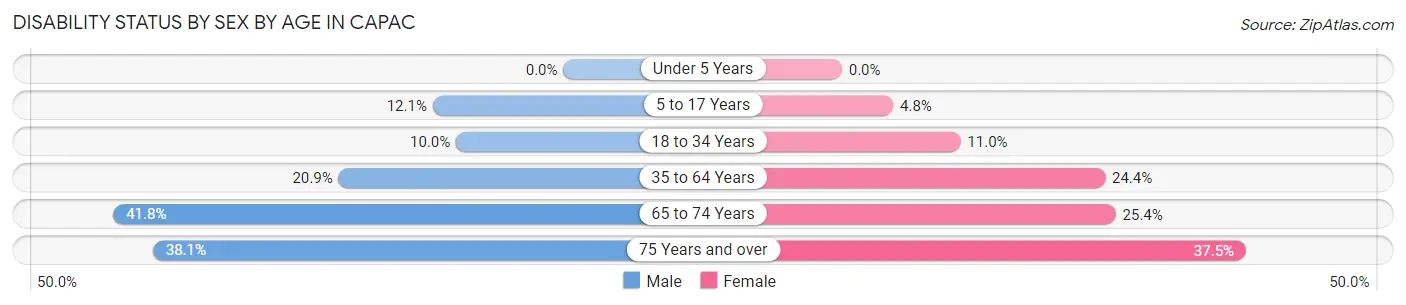
| Age Bracket | Male | Female |
| Under 5 Years | 0 (0.0%) | 0 (0.0%) |
| 5 to 17 Years | 20 (12.1%) | 6 (4.8%) |
| 18 to 34 Years | 22 (10.0%) | 25 (11.0%) |
| 35 to 64 Years | 82 (20.9%) | 85 (24.4%) |
| 65 to 74 Years | 33 (41.8%) | 31 (25.4%) |
| 75 Years and over | 8 (38.1%) | 21 (37.5%) |
Disability Class by Sex by Age in Capac
Disability Class: Hearing Difficulty
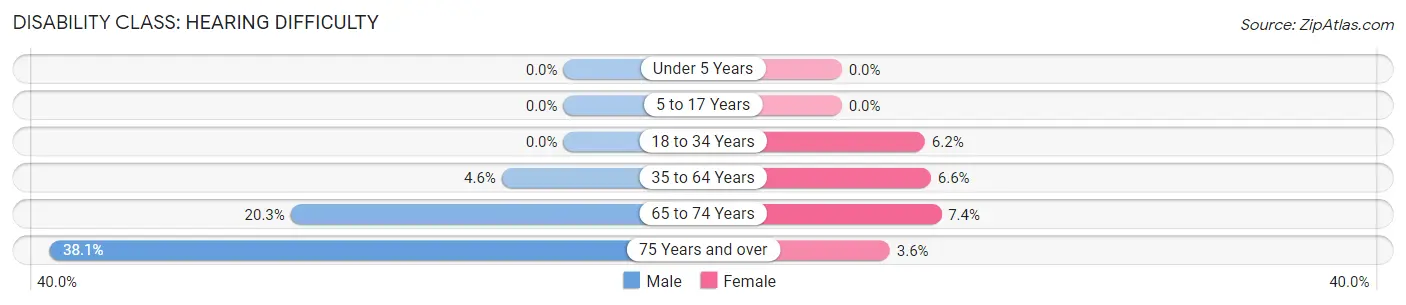
| Age Bracket | Male | Female |
| Under 5 Years | 0 (0.0%) | 0 (0.0%) |
| 5 to 17 Years | 0 (0.0%) | 0 (0.0%) |
| 18 to 34 Years | 0 (0.0%) | 14 (6.2%) |
| 35 to 64 Years | 18 (4.6%) | 23 (6.6%) |
| 65 to 74 Years | 16 (20.3%) | 9 (7.4%) |
| 75 Years and over | 8 (38.1%) | 2 (3.6%) |
Disability Class: Vision Difficulty
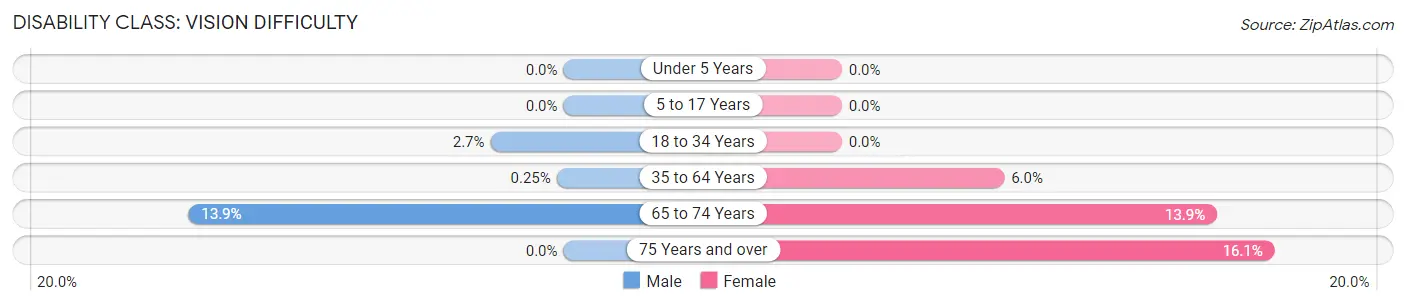
| Age Bracket | Male | Female |
| Under 5 Years | 0 (0.0%) | 0 (0.0%) |
| 5 to 17 Years | 0 (0.0%) | 0 (0.0%) |
| 18 to 34 Years | 6 (2.7%) | 0 (0.0%) |
| 35 to 64 Years | 1 (0.3%) | 21 (6.0%) |
| 65 to 74 Years | 11 (13.9%) | 17 (13.9%) |
| 75 Years and over | 0 (0.0%) | 9 (16.1%) |
Disability Class: Cognitive Difficulty
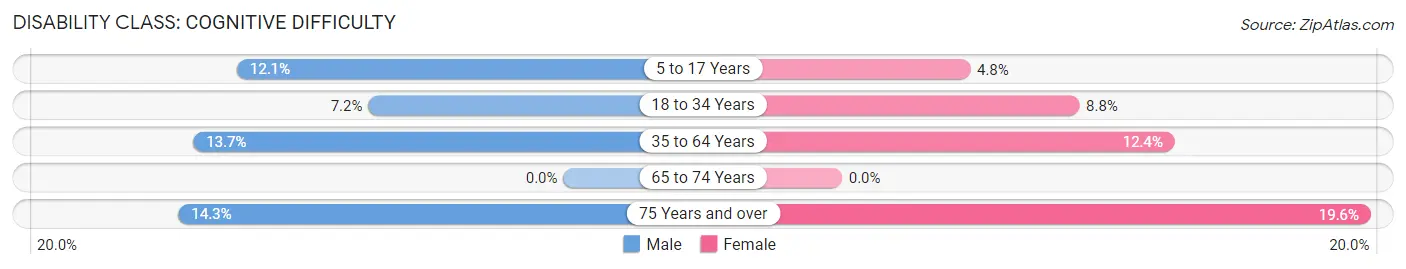
| Age Bracket | Male | Female |
| 5 to 17 Years | 20 (12.1%) | 6 (4.8%) |
| 18 to 34 Years | 16 (7.2%) | 20 (8.8%) |
| 35 to 64 Years | 54 (13.7%) | 43 (12.4%) |
| 65 to 74 Years | 0 (0.0%) | 0 (0.0%) |
| 75 Years and over | 3 (14.3%) | 11 (19.6%) |
Disability Class: Ambulatory Difficulty
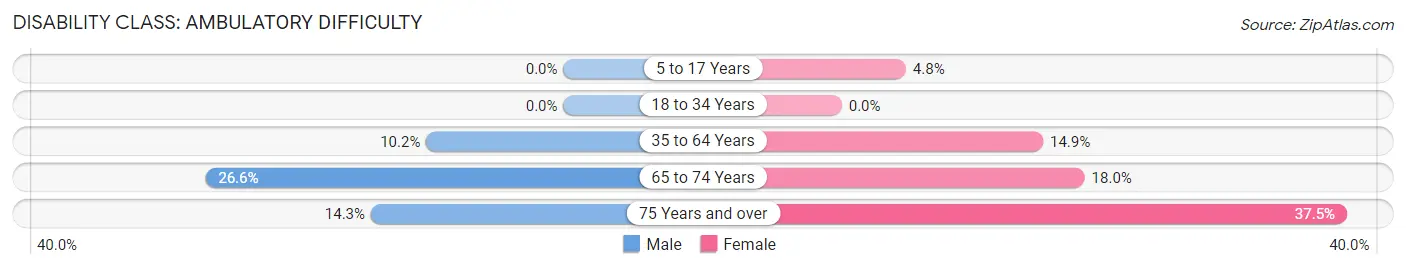
| Age Bracket | Male | Female |
| 5 to 17 Years | 0 (0.0%) | 6 (4.8%) |
| 18 to 34 Years | 0 (0.0%) | 0 (0.0%) |
| 35 to 64 Years | 40 (10.2%) | 52 (14.9%) |
| 65 to 74 Years | 21 (26.6%) | 22 (18.0%) |
| 75 Years and over | 3 (14.3%) | 21 (37.5%) |
Disability Class: Self-Care Difficulty
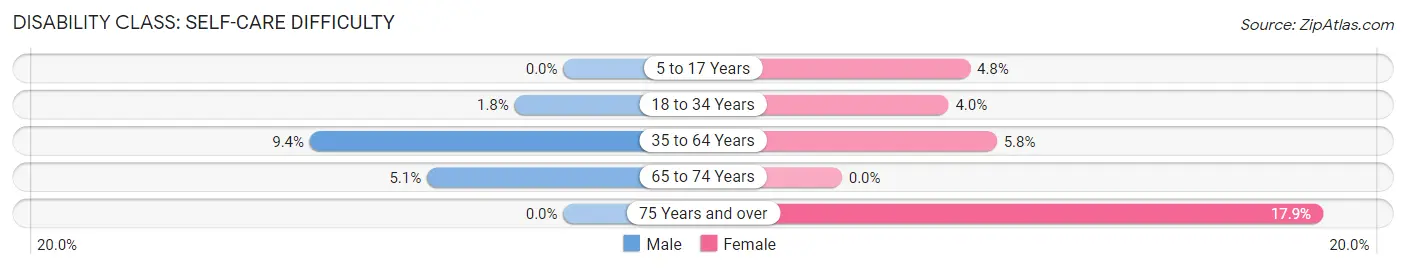
| Age Bracket | Male | Female |
| 5 to 17 Years | 0 (0.0%) | 6 (4.8%) |
| 18 to 34 Years | 4 (1.8%) | 9 (4.0%) |
| 35 to 64 Years | 37 (9.4%) | 20 (5.8%) |
| 65 to 74 Years | 4 (5.1%) | 0 (0.0%) |
| 75 Years and over | 0 (0.0%) | 10 (17.9%) |
Technology Access in Capac
Computing Device Access in Capac
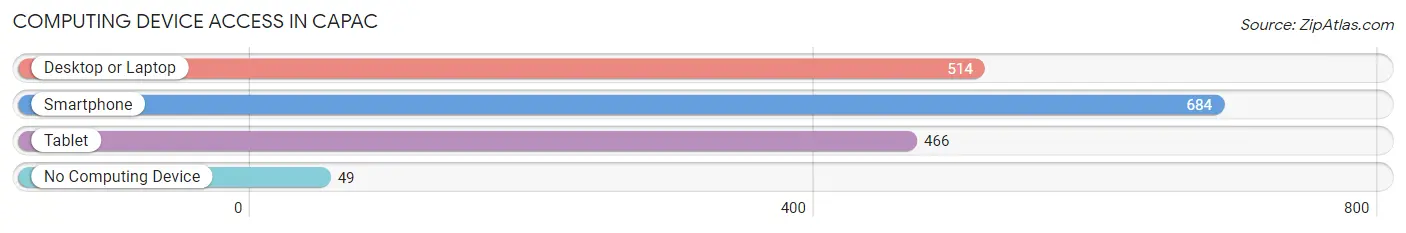
| Device Type | # Households | % Households |
| Desktop or Laptop | 514 | 66.1% |
| Smartphone | 684 | 87.9% |
| Tablet | 466 | 59.9% |
| No Computing Device | 49 | 6.3% |
| Total | 778 | 100.0% |
Internet Access in Capac
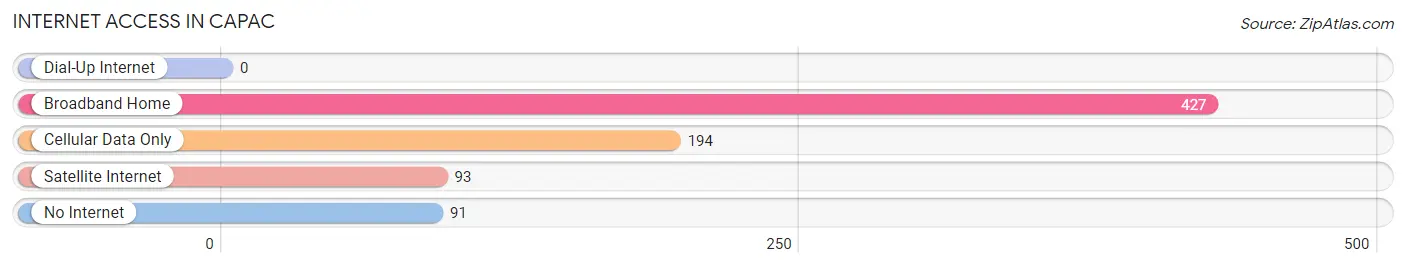
| Internet Type | # Households | % Households |
| Dial-Up Internet | 0 | 0.0% |
| Broadband Home | 427 | 54.9% |
| Cellular Data Only | 194 | 24.9% |
| Satellite Internet | 93 | 11.9% |
| No Internet | 91 | 11.7% |
| Total | 778 | 100.0% |
Capac Summary
Capac, Michigan is a small village located in St. Clair County, Michigan. It is situated on the banks of the St. Clair River, approximately 25 miles northeast of Detroit. The village has a population of 1,717 people, according to the 2010 census.
Geography
Capac is located in the southeastern corner of St. Clair County, Michigan. It is situated on the banks of the St. Clair River, approximately 25 miles northeast of Detroit. The village is bordered by the townships of Cottrellville, Clay, and Brockway. The village is located in a rural area, with the nearest major city being Port Huron, which is approximately 15 miles away.
The village is situated on a flat plain, with an elevation of 590 feet above sea level. The climate is humid continental, with hot summers and cold winters. The average annual temperature is around 50 degrees Fahrenheit.
Economy
The economy of Capac is largely based on agriculture and manufacturing. The village is home to several small businesses, including a grocery store, a hardware store, and a few restaurants. The village also has a few small industrial parks, which are home to several manufacturing companies.
The village is also home to a few farms, which produce a variety of crops, including corn, soybeans, and wheat. The village also has a few wineries, which produce a variety of wines.
Demographics
According to the 2010 census, the population of Capac was 1,717 people. The population is predominantly white, with a small percentage of African Americans and Hispanics. The median household income is $45,000, and the median age is 40 years old.
The village is served by the Capac Community School District, which consists of two elementary schools, one middle school, and one high school. The village also has a public library, which offers a variety of services to the community.
Conclusion
Capac, Michigan is a small village located in St. Clair County, Michigan. It is situated on the banks of the St. Clair River, approximately 25 miles northeast of Detroit. The village has a population of 1,717 people, according to the 2010 census. The economy of Capac is largely based on agriculture and manufacturing, and the village is served by the Capac Community School District. The population is predominantly white, with a small percentage of African Americans and Hispanics. The median household income is $45,000, and the median age is 40 years old.
Common Questions
What is Per Capita Income in Capac?
Per Capita income in Capac is $27,165.
What is the Median Family Income in Capac?
Median Family Income in Capac is $65,903.
What is the Median Household income in Capac?
Median Household Income in Capac is $48,485.
What is Income or Wage Gap in Capac?
Income or Wage Gap in Capac is 39.8%.
Women in Capac earn 60.2 cents for every dollar earned by a man.
What is Inequality or Gini Index in Capac?
Inequality or Gini Index in Capac is 0.42.
What is the Total Population of Capac?
Total Population of Capac is 1,920.
What is the Total Male Population of Capac?
Total Male Population of Capac is 967.
What is the Total Female Population of Capac?
Total Female Population of Capac is 953.
What is the Ratio of Males per 100 Females in Capac?
There are 101.47 Males per 100 Females in Capac.
What is the Ratio of Females per 100 Males in Capac?
There are 98.55 Females per 100 Males in Capac.
What is the Median Population Age in Capac?
Median Population Age in Capac is 37.3 Years.
What is the Average Family Size in Capac
Average Family Size in Capac is 3.3 People.
What is the Average Household Size in Capac
Average Household Size in Capac is 2.5 People.
How Large is the Labor Force in Capac?
There are 997 People in the Labor Forcein in Capac.
What is the Percentage of People in the Labor Force in Capac?
66.4% of People are in the Labor Force in Capac.
What is the Unemployment Rate in Capac?
Unemployment Rate in Capac is 8.0%.