Burt, MI Map & Demographics
Burt Map
Burt Overview
$32,731
PER CAPITA INCOME
$75,083
AVG FAMILY INCOME
$82,313
AVG HOUSEHOLD INCOME
44.6%
WAGE / INCOME GAP [ % ]
55.4¢/ $1
WAGE / INCOME GAP [ $ ]
0.27
INEQUALITY / GINI INDEX
1,271
TOTAL POPULATION
728
MALE POPULATION
543
FEMALE POPULATION
134.07
MALES / 100 FEMALES
74.59
FEMALES / 100 MALES
41.7
MEDIAN AGE
2.9
AVG FAMILY SIZE
2.6
AVG HOUSEHOLD SIZE
591
LABOR FORCE [ PEOPLE ]
56.3%
PERCENT IN LABOR FORCE
2.0%
UNEMPLOYMENT RATE
Burt Zip Codes
Burt Area Codes
Income in Burt
Income Overview in Burt
Per Capita Income in Burt is $32,731, while median incomes of families and households are $75,083 and $82,313 respectively.
| Characteristic | Number | Measure |
| Per Capita Income | 1,271 | $32,731 |
| Median Family Income | 375 | $75,083 |
| Mean Family Income | 375 | $87,652 |
| Median Household Income | 481 | $82,313 |
| Mean Household Income | 481 | $86,808 |
| Income Deficit | 375 | $0 |
| Wage / Income Gap (%) | 1,271 | 44.55% |
| Wage / Income Gap ($) | 1,271 | 55.45¢ per $1 |
| Gini / Inequality Index | 1,271 | 0.27 |
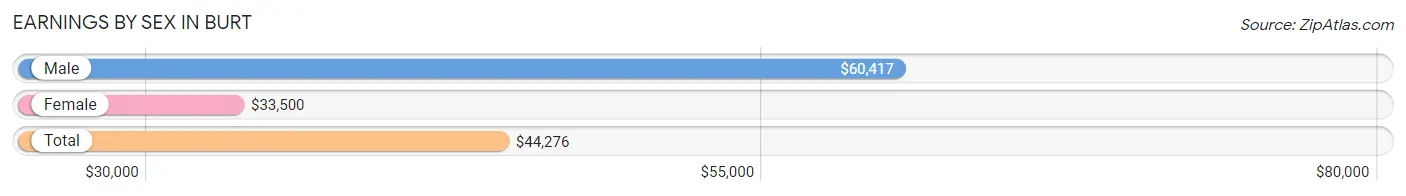
Earnings by Sex in Burt
Average Earnings in Burt are $44,276, $60,417 for men and $33,500 for women, a difference of 44.6%.
| Sex | Number | Average Earnings |
| Male | 353 (56.8%) | $60,417 |
| Female | 268 (43.2%) | $33,500 |
| Total | 621 (100.0%) | $44,276 |
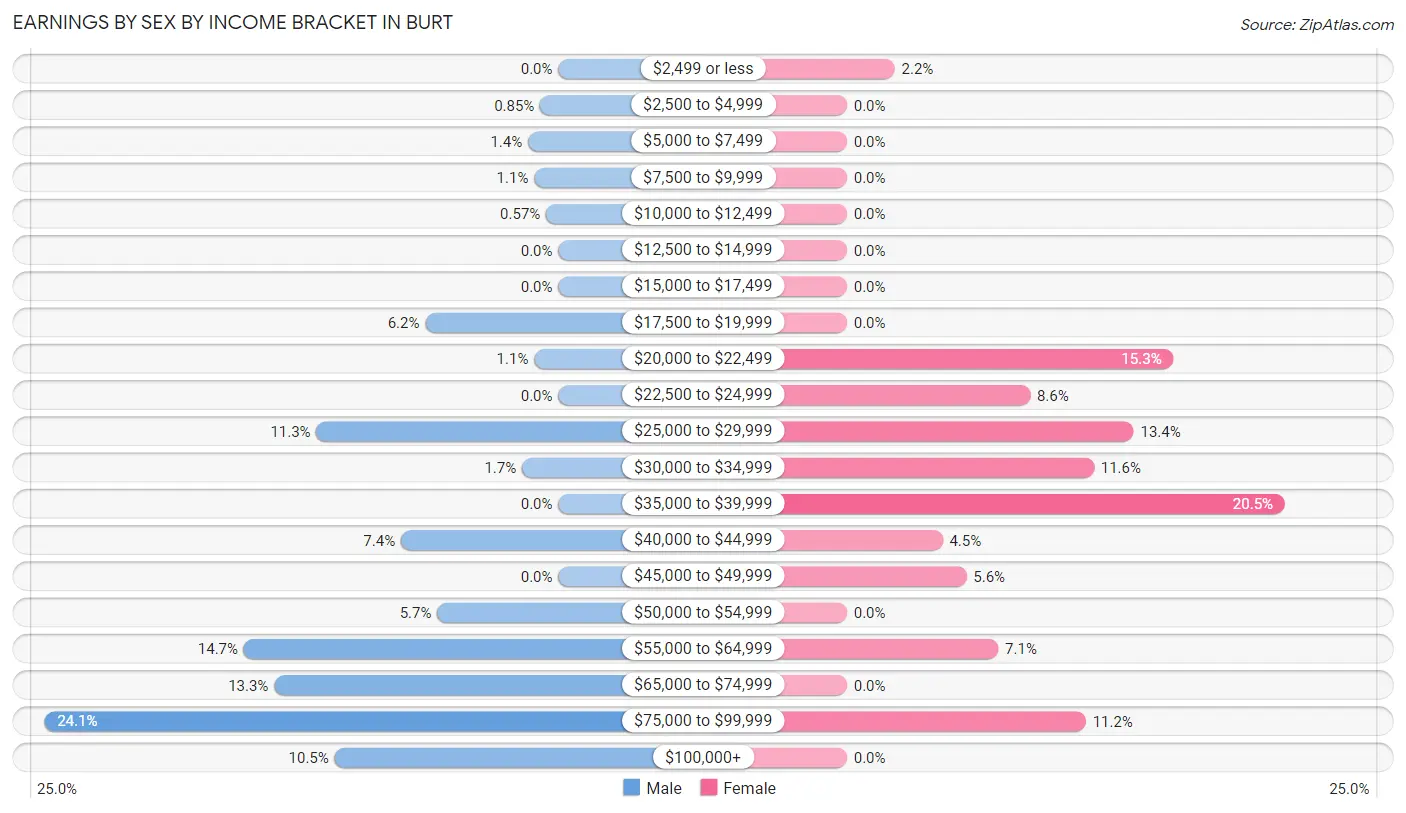
Earnings by Sex by Income Bracket in Burt
The most common earnings brackets in Burt are $75,000 to $99,999 for men (85 | 24.1%) and $35,000 to $39,999 for women (55 | 20.5%).
| Income | Male | Female |
| $2,499 or less | 0 (0.0%) | 6 (2.2%) |
| $2,500 to $4,999 | 3 (0.9%) | 0 (0.0%) |
| $5,000 to $7,499 | 5 (1.4%) | 0 (0.0%) |
| $7,500 to $9,999 | 4 (1.1%) | 0 (0.0%) |
| $10,000 to $12,499 | 2 (0.6%) | 0 (0.0%) |
| $12,500 to $14,999 | 0 (0.0%) | 0 (0.0%) |
| $15,000 to $17,499 | 0 (0.0%) | 0 (0.0%) |
| $17,500 to $19,999 | 22 (6.2%) | 0 (0.0%) |
| $20,000 to $22,499 | 4 (1.1%) | 41 (15.3%) |
| $22,500 to $24,999 | 0 (0.0%) | 23 (8.6%) |
| $25,000 to $29,999 | 40 (11.3%) | 36 (13.4%) |
| $30,000 to $34,999 | 6 (1.7%) | 31 (11.6%) |
| $35,000 to $39,999 | 0 (0.0%) | 55 (20.5%) |
| $40,000 to $44,999 | 26 (7.4%) | 12 (4.5%) |
| $45,000 to $49,999 | 0 (0.0%) | 15 (5.6%) |
| $50,000 to $54,999 | 20 (5.7%) | 0 (0.0%) |
| $55,000 to $64,999 | 52 (14.7%) | 19 (7.1%) |
| $65,000 to $74,999 | 47 (13.3%) | 0 (0.0%) |
| $75,000 to $99,999 | 85 (24.1%) | 30 (11.2%) |
| $100,000+ | 37 (10.5%) | 0 (0.0%) |
| Total | 353 (100.0%) | 268 (100.0%) |
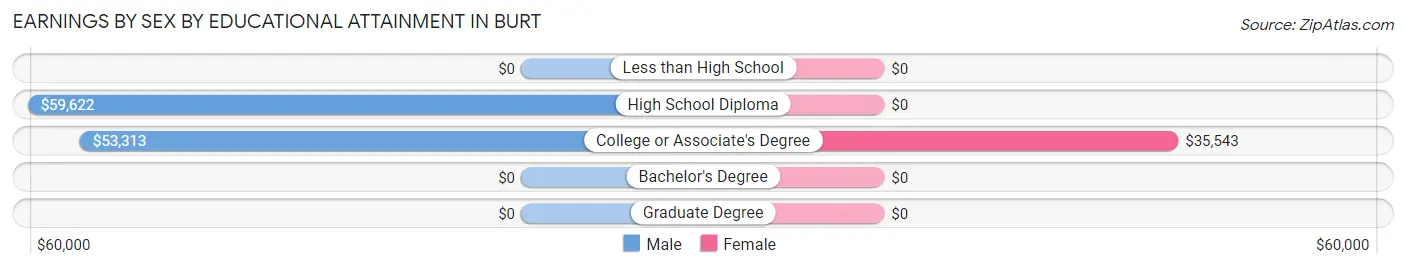
Earnings by Sex by Educational Attainment in Burt
Average earnings in Burt are $59,884 for men and $36,739 for women, a difference of 38.7%. Men with an educational attainment of high school diploma enjoy the highest average annual earnings of $59,622, while those with college or associate's degree education earn the least with $53,313. Women with an educational attainment of college or associate's degree earn the most with the average annual earnings of $35,543, while those with college or associate's degree education have the smallest earnings of $35,543.
| Educational Attainment | Male Income | Female Income |
| Less than High School | - | - |
| High School Diploma | $59,622 | $0 |
| College or Associate's Degree | $53,313 | $35,543 |
| Bachelor's Degree | - | - |
| Graduate Degree | - | - |
| Total | $59,884 | $36,739 |
Family Income in Burt
Family Income Brackets in Burt
According to the Burt family income data, there are 113 families falling into the $50,000 to $74,999 income range, which is the most common income bracket and makes up 30.1% of all families.
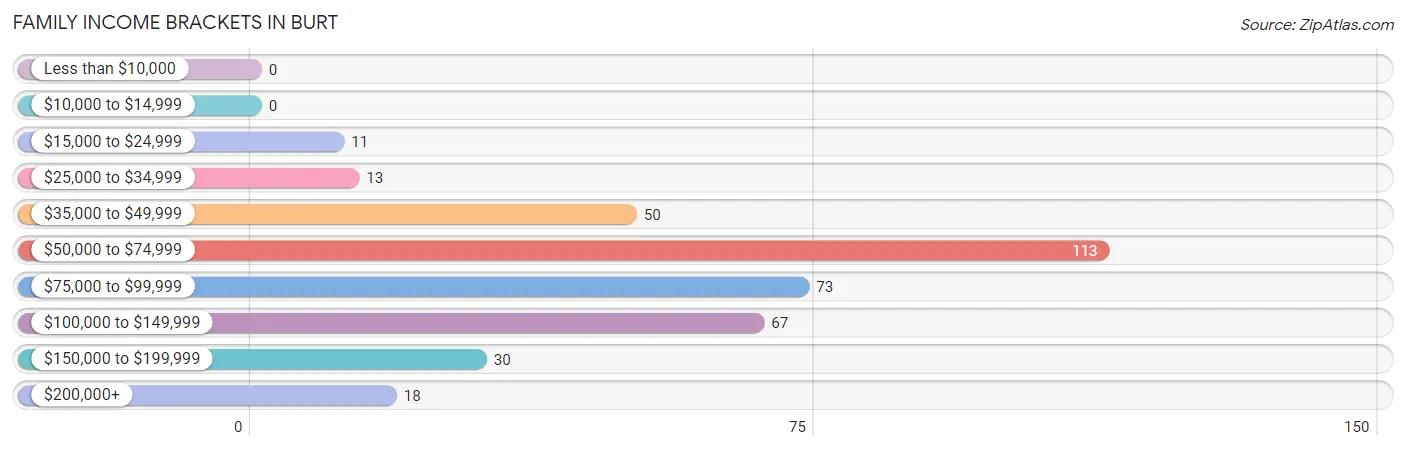
| Income Bracket | # Families | % Families |
| Less than $10,000 | 0 | 0.0% |
| $10,000 to $14,999 | 0 | 0.0% |
| $15,000 to $24,999 | 11 | 2.9% |
| $25,000 to $34,999 | 13 | 3.5% |
| $35,000 to $49,999 | 50 | 13.3% |
| $50,000 to $74,999 | 113 | 30.1% |
| $75,000 to $99,999 | 73 | 19.5% |
| $100,000 to $149,999 | 67 | 17.9% |
| $150,000 to $199,999 | 30 | 8.0% |
| $200,000+ | 18 | 4.8% |
Family Income by Famaliy Size in Burt
4-person families (54 | 14.4%) account for the highest median family income in Burt with $119,000 per family, while 2-person families (168 | 44.8%) have the highest median income of $29,760 per family member.
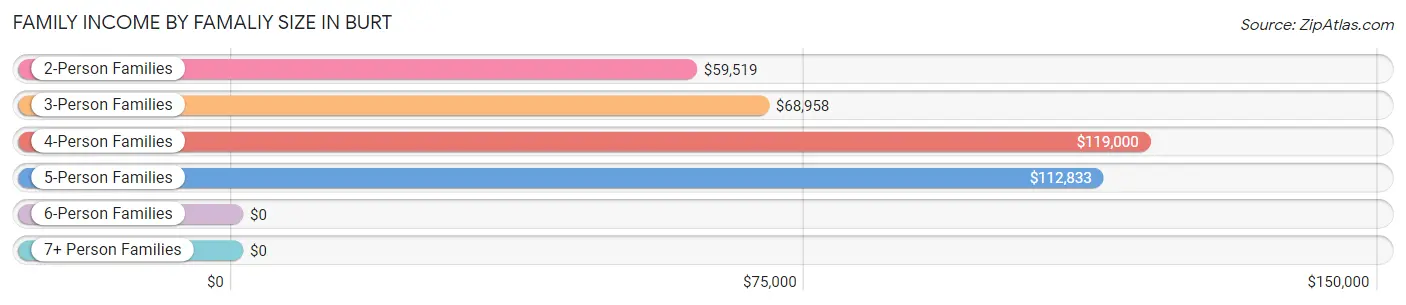
| Income Bracket | # Families | Median Income |
| 2-Person Families | 168 (44.8%) | $59,519 |
| 3-Person Families | 115 (30.7%) | $68,958 |
| 4-Person Families | 54 (14.4%) | $119,000 |
| 5-Person Families | 38 (10.1%) | $112,833 |
| 6-Person Families | 0 (0.0%) | $0 |
| 7+ Person Families | 0 (0.0%) | $0 |
| Total | 375 (100.0%) | $75,083 |
Family Income by Number of Earners in Burt
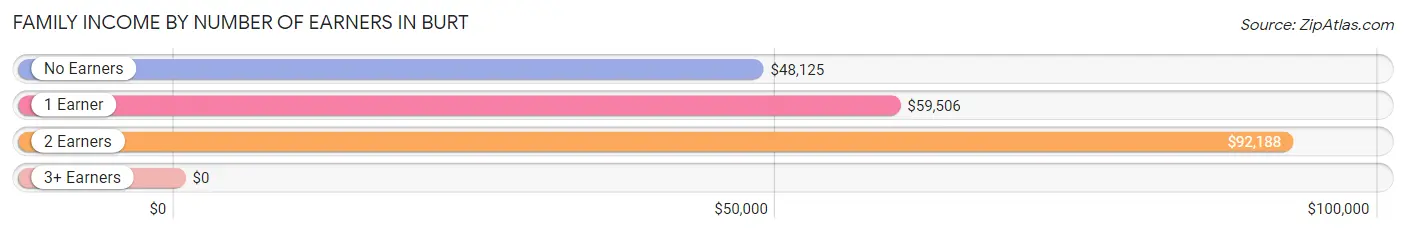
| Number of Earners | # Families | Median Income |
| No Earners | 94 (25.1%) | $48,125 |
| 1 Earner | 111 (29.6%) | $59,506 |
| 2 Earners | 125 (33.3%) | $92,188 |
| 3+ Earners | 45 (12.0%) | $0 |
| Total | 375 (100.0%) | $75,083 |
Household Income in Burt
Household Income Brackets in Burt
With 138 households falling in the category, the $75,000 to $99,999 income range is the most frequent in Burt, accounting for 28.7% of all households.
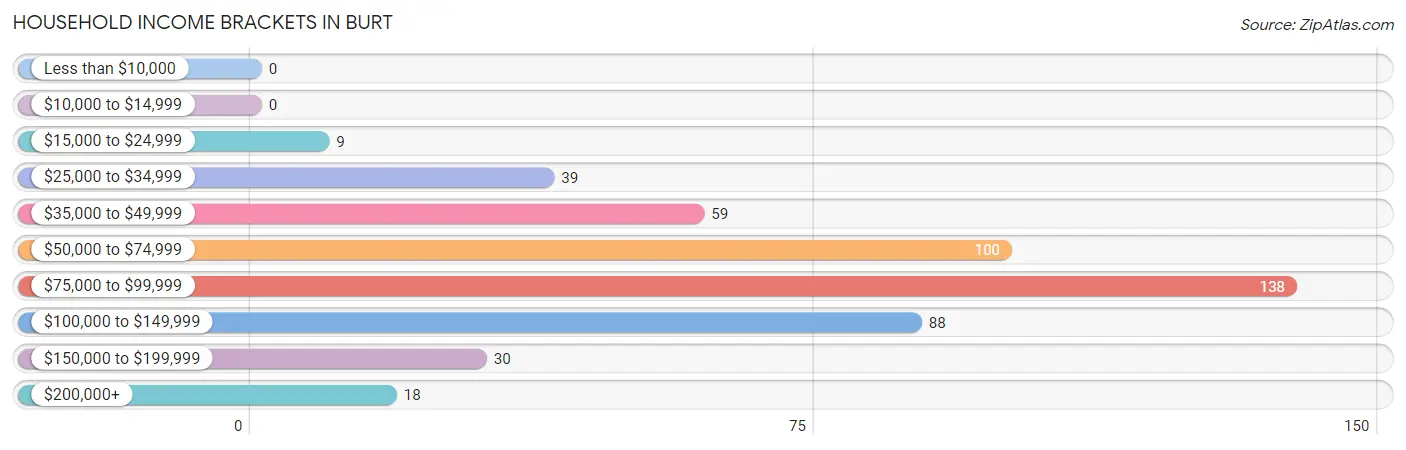
| Income Bracket | # Households | % Households |
| Less than $10,000 | 0 | 0.0% |
| $10,000 to $14,999 | 0 | 0.0% |
| $15,000 to $24,999 | 9 | 1.9% |
| $25,000 to $34,999 | 39 | 8.1% |
| $35,000 to $49,999 | 59 | 12.3% |
| $50,000 to $74,999 | 100 | 20.8% |
| $75,000 to $99,999 | 138 | 28.7% |
| $100,000 to $149,999 | 88 | 18.3% |
| $150,000 to $199,999 | 30 | 6.2% |
| $200,000+ | 18 | 3.7% |
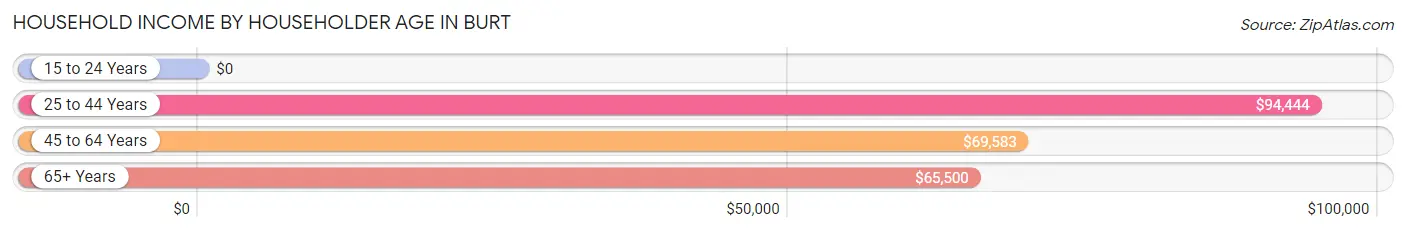
Household Income by Householder Age in Burt
The median household income in Burt is $82,313, with the highest median household income of $94,444 found in the 25 to 44 years age bracket for the primary householder. A total of 148 households (30.8%) fall into this category. Meanwhile, the 15 to 24 years age bracket for the primary householder has the lowest median household income of $0, with 11 households (2.3%) in this group.
| Income Bracket | # Households | Median Income |
| 15 to 24 Years | 11 (2.3%) | $0 |
| 25 to 44 Years | 148 (30.8%) | $94,444 |
| 45 to 64 Years | 144 (29.9%) | $69,583 |
| 65+ Years | 178 (37.0%) | $65,500 |
| Total | 481 (100.0%) | $82,313 |
Poverty in Burt
Income Below Poverty by Sex and Age in Burt
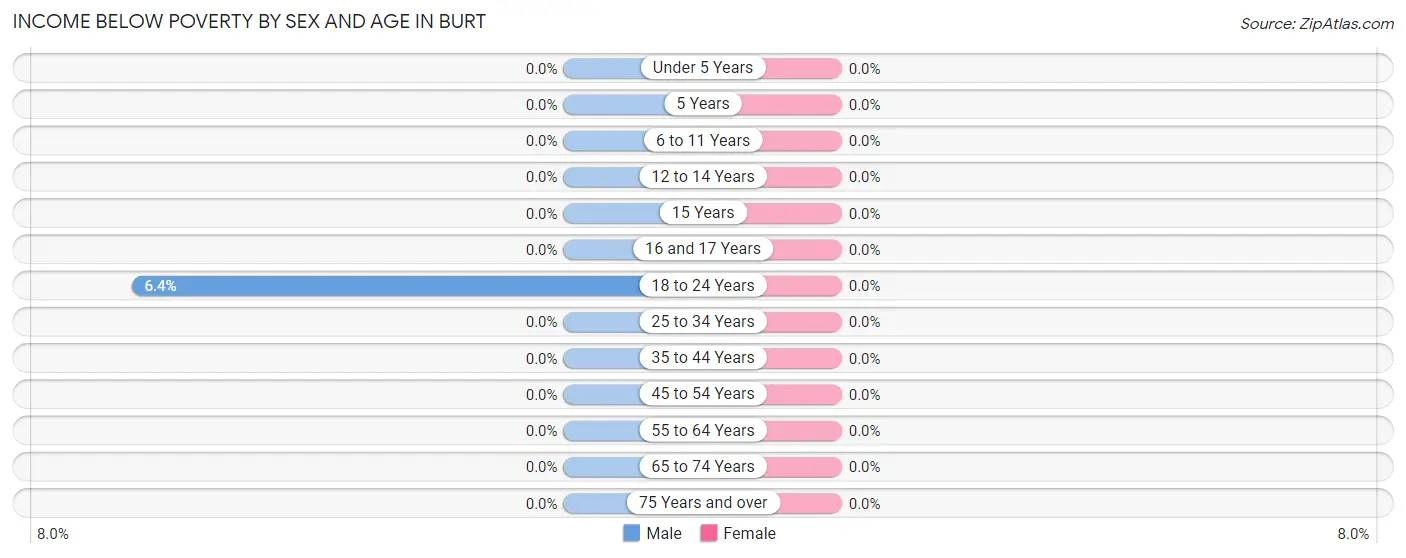
| Age Bracket | Male | Female |
| Under 5 Years | 0 (0.0%) | 0 (0.0%) |
| 5 Years | 0 (0.0%) | 0 (0.0%) |
| 6 to 11 Years | 0 (0.0%) | 0 (0.0%) |
| 12 to 14 Years | 0 (0.0%) | 0 (0.0%) |
| 15 Years | 0 (0.0%) | 0 (0.0%) |
| 16 and 17 Years | 0 (0.0%) | 0 (0.0%) |
| 18 to 24 Years | 5 (6.4%) | 0 (0.0%) |
| 25 to 34 Years | 0 (0.0%) | 0 (0.0%) |
| 35 to 44 Years | 0 (0.0%) | 0 (0.0%) |
| 45 to 54 Years | 0 (0.0%) | 0 (0.0%) |
| 55 to 64 Years | 0 (0.0%) | 0 (0.0%) |
| 65 to 74 Years | 0 (0.0%) | 0 (0.0%) |
| 75 Years and over | 0 (0.0%) | 0 (0.0%) |
| Total | 5 (0.7%) | 0 (0.0%) |
Income Above Poverty by Sex and Age in Burt
According to the poverty statistics in Burt, males aged under 5 years and females aged under 5 years are the age groups that are most secure financially, with 100.0% of males and 100.0% of females in these age groups living above the poverty line.
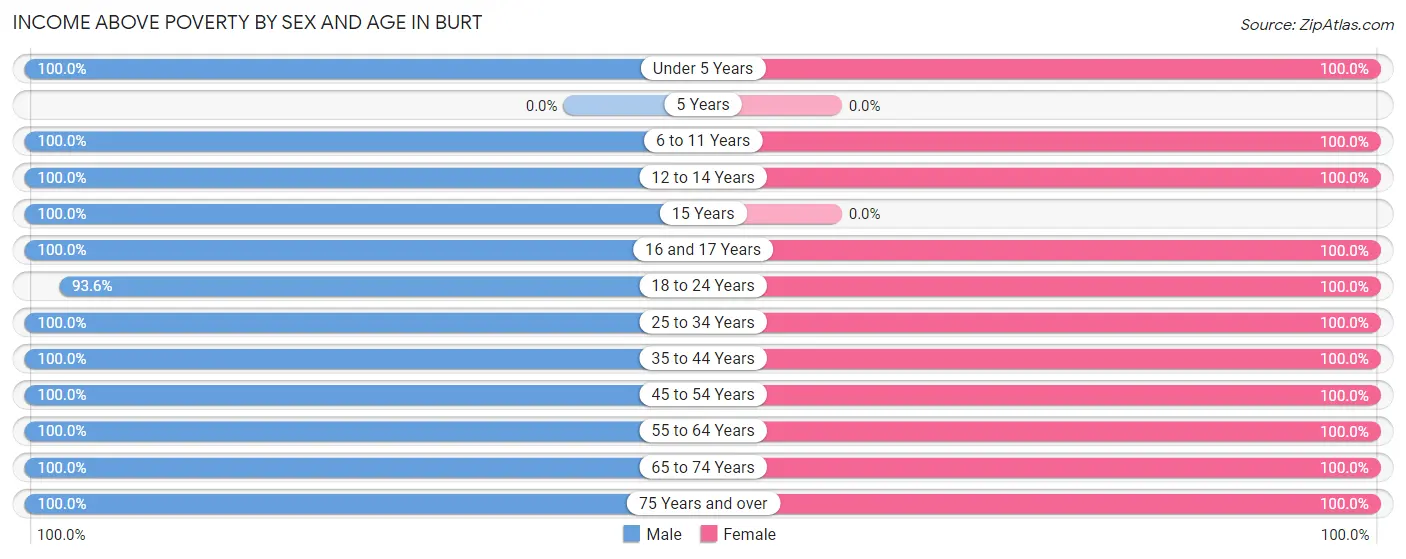
| Age Bracket | Male | Female |
| Under 5 Years | 68 (100.0%) | 16 (100.0%) |
| 5 Years | 0 (0.0%) | 0 (0.0%) |
| 6 to 11 Years | 58 (100.0%) | 28 (100.0%) |
| 12 to 14 Years | 3 (100.0%) | 21 (100.0%) |
| 15 Years | 27 (100.0%) | 0 (0.0%) |
| 16 and 17 Years | 57 (100.0%) | 6 (100.0%) |
| 18 to 24 Years | 73 (93.6%) | 45 (100.0%) |
| 25 to 34 Years | 46 (100.0%) | 82 (100.0%) |
| 35 to 44 Years | 95 (100.0%) | 83 (100.0%) |
| 45 to 54 Years | 107 (100.0%) | 129 (100.0%) |
| 55 to 64 Years | 31 (100.0%) | 24 (100.0%) |
| 65 to 74 Years | 132 (100.0%) | 73 (100.0%) |
| 75 Years and over | 26 (100.0%) | 36 (100.0%) |
| Total | 723 (99.3%) | 543 (100.0%) |
Income Below Poverty Among Married-Couple Families in Burt
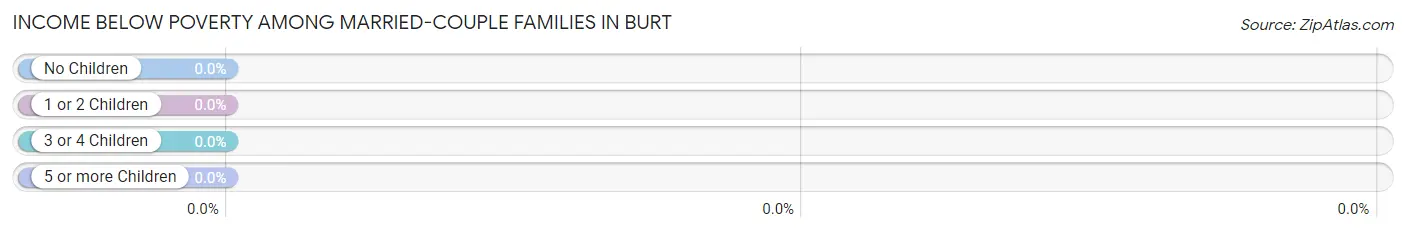
| Children | Above Poverty | Below Poverty |
| No Children | 143 (100.0%) | 0 (0.0%) |
| 1 or 2 Children | 132 (100.0%) | 0 (0.0%) |
| 3 or 4 Children | 32 (100.0%) | 0 (0.0%) |
| 5 or more Children | 0 (0.0%) | 0 (0.0%) |
| Total | 307 (100.0%) | 0 (0.0%) |
Income Below Poverty Among Single-Parent Households in Burt
| Children | Single Father | Single Mother |
| No Children | 0 (0.0%) | 0 (0.0%) |
| 1 or 2 Children | 0 (0.0%) | 0 (0.0%) |
| 3 or 4 Children | 0 (0.0%) | 0 (0.0%) |
| 5 or more Children | 0 (0.0%) | 0 (0.0%) |
| Total | 0 (0.0%) | 0 (0.0%) |
Income Below Poverty Among Married-Couple vs Single-Parent Households in Burt
| Children | Married-Couple Families | Single-Parent Households |
| No Children | 0 (0.0%) | 0 (0.0%) |
| 1 or 2 Children | 0 (0.0%) | 0 (0.0%) |
| 3 or 4 Children | 0 (0.0%) | 0 (0.0%) |
| 5 or more Children | 0 (0.0%) | 0 (0.0%) |
| Total | 0 (0.0%) | 0 (0.0%) |
Race in Burt
The most populous races in Burt are White / Caucasian (1,168 | 91.9%), and Two or more Races (103 | 8.1%).
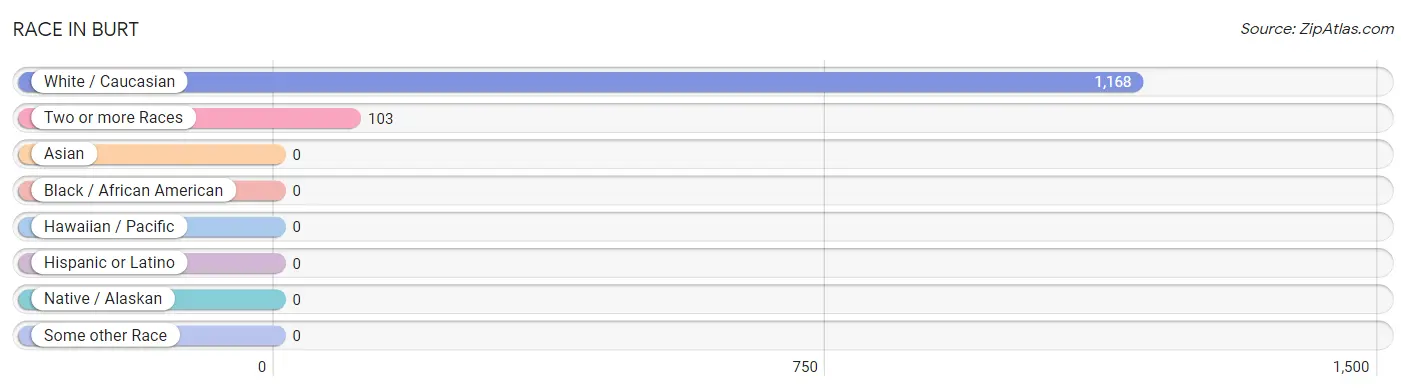
| Race | # Population | % Population |
| Asian | 0 | 0.0% |
| Black / African American | 0 | 0.0% |
| Hawaiian / Pacific | 0 | 0.0% |
| Hispanic or Latino | 0 | 0.0% |
| Native / Alaskan | 0 | 0.0% |
| White / Caucasian | 1,168 | 91.9% |
| Two or more Races | 103 | 8.1% |
| Some other Race | 0 | 0.0% |
| Total | 1,271 | 100.0% |
Ancestry in Burt
The most populous ancestries reported in Burt are German (406 | 31.9%), American (196 | 15.4%), Irish (195 | 15.3%), Polish (142 | 11.2%), and French (105 | 8.3%), together accounting for 82.1% of all Burt residents.
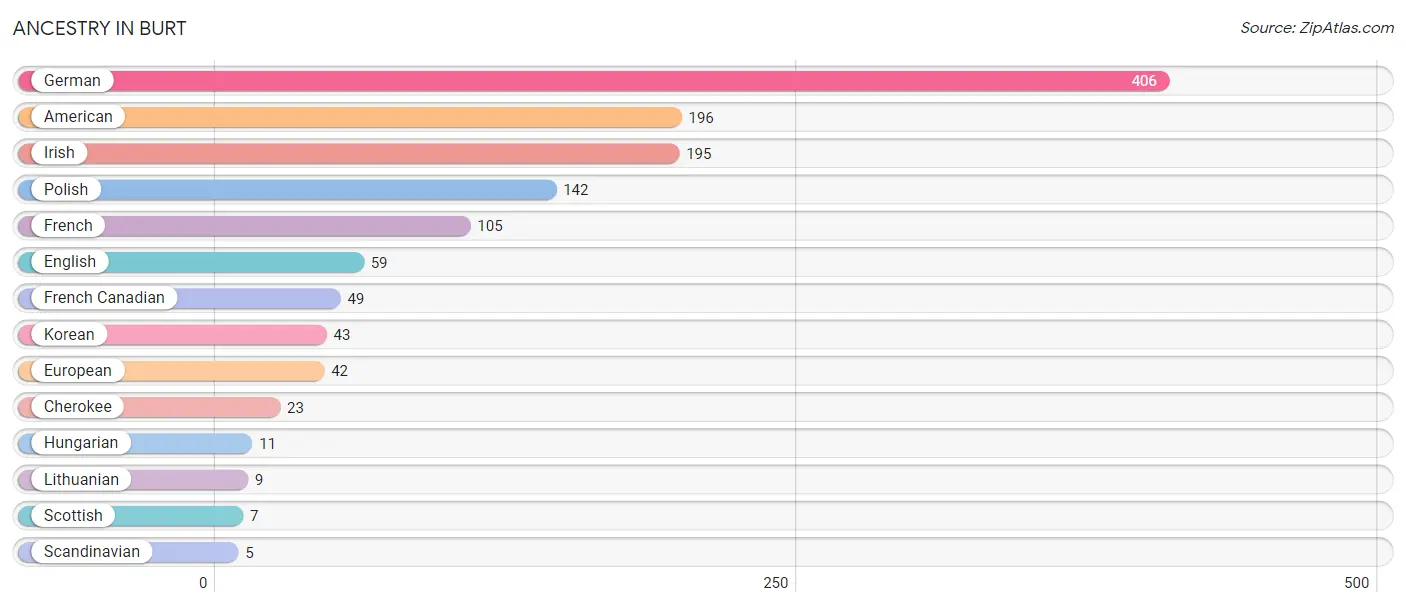
| Ancestry | # Population | % Population |
| American | 196 | 15.4% |
| Cherokee | 23 | 1.8% |
| English | 59 | 4.6% |
| European | 42 | 3.3% |
| French | 105 | 8.3% |
| French Canadian | 49 | 3.9% |
| German | 406 | 31.9% |
| Hungarian | 11 | 0.9% |
| Irish | 195 | 15.3% |
| Korean | 43 | 3.4% |
| Lithuanian | 9 | 0.7% |
| Polish | 142 | 11.2% |
| Scandinavian | 5 | 0.4% |
| Scottish | 7 | 0.5% | View All 14 Rows |
Immigrants in Burt

| Immigration Origin | # Population | % Population | View All 0 Rows |
Sex and Age in Burt
Sex and Age in Burt
The most populous age groups in Burt are 15 to 19 Years (95 | 13.1%) for men and 50 to 54 Years (68 | 12.5%) for women.
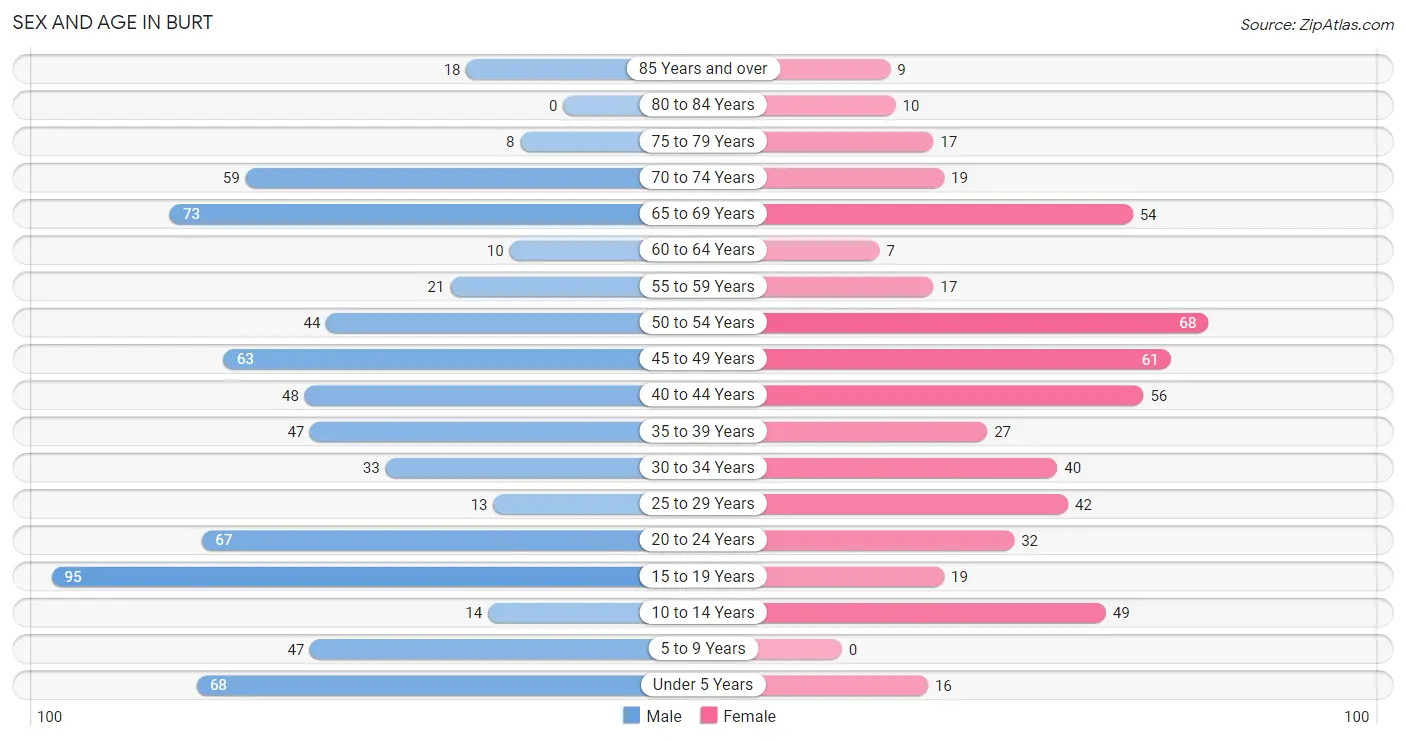
| Age Bracket | Male | Female |
| Under 5 Years | 68 (9.3%) | 16 (2.9%) |
| 5 to 9 Years | 47 (6.5%) | 0 (0.0%) |
| 10 to 14 Years | 14 (1.9%) | 49 (9.0%) |
| 15 to 19 Years | 95 (13.1%) | 19 (3.5%) |
| 20 to 24 Years | 67 (9.2%) | 32 (5.9%) |
| 25 to 29 Years | 13 (1.8%) | 42 (7.7%) |
| 30 to 34 Years | 33 (4.5%) | 40 (7.4%) |
| 35 to 39 Years | 47 (6.5%) | 27 (5.0%) |
| 40 to 44 Years | 48 (6.6%) | 56 (10.3%) |
| 45 to 49 Years | 63 (8.6%) | 61 (11.2%) |
| 50 to 54 Years | 44 (6.0%) | 68 (12.5%) |
| 55 to 59 Years | 21 (2.9%) | 17 (3.1%) |
| 60 to 64 Years | 10 (1.4%) | 7 (1.3%) |
| 65 to 69 Years | 73 (10.0%) | 54 (9.9%) |
| 70 to 74 Years | 59 (8.1%) | 19 (3.5%) |
| 75 to 79 Years | 8 (1.1%) | 17 (3.1%) |
| 80 to 84 Years | 0 (0.0%) | 10 (1.8%) |
| 85 Years and over | 18 (2.5%) | 9 (1.7%) |
| Total | 728 (100.0%) | 543 (100.0%) |
Families and Households in Burt
Median Family Size in Burt
The median family size in Burt is 2.87 persons per family, with married-couple families (307 | 81.9%) accounting for the largest median family size of 3.05 persons per family. On the other hand, single male/father families (8 | 2.1%) represent the smallest median family size with 1.88 persons per family.
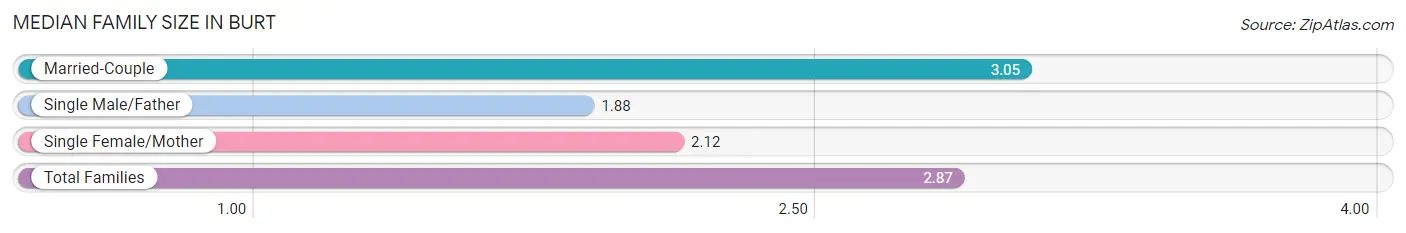
| Family Type | # Families | Family Size |
| Married-Couple | 307 (81.9%) | 3.05 |
| Single Male/Father | 8 (2.1%) | 1.88 |
| Single Female/Mother | 60 (16.0%) | 2.12 |
| Total Families | 375 (100.0%) | 2.87 |
Median Household Size in Burt
The median household size in Burt is 2.64 persons per household, with married-couple households (307 | 63.8%) accounting for the largest median household size of 3.07 persons per household. non-family households (106 | 22.0%) represent the smallest median household size with 1.29 persons per household.
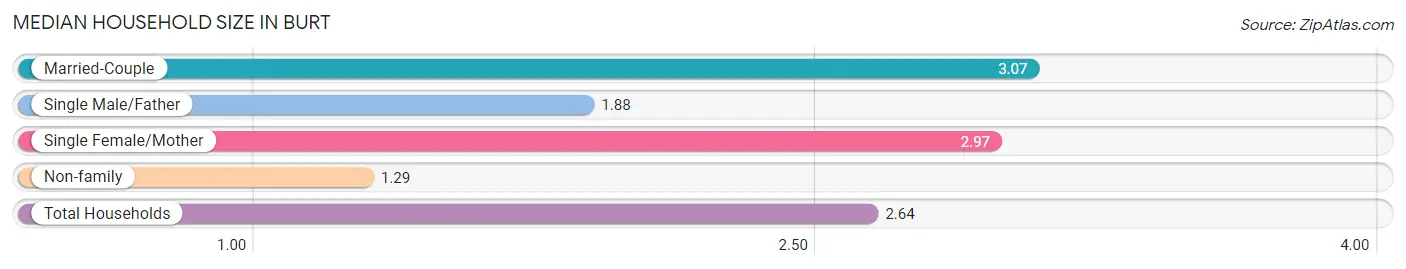
| Household Type | # Households | Household Size |
| Married-Couple | 307 (63.8%) | 3.07 |
| Single Male/Father | 8 (1.7%) | 1.88 |
| Single Female/Mother | 60 (12.5%) | 2.97 |
| Non-family | 106 (22.0%) | 1.29 |
| Total Households | 481 (100.0%) | 2.64 |
Household Size by Marriage Status in Burt
Out of a total of 481 households in Burt, 375 (78.0%) are family households, while 106 (22.0%) are nonfamily households. The most numerous type of family households are 3-person households, comprising 145, and the most common type of nonfamily households are 1-person households, comprising 76.
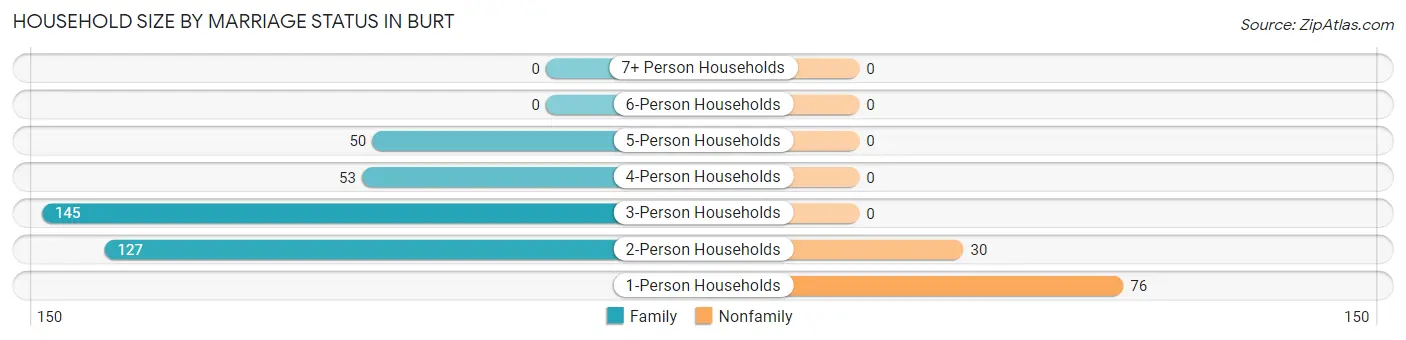
| Household Size | Family Households | Nonfamily Households |
| 1-Person Households | - | 76 (15.8%) |
| 2-Person Households | 127 (26.4%) | 30 (6.2%) |
| 3-Person Households | 145 (30.1%) | 0 (0.0%) |
| 4-Person Households | 53 (11.0%) | 0 (0.0%) |
| 5-Person Households | 50 (10.4%) | 0 (0.0%) |
| 6-Person Households | 0 (0.0%) | 0 (0.0%) |
| 7+ Person Households | 0 (0.0%) | 0 (0.0%) |
| Total | 375 (78.0%) | 106 (22.0%) |
Female Fertility in Burt
Fertility by Age in Burt
Average fertility rate in Burt is 74.0 births per 1,000 women. Women in the age bracket of 20 to 34 years have the highest fertility rate with 184.0 births per 1,000 women. Women in the age bracket of 20 to 34 years acount for 100.0% of all women with births.
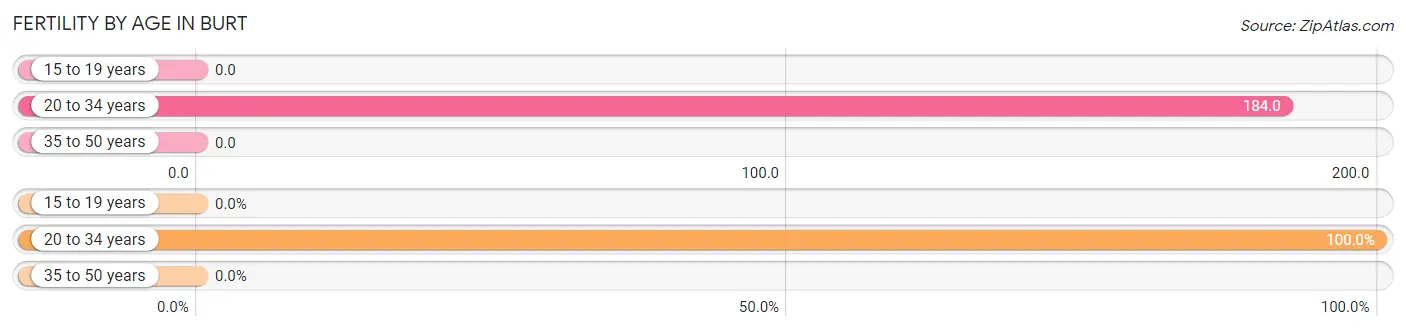
| Age Bracket | Women with Births | Births / 1,000 Women |
| 15 to 19 years | 0 (0.0%) | 0.0 |
| 20 to 34 years | 21 (100.0%) | 184.0 |
| 35 to 50 years | 0 (0.0%) | 0.0 |
| Total | 21 (100.0%) | 74.0 |
Fertility by Age by Marriage Status in Burt
47.6% of women with births (21) in Burt are married. The highest percentage of unmarried women with births falls into 20 to 34 years age bracket with 52.4% of them unmarried at the time of birth, while the lowest percentage of unmarried women with births belong to 20 to 34 years age bracket with 52.4% of them unmarried.
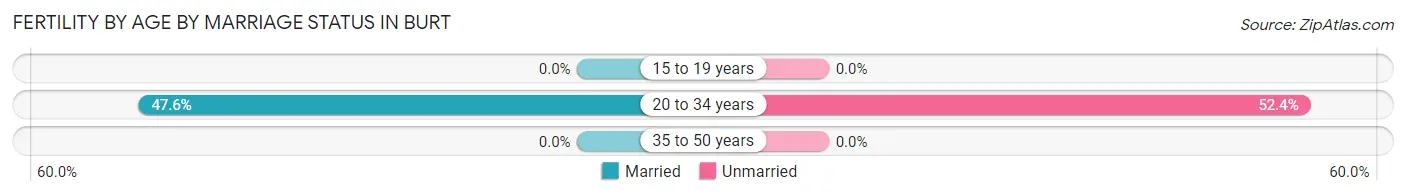
| Age Bracket | Married | Unmarried |
| 15 to 19 years | 0 (0.0%) | 0 (0.0%) |
| 20 to 34 years | 10 (47.6%) | 11 (52.4%) |
| 35 to 50 years | 0 (0.0%) | 0 (0.0%) |
| Total | 10 (47.6%) | 11 (52.4%) |
Fertility by Education in Burt
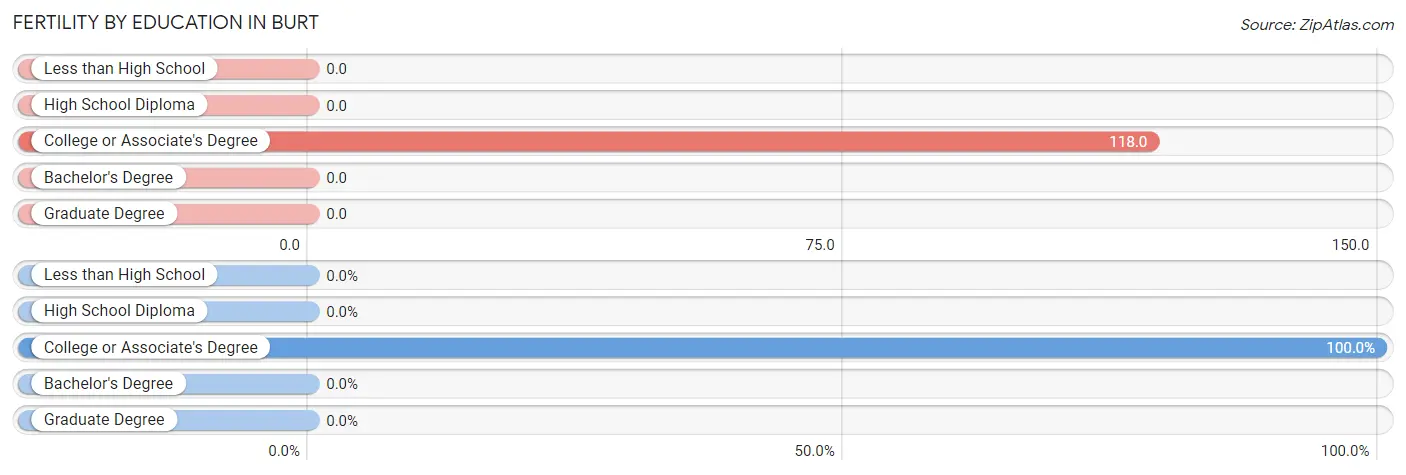
| Educational Attainment | Women with Births | Births / 1,000 Women |
| Less than High School | 0 (0.0%) | 0.0 |
| High School Diploma | 0 (0.0%) | 0.0 |
| College or Associate's Degree | 21 (100.0%) | 118.0 |
| Bachelor's Degree | 0 (0.0%) | 0.0 |
| Graduate Degree | 0 (0.0%) | 0.0 |
| Total | 21 (100.0%) | 74.0 |
Fertility by Education by Marriage Status in Burt
52.4% of women with births in Burt are unmarried. Women with the educational attainment of college or associate's degree are most likely to be married with 47.6% of them married at childbirth, while women with the educational attainment of college or associate's degree are least likely to be married with 52.4% of them unmarried at childbirth.
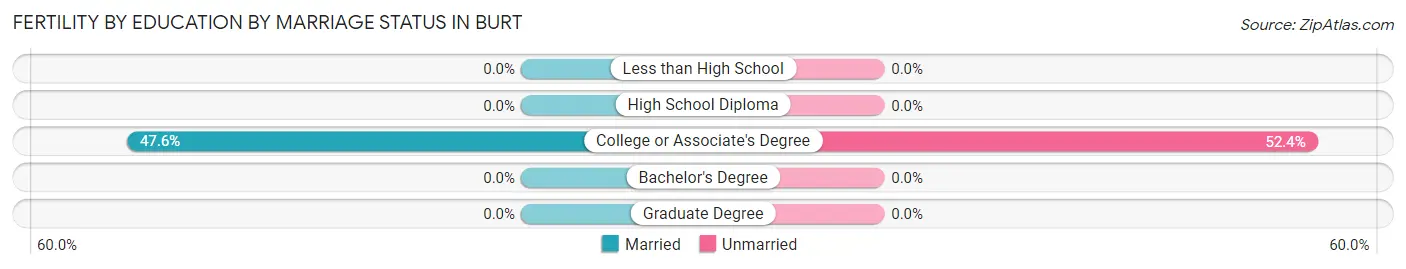
| Educational Attainment | Married | Unmarried |
| Less than High School | 0 (0.0%) | 0 (0.0%) |
| High School Diploma | 0 (0.0%) | 0 (0.0%) |
| College or Associate's Degree | 10 (47.6%) | 11 (52.4%) |
| Bachelor's Degree | 0 (0.0%) | 0 (0.0%) |
| Graduate Degree | 0 (0.0%) | 0 (0.0%) |
| Total | 10 (47.6%) | 11 (52.4%) |
Employment Characteristics in Burt
Employment by Class of Employer in Burt
Among the 568 employed individuals in Burt, private company employees (425 | 74.8%), not-for-profit organizations (67 | 11.8%), and self-employed (not incorporated) (37 | 6.5%) make up the most common classes of employment.
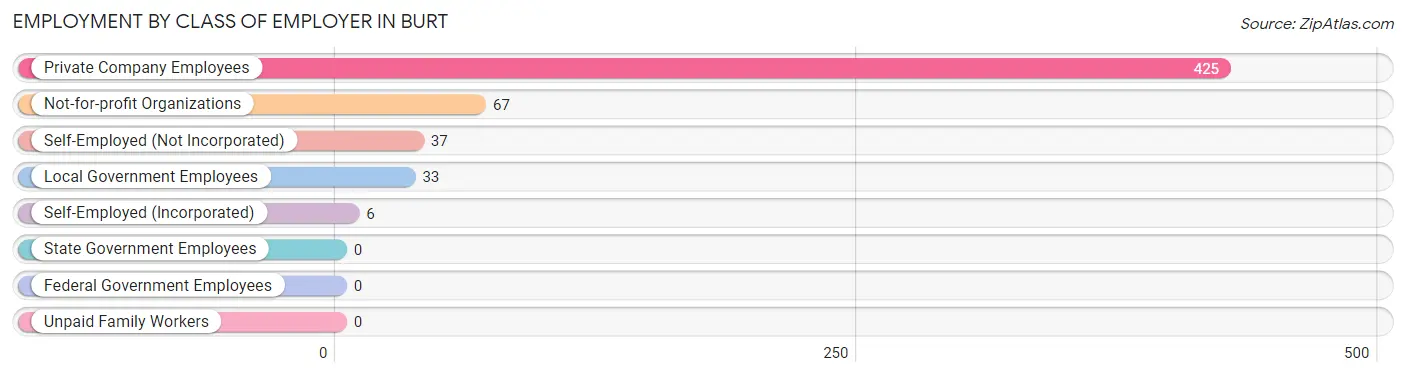
| Employer Class | # Employees | % Employees |
| Private Company Employees | 425 | 74.8% |
| Self-Employed (Incorporated) | 6 | 1.1% |
| Self-Employed (Not Incorporated) | 37 | 6.5% |
| Not-for-profit Organizations | 67 | 11.8% |
| Local Government Employees | 33 | 5.8% |
| State Government Employees | 0 | 0.0% |
| Federal Government Employees | 0 | 0.0% |
| Unpaid Family Workers | 0 | 0.0% |
| Total | 568 | 100.0% |
Employment Status by Age in Burt
According to the labor force statistics for Burt, out of the total population over 16 years of age (1,050), 56.3% or 591 individuals are in the labor force, with 2.0% or 12 of them unemployed. The age group with the highest labor force participation rate is 35 to 44 years, with 92.7% or 165 individuals in the labor force. Within the labor force, the 16 to 19 years age range has the highest percentage of unemployed individuals, with 33.3% or 5 of them being unemployed.
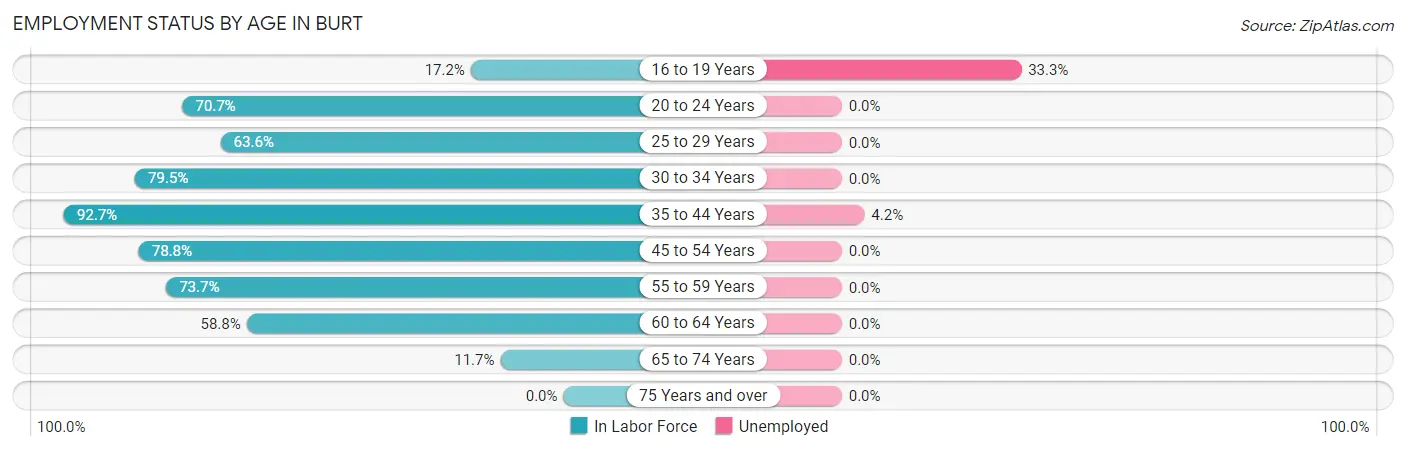
| Age Bracket | In Labor Force | Unemployed |
| 16 to 19 Years | 15 (17.2%) | 5 (33.3%) |
| 20 to 24 Years | 70 (70.7%) | 0 (0.0%) |
| 25 to 29 Years | 35 (63.6%) | 0 (0.0%) |
| 30 to 34 Years | 58 (79.5%) | 0 (0.0%) |
| 35 to 44 Years | 165 (92.7%) | 7 (4.2%) |
| 45 to 54 Years | 186 (78.8%) | 0 (0.0%) |
| 55 to 59 Years | 28 (73.7%) | 0 (0.0%) |
| 60 to 64 Years | 10 (58.8%) | 0 (0.0%) |
| 65 to 74 Years | 24 (11.7%) | 0 (0.0%) |
| 75 Years and over | 0 (0.0%) | 0 (0.0%) |
| Total | 591 (56.3%) | 12 (2.0%) |
Employment Status by Educational Attainment in Burt
According to labor force statistics for Burt, 80.7% of individuals (482) out of the total population between 25 and 64 years of age (597) are in the labor force, with 1.5% or 7 of them being unemployed. The group with the highest labor force participation rate are those with the educational attainment of less than high school, with 100.0% or 9 individuals in the labor force. Within the labor force, individuals with college / associate degree education have the highest percentage of unemployment, with 3.1% or 7 of them being unemployed.
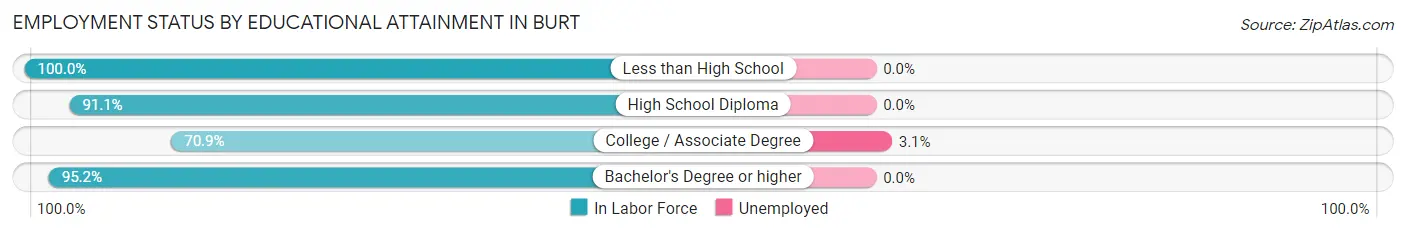
| Educational Attainment | In Labor Force | Unemployed |
| Less than High School | 9 (100.0%) | 0 (0.0%) |
| High School Diploma | 184 (91.1%) | 0 (0.0%) |
| College / Associate Degree | 229 (70.9%) | 10 (3.1%) |
| Bachelor's Degree or higher | 60 (95.2%) | 0 (0.0%) |
| Total | 482 (80.7%) | 9 (1.5%) |
Employment Occupations by Sex in Burt
Management, Business, Science and Arts Occupations
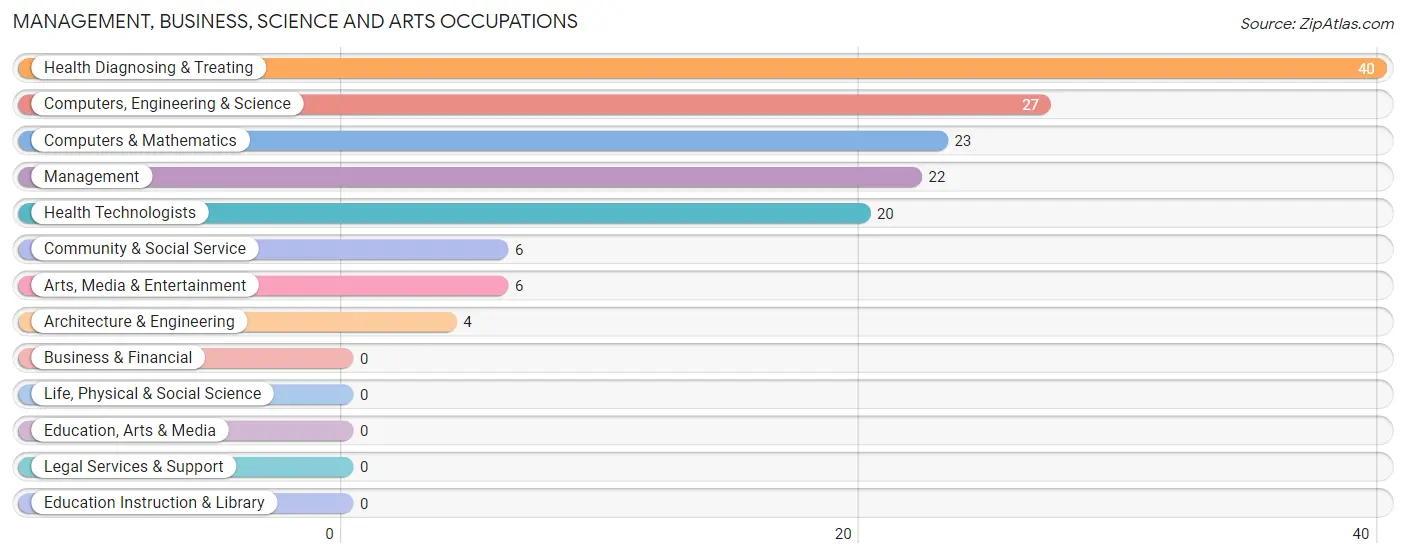
The most common Management, Business, Science and Arts occupations in Burt are Health Diagnosing & Treating (40 | 6.9%), Computers, Engineering & Science (27 | 4.7%), Computers & Mathematics (23 | 4.0%), Management (22 | 3.8%), and Health Technologists (20 | 3.5%).
Management, Business, Science and Arts Occupations by Sex
Within the Management, Business, Science and Arts occupations in Burt, the most male-oriented occupations are Computers, Engineering & Science (100.0%), Computers & Mathematics (100.0%), and Architecture & Engineering (100.0%), while the most female-oriented occupations are Management (100.0%), Community & Social Service (100.0%), and Arts, Media & Entertainment (100.0%).
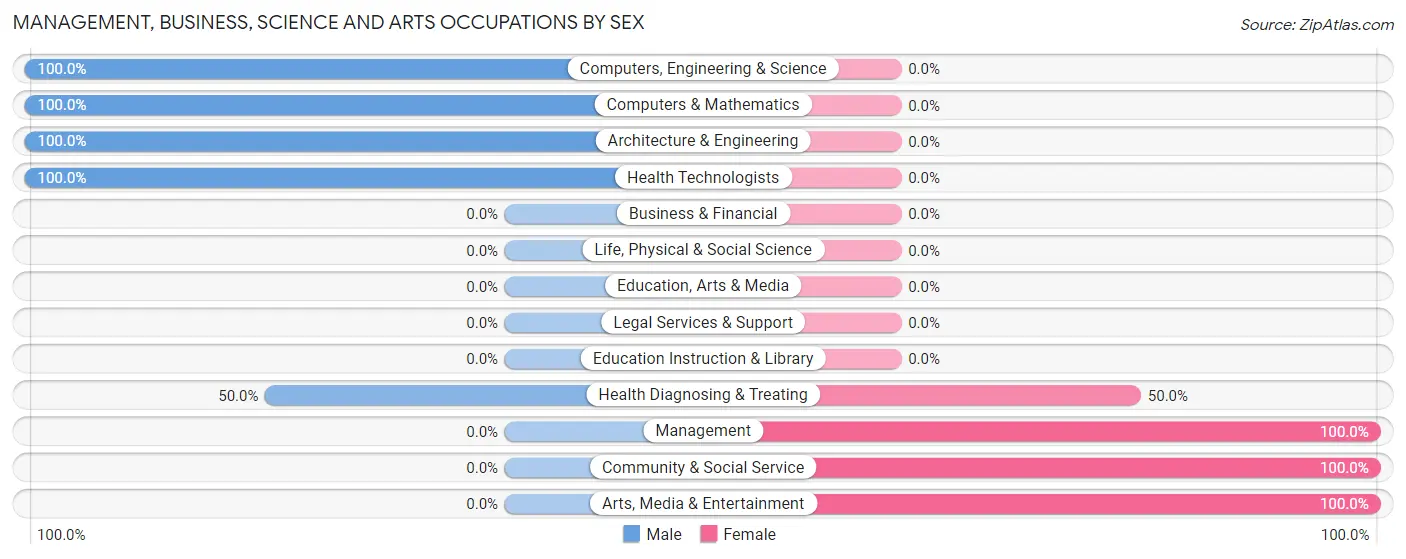
| Occupation | Male | Female |
| Management | 0 (0.0%) | 22 (100.0%) |
| Business & Financial | 0 (0.0%) | 0 (0.0%) |
| Computers, Engineering & Science | 27 (100.0%) | 0 (0.0%) |
| Computers & Mathematics | 23 (100.0%) | 0 (0.0%) |
| Architecture & Engineering | 4 (100.0%) | 0 (0.0%) |
| Life, Physical & Social Science | 0 (0.0%) | 0 (0.0%) |
| Community & Social Service | 0 (0.0%) | 6 (100.0%) |
| Education, Arts & Media | 0 (0.0%) | 0 (0.0%) |
| Legal Services & Support | 0 (0.0%) | 0 (0.0%) |
| Education Instruction & Library | 0 (0.0%) | 0 (0.0%) |
| Arts, Media & Entertainment | 0 (0.0%) | 6 (100.0%) |
| Health Diagnosing & Treating | 20 (50.0%) | 20 (50.0%) |
| Health Technologists | 20 (100.0%) | 0 (0.0%) |
| Total (Category) | 47 (49.5%) | 48 (50.5%) |
| Total (Overall) | 341 (58.9%) | 238 (41.1%) |
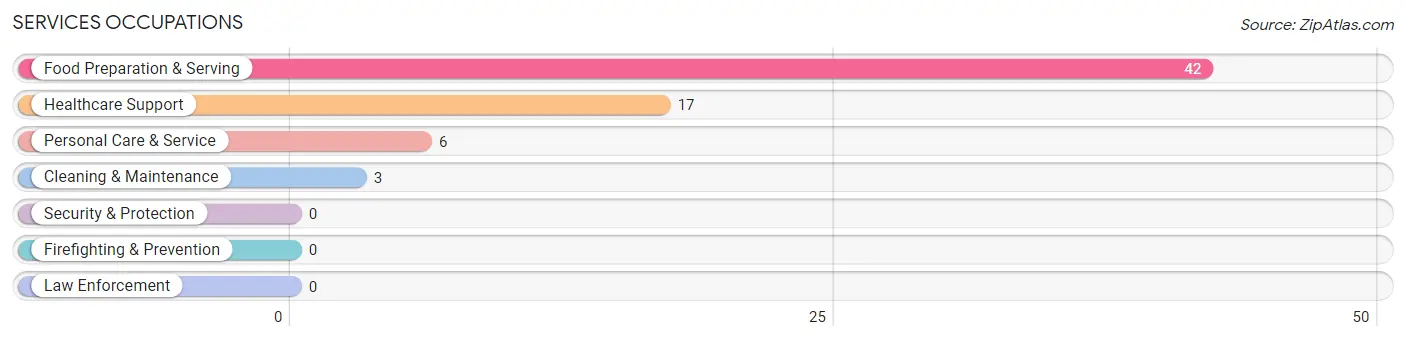
Services Occupations
The most common Services occupations in Burt are Food Preparation & Serving (42 | 7.2%), Healthcare Support (17 | 2.9%), Personal Care & Service (6 | 1.0%), and Cleaning & Maintenance (3 | 0.5%).
Services Occupations by Sex
Within the Services occupations in Burt, the most male-oriented occupations are Cleaning & Maintenance (100.0%), and Food Preparation & Serving (4.8%), while the most female-oriented occupations are Healthcare Support (100.0%), Personal Care & Service (100.0%), and Food Preparation & Serving (95.2%).
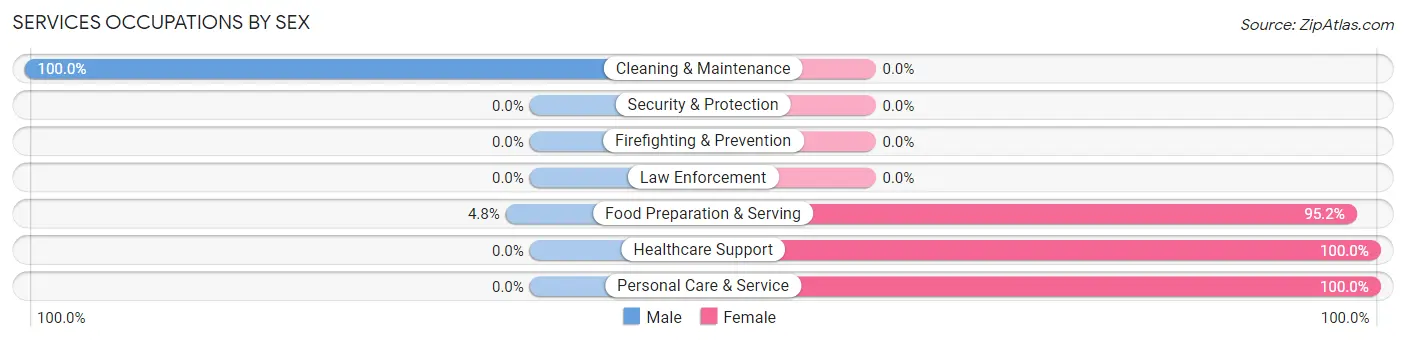
| Occupation | Male | Female |
| Healthcare Support | 0 (0.0%) | 17 (100.0%) |
| Security & Protection | 0 (0.0%) | 0 (0.0%) |
| Firefighting & Prevention | 0 (0.0%) | 0 (0.0%) |
| Law Enforcement | 0 (0.0%) | 0 (0.0%) |
| Food Preparation & Serving | 2 (4.8%) | 40 (95.2%) |
| Cleaning & Maintenance | 3 (100.0%) | 0 (0.0%) |
| Personal Care & Service | 0 (0.0%) | 6 (100.0%) |
| Total (Category) | 5 (7.3%) | 63 (92.6%) |
| Total (Overall) | 341 (58.9%) | 238 (41.1%) |
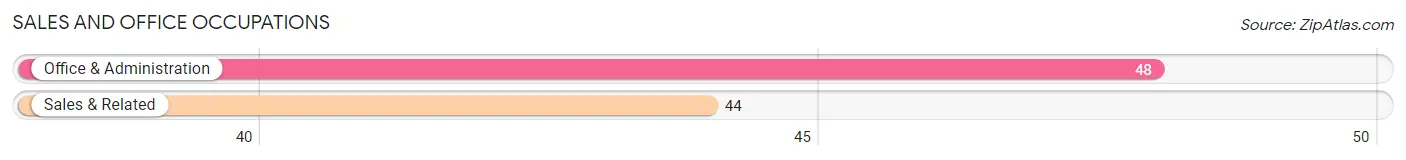
Sales and Office Occupations
The most common Sales and Office occupations in Burt are Office & Administration (48 | 8.3%), and Sales & Related (44 | 7.6%).
Sales and Office Occupations by Sex
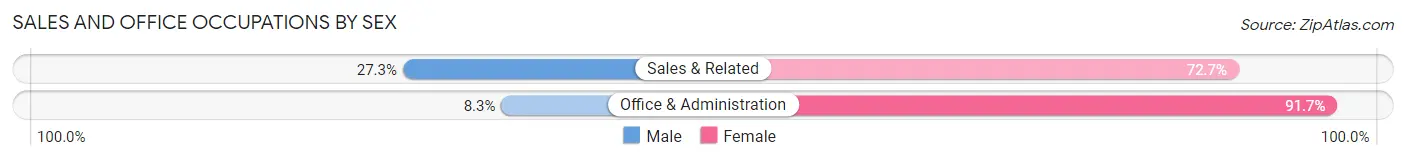
| Occupation | Male | Female |
| Sales & Related | 12 (27.3%) | 32 (72.7%) |
| Office & Administration | 4 (8.3%) | 44 (91.7%) |
| Total (Category) | 16 (17.4%) | 76 (82.6%) |
| Total (Overall) | 341 (58.9%) | 238 (41.1%) |
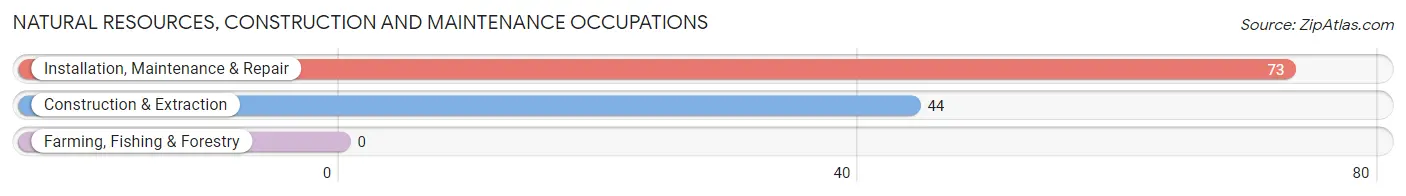
Natural Resources, Construction and Maintenance Occupations
The most common Natural Resources, Construction and Maintenance occupations in Burt are Installation, Maintenance & Repair (73 | 12.6%), and Construction & Extraction (44 | 7.6%).
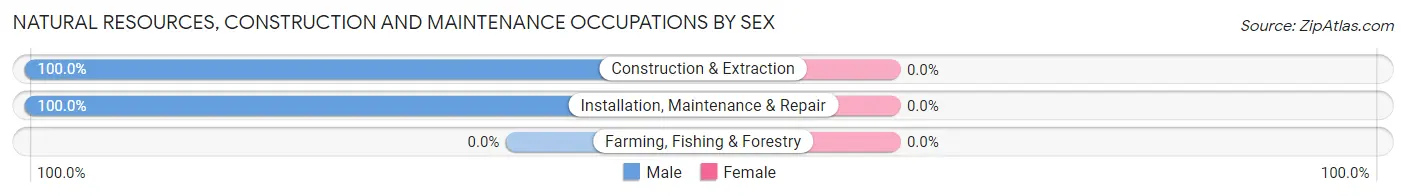
Natural Resources, Construction and Maintenance Occupations by Sex
| Occupation | Male | Female |
| Farming, Fishing & Forestry | 0 (0.0%) | 0 (0.0%) |
| Construction & Extraction | 44 (100.0%) | 0 (0.0%) |
| Installation, Maintenance & Repair | 73 (100.0%) | 0 (0.0%) |
| Total (Category) | 117 (100.0%) | 0 (0.0%) |
| Total (Overall) | 341 (58.9%) | 238 (41.1%) |
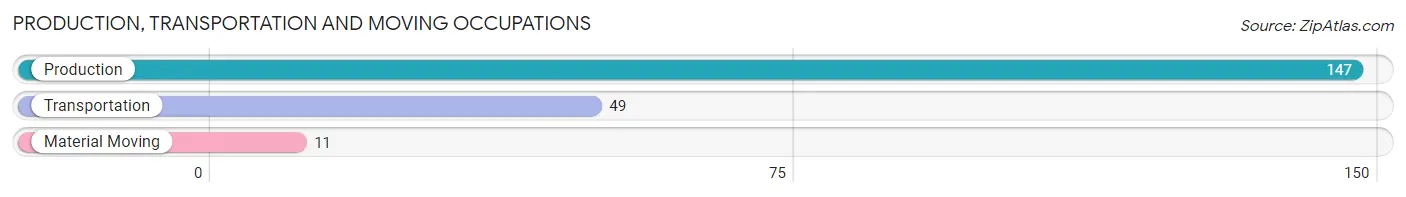
Production, Transportation and Moving Occupations
The most common Production, Transportation and Moving occupations in Burt are Production (147 | 25.4%), Transportation (49 | 8.5%), and Material Moving (11 | 1.9%).
Production, Transportation and Moving Occupations by Sex
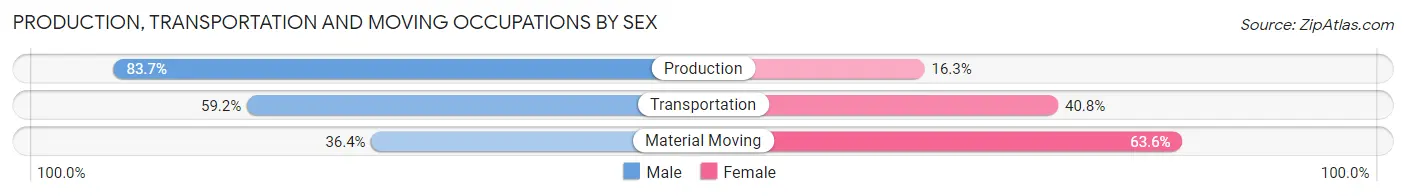
| Occupation | Male | Female |
| Production | 123 (83.7%) | 24 (16.3%) |
| Transportation | 29 (59.2%) | 20 (40.8%) |
| Material Moving | 4 (36.4%) | 7 (63.6%) |
| Total (Category) | 156 (75.4%) | 51 (24.6%) |
| Total (Overall) | 341 (58.9%) | 238 (41.1%) |
Employment Industries by Sex in Burt
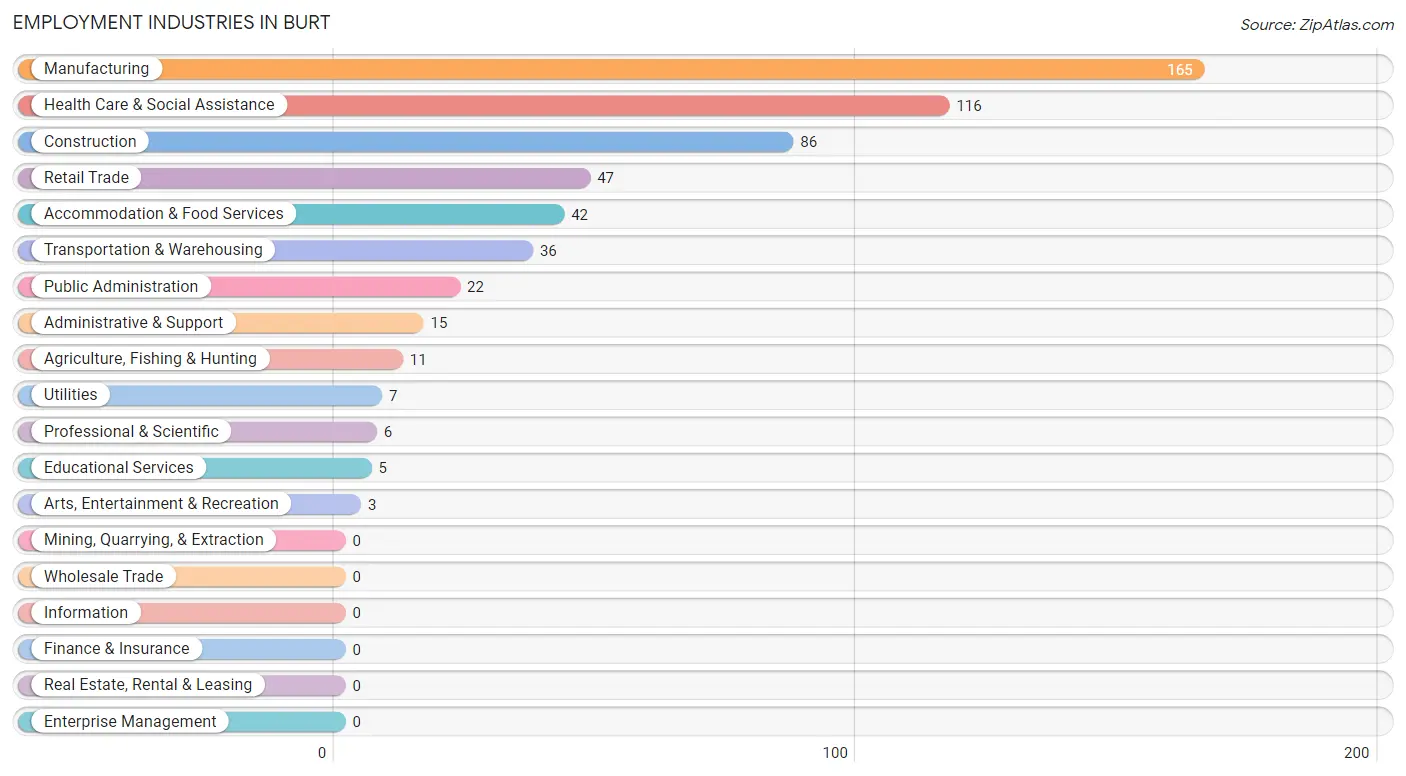
Employment Industries in Burt
The major employment industries in Burt include Manufacturing (165 | 28.5%), Health Care & Social Assistance (116 | 20.0%), Construction (86 | 14.8%), Retail Trade (47 | 8.1%), and Accommodation & Food Services (42 | 7.2%).
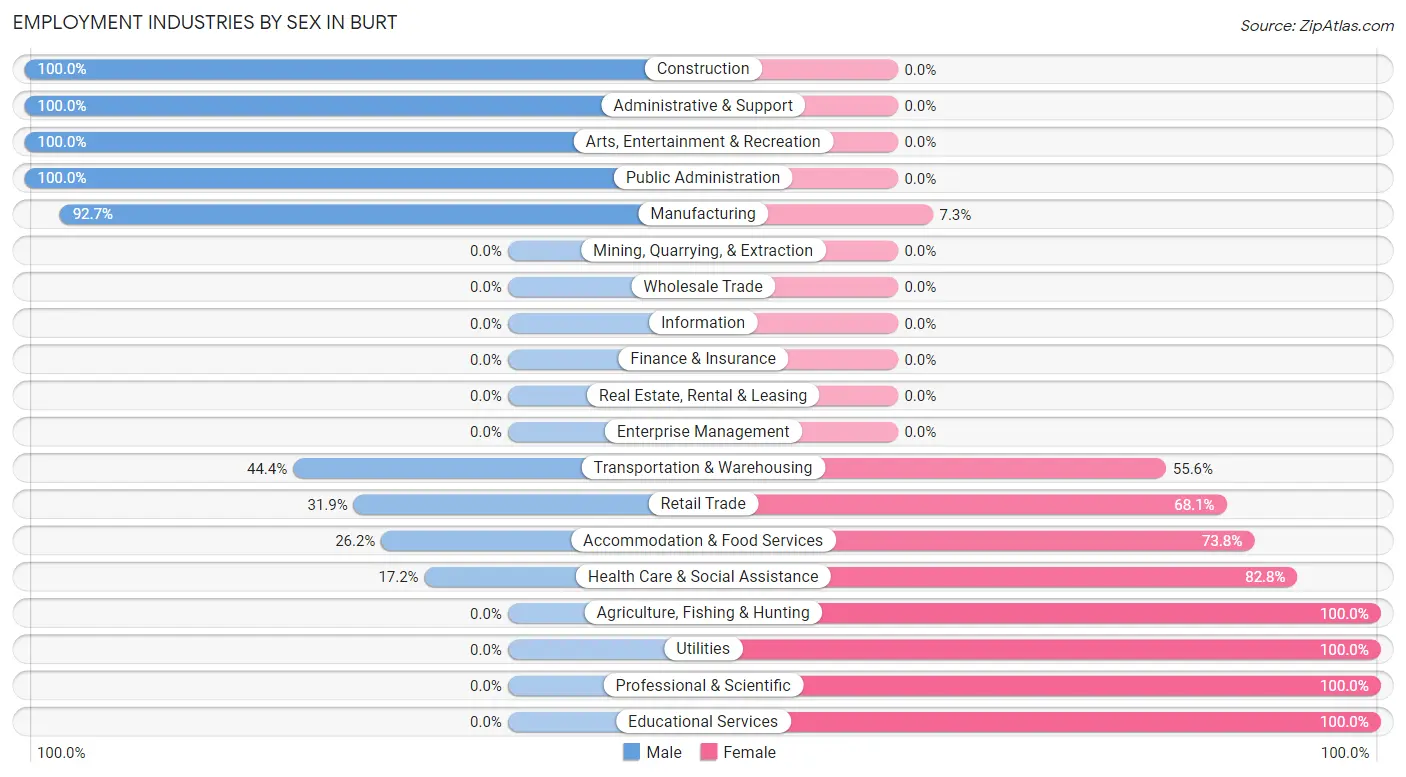
Employment Industries by Sex in Burt
The Burt industries that see more men than women are Construction (100.0%), Administrative & Support (100.0%), and Arts, Entertainment & Recreation (100.0%), whereas the industries that tend to have a higher number of women are Agriculture, Fishing & Hunting (100.0%), Utilities (100.0%), and Professional & Scientific (100.0%).
| Industry | Male | Female |
| Agriculture, Fishing & Hunting | 0 (0.0%) | 11 (100.0%) |
| Mining, Quarrying, & Extraction | 0 (0.0%) | 0 (0.0%) |
| Construction | 86 (100.0%) | 0 (0.0%) |
| Manufacturing | 153 (92.7%) | 12 (7.3%) |
| Wholesale Trade | 0 (0.0%) | 0 (0.0%) |
| Retail Trade | 15 (31.9%) | 32 (68.1%) |
| Transportation & Warehousing | 16 (44.4%) | 20 (55.6%) |
| Utilities | 0 (0.0%) | 7 (100.0%) |
| Information | 0 (0.0%) | 0 (0.0%) |
| Finance & Insurance | 0 (0.0%) | 0 (0.0%) |
| Real Estate, Rental & Leasing | 0 (0.0%) | 0 (0.0%) |
| Professional & Scientific | 0 (0.0%) | 6 (100.0%) |
| Enterprise Management | 0 (0.0%) | 0 (0.0%) |
| Administrative & Support | 15 (100.0%) | 0 (0.0%) |
| Educational Services | 0 (0.0%) | 5 (100.0%) |
| Health Care & Social Assistance | 20 (17.2%) | 96 (82.8%) |
| Arts, Entertainment & Recreation | 3 (100.0%) | 0 (0.0%) |
| Accommodation & Food Services | 11 (26.2%) | 31 (73.8%) |
| Public Administration | 22 (100.0%) | 0 (0.0%) |
| Total | 341 (58.9%) | 238 (41.1%) |
Education in Burt
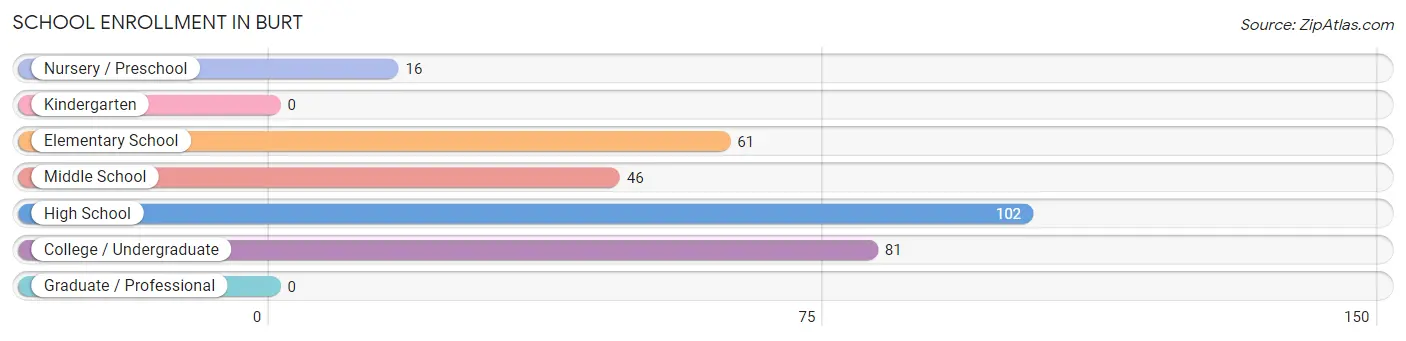
School Enrollment in Burt
The most common levels of schooling among the 306 students in Burt are high school (102 | 33.3%), college / undergraduate (81 | 26.5%), and elementary school (61 | 19.9%).
| School Level | # Students | % Students |
| Nursery / Preschool | 16 | 5.2% |
| Kindergarten | 0 | 0.0% |
| Elementary School | 61 | 19.9% |
| Middle School | 46 | 15.0% |
| High School | 102 | 33.3% |
| College / Undergraduate | 81 | 26.5% |
| Graduate / Professional | 0 | 0.0% |
| Total | 306 | 100.0% |
School Enrollment by Age by Funding Source in Burt
Out of a total of 306 students who are enrolled in schools in Burt, 29 (9.5%) attend a private institution, while the remaining 277 (90.5%) are enrolled in public schools. The age group of 25 to 34 year olds has the highest likelihood of being enrolled in private schools, with 20 (100.0% in the age bracket) enrolled. Conversely, the age group of 3 to 4 year olds has the lowest likelihood of being enrolled in a private school, with 16 (100.0% in the age bracket) attending a public institution.
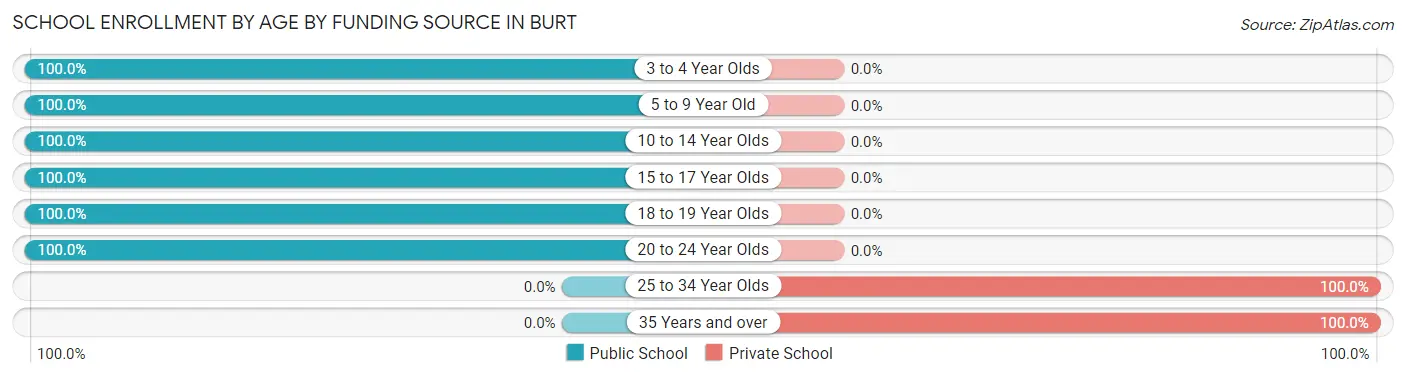
| Age Bracket | Public School | Private School |
| 3 to 4 Year Olds | 16 (100.0%) | 0 (0.0%) |
| 5 to 9 Year Old | 47 (100.0%) | 0 (0.0%) |
| 10 to 14 Year Olds | 63 (100.0%) | 0 (0.0%) |
| 15 to 17 Year Olds | 86 (100.0%) | 0 (0.0%) |
| 18 to 19 Year Olds | 13 (100.0%) | 0 (0.0%) |
| 20 to 24 Year Olds | 52 (100.0%) | 0 (0.0%) |
| 25 to 34 Year Olds | 0 (0.0%) | 20 (100.0%) |
| 35 Years and over | 0 (0.0%) | 9 (100.0%) |
| Total | 277 (90.5%) | 29 (9.5%) |
Educational Attainment by Field of Study in Burt
Engineering (27 | 36.5%), science & technology (22 | 29.7%), arts & humanities (14 | 18.9%), and bio, nature & agricultural (11 | 14.9%) are the most common fields of study among 74 individuals in Burt who have obtained a bachelor's degree or higher.
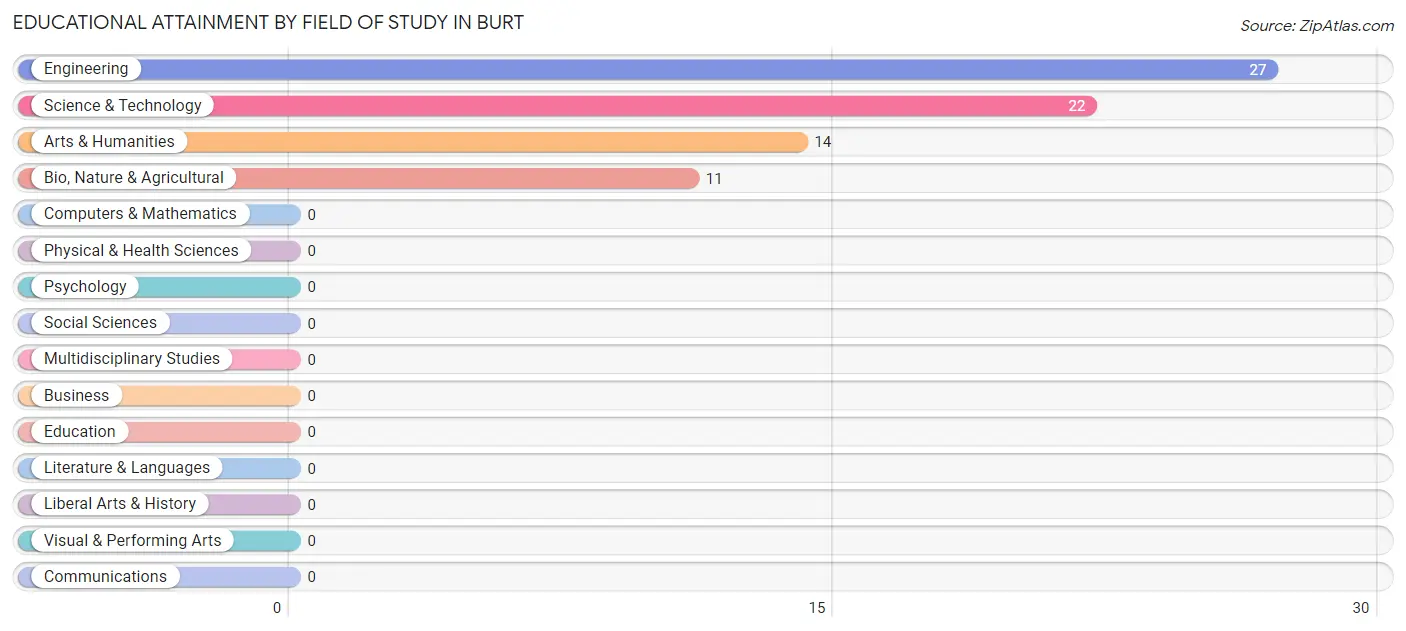
| Field of Study | # Graduates | % Graduates |
| Computers & Mathematics | 0 | 0.0% |
| Bio, Nature & Agricultural | 11 | 14.9% |
| Physical & Health Sciences | 0 | 0.0% |
| Psychology | 0 | 0.0% |
| Social Sciences | 0 | 0.0% |
| Engineering | 27 | 36.5% |
| Multidisciplinary Studies | 0 | 0.0% |
| Science & Technology | 22 | 29.7% |
| Business | 0 | 0.0% |
| Education | 0 | 0.0% |
| Literature & Languages | 0 | 0.0% |
| Liberal Arts & History | 0 | 0.0% |
| Visual & Performing Arts | 0 | 0.0% |
| Communications | 0 | 0.0% |
| Arts & Humanities | 14 | 18.9% |
| Total | 74 | 100.0% |
Transportation & Commute in Burt
Vehicle Availability by Sex in Burt
The most prevalent vehicle ownership categories in Burt are males with 2 vehicles (142, accounting for 41.6%) and females with 2 vehicles (71, making up 62.6%).
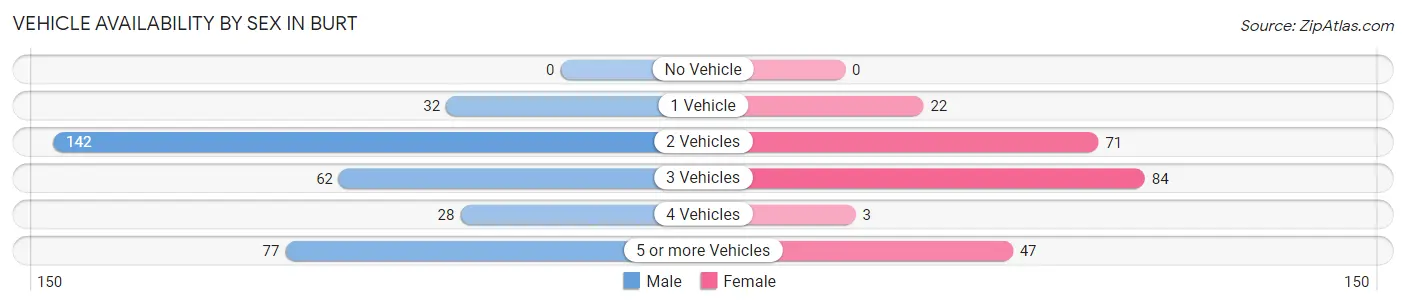
| Vehicles Available | Male | Female |
| No Vehicle | 0 (0.0%) | 0 (0.0%) |
| 1 Vehicle | 32 (9.4%) | 22 (9.7%) |
| 2 Vehicles | 142 (41.6%) | 71 (31.3%) |
| 3 Vehicles | 62 (18.2%) | 84 (37.0%) |
| 4 Vehicles | 28 (8.2%) | 3 (1.3%) |
| 5 or more Vehicles | 77 (22.6%) | 47 (20.7%) |
| Total | 341 (100.0%) | 227 (100.0%) |
Commute Time in Burt
The most frequently occuring commute durations in Burt are 30 to 34 minutes (136 commuters, 24.4%), 20 to 24 minutes (105 commuters, 18.9%), and 15 to 19 minutes (92 commuters, 16.5%).
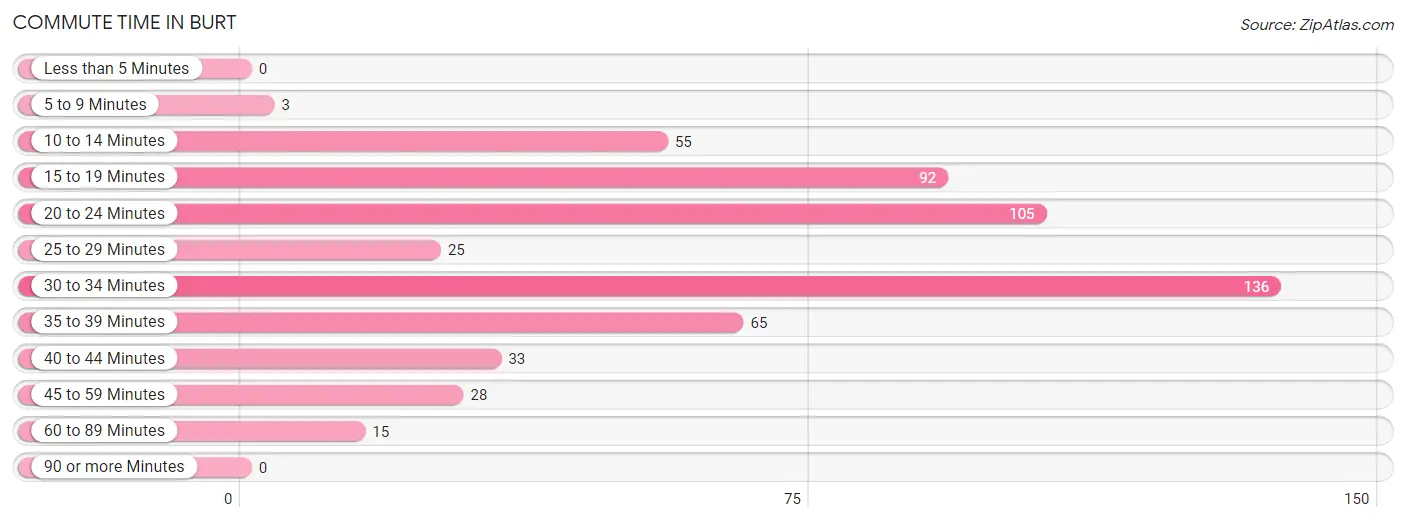
| Commute Time | # Commuters | % Commuters |
| Less than 5 Minutes | 0 | 0.0% |
| 5 to 9 Minutes | 3 | 0.5% |
| 10 to 14 Minutes | 55 | 9.9% |
| 15 to 19 Minutes | 92 | 16.5% |
| 20 to 24 Minutes | 105 | 18.9% |
| 25 to 29 Minutes | 25 | 4.5% |
| 30 to 34 Minutes | 136 | 24.4% |
| 35 to 39 Minutes | 65 | 11.7% |
| 40 to 44 Minutes | 33 | 5.9% |
| 45 to 59 Minutes | 28 | 5.0% |
| 60 to 89 Minutes | 15 | 2.7% |
| 90 or more Minutes | 0 | 0.0% |
Commute Time by Sex in Burt
The most common commute times in Burt are 20 to 24 minutes (88 commuters, 25.8%) for males and 30 to 34 minutes (55 commuters, 25.5%) for females.
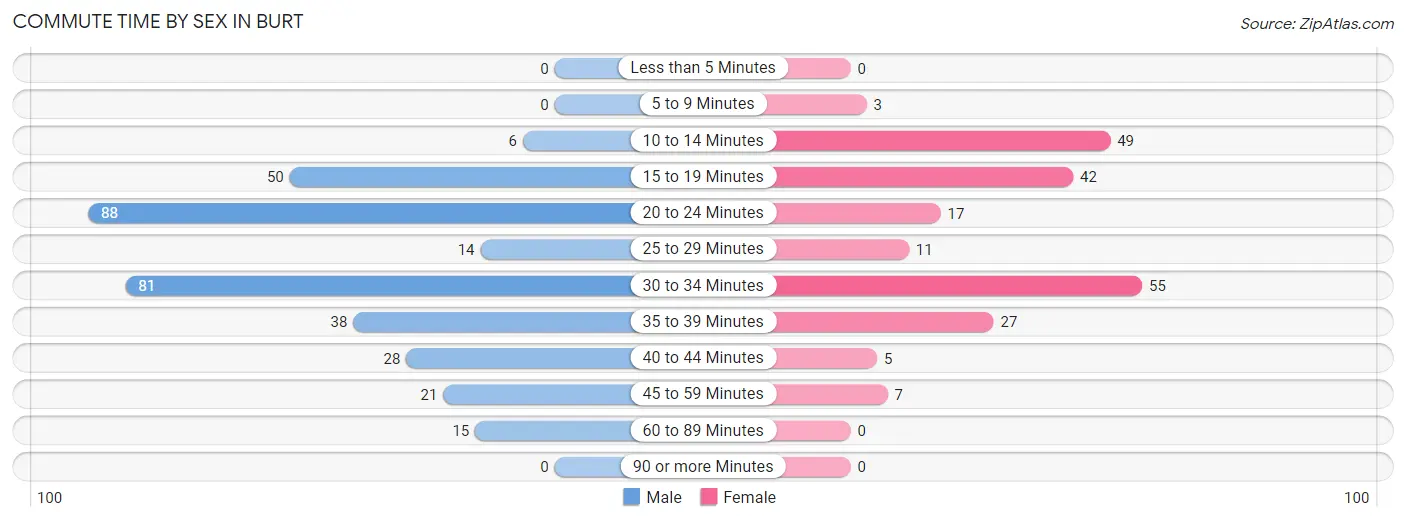
| Commute Time | Male | Female |
| Less than 5 Minutes | 0 (0.0%) | 0 (0.0%) |
| 5 to 9 Minutes | 0 (0.0%) | 3 (1.4%) |
| 10 to 14 Minutes | 6 (1.8%) | 49 (22.7%) |
| 15 to 19 Minutes | 50 (14.7%) | 42 (19.4%) |
| 20 to 24 Minutes | 88 (25.8%) | 17 (7.9%) |
| 25 to 29 Minutes | 14 (4.1%) | 11 (5.1%) |
| 30 to 34 Minutes | 81 (23.7%) | 55 (25.5%) |
| 35 to 39 Minutes | 38 (11.1%) | 27 (12.5%) |
| 40 to 44 Minutes | 28 (8.2%) | 5 (2.3%) |
| 45 to 59 Minutes | 21 (6.2%) | 7 (3.2%) |
| 60 to 89 Minutes | 15 (4.4%) | 0 (0.0%) |
| 90 or more Minutes | 0 (0.0%) | 0 (0.0%) |
Time of Departure to Work by Sex in Burt
The most frequent times of departure to work in Burt are 7:00 AM to 7:29 AM (85, 24.9%) for males and 12:00 PM to 3:59 PM (53, 24.5%) for females.
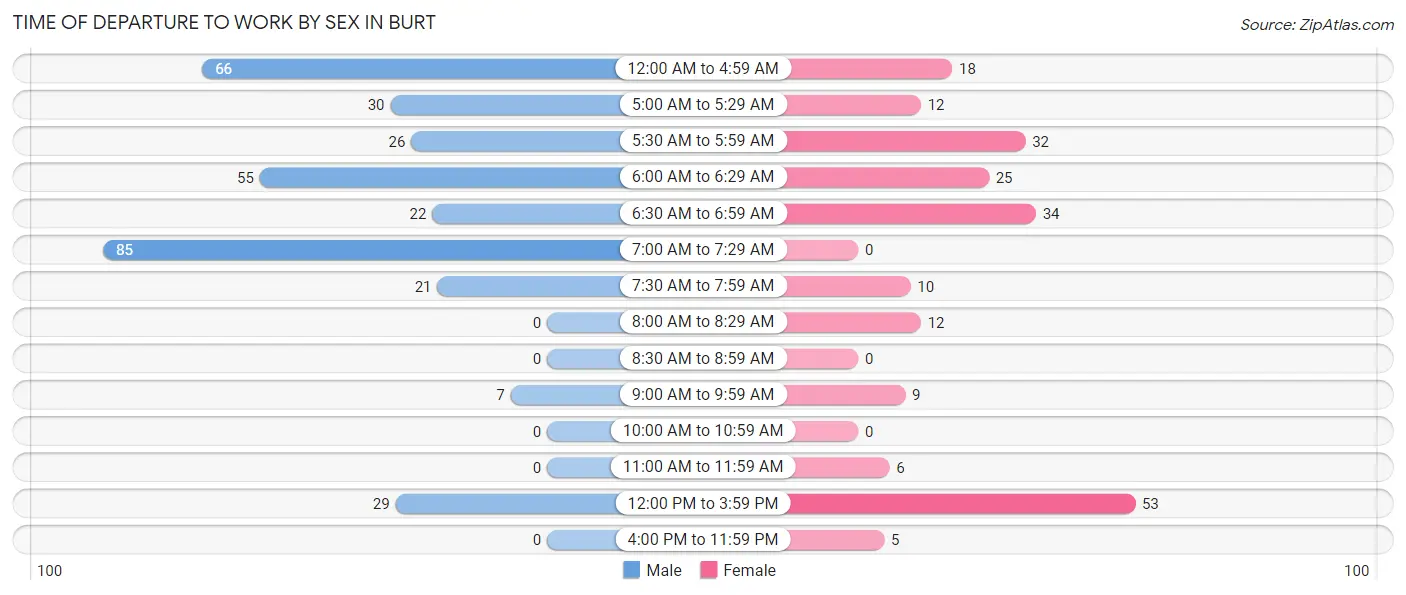
| Time of Departure | Male | Female |
| 12:00 AM to 4:59 AM | 66 (19.4%) | 18 (8.3%) |
| 5:00 AM to 5:29 AM | 30 (8.8%) | 12 (5.6%) |
| 5:30 AM to 5:59 AM | 26 (7.6%) | 32 (14.8%) |
| 6:00 AM to 6:29 AM | 55 (16.1%) | 25 (11.6%) |
| 6:30 AM to 6:59 AM | 22 (6.5%) | 34 (15.7%) |
| 7:00 AM to 7:29 AM | 85 (24.9%) | 0 (0.0%) |
| 7:30 AM to 7:59 AM | 21 (6.2%) | 10 (4.6%) |
| 8:00 AM to 8:29 AM | 0 (0.0%) | 12 (5.6%) |
| 8:30 AM to 8:59 AM | 0 (0.0%) | 0 (0.0%) |
| 9:00 AM to 9:59 AM | 7 (2.1%) | 9 (4.2%) |
| 10:00 AM to 10:59 AM | 0 (0.0%) | 0 (0.0%) |
| 11:00 AM to 11:59 AM | 0 (0.0%) | 6 (2.8%) |
| 12:00 PM to 3:59 PM | 29 (8.5%) | 53 (24.5%) |
| 4:00 PM to 11:59 PM | 0 (0.0%) | 5 (2.3%) |
| Total | 341 (100.0%) | 216 (100.0%) |
Housing Occupancy in Burt
Occupancy by Ownership in Burt
Of the total 481 dwellings in Burt, owner-occupied units account for 437 (90.8%), while renter-occupied units make up 44 (9.1%).
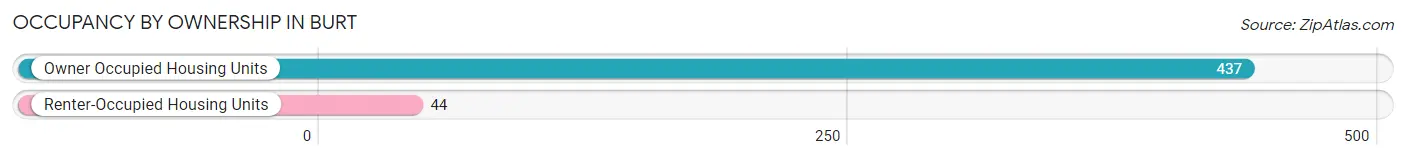
| Occupancy | # Housing Units | % Housing Units |
| Owner Occupied Housing Units | 437 | 90.8% |
| Renter-Occupied Housing Units | 44 | 9.1% |
| Total Occupied Housing Units | 481 | 100.0% |
Occupancy by Household Size in Burt
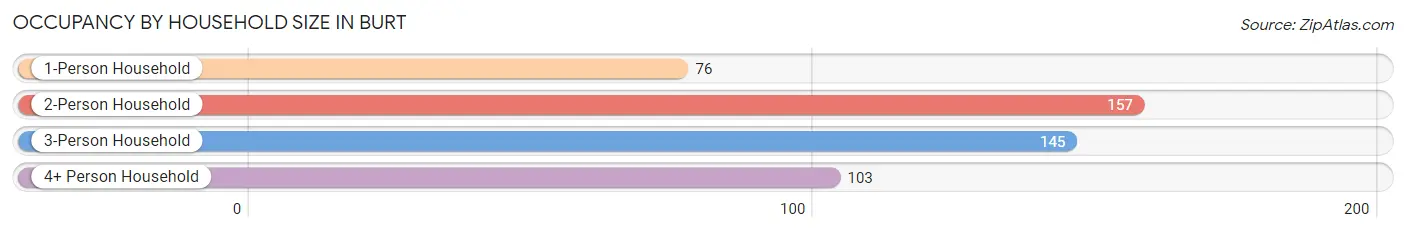
| Household Size | # Housing Units | % Housing Units |
| 1-Person Household | 76 | 15.8% |
| 2-Person Household | 157 | 32.6% |
| 3-Person Household | 145 | 30.1% |
| 4+ Person Household | 103 | 21.4% |
| Total Housing Units | 481 | 100.0% |
Occupancy by Ownership by Household Size in Burt
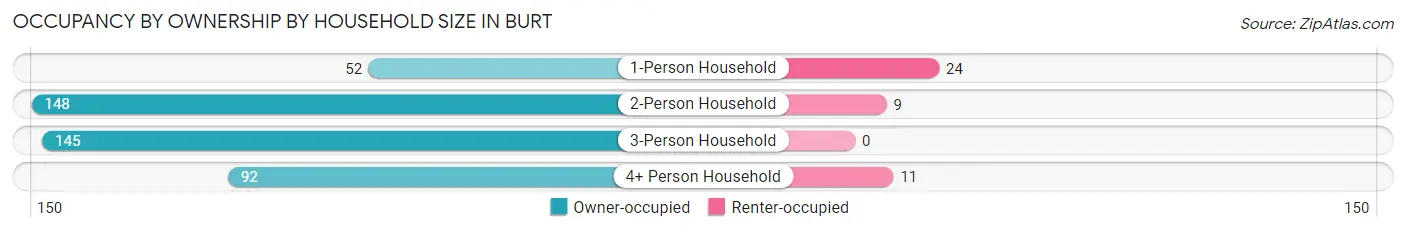
| Household Size | Owner-occupied | Renter-occupied |
| 1-Person Household | 52 (68.4%) | 24 (31.6%) |
| 2-Person Household | 148 (94.3%) | 9 (5.7%) |
| 3-Person Household | 145 (100.0%) | 0 (0.0%) |
| 4+ Person Household | 92 (89.3%) | 11 (10.7%) |
| Total Housing Units | 437 (90.8%) | 44 (9.1%) |
Occupancy by Educational Attainment in Burt
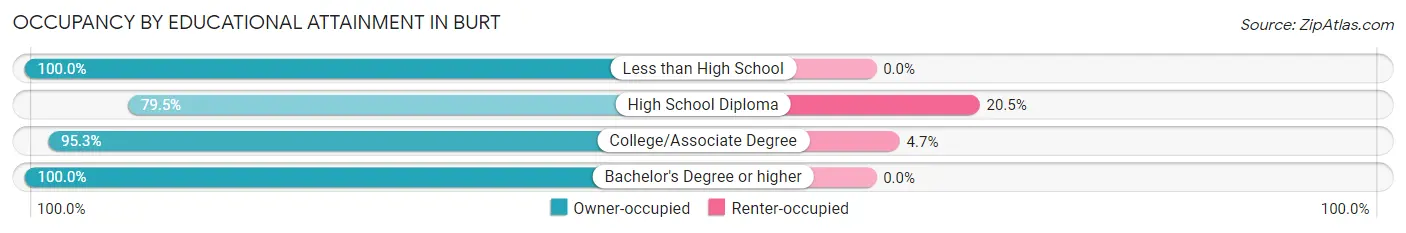
| Household Size | Owner-occupied | Renter-occupied |
| Less than High School | 35 (100.0%) | 0 (0.0%) |
| High School Diploma | 128 (79.5%) | 33 (20.5%) |
| College/Associate Degree | 225 (95.3%) | 11 (4.7%) |
| Bachelor's Degree or higher | 49 (100.0%) | 0 (0.0%) |
Occupancy by Age of Householder in Burt
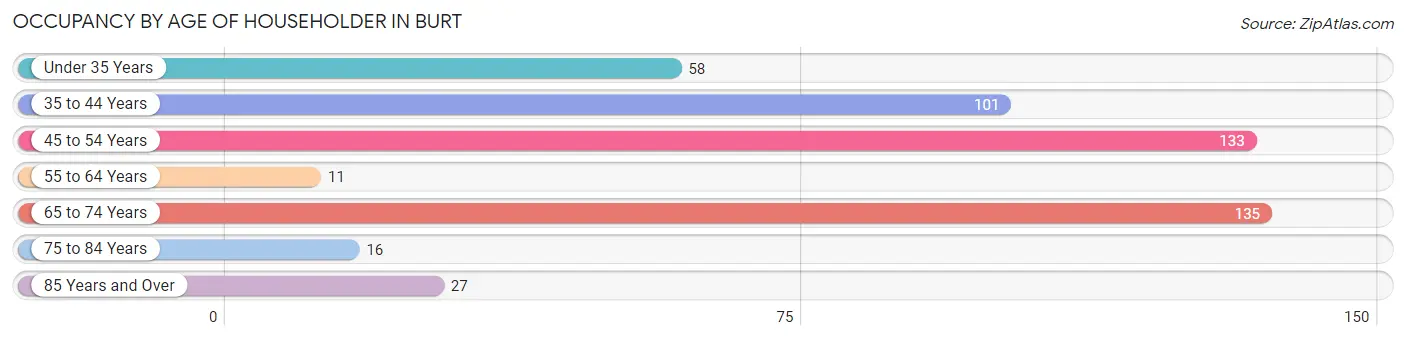
| Age Bracket | # Households | % Households |
| Under 35 Years | 58 | 12.1% |
| 35 to 44 Years | 101 | 21.0% |
| 45 to 54 Years | 133 | 27.7% |
| 55 to 64 Years | 11 | 2.3% |
| 65 to 74 Years | 135 | 28.1% |
| 75 to 84 Years | 16 | 3.3% |
| 85 Years and Over | 27 | 5.6% |
| Total | 481 | 100.0% |
Housing Finances in Burt
Median Income by Occupancy in Burt
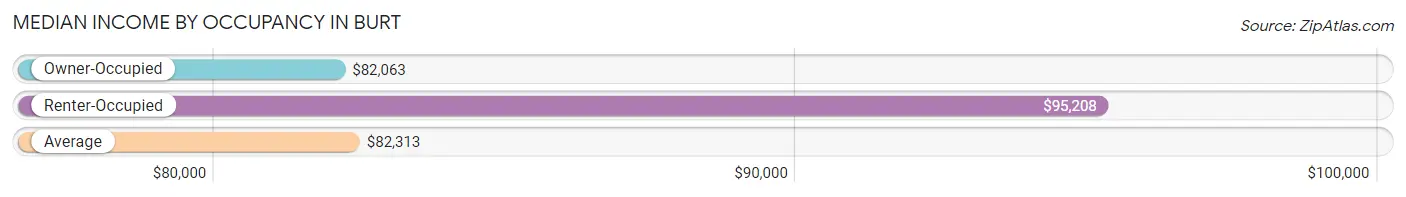
| Occupancy Type | # Households | Median Income |
| Owner-Occupied | 437 (90.8%) | $82,063 |
| Renter-Occupied | 44 (9.1%) | $95,208 |
| Average | 481 (100.0%) | $82,313 |
Occupancy by Householder Income Bracket in Burt
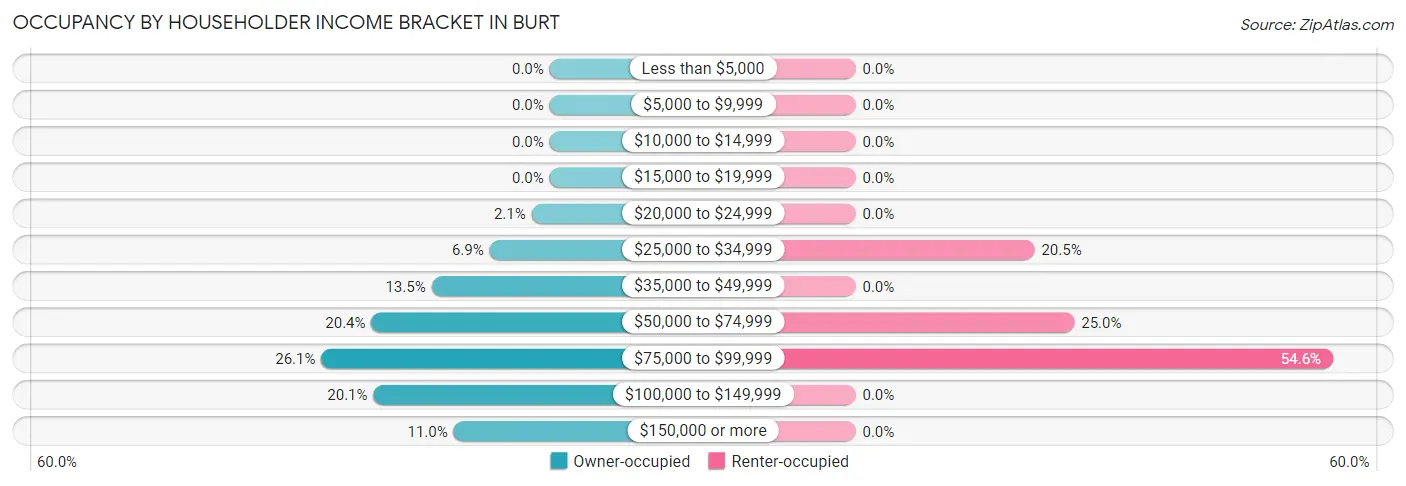
| Income Bracket | Owner-occupied | Renter-occupied |
| Less than $5,000 | 0 (0.0%) | 0 (0.0%) |
| $5,000 to $9,999 | 0 (0.0%) | 0 (0.0%) |
| $10,000 to $14,999 | 0 (0.0%) | 0 (0.0%) |
| $15,000 to $19,999 | 0 (0.0%) | 0 (0.0%) |
| $20,000 to $24,999 | 9 (2.1%) | 0 (0.0%) |
| $25,000 to $34,999 | 30 (6.9%) | 9 (20.4%) |
| $35,000 to $49,999 | 59 (13.5%) | 0 (0.0%) |
| $50,000 to $74,999 | 89 (20.4%) | 11 (25.0%) |
| $75,000 to $99,999 | 114 (26.1%) | 24 (54.5%) |
| $100,000 to $149,999 | 88 (20.1%) | 0 (0.0%) |
| $150,000 or more | 48 (11.0%) | 0 (0.0%) |
| Total | 437 (100.0%) | 44 (100.0%) |
Monthly Housing Cost Tiers in Burt
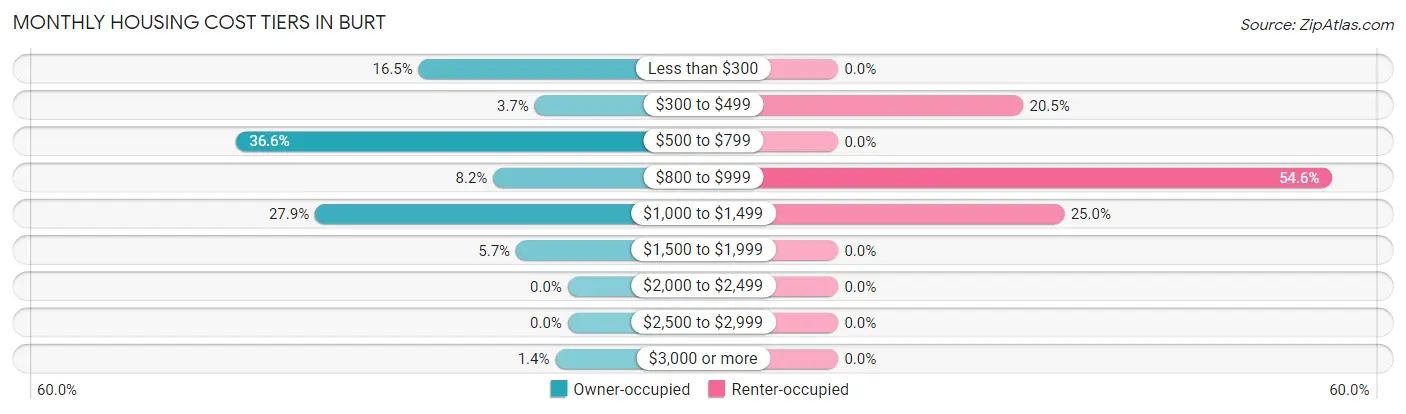
| Monthly Cost | Owner-occupied | Renter-occupied |
| Less than $300 | 72 (16.5%) | 0 (0.0%) |
| $300 to $499 | 16 (3.7%) | 9 (20.4%) |
| $500 to $799 | 160 (36.6%) | 0 (0.0%) |
| $800 to $999 | 36 (8.2%) | 24 (54.5%) |
| $1,000 to $1,499 | 122 (27.9%) | 11 (25.0%) |
| $1,500 to $1,999 | 25 (5.7%) | 0 (0.0%) |
| $2,000 to $2,499 | 0 (0.0%) | 0 (0.0%) |
| $2,500 to $2,999 | 0 (0.0%) | 0 (0.0%) |
| $3,000 or more | 6 (1.4%) | 0 (0.0%) |
| Total | 437 (100.0%) | 44 (100.0%) |
Physical Housing Characteristics in Burt
Housing Structures in Burt
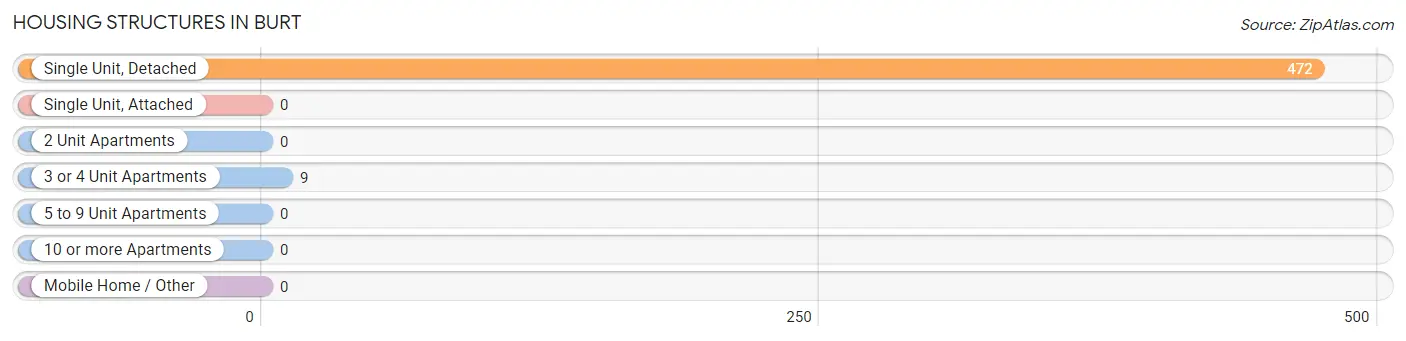
| Structure Type | # Housing Units | % Housing Units |
| Single Unit, Detached | 472 | 98.1% |
| Single Unit, Attached | 0 | 0.0% |
| 2 Unit Apartments | 0 | 0.0% |
| 3 or 4 Unit Apartments | 9 | 1.9% |
| 5 to 9 Unit Apartments | 0 | 0.0% |
| 10 or more Apartments | 0 | 0.0% |
| Mobile Home / Other | 0 | 0.0% |
| Total | 481 | 100.0% |
Housing Structures by Occupancy in Burt
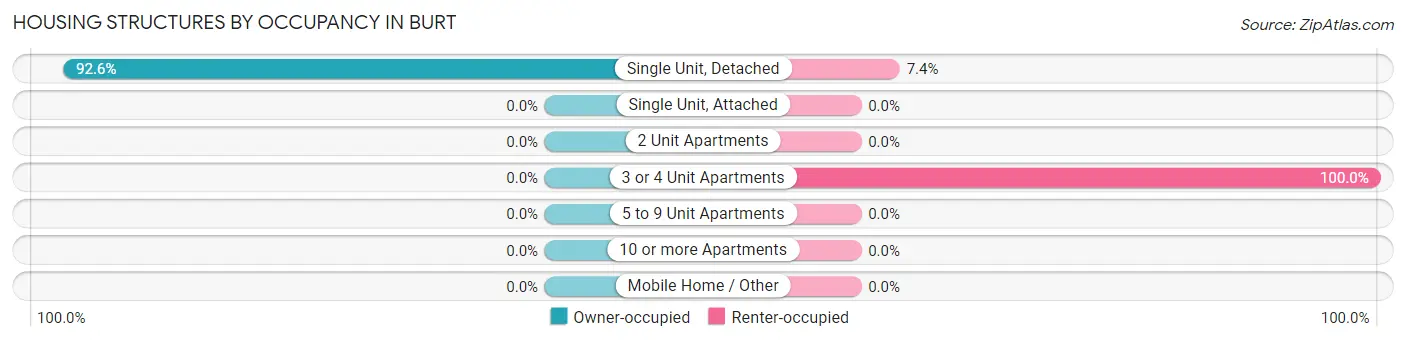
| Structure Type | Owner-occupied | Renter-occupied |
| Single Unit, Detached | 437 (92.6%) | 35 (7.4%) |
| Single Unit, Attached | 0 (0.0%) | 0 (0.0%) |
| 2 Unit Apartments | 0 (0.0%) | 0 (0.0%) |
| 3 or 4 Unit Apartments | 0 (0.0%) | 9 (100.0%) |
| 5 to 9 Unit Apartments | 0 (0.0%) | 0 (0.0%) |
| 10 or more Apartments | 0 (0.0%) | 0 (0.0%) |
| Mobile Home / Other | 0 (0.0%) | 0 (0.0%) |
| Total | 437 (90.8%) | 44 (9.1%) |
Housing Structures by Number of Rooms in Burt
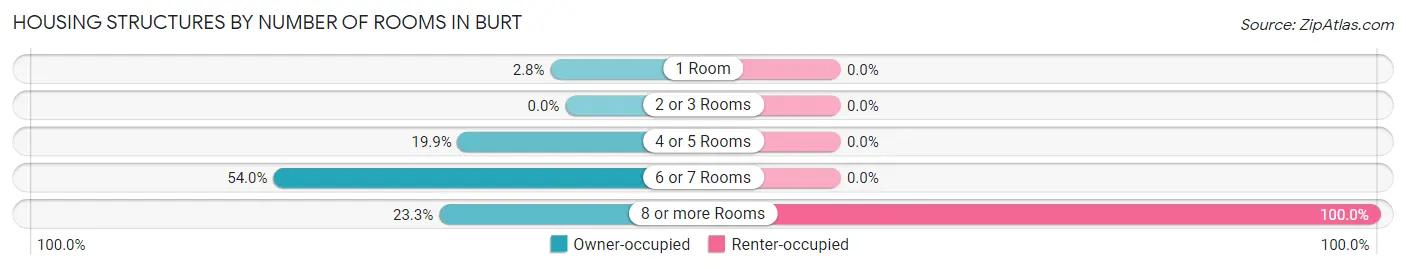
| Number of Rooms | Owner-occupied | Renter-occupied |
| 1 Room | 12 (2.8%) | 0 (0.0%) |
| 2 or 3 Rooms | 0 (0.0%) | 0 (0.0%) |
| 4 or 5 Rooms | 87 (19.9%) | 0 (0.0%) |
| 6 or 7 Rooms | 236 (54.0%) | 0 (0.0%) |
| 8 or more Rooms | 102 (23.3%) | 44 (100.0%) |
| Total | 437 (100.0%) | 44 (100.0%) |
Housing Structure by Heating Type in Burt
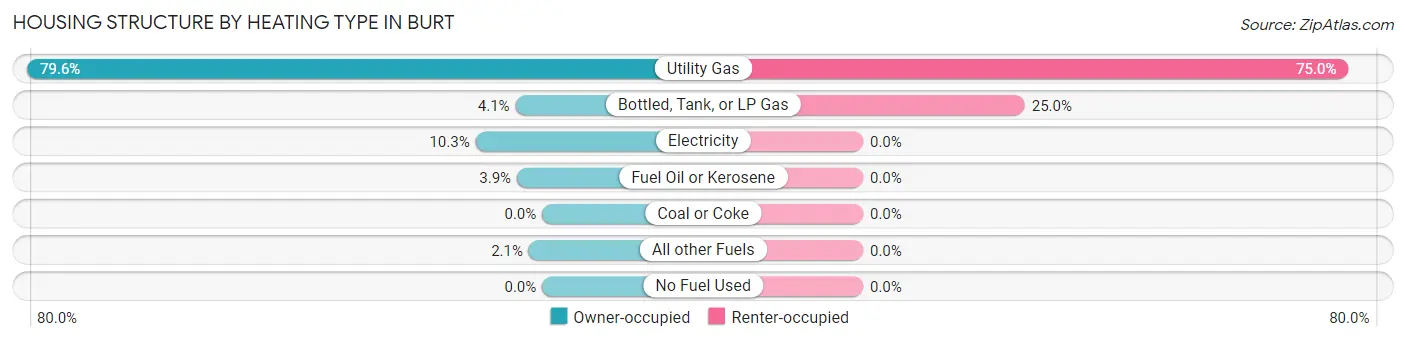
| Heating Type | Owner-occupied | Renter-occupied |
| Utility Gas | 348 (79.6%) | 33 (75.0%) |
| Bottled, Tank, or LP Gas | 18 (4.1%) | 11 (25.0%) |
| Electricity | 45 (10.3%) | 0 (0.0%) |
| Fuel Oil or Kerosene | 17 (3.9%) | 0 (0.0%) |
| Coal or Coke | 0 (0.0%) | 0 (0.0%) |
| All other Fuels | 9 (2.1%) | 0 (0.0%) |
| No Fuel Used | 0 (0.0%) | 0 (0.0%) |
| Total | 437 (100.0%) | 44 (100.0%) |
Household Vehicle Usage in Burt
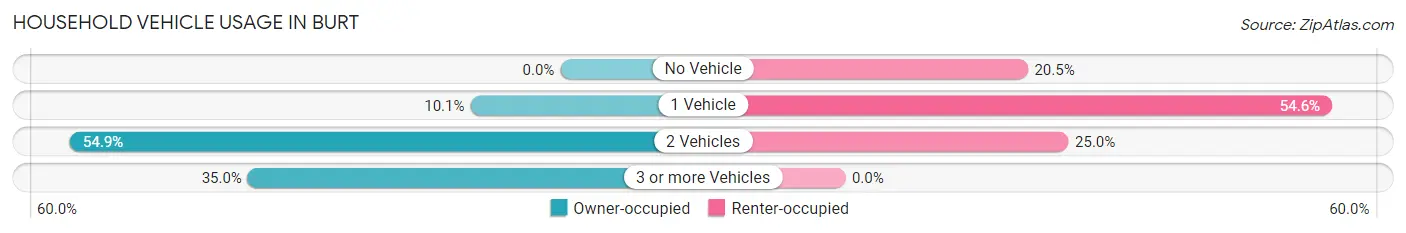
| Vehicles per Household | Owner-occupied | Renter-occupied |
| No Vehicle | 0 (0.0%) | 9 (20.4%) |
| 1 Vehicle | 44 (10.1%) | 24 (54.5%) |
| 2 Vehicles | 240 (54.9%) | 11 (25.0%) |
| 3 or more Vehicles | 153 (35.0%) | 0 (0.0%) |
| Total | 437 (100.0%) | 44 (100.0%) |
Real Estate & Mortgages in Burt
Real Estate and Mortgage Overview in Burt
| Characteristic | Without Mortgage | With Mortgage |
| Housing Units | 225 | 212 |
| Median Property Value | $158,100 | $167,100 |
| Median Household Income | $59,041 | $40 |
| Monthly Housing Costs | $582 | $6 |
| Real Estate Taxes | $2,183 | $0 |
Property Value by Mortgage Status in Burt
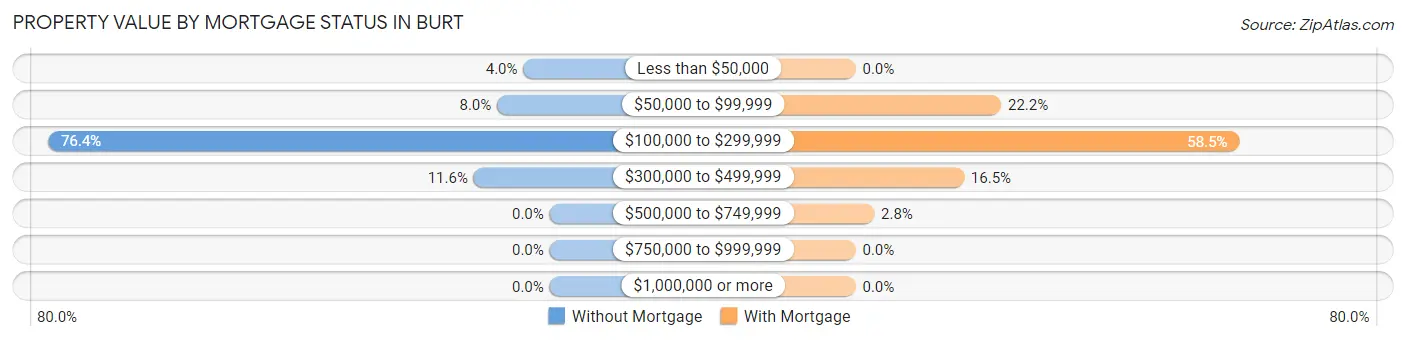
| Property Value | Without Mortgage | With Mortgage |
| Less than $50,000 | 9 (4.0%) | 0 (0.0%) |
| $50,000 to $99,999 | 18 (8.0%) | 47 (22.2%) |
| $100,000 to $299,999 | 172 (76.4%) | 124 (58.5%) |
| $300,000 to $499,999 | 26 (11.6%) | 35 (16.5%) |
| $500,000 to $749,999 | 0 (0.0%) | 6 (2.8%) |
| $750,000 to $999,999 | 0 (0.0%) | 0 (0.0%) |
| $1,000,000 or more | 0 (0.0%) | 0 (0.0%) |
| Total | 225 (100.0%) | 212 (100.0%) |
Household Income by Mortgage Status in Burt
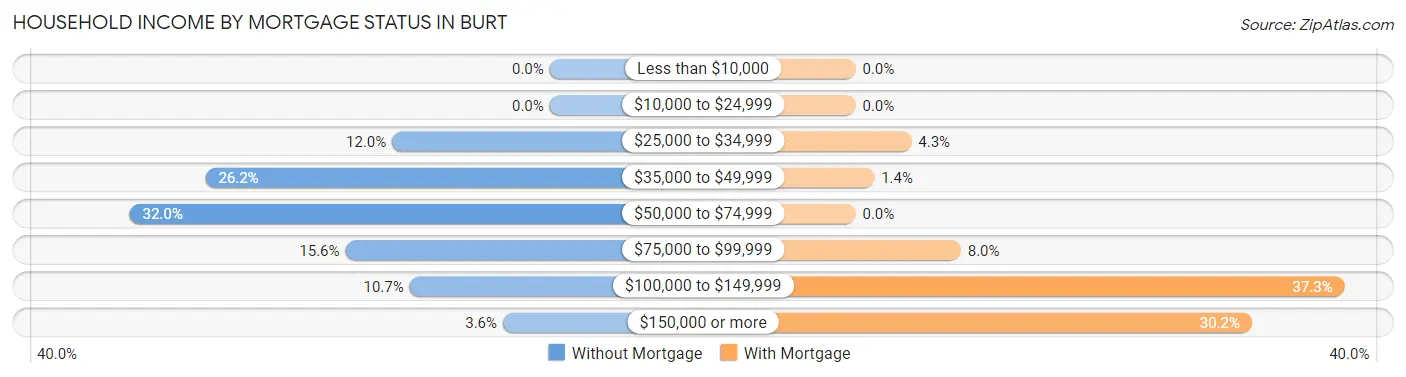
| Household Income | Without Mortgage | With Mortgage |
| Less than $10,000 | 0 (0.0%) | 0 (0.0%) |
| $10,000 to $24,999 | 0 (0.0%) | 0 (0.0%) |
| $25,000 to $34,999 | 27 (12.0%) | 9 (4.3%) |
| $35,000 to $49,999 | 59 (26.2%) | 3 (1.4%) |
| $50,000 to $74,999 | 72 (32.0%) | 0 (0.0%) |
| $75,000 to $99,999 | 35 (15.6%) | 17 (8.0%) |
| $100,000 to $149,999 | 24 (10.7%) | 79 (37.3%) |
| $150,000 or more | 8 (3.6%) | 64 (30.2%) |
| Total | 225 (100.0%) | 212 (100.0%) |
Property Value to Household Income Ratio in Burt
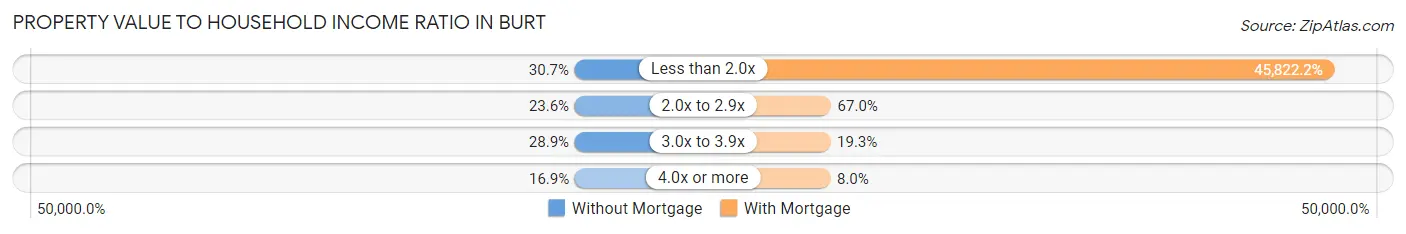
| Value-to-Income Ratio | Without Mortgage | With Mortgage |
| Less than 2.0x | 69 (30.7%) | 97,143 (45,822.2%) |
| 2.0x to 2.9x | 53 (23.6%) | 142 (67.0%) |
| 3.0x to 3.9x | 65 (28.9%) | 41 (19.3%) |
| 4.0x or more | 38 (16.9%) | 17 (8.0%) |
| Total | 225 (100.0%) | 212 (100.0%) |
Real Estate Taxes by Mortgage Status in Burt
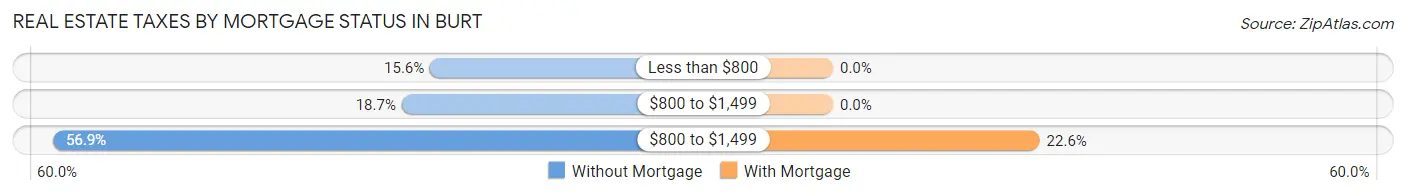
| Property Taxes | Without Mortgage | With Mortgage |
| Less than $800 | 35 (15.6%) | 0 (0.0%) |
| $800 to $1,499 | 42 (18.7%) | 0 (0.0%) |
| $800 to $1,499 | 128 (56.9%) | 48 (22.6%) |
| Total | 225 (100.0%) | 212 (100.0%) |
Health & Disability in Burt
Health Insurance Coverage by Age in Burt
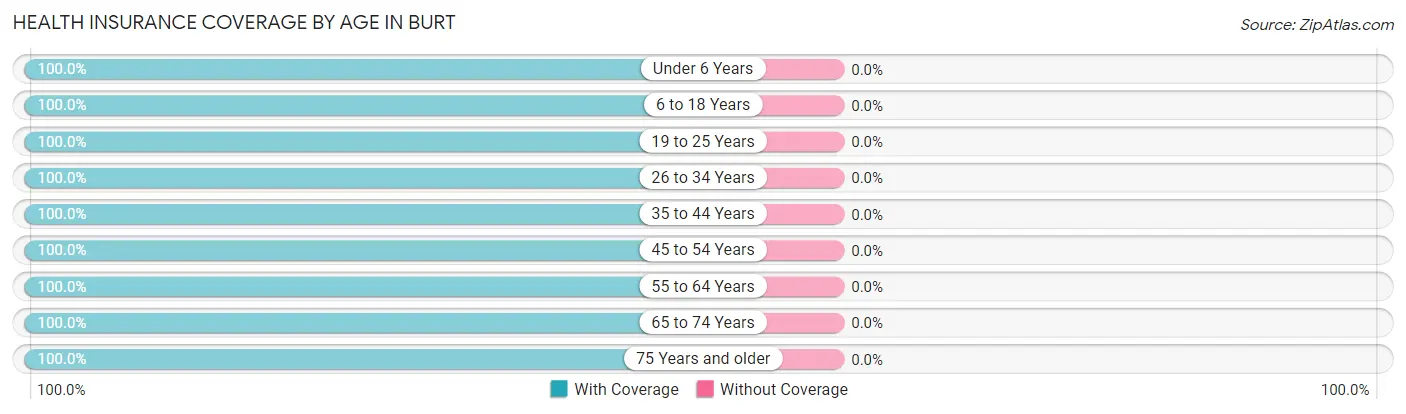
| Age Bracket | With Coverage | Without Coverage |
| Under 6 Years | 84 (100.0%) | 0 (0.0%) |
| 6 to 18 Years | 213 (100.0%) | 0 (0.0%) |
| 19 to 25 Years | 110 (100.0%) | 0 (0.0%) |
| 26 to 34 Years | 128 (100.0%) | 0 (0.0%) |
| 35 to 44 Years | 178 (100.0%) | 0 (0.0%) |
| 45 to 54 Years | 236 (100.0%) | 0 (0.0%) |
| 55 to 64 Years | 55 (100.0%) | 0 (0.0%) |
| 65 to 74 Years | 205 (100.0%) | 0 (0.0%) |
| 75 Years and older | 62 (100.0%) | 0 (0.0%) |
| Total | 1,271 (100.0%) | 0 (0.0%) |
Health Insurance Coverage by Citizenship Status in Burt
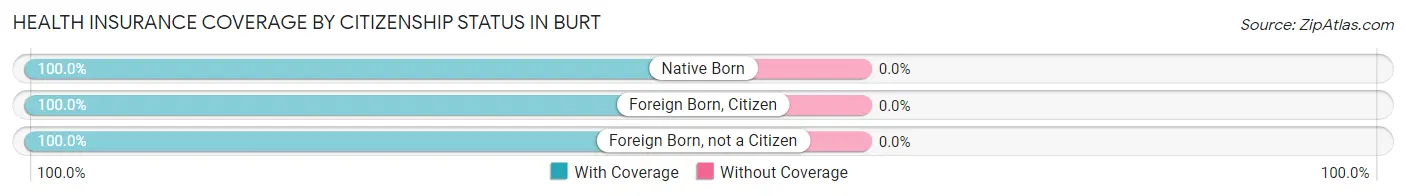
| Citizenship Status | With Coverage | Without Coverage |
| Native Born | 84 (100.0%) | 0 (0.0%) |
| Foreign Born, Citizen | 213 (100.0%) | 0 (0.0%) |
| Foreign Born, not a Citizen | 110 (100.0%) | 0 (0.0%) |
Health Insurance Coverage by Household Income in Burt
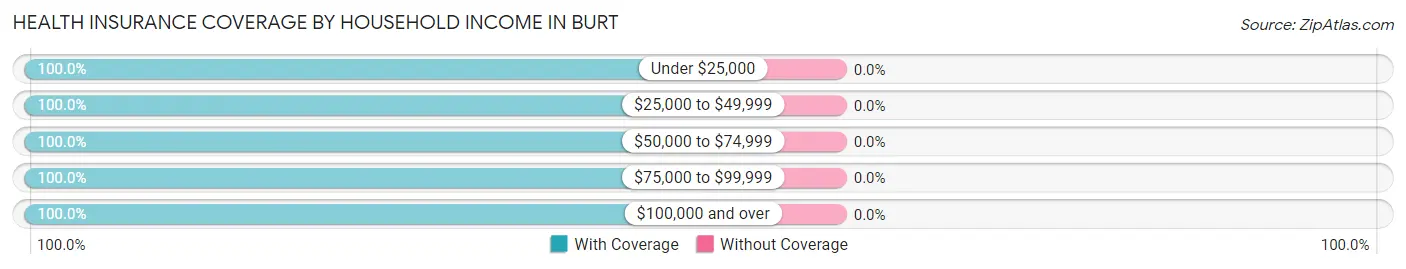
| Household Income | With Coverage | Without Coverage |
| Under $25,000 | 9 (100.0%) | 0 (0.0%) |
| $25,000 to $49,999 | 158 (100.0%) | 0 (0.0%) |
| $50,000 to $74,999 | 263 (100.0%) | 0 (0.0%) |
| $75,000 to $99,999 | 343 (100.0%) | 0 (0.0%) |
| $100,000 and over | 498 (100.0%) | 0 (0.0%) |
Public vs Private Health Insurance Coverage by Age in Burt
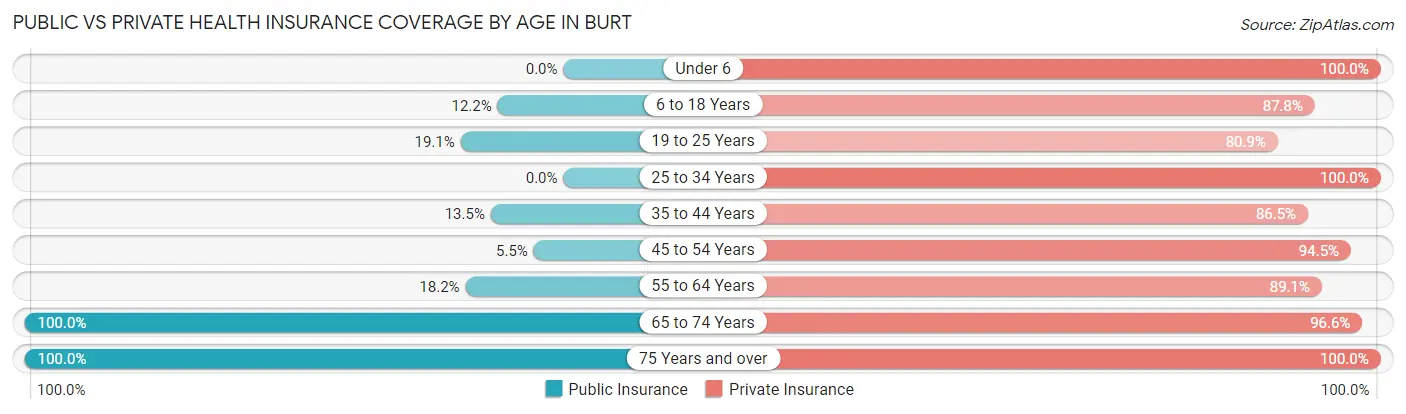
| Age Bracket | Public Insurance | Private Insurance |
| Under 6 | 0 (0.0%) | 84 (100.0%) |
| 6 to 18 Years | 26 (12.2%) | 187 (87.8%) |
| 19 to 25 Years | 21 (19.1%) | 89 (80.9%) |
| 25 to 34 Years | 0 (0.0%) | 128 (100.0%) |
| 35 to 44 Years | 24 (13.5%) | 154 (86.5%) |
| 45 to 54 Years | 13 (5.5%) | 223 (94.5%) |
| 55 to 64 Years | 10 (18.2%) | 49 (89.1%) |
| 65 to 74 Years | 205 (100.0%) | 198 (96.6%) |
| 75 Years and over | 62 (100.0%) | 62 (100.0%) |
| Total | 361 (28.4%) | 1,174 (92.4%) |
Disability Status by Sex by Age in Burt
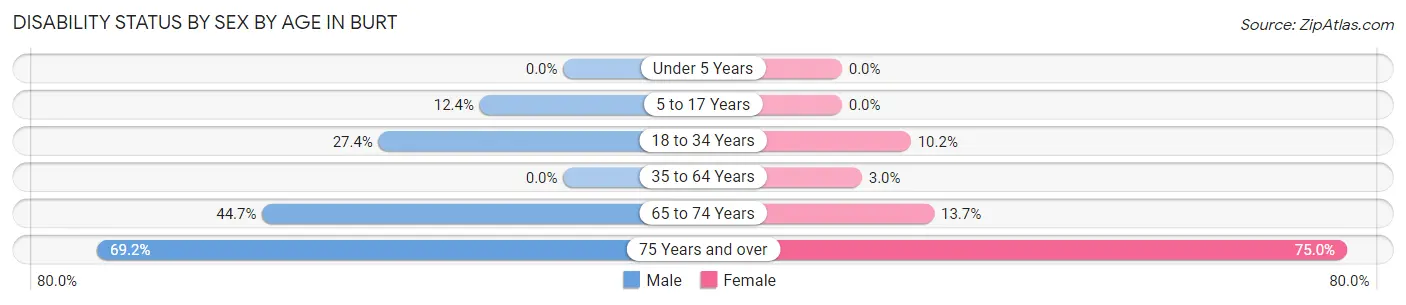
| Age Bracket | Male | Female |
| Under 5 Years | 0 (0.0%) | 0 (0.0%) |
| 5 to 17 Years | 18 (12.4%) | 0 (0.0%) |
| 18 to 34 Years | 34 (27.4%) | 13 (10.2%) |
| 35 to 64 Years | 0 (0.0%) | 7 (3.0%) |
| 65 to 74 Years | 59 (44.7%) | 10 (13.7%) |
| 75 Years and over | 18 (69.2%) | 27 (75.0%) |
Disability Class by Sex by Age in Burt
Disability Class: Hearing Difficulty
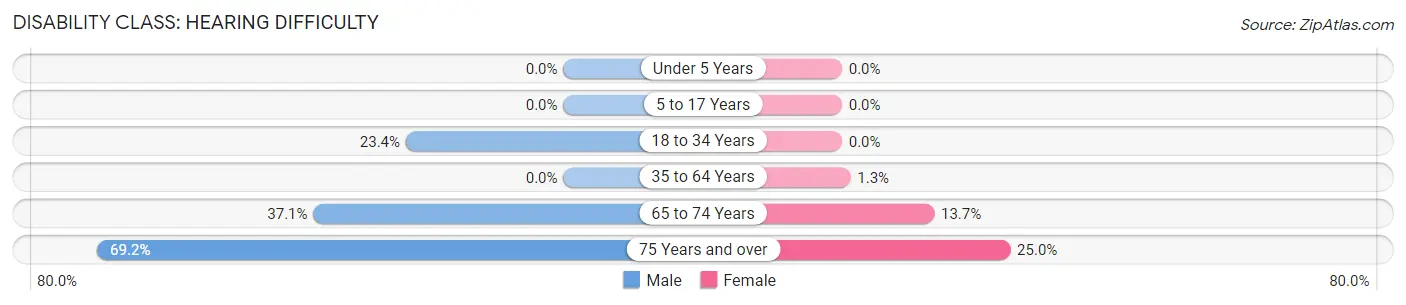
| Age Bracket | Male | Female |
| Under 5 Years | 0 (0.0%) | 0 (0.0%) |
| 5 to 17 Years | 0 (0.0%) | 0 (0.0%) |
| 18 to 34 Years | 29 (23.4%) | 0 (0.0%) |
| 35 to 64 Years | 0 (0.0%) | 3 (1.3%) |
| 65 to 74 Years | 49 (37.1%) | 10 (13.7%) |
| 75 Years and over | 18 (69.2%) | 9 (25.0%) |
Disability Class: Vision Difficulty
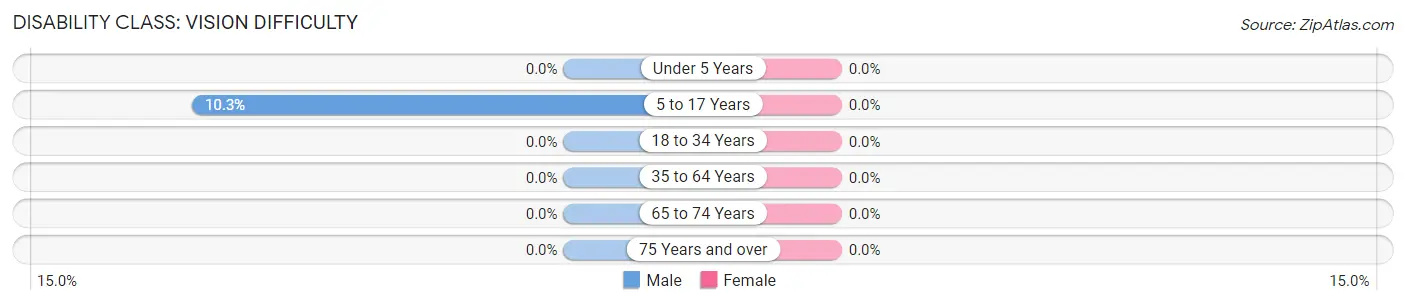
| Age Bracket | Male | Female |
| Under 5 Years | 0 (0.0%) | 0 (0.0%) |
| 5 to 17 Years | 15 (10.3%) | 0 (0.0%) |
| 18 to 34 Years | 0 (0.0%) | 0 (0.0%) |
| 35 to 64 Years | 0 (0.0%) | 0 (0.0%) |
| 65 to 74 Years | 0 (0.0%) | 0 (0.0%) |
| 75 Years and over | 0 (0.0%) | 0 (0.0%) |
Disability Class: Cognitive Difficulty
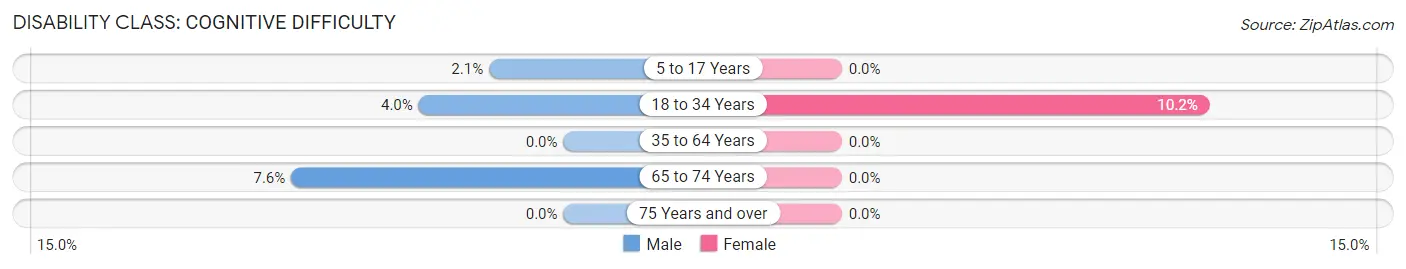
| Age Bracket | Male | Female |
| 5 to 17 Years | 3 (2.1%) | 0 (0.0%) |
| 18 to 34 Years | 5 (4.0%) | 13 (10.2%) |
| 35 to 64 Years | 0 (0.0%) | 0 (0.0%) |
| 65 to 74 Years | 10 (7.6%) | 0 (0.0%) |
| 75 Years and over | 0 (0.0%) | 0 (0.0%) |
Disability Class: Ambulatory Difficulty
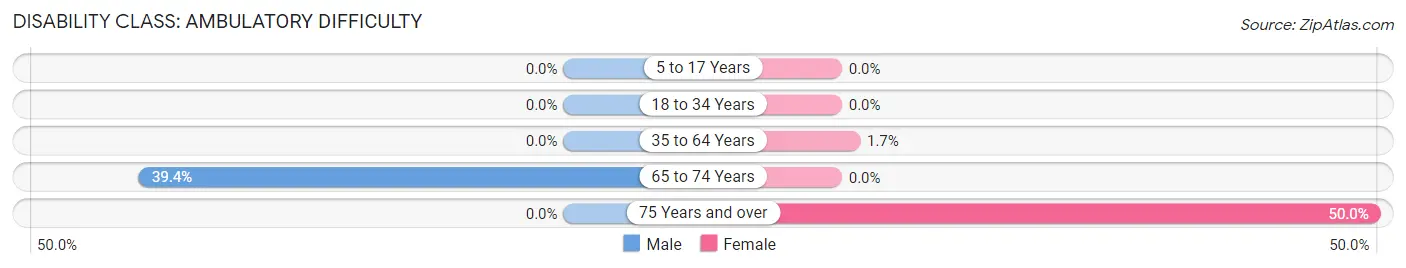
| Age Bracket | Male | Female |
| 5 to 17 Years | 0 (0.0%) | 0 (0.0%) |
| 18 to 34 Years | 0 (0.0%) | 0 (0.0%) |
| 35 to 64 Years | 0 (0.0%) | 4 (1.7%) |
| 65 to 74 Years | 52 (39.4%) | 0 (0.0%) |
| 75 Years and over | 0 (0.0%) | 18 (50.0%) |
Disability Class: Self-Care Difficulty
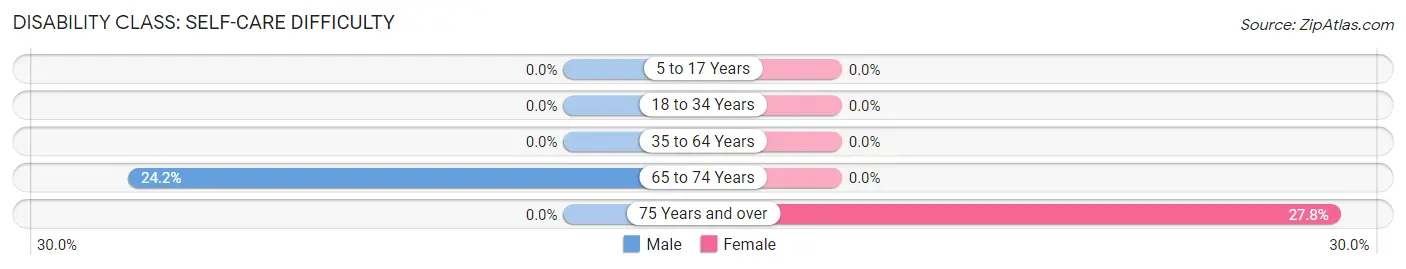
| Age Bracket | Male | Female |
| 5 to 17 Years | 0 (0.0%) | 0 (0.0%) |
| 18 to 34 Years | 0 (0.0%) | 0 (0.0%) |
| 35 to 64 Years | 0 (0.0%) | 0 (0.0%) |
| 65 to 74 Years | 32 (24.2%) | 0 (0.0%) |
| 75 Years and over | 0 (0.0%) | 10 (27.8%) |
Technology Access in Burt
Computing Device Access in Burt
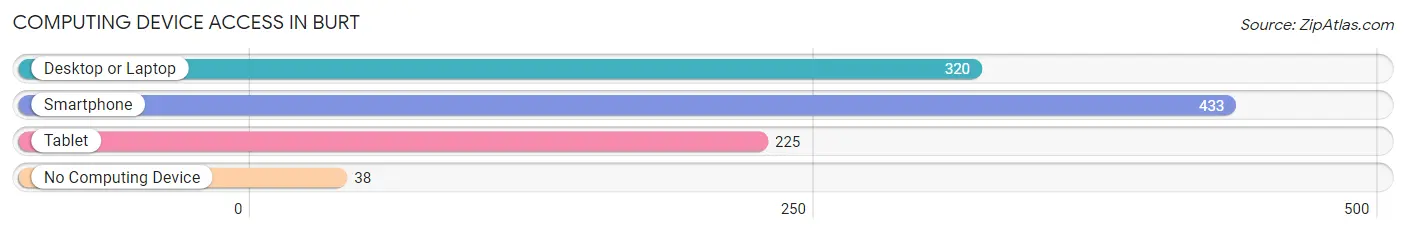
| Device Type | # Households | % Households |
| Desktop or Laptop | 320 | 66.5% |
| Smartphone | 433 | 90.0% |
| Tablet | 225 | 46.8% |
| No Computing Device | 38 | 7.9% |
| Total | 481 | 100.0% |
Internet Access in Burt
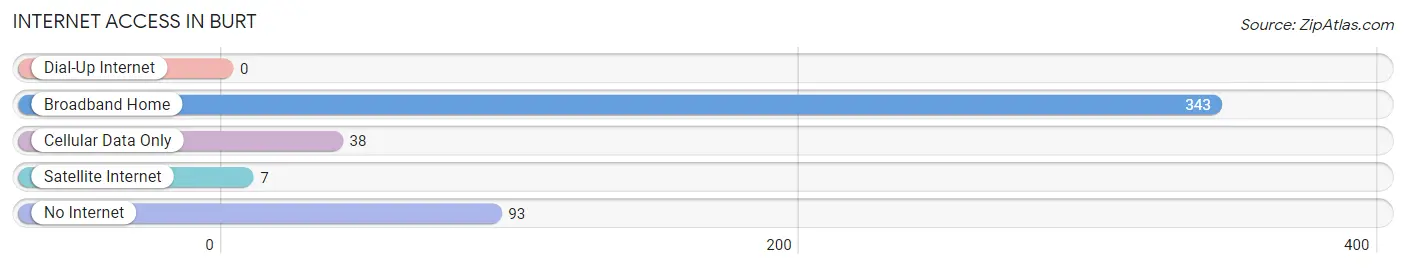
| Internet Type | # Households | % Households |
| Dial-Up Internet | 0 | 0.0% |
| Broadband Home | 343 | 71.3% |
| Cellular Data Only | 38 | 7.9% |
| Satellite Internet | 7 | 1.5% |
| No Internet | 93 | 19.3% |
| Total | 481 | 100.0% |
Burt Summary
Burt, Michigan is a small unincorporated community located in the northern part of Tuscola County in the state of Michigan. It is situated on the banks of the Cass River, approximately 10 miles south of the city of Caro. The population of Burt was estimated to be around 500 people in 2020.
History
The area that is now Burt was first settled in the early 1800s by a group of German immigrants. The settlement was originally known as “Burt’s Corners”, named after the first settler, John Burt. The settlement was later renamed to Burt in 1871.
In the late 1800s, Burt was a thriving agricultural community. The main crops grown in the area were wheat, corn, and oats. The town also had a sawmill, a grist mill, and a blacksmith shop.
In the early 1900s, Burt began to experience a decline in population due to the introduction of mechanized farming. This caused many of the local farmers to move away in search of better opportunities.
In the mid-1900s, Burt experienced a resurgence in population due to the introduction of the automobile industry. The town was home to several auto parts manufacturers, which provided employment for many of the local residents.
Geography
Burt is located in the northern part of Tuscola County in the state of Michigan. It is situated on the banks of the Cass River, approximately 10 miles south of the city of Caro. The town is surrounded by farmland and is located near the intersection of M-53 and M-81.
The climate in Burt is classified as humid continental, with hot summers and cold winters. The average temperature in the summer is around 75 degrees Fahrenheit, while the average temperature in the winter is around 25 degrees Fahrenheit.
Economy
The economy of Burt is largely based on agriculture and manufacturing. The town is home to several auto parts manufacturers, which provide employment for many of the local residents. The town also has a few small businesses, such as a grocery store, a hardware store, and a restaurant.
Demographics
As of 2020, the population of Burt was estimated to be around 500 people. The racial makeup of the town is predominantly white, with a small percentage of African Americans and Native Americans. The median household income in Burt is around $45,000, which is slightly lower than the national average. The median age in Burt is around 40 years old.
Common Questions
What is Per Capita Income in Burt?
Per Capita income in Burt is $32,731.
What is the Median Family Income in Burt?
Median Family Income in Burt is $75,083.
What is the Median Household income in Burt?
Median Household Income in Burt is $82,313.
What is Income or Wage Gap in Burt?
Income or Wage Gap in Burt is 44.6%.
Women in Burt earn 55.4 cents for every dollar earned by a man.
What is Inequality or Gini Index in Burt?
Inequality or Gini Index in Burt is 0.27.
What is the Total Population of Burt?
Total Population of Burt is 1,271.
What is the Total Male Population of Burt?
Total Male Population of Burt is 728.
What is the Total Female Population of Burt?
Total Female Population of Burt is 543.
What is the Ratio of Males per 100 Females in Burt?
There are 134.07 Males per 100 Females in Burt.
What is the Ratio of Females per 100 Males in Burt?
There are 74.59 Females per 100 Males in Burt.
What is the Median Population Age in Burt?
Median Population Age in Burt is 41.7 Years.
What is the Average Family Size in Burt
Average Family Size in Burt is 2.9 People.
What is the Average Household Size in Burt
Average Household Size in Burt is 2.6 People.
How Large is the Labor Force in Burt?
There are 591 People in the Labor Forcein in Burt.
What is the Percentage of People in the Labor Force in Burt?
56.3% of People are in the Labor Force in Burt.
What is the Unemployment Rate in Burt?
Unemployment Rate in Burt is 2.0%.