Brown City, MI Map & Demographics
Brown City Map
Brown City Overview
$29,813
PER CAPITA INCOME
$59,511
AVG FAMILY INCOME
$49,345
AVG HOUSEHOLD INCOME
50.2%
WAGE / INCOME GAP [ % ]
49.8¢/ $1
WAGE / INCOME GAP [ $ ]
0.46
INEQUALITY / GINI INDEX
1,131
TOTAL POPULATION
542
MALE POPULATION
589
FEMALE POPULATION
92.02
MALES / 100 FEMALES
108.67
FEMALES / 100 MALES
46.1
MEDIAN AGE
2.7
AVG FAMILY SIZE
2.2
AVG HOUSEHOLD SIZE
504
LABOR FORCE [ PEOPLE ]
52.8%
PERCENT IN LABOR FORCE
13.3%
UNEMPLOYMENT RATE
Brown City Zip Codes
Brown City Area Codes
Income in Brown City
Income Overview in Brown City
Per Capita Income in Brown City is $29,813, while median incomes of families and households are $59,511 and $49,345 respectively.
| Characteristic | Number | Measure |
| Per Capita Income | 1,131 | $29,813 |
| Median Family Income | 329 | $59,511 |
| Mean Family Income | 329 | $76,053 |
| Median Household Income | 499 | $49,345 |
| Mean Household Income | 499 | $67,908 |
| Income Deficit | 329 | $0 |
| Wage / Income Gap (%) | 1,131 | 50.19% |
| Wage / Income Gap ($) | 1,131 | 49.81¢ per $1 |
| Gini / Inequality Index | 1,131 | 0.46 |
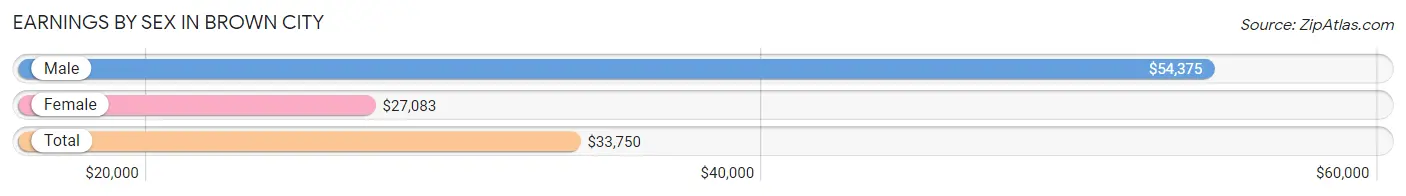
Earnings by Sex in Brown City
Average Earnings in Brown City are $33,750, $54,375 for men and $27,083 for women, a difference of 50.2%.
| Sex | Number | Average Earnings |
| Male | 272 (54.1%) | $54,375 |
| Female | 231 (45.9%) | $27,083 |
| Total | 503 (100.0%) | $33,750 |
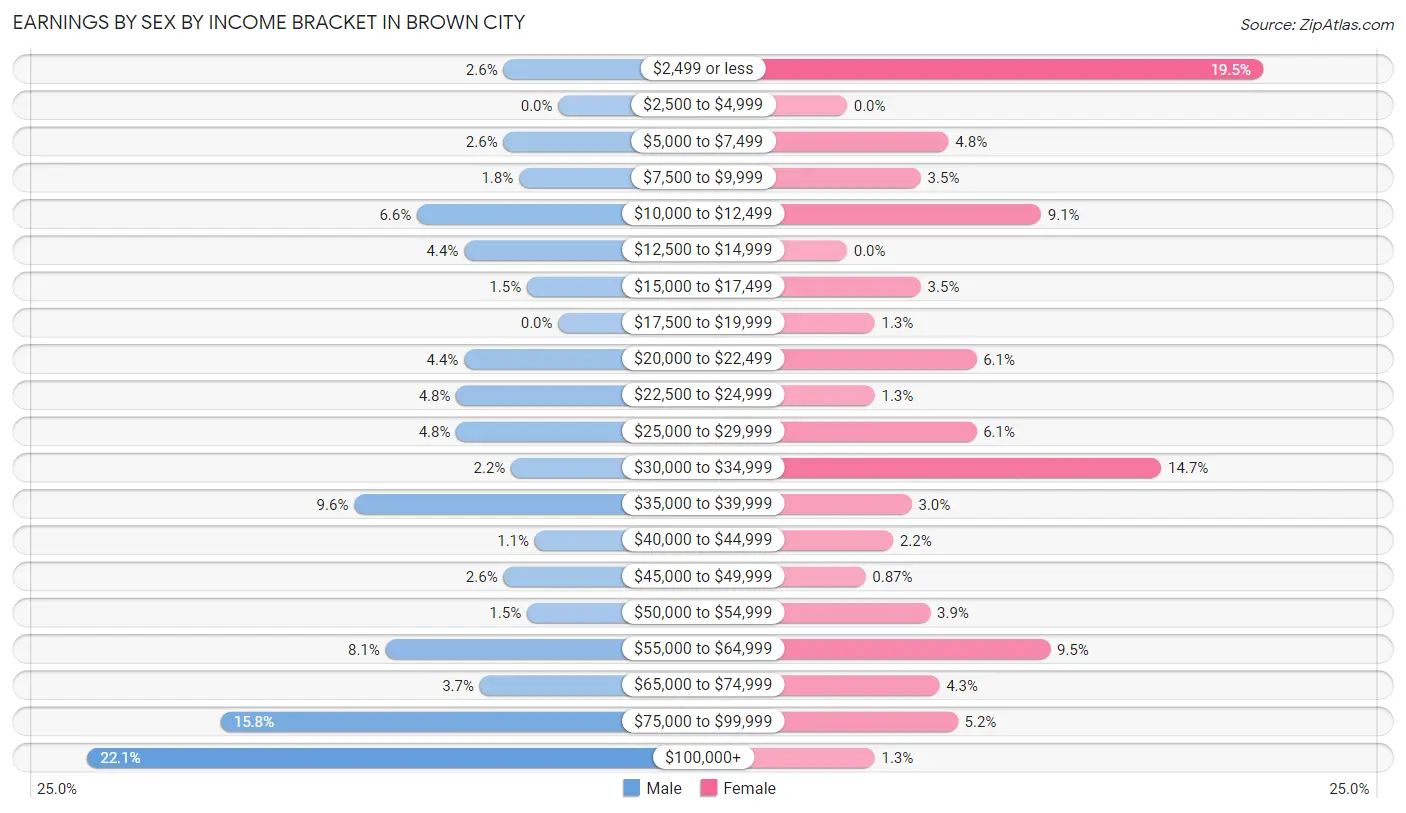
Earnings by Sex by Income Bracket in Brown City
The most common earnings brackets in Brown City are $100,000+ for men (60 | 22.1%) and $2,499 or less for women (45 | 19.5%).
| Income | Male | Female |
| $2,499 or less | 7 (2.6%) | 45 (19.5%) |
| $2,500 to $4,999 | 0 (0.0%) | 0 (0.0%) |
| $5,000 to $7,499 | 7 (2.6%) | 11 (4.8%) |
| $7,500 to $9,999 | 5 (1.8%) | 8 (3.5%) |
| $10,000 to $12,499 | 18 (6.6%) | 21 (9.1%) |
| $12,500 to $14,999 | 12 (4.4%) | 0 (0.0%) |
| $15,000 to $17,499 | 4 (1.5%) | 8 (3.5%) |
| $17,500 to $19,999 | 0 (0.0%) | 3 (1.3%) |
| $20,000 to $22,499 | 12 (4.4%) | 14 (6.1%) |
| $22,500 to $24,999 | 13 (4.8%) | 3 (1.3%) |
| $25,000 to $29,999 | 13 (4.8%) | 14 (6.1%) |
| $30,000 to $34,999 | 6 (2.2%) | 34 (14.7%) |
| $35,000 to $39,999 | 26 (9.6%) | 7 (3.0%) |
| $40,000 to $44,999 | 3 (1.1%) | 5 (2.2%) |
| $45,000 to $49,999 | 7 (2.6%) | 2 (0.9%) |
| $50,000 to $54,999 | 4 (1.5%) | 9 (3.9%) |
| $55,000 to $64,999 | 22 (8.1%) | 22 (9.5%) |
| $65,000 to $74,999 | 10 (3.7%) | 10 (4.3%) |
| $75,000 to $99,999 | 43 (15.8%) | 12 (5.2%) |
| $100,000+ | 60 (22.1%) | 3 (1.3%) |
| Total | 272 (100.0%) | 231 (100.0%) |
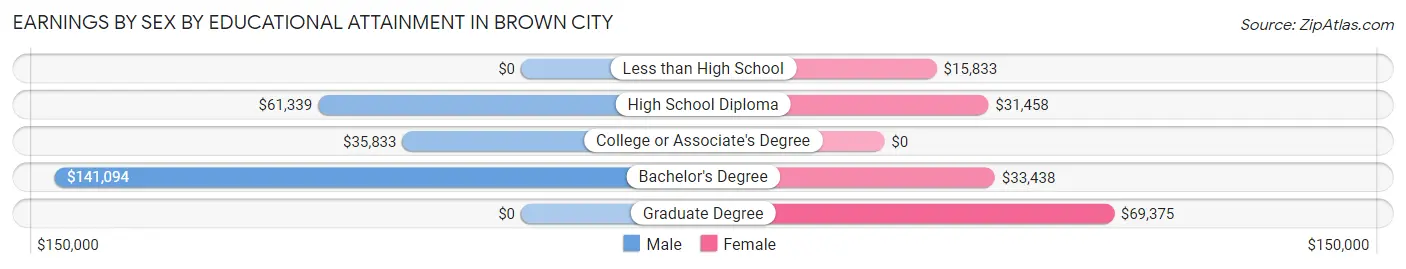
Earnings by Sex by Educational Attainment in Brown City
Average earnings in Brown City are $61,518 for men and $31,510 for women, a difference of 48.8%. Men with an educational attainment of bachelor's degree enjoy the highest average annual earnings of $141,094, while those with college or associate's degree education earn the least with $35,833. Women with an educational attainment of graduate degree earn the most with the average annual earnings of $69,375, while those with less than high school education have the smallest earnings of $15,833.
| Educational Attainment | Male Income | Female Income |
| Less than High School | - | - |
| High School Diploma | $61,339 | $31,458 |
| College or Associate's Degree | $35,833 | $0 |
| Bachelor's Degree | $141,094 | $33,438 |
| Graduate Degree | - | - |
| Total | $61,518 | $31,510 |
Family Income in Brown City
Family Income Brackets in Brown City
According to the Brown City family income data, there are 69 families falling into the $100,000 to $149,999 income range, which is the most common income bracket and makes up 21.0% of all families.
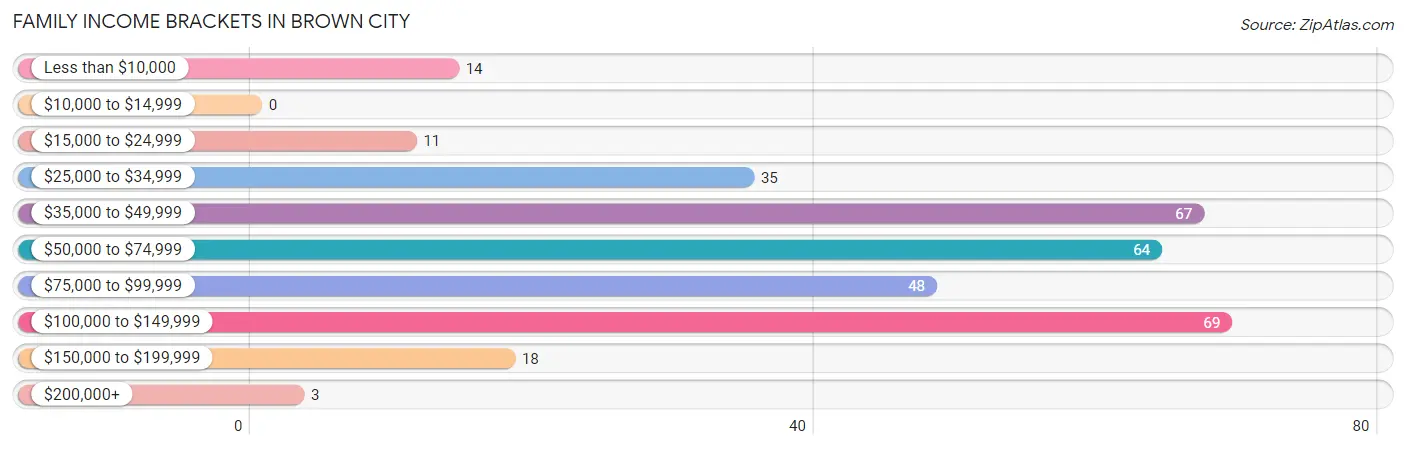
| Income Bracket | # Families | % Families |
| Less than $10,000 | 14 | 4.3% |
| $10,000 to $14,999 | 0 | 0.0% |
| $15,000 to $24,999 | 11 | 3.3% |
| $25,000 to $34,999 | 35 | 10.6% |
| $35,000 to $49,999 | 67 | 20.4% |
| $50,000 to $74,999 | 64 | 19.5% |
| $75,000 to $99,999 | 48 | 14.6% |
| $100,000 to $149,999 | 69 | 21.0% |
| $150,000 to $199,999 | 18 | 5.5% |
| $200,000+ | 3 | 0.9% |
Family Income by Famaliy Size in Brown City
5-person families (22 | 6.7%) account for the highest median family income in Brown City with $143,750 per family, while 5-person families (22 | 6.7%) have the highest median income of $28,750 per family member.
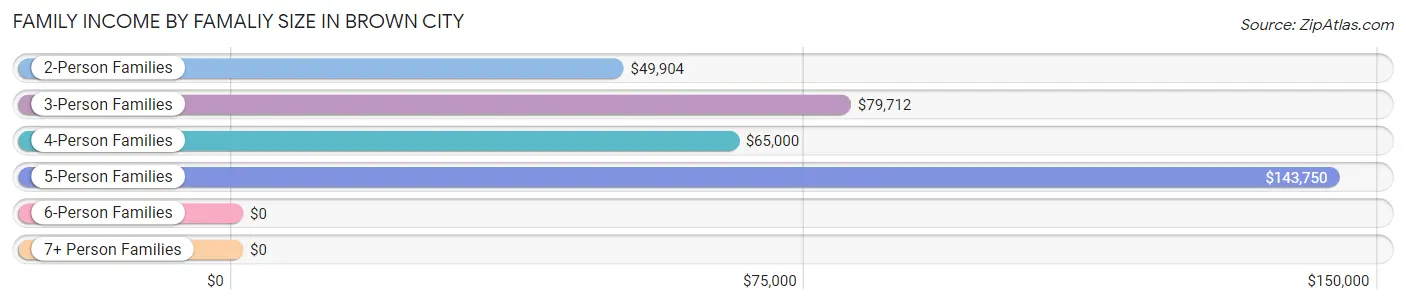
| Income Bracket | # Families | Median Income |
| 2-Person Families | 145 (44.1%) | $49,904 |
| 3-Person Families | 125 (38.0%) | $79,712 |
| 4-Person Families | 34 (10.3%) | $65,000 |
| 5-Person Families | 22 (6.7%) | $143,750 |
| 6-Person Families | 3 (0.9%) | $0 |
| 7+ Person Families | 0 (0.0%) | $0 |
| Total | 329 (100.0%) | $59,511 |
Family Income by Number of Earners in Brown City
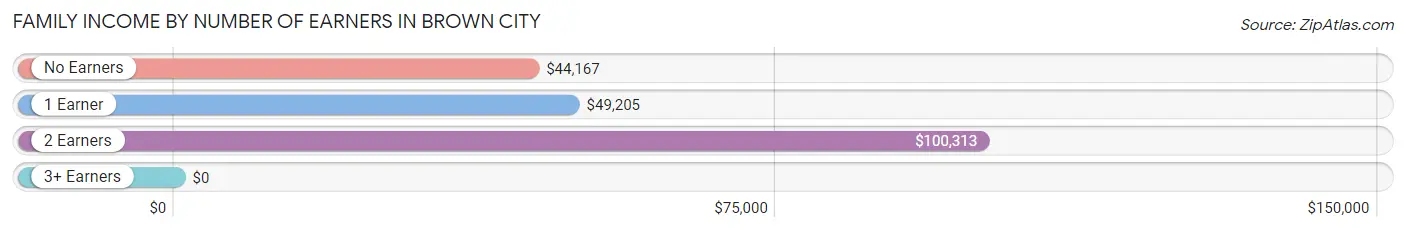
| Number of Earners | # Families | Median Income |
| No Earners | 58 (17.6%) | $44,167 |
| 1 Earner | 109 (33.1%) | $49,205 |
| 2 Earners | 155 (47.1%) | $100,313 |
| 3+ Earners | 7 (2.1%) | $0 |
| Total | 329 (100.0%) | $59,511 |
Household Income in Brown City
Household Income Brackets in Brown City
With 90 households falling in the category, the $50,000 to $74,999 income range is the most frequent in Brown City, accounting for 18.0% of all households. In contrast, only 5 households (1.0%) fall into the $200,000+ income bracket, making it the least populous group.
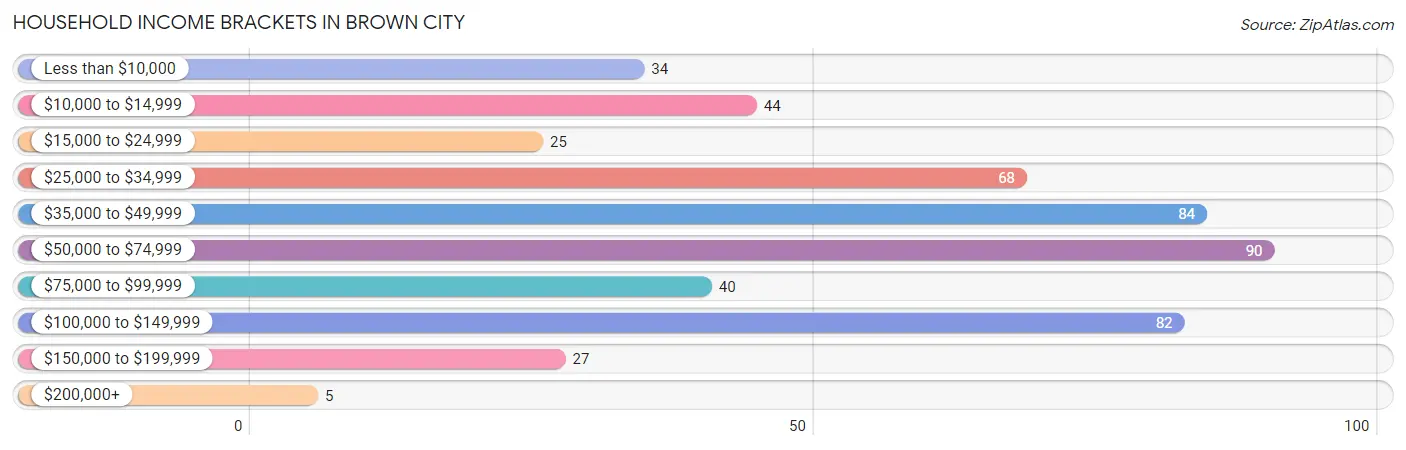
| Income Bracket | # Households | % Households |
| Less than $10,000 | 34 | 6.8% |
| $10,000 to $14,999 | 44 | 8.8% |
| $15,000 to $24,999 | 25 | 5.0% |
| $25,000 to $34,999 | 68 | 13.6% |
| $35,000 to $49,999 | 84 | 16.8% |
| $50,000 to $74,999 | 90 | 18.0% |
| $75,000 to $99,999 | 40 | 8.0% |
| $100,000 to $149,999 | 82 | 16.4% |
| $150,000 to $199,999 | 27 | 5.4% |
| $200,000+ | 5 | 1.0% |
Household Income by Householder Age in Brown City
The median household income in Brown City is $49,345, with the highest median household income of $59,250 found in the 25 to 44 years age bracket for the primary householder. A total of 111 households (22.2%) fall into this category. Meanwhile, the 65+ years age bracket for the primary householder has the lowest median household income of $31,786, with 156 households (31.3%) in this group.
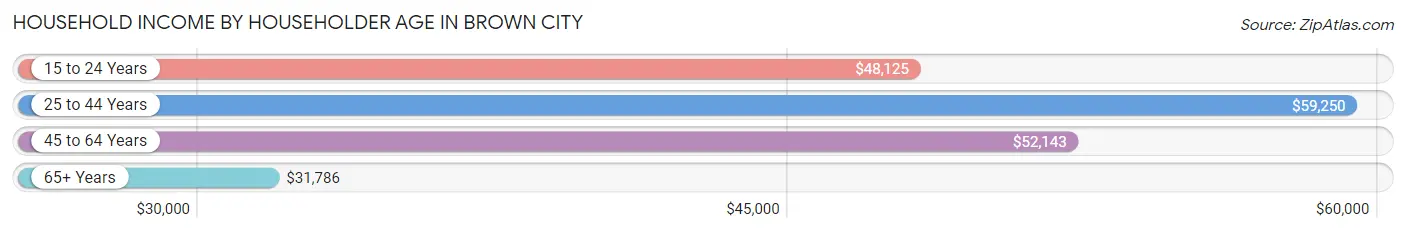
| Income Bracket | # Households | Median Income |
| 15 to 24 Years | 14 (2.8%) | $48,125 |
| 25 to 44 Years | 111 (22.2%) | $59,250 |
| 45 to 64 Years | 218 (43.7%) | $52,143 |
| 65+ Years | 156 (31.3%) | $31,786 |
| Total | 499 (100.0%) | $49,345 |
Poverty in Brown City
Income Below Poverty by Sex and Age in Brown City
With 16.8% poverty level for males and 20.8% for females among the residents of Brown City, 35 to 44 year old males and 75 year old and over females are the most vulnerable to poverty, with 43 males (43.4%) and 34 females (65.4%) in their respective age groups living below the poverty level.
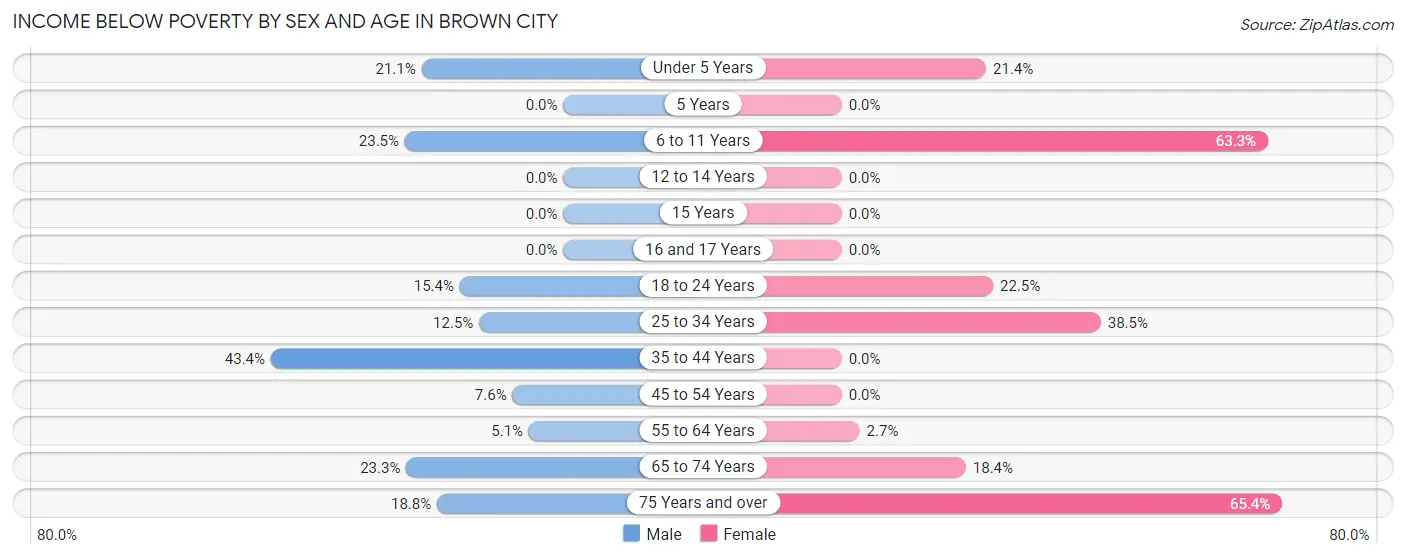
| Age Bracket | Male | Female |
| Under 5 Years | 4 (21.0%) | 3 (21.4%) |
| 5 Years | 0 (0.0%) | 0 (0.0%) |
| 6 to 11 Years | 4 (23.5%) | 31 (63.3%) |
| 12 to 14 Years | 0 (0.0%) | 0 (0.0%) |
| 15 Years | 0 (0.0%) | 0 (0.0%) |
| 16 and 17 Years | 0 (0.0%) | 0 (0.0%) |
| 18 to 24 Years | 4 (15.4%) | 20 (22.5%) |
| 25 to 34 Years | 5 (12.5%) | 15 (38.5%) |
| 35 to 44 Years | 43 (43.4%) | 0 (0.0%) |
| 45 to 54 Years | 4 (7.5%) | 0 (0.0%) |
| 55 to 64 Years | 7 (5.1%) | 3 (2.6%) |
| 65 to 74 Years | 14 (23.3%) | 14 (18.4%) |
| 75 Years and over | 6 (18.8%) | 34 (65.4%) |
| Total | 91 (16.8%) | 120 (20.8%) |
Income Above Poverty by Sex and Age in Brown City
According to the poverty statistics in Brown City, males aged 5 years and females aged 12 to 14 years are the age groups that are most secure financially, with 100.0% of males and 100.0% of females in these age groups living above the poverty line.
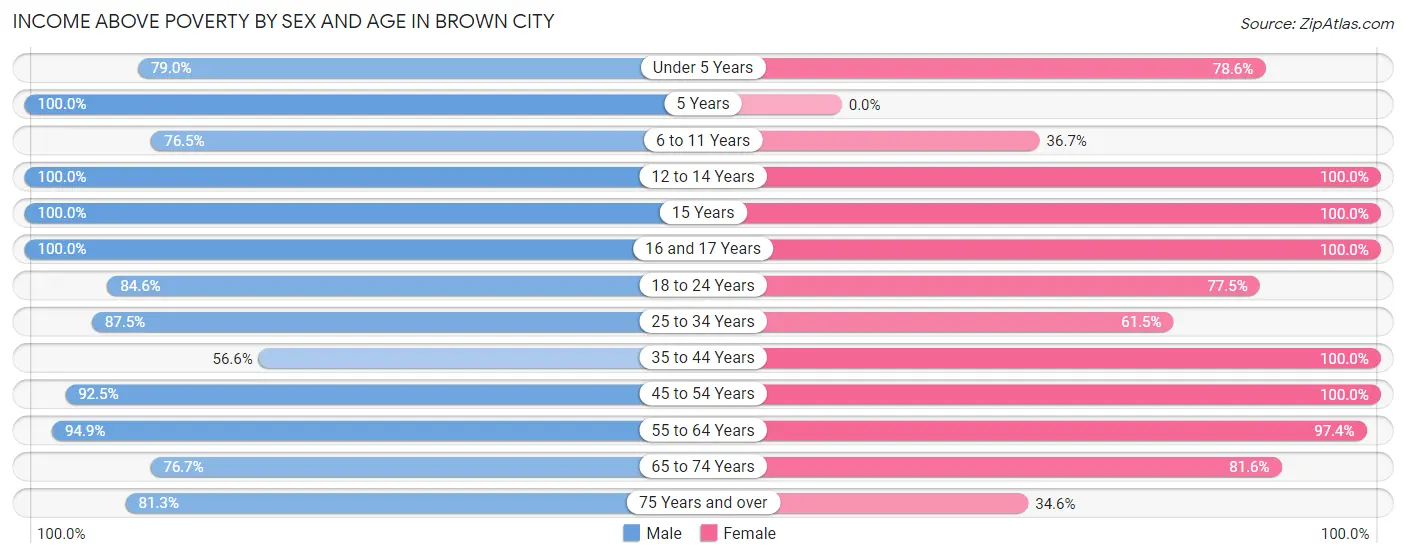
| Age Bracket | Male | Female |
| Under 5 Years | 15 (78.9%) | 11 (78.6%) |
| 5 Years | 6 (100.0%) | 0 (0.0%) |
| 6 to 11 Years | 13 (76.5%) | 18 (36.7%) |
| 12 to 14 Years | 23 (100.0%) | 14 (100.0%) |
| 15 Years | 17 (100.0%) | 7 (100.0%) |
| 16 and 17 Years | 13 (100.0%) | 11 (100.0%) |
| 18 to 24 Years | 22 (84.6%) | 69 (77.5%) |
| 25 to 34 Years | 35 (87.5%) | 24 (61.5%) |
| 35 to 44 Years | 56 (56.6%) | 64 (100.0%) |
| 45 to 54 Years | 49 (92.4%) | 50 (100.0%) |
| 55 to 64 Years | 130 (94.9%) | 110 (97.4%) |
| 65 to 74 Years | 46 (76.7%) | 62 (81.6%) |
| 75 Years and over | 26 (81.2%) | 18 (34.6%) |
| Total | 451 (83.2%) | 458 (79.2%) |
Income Below Poverty Among Married-Couple Families in Brown City
The poverty statistics for married-couple families in Brown City show that 0.8% or 2 of the total 242 families live below the poverty line. Families with no children have the highest poverty rate of 1.1%, comprising of 2 families. On the other hand, families with 1 or 2 children have the lowest poverty rate of 0.0%, which includes 0 families.
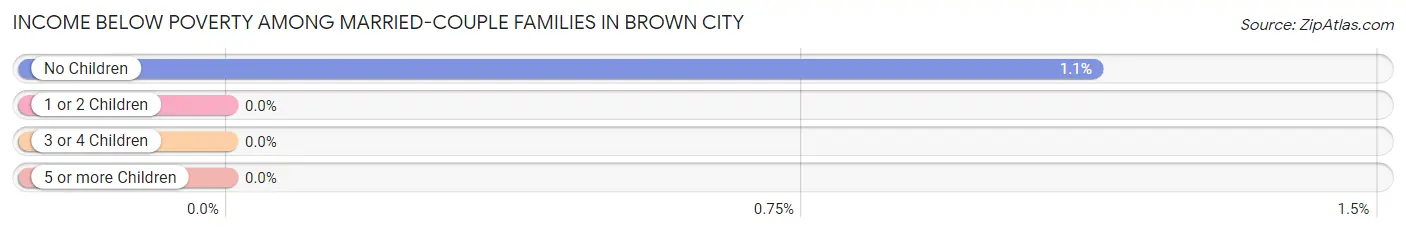
| Children | Above Poverty | Below Poverty |
| No Children | 175 (98.9%) | 2 (1.1%) |
| 1 or 2 Children | 57 (100.0%) | 0 (0.0%) |
| 3 or 4 Children | 8 (100.0%) | 0 (0.0%) |
| 5 or more Children | 0 (0.0%) | 0 (0.0%) |
| Total | 240 (99.2%) | 2 (0.8%) |
Income Below Poverty Among Single-Parent Households in Brown City
According to the poverty data in Brown City, 52.3% or 23 single-father households and 16.3% or 7 single-mother households are living below the poverty line. Among single-father households, those with 1 or 2 children have the highest poverty rate, with 23 households (71.9%) experiencing poverty. Likewise, among single-mother households, those with 1 or 2 children have the highest poverty rate, with 7 households (29.2%) falling below the poverty line.
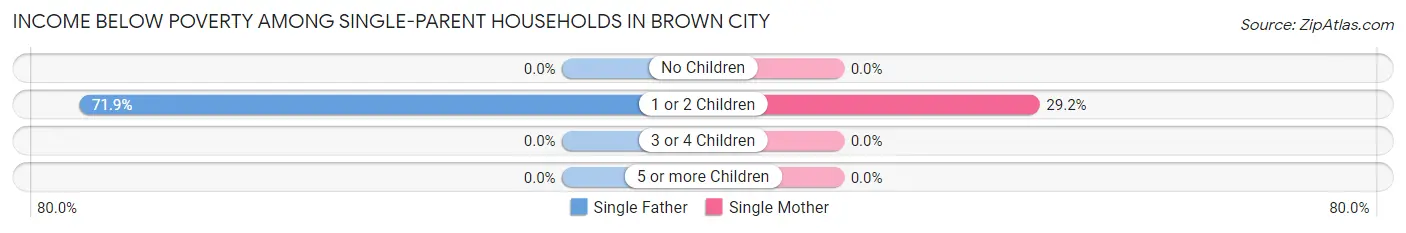
| Children | Single Father | Single Mother |
| No Children | 0 (0.0%) | 0 (0.0%) |
| 1 or 2 Children | 23 (71.9%) | 7 (29.2%) |
| 3 or 4 Children | 0 (0.0%) | 0 (0.0%) |
| 5 or more Children | 0 (0.0%) | 0 (0.0%) |
| Total | 23 (52.3%) | 7 (16.3%) |
Income Below Poverty Among Married-Couple vs Single-Parent Households in Brown City
The poverty data for Brown City shows that 2 of the married-couple family households (0.8%) and 30 of the single-parent households (34.5%) are living below the poverty level. Within the married-couple family households, those with no children have the highest poverty rate, with 2 households (1.1%) falling below the poverty line. Among the single-parent households, those with 1 or 2 children have the highest poverty rate, with 30 household (53.6%) living below poverty.
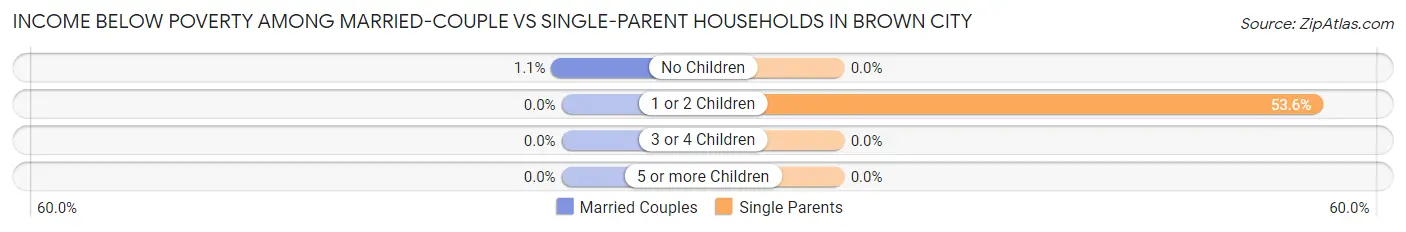
| Children | Married-Couple Families | Single-Parent Households |
| No Children | 2 (1.1%) | 0 (0.0%) |
| 1 or 2 Children | 0 (0.0%) | 30 (53.6%) |
| 3 or 4 Children | 0 (0.0%) | 0 (0.0%) |
| 5 or more Children | 0 (0.0%) | 0 (0.0%) |
| Total | 2 (0.8%) | 30 (34.5%) |
Race in Brown City
The most populous races in Brown City are White / Caucasian (1,032 | 91.2%), Hispanic or Latino (61 | 5.4%), and Two or more Races (61 | 5.4%).
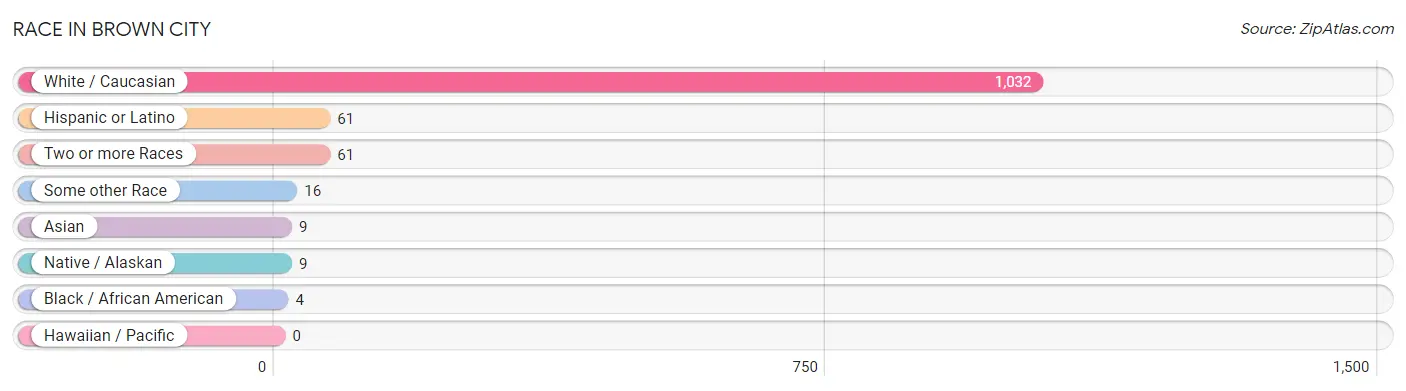
| Race | # Population | % Population |
| Asian | 9 | 0.8% |
| Black / African American | 4 | 0.4% |
| Hawaiian / Pacific | 0 | 0.0% |
| Hispanic or Latino | 61 | 5.4% |
| Native / Alaskan | 9 | 0.8% |
| White / Caucasian | 1,032 | 91.2% |
| Two or more Races | 61 | 5.4% |
| Some other Race | 16 | 1.4% |
| Total | 1,131 | 100.0% |
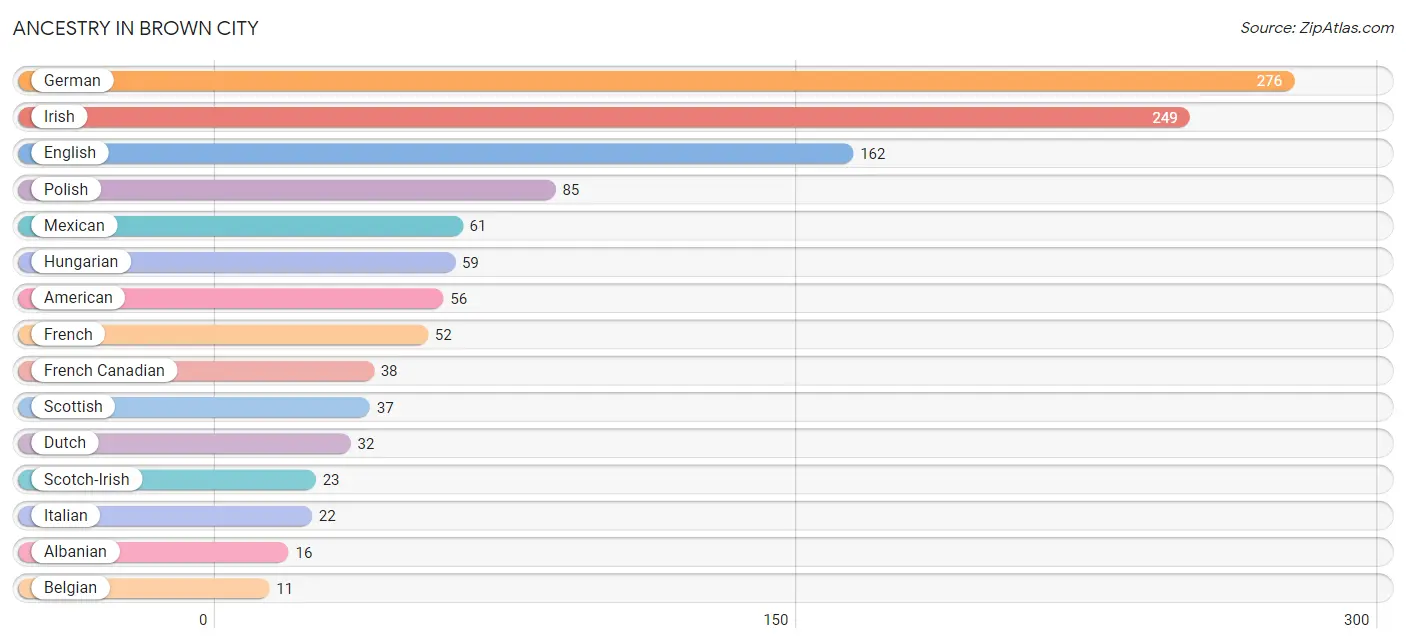
Ancestry in Brown City
The most populous ancestries reported in Brown City are German (276 | 24.4%), Irish (249 | 22.0%), English (162 | 14.3%), Polish (85 | 7.5%), and Mexican (61 | 5.4%), together accounting for 73.6% of all Brown City residents.
| Ancestry | # Population | % Population |
| Albanian | 16 | 1.4% |
| American | 56 | 5.0% |
| Apache | 3 | 0.3% |
| Belgian | 11 | 1.0% |
| Blackfeet | 5 | 0.4% |
| Bulgarian | 4 | 0.4% |
| Cherokee | 5 | 0.4% |
| Choctaw | 2 | 0.2% |
| Czech | 3 | 0.3% |
| Dutch | 32 | 2.8% |
| English | 162 | 14.3% |
| European | 3 | 0.3% |
| French | 52 | 4.6% |
| French Canadian | 38 | 3.4% |
| German | 276 | 24.4% |
| Hungarian | 59 | 5.2% |
| Irish | 249 | 22.0% |
| Italian | 22 | 1.9% |
| Jamaican | 8 | 0.7% |
| Korean | 7 | 0.6% |
| Lithuanian | 3 | 0.3% |
| Mexican | 61 | 5.4% |
| Norwegian | 3 | 0.3% |
| Ottawa | 2 | 0.2% |
| Polish | 85 | 7.5% |
| Russian | 6 | 0.5% |
| Scandinavian | 5 | 0.4% |
| Scotch-Irish | 23 | 2.0% |
| Scottish | 37 | 3.3% |
| Sri Lankan | 2 | 0.2% |
| Welsh | 5 | 0.4% | View All 31 Rows |
Immigrants in Brown City
The most numerous immigrant groups reported in Brown City came from , and Canada (8 | 0.7%), together accounting for 0.7% of all Brown City residents.

| Immigration Origin | # Population | % Population |
| Canada | 8 | 0.7% | View All 1 Rows |
Sex and Age in Brown City
Sex and Age in Brown City
The most populous age groups in Brown City are 60 to 64 Years (83 | 15.3%) for men and 55 to 59 Years (68 | 11.5%) for women.
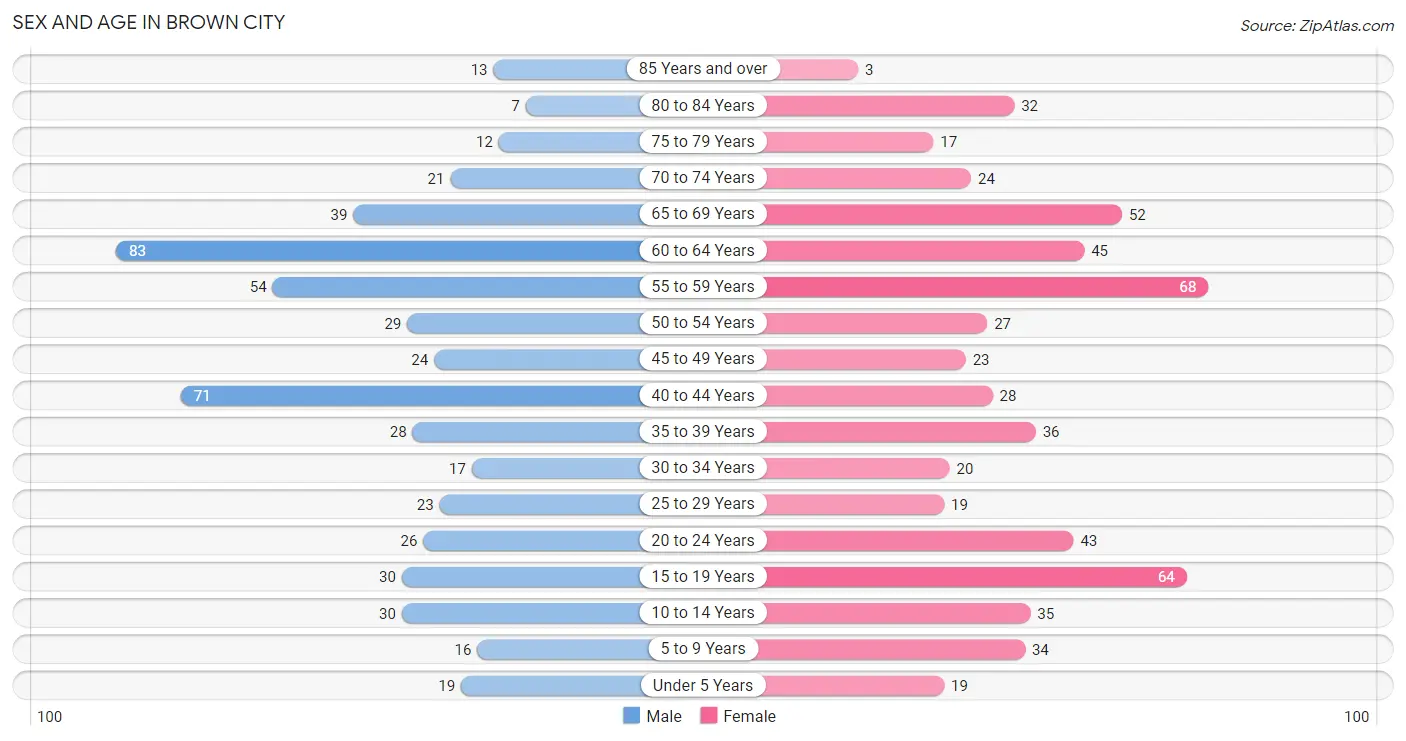
| Age Bracket | Male | Female |
| Under 5 Years | 19 (3.5%) | 19 (3.2%) |
| 5 to 9 Years | 16 (2.9%) | 34 (5.8%) |
| 10 to 14 Years | 30 (5.5%) | 35 (5.9%) |
| 15 to 19 Years | 30 (5.5%) | 64 (10.9%) |
| 20 to 24 Years | 26 (4.8%) | 43 (7.3%) |
| 25 to 29 Years | 23 (4.2%) | 19 (3.2%) |
| 30 to 34 Years | 17 (3.1%) | 20 (3.4%) |
| 35 to 39 Years | 28 (5.2%) | 36 (6.1%) |
| 40 to 44 Years | 71 (13.1%) | 28 (4.8%) |
| 45 to 49 Years | 24 (4.4%) | 23 (3.9%) |
| 50 to 54 Years | 29 (5.3%) | 27 (4.6%) |
| 55 to 59 Years | 54 (10.0%) | 68 (11.5%) |
| 60 to 64 Years | 83 (15.3%) | 45 (7.6%) |
| 65 to 69 Years | 39 (7.2%) | 52 (8.8%) |
| 70 to 74 Years | 21 (3.9%) | 24 (4.1%) |
| 75 to 79 Years | 12 (2.2%) | 17 (2.9%) |
| 80 to 84 Years | 7 (1.3%) | 32 (5.4%) |
| 85 Years and over | 13 (2.4%) | 3 (0.5%) |
| Total | 542 (100.0%) | 589 (100.0%) |
Families and Households in Brown City
Median Family Size in Brown City
The median family size in Brown City is 2.68 persons per family, with single male/father families (44 | 13.4%) accounting for the largest median family size of 2.91 persons per family. On the other hand, single female/mother families (43 | 13.1%) represent the smallest median family size with 2.47 persons per family.
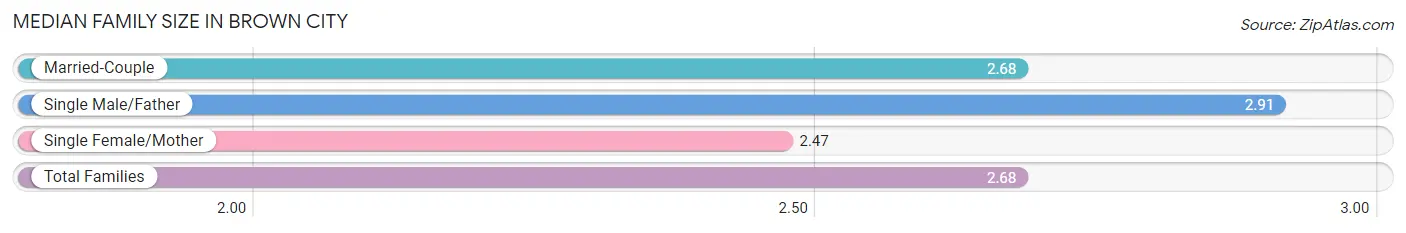
| Family Type | # Families | Family Size |
| Married-Couple | 242 (73.6%) | 2.68 |
| Single Male/Father | 44 (13.4%) | 2.91 |
| Single Female/Mother | 43 (13.1%) | 2.47 |
| Total Families | 329 (100.0%) | 2.68 |
Median Household Size in Brown City
The median household size in Brown City is 2.24 persons per household, with single male/father households (44 | 8.8%) accounting for the largest median household size of 3.3 persons per household. non-family households (170 | 34.1%) represent the smallest median household size with 1.15 persons per household.
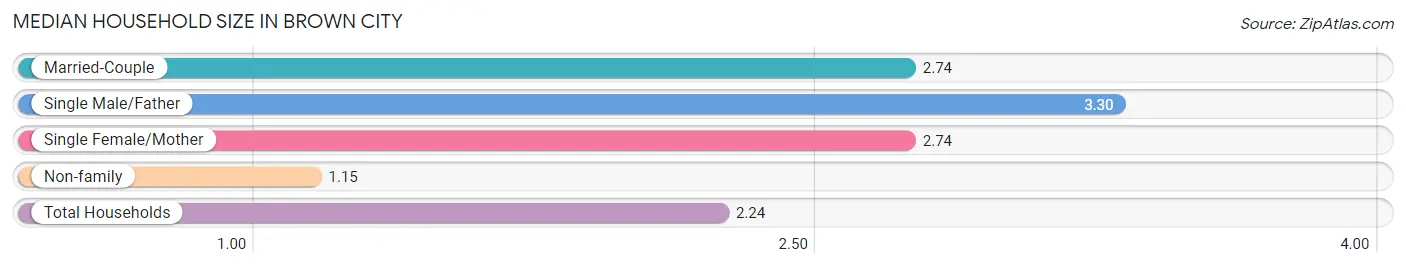
| Household Type | # Households | Household Size |
| Married-Couple | 242 (48.5%) | 2.74 |
| Single Male/Father | 44 (8.8%) | 3.30 |
| Single Female/Mother | 43 (8.6%) | 2.74 |
| Non-family | 170 (34.1%) | 1.15 |
| Total Households | 499 (100.0%) | 2.24 |
Household Size by Marriage Status in Brown City
Out of a total of 499 households in Brown City, 329 (65.9%) are family households, while 170 (34.1%) are nonfamily households. The most numerous type of family households are 2-person households, comprising 139, and the most common type of nonfamily households are 1-person households, comprising 147.
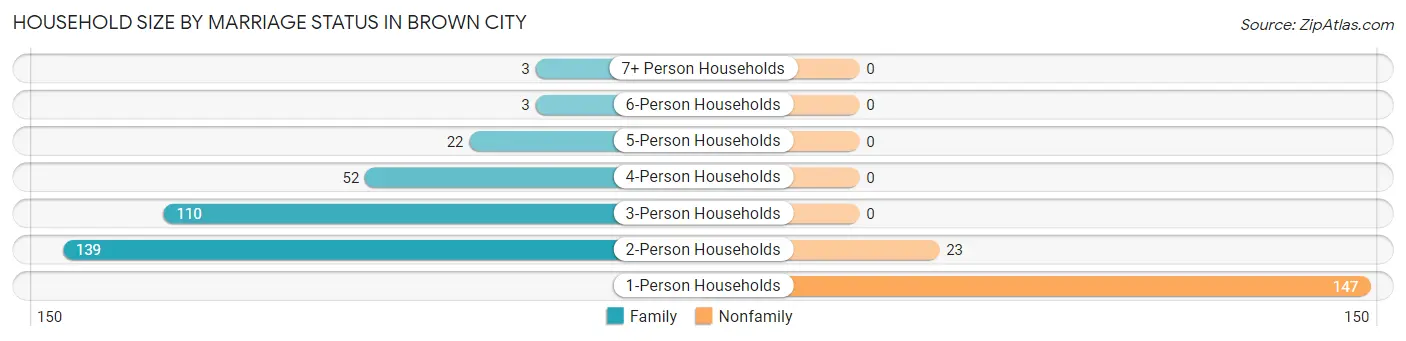
| Household Size | Family Households | Nonfamily Households |
| 1-Person Households | - | 147 (29.5%) |
| 2-Person Households | 139 (27.9%) | 23 (4.6%) |
| 3-Person Households | 110 (22.0%) | 0 (0.0%) |
| 4-Person Households | 52 (10.4%) | 0 (0.0%) |
| 5-Person Households | 22 (4.4%) | 0 (0.0%) |
| 6-Person Households | 3 (0.6%) | 0 (0.0%) |
| 7+ Person Households | 3 (0.6%) | 0 (0.0%) |
| Total | 329 (65.9%) | 170 (34.1%) |
Female Fertility in Brown City
Fertility by Age in Brown City
Average fertility rate in Brown City is 55.0 births per 1,000 women. Women in the age bracket of 20 to 34 years have the highest fertility rate with 122.0 births per 1,000 women. Women in the age bracket of 20 to 34 years acount for 76.9% of all women with births.
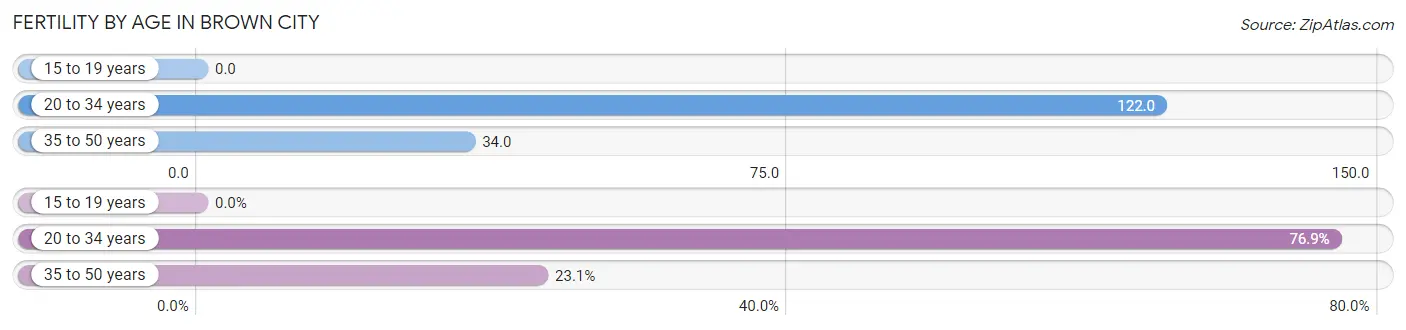
| Age Bracket | Women with Births | Births / 1,000 Women |
| 15 to 19 years | 0 (0.0%) | 0.0 |
| 20 to 34 years | 10 (76.9%) | 122.0 |
| 35 to 50 years | 3 (23.1%) | 34.0 |
| Total | 13 (100.0%) | 55.0 |
Fertility by Age by Marriage Status in Brown City
46.2% of women with births (13) in Brown City are married. The highest percentage of unmarried women with births falls into 20 to 34 years age bracket with 70.0% of them unmarried at the time of birth, while the lowest percentage of unmarried women with births belong to 35 to 50 years age bracket with 0.0% of them unmarried.
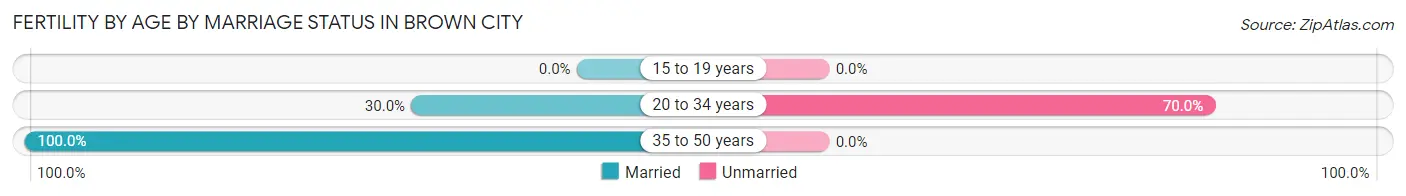
| Age Bracket | Married | Unmarried |
| 15 to 19 years | 0 (0.0%) | 0 (0.0%) |
| 20 to 34 years | 3 (30.0%) | 7 (70.0%) |
| 35 to 50 years | 3 (100.0%) | 0 (0.0%) |
| Total | 6 (46.2%) | 7 (53.8%) |
Fertility by Education in Brown City
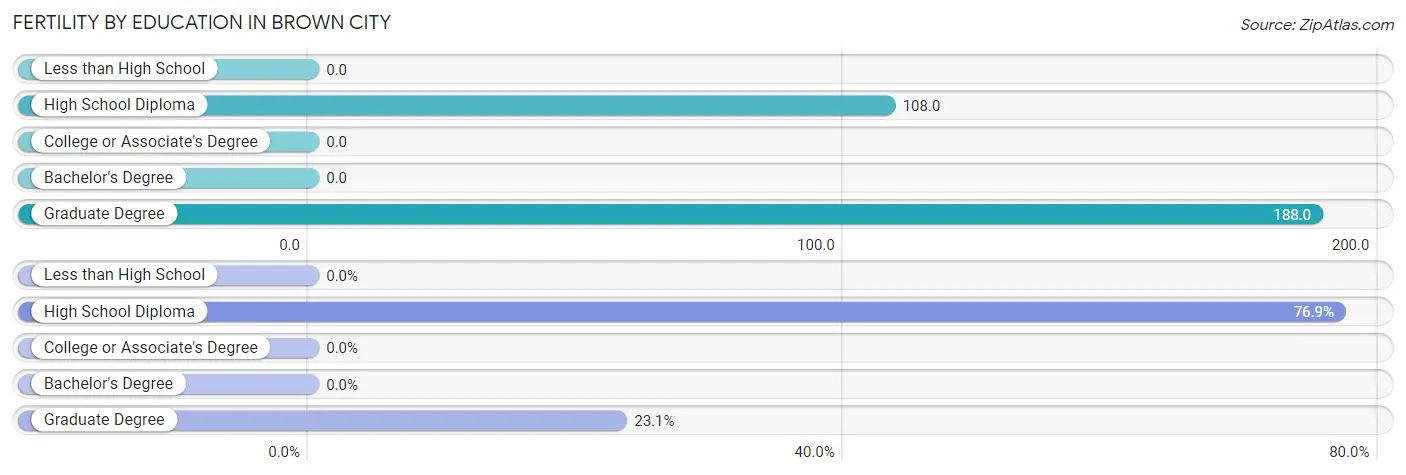
| Educational Attainment | Women with Births | Births / 1,000 Women |
| Less than High School | 0 (0.0%) | 0.0 |
| High School Diploma | 10 (76.9%) | 108.0 |
| College or Associate's Degree | 0 (0.0%) | 0.0 |
| Bachelor's Degree | 0 (0.0%) | 0.0 |
| Graduate Degree | 3 (23.1%) | 188.0 |
| Total | 13 (100.0%) | 55.0 |
Fertility by Education by Marriage Status in Brown City
53.8% of women with births in Brown City are unmarried. Women with the educational attainment of graduate degree are most likely to be married with 100.0% of them married at childbirth, while women with the educational attainment of high school diploma are least likely to be married with 70.0% of them unmarried at childbirth.
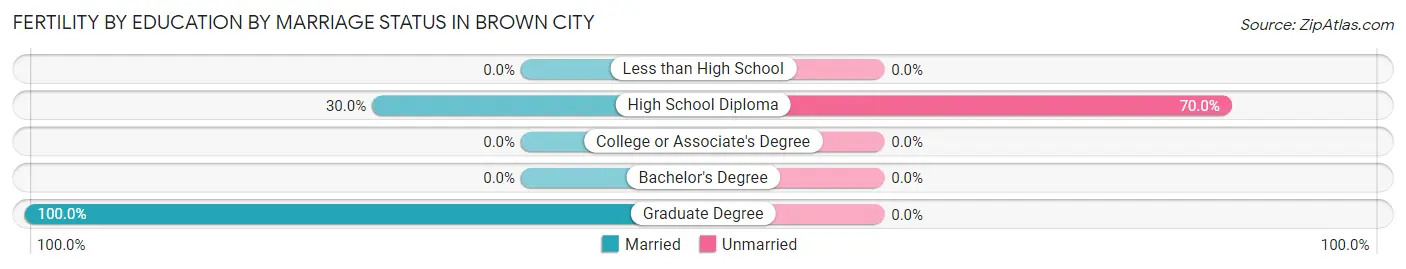
| Educational Attainment | Married | Unmarried |
| Less than High School | 0 (0.0%) | 0 (0.0%) |
| High School Diploma | 3 (30.0%) | 7 (70.0%) |
| College or Associate's Degree | 0 (0.0%) | 0 (0.0%) |
| Bachelor's Degree | 0 (0.0%) | 0 (0.0%) |
| Graduate Degree | 3 (100.0%) | 0 (0.0%) |
| Total | 6 (46.2%) | 7 (53.8%) |
Employment Characteristics in Brown City
Employment by Class of Employer in Brown City
Among the 434 employed individuals in Brown City, private company employees (289 | 66.6%), self-employed (not incorporated) (62 | 14.3%), and local government employees (27 | 6.2%) make up the most common classes of employment.
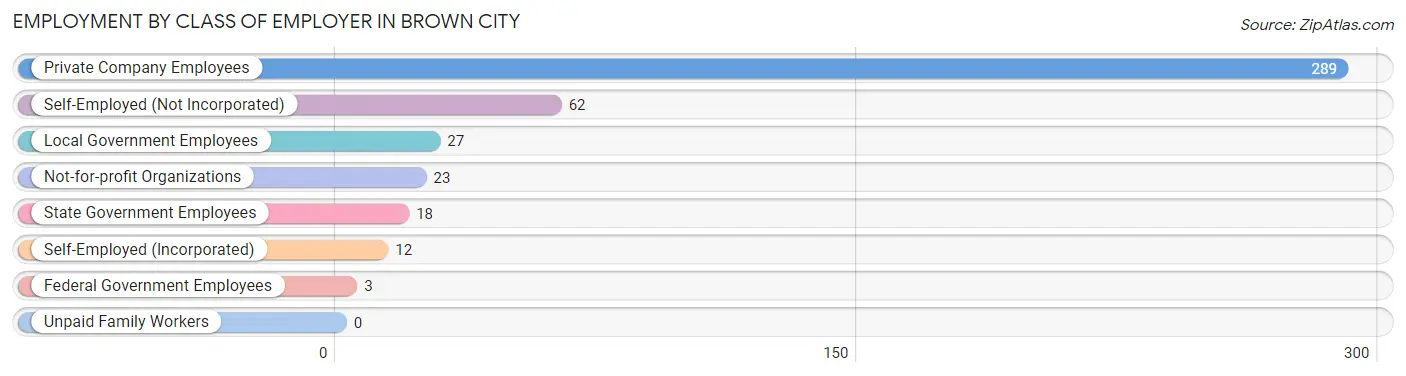
| Employer Class | # Employees | % Employees |
| Private Company Employees | 289 | 66.6% |
| Self-Employed (Incorporated) | 12 | 2.8% |
| Self-Employed (Not Incorporated) | 62 | 14.3% |
| Not-for-profit Organizations | 23 | 5.3% |
| Local Government Employees | 27 | 6.2% |
| State Government Employees | 18 | 4.2% |
| Federal Government Employees | 3 | 0.7% |
| Unpaid Family Workers | 0 | 0.0% |
| Total | 434 | 100.0% |
Employment Status by Age in Brown City
According to the labor force statistics for Brown City, out of the total population over 16 years of age (954), 52.8% or 504 individuals are in the labor force, with 13.3% or 67 of them unemployed. The age group with the highest labor force participation rate is 30 to 34 years, with 100.0% or 37 individuals in the labor force. Within the labor force, the 16 to 19 years age range has the highest percentage of unemployed individuals, with 62.1% or 18 of them being unemployed.
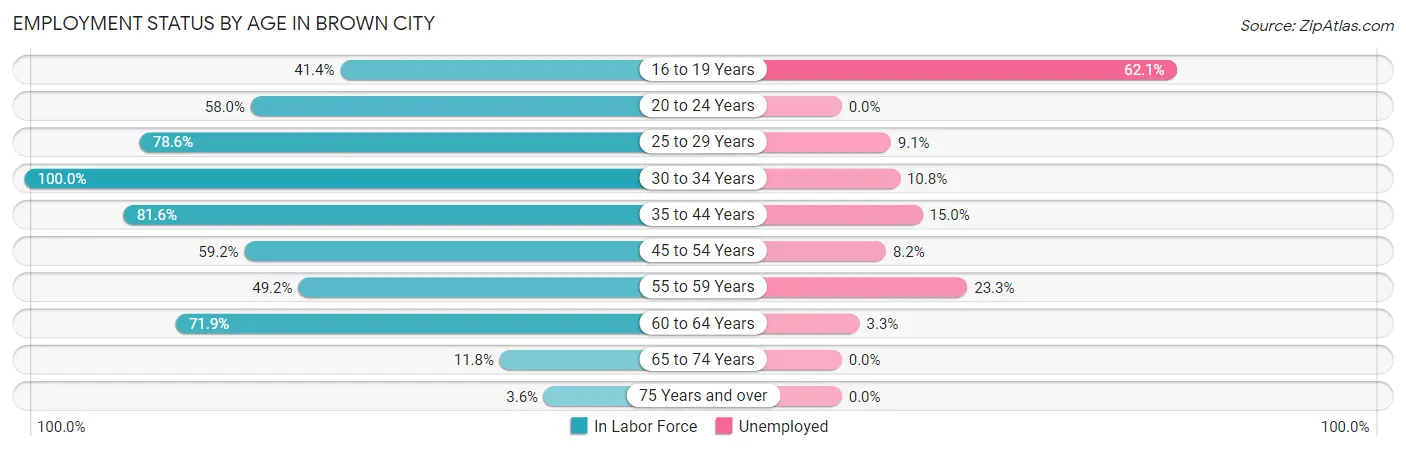
| Age Bracket | In Labor Force | Unemployed |
| 16 to 19 Years | 29 (41.4%) | 18 (62.1%) |
| 20 to 24 Years | 40 (58.0%) | 0 (0.0%) |
| 25 to 29 Years | 33 (78.6%) | 3 (9.1%) |
| 30 to 34 Years | 37 (100.0%) | 4 (10.8%) |
| 35 to 44 Years | 133 (81.6%) | 20 (15.0%) |
| 45 to 54 Years | 61 (59.2%) | 5 (8.2%) |
| 55 to 59 Years | 60 (49.2%) | 14 (23.3%) |
| 60 to 64 Years | 92 (71.9%) | 3 (3.3%) |
| 65 to 74 Years | 16 (11.8%) | 0 (0.0%) |
| 75 Years and over | 3 (3.6%) | 0 (0.0%) |
| Total | 504 (52.8%) | 67 (13.3%) |
Employment Status by Educational Attainment in Brown City
According to labor force statistics for Brown City, 69.9% of individuals (416) out of the total population between 25 and 64 years of age (595) are in the labor force, with 11.8% or 49 of them being unemployed. The group with the highest labor force participation rate are those with the educational attainment of bachelor's degree or higher, with 93.0% or 66 individuals in the labor force. Within the labor force, individuals with high school diploma education have the highest percentage of unemployment, with 15.4% or 39 of them being unemployed.
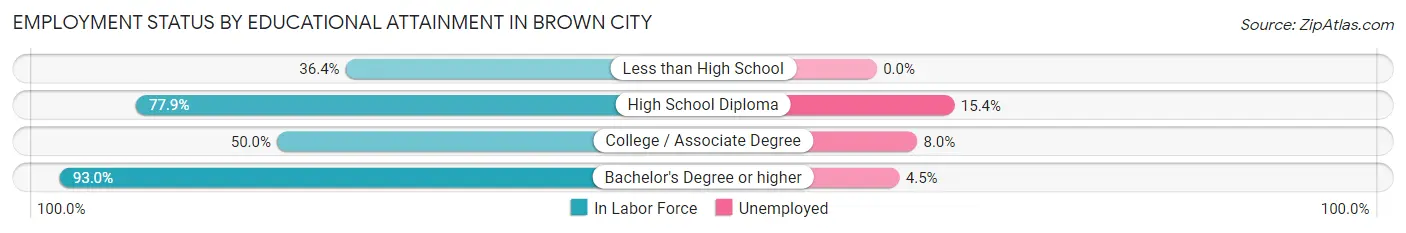
| Educational Attainment | In Labor Force | Unemployed |
| Less than High School | 8 (36.4%) | 0 (0.0%) |
| High School Diploma | 254 (77.9%) | 50 (15.4%) |
| College / Associate Degree | 88 (50.0%) | 14 (8.0%) |
| Bachelor's Degree or higher | 66 (93.0%) | 3 (4.5%) |
| Total | 416 (69.9%) | 70 (11.8%) |
Employment Occupations by Sex in Brown City
Management, Business, Science and Arts Occupations
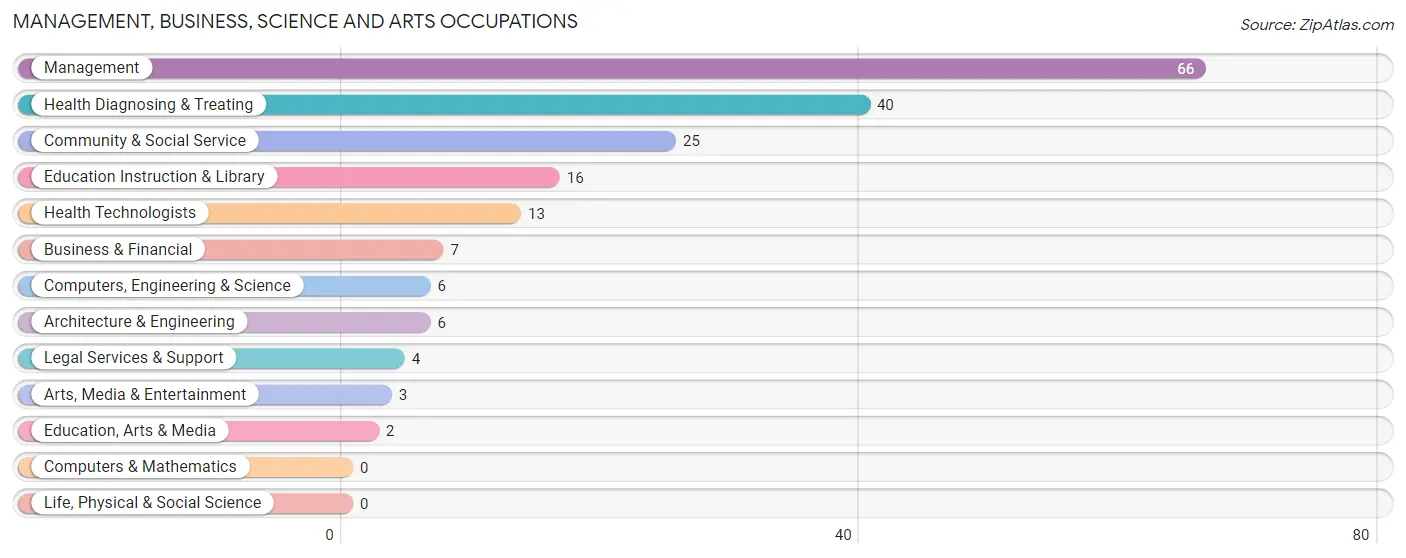
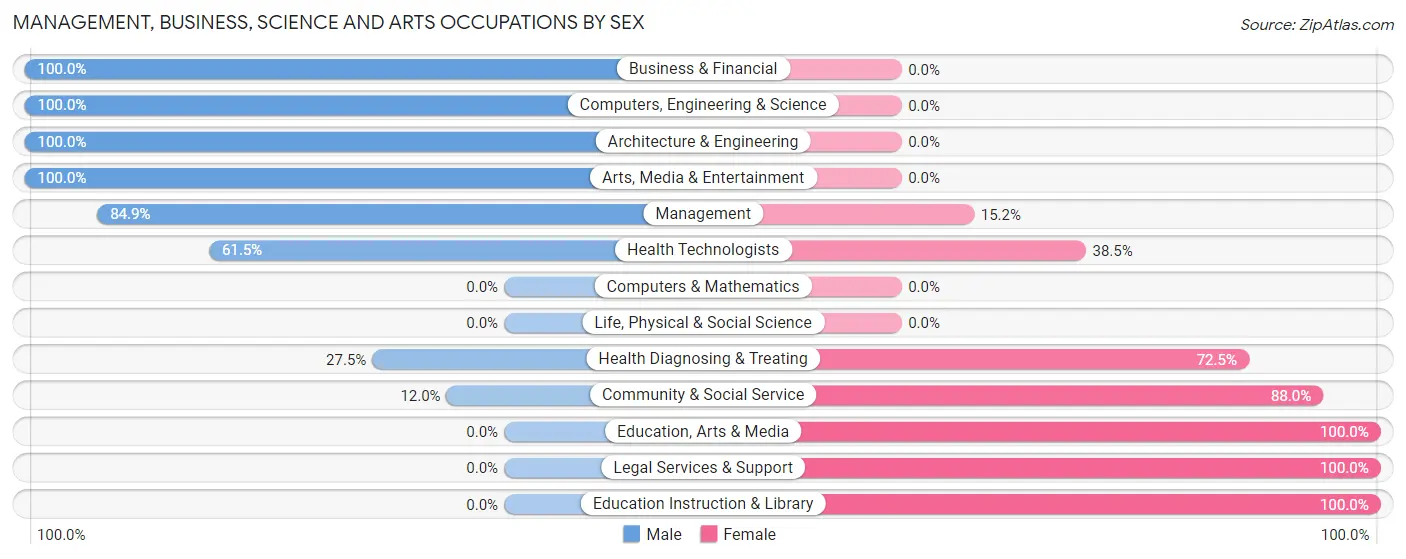
The most common Management, Business, Science and Arts occupations in Brown City are Management (66 | 15.1%), Health Diagnosing & Treating (40 | 9.1%), Community & Social Service (25 | 5.7%), Education Instruction & Library (16 | 3.7%), and Health Technologists (13 | 3.0%).
Management, Business, Science and Arts Occupations by Sex
Within the Management, Business, Science and Arts occupations in Brown City, the most male-oriented occupations are Business & Financial (100.0%), Computers, Engineering & Science (100.0%), and Architecture & Engineering (100.0%), while the most female-oriented occupations are Education, Arts & Media (100.0%), Legal Services & Support (100.0%), and Education Instruction & Library (100.0%).
| Occupation | Male | Female |
| Management | 56 (84.9%) | 10 (15.1%) |
| Business & Financial | 7 (100.0%) | 0 (0.0%) |
| Computers, Engineering & Science | 6 (100.0%) | 0 (0.0%) |
| Computers & Mathematics | 0 (0.0%) | 0 (0.0%) |
| Architecture & Engineering | 6 (100.0%) | 0 (0.0%) |
| Life, Physical & Social Science | 0 (0.0%) | 0 (0.0%) |
| Community & Social Service | 3 (12.0%) | 22 (88.0%) |
| Education, Arts & Media | 0 (0.0%) | 2 (100.0%) |
| Legal Services & Support | 0 (0.0%) | 4 (100.0%) |
| Education Instruction & Library | 0 (0.0%) | 16 (100.0%) |
| Arts, Media & Entertainment | 3 (100.0%) | 0 (0.0%) |
| Health Diagnosing & Treating | 11 (27.5%) | 29 (72.5%) |
| Health Technologists | 8 (61.5%) | 5 (38.5%) |
| Total (Category) | 83 (57.6%) | 61 (42.4%) |
| Total (Overall) | 248 (56.8%) | 189 (43.2%) |
Services Occupations
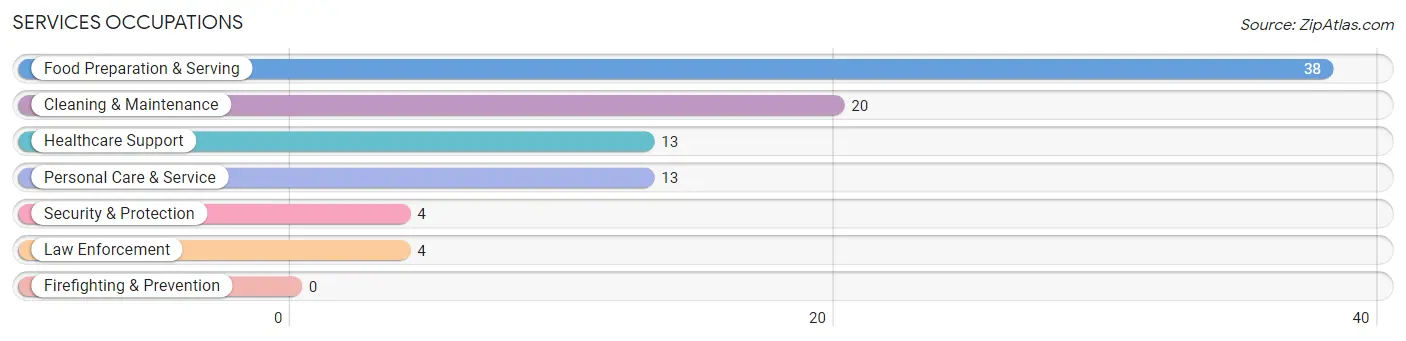
The most common Services occupations in Brown City are Food Preparation & Serving (38 | 8.7%), Cleaning & Maintenance (20 | 4.6%), Healthcare Support (13 | 3.0%), Personal Care & Service (13 | 3.0%), and Security & Protection (4 | 0.9%).
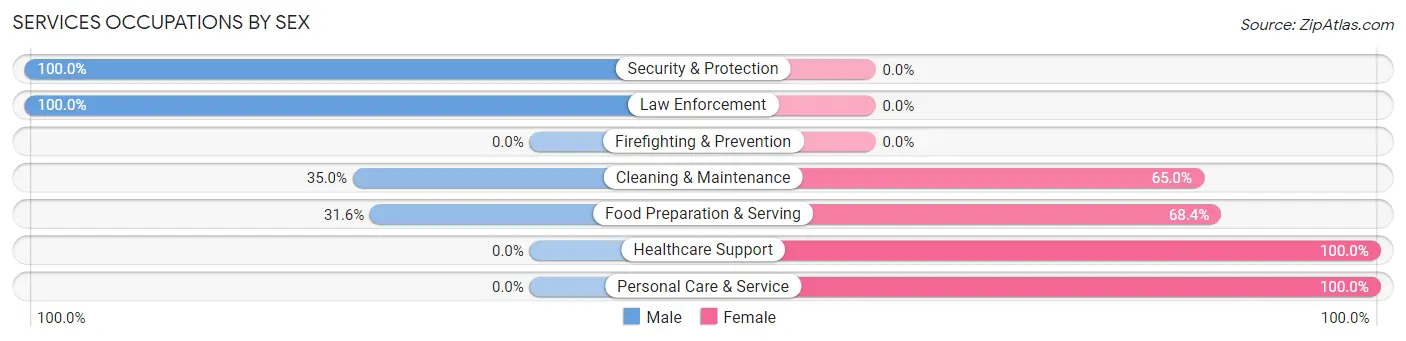
Services Occupations by Sex
Within the Services occupations in Brown City, the most male-oriented occupations are Security & Protection (100.0%), Law Enforcement (100.0%), and Cleaning & Maintenance (35.0%), while the most female-oriented occupations are Healthcare Support (100.0%), Personal Care & Service (100.0%), and Food Preparation & Serving (68.4%).
| Occupation | Male | Female |
| Healthcare Support | 0 (0.0%) | 13 (100.0%) |
| Security & Protection | 4 (100.0%) | 0 (0.0%) |
| Firefighting & Prevention | 0 (0.0%) | 0 (0.0%) |
| Law Enforcement | 4 (100.0%) | 0 (0.0%) |
| Food Preparation & Serving | 12 (31.6%) | 26 (68.4%) |
| Cleaning & Maintenance | 7 (35.0%) | 13 (65.0%) |
| Personal Care & Service | 0 (0.0%) | 13 (100.0%) |
| Total (Category) | 23 (26.1%) | 65 (73.9%) |
| Total (Overall) | 248 (56.8%) | 189 (43.2%) |
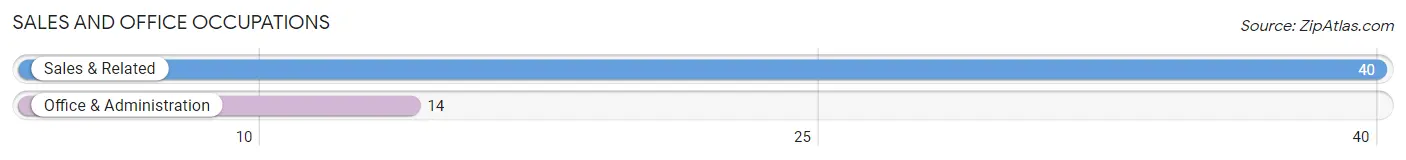
Sales and Office Occupations
The most common Sales and Office occupations in Brown City are Sales & Related (40 | 9.1%), and Office & Administration (14 | 3.2%).
Sales and Office Occupations by Sex
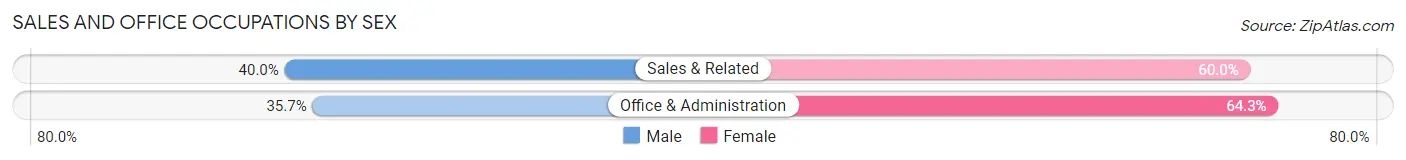
| Occupation | Male | Female |
| Sales & Related | 16 (40.0%) | 24 (60.0%) |
| Office & Administration | 5 (35.7%) | 9 (64.3%) |
| Total (Category) | 21 (38.9%) | 33 (61.1%) |
| Total (Overall) | 248 (56.8%) | 189 (43.2%) |
Natural Resources, Construction and Maintenance Occupations
The most common Natural Resources, Construction and Maintenance occupations in Brown City are , and Construction & Extraction (38 | 8.7%).
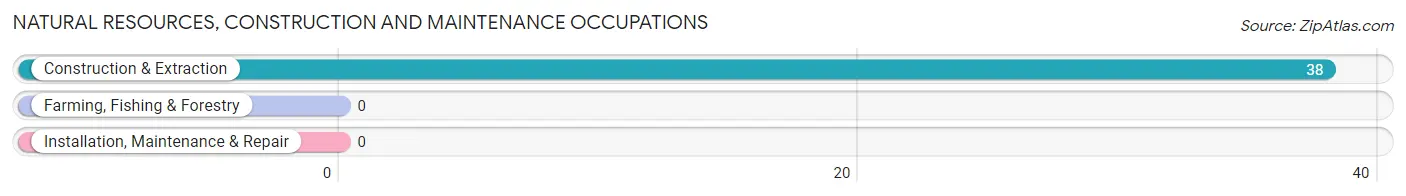
Natural Resources, Construction and Maintenance Occupations by Sex
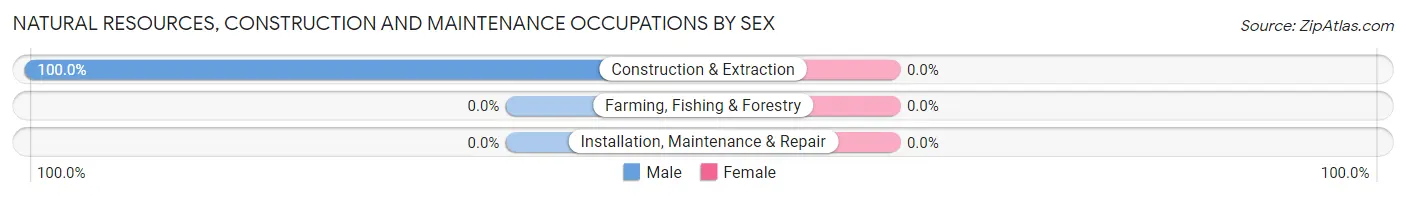
| Occupation | Male | Female |
| Farming, Fishing & Forestry | 0 (0.0%) | 0 (0.0%) |
| Construction & Extraction | 38 (100.0%) | 0 (0.0%) |
| Installation, Maintenance & Repair | 0 (0.0%) | 0 (0.0%) |
| Total (Category) | 38 (100.0%) | 0 (0.0%) |
| Total (Overall) | 248 (56.8%) | 189 (43.2%) |
Production, Transportation and Moving Occupations
The most common Production, Transportation and Moving occupations in Brown City are Production (51 | 11.7%), Transportation (35 | 8.0%), and Material Moving (27 | 6.2%).
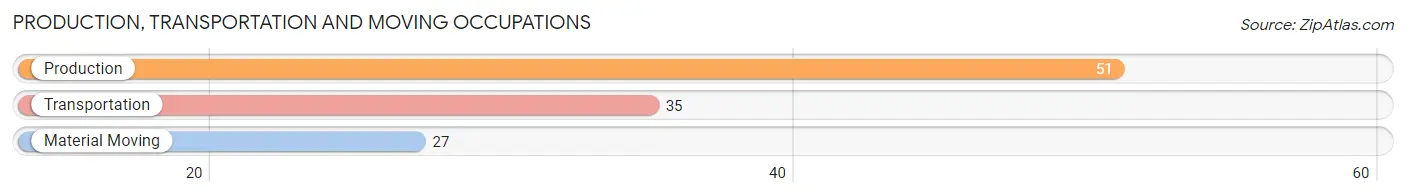
Production, Transportation and Moving Occupations by Sex
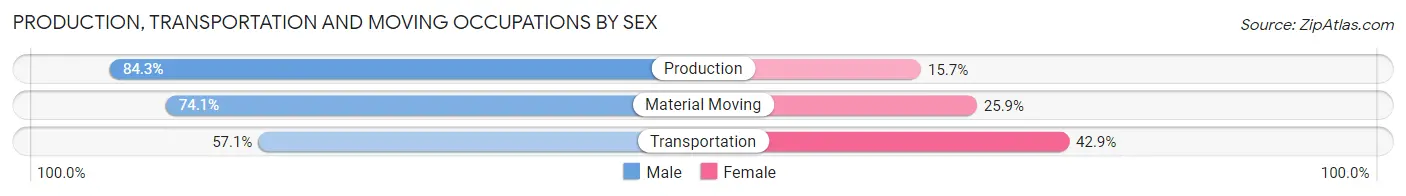
| Occupation | Male | Female |
| Production | 43 (84.3%) | 8 (15.7%) |
| Transportation | 20 (57.1%) | 15 (42.9%) |
| Material Moving | 20 (74.1%) | 7 (25.9%) |
| Total (Category) | 83 (73.5%) | 30 (26.6%) |
| Total (Overall) | 248 (56.8%) | 189 (43.2%) |
Employment Industries by Sex in Brown City
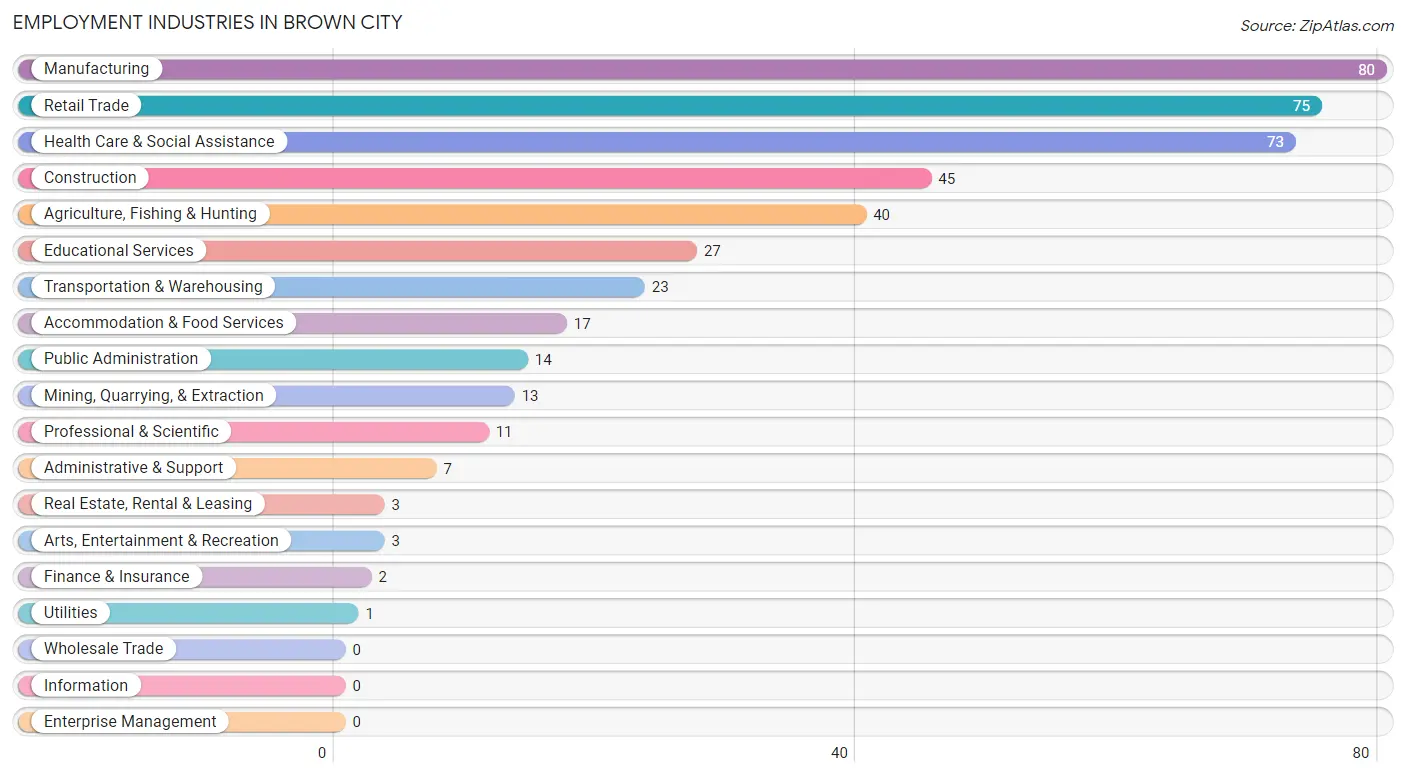
Employment Industries in Brown City
The major employment industries in Brown City include Manufacturing (80 | 18.3%), Retail Trade (75 | 17.2%), Health Care & Social Assistance (73 | 16.7%), Construction (45 | 10.3%), and Agriculture, Fishing & Hunting (40 | 9.1%).
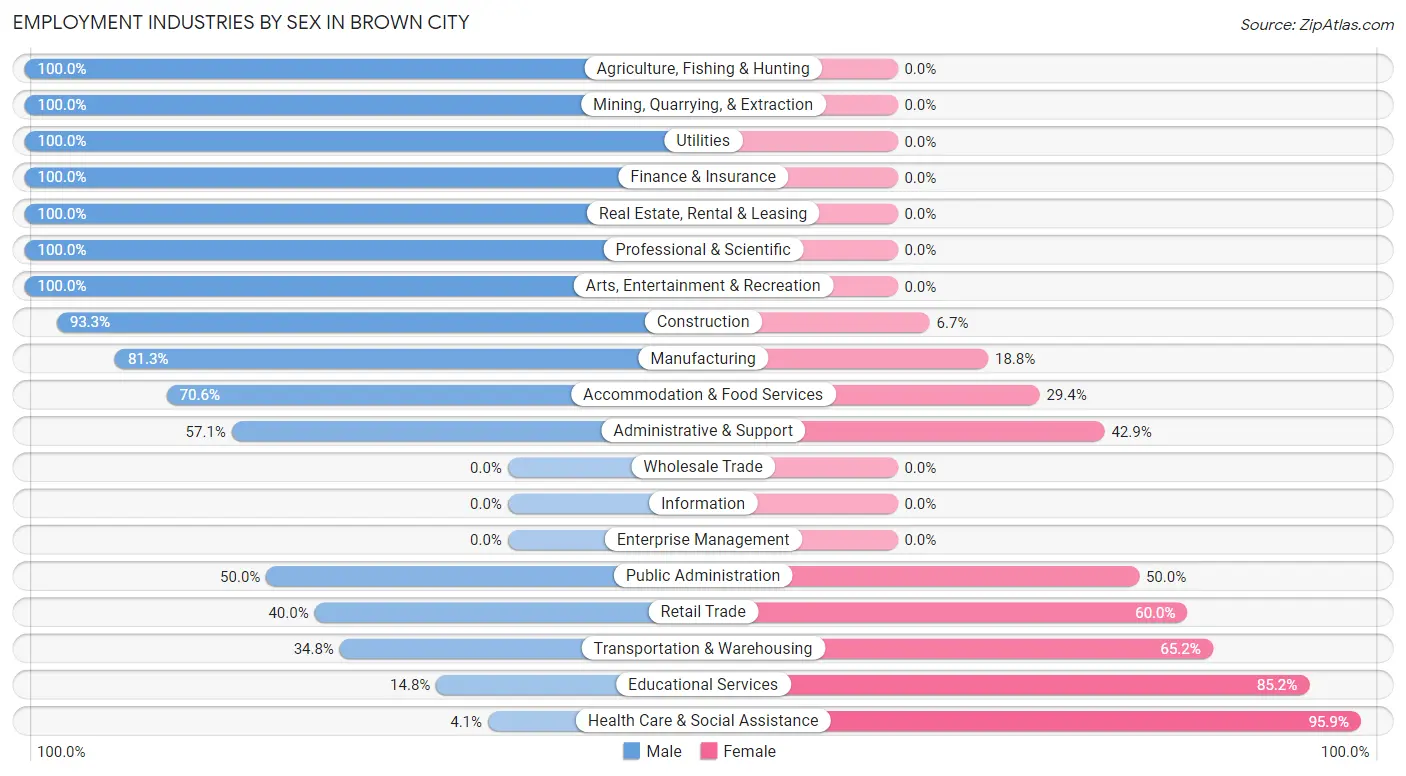
Employment Industries by Sex in Brown City
The Brown City industries that see more men than women are Agriculture, Fishing & Hunting (100.0%), Mining, Quarrying, & Extraction (100.0%), and Utilities (100.0%), whereas the industries that tend to have a higher number of women are Health Care & Social Assistance (95.9%), Educational Services (85.2%), and Transportation & Warehousing (65.2%).
| Industry | Male | Female |
| Agriculture, Fishing & Hunting | 40 (100.0%) | 0 (0.0%) |
| Mining, Quarrying, & Extraction | 13 (100.0%) | 0 (0.0%) |
| Construction | 42 (93.3%) | 3 (6.7%) |
| Manufacturing | 65 (81.2%) | 15 (18.8%) |
| Wholesale Trade | 0 (0.0%) | 0 (0.0%) |
| Retail Trade | 30 (40.0%) | 45 (60.0%) |
| Transportation & Warehousing | 8 (34.8%) | 15 (65.2%) |
| Utilities | 1 (100.0%) | 0 (0.0%) |
| Information | 0 (0.0%) | 0 (0.0%) |
| Finance & Insurance | 2 (100.0%) | 0 (0.0%) |
| Real Estate, Rental & Leasing | 3 (100.0%) | 0 (0.0%) |
| Professional & Scientific | 11 (100.0%) | 0 (0.0%) |
| Enterprise Management | 0 (0.0%) | 0 (0.0%) |
| Administrative & Support | 4 (57.1%) | 3 (42.9%) |
| Educational Services | 4 (14.8%) | 23 (85.2%) |
| Health Care & Social Assistance | 3 (4.1%) | 70 (95.9%) |
| Arts, Entertainment & Recreation | 3 (100.0%) | 0 (0.0%) |
| Accommodation & Food Services | 12 (70.6%) | 5 (29.4%) |
| Public Administration | 7 (50.0%) | 7 (50.0%) |
| Total | 248 (56.8%) | 189 (43.2%) |
Education in Brown City
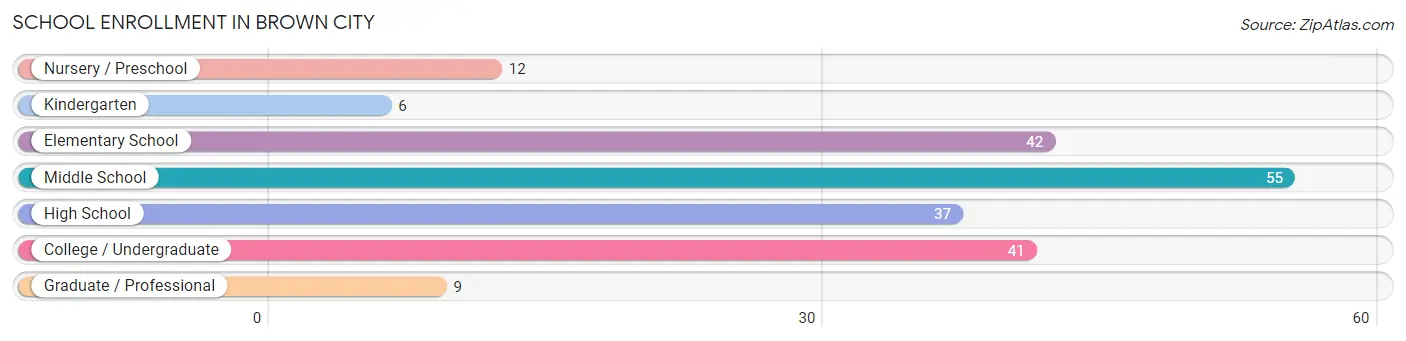
School Enrollment in Brown City
The most common levels of schooling among the 202 students in Brown City are middle school (55 | 27.2%), elementary school (42 | 20.8%), and college / undergraduate (41 | 20.3%).
| School Level | # Students | % Students |
| Nursery / Preschool | 12 | 5.9% |
| Kindergarten | 6 | 3.0% |
| Elementary School | 42 | 20.8% |
| Middle School | 55 | 27.2% |
| High School | 37 | 18.3% |
| College / Undergraduate | 41 | 20.3% |
| Graduate / Professional | 9 | 4.5% |
| Total | 202 | 100.0% |
School Enrollment by Age by Funding Source in Brown City
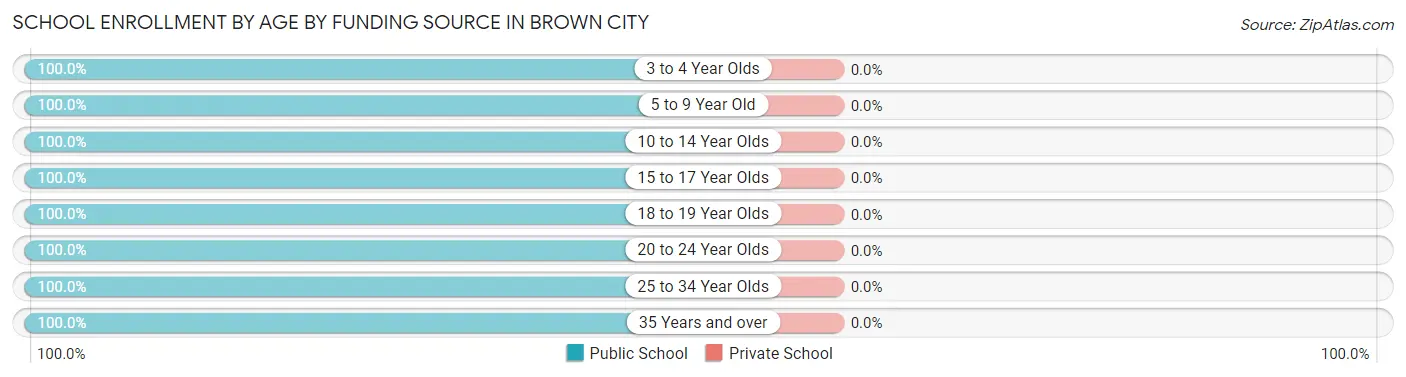
| Age Bracket | Public School | Private School |
| 3 to 4 Year Olds | 6 (100.0%) | 0 (0.0%) |
| 5 to 9 Year Old | 50 (100.0%) | 0 (0.0%) |
| 10 to 14 Year Olds | 65 (100.0%) | 0 (0.0%) |
| 15 to 17 Year Olds | 31 (100.0%) | 0 (0.0%) |
| 18 to 19 Year Olds | 20 (100.0%) | 0 (0.0%) |
| 20 to 24 Year Olds | 4 (100.0%) | 0 (0.0%) |
| 25 to 34 Year Olds | 4 (100.0%) | 0 (0.0%) |
| 35 Years and over | 22 (100.0%) | 0 (0.0%) |
| Total | 202 (100.0%) | 0 (0.0%) |
Educational Attainment by Field of Study in Brown City
Education (29 | 32.2%), business (27 | 30.0%), arts & humanities (13 | 14.4%), science & technology (11 | 12.2%), and psychology (5 | 5.6%) are the most common fields of study among 90 individuals in Brown City who have obtained a bachelor's degree or higher.
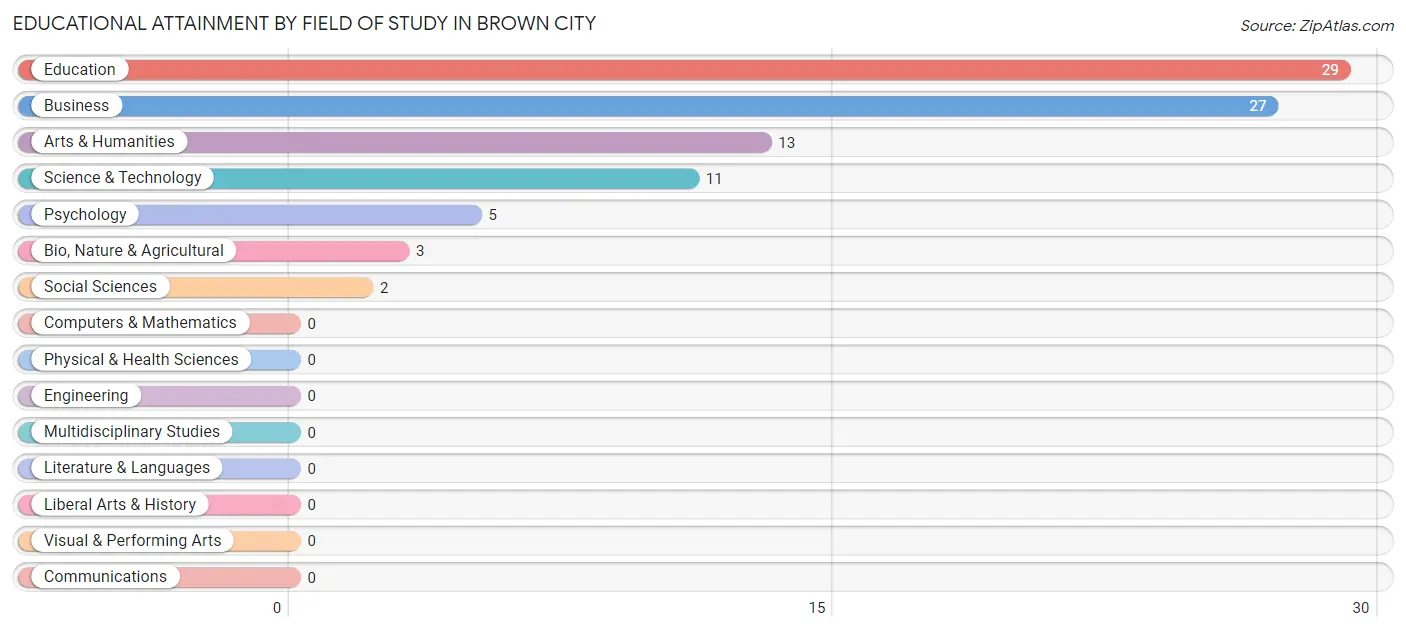
| Field of Study | # Graduates | % Graduates |
| Computers & Mathematics | 0 | 0.0% |
| Bio, Nature & Agricultural | 3 | 3.3% |
| Physical & Health Sciences | 0 | 0.0% |
| Psychology | 5 | 5.6% |
| Social Sciences | 2 | 2.2% |
| Engineering | 0 | 0.0% |
| Multidisciplinary Studies | 0 | 0.0% |
| Science & Technology | 11 | 12.2% |
| Business | 27 | 30.0% |
| Education | 29 | 32.2% |
| Literature & Languages | 0 | 0.0% |
| Liberal Arts & History | 0 | 0.0% |
| Visual & Performing Arts | 0 | 0.0% |
| Communications | 0 | 0.0% |
| Arts & Humanities | 13 | 14.4% |
| Total | 90 | 100.0% |
Transportation & Commute in Brown City
Vehicle Availability by Sex in Brown City
The most prevalent vehicle ownership categories in Brown City are males with 3 vehicles (94, accounting for 39.0%) and females with 3 vehicles (47, making up 50.8%).
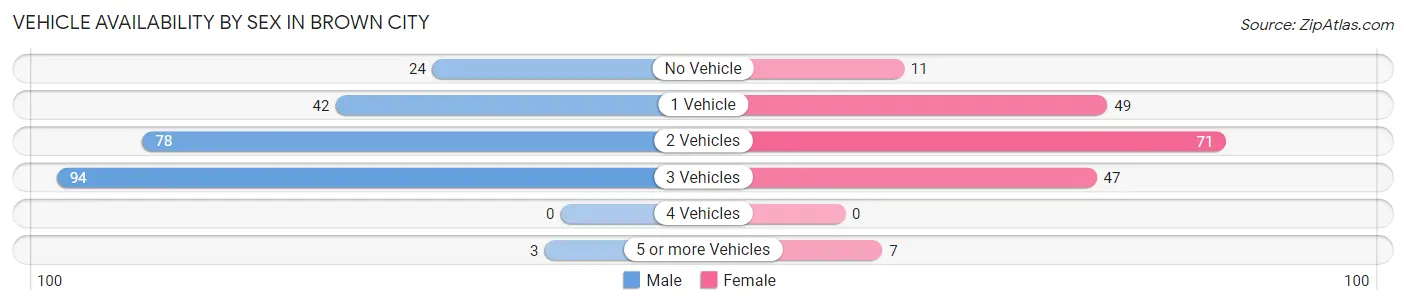
| Vehicles Available | Male | Female |
| No Vehicle | 24 (10.0%) | 11 (5.9%) |
| 1 Vehicle | 42 (17.4%) | 49 (26.5%) |
| 2 Vehicles | 78 (32.4%) | 71 (38.4%) |
| 3 Vehicles | 94 (39.0%) | 47 (25.4%) |
| 4 Vehicles | 0 (0.0%) | 0 (0.0%) |
| 5 or more Vehicles | 3 (1.2%) | 7 (3.8%) |
| Total | 241 (100.0%) | 185 (100.0%) |
Commute Time in Brown City
The most frequently occuring commute durations in Brown City are 5 to 9 minutes (76 commuters, 18.0%), 60 to 89 minutes (67 commuters, 15.9%), and 10 to 14 minutes (59 commuters, 14.0%).
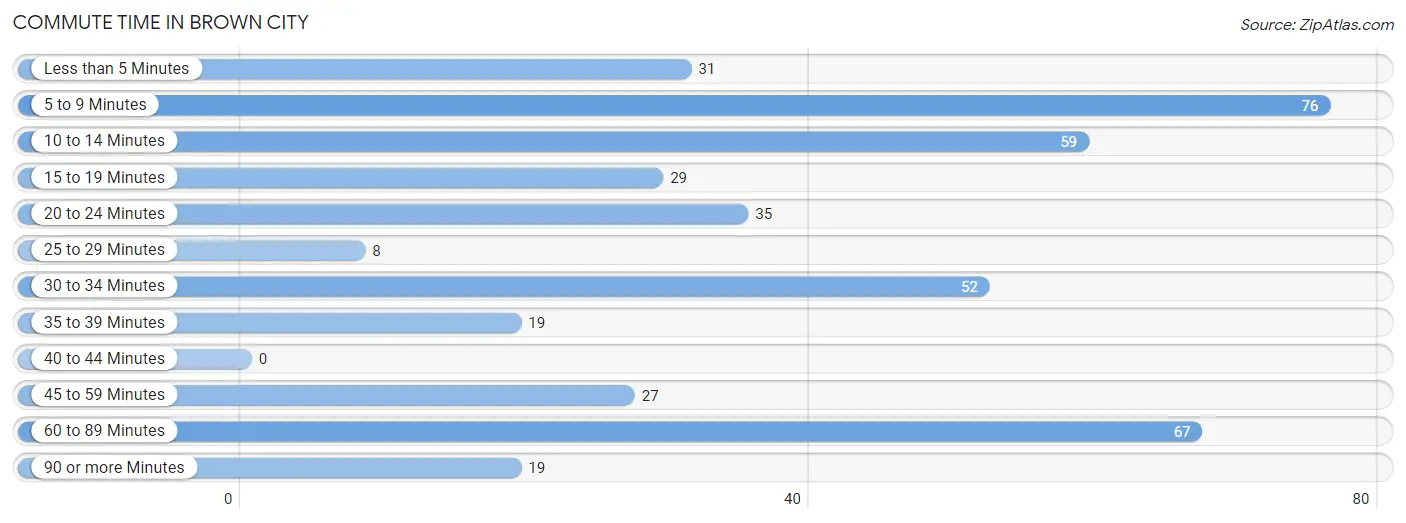
| Commute Time | # Commuters | % Commuters |
| Less than 5 Minutes | 31 | 7.3% |
| 5 to 9 Minutes | 76 | 18.0% |
| 10 to 14 Minutes | 59 | 14.0% |
| 15 to 19 Minutes | 29 | 6.9% |
| 20 to 24 Minutes | 35 | 8.3% |
| 25 to 29 Minutes | 8 | 1.9% |
| 30 to 34 Minutes | 52 | 12.3% |
| 35 to 39 Minutes | 19 | 4.5% |
| 40 to 44 Minutes | 0 | 0.0% |
| 45 to 59 Minutes | 27 | 6.4% |
| 60 to 89 Minutes | 67 | 15.9% |
| 90 or more Minutes | 19 | 4.5% |
Commute Time by Sex in Brown City
The most common commute times in Brown City are 60 to 89 minutes (52 commuters, 21.5%) for males and 30 to 34 minutes (34 commuters, 18.9%) for females.
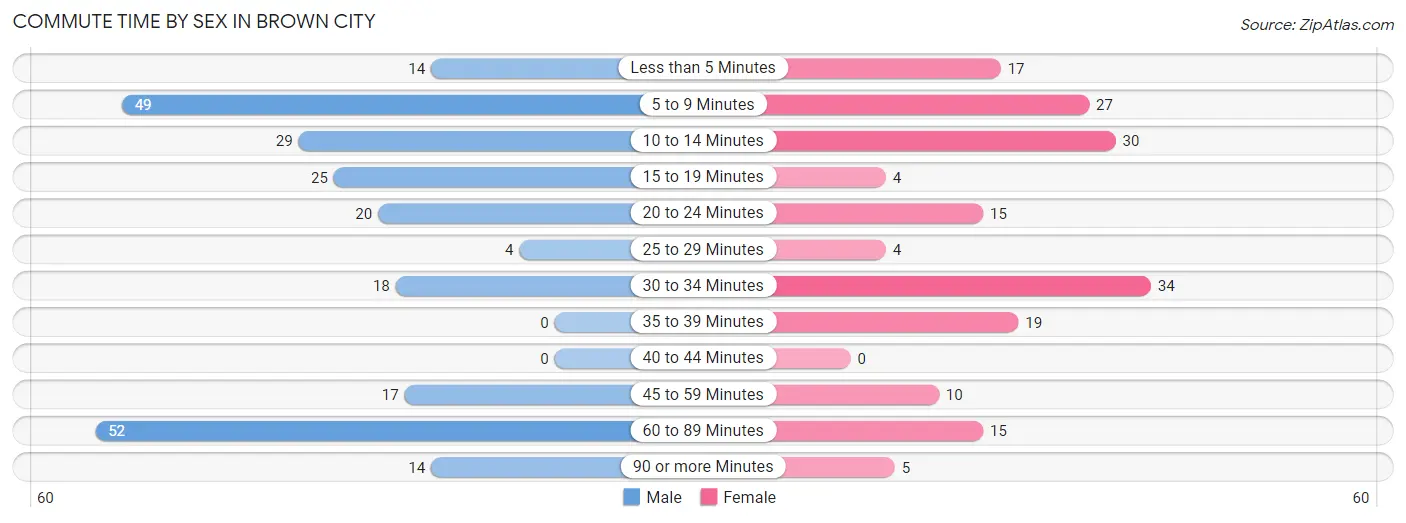
| Commute Time | Male | Female |
| Less than 5 Minutes | 14 (5.8%) | 17 (9.4%) |
| 5 to 9 Minutes | 49 (20.3%) | 27 (15.0%) |
| 10 to 14 Minutes | 29 (12.0%) | 30 (16.7%) |
| 15 to 19 Minutes | 25 (10.3%) | 4 (2.2%) |
| 20 to 24 Minutes | 20 (8.3%) | 15 (8.3%) |
| 25 to 29 Minutes | 4 (1.7%) | 4 (2.2%) |
| 30 to 34 Minutes | 18 (7.4%) | 34 (18.9%) |
| 35 to 39 Minutes | 0 (0.0%) | 19 (10.6%) |
| 40 to 44 Minutes | 0 (0.0%) | 0 (0.0%) |
| 45 to 59 Minutes | 17 (7.0%) | 10 (5.6%) |
| 60 to 89 Minutes | 52 (21.5%) | 15 (8.3%) |
| 90 or more Minutes | 14 (5.8%) | 5 (2.8%) |
Time of Departure to Work by Sex in Brown City
The most frequent times of departure to work in Brown City are 12:00 AM to 4:59 AM (93, 38.4%) for males and 7:30 AM to 7:59 AM (32, 17.8%) for females.
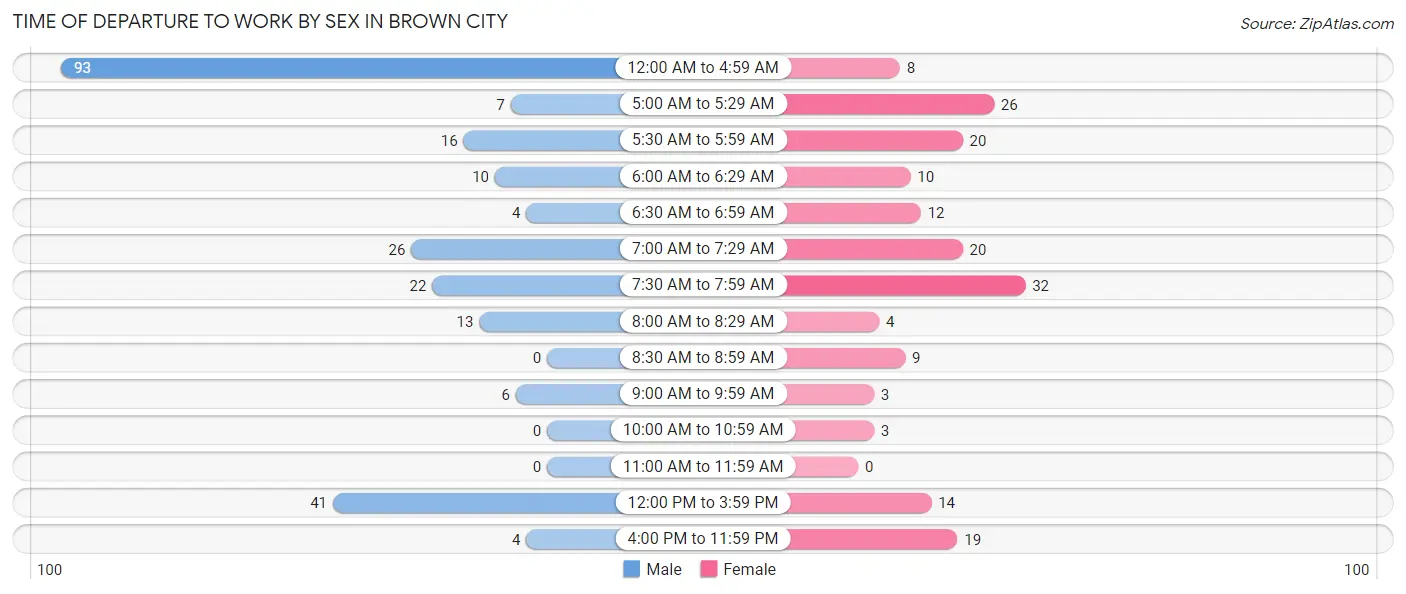
| Time of Departure | Male | Female |
| 12:00 AM to 4:59 AM | 93 (38.4%) | 8 (4.4%) |
| 5:00 AM to 5:29 AM | 7 (2.9%) | 26 (14.4%) |
| 5:30 AM to 5:59 AM | 16 (6.6%) | 20 (11.1%) |
| 6:00 AM to 6:29 AM | 10 (4.1%) | 10 (5.6%) |
| 6:30 AM to 6:59 AM | 4 (1.7%) | 12 (6.7%) |
| 7:00 AM to 7:29 AM | 26 (10.7%) | 20 (11.1%) |
| 7:30 AM to 7:59 AM | 22 (9.1%) | 32 (17.8%) |
| 8:00 AM to 8:29 AM | 13 (5.4%) | 4 (2.2%) |
| 8:30 AM to 8:59 AM | 0 (0.0%) | 9 (5.0%) |
| 9:00 AM to 9:59 AM | 6 (2.5%) | 3 (1.7%) |
| 10:00 AM to 10:59 AM | 0 (0.0%) | 3 (1.7%) |
| 11:00 AM to 11:59 AM | 0 (0.0%) | 0 (0.0%) |
| 12:00 PM to 3:59 PM | 41 (16.9%) | 14 (7.8%) |
| 4:00 PM to 11:59 PM | 4 (1.7%) | 19 (10.6%) |
| Total | 242 (100.0%) | 180 (100.0%) |
Housing Occupancy in Brown City
Occupancy by Ownership in Brown City
Of the total 499 dwellings in Brown City, owner-occupied units account for 352 (70.5%), while renter-occupied units make up 147 (29.5%).
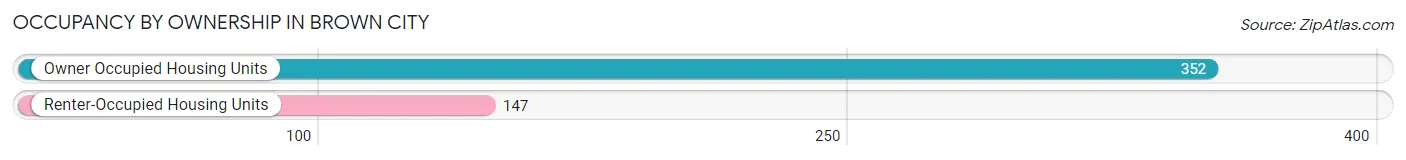
| Occupancy | # Housing Units | % Housing Units |
| Owner Occupied Housing Units | 352 | 70.5% |
| Renter-Occupied Housing Units | 147 | 29.5% |
| Total Occupied Housing Units | 499 | 100.0% |
Occupancy by Household Size in Brown City
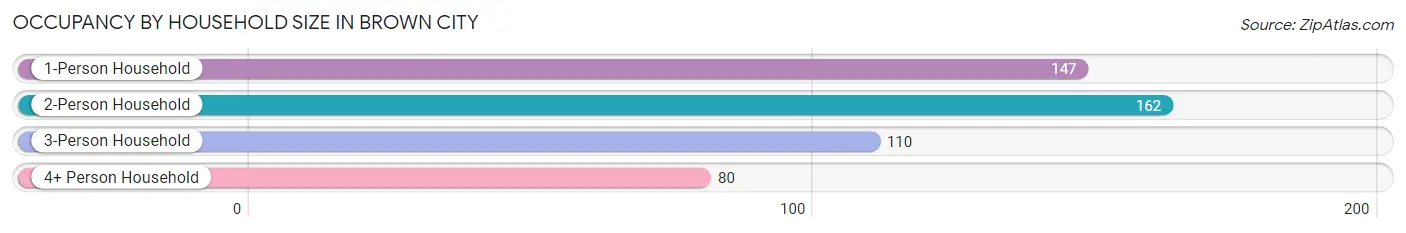
| Household Size | # Housing Units | % Housing Units |
| 1-Person Household | 147 | 29.5% |
| 2-Person Household | 162 | 32.5% |
| 3-Person Household | 110 | 22.0% |
| 4+ Person Household | 80 | 16.0% |
| Total Housing Units | 499 | 100.0% |
Occupancy by Ownership by Household Size in Brown City
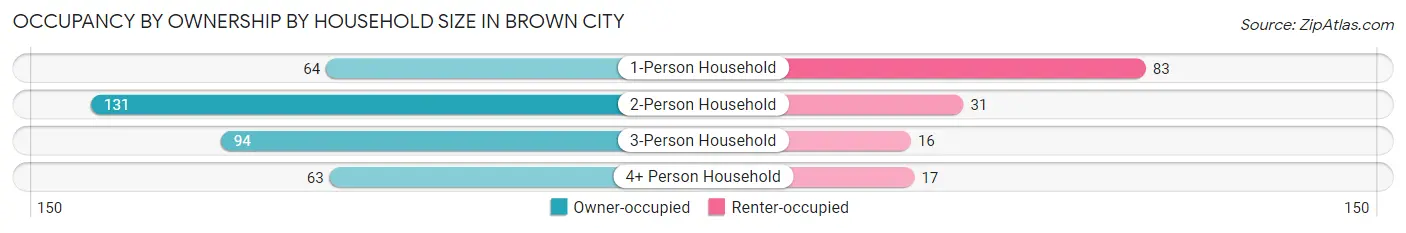
| Household Size | Owner-occupied | Renter-occupied |
| 1-Person Household | 64 (43.5%) | 83 (56.5%) |
| 2-Person Household | 131 (80.9%) | 31 (19.1%) |
| 3-Person Household | 94 (85.5%) | 16 (14.5%) |
| 4+ Person Household | 63 (78.7%) | 17 (21.2%) |
| Total Housing Units | 352 (70.5%) | 147 (29.5%) |
Occupancy by Educational Attainment in Brown City
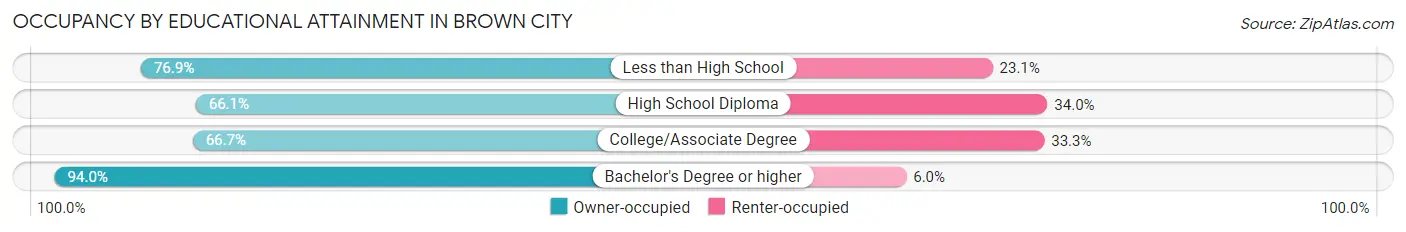
| Household Size | Owner-occupied | Renter-occupied |
| Less than High School | 20 (76.9%) | 6 (23.1%) |
| High School Diploma | 179 (66.0%) | 92 (34.0%) |
| College/Associate Degree | 90 (66.7%) | 45 (33.3%) |
| Bachelor's Degree or higher | 63 (94.0%) | 4 (6.0%) |
Occupancy by Age of Householder in Brown City
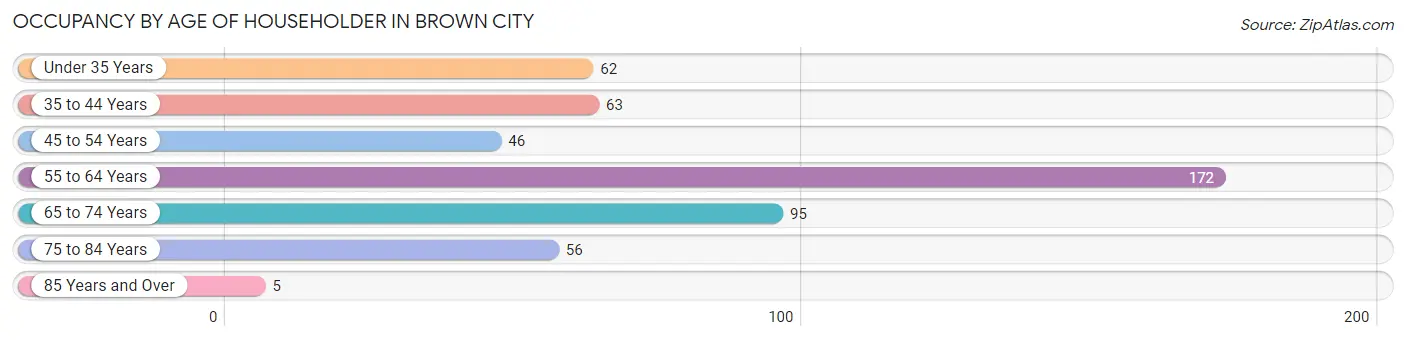
| Age Bracket | # Households | % Households |
| Under 35 Years | 62 | 12.4% |
| 35 to 44 Years | 63 | 12.6% |
| 45 to 54 Years | 46 | 9.2% |
| 55 to 64 Years | 172 | 34.5% |
| 65 to 74 Years | 95 | 19.0% |
| 75 to 84 Years | 56 | 11.2% |
| 85 Years and Over | 5 | 1.0% |
| Total | 499 | 100.0% |
Housing Finances in Brown City
Median Income by Occupancy in Brown City
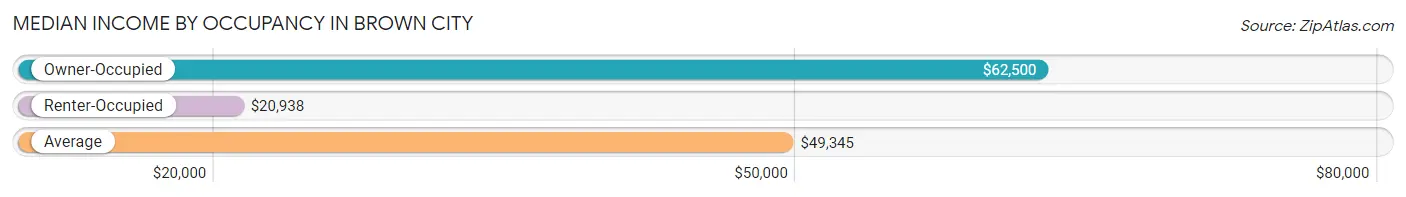
| Occupancy Type | # Households | Median Income |
| Owner-Occupied | 352 (70.5%) | $62,500 |
| Renter-Occupied | 147 (29.5%) | $20,938 |
| Average | 499 (100.0%) | $49,345 |
Occupancy by Householder Income Bracket in Brown City
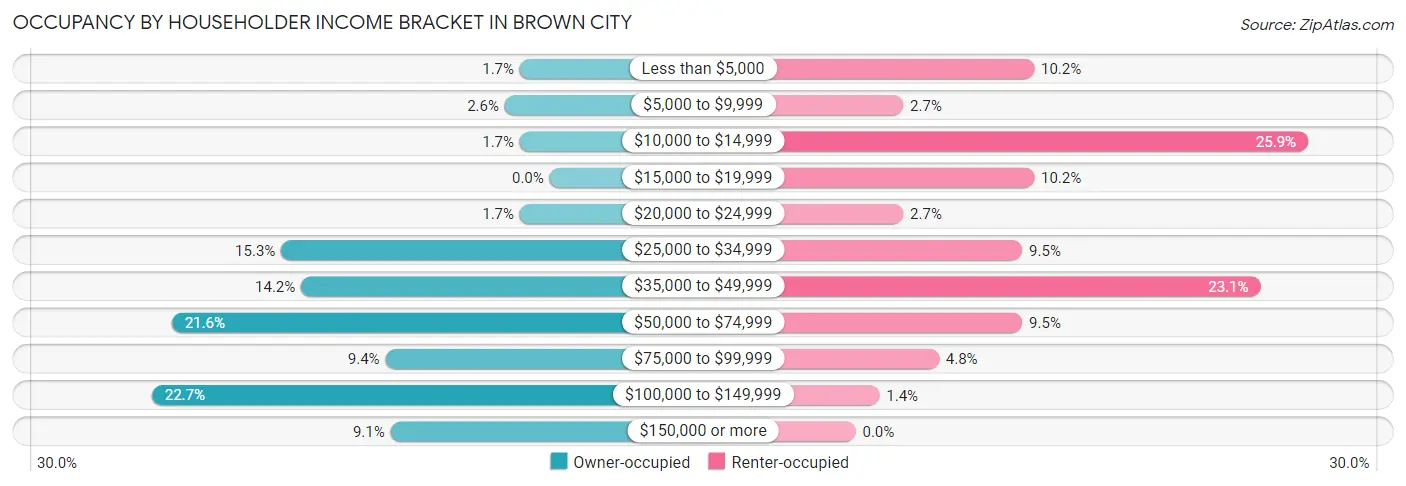
| Income Bracket | Owner-occupied | Renter-occupied |
| Less than $5,000 | 6 (1.7%) | 15 (10.2%) |
| $5,000 to $9,999 | 9 (2.6%) | 4 (2.7%) |
| $10,000 to $14,999 | 6 (1.7%) | 38 (25.9%) |
| $15,000 to $19,999 | 0 (0.0%) | 15 (10.2%) |
| $20,000 to $24,999 | 6 (1.7%) | 4 (2.7%) |
| $25,000 to $34,999 | 54 (15.3%) | 14 (9.5%) |
| $35,000 to $49,999 | 50 (14.2%) | 34 (23.1%) |
| $50,000 to $74,999 | 76 (21.6%) | 14 (9.5%) |
| $75,000 to $99,999 | 33 (9.4%) | 7 (4.8%) |
| $100,000 to $149,999 | 80 (22.7%) | 2 (1.4%) |
| $150,000 or more | 32 (9.1%) | 0 (0.0%) |
| Total | 352 (100.0%) | 147 (100.0%) |
Monthly Housing Cost Tiers in Brown City
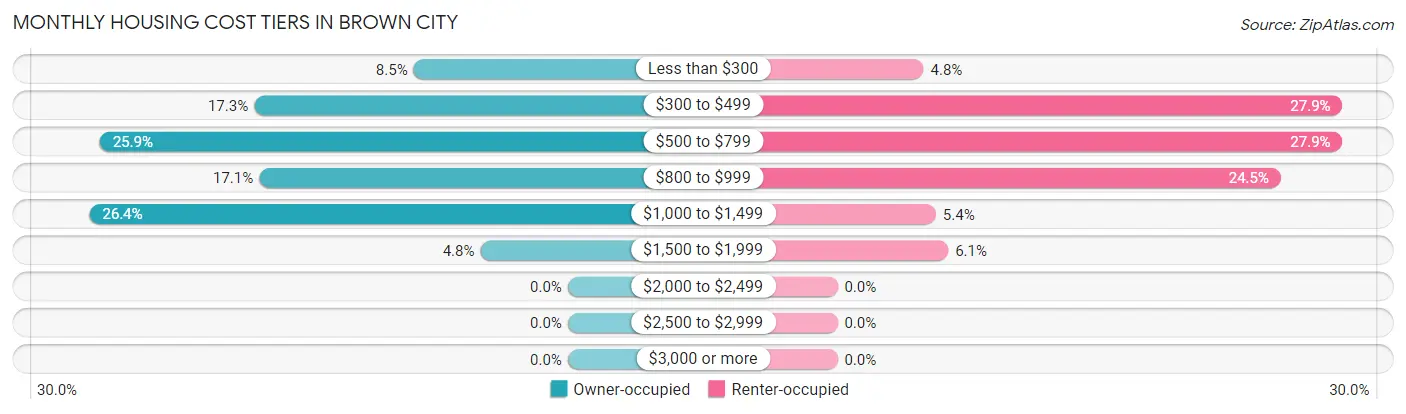
| Monthly Cost | Owner-occupied | Renter-occupied |
| Less than $300 | 30 (8.5%) | 7 (4.8%) |
| $300 to $499 | 61 (17.3%) | 41 (27.9%) |
| $500 to $799 | 91 (25.9%) | 41 (27.9%) |
| $800 to $999 | 60 (17.1%) | 36 (24.5%) |
| $1,000 to $1,499 | 93 (26.4%) | 8 (5.4%) |
| $1,500 to $1,999 | 17 (4.8%) | 9 (6.1%) |
| $2,000 to $2,499 | 0 (0.0%) | 0 (0.0%) |
| $2,500 to $2,999 | 0 (0.0%) | 0 (0.0%) |
| $3,000 or more | 0 (0.0%) | 0 (0.0%) |
| Total | 352 (100.0%) | 147 (100.0%) |
Physical Housing Characteristics in Brown City
Housing Structures in Brown City
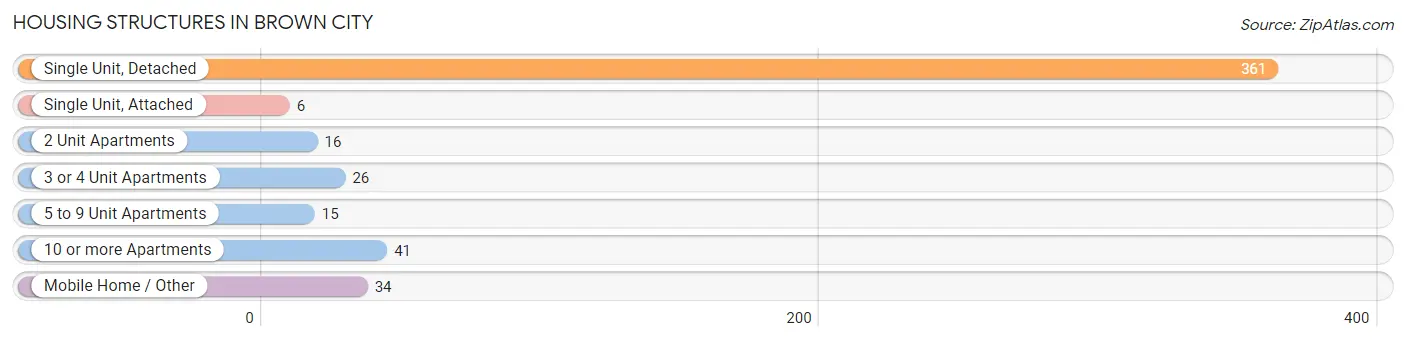
| Structure Type | # Housing Units | % Housing Units |
| Single Unit, Detached | 361 | 72.3% |
| Single Unit, Attached | 6 | 1.2% |
| 2 Unit Apartments | 16 | 3.2% |
| 3 or 4 Unit Apartments | 26 | 5.2% |
| 5 to 9 Unit Apartments | 15 | 3.0% |
| 10 or more Apartments | 41 | 8.2% |
| Mobile Home / Other | 34 | 6.8% |
| Total | 499 | 100.0% |
Housing Structures by Occupancy in Brown City
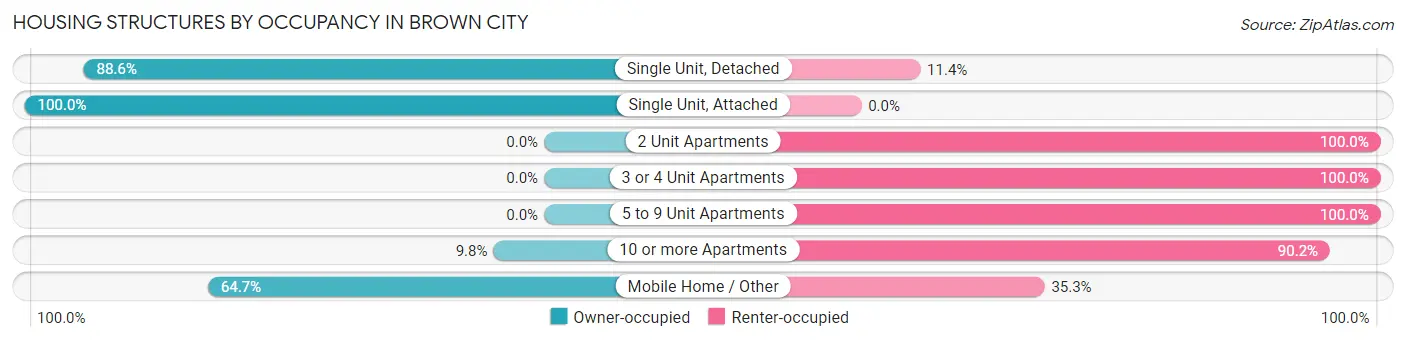
| Structure Type | Owner-occupied | Renter-occupied |
| Single Unit, Detached | 320 (88.6%) | 41 (11.4%) |
| Single Unit, Attached | 6 (100.0%) | 0 (0.0%) |
| 2 Unit Apartments | 0 (0.0%) | 16 (100.0%) |
| 3 or 4 Unit Apartments | 0 (0.0%) | 26 (100.0%) |
| 5 to 9 Unit Apartments | 0 (0.0%) | 15 (100.0%) |
| 10 or more Apartments | 4 (9.8%) | 37 (90.2%) |
| Mobile Home / Other | 22 (64.7%) | 12 (35.3%) |
| Total | 352 (70.5%) | 147 (29.5%) |
Housing Structures by Number of Rooms in Brown City
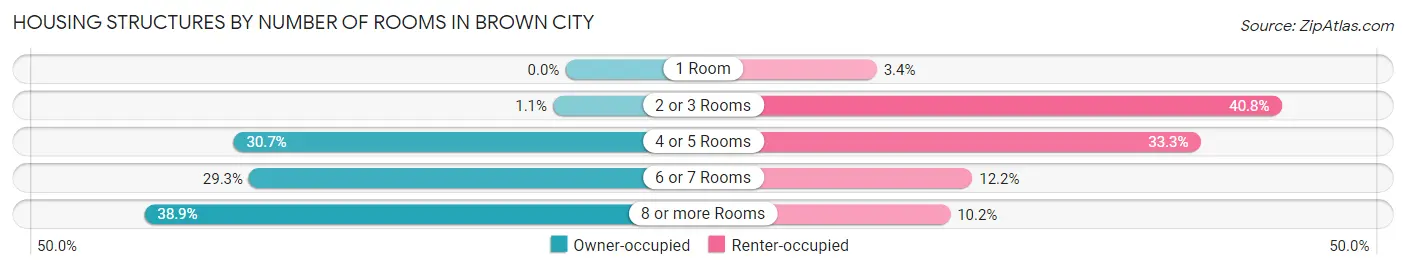
| Number of Rooms | Owner-occupied | Renter-occupied |
| 1 Room | 0 (0.0%) | 5 (3.4%) |
| 2 or 3 Rooms | 4 (1.1%) | 60 (40.8%) |
| 4 or 5 Rooms | 108 (30.7%) | 49 (33.3%) |
| 6 or 7 Rooms | 103 (29.3%) | 18 (12.2%) |
| 8 or more Rooms | 137 (38.9%) | 15 (10.2%) |
| Total | 352 (100.0%) | 147 (100.0%) |
Housing Structure by Heating Type in Brown City
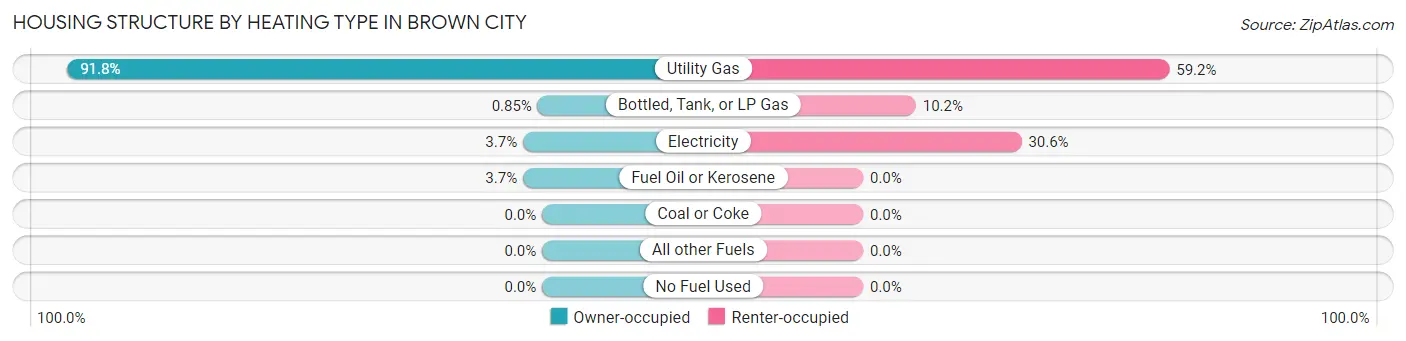
| Heating Type | Owner-occupied | Renter-occupied |
| Utility Gas | 323 (91.8%) | 87 (59.2%) |
| Bottled, Tank, or LP Gas | 3 (0.9%) | 15 (10.2%) |
| Electricity | 13 (3.7%) | 45 (30.6%) |
| Fuel Oil or Kerosene | 13 (3.7%) | 0 (0.0%) |
| Coal or Coke | 0 (0.0%) | 0 (0.0%) |
| All other Fuels | 0 (0.0%) | 0 (0.0%) |
| No Fuel Used | 0 (0.0%) | 0 (0.0%) |
| Total | 352 (100.0%) | 147 (100.0%) |
Household Vehicle Usage in Brown City
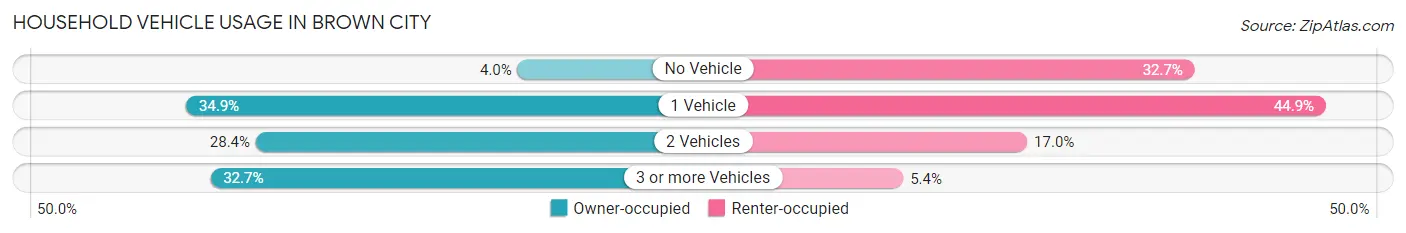
| Vehicles per Household | Owner-occupied | Renter-occupied |
| No Vehicle | 14 (4.0%) | 48 (32.7%) |
| 1 Vehicle | 123 (34.9%) | 66 (44.9%) |
| 2 Vehicles | 100 (28.4%) | 25 (17.0%) |
| 3 or more Vehicles | 115 (32.7%) | 8 (5.4%) |
| Total | 352 (100.0%) | 147 (100.0%) |
Real Estate & Mortgages in Brown City
Real Estate and Mortgage Overview in Brown City
| Characteristic | Without Mortgage | With Mortgage |
| Housing Units | 128 | 224 |
| Median Property Value | $86,700 | $124,500 |
| Median Household Income | $37,500 | $27 |
| Monthly Housing Costs | $393 | $0 |
| Real Estate Taxes | $926 | $48 |
Property Value by Mortgage Status in Brown City
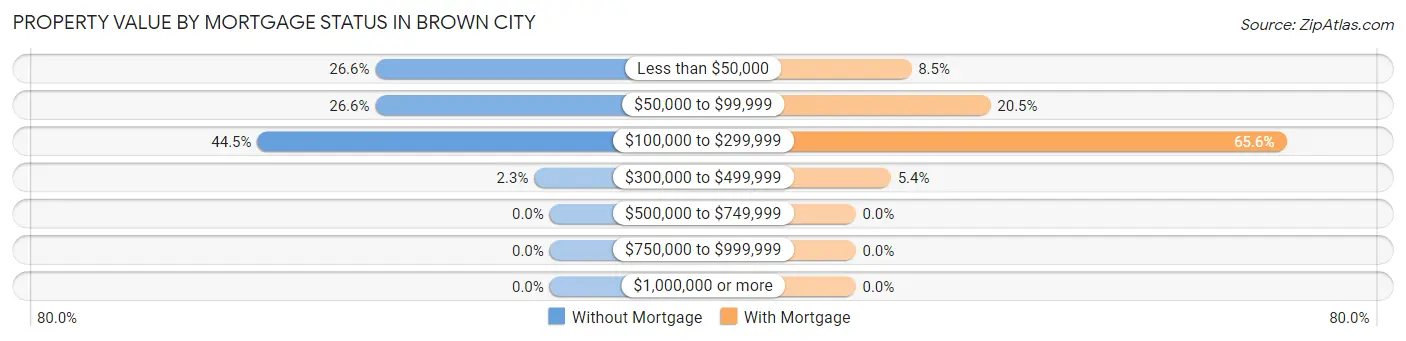
| Property Value | Without Mortgage | With Mortgage |
| Less than $50,000 | 34 (26.6%) | 19 (8.5%) |
| $50,000 to $99,999 | 34 (26.6%) | 46 (20.5%) |
| $100,000 to $299,999 | 57 (44.5%) | 147 (65.6%) |
| $300,000 to $499,999 | 3 (2.3%) | 12 (5.4%) |
| $500,000 to $749,999 | 0 (0.0%) | 0 (0.0%) |
| $750,000 to $999,999 | 0 (0.0%) | 0 (0.0%) |
| $1,000,000 or more | 0 (0.0%) | 0 (0.0%) |
| Total | 128 (100.0%) | 224 (100.0%) |
Household Income by Mortgage Status in Brown City
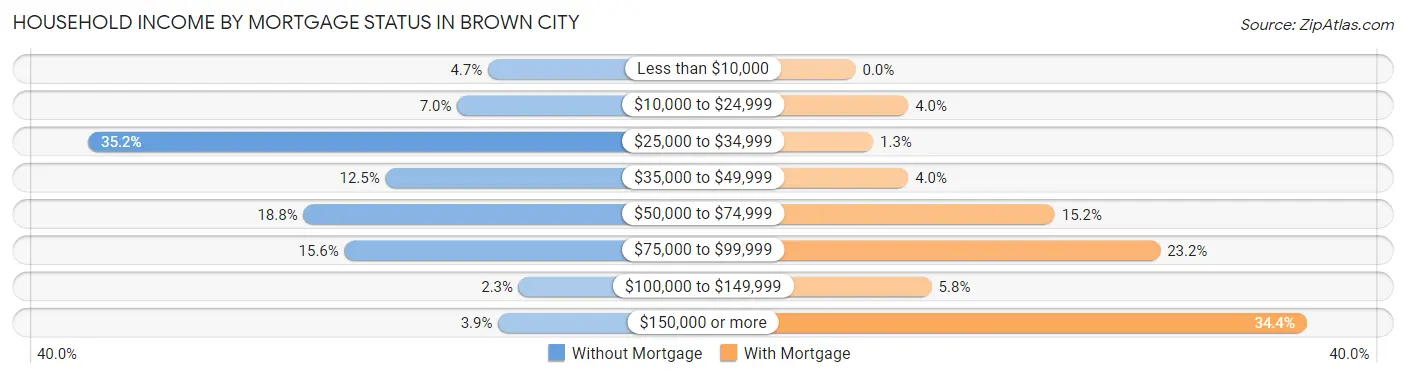
| Household Income | Without Mortgage | With Mortgage |
| Less than $10,000 | 6 (4.7%) | 0 (0.0%) |
| $10,000 to $24,999 | 9 (7.0%) | 9 (4.0%) |
| $25,000 to $34,999 | 45 (35.2%) | 3 (1.3%) |
| $35,000 to $49,999 | 16 (12.5%) | 9 (4.0%) |
| $50,000 to $74,999 | 24 (18.8%) | 34 (15.2%) |
| $75,000 to $99,999 | 20 (15.6%) | 52 (23.2%) |
| $100,000 to $149,999 | 3 (2.3%) | 13 (5.8%) |
| $150,000 or more | 5 (3.9%) | 77 (34.4%) |
| Total | 128 (100.0%) | 224 (100.0%) |
Property Value to Household Income Ratio in Brown City
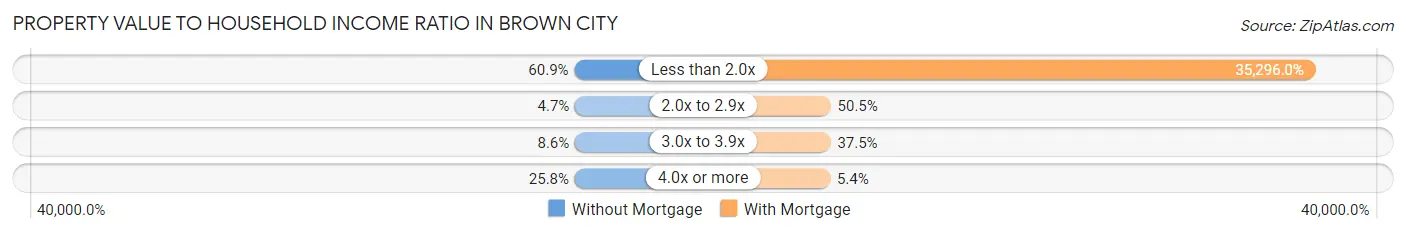
| Value-to-Income Ratio | Without Mortgage | With Mortgage |
| Less than 2.0x | 78 (60.9%) | 79,063 (35,296.0%) |
| 2.0x to 2.9x | 6 (4.7%) | 113 (50.4%) |
| 3.0x to 3.9x | 11 (8.6%) | 84 (37.5%) |
| 4.0x or more | 33 (25.8%) | 12 (5.4%) |
| Total | 128 (100.0%) | 224 (100.0%) |
Real Estate Taxes by Mortgage Status in Brown City
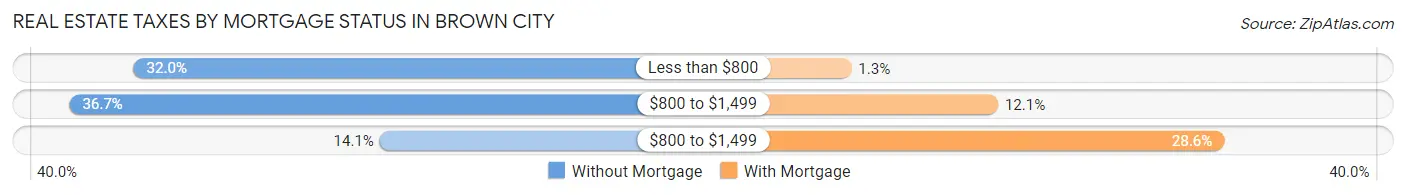
| Property Taxes | Without Mortgage | With Mortgage |
| Less than $800 | 41 (32.0%) | 3 (1.3%) |
| $800 to $1,499 | 47 (36.7%) | 27 (12.0%) |
| $800 to $1,499 | 18 (14.1%) | 64 (28.6%) |
| Total | 128 (100.0%) | 224 (100.0%) |
Health & Disability in Brown City
Health Insurance Coverage by Age in Brown City
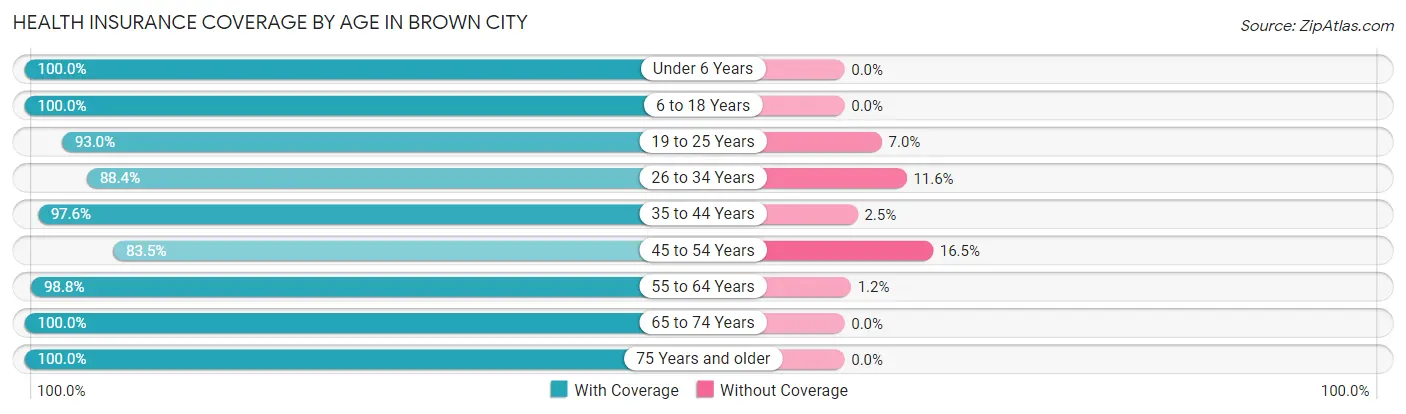
| Age Bracket | With Coverage | Without Coverage |
| Under 6 Years | 44 (100.0%) | 0 (0.0%) |
| 6 to 18 Years | 167 (100.0%) | 0 (0.0%) |
| 19 to 25 Years | 107 (93.0%) | 8 (7.0%) |
| 26 to 34 Years | 61 (88.4%) | 8 (11.6%) |
| 35 to 44 Years | 159 (97.6%) | 4 (2.5%) |
| 45 to 54 Years | 86 (83.5%) | 17 (16.5%) |
| 55 to 64 Years | 247 (98.8%) | 3 (1.2%) |
| 65 to 74 Years | 136 (100.0%) | 0 (0.0%) |
| 75 Years and older | 84 (100.0%) | 0 (0.0%) |
| Total | 1,091 (96.5%) | 40 (3.5%) |
Health Insurance Coverage by Citizenship Status in Brown City
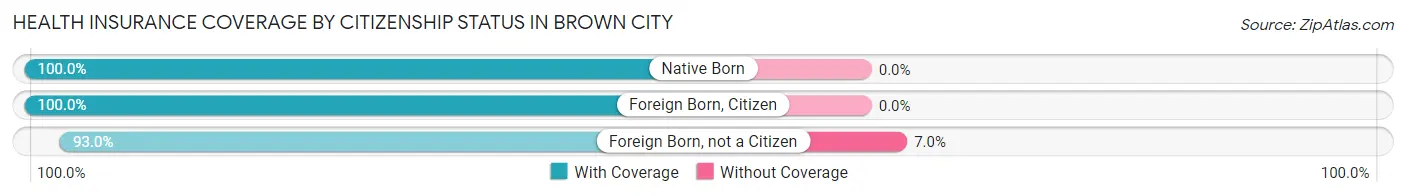
| Citizenship Status | With Coverage | Without Coverage |
| Native Born | 44 (100.0%) | 0 (0.0%) |
| Foreign Born, Citizen | 167 (100.0%) | 0 (0.0%) |
| Foreign Born, not a Citizen | 107 (93.0%) | 8 (7.0%) |
Health Insurance Coverage by Household Income in Brown City
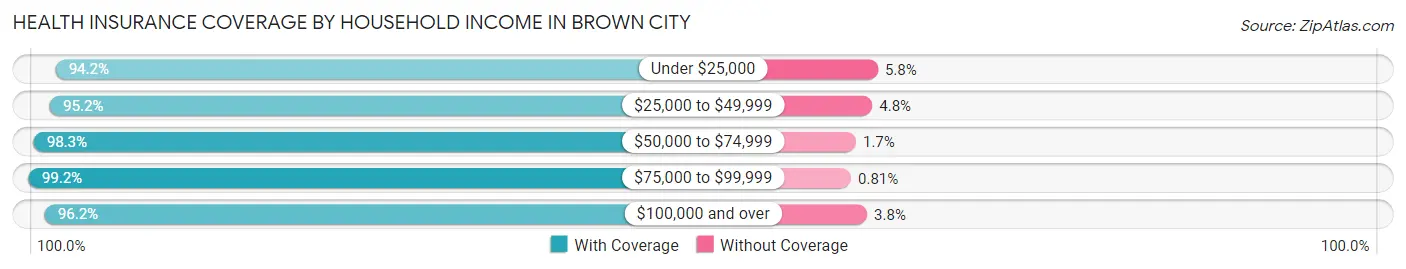
| Household Income | With Coverage | Without Coverage |
| Under $25,000 | 129 (94.2%) | 8 (5.8%) |
| $25,000 to $49,999 | 298 (95.2%) | 15 (4.8%) |
| $50,000 to $74,999 | 227 (98.3%) | 4 (1.7%) |
| $75,000 to $99,999 | 123 (99.2%) | 1 (0.8%) |
| $100,000 and over | 303 (96.2%) | 12 (3.8%) |
Public vs Private Health Insurance Coverage by Age in Brown City
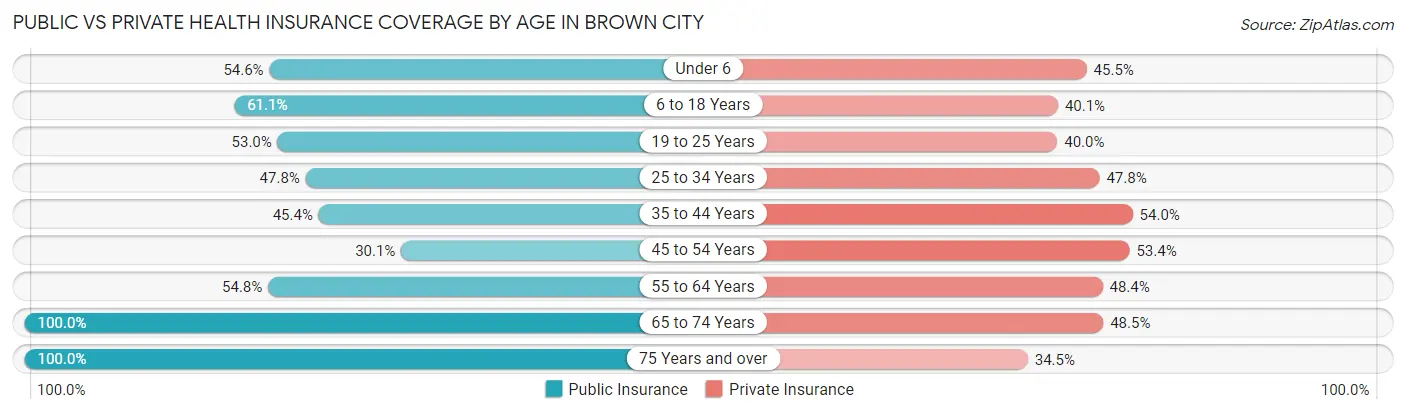
| Age Bracket | Public Insurance | Private Insurance |
| Under 6 | 24 (54.5%) | 20 (45.5%) |
| 6 to 18 Years | 102 (61.1%) | 67 (40.1%) |
| 19 to 25 Years | 61 (53.0%) | 46 (40.0%) |
| 25 to 34 Years | 33 (47.8%) | 33 (47.8%) |
| 35 to 44 Years | 74 (45.4%) | 88 (54.0%) |
| 45 to 54 Years | 31 (30.1%) | 55 (53.4%) |
| 55 to 64 Years | 137 (54.8%) | 121 (48.4%) |
| 65 to 74 Years | 136 (100.0%) | 66 (48.5%) |
| 75 Years and over | 84 (100.0%) | 29 (34.5%) |
| Total | 682 (60.3%) | 525 (46.4%) |
Disability Status by Sex by Age in Brown City
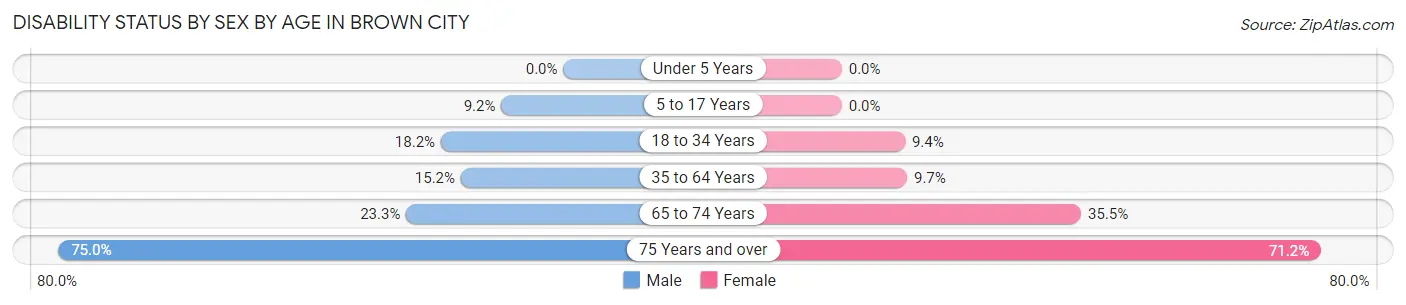
| Age Bracket | Male | Female |
| Under 5 Years | 0 (0.0%) | 0 (0.0%) |
| 5 to 17 Years | 7 (9.2%) | 0 (0.0%) |
| 18 to 34 Years | 12 (18.2%) | 12 (9.4%) |
| 35 to 64 Years | 44 (15.2%) | 22 (9.7%) |
| 65 to 74 Years | 14 (23.3%) | 27 (35.5%) |
| 75 Years and over | 24 (75.0%) | 37 (71.2%) |
Disability Class by Sex by Age in Brown City
Disability Class: Hearing Difficulty
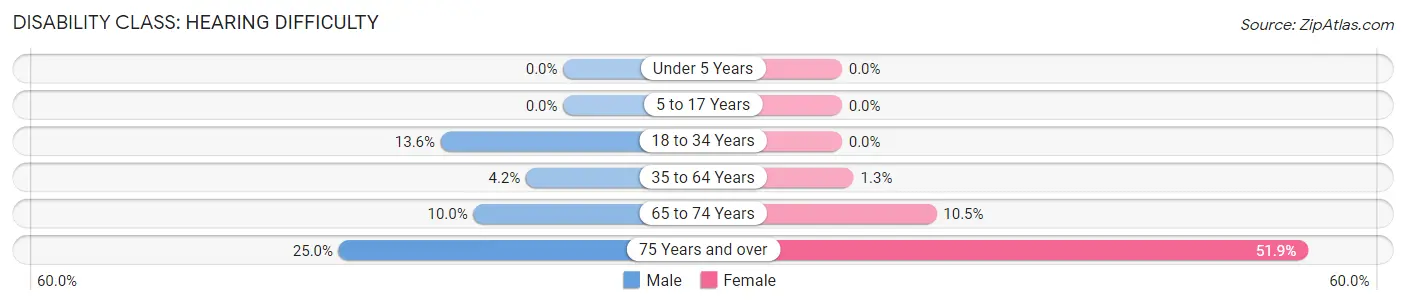
| Age Bracket | Male | Female |
| Under 5 Years | 0 (0.0%) | 0 (0.0%) |
| 5 to 17 Years | 0 (0.0%) | 0 (0.0%) |
| 18 to 34 Years | 9 (13.6%) | 0 (0.0%) |
| 35 to 64 Years | 12 (4.2%) | 3 (1.3%) |
| 65 to 74 Years | 6 (10.0%) | 8 (10.5%) |
| 75 Years and over | 8 (25.0%) | 27 (51.9%) |
Disability Class: Vision Difficulty

| Age Bracket | Male | Female |
| Under 5 Years | 0 (0.0%) | 0 (0.0%) |
| 5 to 17 Years | 0 (0.0%) | 0 (0.0%) |
| 18 to 34 Years | 0 (0.0%) | 0 (0.0%) |
| 35 to 64 Years | 9 (3.1%) | 6 (2.6%) |
| 65 to 74 Years | 2 (3.3%) | 3 (4.0%) |
| 75 Years and over | 9 (28.1%) | 0 (0.0%) |
Disability Class: Cognitive Difficulty
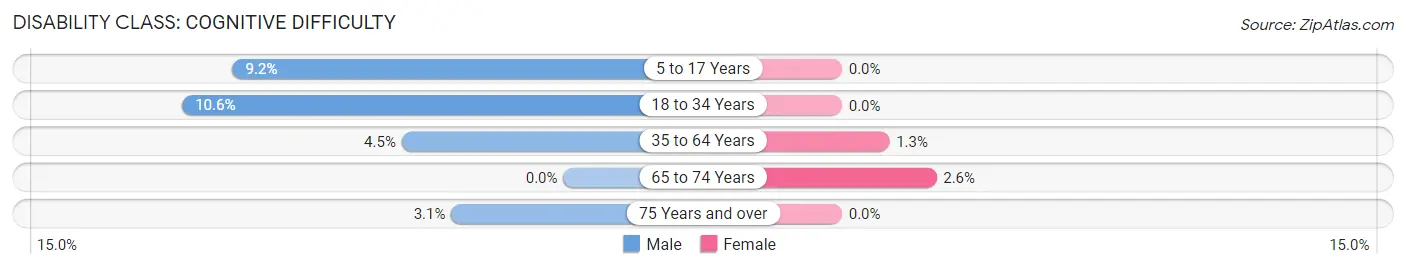
| Age Bracket | Male | Female |
| 5 to 17 Years | 7 (9.2%) | 0 (0.0%) |
| 18 to 34 Years | 7 (10.6%) | 0 (0.0%) |
| 35 to 64 Years | 13 (4.5%) | 3 (1.3%) |
| 65 to 74 Years | 0 (0.0%) | 2 (2.6%) |
| 75 Years and over | 1 (3.1%) | 0 (0.0%) |
Disability Class: Ambulatory Difficulty
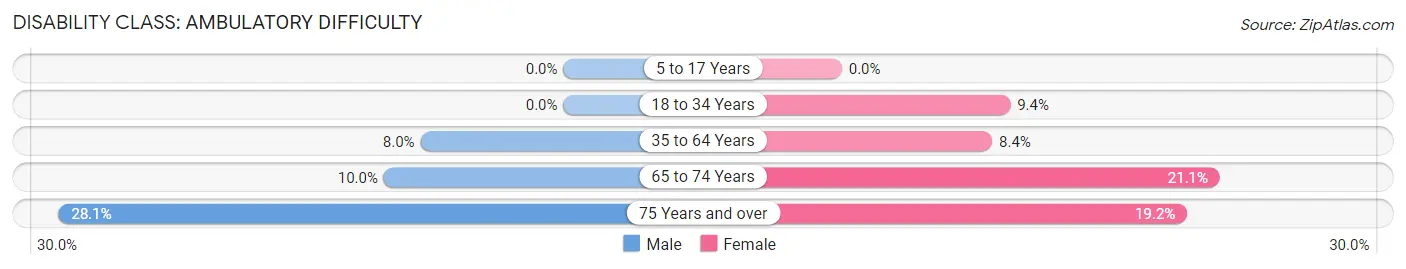
| Age Bracket | Male | Female |
| 5 to 17 Years | 0 (0.0%) | 0 (0.0%) |
| 18 to 34 Years | 0 (0.0%) | 12 (9.4%) |
| 35 to 64 Years | 23 (8.0%) | 19 (8.4%) |
| 65 to 74 Years | 6 (10.0%) | 16 (21.0%) |
| 75 Years and over | 9 (28.1%) | 10 (19.2%) |
Disability Class: Self-Care Difficulty
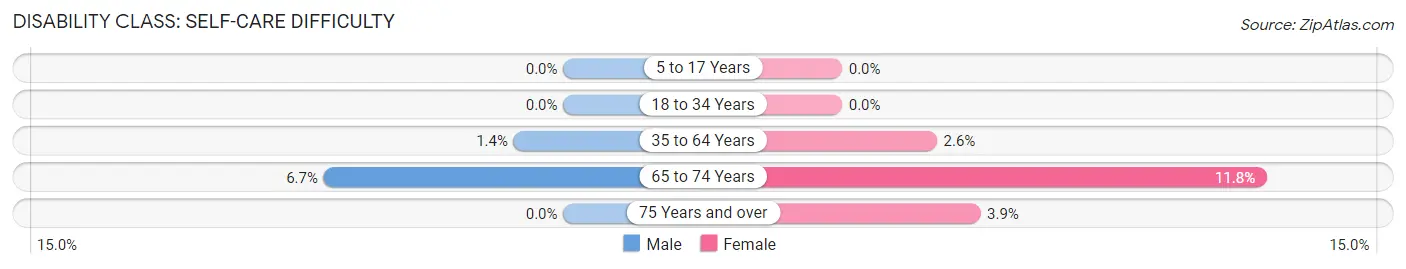
| Age Bracket | Male | Female |
| 5 to 17 Years | 0 (0.0%) | 0 (0.0%) |
| 18 to 34 Years | 0 (0.0%) | 0 (0.0%) |
| 35 to 64 Years | 4 (1.4%) | 6 (2.6%) |
| 65 to 74 Years | 4 (6.7%) | 9 (11.8%) |
| 75 Years and over | 0 (0.0%) | 2 (3.8%) |
Technology Access in Brown City
Computing Device Access in Brown City
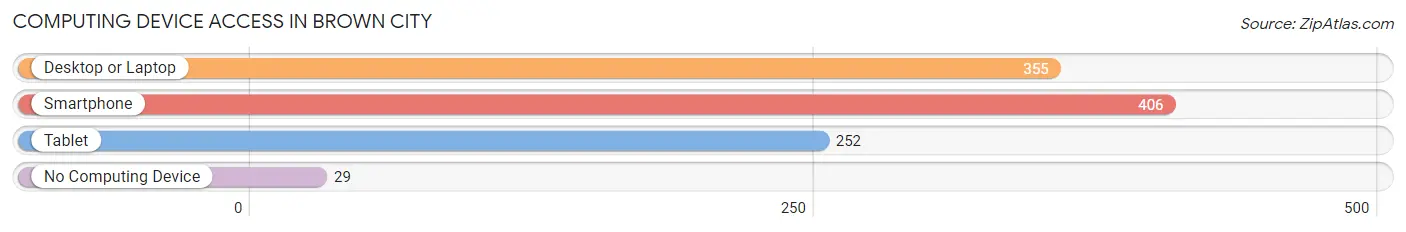
| Device Type | # Households | % Households |
| Desktop or Laptop | 355 | 71.1% |
| Smartphone | 406 | 81.4% |
| Tablet | 252 | 50.5% |
| No Computing Device | 29 | 5.8% |
| Total | 499 | 100.0% |
Internet Access in Brown City
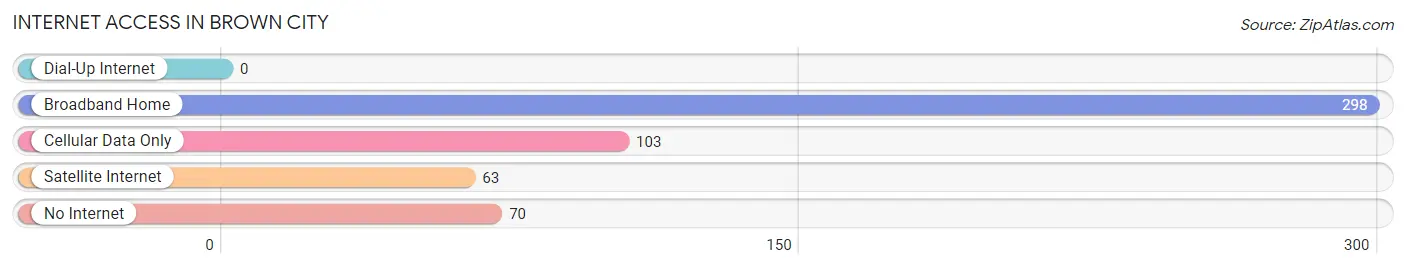
| Internet Type | # Households | % Households |
| Dial-Up Internet | 0 | 0.0% |
| Broadband Home | 298 | 59.7% |
| Cellular Data Only | 103 | 20.6% |
| Satellite Internet | 63 | 12.6% |
| No Internet | 70 | 14.0% |
| Total | 499 | 100.0% |
Brown City Summary
Brown City is a small city located in Sanilac County, Michigan. It is situated on the banks of the Black River, approximately 40 miles north of Detroit. The city has a population of 1,817 as of the 2010 census.
History
Brown City was founded in 1871 by William Brown, a lumberman from Canada. He purchased the land from the government and began to develop the area. The first post office was established in 1872 and the village was incorporated in 1887.
The city was named after William Brown, who was the first mayor. The city grew rapidly in the late 19th century due to the lumber industry. The city was also known for its brickyards, which produced bricks for many of the buildings in the area.
In the early 20th century, the city began to decline due to the decline of the lumber industry. The city was also affected by the Great Depression and World War II. The city began to recover in the 1950s and 1960s with the development of the automotive industry.
Geography
Brown City is located in Sanilac County, Michigan. It is situated on the banks of the Black River, approximately 40 miles north of Detroit. The city has a total area of 1.3 square miles, all of which is land.
The city is located in the Thumb region of Michigan, which is known for its agricultural production. The city is surrounded by farmland and is home to several small lakes.
Economy
The economy of Brown City is largely based on agriculture and manufacturing. The city is home to several small businesses, including a lumber mill, a brickyard, and a dairy farm. The city is also home to several automotive parts suppliers.
The city is also home to several small retail stores, restaurants, and other businesses. The city is also home to a small airport, which serves the surrounding area.
Demographics
As of the 2010 census, the population of Brown City was 1,817. The racial makeup of the city was 95.3% White, 0.7% African American, 0.3% Native American, 0.3% Asian, 0.1% Pacific Islander, 1.2% from other races, and 2.3% from two or more races. Hispanic or Latino of any race were 3.2% of the population.
The median income for a household in the city was $37,917, and the median income for a family was $45,000. The per capita income for the city was $18,945. About 11.2% of families and 14.2% of the population were below the poverty line, including 19.2% of those under age 18 and 8.3% of those age 65 or over.
Conclusion
Brown City is a small city located in Sanilac County, Michigan. It is situated on the banks of the Black River, approximately 40 miles north of Detroit. The city has a population of 1,817 as of the 2010 census. The economy of Brown City is largely based on agriculture and manufacturing. The racial makeup of the city was 95.3% White, 0.7% African American, 0.3% Native American, 0.3% Asian, 0.1% Pacific Islander, 1.2% from other races, and 2.3% from two or more races. The median income for a household in the city was $37,917, and the median income for a family was $45,000. Brown City is a small city with a rich history and a diverse economy.
Common Questions
What is Per Capita Income in Brown City?
Per Capita income in Brown City is $29,813.
What is the Median Family Income in Brown City?
Median Family Income in Brown City is $59,511.
What is the Median Household income in Brown City?
Median Household Income in Brown City is $49,345.
What is Income or Wage Gap in Brown City?
Income or Wage Gap in Brown City is 50.2%.
Women in Brown City earn 49.8 cents for every dollar earned by a man.
What is Inequality or Gini Index in Brown City?
Inequality or Gini Index in Brown City is 0.46.
What is the Total Population of Brown City?
Total Population of Brown City is 1,131.
What is the Total Male Population of Brown City?
Total Male Population of Brown City is 542.
What is the Total Female Population of Brown City?
Total Female Population of Brown City is 589.
What is the Ratio of Males per 100 Females in Brown City?
There are 92.02 Males per 100 Females in Brown City.
What is the Ratio of Females per 100 Males in Brown City?
There are 108.67 Females per 100 Males in Brown City.
What is the Median Population Age in Brown City?
Median Population Age in Brown City is 46.1 Years.
What is the Average Family Size in Brown City
Average Family Size in Brown City is 2.7 People.
What is the Average Household Size in Brown City
Average Household Size in Brown City is 2.2 People.
How Large is the Labor Force in Brown City?
There are 504 People in the Labor Forcein in Brown City.
What is the Percentage of People in the Labor Force in Brown City?
52.8% of People are in the Labor Force in Brown City.
What is the Unemployment Rate in Brown City?
Unemployment Rate in Brown City is 13.3%.