Zip Codes with the Highest Percentage of Population Employed in Arts, Entertainment & Recreation in Brighton, MI
RELATED REPORTS & OPTIONS
Arts, Entertainment & Recreation
Brighton
Compare Zip Codes
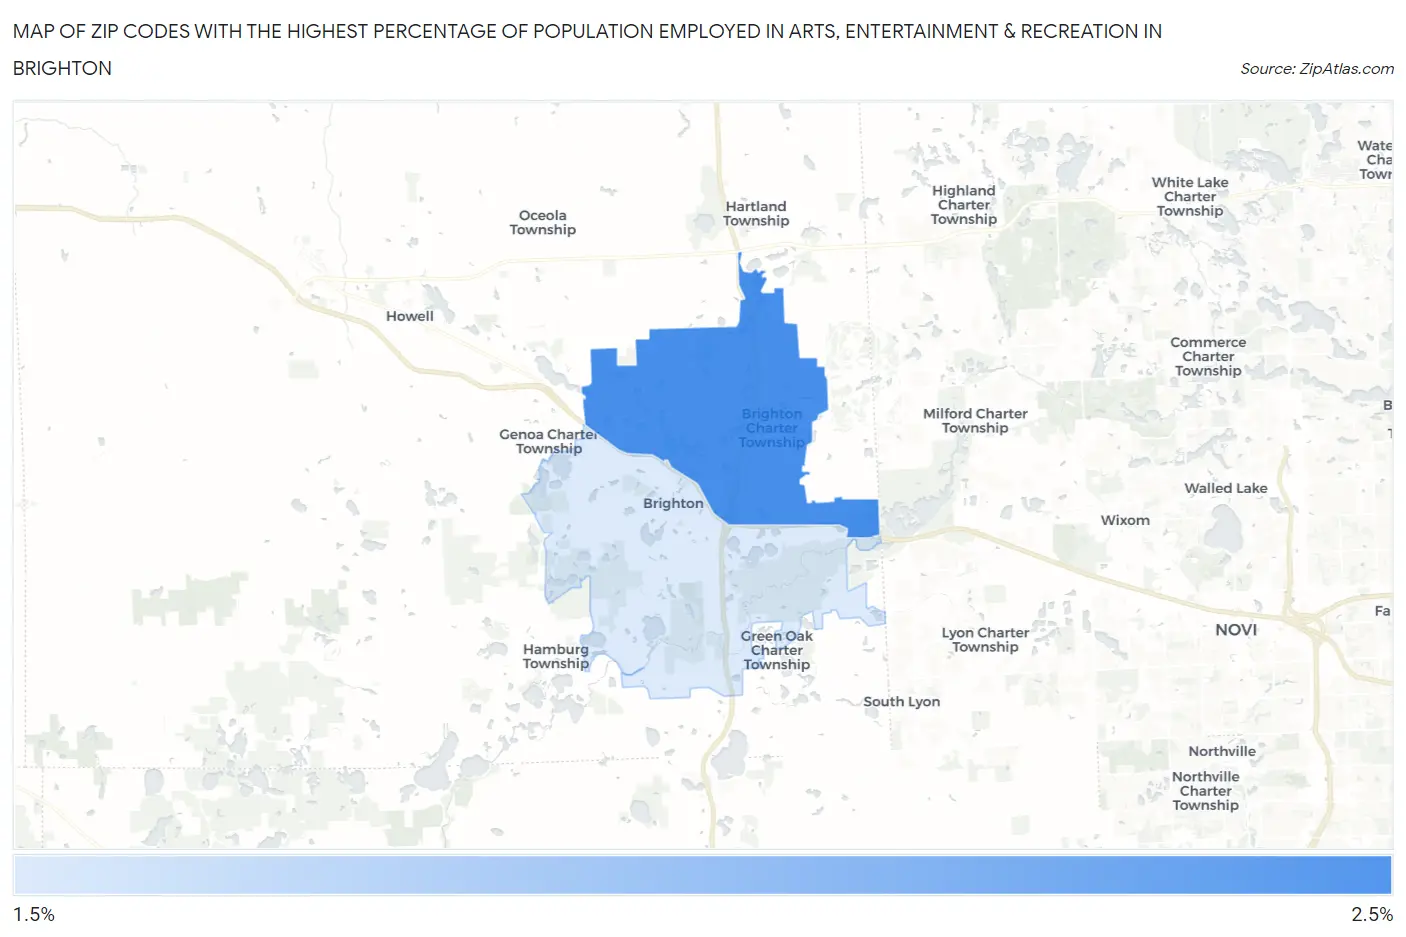
Map of Zip Codes with the Highest Percentage of Population Employed in Arts, Entertainment & Recreation in Brighton
0.0%
2.5%
Zip Codes with the Highest Percentage of Population Employed in Arts, Entertainment & Recreation in Brighton, MI
| Zip Code | % Employed | vs State | vs National | |
| 1. | 48114 | 2.1% | 1.8%(+0.283)#290 | 2.1%(-0.013)#9,370 |
| 2. | 48116 | 1.6% | 1.8%(-0.169)#427 | 2.1%(-0.465)#12,321 |
1
Common Questions
What are the Top Zip Codes with the Highest Percentage of Population Employed in Arts, Entertainment & Recreation in Brighton, MI?
Top Zip Codes with the Highest Percentage of Population Employed in Arts, Entertainment & Recreation in Brighton, MI are:
What zip code has the Highest Percentage of Population Employed in Arts, Entertainment & Recreation in Brighton, MI?
48114 has the Highest Percentage of Population Employed in Arts, Entertainment & Recreation in Brighton, MI with 2.1%.
What is the Percentage of Population Employed in Arts, Entertainment & Recreation in Brighton, MI?
Percentage of Population Employed in Arts, Entertainment & Recreation in Brighton is 2.1%.
What is the Percentage of Population Employed in Arts, Entertainment & Recreation in Michigan?
Percentage of Population Employed in Arts, Entertainment & Recreation in Michigan is 1.8%.
What is the Percentage of Population Employed in Arts, Entertainment & Recreation in the United States?
Percentage of Population Employed in Arts, Entertainment & Recreation in the United States is 2.1%.