Zip Codes with the Highest Percentage of Population Employed in Arts, Entertainment & Recreation in Northville, MI
RELATED REPORTS & OPTIONS
Arts, Entertainment & Recreation
Northville
Compare Zip Codes
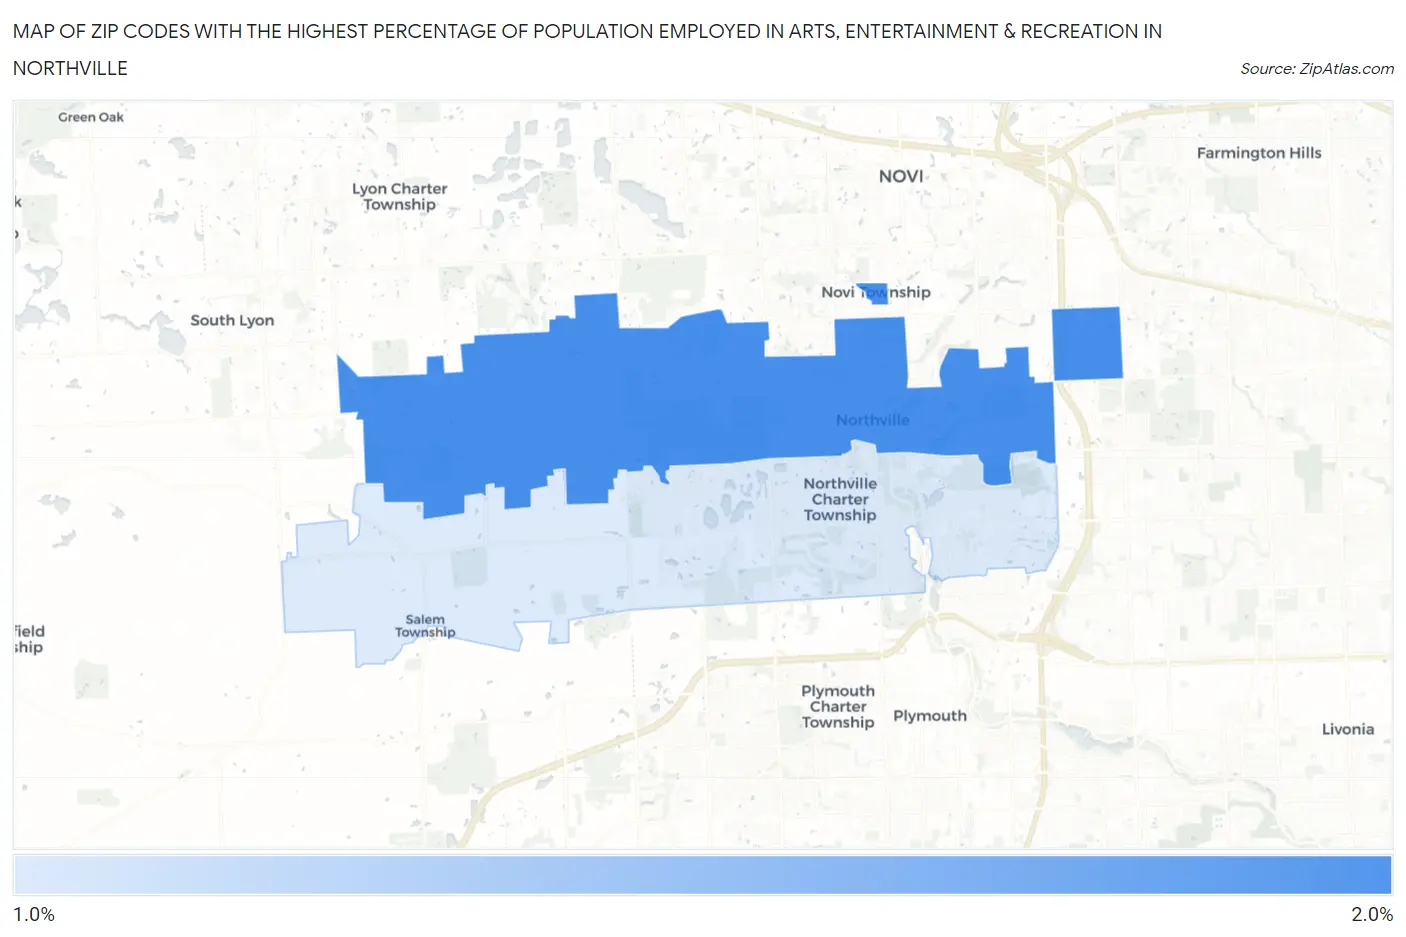
Map of Zip Codes with the Highest Percentage of Population Employed in Arts, Entertainment & Recreation in Northville
1.1%
1.8%
Zip Codes with the Highest Percentage of Population Employed in Arts, Entertainment & Recreation in Northville, MI
| Zip Code | % Employed | vs State | vs National | |
| 1. | 48167 | 1.8% | 1.8%(-0.014)#370 | 2.1%(-0.310)#11,212 |
| 2. | 48168 | 1.1% | 1.8%(-0.641)#575 | 2.1%(-0.937)#15,899 |
1
Common Questions
What are the Top Zip Codes with the Highest Percentage of Population Employed in Arts, Entertainment & Recreation in Northville, MI?
Top Zip Codes with the Highest Percentage of Population Employed in Arts, Entertainment & Recreation in Northville, MI are:
What zip code has the Highest Percentage of Population Employed in Arts, Entertainment & Recreation in Northville, MI?
48167 has the Highest Percentage of Population Employed in Arts, Entertainment & Recreation in Northville, MI with 1.8%.
What is the Percentage of Population Employed in Arts, Entertainment & Recreation in Northville, MI?
Percentage of Population Employed in Arts, Entertainment & Recreation in Northville is 1.1%.
What is the Percentage of Population Employed in Arts, Entertainment & Recreation in Michigan?
Percentage of Population Employed in Arts, Entertainment & Recreation in Michigan is 1.8%.
What is the Percentage of Population Employed in Arts, Entertainment & Recreation in the United States?
Percentage of Population Employed in Arts, Entertainment & Recreation in the United States is 2.1%.