Zip Codes with the Highest Percentage of Population Employed in Agriculture, Fishing & Hunting in Brighton, MI
RELATED REPORTS & OPTIONS
Agriculture, Fishing & Hunting
Brighton
Compare Zip Codes
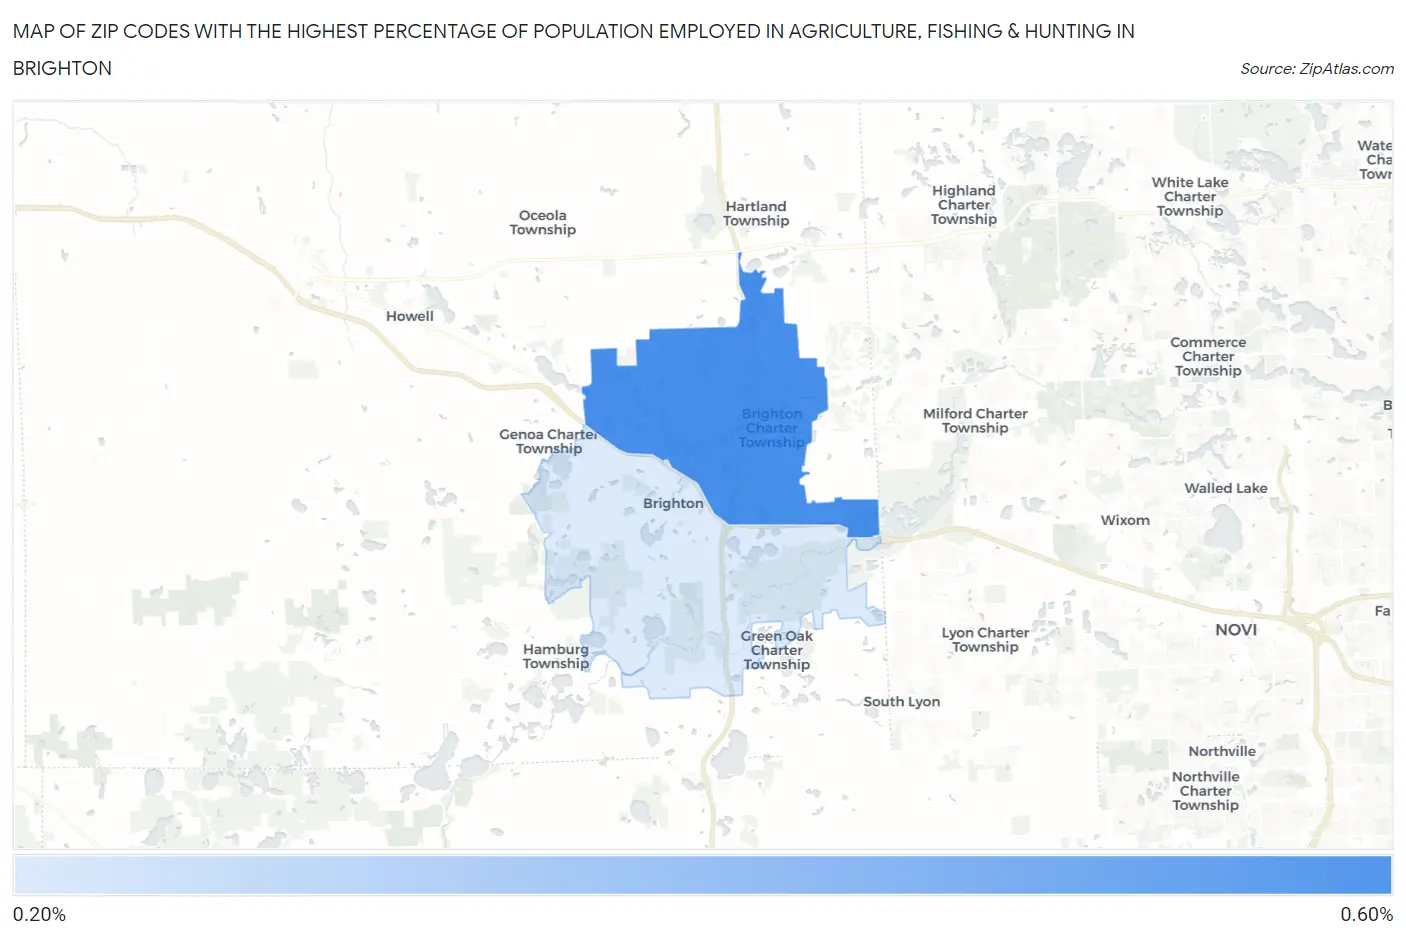
Map of Zip Codes with the Highest Percentage of Population Employed in Agriculture, Fishing & Hunting in Brighton
0.0%
0.60%
Zip Codes with the Highest Percentage of Population Employed in Agriculture, Fishing & Hunting in Brighton, MI
| Zip Code | % Employed | vs State | vs National | |
| 1. | 48114 | 0.57% | 0.98%(-0.411)#621 | 1.2%(-0.627)#18,686 |
| 2. | 48116 | 0.28% | 0.98%(-0.702)#709 | 1.2%(-0.918)#21,396 |
1
Common Questions
What are the Top Zip Codes with the Highest Percentage of Population Employed in Agriculture, Fishing & Hunting in Brighton, MI?
Top Zip Codes with the Highest Percentage of Population Employed in Agriculture, Fishing & Hunting in Brighton, MI are:
What zip code has the Highest Percentage of Population Employed in Agriculture, Fishing & Hunting in Brighton, MI?
48114 has the Highest Percentage of Population Employed in Agriculture, Fishing & Hunting in Brighton, MI with 0.57%.
What is the Percentage of Population Employed in Agriculture, Fishing & Hunting in Brighton, MI?
Percentage of Population Employed in Agriculture, Fishing & Hunting in Brighton is 0.60%.
What is the Percentage of Population Employed in Agriculture, Fishing & Hunting in Michigan?
Percentage of Population Employed in Agriculture, Fishing & Hunting in Michigan is 0.98%.
What is the Percentage of Population Employed in Agriculture, Fishing & Hunting in the United States?
Percentage of Population Employed in Agriculture, Fishing & Hunting in the United States is 1.2%.