Zip Codes with the Highest Percentage of Population Employed in Agriculture, Fishing & Hunting in Howell, MI
RELATED REPORTS & OPTIONS
Agriculture, Fishing & Hunting
Howell
Compare Zip Codes
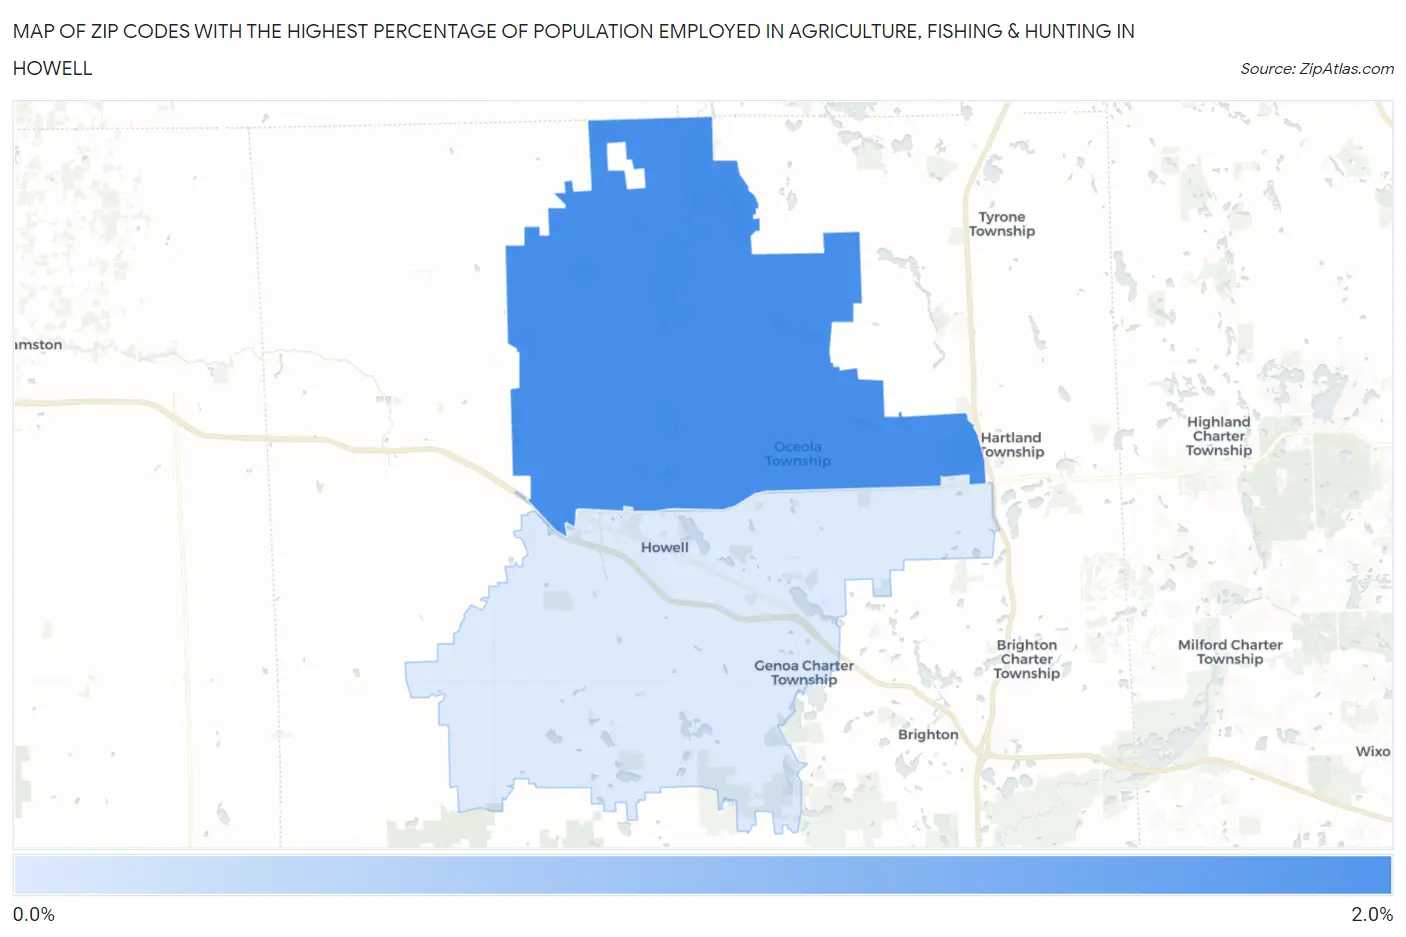
Map of Zip Codes with the Highest Percentage of Population Employed in Agriculture, Fishing & Hunting in Howell
0.33%
2.0%
Zip Codes with the Highest Percentage of Population Employed in Agriculture, Fishing & Hunting in Howell, MI
| Zip Code | % Employed | vs State | vs National | |
| 1. | 48855 | 2.0% | 0.98%(+0.998)#360 | 1.2%(+0.782)#12,813 |
| 2. | 48843 | 0.33% | 0.98%(-0.658)#689 | 1.2%(-0.874)#20,889 |
1
Common Questions
What are the Top Zip Codes with the Highest Percentage of Population Employed in Agriculture, Fishing & Hunting in Howell, MI?
Top Zip Codes with the Highest Percentage of Population Employed in Agriculture, Fishing & Hunting in Howell, MI are:
What zip code has the Highest Percentage of Population Employed in Agriculture, Fishing & Hunting in Howell, MI?
48855 has the Highest Percentage of Population Employed in Agriculture, Fishing & Hunting in Howell, MI with 2.0%.
What is the Percentage of Population Employed in Agriculture, Fishing & Hunting in Howell, MI?
Percentage of Population Employed in Agriculture, Fishing & Hunting in Howell is 0.20%.
What is the Percentage of Population Employed in Agriculture, Fishing & Hunting in Michigan?
Percentage of Population Employed in Agriculture, Fishing & Hunting in Michigan is 0.98%.
What is the Percentage of Population Employed in Agriculture, Fishing & Hunting in the United States?
Percentage of Population Employed in Agriculture, Fishing & Hunting in the United States is 1.2%.