Zip Codes with the Highest Percentage of Population Employed in Installation, Maintenance & Repair in Midland, MI
RELATED REPORTS & OPTIONS
Installation, Maintenance & Repair
Midland
Compare Zip Codes
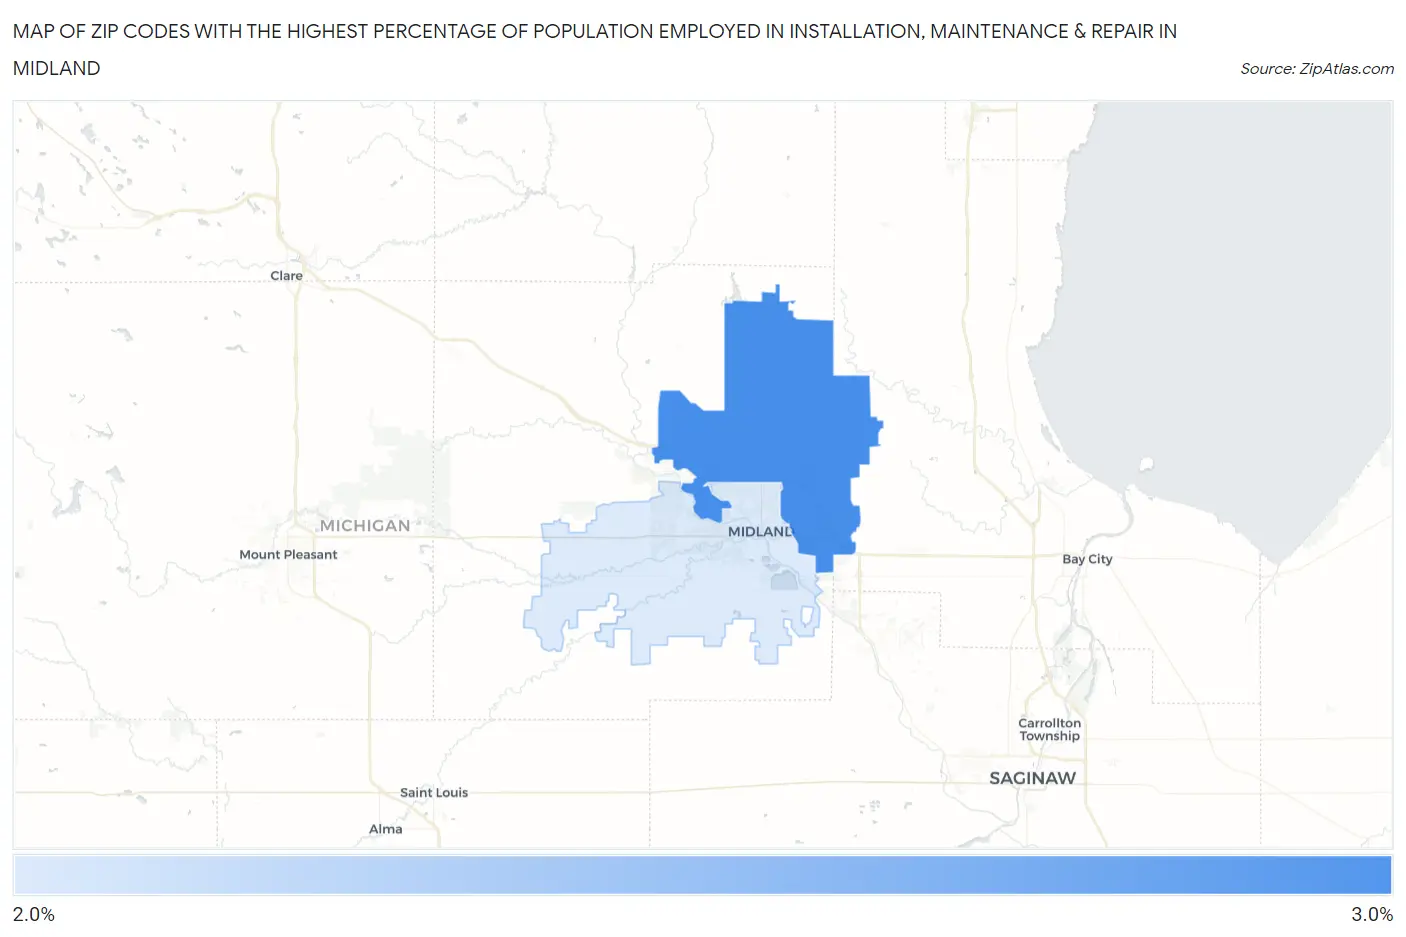
Map of Zip Codes with the Highest Percentage of Population Employed in Installation, Maintenance & Repair in Midland
2.5%
2.8%
Zip Codes with the Highest Percentage of Population Employed in Installation, Maintenance & Repair in Midland, MI
| Zip Code | % Employed | vs State | vs National | |
| 1. | 48642 | 2.8% | 3.1%(-0.300)#643 | 3.1%(-0.268)#18,008 |
| 2. | 48640 | 2.5% | 3.1%(-0.552)#682 | 3.1%(-0.520)#19,320 |
1
Common Questions
What are the Top Zip Codes with the Highest Percentage of Population Employed in Installation, Maintenance & Repair in Midland, MI?
Top Zip Codes with the Highest Percentage of Population Employed in Installation, Maintenance & Repair in Midland, MI are:
What zip code has the Highest Percentage of Population Employed in Installation, Maintenance & Repair in Midland, MI?
48642 has the Highest Percentage of Population Employed in Installation, Maintenance & Repair in Midland, MI with 2.8%.
What is the Percentage of Population Employed in Installation, Maintenance & Repair in Midland, MI?
Percentage of Population Employed in Installation, Maintenance & Repair in Midland is 1.9%.
What is the Percentage of Population Employed in Installation, Maintenance & Repair in Michigan?
Percentage of Population Employed in Installation, Maintenance & Repair in Michigan is 3.1%.
What is the Percentage of Population Employed in Installation, Maintenance & Repair in the United States?
Percentage of Population Employed in Installation, Maintenance & Repair in the United States is 3.1%.