Bridgeport, MI Map & Demographics
Bridgeport Map
Bridgeport Overview
$27,285
PER CAPITA INCOME
$51,042
AVG FAMILY INCOME
$42,719
AVG HOUSEHOLD INCOME
35.7%
WAGE / INCOME GAP [ % ]
64.3¢/ $1
WAGE / INCOME GAP [ $ ]
$9,111
FAMILY INCOME DEFICIT
0.49
INEQUALITY / GINI INDEX
6,495
TOTAL POPULATION
2,838
MALE POPULATION
3,657
FEMALE POPULATION
77.60
MALES / 100 FEMALES
128.86
FEMALES / 100 MALES
37.1
MEDIAN AGE
2.9
AVG FAMILY SIZE
2.4
AVG HOUSEHOLD SIZE
2,482
LABOR FORCE [ PEOPLE ]
48.5%
PERCENT IN LABOR FORCE
5.3%
UNEMPLOYMENT RATE
Bridgeport Zip Codes
Bridgeport Area Codes
Income in Bridgeport
Income Overview in Bridgeport
Per Capita Income in Bridgeport is $27,285, while median incomes of families and households are $51,042 and $42,719 respectively.
| Characteristic | Number | Measure |
| Per Capita Income | 6,495 | $27,285 |
| Median Family Income | 1,684 | $51,042 |
| Mean Family Income | 1,684 | $65,860 |
| Median Household Income | 2,691 | $42,719 |
| Mean Household Income | 2,691 | $64,576 |
| Income Deficit | 1,684 | $9,111 |
| Wage / Income Gap (%) | 6,495 | 35.67% |
| Wage / Income Gap ($) | 6,495 | 64.33¢ per $1 |
| Gini / Inequality Index | 6,495 | 0.49 |
Earnings by Sex in Bridgeport
Average Earnings in Bridgeport are $30,483, $36,616 for men and $23,554 for women, a difference of 35.7%.
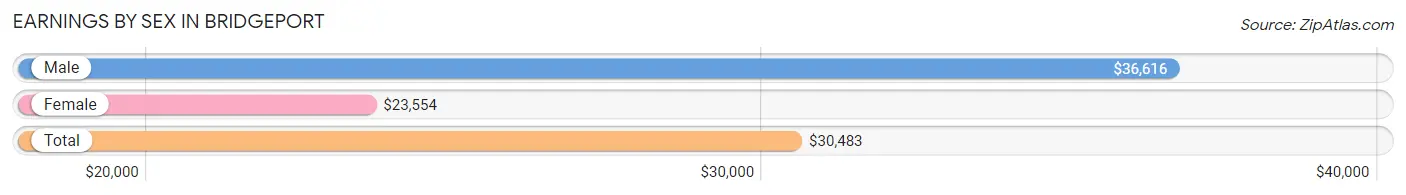
| Sex | Number | Average Earnings |
| Male | 1,187 (43.9%) | $36,616 |
| Female | 1,518 (56.1%) | $23,554 |
| Total | 2,705 (100.0%) | $30,483 |
Earnings by Sex by Income Bracket in Bridgeport
The most common earnings brackets in Bridgeport are $30,000 to $34,999 for men (181 | 15.2%) and $12,500 to $14,999 for women (208 | 13.7%).
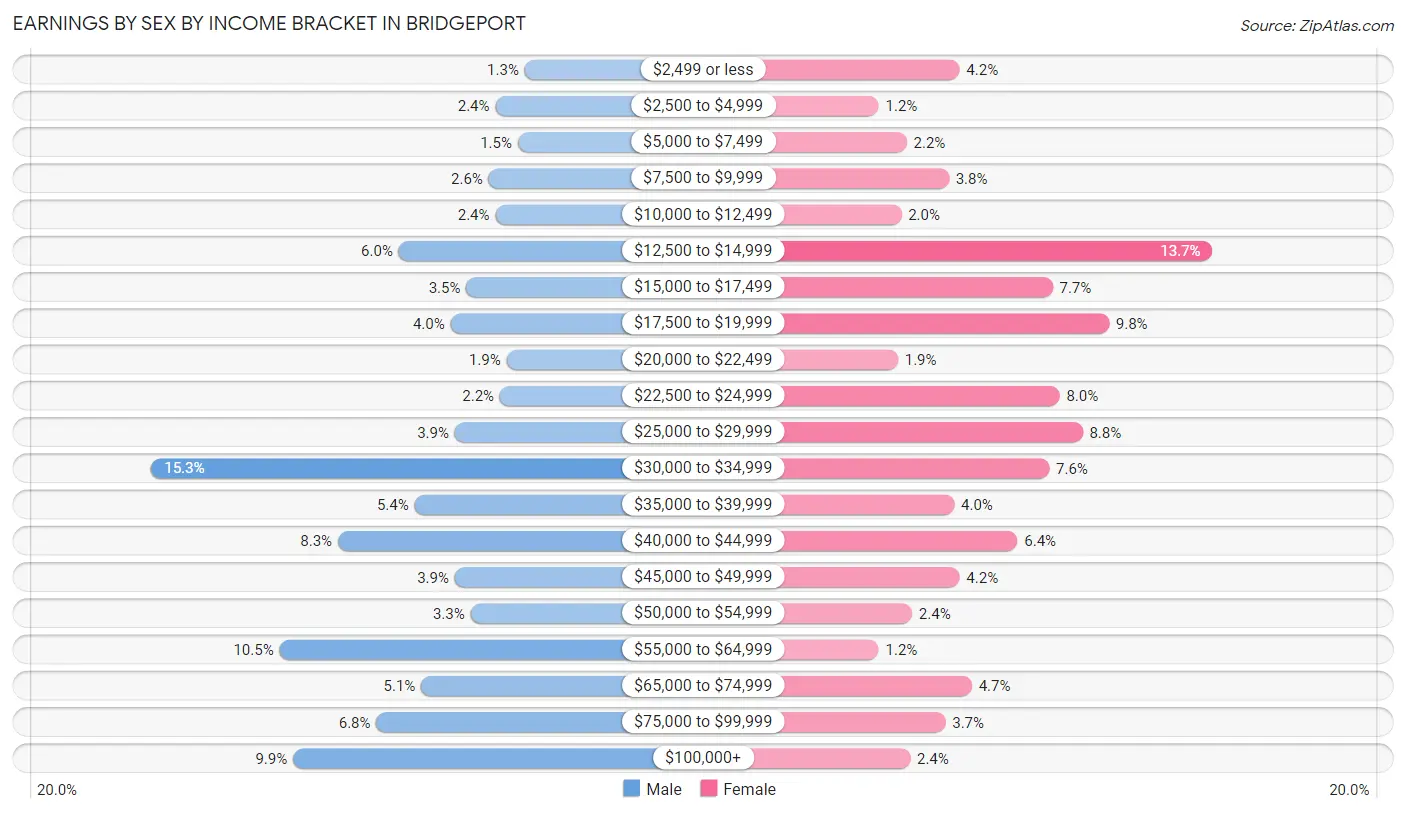
| Income | Male | Female |
| $2,499 or less | 15 (1.3%) | 64 (4.2%) |
| $2,500 to $4,999 | 28 (2.4%) | 18 (1.2%) |
| $5,000 to $7,499 | 18 (1.5%) | 34 (2.2%) |
| $7,500 to $9,999 | 31 (2.6%) | 58 (3.8%) |
| $10,000 to $12,499 | 28 (2.4%) | 31 (2.0%) |
| $12,500 to $14,999 | 71 (6.0%) | 208 (13.7%) |
| $15,000 to $17,499 | 41 (3.5%) | 117 (7.7%) |
| $17,500 to $19,999 | 48 (4.0%) | 149 (9.8%) |
| $20,000 to $22,499 | 23 (1.9%) | 29 (1.9%) |
| $22,500 to $24,999 | 26 (2.2%) | 121 (8.0%) |
| $25,000 to $29,999 | 46 (3.9%) | 134 (8.8%) |
| $30,000 to $34,999 | 181 (15.2%) | 115 (7.6%) |
| $35,000 to $39,999 | 64 (5.4%) | 61 (4.0%) |
| $40,000 to $44,999 | 98 (8.3%) | 97 (6.4%) |
| $45,000 to $49,999 | 46 (3.9%) | 64 (4.2%) |
| $50,000 to $54,999 | 39 (3.3%) | 37 (2.4%) |
| $55,000 to $64,999 | 124 (10.4%) | 18 (1.2%) |
| $65,000 to $74,999 | 61 (5.1%) | 71 (4.7%) |
| $75,000 to $99,999 | 81 (6.8%) | 56 (3.7%) |
| $100,000+ | 118 (9.9%) | 36 (2.4%) |
| Total | 1,187 (100.0%) | 1,518 (100.0%) |
Earnings by Sex by Educational Attainment in Bridgeport
Average earnings in Bridgeport are $42,576 for men and $26,583 for women, a difference of 37.6%. Men with an educational attainment of bachelor's degree enjoy the highest average annual earnings of $61,429, while those with less than high school education earn the least with $33,527. Women with an educational attainment of bachelor's degree earn the most with the average annual earnings of $48,864, while those with high school diploma education have the smallest earnings of $19,551.
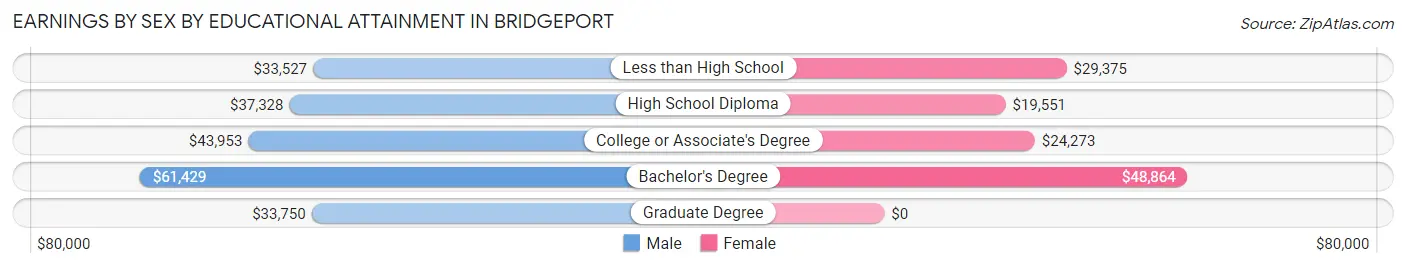
| Educational Attainment | Male Income | Female Income |
| Less than High School | $33,527 | $29,375 |
| High School Diploma | $37,328 | $19,551 |
| College or Associate's Degree | $43,953 | $24,273 |
| Bachelor's Degree | $61,429 | $48,864 |
| Graduate Degree | $33,750 | $0 |
| Total | $42,576 | $26,583 |
Family Income in Bridgeport
Family Income Brackets in Bridgeport
According to the Bridgeport family income data, there are 349 families falling into the $50,000 to $74,999 income range, which is the most common income bracket and makes up 20.7% of all families. Conversely, the $150,000 to $199,999 income bracket is the least frequent group with only 32 families (1.9%) belonging to this category.
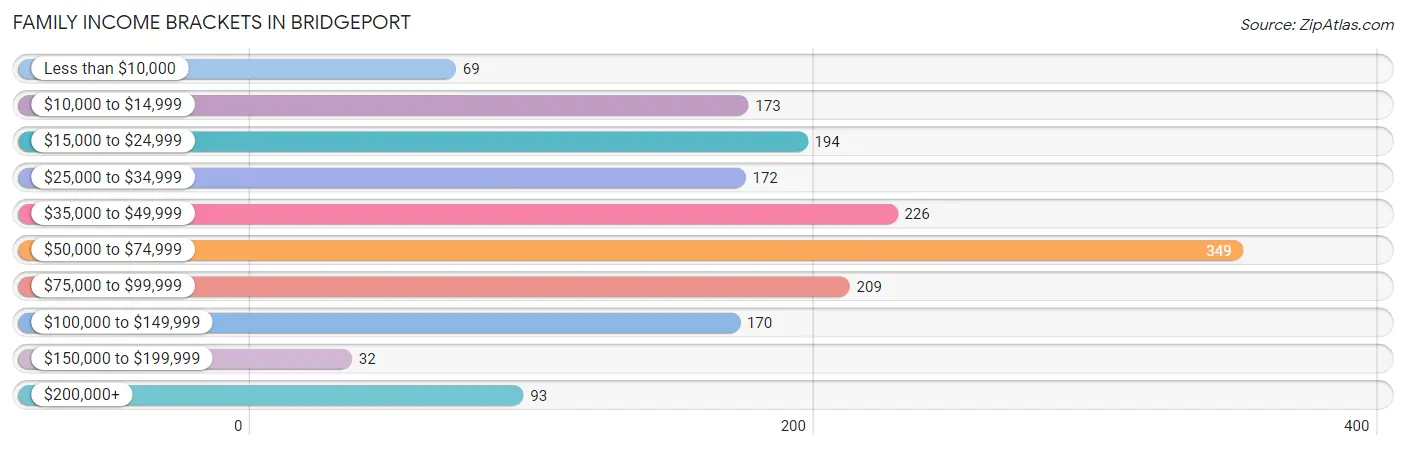
| Income Bracket | # Families | % Families |
| Less than $10,000 | 69 | 4.1% |
| $10,000 to $14,999 | 173 | 10.3% |
| $15,000 to $24,999 | 194 | 11.5% |
| $25,000 to $34,999 | 172 | 10.2% |
| $35,000 to $49,999 | 226 | 13.4% |
| $50,000 to $74,999 | 349 | 20.7% |
| $75,000 to $99,999 | 209 | 12.4% |
| $100,000 to $149,999 | 170 | 10.1% |
| $150,000 to $199,999 | 32 | 1.9% |
| $200,000+ | 93 | 5.5% |
Family Income by Famaliy Size in Bridgeport
4-person families (237 | 14.1%) account for the highest median family income in Bridgeport with $72,625 per family, while 2-person families (724 | 43.0%) have the highest median income of $24,166 per family member.
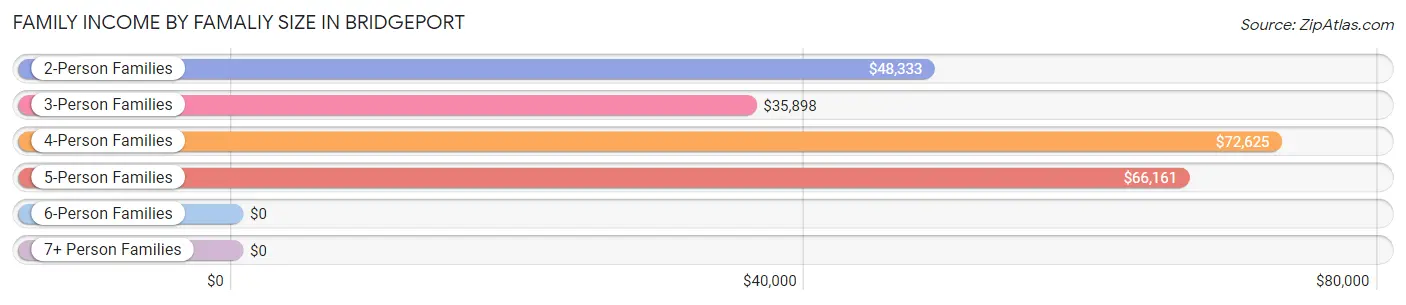
| Income Bracket | # Families | Median Income |
| 2-Person Families | 724 (43.0%) | $48,333 |
| 3-Person Families | 592 (35.1%) | $35,898 |
| 4-Person Families | 237 (14.1%) | $72,625 |
| 5-Person Families | 96 (5.7%) | $66,161 |
| 6-Person Families | 27 (1.6%) | $0 |
| 7+ Person Families | 8 (0.5%) | $0 |
| Total | 1,684 (100.0%) | $51,042 |
Family Income by Number of Earners in Bridgeport
The median family income in Bridgeport is $51,042, with families comprising 3+ earners (90) having the highest median family income of $140,000, while families with 1 earner (751) have the lowest median family income of $33,560, accounting for 5.3% and 44.6% of families, respectively.
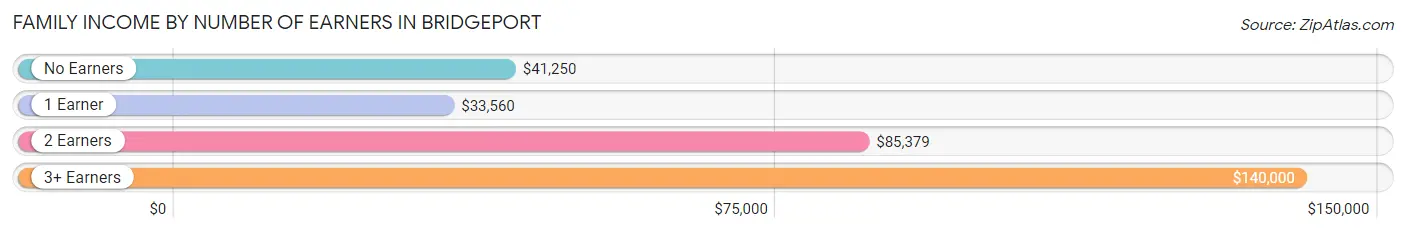
| Number of Earners | # Families | Median Income |
| No Earners | 361 (21.4%) | $41,250 |
| 1 Earner | 751 (44.6%) | $33,560 |
| 2 Earners | 482 (28.6%) | $85,379 |
| 3+ Earners | 90 (5.3%) | $140,000 |
| Total | 1,684 (100.0%) | $51,042 |
Household Income in Bridgeport
Household Income Brackets in Bridgeport
With 616 households falling in the category, the $35,000 to $49,999 income range is the most frequent in Bridgeport, accounting for 22.9% of all households. In contrast, only 43 households (1.6%) fall into the less than $10,000 income bracket, making it the least populous group.
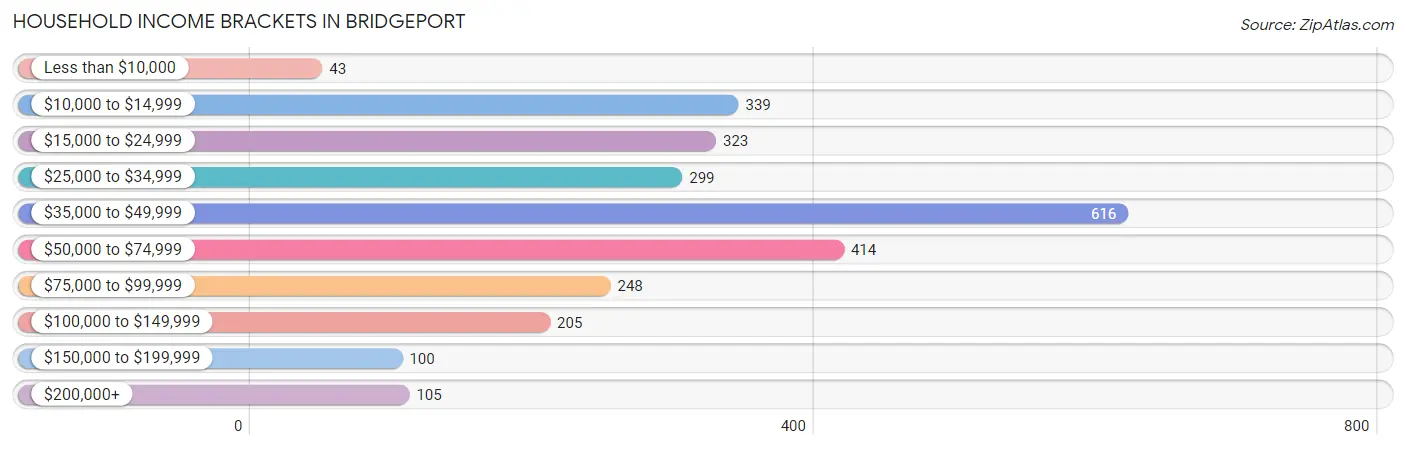
| Income Bracket | # Households | % Households |
| Less than $10,000 | 43 | 1.6% |
| $10,000 to $14,999 | 339 | 12.6% |
| $15,000 to $24,999 | 323 | 12.0% |
| $25,000 to $34,999 | 299 | 11.1% |
| $35,000 to $49,999 | 616 | 22.9% |
| $50,000 to $74,999 | 414 | 15.4% |
| $75,000 to $99,999 | 248 | 9.2% |
| $100,000 to $149,999 | 205 | 7.6% |
| $150,000 to $199,999 | 100 | 3.7% |
| $200,000+ | 105 | 3.9% |
Household Income by Householder Age in Bridgeport
The median household income in Bridgeport is $42,719, with the highest median household income of $62,772 found in the 45 to 64 years age bracket for the primary householder. A total of 797 households (29.6%) fall into this category. Meanwhile, the 25 to 44 years age bracket for the primary householder has the lowest median household income of $36,359, with 895 households (33.3%) in this group.
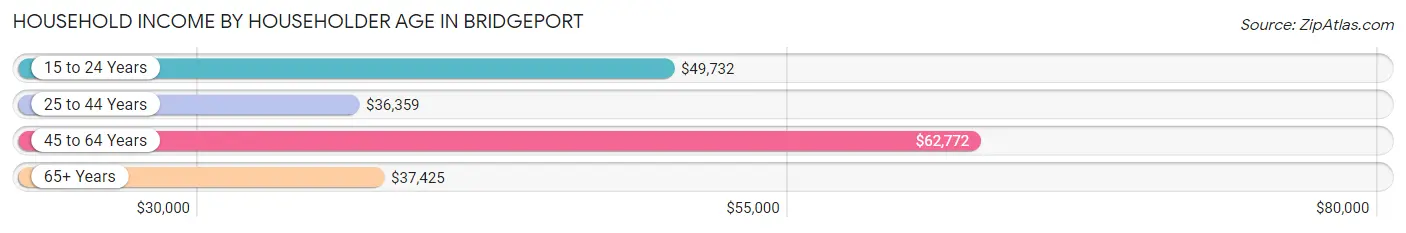
| Income Bracket | # Households | Median Income |
| 15 to 24 Years | 25 (0.9%) | $49,732 |
| 25 to 44 Years | 895 (33.3%) | $36,359 |
| 45 to 64 Years | 797 (29.6%) | $62,772 |
| 65+ Years | 974 (36.2%) | $37,425 |
| Total | 2,691 (100.0%) | $42,719 |
Poverty in Bridgeport
Income Below Poverty by Sex and Age in Bridgeport
With 17.9% poverty level for males and 26.0% for females among the residents of Bridgeport, 35 to 44 year old males and 12 to 14 year old females are the most vulnerable to poverty, with 104 males (45.4%) and 150 females (51.7%) in their respective age groups living below the poverty level.
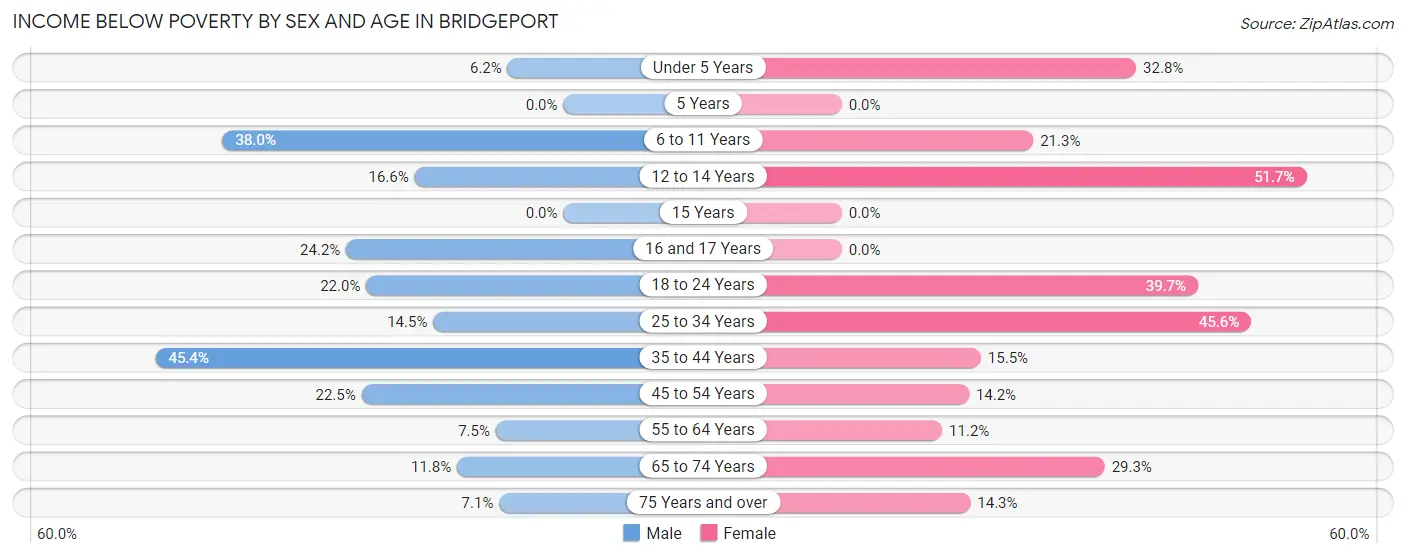
| Age Bracket | Male | Female |
| Under 5 Years | 11 (6.2%) | 59 (32.8%) |
| 5 Years | 0 (0.0%) | 0 (0.0%) |
| 6 to 11 Years | 52 (38.0%) | 71 (21.3%) |
| 12 to 14 Years | 29 (16.6%) | 150 (51.7%) |
| 15 Years | 0 (0.0%) | 0 (0.0%) |
| 16 and 17 Years | 45 (24.2%) | 0 (0.0%) |
| 18 to 24 Years | 45 (22.0%) | 90 (39.7%) |
| 25 to 34 Years | 72 (14.5%) | 268 (45.6%) |
| 35 to 44 Years | 104 (45.4%) | 57 (15.5%) |
| 45 to 54 Years | 60 (22.5%) | 50 (14.2%) |
| 55 to 64 Years | 24 (7.5%) | 52 (11.2%) |
| 65 to 74 Years | 45 (11.8%) | 89 (29.3%) |
| 75 Years and over | 15 (7.1%) | 54 (14.3%) |
| Total | 502 (17.9%) | 940 (26.0%) |
Income Above Poverty by Sex and Age in Bridgeport
According to the poverty statistics in Bridgeport, males aged 15 years and females aged 5 years are the age groups that are most secure financially, with 100.0% of males and 100.0% of females in these age groups living above the poverty line.
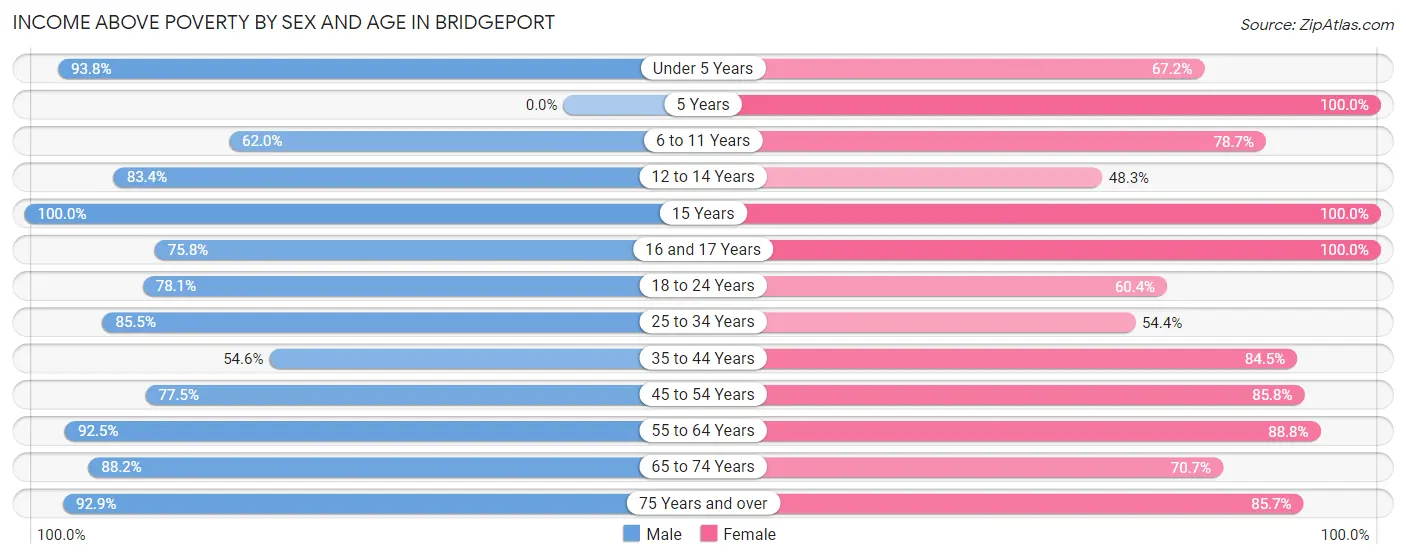
| Age Bracket | Male | Female |
| Under 5 Years | 166 (93.8%) | 121 (67.2%) |
| 5 Years | 0 (0.0%) | 34 (100.0%) |
| 6 to 11 Years | 85 (62.0%) | 262 (78.7%) |
| 12 to 14 Years | 146 (83.4%) | 140 (48.3%) |
| 15 Years | 28 (100.0%) | 23 (100.0%) |
| 16 and 17 Years | 141 (75.8%) | 69 (100.0%) |
| 18 to 24 Years | 160 (78.0%) | 137 (60.4%) |
| 25 to 34 Years | 425 (85.5%) | 320 (54.4%) |
| 35 to 44 Years | 125 (54.6%) | 311 (84.5%) |
| 45 to 54 Years | 207 (77.5%) | 303 (85.8%) |
| 55 to 64 Years | 295 (92.5%) | 413 (88.8%) |
| 65 to 74 Years | 335 (88.2%) | 215 (70.7%) |
| 75 Years and over | 195 (92.9%) | 323 (85.7%) |
| Total | 2,308 (82.1%) | 2,671 (74.0%) |
Income Below Poverty Among Married-Couple Families in Bridgeport
The poverty statistics for married-couple families in Bridgeport show that 5.9% or 52 of the total 884 families live below the poverty line. Families with 1 or 2 children have the highest poverty rate of 6.3%, comprising of 17 families. On the other hand, families with 3 or 4 children have the lowest poverty rate of 0.0%, which includes 0 families.
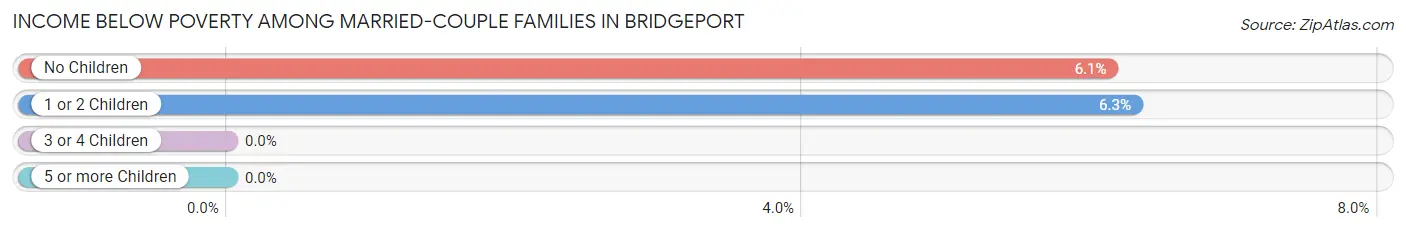
| Children | Above Poverty | Below Poverty |
| No Children | 536 (93.9%) | 35 (6.1%) |
| 1 or 2 Children | 253 (93.7%) | 17 (6.3%) |
| 3 or 4 Children | 35 (100.0%) | 0 (0.0%) |
| 5 or more Children | 8 (100.0%) | 0 (0.0%) |
| Total | 832 (94.1%) | 52 (5.9%) |
Income Below Poverty Among Single-Parent Households in Bridgeport
According to the poverty data in Bridgeport, 26.9% or 32 single-father households and 42.9% or 292 single-mother households are living below the poverty line. Among single-father households, those with 1 or 2 children have the highest poverty rate, with 32 households (37.2%) experiencing poverty. Likewise, among single-mother households, those with 5 or more children have the highest poverty rate, with 16 households (100.0%) falling below the poverty line.
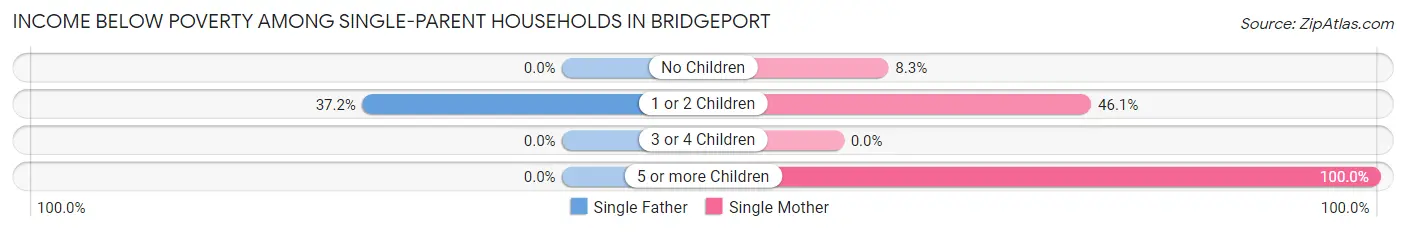
| Children | Single Father | Single Mother |
| No Children | 0 (0.0%) | 5 (8.3%) |
| 1 or 2 Children | 32 (37.2%) | 271 (46.1%) |
| 3 or 4 Children | 0 (0.0%) | 0 (0.0%) |
| 5 or more Children | 0 (0.0%) | 16 (100.0%) |
| Total | 32 (26.9%) | 292 (42.9%) |
Income Below Poverty Among Married-Couple vs Single-Parent Households in Bridgeport
The poverty data for Bridgeport shows that 52 of the married-couple family households (5.9%) and 324 of the single-parent households (40.5%) are living below the poverty level. Within the married-couple family households, those with 1 or 2 children have the highest poverty rate, with 17 households (6.3%) falling below the poverty line. Among the single-parent households, those with 5 or more children have the highest poverty rate, with 16 household (100.0%) living below poverty.
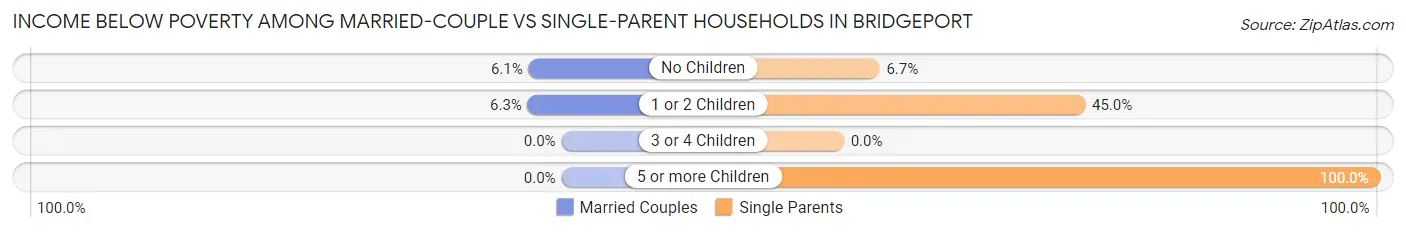
| Children | Married-Couple Families | Single-Parent Households |
| No Children | 35 (6.1%) | 5 (6.7%) |
| 1 or 2 Children | 17 (6.3%) | 303 (45.0%) |
| 3 or 4 Children | 0 (0.0%) | 0 (0.0%) |
| 5 or more Children | 0 (0.0%) | 16 (100.0%) |
| Total | 52 (5.9%) | 324 (40.5%) |
Race in Bridgeport
The most populous races in Bridgeport are White / Caucasian (3,434 | 52.9%), Black / African American (2,541 | 39.1%), and Hispanic or Latino (611 | 9.4%).
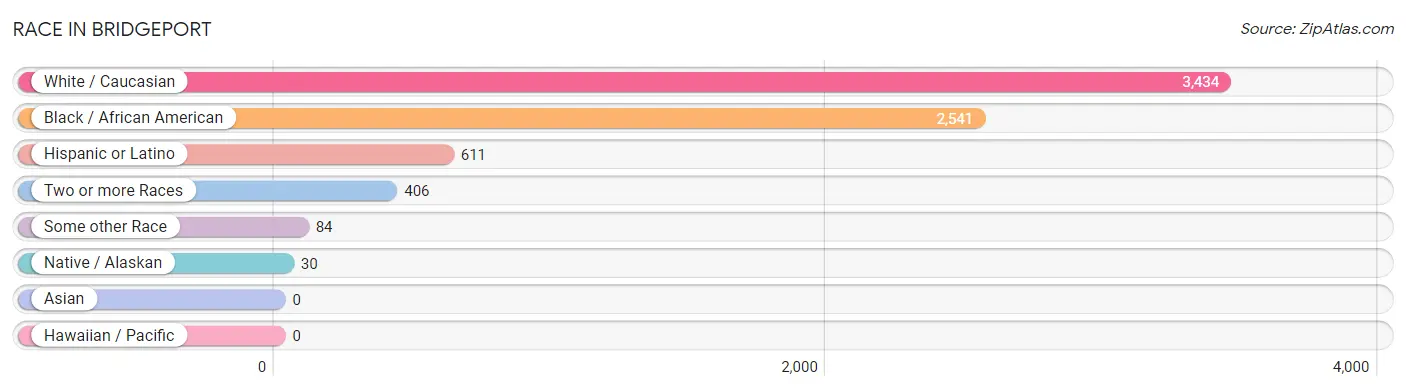
| Race | # Population | % Population |
| Asian | 0 | 0.0% |
| Black / African American | 2,541 | 39.1% |
| Hawaiian / Pacific | 0 | 0.0% |
| Hispanic or Latino | 611 | 9.4% |
| Native / Alaskan | 30 | 0.5% |
| White / Caucasian | 3,434 | 52.9% |
| Two or more Races | 406 | 6.2% |
| Some other Race | 84 | 1.3% |
| Total | 6,495 | 100.0% |
Ancestry in Bridgeport
The most populous ancestries reported in Bridgeport are German (1,144 | 17.6%), Mexican (604 | 9.3%), Irish (585 | 9.0%), Polish (367 | 5.7%), and English (234 | 3.6%), together accounting for 45.2% of all Bridgeport residents.
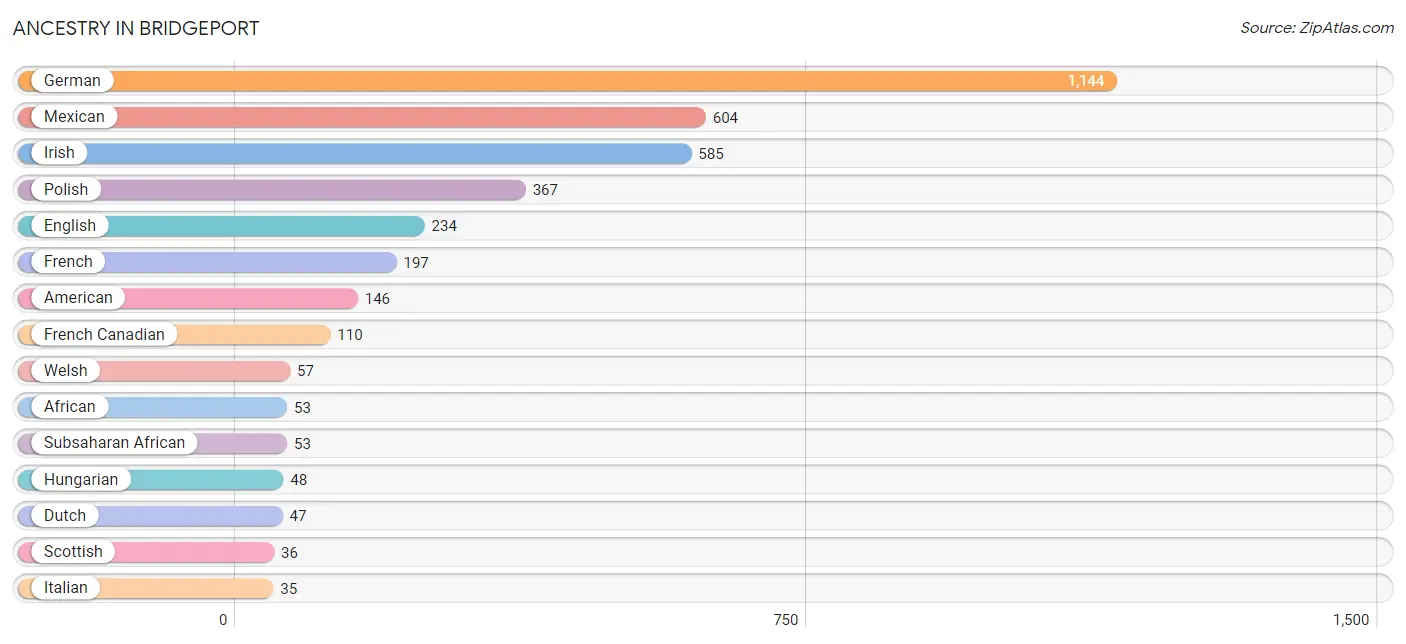
| Ancestry | # Population | % Population |
| African | 53 | 0.8% |
| American | 146 | 2.2% |
| Arab | 16 | 0.3% |
| British | 25 | 0.4% |
| British West Indian | 15 | 0.2% |
| Canadian | 12 | 0.2% |
| Celtic | 18 | 0.3% |
| Central American | 7 | 0.1% |
| Chippewa | 11 | 0.2% |
| Czechoslovakian | 7 | 0.1% |
| Dutch | 47 | 0.7% |
| Eastern European | 16 | 0.3% |
| English | 234 | 3.6% |
| European | 11 | 0.2% |
| Finnish | 7 | 0.1% |
| French | 197 | 3.0% |
| French Canadian | 110 | 1.7% |
| German | 1,144 | 17.6% |
| Guyanese | 32 | 0.5% |
| Honduran | 2 | 0.0% |
| Hungarian | 48 | 0.7% |
| Indian (Asian) | 6 | 0.1% |
| Irish | 585 | 9.0% |
| Italian | 35 | 0.5% |
| Lithuanian | 9 | 0.1% |
| Mexican | 604 | 9.3% |
| Native Hawaiian | 6 | 0.1% |
| Norwegian | 5 | 0.1% |
| Ottawa | 12 | 0.2% |
| Polish | 367 | 5.7% |
| Russian | 28 | 0.4% |
| Salvadoran | 5 | 0.1% |
| Scotch-Irish | 25 | 0.4% |
| Scottish | 36 | 0.5% |
| Slovak | 17 | 0.3% |
| Subsaharan African | 53 | 0.8% |
| Swedish | 8 | 0.1% |
| Swiss | 12 | 0.2% |
| Welsh | 57 | 0.9% |
| Yaqui | 6 | 0.1% |
| Yugoslavian | 5 | 0.1% | View All 41 Rows |
Immigrants in Bridgeport
The most numerous immigrant groups reported in Bridgeport came from Latin America (145 | 2.2%), Central America (113 | 1.7%), Mexico (111 | 1.7%), Europe (18 | 0.3%), and Germany (18 | 0.3%), together accounting for 6.2% of all Bridgeport residents.
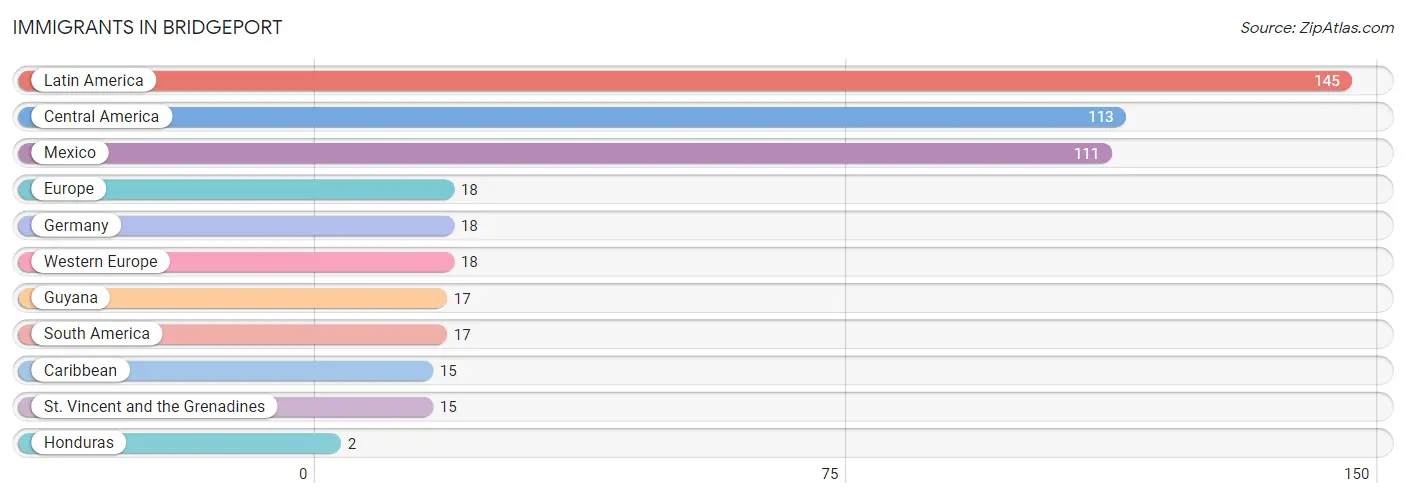
| Immigration Origin | # Population | % Population |
| Caribbean | 15 | 0.2% |
| Central America | 113 | 1.7% |
| Europe | 18 | 0.3% |
| Germany | 18 | 0.3% |
| Guyana | 17 | 0.3% |
| Honduras | 2 | 0.0% |
| Latin America | 145 | 2.2% |
| Mexico | 111 | 1.7% |
| South America | 17 | 0.3% |
| St. Vincent and the Grenadines | 15 | 0.2% |
| Western Europe | 18 | 0.3% | View All 11 Rows |
Sex and Age in Bridgeport
Sex and Age in Bridgeport
The most populous age groups in Bridgeport are 15 to 19 Years (308 | 10.8%) for men and 10 to 14 Years (355 | 9.7%) for women.
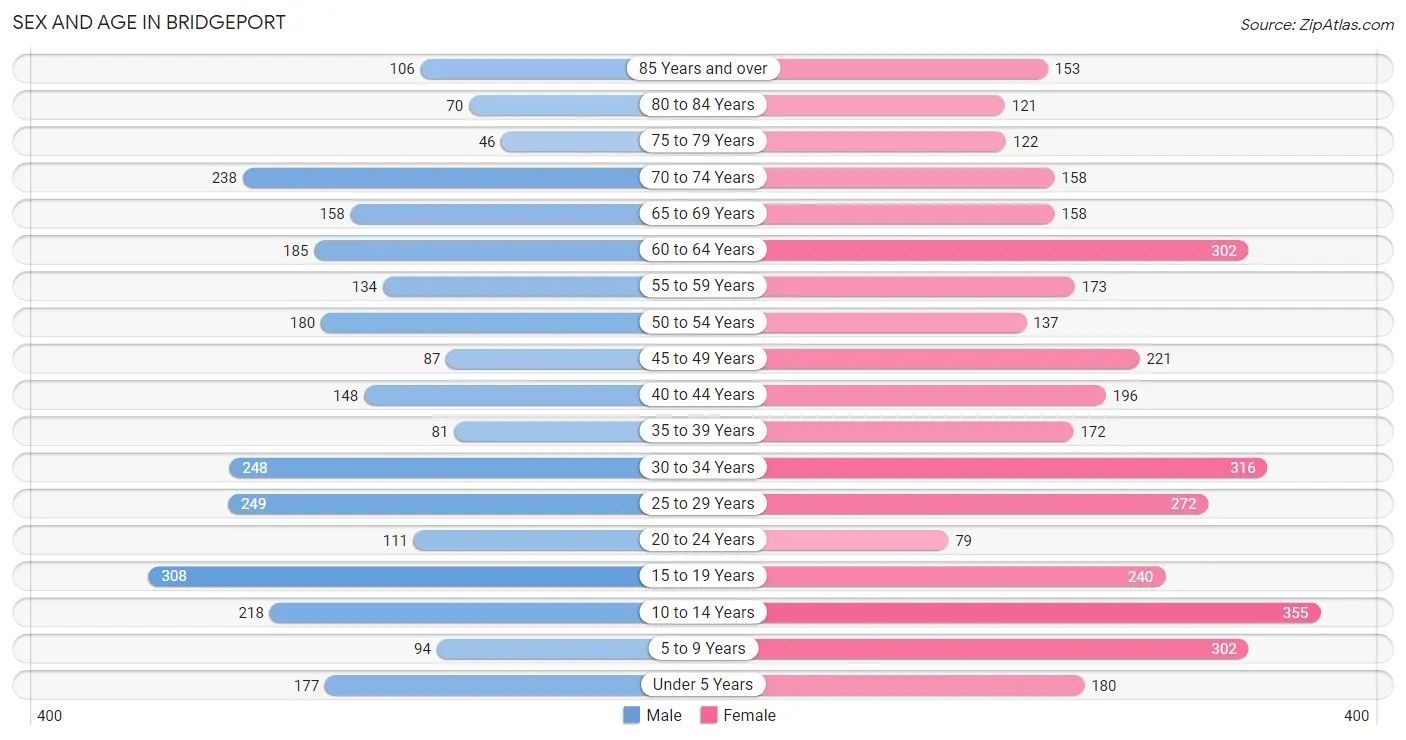
| Age Bracket | Male | Female |
| Under 5 Years | 177 (6.2%) | 180 (4.9%) |
| 5 to 9 Years | 94 (3.3%) | 302 (8.3%) |
| 10 to 14 Years | 218 (7.7%) | 355 (9.7%) |
| 15 to 19 Years | 308 (10.8%) | 240 (6.6%) |
| 20 to 24 Years | 111 (3.9%) | 79 (2.2%) |
| 25 to 29 Years | 249 (8.8%) | 272 (7.4%) |
| 30 to 34 Years | 248 (8.7%) | 316 (8.6%) |
| 35 to 39 Years | 81 (2.9%) | 172 (4.7%) |
| 40 to 44 Years | 148 (5.2%) | 196 (5.4%) |
| 45 to 49 Years | 87 (3.1%) | 221 (6.0%) |
| 50 to 54 Years | 180 (6.3%) | 137 (3.7%) |
| 55 to 59 Years | 134 (4.7%) | 173 (4.7%) |
| 60 to 64 Years | 185 (6.5%) | 302 (8.3%) |
| 65 to 69 Years | 158 (5.6%) | 158 (4.3%) |
| 70 to 74 Years | 238 (8.4%) | 158 (4.3%) |
| 75 to 79 Years | 46 (1.6%) | 122 (3.3%) |
| 80 to 84 Years | 70 (2.5%) | 121 (3.3%) |
| 85 Years and over | 106 (3.7%) | 153 (4.2%) |
| Total | 2,838 (100.0%) | 3,657 (100.0%) |
Families and Households in Bridgeport
Median Family Size in Bridgeport
The median family size in Bridgeport is 2.93 persons per family, with single male/father families (119 | 7.1%) accounting for the largest median family size of 3.06 persons per family. On the other hand, single female/mother families (681 | 40.4%) represent the smallest median family size with 2.86 persons per family.
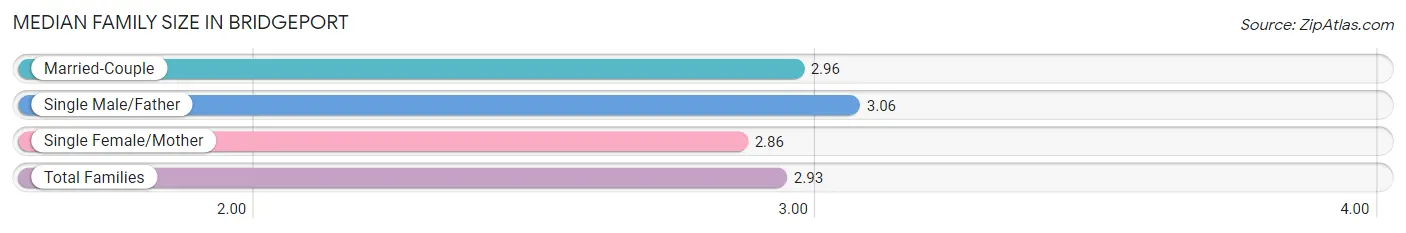
| Family Type | # Families | Family Size |
| Married-Couple | 884 (52.5%) | 2.96 |
| Single Male/Father | 119 (7.1%) | 3.06 |
| Single Female/Mother | 681 (40.4%) | 2.86 |
| Total Families | 1,684 (100.0%) | 2.93 |
Median Household Size in Bridgeport
The median household size in Bridgeport is 2.38 persons per household, with single male/father households (119 | 4.4%) accounting for the largest median household size of 3.77 persons per household. non-family households (1,007 | 37.4%) represent the smallest median household size with 1.15 persons per household.
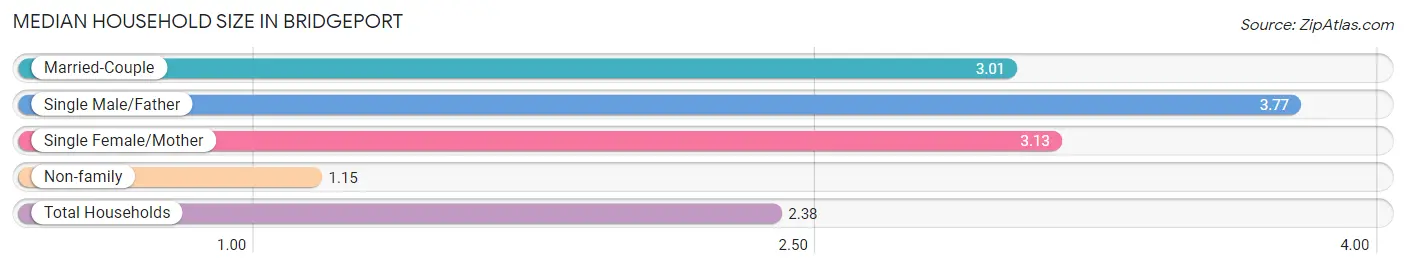
| Household Type | # Households | Household Size |
| Married-Couple | 884 (32.9%) | 3.01 |
| Single Male/Father | 119 (4.4%) | 3.77 |
| Single Female/Mother | 681 (25.3%) | 3.13 |
| Non-family | 1,007 (37.4%) | 1.15 |
| Total Households | 2,691 (100.0%) | 2.38 |
Household Size by Marriage Status in Bridgeport
Out of a total of 2,691 households in Bridgeport, 1,684 (62.6%) are family households, while 1,007 (37.4%) are nonfamily households. The most numerous type of family households are 2-person households, comprising 599, and the most common type of nonfamily households are 1-person households, comprising 885.
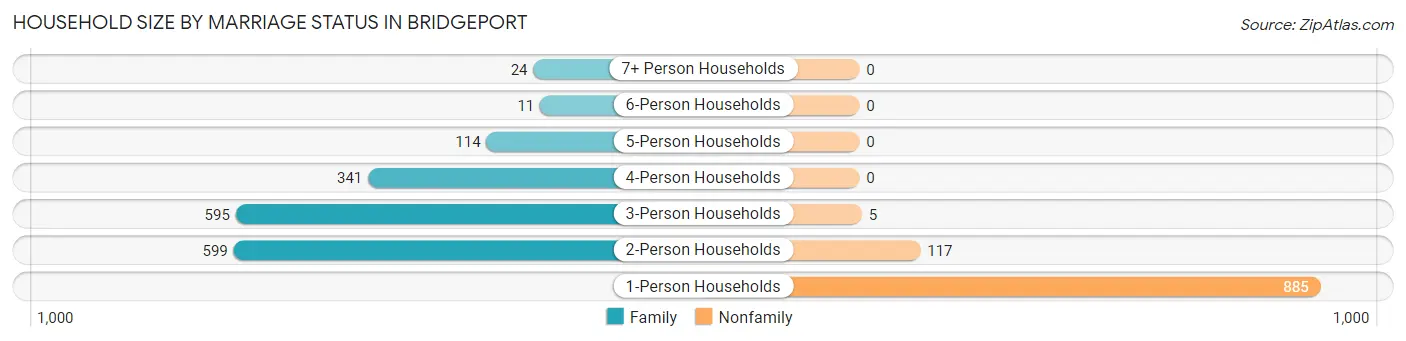
| Household Size | Family Households | Nonfamily Households |
| 1-Person Households | - | 885 (32.9%) |
| 2-Person Households | 599 (22.3%) | 117 (4.3%) |
| 3-Person Households | 595 (22.1%) | 5 (0.2%) |
| 4-Person Households | 341 (12.7%) | 0 (0.0%) |
| 5-Person Households | 114 (4.2%) | 0 (0.0%) |
| 6-Person Households | 11 (0.4%) | 0 (0.0%) |
| 7+ Person Households | 24 (0.9%) | 0 (0.0%) |
| Total | 1,684 (62.6%) | 1,007 (37.4%) |
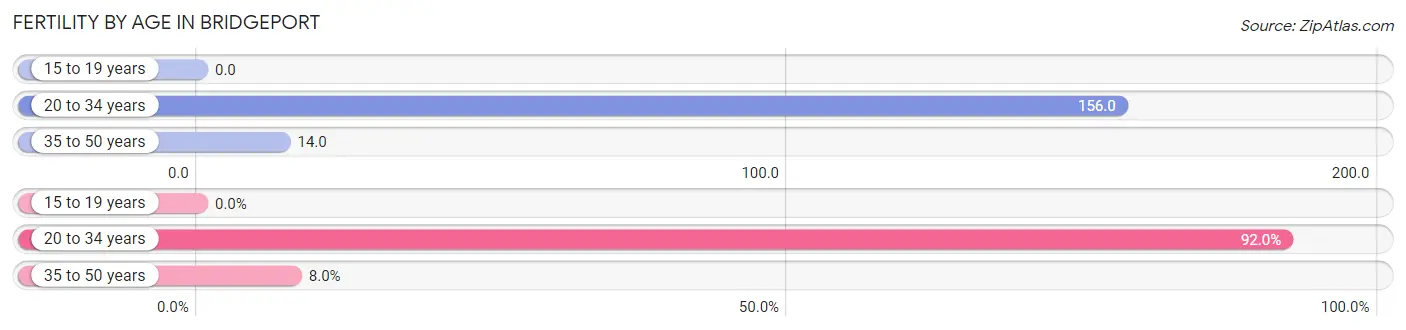
Female Fertility in Bridgeport
Fertility by Age in Bridgeport
Average fertility rate in Bridgeport is 73.0 births per 1,000 women. Women in the age bracket of 20 to 34 years have the highest fertility rate with 156.0 births per 1,000 women. Women in the age bracket of 20 to 34 years acount for 92.0% of all women with births.
| Age Bracket | Women with Births | Births / 1,000 Women |
| 15 to 19 years | 0 (0.0%) | 0.0 |
| 20 to 34 years | 104 (92.0%) | 156.0 |
| 35 to 50 years | 9 (8.0%) | 14.0 |
| Total | 113 (100.0%) | 73.0 |
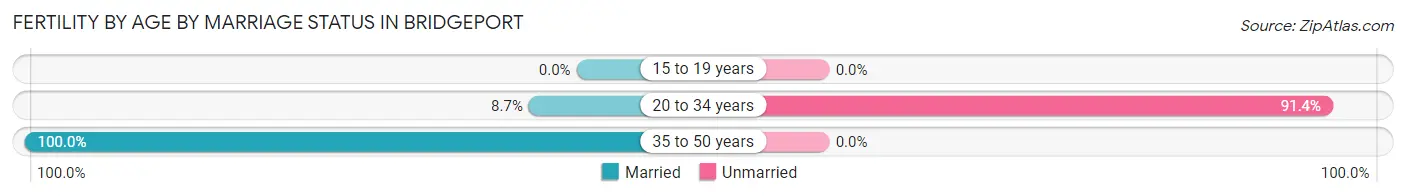
Fertility by Age by Marriage Status in Bridgeport
15.9% of women with births (113) in Bridgeport are married. The highest percentage of unmarried women with births falls into 20 to 34 years age bracket with 91.3% of them unmarried at the time of birth, while the lowest percentage of unmarried women with births belong to 35 to 50 years age bracket with 0.0% of them unmarried.
| Age Bracket | Married | Unmarried |
| 15 to 19 years | 0 (0.0%) | 0 (0.0%) |
| 20 to 34 years | 9 (8.6%) | 95 (91.3%) |
| 35 to 50 years | 9 (100.0%) | 0 (0.0%) |
| Total | 18 (15.9%) | 95 (84.1%) |
Fertility by Education in Bridgeport
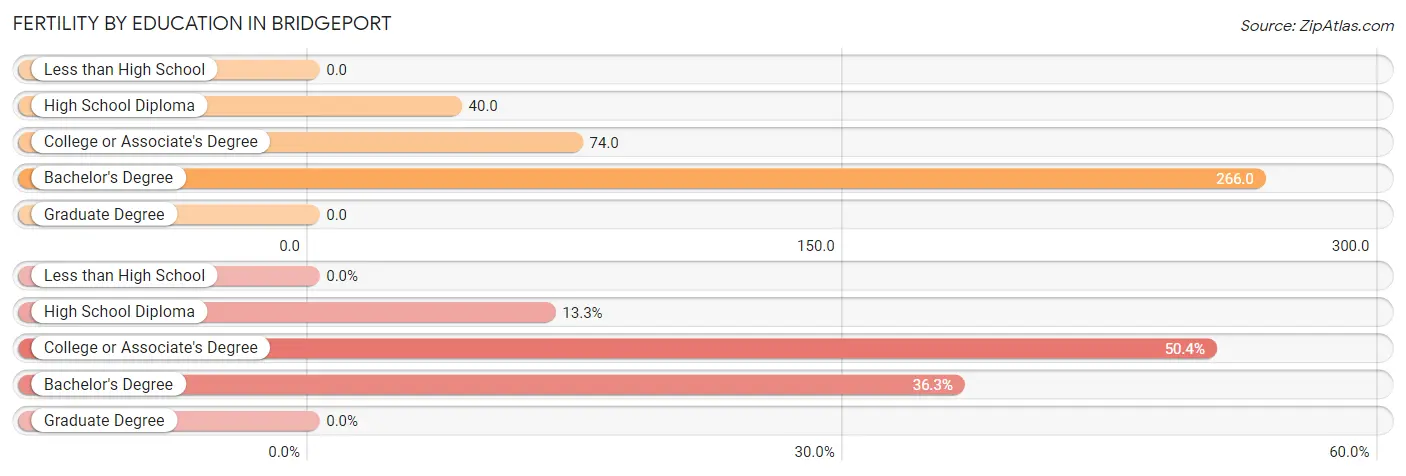
| Educational Attainment | Women with Births | Births / 1,000 Women |
| Less than High School | 0 (0.0%) | 0.0 |
| High School Diploma | 15 (13.3%) | 40.0 |
| College or Associate's Degree | 57 (50.4%) | 74.0 |
| Bachelor's Degree | 41 (36.3%) | 266.0 |
| Graduate Degree | 0 (0.0%) | 0.0 |
| Total | 113 (100.0%) | 73.0 |
Fertility by Education by Marriage Status in Bridgeport
84.1% of women with births in Bridgeport are unmarried. Women with the educational attainment of college or associate's degree are most likely to be married with 31.6% of them married at childbirth, while women with the educational attainment of high school diploma are least likely to be married with 100.0% of them unmarried at childbirth.
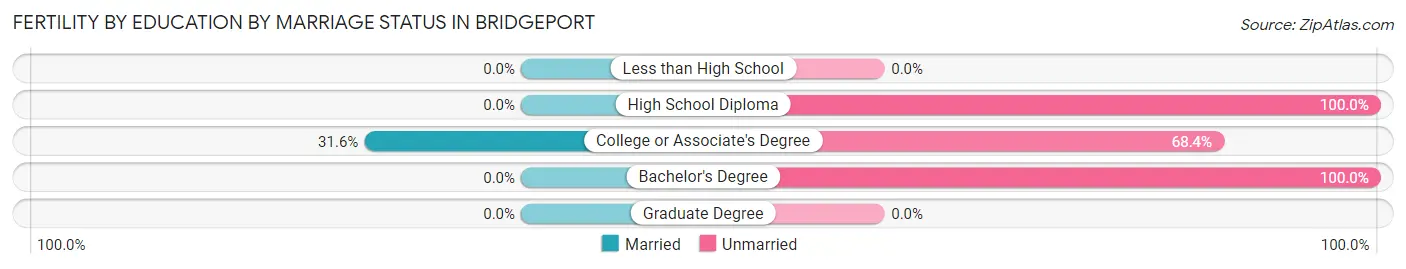
| Educational Attainment | Married | Unmarried |
| Less than High School | 0 (0.0%) | 0 (0.0%) |
| High School Diploma | 0 (0.0%) | 15 (100.0%) |
| College or Associate's Degree | 18 (31.6%) | 39 (68.4%) |
| Bachelor's Degree | 0 (0.0%) | 41 (100.0%) |
| Graduate Degree | 0 (0.0%) | 0 (0.0%) |
| Total | 18 (15.9%) | 95 (84.1%) |
Employment Characteristics in Bridgeport
Employment by Class of Employer in Bridgeport
Among the 2,288 employed individuals in Bridgeport, private company employees (1,739 | 76.0%), self-employed (not incorporated) (179 | 7.8%), and not-for-profit organizations (161 | 7.0%) make up the most common classes of employment.
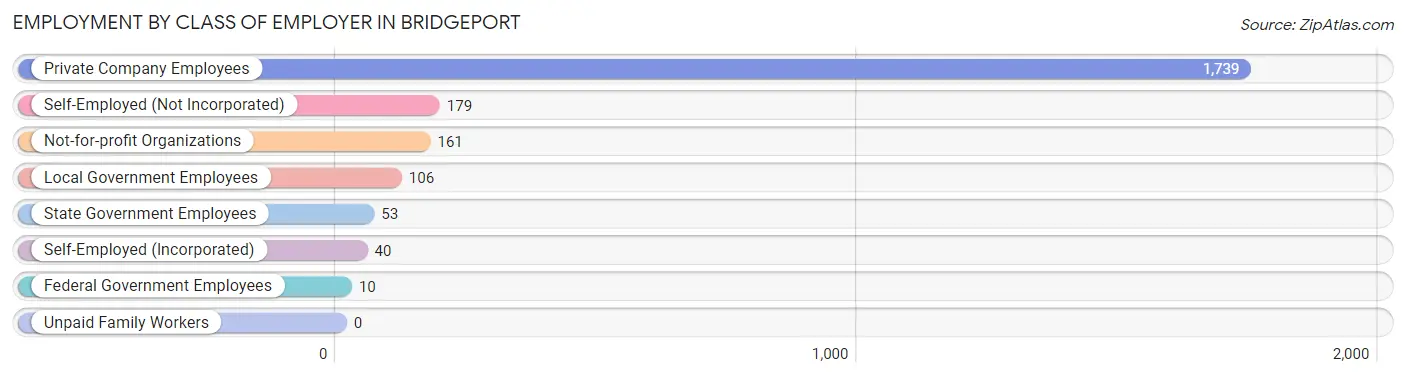
| Employer Class | # Employees | % Employees |
| Private Company Employees | 1,739 | 76.0% |
| Self-Employed (Incorporated) | 40 | 1.8% |
| Self-Employed (Not Incorporated) | 179 | 7.8% |
| Not-for-profit Organizations | 161 | 7.0% |
| Local Government Employees | 106 | 4.6% |
| State Government Employees | 53 | 2.3% |
| Federal Government Employees | 10 | 0.4% |
| Unpaid Family Workers | 0 | 0.0% |
| Total | 2,288 | 100.0% |
Employment Status by Age in Bridgeport
According to the labor force statistics for Bridgeport, out of the total population over 16 years of age (5,118), 48.5% or 2,482 individuals are in the labor force, with 5.3% or 132 of them unemployed. The age group with the highest labor force participation rate is 20 to 24 years, with 84.2% or 160 individuals in the labor force. Within the labor force, the 25 to 29 years age range has the highest percentage of unemployed individuals, with 12.3% or 46 of them being unemployed.
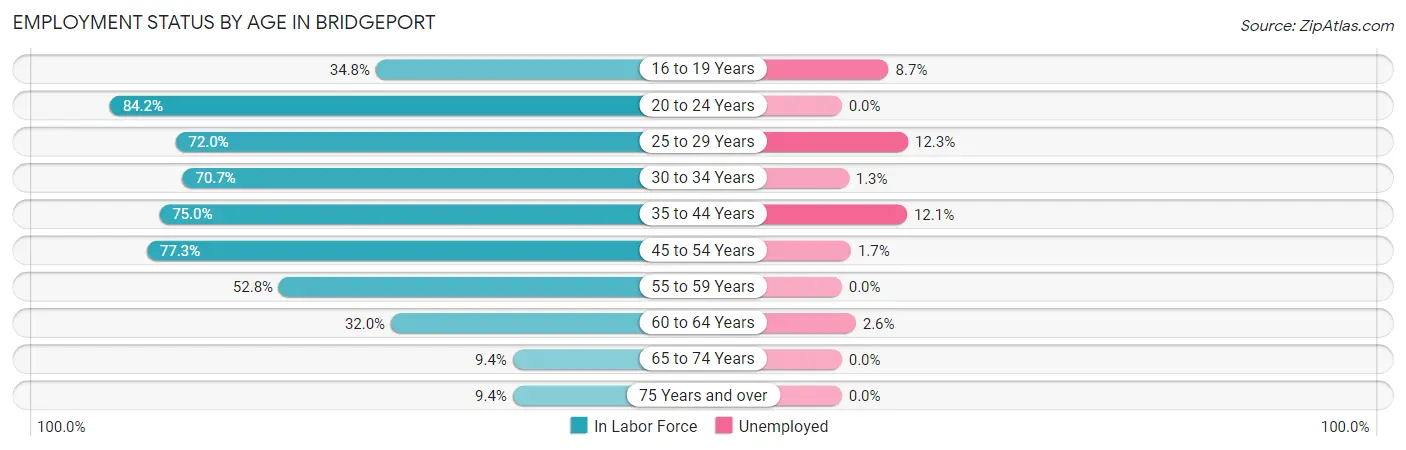
| Age Bracket | In Labor Force | Unemployed |
| 16 to 19 Years | 173 (34.8%) | 15 (8.7%) |
| 20 to 24 Years | 160 (84.2%) | 0 (0.0%) |
| 25 to 29 Years | 375 (72.0%) | 46 (12.3%) |
| 30 to 34 Years | 399 (70.7%) | 5 (1.3%) |
| 35 to 44 Years | 448 (75.0%) | 54 (12.1%) |
| 45 to 54 Years | 483 (77.3%) | 8 (1.7%) |
| 55 to 59 Years | 162 (52.8%) | 0 (0.0%) |
| 60 to 64 Years | 156 (32.0%) | 4 (2.6%) |
| 65 to 74 Years | 67 (9.4%) | 0 (0.0%) |
| 75 Years and over | 58 (9.4%) | 0 (0.0%) |
| Total | 2,482 (48.5%) | 132 (5.3%) |
Employment Status by Educational Attainment in Bridgeport
According to labor force statistics for Bridgeport, 65.2% of individuals (2,022) out of the total population between 25 and 64 years of age (3,101) are in the labor force, with 5.8% or 117 of them being unemployed. The group with the highest labor force participation rate are those with the educational attainment of bachelor's degree or higher, with 84.6% or 296 individuals in the labor force. Within the labor force, individuals with high school diploma education have the highest percentage of unemployment, with 10.9% or 82 of them being unemployed.
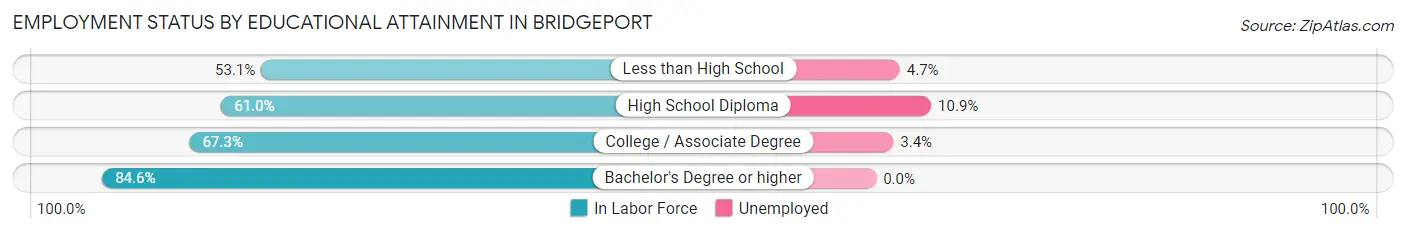
| Educational Attainment | In Labor Force | Unemployed |
| Less than High School | 171 (53.1%) | 15 (4.7%) |
| High School Diploma | 753 (61.0%) | 135 (10.9%) |
| College / Associate Degree | 804 (67.3%) | 41 (3.4%) |
| Bachelor's Degree or higher | 296 (84.6%) | 0 (0.0%) |
| Total | 2,022 (65.2%) | 180 (5.8%) |
Employment Occupations by Sex in Bridgeport
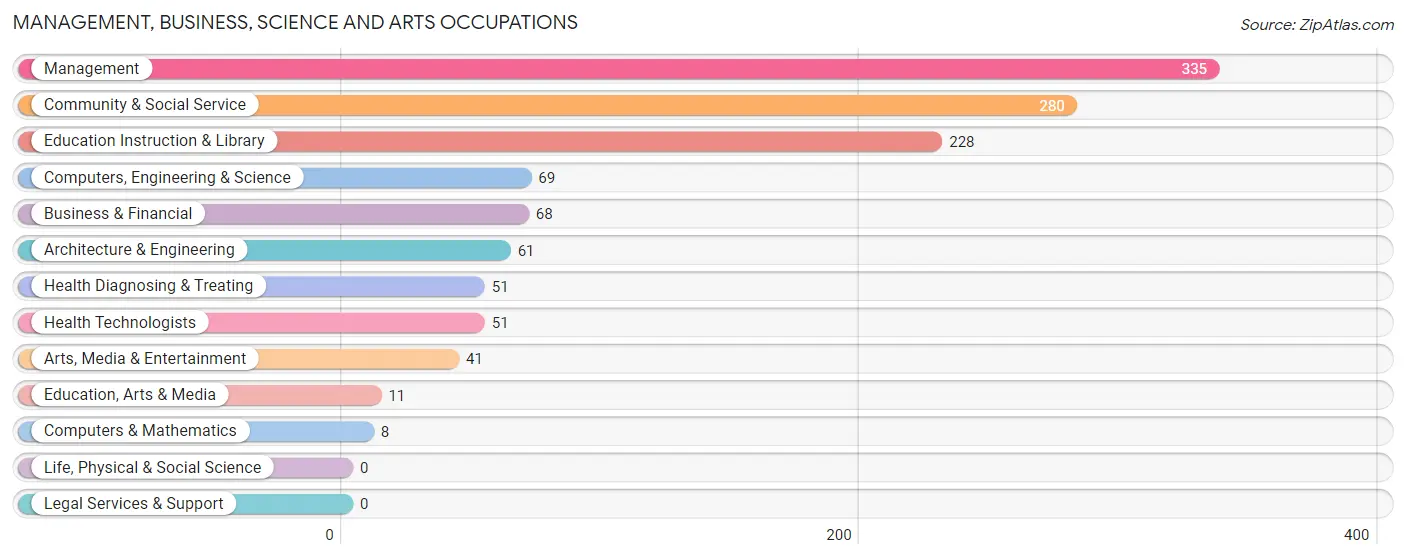
Management, Business, Science and Arts Occupations
The most common Management, Business, Science and Arts occupations in Bridgeport are Management (335 | 14.3%), Community & Social Service (280 | 11.9%), Education Instruction & Library (228 | 9.7%), Computers, Engineering & Science (69 | 2.9%), and Business & Financial (68 | 2.9%).
Management, Business, Science and Arts Occupations by Sex
Within the Management, Business, Science and Arts occupations in Bridgeport, the most male-oriented occupations are Computers, Engineering & Science (100.0%), Computers & Mathematics (100.0%), and Architecture & Engineering (100.0%), while the most female-oriented occupations are Education, Arts & Media (100.0%), Education Instruction & Library (100.0%), and Community & Social Service (92.5%).
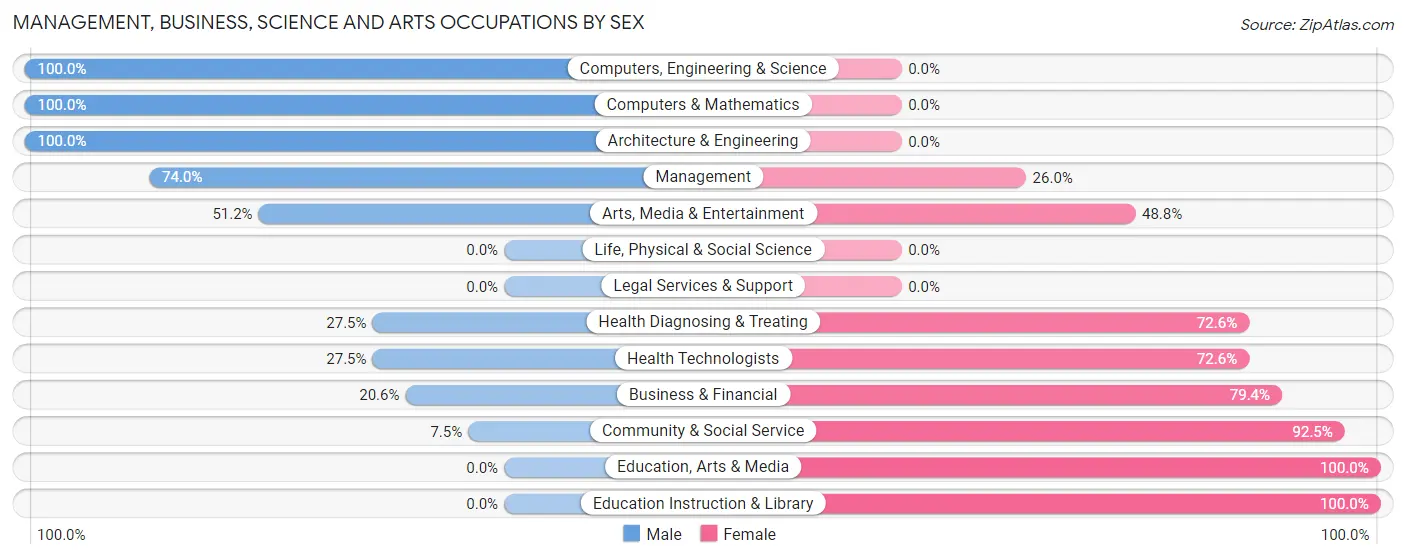
| Occupation | Male | Female |
| Management | 248 (74.0%) | 87 (26.0%) |
| Business & Financial | 14 (20.6%) | 54 (79.4%) |
| Computers, Engineering & Science | 69 (100.0%) | 0 (0.0%) |
| Computers & Mathematics | 8 (100.0%) | 0 (0.0%) |
| Architecture & Engineering | 61 (100.0%) | 0 (0.0%) |
| Life, Physical & Social Science | 0 (0.0%) | 0 (0.0%) |
| Community & Social Service | 21 (7.5%) | 259 (92.5%) |
| Education, Arts & Media | 0 (0.0%) | 11 (100.0%) |
| Legal Services & Support | 0 (0.0%) | 0 (0.0%) |
| Education Instruction & Library | 0 (0.0%) | 228 (100.0%) |
| Arts, Media & Entertainment | 21 (51.2%) | 20 (48.8%) |
| Health Diagnosing & Treating | 14 (27.5%) | 37 (72.6%) |
| Health Technologists | 14 (27.5%) | 37 (72.6%) |
| Total (Category) | 366 (45.6%) | 437 (54.4%) |
| Total (Overall) | 1,068 (45.5%) | 1,281 (54.5%) |
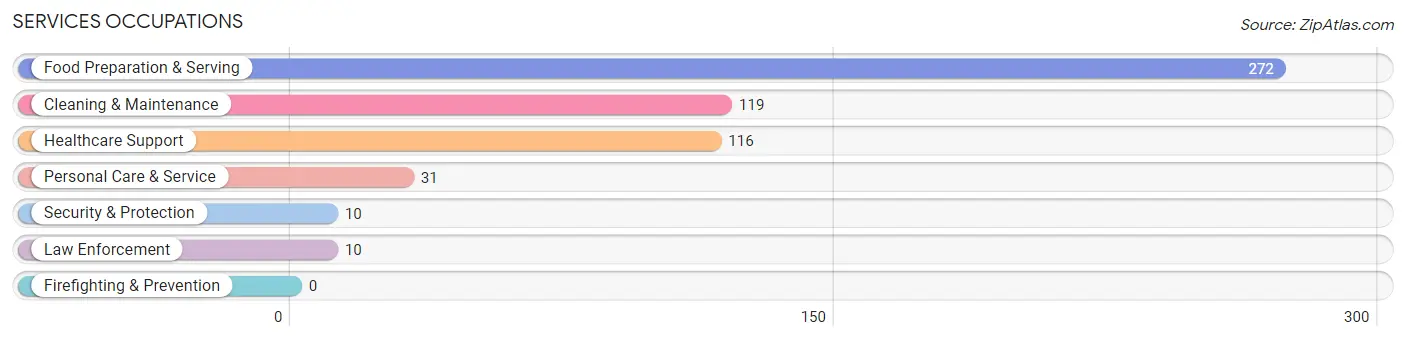
Services Occupations
The most common Services occupations in Bridgeport are Food Preparation & Serving (272 | 11.6%), Cleaning & Maintenance (119 | 5.1%), Healthcare Support (116 | 4.9%), Personal Care & Service (31 | 1.3%), and Security & Protection (10 | 0.4%).
Services Occupations by Sex
Within the Services occupations in Bridgeport, the most male-oriented occupations are Security & Protection (100.0%), Law Enforcement (100.0%), and Cleaning & Maintenance (60.5%), while the most female-oriented occupations are Personal Care & Service (100.0%), Food Preparation & Serving (83.5%), and Healthcare Support (69.0%).
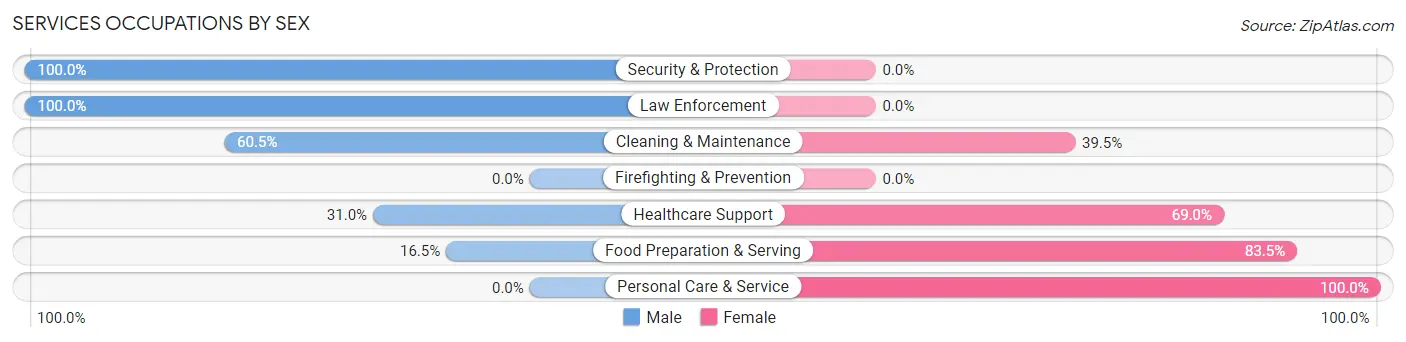
| Occupation | Male | Female |
| Healthcare Support | 36 (31.0%) | 80 (69.0%) |
| Security & Protection | 10 (100.0%) | 0 (0.0%) |
| Firefighting & Prevention | 0 (0.0%) | 0 (0.0%) |
| Law Enforcement | 10 (100.0%) | 0 (0.0%) |
| Food Preparation & Serving | 45 (16.5%) | 227 (83.5%) |
| Cleaning & Maintenance | 72 (60.5%) | 47 (39.5%) |
| Personal Care & Service | 0 (0.0%) | 31 (100.0%) |
| Total (Category) | 163 (29.7%) | 385 (70.3%) |
| Total (Overall) | 1,068 (45.5%) | 1,281 (54.5%) |
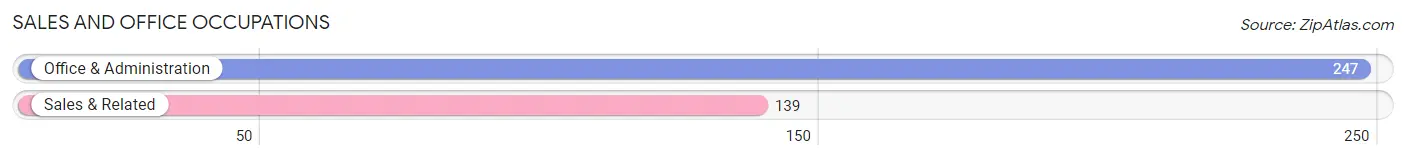
Sales and Office Occupations
The most common Sales and Office occupations in Bridgeport are Office & Administration (247 | 10.5%), and Sales & Related (139 | 5.9%).
Sales and Office Occupations by Sex
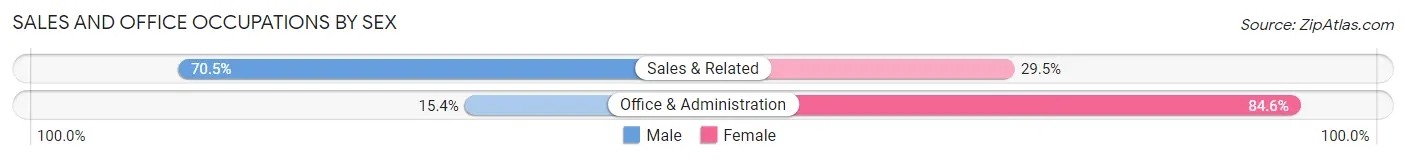
| Occupation | Male | Female |
| Sales & Related | 98 (70.5%) | 41 (29.5%) |
| Office & Administration | 38 (15.4%) | 209 (84.6%) |
| Total (Category) | 136 (35.2%) | 250 (64.8%) |
| Total (Overall) | 1,068 (45.5%) | 1,281 (54.5%) |
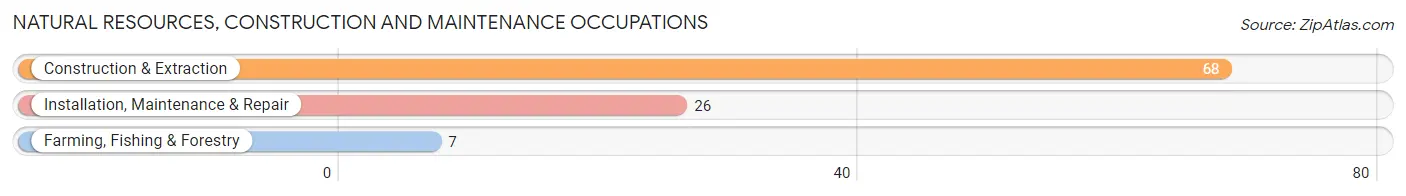
Natural Resources, Construction and Maintenance Occupations
The most common Natural Resources, Construction and Maintenance occupations in Bridgeport are Construction & Extraction (68 | 2.9%), Installation, Maintenance & Repair (26 | 1.1%), and Farming, Fishing & Forestry (7 | 0.3%).
Natural Resources, Construction and Maintenance Occupations by Sex
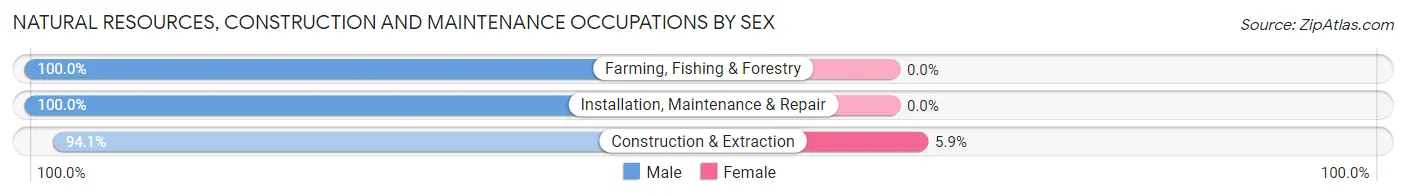
| Occupation | Male | Female |
| Farming, Fishing & Forestry | 7 (100.0%) | 0 (0.0%) |
| Construction & Extraction | 64 (94.1%) | 4 (5.9%) |
| Installation, Maintenance & Repair | 26 (100.0%) | 0 (0.0%) |
| Total (Category) | 97 (96.0%) | 4 (4.0%) |
| Total (Overall) | 1,068 (45.5%) | 1,281 (54.5%) |
Production, Transportation and Moving Occupations
The most common Production, Transportation and Moving occupations in Bridgeport are Production (317 | 13.5%), Material Moving (131 | 5.6%), and Transportation (63 | 2.7%).
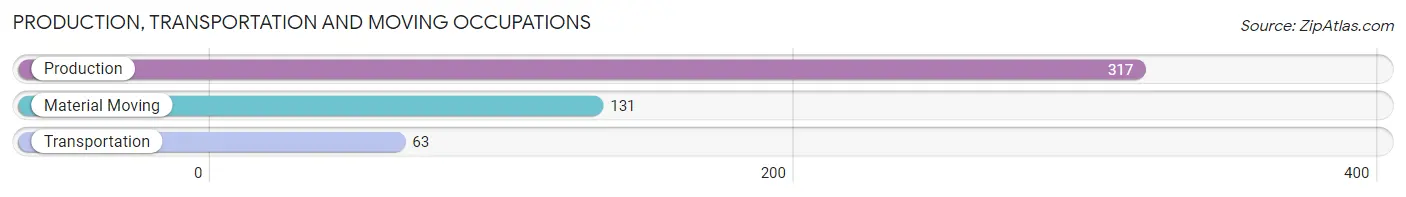
Production, Transportation and Moving Occupations by Sex
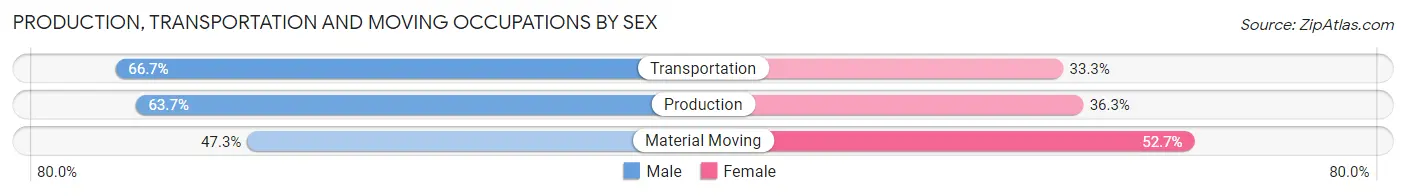
| Occupation | Male | Female |
| Production | 202 (63.7%) | 115 (36.3%) |
| Transportation | 42 (66.7%) | 21 (33.3%) |
| Material Moving | 62 (47.3%) | 69 (52.7%) |
| Total (Category) | 306 (59.9%) | 205 (40.1%) |
| Total (Overall) | 1,068 (45.5%) | 1,281 (54.5%) |
Employment Industries by Sex in Bridgeport
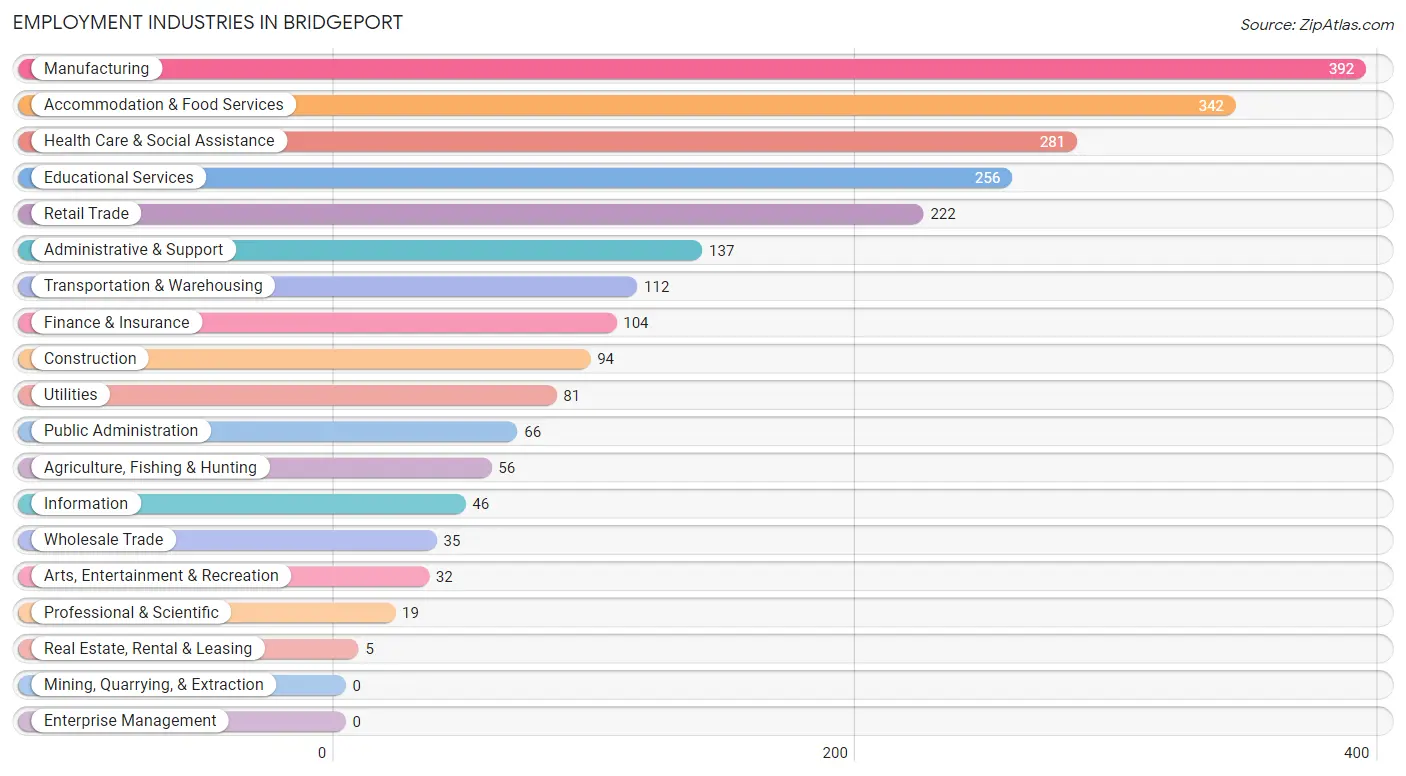
Employment Industries in Bridgeport
The major employment industries in Bridgeport include Manufacturing (392 | 16.7%), Accommodation & Food Services (342 | 14.6%), Health Care & Social Assistance (281 | 12.0%), Educational Services (256 | 10.9%), and Retail Trade (222 | 9.5%).
Employment Industries by Sex in Bridgeport
The Bridgeport industries that see more men than women are Utilities (100.0%), Real Estate, Rental & Leasing (100.0%), and Arts, Entertainment & Recreation (100.0%), whereas the industries that tend to have a higher number of women are Information (100.0%), Educational Services (94.5%), and Public Administration (84.9%).
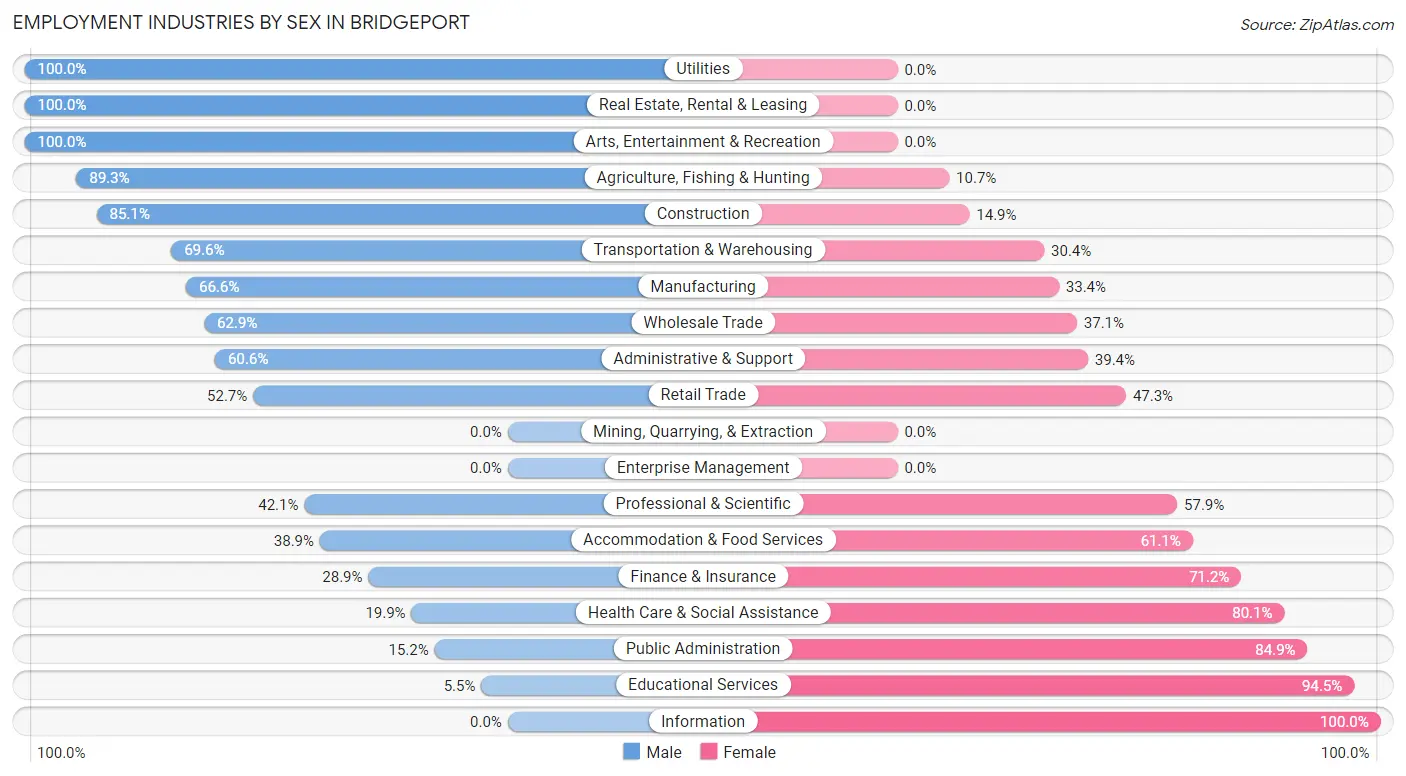
| Industry | Male | Female |
| Agriculture, Fishing & Hunting | 50 (89.3%) | 6 (10.7%) |
| Mining, Quarrying, & Extraction | 0 (0.0%) | 0 (0.0%) |
| Construction | 80 (85.1%) | 14 (14.9%) |
| Manufacturing | 261 (66.6%) | 131 (33.4%) |
| Wholesale Trade | 22 (62.9%) | 13 (37.1%) |
| Retail Trade | 117 (52.7%) | 105 (47.3%) |
| Transportation & Warehousing | 78 (69.6%) | 34 (30.4%) |
| Utilities | 81 (100.0%) | 0 (0.0%) |
| Information | 0 (0.0%) | 46 (100.0%) |
| Finance & Insurance | 30 (28.8%) | 74 (71.2%) |
| Real Estate, Rental & Leasing | 5 (100.0%) | 0 (0.0%) |
| Professional & Scientific | 8 (42.1%) | 11 (57.9%) |
| Enterprise Management | 0 (0.0%) | 0 (0.0%) |
| Administrative & Support | 83 (60.6%) | 54 (39.4%) |
| Educational Services | 14 (5.5%) | 242 (94.5%) |
| Health Care & Social Assistance | 56 (19.9%) | 225 (80.1%) |
| Arts, Entertainment & Recreation | 32 (100.0%) | 0 (0.0%) |
| Accommodation & Food Services | 133 (38.9%) | 209 (61.1%) |
| Public Administration | 10 (15.1%) | 56 (84.9%) |
| Total | 1,068 (45.5%) | 1,281 (54.5%) |
Education in Bridgeport
School Enrollment in Bridgeport
The most common levels of schooling among the 1,639 students in Bridgeport are high school (533 | 32.5%), middle school (431 | 26.3%), and elementary school (338 | 20.6%).
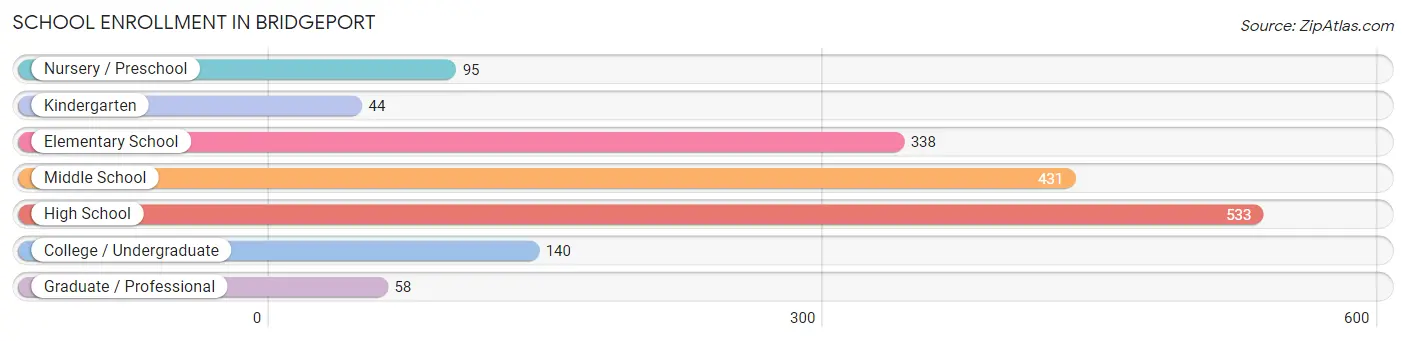
| School Level | # Students | % Students |
| Nursery / Preschool | 95 | 5.8% |
| Kindergarten | 44 | 2.7% |
| Elementary School | 338 | 20.6% |
| Middle School | 431 | 26.3% |
| High School | 533 | 32.5% |
| College / Undergraduate | 140 | 8.5% |
| Graduate / Professional | 58 | 3.5% |
| Total | 1,639 | 100.0% |
School Enrollment by Age by Funding Source in Bridgeport
Out of a total of 1,639 students who are enrolled in schools in Bridgeport, 48 (2.9%) attend a private institution, while the remaining 1,591 (97.1%) are enrolled in public schools. The age group of 25 to 34 year olds has the highest likelihood of being enrolled in private schools, with 6 (8.5% in the age bracket) enrolled. Conversely, the age group of 3 to 4 year olds has the lowest likelihood of being enrolled in a private school, with 84 (100.0% in the age bracket) attending a public institution.
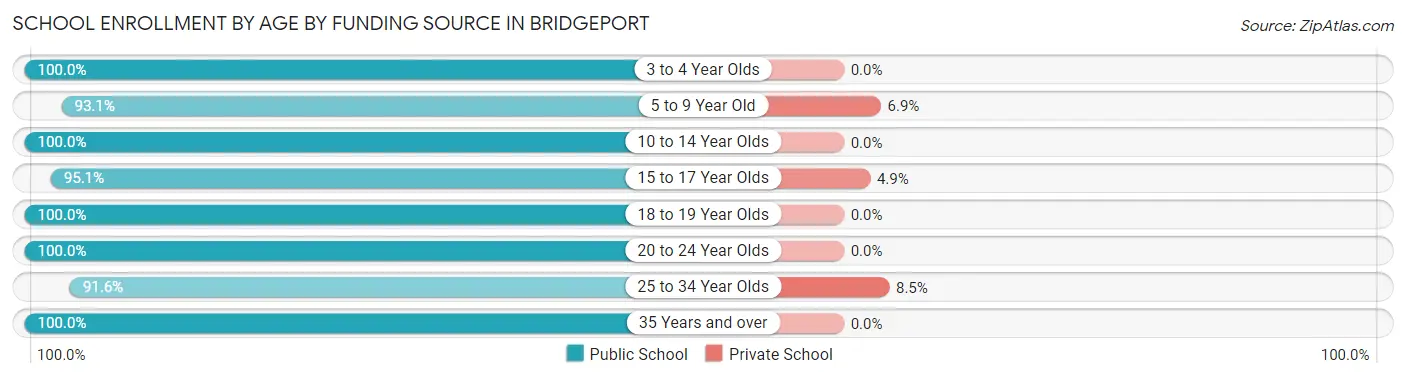
| Age Bracket | Public School | Private School |
| 3 to 4 Year Olds | 84 (100.0%) | 0 (0.0%) |
| 5 to 9 Year Old | 352 (93.1%) | 26 (6.9%) |
| 10 to 14 Year Olds | 573 (100.0%) | 0 (0.0%) |
| 15 to 17 Year Olds | 291 (95.1%) | 15 (4.9%) |
| 18 to 19 Year Olds | 170 (100.0%) | 0 (0.0%) |
| 20 to 24 Year Olds | 10 (100.0%) | 0 (0.0%) |
| 25 to 34 Year Olds | 65 (91.5%) | 6 (8.5%) |
| 35 Years and over | 47 (100.0%) | 0 (0.0%) |
| Total | 1,591 (97.1%) | 48 (2.9%) |
Educational Attainment by Field of Study in Bridgeport
Education (137 | 27.5%), business (85 | 17.0%), arts & humanities (60 | 12.0%), engineering (46 | 9.2%), and liberal arts & history (46 | 9.2%) are the most common fields of study among 499 individuals in Bridgeport who have obtained a bachelor's degree or higher.
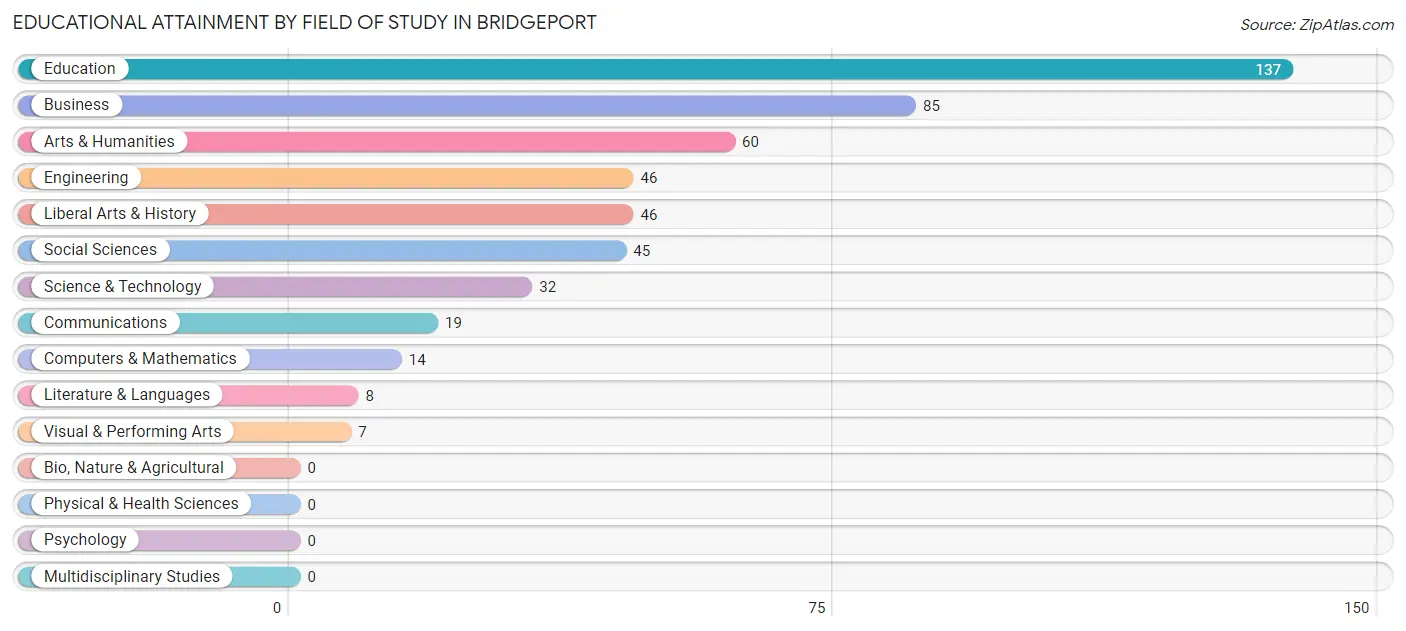
| Field of Study | # Graduates | % Graduates |
| Computers & Mathematics | 14 | 2.8% |
| Bio, Nature & Agricultural | 0 | 0.0% |
| Physical & Health Sciences | 0 | 0.0% |
| Psychology | 0 | 0.0% |
| Social Sciences | 45 | 9.0% |
| Engineering | 46 | 9.2% |
| Multidisciplinary Studies | 0 | 0.0% |
| Science & Technology | 32 | 6.4% |
| Business | 85 | 17.0% |
| Education | 137 | 27.5% |
| Literature & Languages | 8 | 1.6% |
| Liberal Arts & History | 46 | 9.2% |
| Visual & Performing Arts | 7 | 1.4% |
| Communications | 19 | 3.8% |
| Arts & Humanities | 60 | 12.0% |
| Total | 499 | 100.0% |
Transportation & Commute in Bridgeport
Vehicle Availability by Sex in Bridgeport
The most prevalent vehicle ownership categories in Bridgeport are males with 2 vehicles (533, accounting for 52.6%) and females with 2 vehicles (405, making up 41.8%).
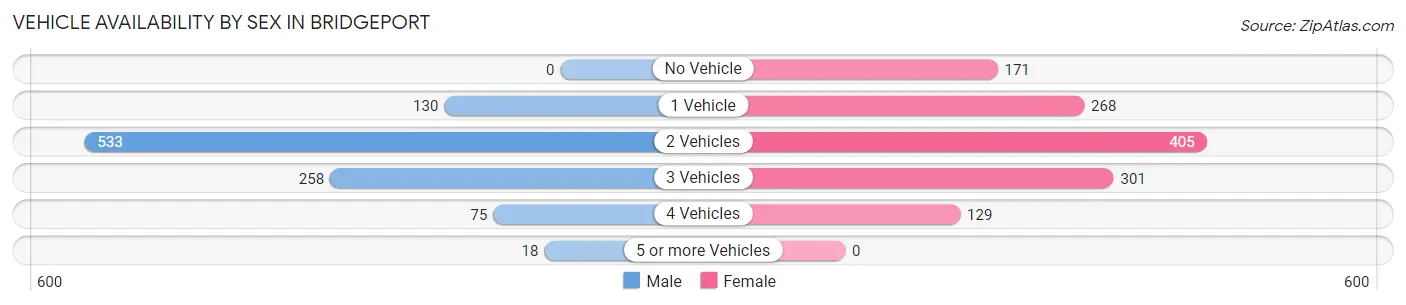
| Vehicles Available | Male | Female |
| No Vehicle | 0 (0.0%) | 171 (13.4%) |
| 1 Vehicle | 130 (12.8%) | 268 (21.0%) |
| 2 Vehicles | 533 (52.6%) | 405 (31.8%) |
| 3 Vehicles | 258 (25.4%) | 301 (23.6%) |
| 4 Vehicles | 75 (7.4%) | 129 (10.1%) |
| 5 or more Vehicles | 18 (1.8%) | 0 (0.0%) |
| Total | 1,014 (100.0%) | 1,274 (100.0%) |
Commute Time in Bridgeport
The most frequently occuring commute durations in Bridgeport are 15 to 19 minutes (596 commuters, 26.6%), 10 to 14 minutes (410 commuters, 18.3%), and 20 to 24 minutes (399 commuters, 17.8%).
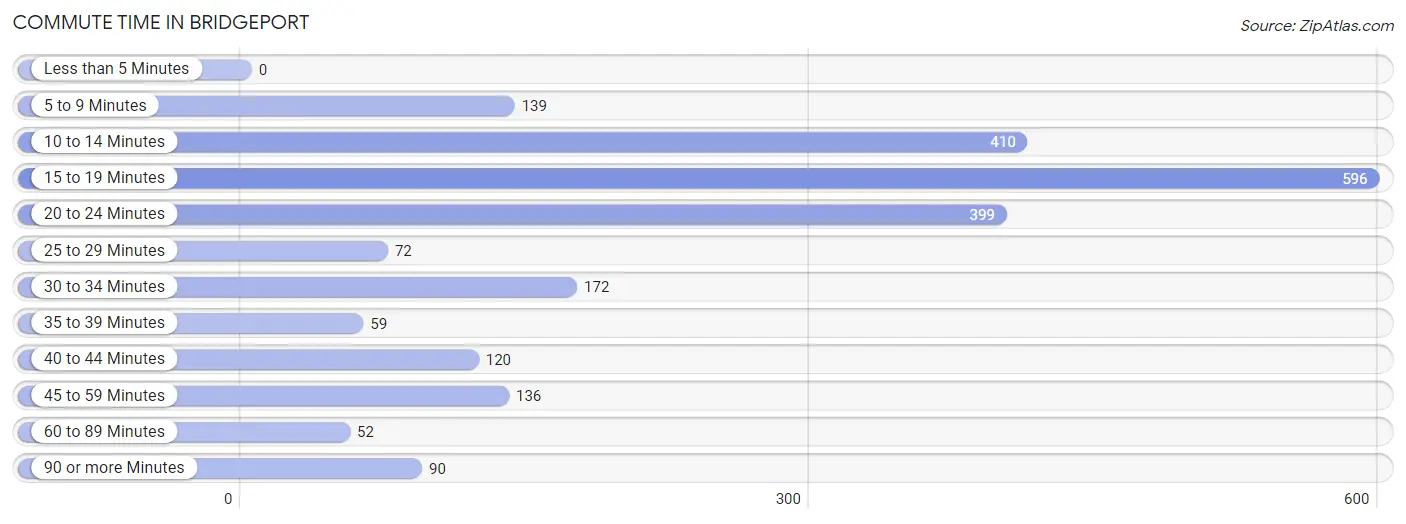
| Commute Time | # Commuters | % Commuters |
| Less than 5 Minutes | 0 | 0.0% |
| 5 to 9 Minutes | 139 | 6.2% |
| 10 to 14 Minutes | 410 | 18.3% |
| 15 to 19 Minutes | 596 | 26.6% |
| 20 to 24 Minutes | 399 | 17.8% |
| 25 to 29 Minutes | 72 | 3.2% |
| 30 to 34 Minutes | 172 | 7.7% |
| 35 to 39 Minutes | 59 | 2.6% |
| 40 to 44 Minutes | 120 | 5.3% |
| 45 to 59 Minutes | 136 | 6.1% |
| 60 to 89 Minutes | 52 | 2.3% |
| 90 or more Minutes | 90 | 4.0% |
Commute Time by Sex in Bridgeport
The most common commute times in Bridgeport are 10 to 14 minutes (192 commuters, 19.3%) for males and 15 to 19 minutes (440 commuters, 35.2%) for females.
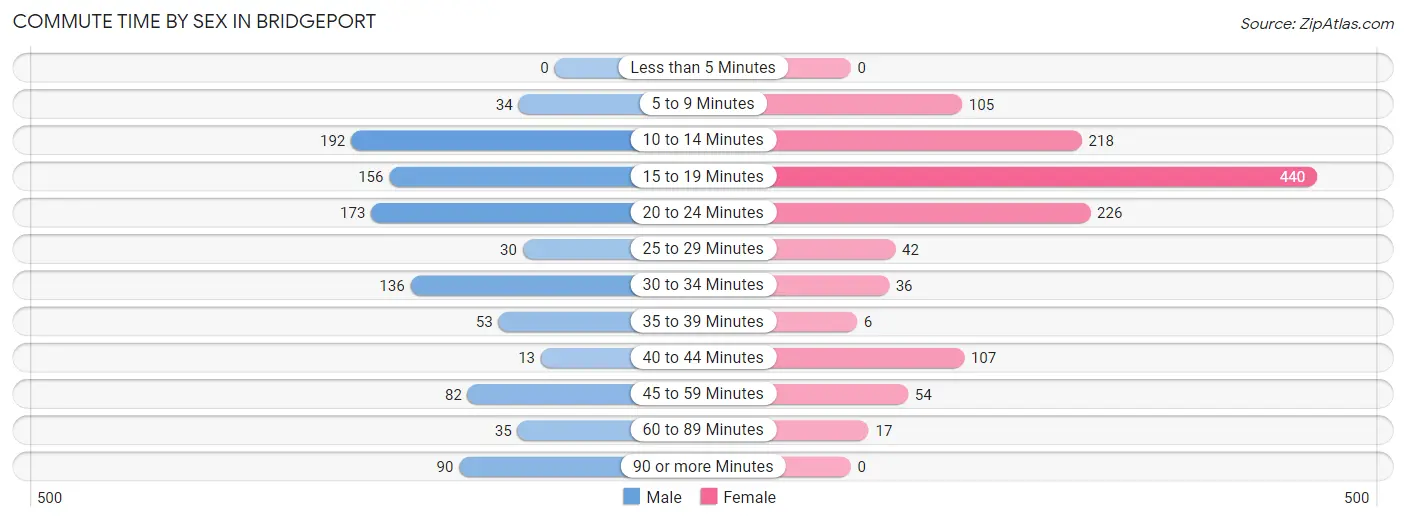
| Commute Time | Male | Female |
| Less than 5 Minutes | 0 (0.0%) | 0 (0.0%) |
| 5 to 9 Minutes | 34 (3.4%) | 105 (8.4%) |
| 10 to 14 Minutes | 192 (19.3%) | 218 (17.4%) |
| 15 to 19 Minutes | 156 (15.7%) | 440 (35.2%) |
| 20 to 24 Minutes | 173 (17.4%) | 226 (18.1%) |
| 25 to 29 Minutes | 30 (3.0%) | 42 (3.4%) |
| 30 to 34 Minutes | 136 (13.7%) | 36 (2.9%) |
| 35 to 39 Minutes | 53 (5.3%) | 6 (0.5%) |
| 40 to 44 Minutes | 13 (1.3%) | 107 (8.6%) |
| 45 to 59 Minutes | 82 (8.3%) | 54 (4.3%) |
| 60 to 89 Minutes | 35 (3.5%) | 17 (1.4%) |
| 90 or more Minutes | 90 (9.0%) | 0 (0.0%) |
Time of Departure to Work by Sex in Bridgeport
The most frequent times of departure to work in Bridgeport are 12:00 PM to 3:59 PM (139, 14.0%) for males and 7:30 AM to 7:59 AM (226, 18.1%) for females.
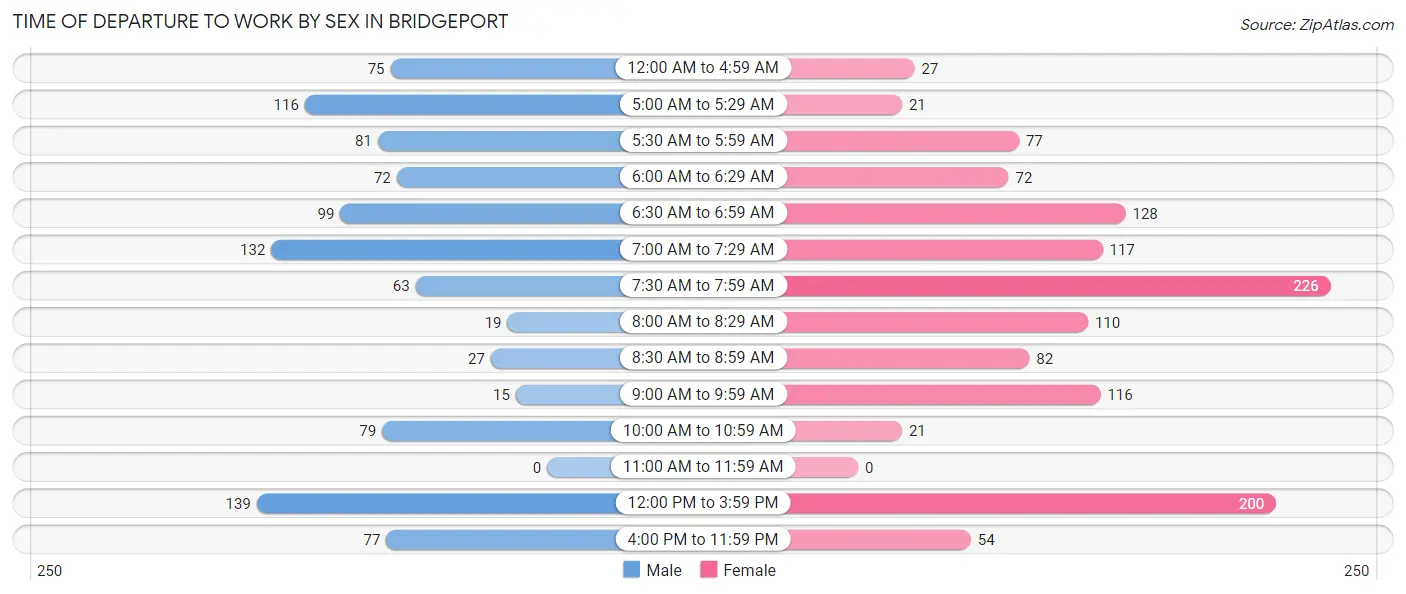
| Time of Departure | Male | Female |
| 12:00 AM to 4:59 AM | 75 (7.5%) | 27 (2.2%) |
| 5:00 AM to 5:29 AM | 116 (11.7%) | 21 (1.7%) |
| 5:30 AM to 5:59 AM | 81 (8.2%) | 77 (6.2%) |
| 6:00 AM to 6:29 AM | 72 (7.2%) | 72 (5.8%) |
| 6:30 AM to 6:59 AM | 99 (10.0%) | 128 (10.2%) |
| 7:00 AM to 7:29 AM | 132 (13.3%) | 117 (9.3%) |
| 7:30 AM to 7:59 AM | 63 (6.3%) | 226 (18.1%) |
| 8:00 AM to 8:29 AM | 19 (1.9%) | 110 (8.8%) |
| 8:30 AM to 8:59 AM | 27 (2.7%) | 82 (6.6%) |
| 9:00 AM to 9:59 AM | 15 (1.5%) | 116 (9.3%) |
| 10:00 AM to 10:59 AM | 79 (8.0%) | 21 (1.7%) |
| 11:00 AM to 11:59 AM | 0 (0.0%) | 0 (0.0%) |
| 12:00 PM to 3:59 PM | 139 (14.0%) | 200 (16.0%) |
| 4:00 PM to 11:59 PM | 77 (7.7%) | 54 (4.3%) |
| Total | 994 (100.0%) | 1,251 (100.0%) |
Housing Occupancy in Bridgeport
Occupancy by Ownership in Bridgeport
Of the total 2,691 dwellings in Bridgeport, owner-occupied units account for 1,773 (65.9%), while renter-occupied units make up 918 (34.1%).
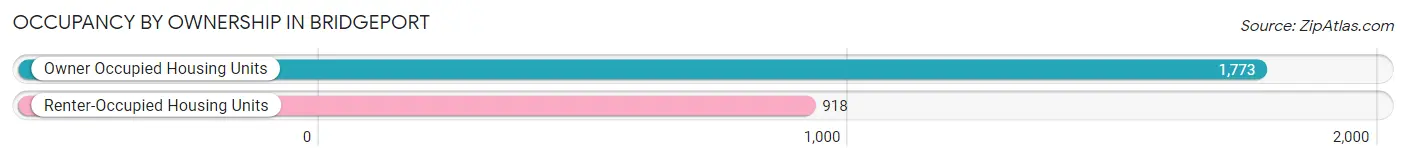
| Occupancy | # Housing Units | % Housing Units |
| Owner Occupied Housing Units | 1,773 | 65.9% |
| Renter-Occupied Housing Units | 918 | 34.1% |
| Total Occupied Housing Units | 2,691 | 100.0% |
Occupancy by Household Size in Bridgeport
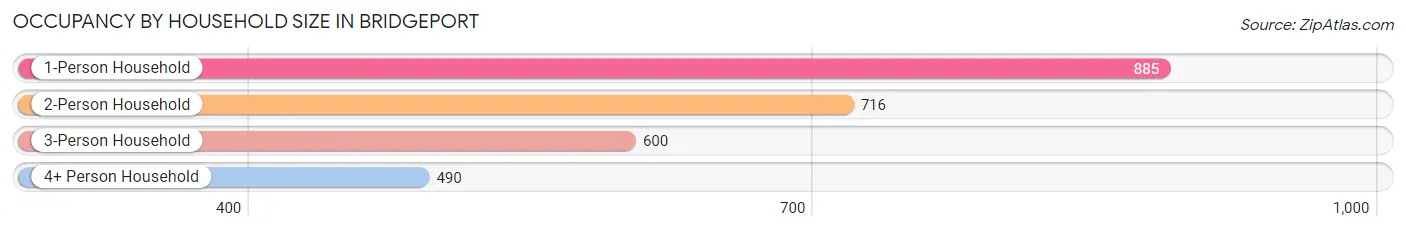
| Household Size | # Housing Units | % Housing Units |
| 1-Person Household | 885 | 32.9% |
| 2-Person Household | 716 | 26.6% |
| 3-Person Household | 600 | 22.3% |
| 4+ Person Household | 490 | 18.2% |
| Total Housing Units | 2,691 | 100.0% |
Occupancy by Ownership by Household Size in Bridgeport
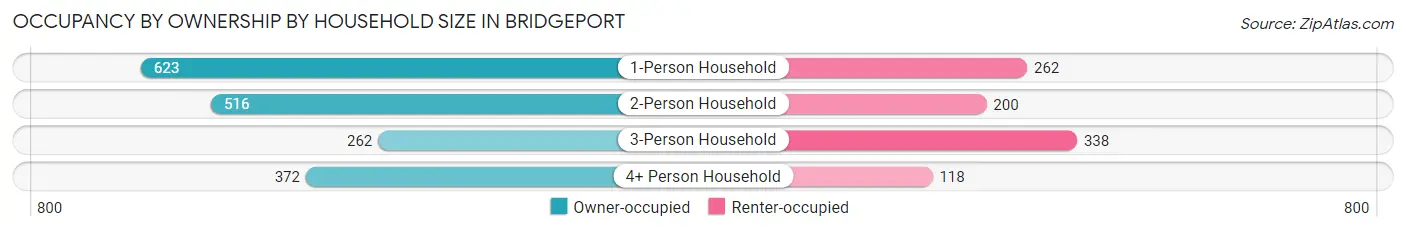
| Household Size | Owner-occupied | Renter-occupied |
| 1-Person Household | 623 (70.4%) | 262 (29.6%) |
| 2-Person Household | 516 (72.1%) | 200 (27.9%) |
| 3-Person Household | 262 (43.7%) | 338 (56.3%) |
| 4+ Person Household | 372 (75.9%) | 118 (24.1%) |
| Total Housing Units | 1,773 (65.9%) | 918 (34.1%) |
Occupancy by Educational Attainment in Bridgeport
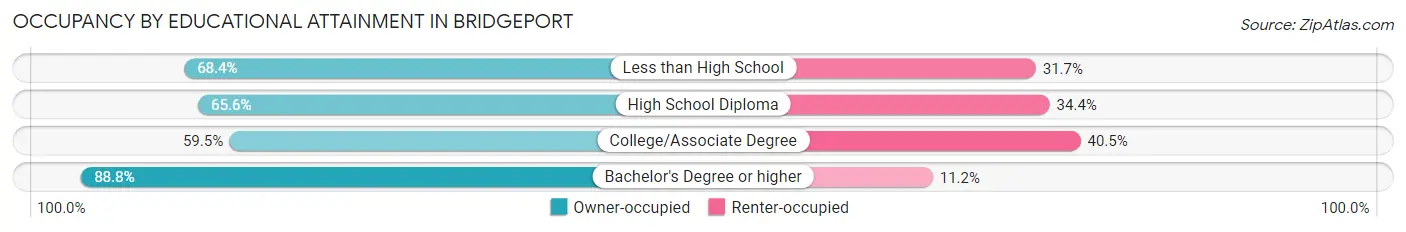
| Household Size | Owner-occupied | Renter-occupied |
| Less than High School | 244 (68.3%) | 113 (31.7%) |
| High School Diploma | 614 (65.6%) | 322 (34.4%) |
| College/Associate Degree | 662 (59.5%) | 451 (40.5%) |
| Bachelor's Degree or higher | 253 (88.8%) | 32 (11.2%) |
Occupancy by Age of Householder in Bridgeport
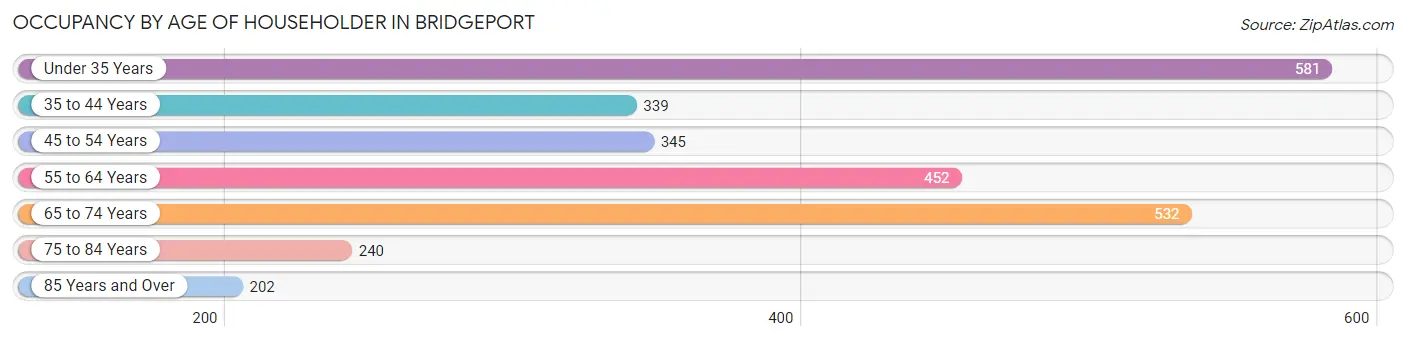
| Age Bracket | # Households | % Households |
| Under 35 Years | 581 | 21.6% |
| 35 to 44 Years | 339 | 12.6% |
| 45 to 54 Years | 345 | 12.8% |
| 55 to 64 Years | 452 | 16.8% |
| 65 to 74 Years | 532 | 19.8% |
| 75 to 84 Years | 240 | 8.9% |
| 85 Years and Over | 202 | 7.5% |
| Total | 2,691 | 100.0% |
Housing Finances in Bridgeport
Median Income by Occupancy in Bridgeport
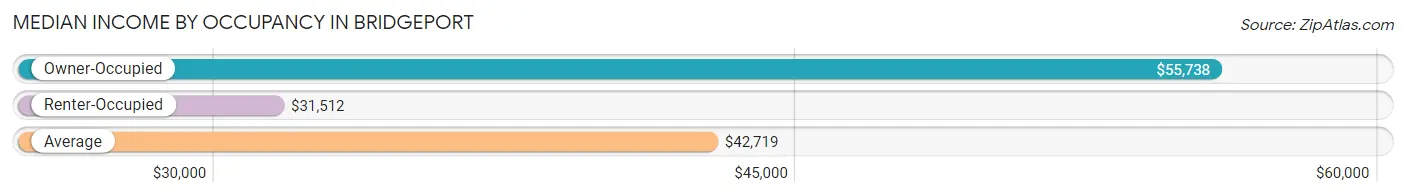
| Occupancy Type | # Households | Median Income |
| Owner-Occupied | 1,773 (65.9%) | $55,738 |
| Renter-Occupied | 918 (34.1%) | $31,512 |
| Average | 2,691 (100.0%) | $42,719 |
Occupancy by Householder Income Bracket in Bridgeport
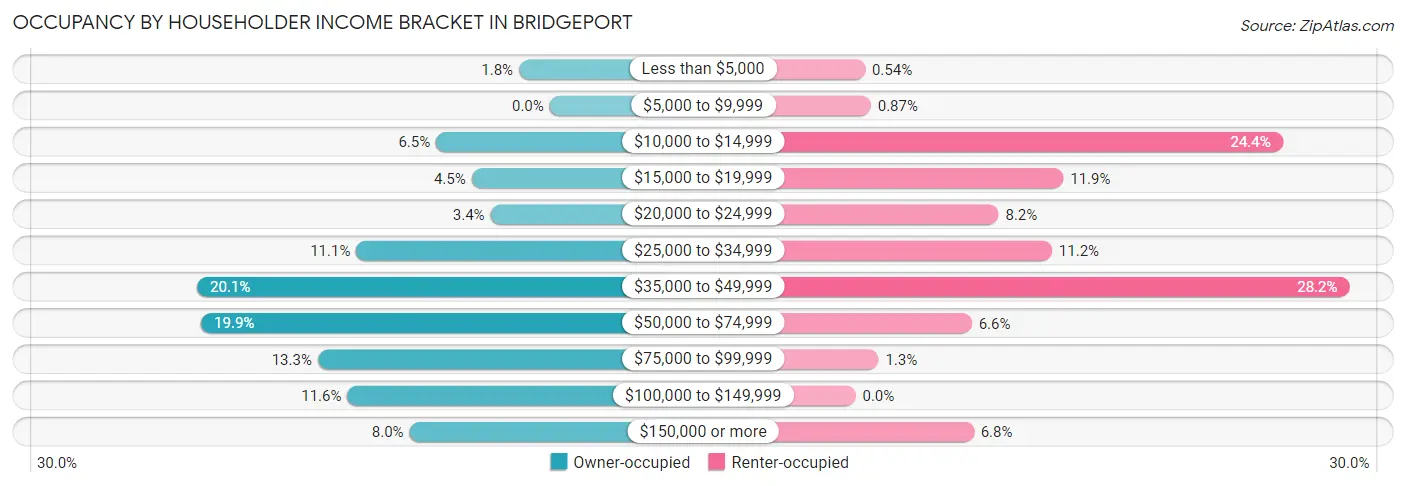
| Income Bracket | Owner-occupied | Renter-occupied |
| Less than $5,000 | 31 (1.8%) | 5 (0.5%) |
| $5,000 to $9,999 | 0 (0.0%) | 8 (0.9%) |
| $10,000 to $14,999 | 115 (6.5%) | 224 (24.4%) |
| $15,000 to $19,999 | 79 (4.5%) | 109 (11.9%) |
| $20,000 to $24,999 | 60 (3.4%) | 75 (8.2%) |
| $25,000 to $34,999 | 196 (11.1%) | 103 (11.2%) |
| $35,000 to $49,999 | 357 (20.1%) | 259 (28.2%) |
| $50,000 to $74,999 | 353 (19.9%) | 61 (6.6%) |
| $75,000 to $99,999 | 235 (13.3%) | 12 (1.3%) |
| $100,000 to $149,999 | 205 (11.6%) | 0 (0.0%) |
| $150,000 or more | 142 (8.0%) | 62 (6.8%) |
| Total | 1,773 (100.0%) | 918 (100.0%) |
Monthly Housing Cost Tiers in Bridgeport
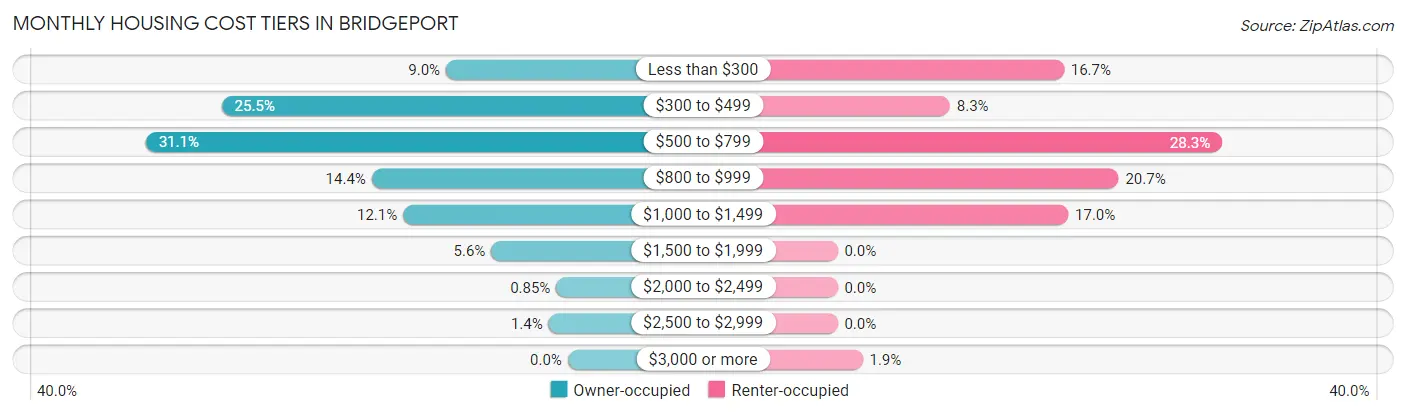
| Monthly Cost | Owner-occupied | Renter-occupied |
| Less than $300 | 159 (9.0%) | 153 (16.7%) |
| $300 to $499 | 452 (25.5%) | 76 (8.3%) |
| $500 to $799 | 551 (31.1%) | 260 (28.3%) |
| $800 to $999 | 256 (14.4%) | 190 (20.7%) |
| $1,000 to $1,499 | 215 (12.1%) | 156 (17.0%) |
| $1,500 to $1,999 | 100 (5.6%) | 0 (0.0%) |
| $2,000 to $2,499 | 15 (0.9%) | 0 (0.0%) |
| $2,500 to $2,999 | 25 (1.4%) | 0 (0.0%) |
| $3,000 or more | 0 (0.0%) | 17 (1.8%) |
| Total | 1,773 (100.0%) | 918 (100.0%) |
Physical Housing Characteristics in Bridgeport
Housing Structures in Bridgeport
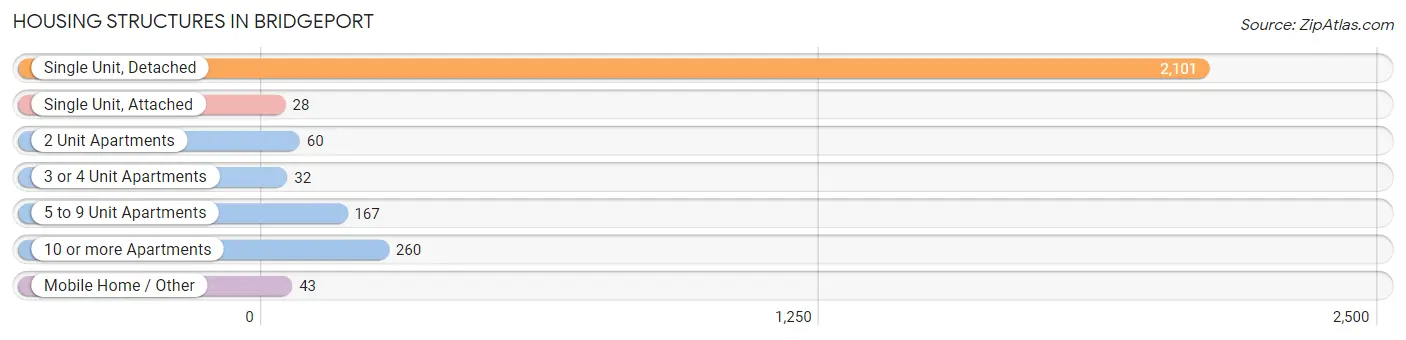
| Structure Type | # Housing Units | % Housing Units |
| Single Unit, Detached | 2,101 | 78.1% |
| Single Unit, Attached | 28 | 1.0% |
| 2 Unit Apartments | 60 | 2.2% |
| 3 or 4 Unit Apartments | 32 | 1.2% |
| 5 to 9 Unit Apartments | 167 | 6.2% |
| 10 or more Apartments | 260 | 9.7% |
| Mobile Home / Other | 43 | 1.6% |
| Total | 2,691 | 100.0% |
Housing Structures by Occupancy in Bridgeport
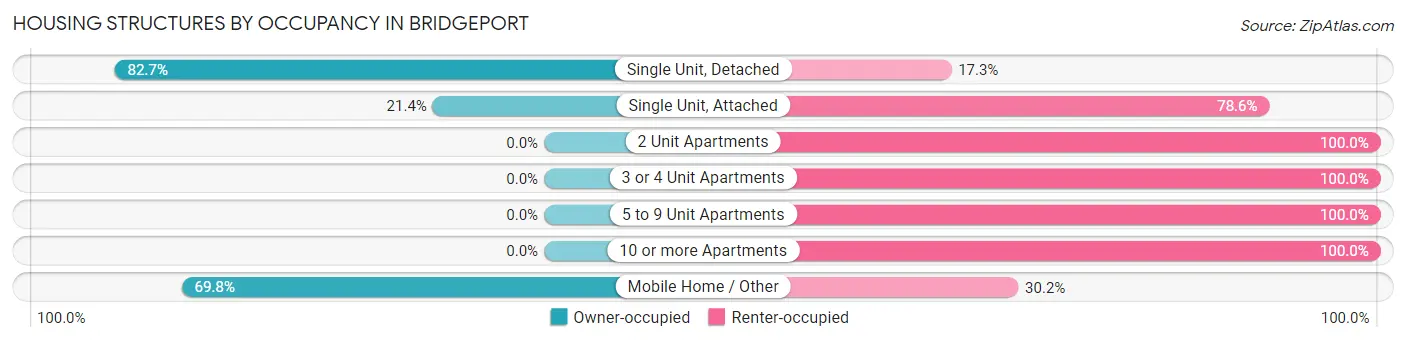
| Structure Type | Owner-occupied | Renter-occupied |
| Single Unit, Detached | 1,737 (82.7%) | 364 (17.3%) |
| Single Unit, Attached | 6 (21.4%) | 22 (78.6%) |
| 2 Unit Apartments | 0 (0.0%) | 60 (100.0%) |
| 3 or 4 Unit Apartments | 0 (0.0%) | 32 (100.0%) |
| 5 to 9 Unit Apartments | 0 (0.0%) | 167 (100.0%) |
| 10 or more Apartments | 0 (0.0%) | 260 (100.0%) |
| Mobile Home / Other | 30 (69.8%) | 13 (30.2%) |
| Total | 1,773 (65.9%) | 918 (34.1%) |
Housing Structures by Number of Rooms in Bridgeport
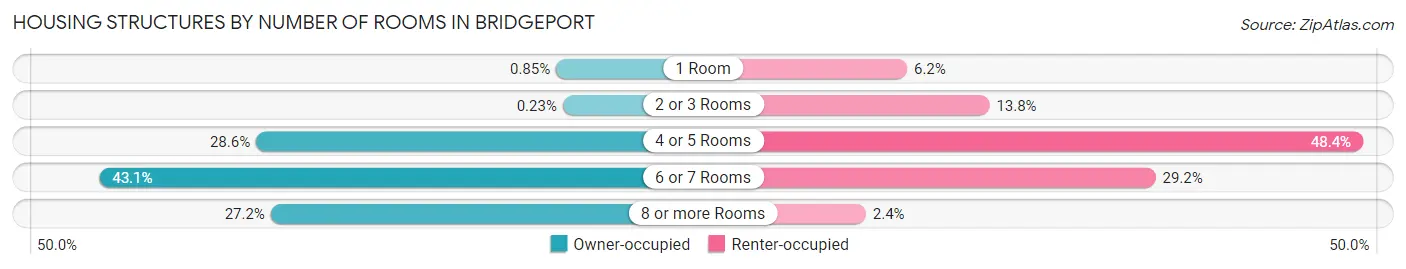
| Number of Rooms | Owner-occupied | Renter-occupied |
| 1 Room | 15 (0.9%) | 57 (6.2%) |
| 2 or 3 Rooms | 4 (0.2%) | 127 (13.8%) |
| 4 or 5 Rooms | 507 (28.6%) | 444 (48.4%) |
| 6 or 7 Rooms | 764 (43.1%) | 268 (29.2%) |
| 8 or more Rooms | 483 (27.2%) | 22 (2.4%) |
| Total | 1,773 (100.0%) | 918 (100.0%) |
Housing Structure by Heating Type in Bridgeport
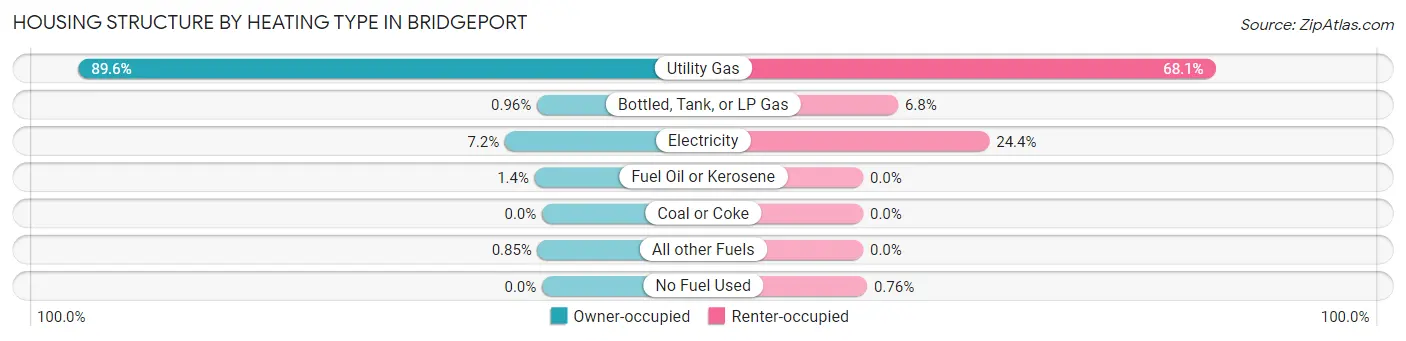
| Heating Type | Owner-occupied | Renter-occupied |
| Utility Gas | 1,589 (89.6%) | 625 (68.1%) |
| Bottled, Tank, or LP Gas | 17 (1.0%) | 62 (6.8%) |
| Electricity | 127 (7.2%) | 224 (24.4%) |
| Fuel Oil or Kerosene | 25 (1.4%) | 0 (0.0%) |
| Coal or Coke | 0 (0.0%) | 0 (0.0%) |
| All other Fuels | 15 (0.9%) | 0 (0.0%) |
| No Fuel Used | 0 (0.0%) | 7 (0.8%) |
| Total | 1,773 (100.0%) | 918 (100.0%) |
Household Vehicle Usage in Bridgeport
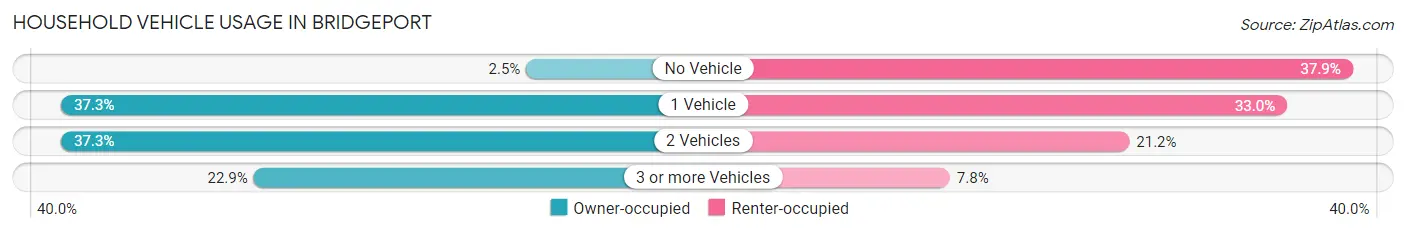
| Vehicles per Household | Owner-occupied | Renter-occupied |
| No Vehicle | 45 (2.5%) | 348 (37.9%) |
| 1 Vehicle | 661 (37.3%) | 303 (33.0%) |
| 2 Vehicles | 661 (37.3%) | 195 (21.2%) |
| 3 or more Vehicles | 406 (22.9%) | 72 (7.8%) |
| Total | 1,773 (100.0%) | 918 (100.0%) |
Real Estate & Mortgages in Bridgeport
Real Estate and Mortgage Overview in Bridgeport
| Characteristic | Without Mortgage | With Mortgage |
| Housing Units | 914 | 859 |
| Median Property Value | $76,000 | $84,400 |
| Median Household Income | $38,958 | $100 |
| Monthly Housing Costs | $457 | $0 |
| Real Estate Taxes | $1,439 | $65 |
Property Value by Mortgage Status in Bridgeport
| Property Value | Without Mortgage | With Mortgage |
| Less than $50,000 | 172 (18.8%) | 156 (18.2%) |
| $50,000 to $99,999 | 478 (52.3%) | 468 (54.5%) |
| $100,000 to $299,999 | 255 (27.9%) | 219 (25.5%) |
| $300,000 to $499,999 | 0 (0.0%) | 16 (1.9%) |
| $500,000 to $749,999 | 9 (1.0%) | 0 (0.0%) |
| $750,000 to $999,999 | 0 (0.0%) | 0 (0.0%) |
| $1,000,000 or more | 0 (0.0%) | 0 (0.0%) |
| Total | 914 (100.0%) | 859 (100.0%) |
Household Income by Mortgage Status in Bridgeport
| Household Income | Without Mortgage | With Mortgage |
| Less than $10,000 | 31 (3.4%) | 9 (1.1%) |
| $10,000 to $24,999 | 202 (22.1%) | 0 (0.0%) |
| $25,000 to $34,999 | 136 (14.9%) | 52 (6.0%) |
| $35,000 to $49,999 | 182 (19.9%) | 60 (7.0%) |
| $50,000 to $74,999 | 165 (18.0%) | 175 (20.4%) |
| $75,000 to $99,999 | 98 (10.7%) | 188 (21.9%) |
| $100,000 to $149,999 | 58 (6.4%) | 137 (16.0%) |
| $150,000 or more | 42 (4.6%) | 147 (17.1%) |
| Total | 914 (100.0%) | 859 (100.0%) |
Property Value to Household Income Ratio in Bridgeport
| Value-to-Income Ratio | Without Mortgage | With Mortgage |
| Less than 2.0x | 414 (45.3%) | 66,616 (7,755.1%) |
| 2.0x to 2.9x | 195 (21.3%) | 615 (71.6%) |
| 3.0x to 3.9x | 166 (18.2%) | 208 (24.2%) |
| 4.0x or more | 108 (11.8%) | 21 (2.4%) |
| Total | 914 (100.0%) | 859 (100.0%) |
Real Estate Taxes by Mortgage Status in Bridgeport
| Property Taxes | Without Mortgage | With Mortgage |
| Less than $800 | 97 (10.6%) | 0 (0.0%) |
| $800 to $1,499 | 376 (41.1%) | 99 (11.5%) |
| $800 to $1,499 | 411 (45.0%) | 327 (38.1%) |
| Total | 914 (100.0%) | 859 (100.0%) |
Health & Disability in Bridgeport
Health Insurance Coverage by Age in Bridgeport
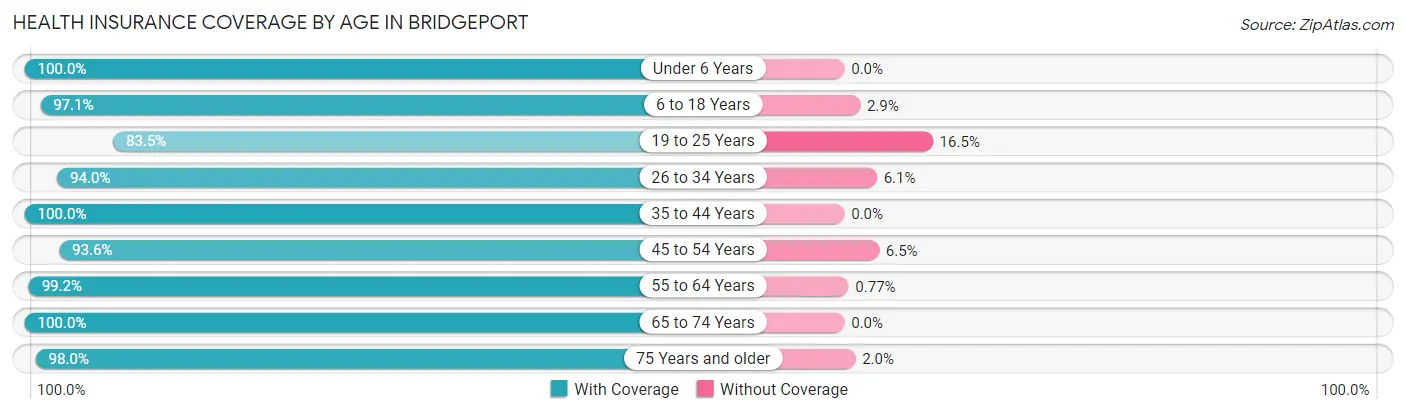
| Age Bracket | With Coverage | Without Coverage |
| Under 6 Years | 391 (100.0%) | 0 (0.0%) |
| 6 to 18 Years | 1,330 (97.1%) | 40 (2.9%) |
| 19 to 25 Years | 304 (83.5%) | 60 (16.5%) |
| 26 to 34 Years | 962 (94.0%) | 62 (6.0%) |
| 35 to 44 Years | 597 (100.0%) | 0 (0.0%) |
| 45 to 54 Years | 580 (93.5%) | 40 (6.5%) |
| 55 to 64 Years | 778 (99.2%) | 6 (0.8%) |
| 65 to 74 Years | 684 (100.0%) | 0 (0.0%) |
| 75 Years and older | 575 (98.0%) | 12 (2.0%) |
| Total | 6,201 (96.6%) | 220 (3.4%) |
Health Insurance Coverage by Citizenship Status in Bridgeport
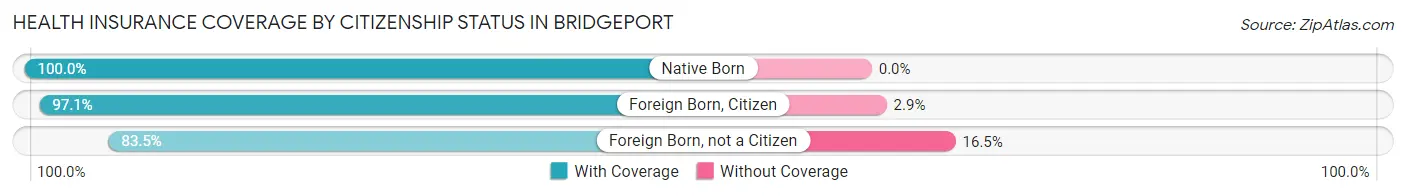
| Citizenship Status | With Coverage | Without Coverage |
| Native Born | 391 (100.0%) | 0 (0.0%) |
| Foreign Born, Citizen | 1,330 (97.1%) | 40 (2.9%) |
| Foreign Born, not a Citizen | 304 (83.5%) | 60 (16.5%) |
Health Insurance Coverage by Household Income in Bridgeport
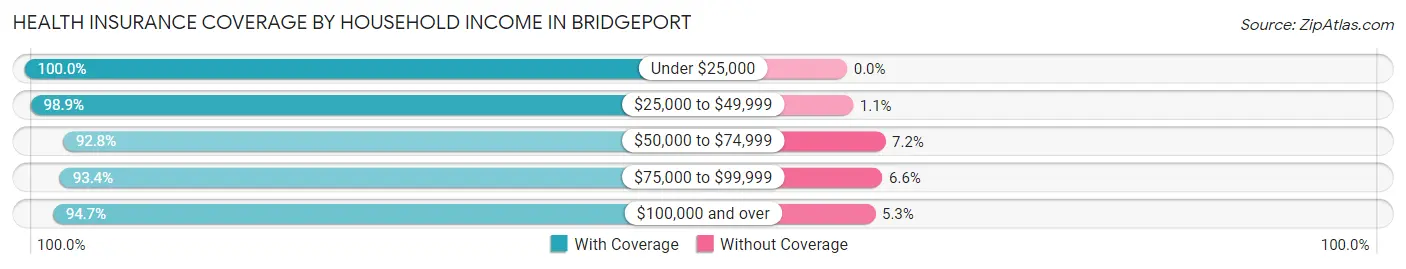
| Household Income | With Coverage | Without Coverage |
| Under $25,000 | 1,322 (100.0%) | 0 (0.0%) |
| $25,000 to $49,999 | 1,901 (98.9%) | 22 (1.1%) |
| $50,000 to $74,999 | 1,049 (92.8%) | 81 (7.2%) |
| $75,000 to $99,999 | 721 (93.4%) | 51 (6.6%) |
| $100,000 and over | 1,181 (94.7%) | 66 (5.3%) |
Public vs Private Health Insurance Coverage by Age in Bridgeport
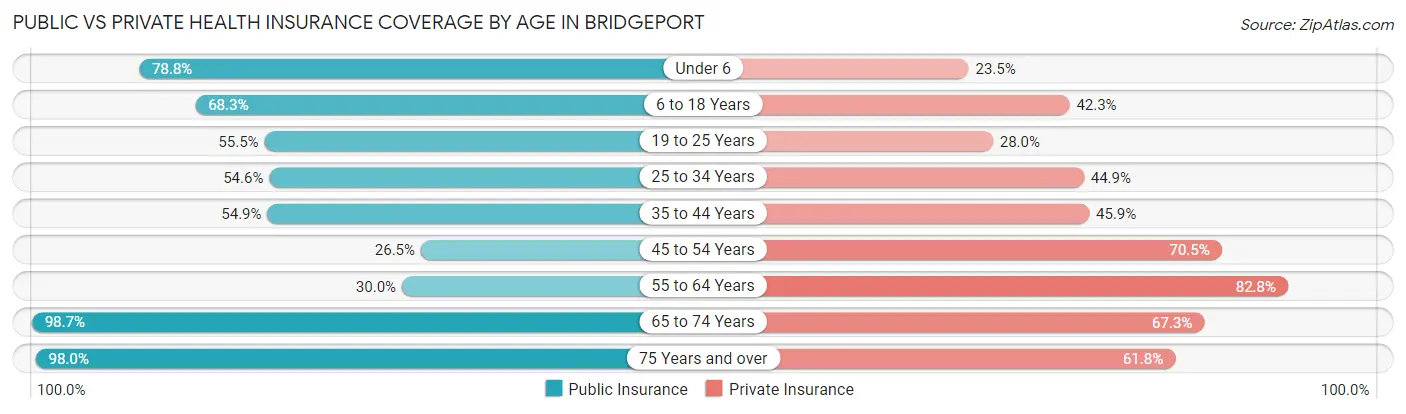
| Age Bracket | Public Insurance | Private Insurance |
| Under 6 | 308 (78.8%) | 92 (23.5%) |
| 6 to 18 Years | 936 (68.3%) | 579 (42.3%) |
| 19 to 25 Years | 202 (55.5%) | 102 (28.0%) |
| 25 to 34 Years | 559 (54.6%) | 460 (44.9%) |
| 35 to 44 Years | 328 (54.9%) | 274 (45.9%) |
| 45 to 54 Years | 164 (26.5%) | 437 (70.5%) |
| 55 to 64 Years | 235 (30.0%) | 649 (82.8%) |
| 65 to 74 Years | 675 (98.7%) | 460 (67.2%) |
| 75 Years and over | 575 (98.0%) | 363 (61.8%) |
| Total | 3,982 (62.0%) | 3,416 (53.2%) |
Disability Status by Sex by Age in Bridgeport
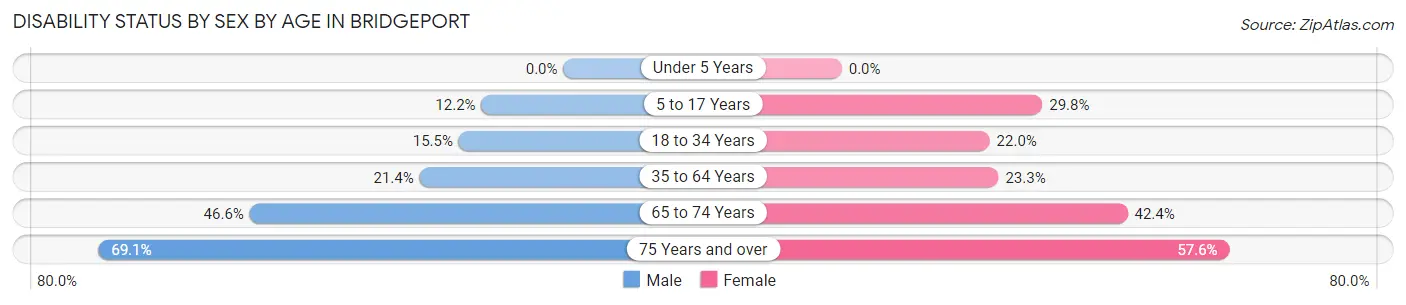
| Age Bracket | Male | Female |
| Under 5 Years | 0 (0.0%) | 0 (0.0%) |
| 5 to 17 Years | 64 (12.2%) | 223 (29.8%) |
| 18 to 34 Years | 109 (15.5%) | 179 (22.0%) |
| 35 to 64 Years | 174 (21.3%) | 276 (23.3%) |
| 65 to 74 Years | 177 (46.6%) | 129 (42.4%) |
| 75 Years and over | 145 (69.1%) | 217 (57.6%) |
Disability Class by Sex by Age in Bridgeport
Disability Class: Hearing Difficulty
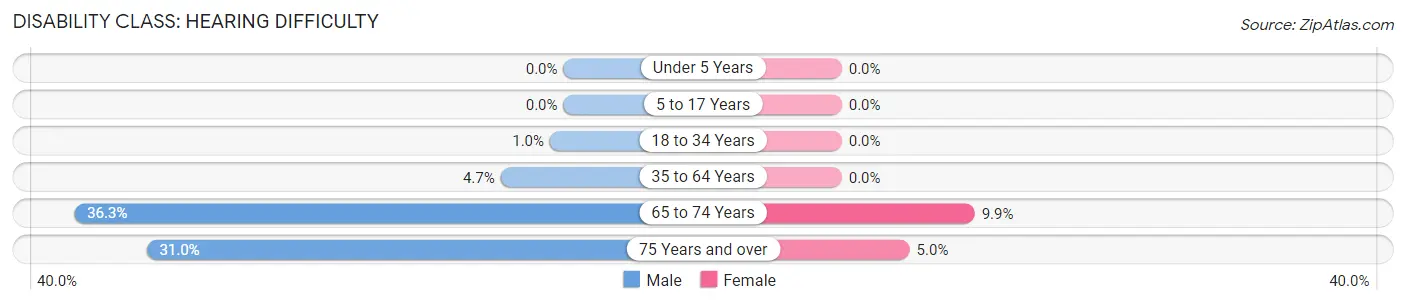
| Age Bracket | Male | Female |
| Under 5 Years | 0 (0.0%) | 0 (0.0%) |
| 5 to 17 Years | 0 (0.0%) | 0 (0.0%) |
| 18 to 34 Years | 7 (1.0%) | 0 (0.0%) |
| 35 to 64 Years | 38 (4.7%) | 0 (0.0%) |
| 65 to 74 Years | 138 (36.3%) | 30 (9.9%) |
| 75 Years and over | 65 (30.9%) | 19 (5.0%) |
Disability Class: Vision Difficulty
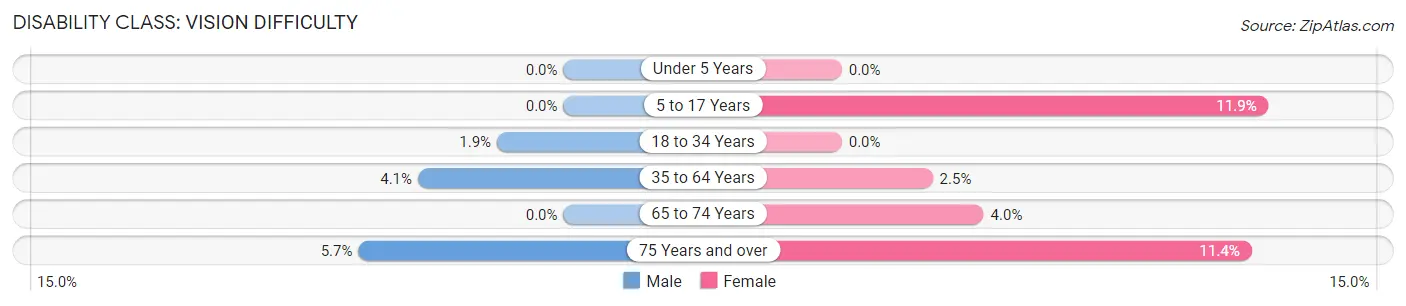
| Age Bracket | Male | Female |
| Under 5 Years | 0 (0.0%) | 0 (0.0%) |
| 5 to 17 Years | 0 (0.0%) | 89 (11.9%) |
| 18 to 34 Years | 13 (1.8%) | 0 (0.0%) |
| 35 to 64 Years | 33 (4.1%) | 30 (2.5%) |
| 65 to 74 Years | 0 (0.0%) | 12 (4.0%) |
| 75 Years and over | 12 (5.7%) | 43 (11.4%) |
Disability Class: Cognitive Difficulty
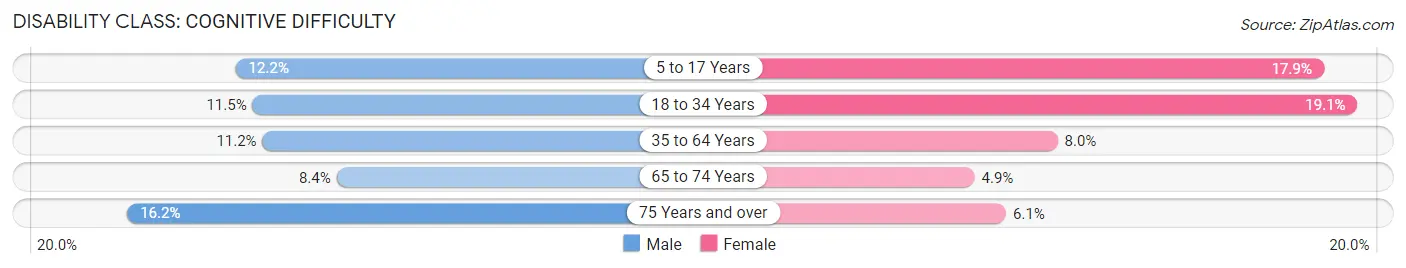
| Age Bracket | Male | Female |
| 5 to 17 Years | 64 (12.2%) | 134 (17.9%) |
| 18 to 34 Years | 81 (11.5%) | 156 (19.1%) |
| 35 to 64 Years | 91 (11.2%) | 95 (8.0%) |
| 65 to 74 Years | 32 (8.4%) | 15 (4.9%) |
| 75 Years and over | 34 (16.2%) | 23 (6.1%) |
Disability Class: Ambulatory Difficulty
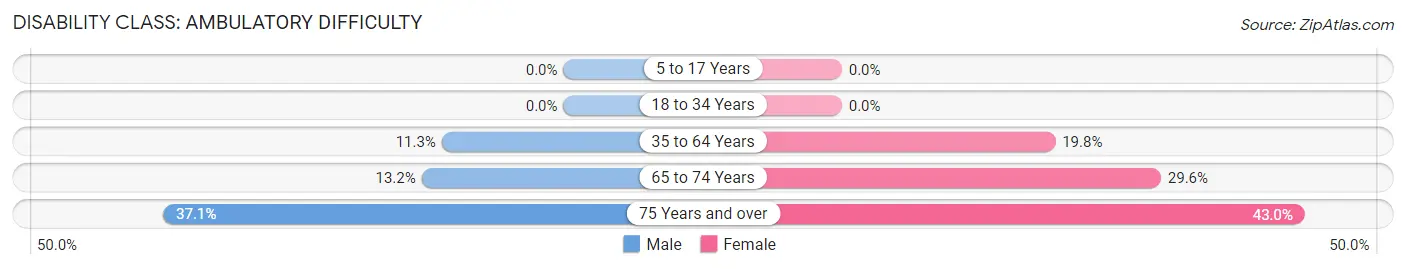
| Age Bracket | Male | Female |
| 5 to 17 Years | 0 (0.0%) | 0 (0.0%) |
| 18 to 34 Years | 0 (0.0%) | 0 (0.0%) |
| 35 to 64 Years | 92 (11.3%) | 235 (19.8%) |
| 65 to 74 Years | 50 (13.2%) | 90 (29.6%) |
| 75 Years and over | 78 (37.1%) | 162 (43.0%) |
Disability Class: Self-Care Difficulty
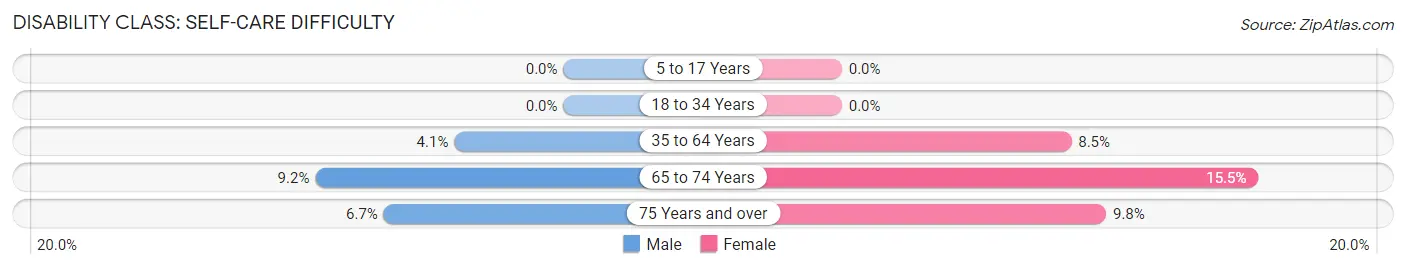
| Age Bracket | Male | Female |
| 5 to 17 Years | 0 (0.0%) | 0 (0.0%) |
| 18 to 34 Years | 0 (0.0%) | 0 (0.0%) |
| 35 to 64 Years | 33 (4.1%) | 101 (8.5%) |
| 65 to 74 Years | 35 (9.2%) | 47 (15.5%) |
| 75 Years and over | 14 (6.7%) | 37 (9.8%) |
Technology Access in Bridgeport
Computing Device Access in Bridgeport
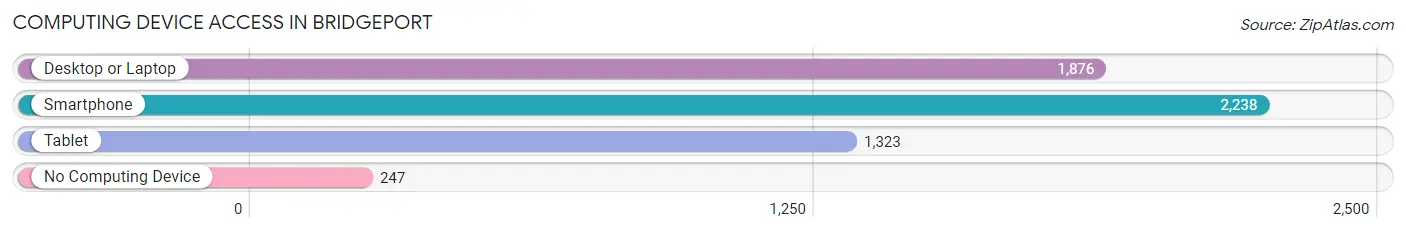
| Device Type | # Households | % Households |
| Desktop or Laptop | 1,876 | 69.7% |
| Smartphone | 2,238 | 83.2% |
| Tablet | 1,323 | 49.2% |
| No Computing Device | 247 | 9.2% |
| Total | 2,691 | 100.0% |
Internet Access in Bridgeport
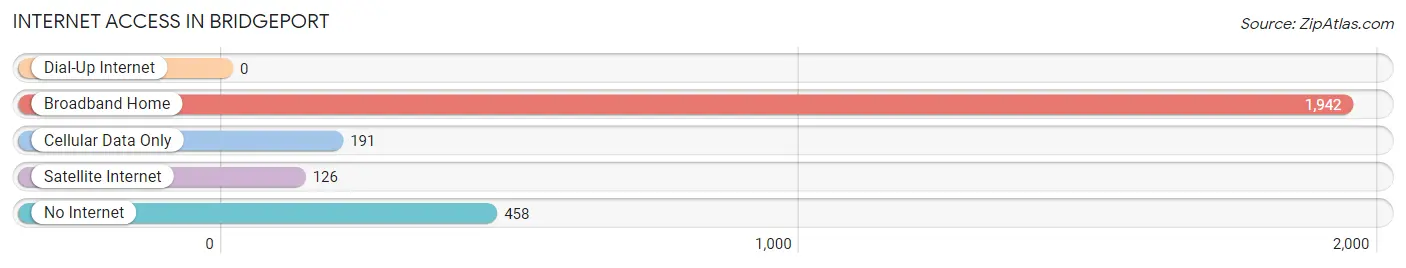
| Internet Type | # Households | % Households |
| Dial-Up Internet | 0 | 0.0% |
| Broadband Home | 1,942 | 72.2% |
| Cellular Data Only | 191 | 7.1% |
| Satellite Internet | 126 | 4.7% |
| No Internet | 458 | 17.0% |
| Total | 2,691 | 100.0% |
Bridgeport Summary
Bridgeport, Michigan is a small city located in Saginaw County, Michigan. It is situated on the Saginaw River, approximately 10 miles north of Saginaw. The city has a population of approximately 8,000 people and is part of the Saginaw Metropolitan Statistical Area.
History
The area that is now Bridgeport was first settled in 1837 by a group of German immigrants. The settlement was originally known as Frankenlust, and was later renamed Bridgeport in 1854. The name was chosen to reflect the fact that the settlement was located at the site of a bridge that crossed the Saginaw River.
The city was incorporated in 1871 and quickly became an important industrial center. The city was home to several factories, including a paper mill, a sawmill, and a flour mill. The city also had a large lumber industry, which was a major source of employment for the residents.
Geography
Bridgeport is located in Saginaw County, Michigan. It is situated on the Saginaw River, approximately 10 miles north of Saginaw. The city has a total area of 4.2 square miles, all of which is land. The city is located in a flat, low-lying area, with an elevation of approximately 690 feet above sea level.
The climate in Bridgeport is classified as humid continental, with hot, humid summers and cold, snowy winters. The average annual temperature is approximately 48°F, with an average high of 68°F in the summer and an average low of 28°F in the winter.
Economy
The economy of Bridgeport is largely based on manufacturing and services. The city is home to several factories, including a paper mill, a sawmill, and a flour mill. The city also has a large lumber industry, which is a major source of employment for the residents.
In addition to manufacturing, Bridgeport is also home to several retail stores, restaurants, and other businesses. The city is also home to several medical facilities, including a hospital and several clinics.
Demographics
As of the 2010 census, the population of Bridgeport was 8,068. The racial makeup of the city was 87.3% White, 8.2% African American, 0.4% Native American, 0.7% Asian, 0.1% Pacific Islander, and 2.3% from other races. Hispanic or Latino of any race were 3.2% of the population.
The median household income in Bridgeport was $37,917, and the median family income was $45,938. The per capita income was $19,945. About 16.2% of the population was below the poverty line.
Bridgeport is a small city with a rich history and a diverse economy. The city is home to several factories, retail stores, restaurants, and other businesses. The city also has a large lumber industry, which is a major source of employment for the residents. The population of Bridgeport is largely white, with a small percentage of African Americans, Native Americans, Asians, and other races. The median household income in Bridgeport is slightly below the national average, and the poverty rate is slightly higher than the national average.
Common Questions
What is Per Capita Income in Bridgeport?
Per Capita income in Bridgeport is $27,285.
What is the Median Family Income in Bridgeport?
Median Family Income in Bridgeport is $51,042.
What is the Median Household income in Bridgeport?
Median Household Income in Bridgeport is $42,719.
What is Income or Wage Gap in Bridgeport?
Income or Wage Gap in Bridgeport is 35.7%.
Women in Bridgeport earn 64.3 cents for every dollar earned by a man.
What is Family Income Deficit in Bridgeport?
Family Income Deficit in Bridgeport is $9,111.
Families that are below poverty line in Bridgeport earn $9,111 less on average than the poverty threshold level.
What is Inequality or Gini Index in Bridgeport?
Inequality or Gini Index in Bridgeport is 0.49.
What is the Total Population of Bridgeport?
Total Population of Bridgeport is 6,495.
What is the Total Male Population of Bridgeport?
Total Male Population of Bridgeport is 2,838.
What is the Total Female Population of Bridgeport?
Total Female Population of Bridgeport is 3,657.
What is the Ratio of Males per 100 Females in Bridgeport?
There are 77.60 Males per 100 Females in Bridgeport.
What is the Ratio of Females per 100 Males in Bridgeport?
There are 128.86 Females per 100 Males in Bridgeport.
What is the Median Population Age in Bridgeport?
Median Population Age in Bridgeport is 37.1 Years.
What is the Average Family Size in Bridgeport
Average Family Size in Bridgeport is 2.9 People.
What is the Average Household Size in Bridgeport
Average Household Size in Bridgeport is 2.4 People.
How Large is the Labor Force in Bridgeport?
There are 2,482 People in the Labor Forcein in Bridgeport.
What is the Percentage of People in the Labor Force in Bridgeport?
48.5% of People are in the Labor Force in Bridgeport.
What is the Unemployment Rate in Bridgeport?
Unemployment Rate in Bridgeport is 5.3%.