Breckenridge, MI Map & Demographics
Breckenridge Map
Breckenridge Overview
$26,453
PER CAPITA INCOME
$61,471
AVG FAMILY INCOME
$53,413
AVG HOUSEHOLD INCOME
23.2%
WAGE / INCOME GAP [ % ]
76.8¢/ $1
WAGE / INCOME GAP [ $ ]
$11,287
FAMILY INCOME DEFICIT
0.39
INEQUALITY / GINI INDEX
1,413
TOTAL POPULATION
720
MALE POPULATION
693
FEMALE POPULATION
103.90
MALES / 100 FEMALES
96.25
FEMALES / 100 MALES
38.7
MEDIAN AGE
2.9
AVG FAMILY SIZE
2.6
AVG HOUSEHOLD SIZE
661
LABOR FORCE [ PEOPLE ]
60.7%
PERCENT IN LABOR FORCE
8.2%
UNEMPLOYMENT RATE
Breckenridge Zip Codes
Breckenridge Area Codes
Income in Breckenridge
Income Overview in Breckenridge
Per Capita Income in Breckenridge is $26,453, while median incomes of families and households are $61,471 and $53,413 respectively.
| Characteristic | Number | Measure |
| Per Capita Income | 1,413 | $26,453 |
| Median Family Income | 386 | $61,471 |
| Mean Family Income | 386 | $76,841 |
| Median Household Income | 541 | $53,413 |
| Mean Household Income | 541 | $67,105 |
| Income Deficit | 386 | $11,287 |
| Wage / Income Gap (%) | 1,413 | 23.15% |
| Wage / Income Gap ($) | 1,413 | 76.85¢ per $1 |
| Gini / Inequality Index | 1,413 | 0.39 |
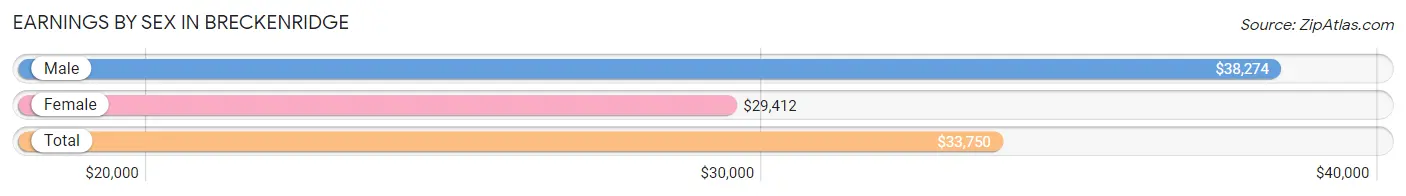
Earnings by Sex in Breckenridge
Average Earnings in Breckenridge are $33,750, $38,274 for men and $29,412 for women, a difference of 23.2%.
| Sex | Number | Average Earnings |
| Male | 304 (46.1%) | $38,274 |
| Female | 356 (53.9%) | $29,412 |
| Total | 660 (100.0%) | $33,750 |
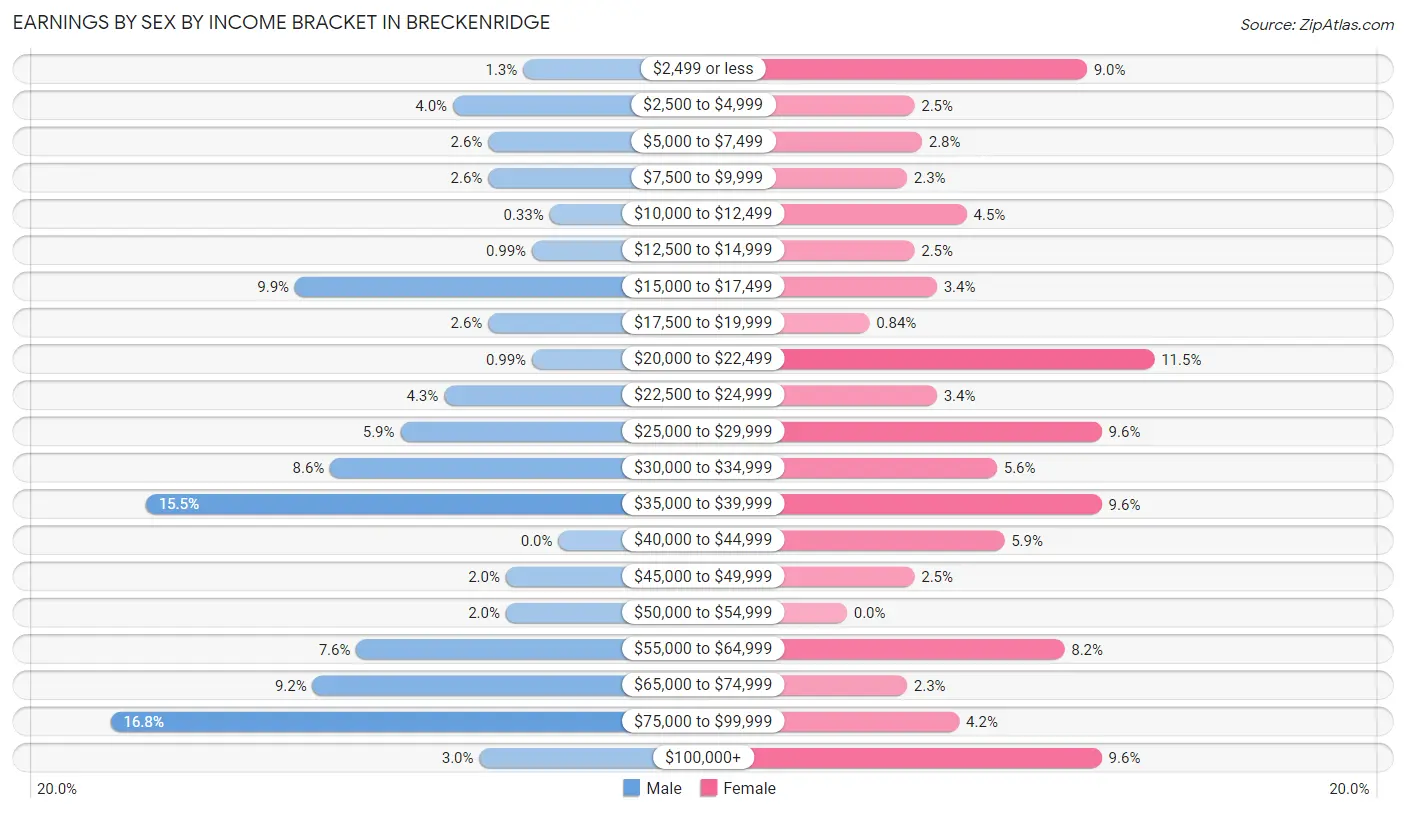
Earnings by Sex by Income Bracket in Breckenridge
The most common earnings brackets in Breckenridge are $75,000 to $99,999 for men (51 | 16.8%) and $20,000 to $22,499 for women (41 | 11.5%).
| Income | Male | Female |
| $2,499 or less | 4 (1.3%) | 32 (9.0%) |
| $2,500 to $4,999 | 12 (4.0%) | 9 (2.5%) |
| $5,000 to $7,499 | 8 (2.6%) | 10 (2.8%) |
| $7,500 to $9,999 | 8 (2.6%) | 8 (2.2%) |
| $10,000 to $12,499 | 1 (0.3%) | 16 (4.5%) |
| $12,500 to $14,999 | 3 (1.0%) | 9 (2.5%) |
| $15,000 to $17,499 | 30 (9.9%) | 12 (3.4%) |
| $17,500 to $19,999 | 8 (2.6%) | 3 (0.8%) |
| $20,000 to $22,499 | 3 (1.0%) | 41 (11.5%) |
| $22,500 to $24,999 | 13 (4.3%) | 12 (3.4%) |
| $25,000 to $29,999 | 18 (5.9%) | 34 (9.6%) |
| $30,000 to $34,999 | 26 (8.6%) | 20 (5.6%) |
| $35,000 to $39,999 | 47 (15.5%) | 34 (9.6%) |
| $40,000 to $44,999 | 0 (0.0%) | 21 (5.9%) |
| $45,000 to $49,999 | 6 (2.0%) | 9 (2.5%) |
| $50,000 to $54,999 | 6 (2.0%) | 0 (0.0%) |
| $55,000 to $64,999 | 23 (7.6%) | 29 (8.2%) |
| $65,000 to $74,999 | 28 (9.2%) | 8 (2.2%) |
| $75,000 to $99,999 | 51 (16.8%) | 15 (4.2%) |
| $100,000+ | 9 (3.0%) | 34 (9.6%) |
| Total | 304 (100.0%) | 356 (100.0%) |
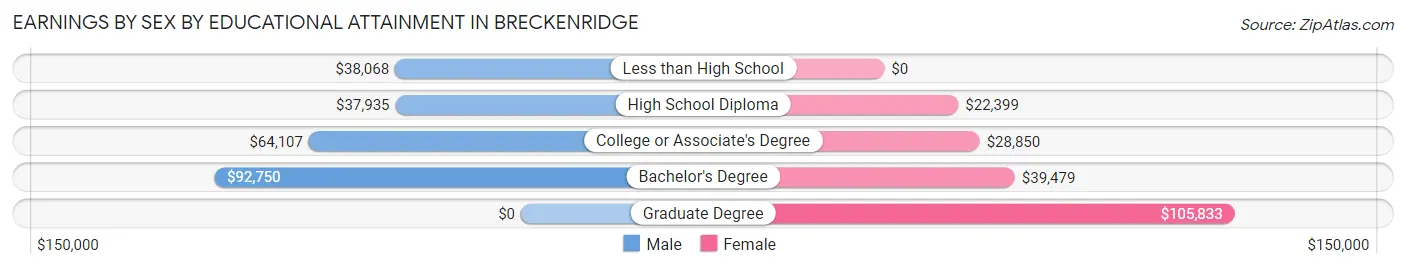
Earnings by Sex by Educational Attainment in Breckenridge
Average earnings in Breckenridge are $39,243 for men and $32,019 for women, a difference of 18.4%. Men with an educational attainment of bachelor's degree enjoy the highest average annual earnings of $92,750, while those with high school diploma education earn the least with $37,935. Women with an educational attainment of graduate degree earn the most with the average annual earnings of $105,833, while those with high school diploma education have the smallest earnings of $22,399.
| Educational Attainment | Male Income | Female Income |
| Less than High School | $38,068 | $0 |
| High School Diploma | $37,935 | $22,399 |
| College or Associate's Degree | $64,107 | $28,850 |
| Bachelor's Degree | $92,750 | $39,479 |
| Graduate Degree | - | - |
| Total | $39,243 | $32,019 |
Family Income in Breckenridge
Family Income Brackets in Breckenridge
According to the Breckenridge family income data, there are 79 families falling into the $50,000 to $74,999 income range, which is the most common income bracket and makes up 20.5% of all families. Conversely, the $200,000+ income bracket is the least frequent group with only 9 families (2.3%) belonging to this category.
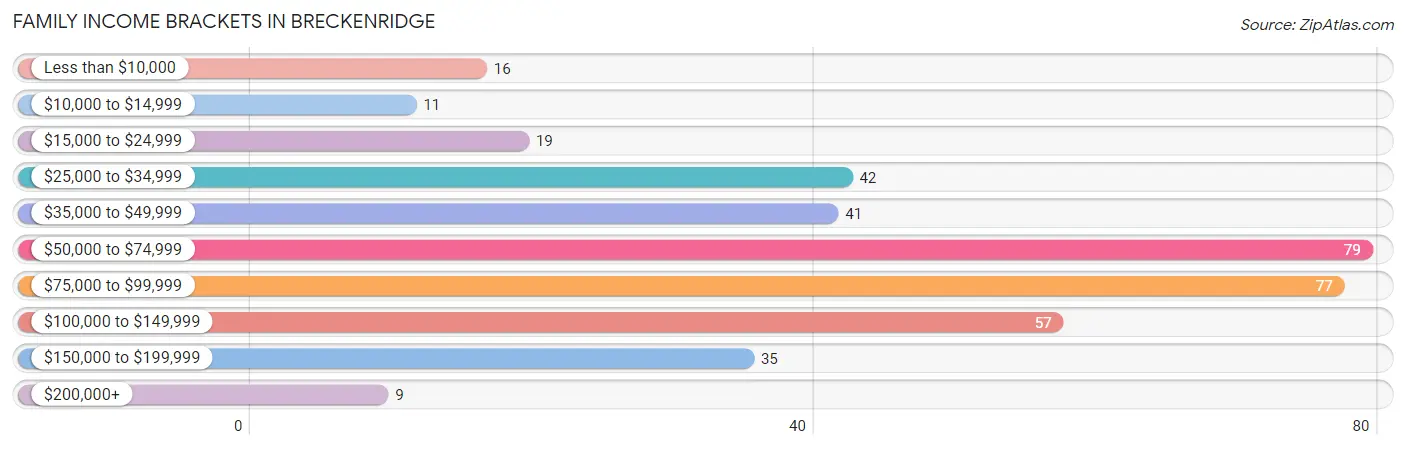
| Income Bracket | # Families | % Families |
| Less than $10,000 | 16 | 4.1% |
| $10,000 to $14,999 | 11 | 2.8% |
| $15,000 to $24,999 | 19 | 4.9% |
| $25,000 to $34,999 | 42 | 10.9% |
| $35,000 to $49,999 | 41 | 10.6% |
| $50,000 to $74,999 | 79 | 20.5% |
| $75,000 to $99,999 | 77 | 19.9% |
| $100,000 to $149,999 | 57 | 14.8% |
| $150,000 to $199,999 | 35 | 9.1% |
| $200,000+ | 9 | 2.3% |
Family Income by Famaliy Size in Breckenridge
3-person families (99 | 25.7%) account for the highest median family income in Breckenridge with $78,661 per family, while 3-person families (99 | 25.7%) have the highest median income of $26,220 per family member.
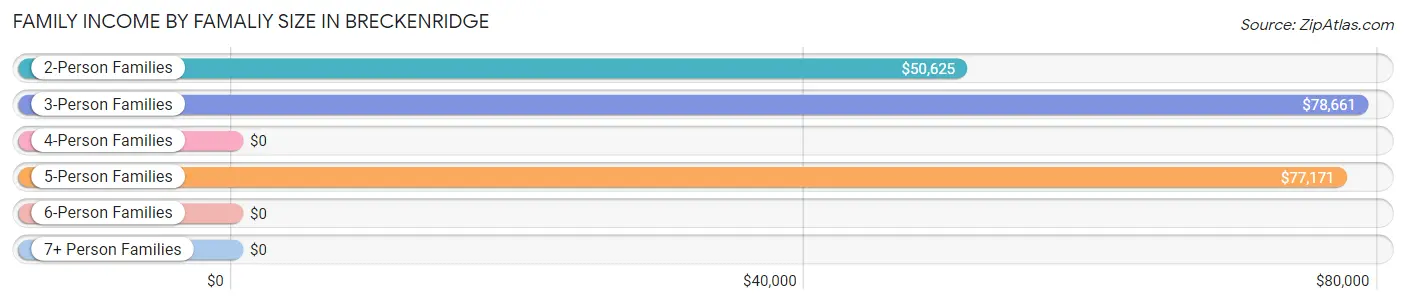
| Income Bracket | # Families | Median Income |
| 2-Person Families | 173 (44.8%) | $50,625 |
| 3-Person Families | 99 (25.7%) | $78,661 |
| 4-Person Families | 73 (18.9%) | $0 |
| 5-Person Families | 41 (10.6%) | $77,171 |
| 6-Person Families | 0 (0.0%) | $0 |
| 7+ Person Families | 0 (0.0%) | $0 |
| Total | 386 (100.0%) | $61,471 |
Family Income by Number of Earners in Breckenridge
The median family income in Breckenridge is $61,471, with families comprising 3+ earners (23) having the highest median family income of $195,417, while families with no earners (68) have the lowest median family income of $27,000, accounting for 6.0% and 17.6% of families, respectively.
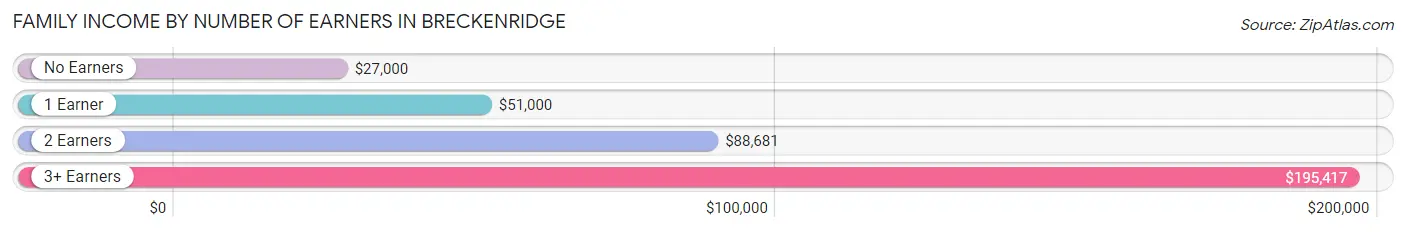
| Number of Earners | # Families | Median Income |
| No Earners | 68 (17.6%) | $27,000 |
| 1 Earner | 154 (39.9%) | $51,000 |
| 2 Earners | 141 (36.5%) | $88,681 |
| 3+ Earners | 23 (6.0%) | $195,417 |
| Total | 386 (100.0%) | $61,471 |
Household Income in Breckenridge
Household Income Brackets in Breckenridge
With 100 households falling in the category, the $50,000 to $74,999 income range is the most frequent in Breckenridge, accounting for 18.5% of all households. In contrast, only 7 households (1.3%) fall into the $10,000 to $14,999 income bracket, making it the least populous group.
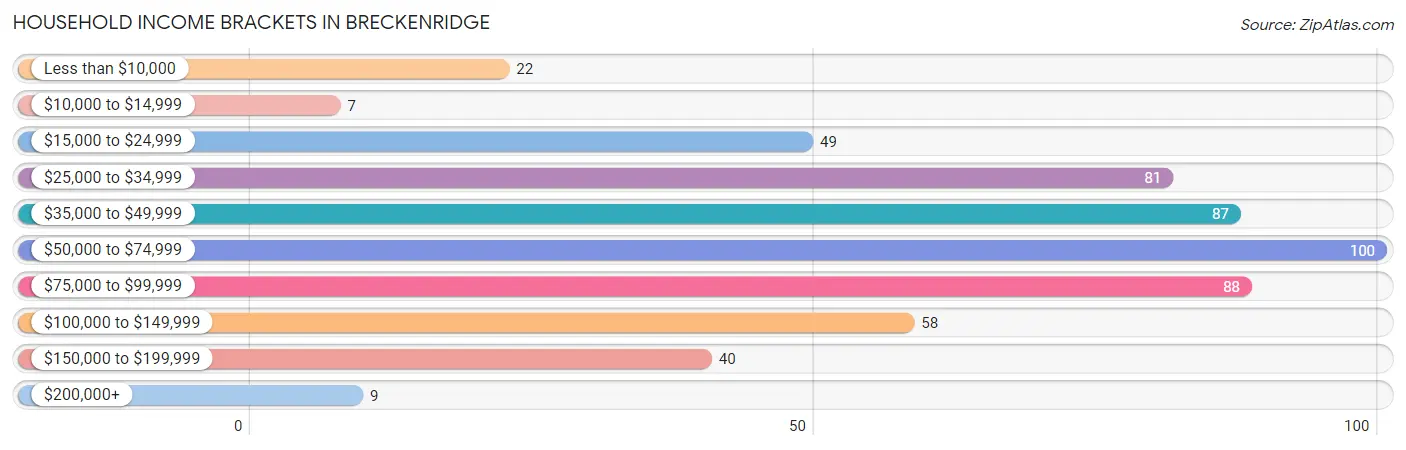
| Income Bracket | # Households | % Households |
| Less than $10,000 | 22 | 4.1% |
| $10,000 to $14,999 | 7 | 1.3% |
| $15,000 to $24,999 | 49 | 9.1% |
| $25,000 to $34,999 | 81 | 15.0% |
| $35,000 to $49,999 | 87 | 16.1% |
| $50,000 to $74,999 | 100 | 18.5% |
| $75,000 to $99,999 | 88 | 16.3% |
| $100,000 to $149,999 | 58 | 10.7% |
| $150,000 to $199,999 | 40 | 7.4% |
| $200,000+ | 9 | 1.7% |
Household Income by Householder Age in Breckenridge
The median household income in Breckenridge is $53,413, with the highest median household income of $66,563 found in the 25 to 44 years age bracket for the primary householder. A total of 201 households (37.1%) fall into this category. Meanwhile, the 15 to 24 years age bracket for the primary householder has the lowest median household income of $0, with 1 households (0.2%) in this group.
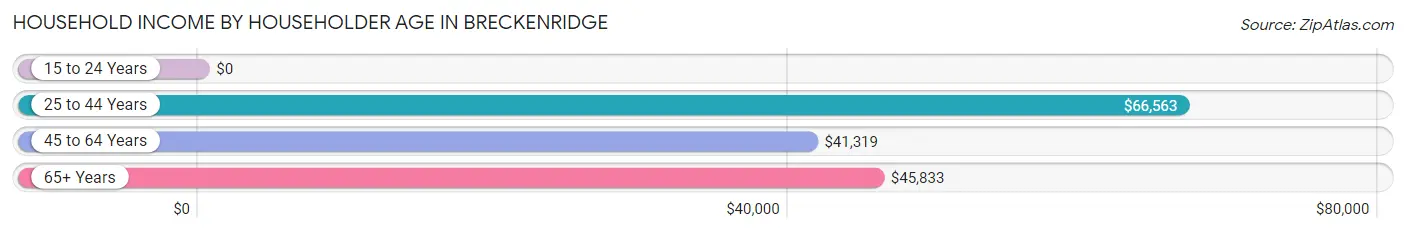
| Income Bracket | # Households | Median Income |
| 15 to 24 Years | 1 (0.2%) | $0 |
| 25 to 44 Years | 201 (37.1%) | $66,563 |
| 45 to 64 Years | 203 (37.5%) | $41,319 |
| 65+ Years | 136 (25.1%) | $45,833 |
| Total | 541 (100.0%) | $53,413 |
Poverty in Breckenridge
Income Below Poverty by Sex and Age in Breckenridge
With 10.7% poverty level for males and 18.9% for females among the residents of Breckenridge, under 5 year old males and under 5 year old females are the most vulnerable to poverty, with 10 males (50.0%) and 9 females (47.4%) in their respective age groups living below the poverty level.
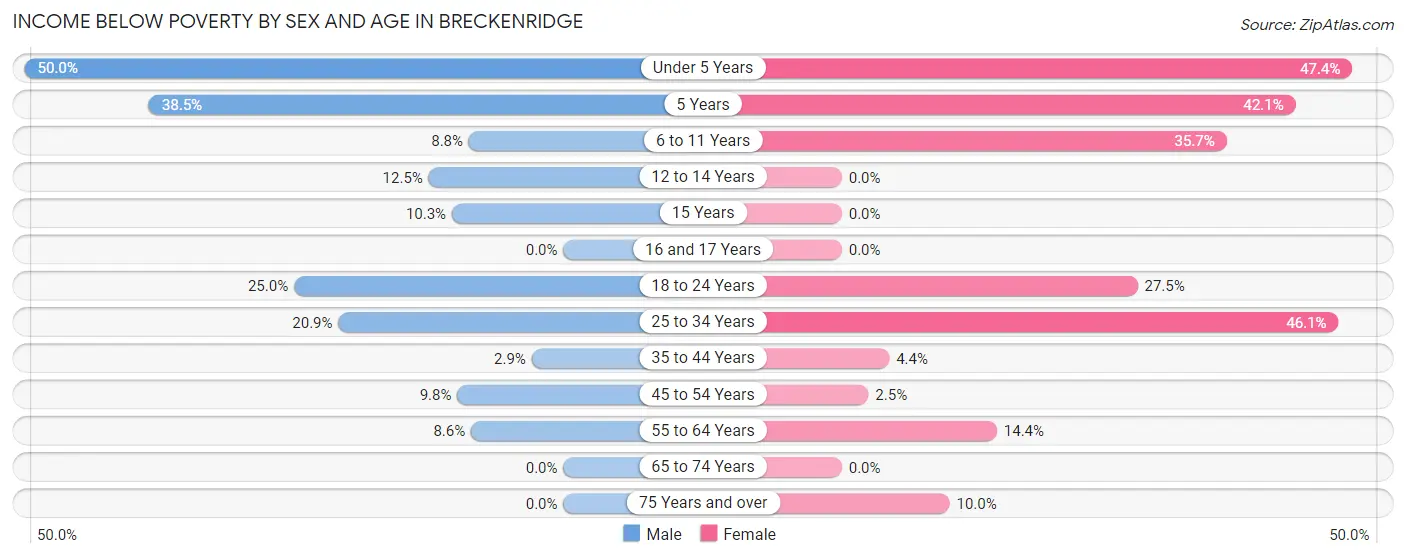
| Age Bracket | Male | Female |
| Under 5 Years | 10 (50.0%) | 9 (47.4%) |
| 5 Years | 5 (38.5%) | 8 (42.1%) |
| 6 to 11 Years | 10 (8.8%) | 15 (35.7%) |
| 12 to 14 Years | 4 (12.5%) | 0 (0.0%) |
| 15 Years | 3 (10.3%) | 0 (0.0%) |
| 16 and 17 Years | 0 (0.0%) | 0 (0.0%) |
| 18 to 24 Years | 10 (25.0%) | 14 (27.5%) |
| 25 to 34 Years | 19 (20.9%) | 53 (46.1%) |
| 35 to 44 Years | 4 (2.9%) | 4 (4.4%) |
| 45 to 54 Years | 6 (9.8%) | 2 (2.5%) |
| 55 to 64 Years | 6 (8.6%) | 20 (14.4%) |
| 65 to 74 Years | 0 (0.0%) | 0 (0.0%) |
| 75 Years and over | 0 (0.0%) | 3 (10.0%) |
| Total | 77 (10.7%) | 128 (18.9%) |
Income Above Poverty by Sex and Age in Breckenridge
According to the poverty statistics in Breckenridge, males aged 16 and 17 years and females aged 12 to 14 years are the age groups that are most secure financially, with 100.0% of males and 100.0% of females in these age groups living above the poverty line.
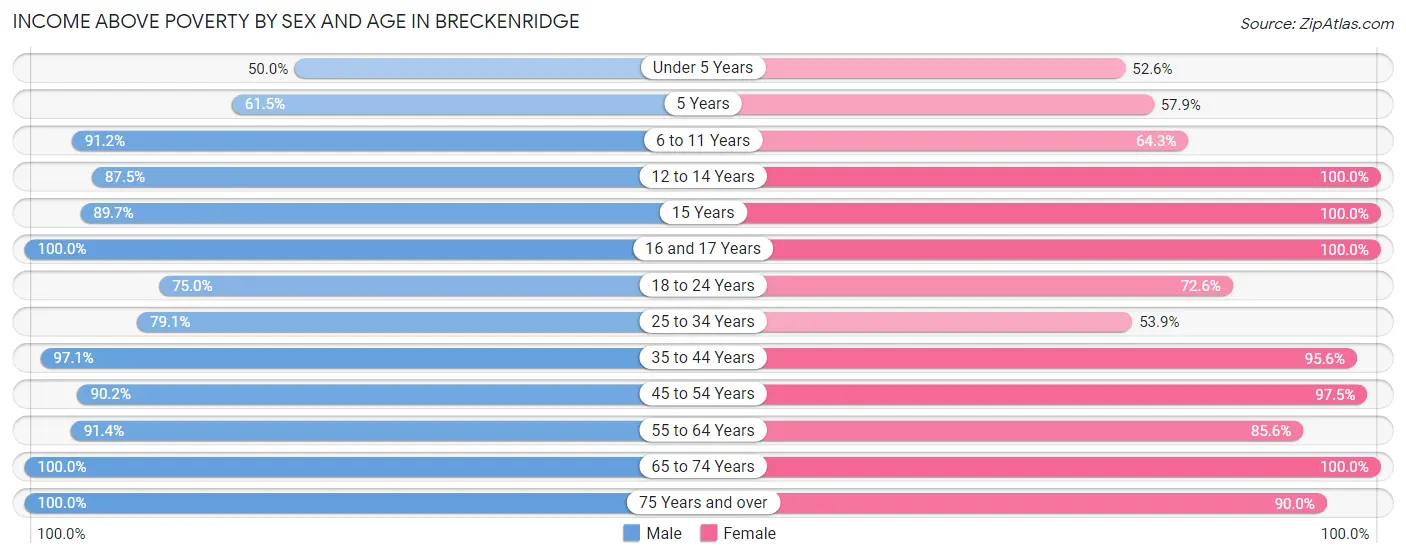
| Age Bracket | Male | Female |
| Under 5 Years | 10 (50.0%) | 10 (52.6%) |
| 5 Years | 8 (61.5%) | 11 (57.9%) |
| 6 to 11 Years | 104 (91.2%) | 27 (64.3%) |
| 12 to 14 Years | 28 (87.5%) | 13 (100.0%) |
| 15 Years | 26 (89.7%) | 23 (100.0%) |
| 16 and 17 Years | 5 (100.0%) | 7 (100.0%) |
| 18 to 24 Years | 30 (75.0%) | 37 (72.6%) |
| 25 to 34 Years | 72 (79.1%) | 62 (53.9%) |
| 35 to 44 Years | 132 (97.1%) | 87 (95.6%) |
| 45 to 54 Years | 55 (90.2%) | 79 (97.5%) |
| 55 to 64 Years | 64 (91.4%) | 119 (85.6%) |
| 65 to 74 Years | 74 (100.0%) | 47 (100.0%) |
| 75 Years and over | 35 (100.0%) | 27 (90.0%) |
| Total | 643 (89.3%) | 549 (81.1%) |
Income Below Poverty Among Married-Couple Families in Breckenridge
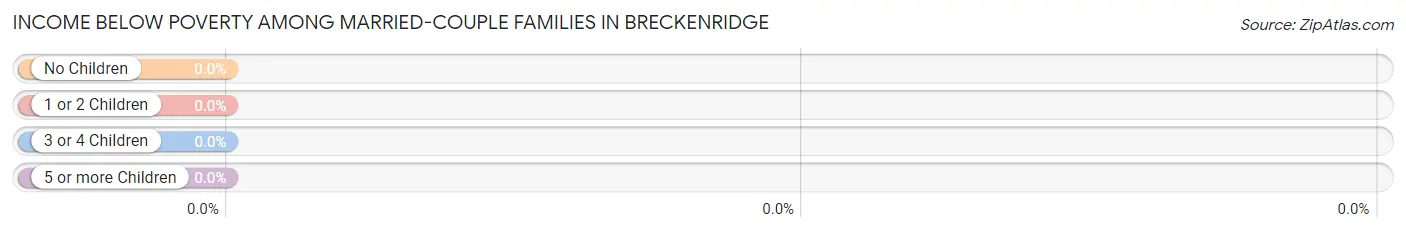
| Children | Above Poverty | Below Poverty |
| No Children | 161 (100.0%) | 0 (0.0%) |
| 1 or 2 Children | 100 (100.0%) | 0 (0.0%) |
| 3 or 4 Children | 18 (100.0%) | 0 (0.0%) |
| 5 or more Children | 0 (0.0%) | 0 (0.0%) |
| Total | 279 (100.0%) | 0 (0.0%) |
Income Below Poverty Among Single-Parent Households in Breckenridge
According to the poverty data in Breckenridge, 41.5% or 17 single-father households and 31.8% or 21 single-mother households are living below the poverty line. Among single-father households, those with no children have the highest poverty rate, with 3 households (100.0%) experiencing poverty. Likewise, among single-mother households, those with 3 or 4 children have the highest poverty rate, with 11 households (100.0%) falling below the poverty line.
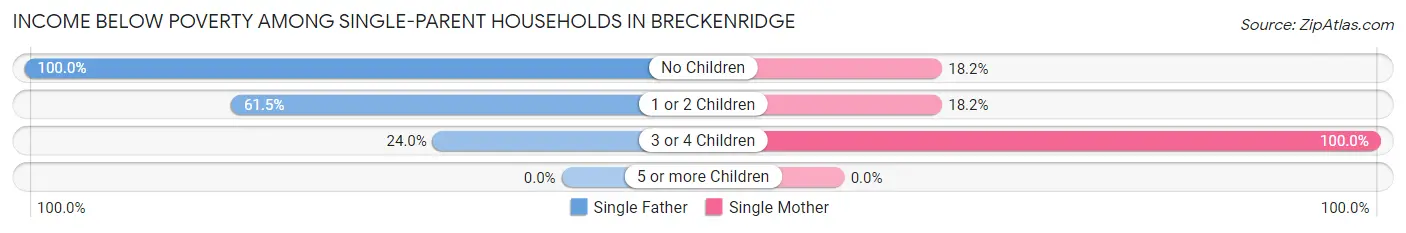
| Children | Single Father | Single Mother |
| No Children | 3 (100.0%) | 6 (18.2%) |
| 1 or 2 Children | 8 (61.5%) | 4 (18.2%) |
| 3 or 4 Children | 6 (24.0%) | 11 (100.0%) |
| 5 or more Children | 0 (0.0%) | 0 (0.0%) |
| Total | 17 (41.5%) | 21 (31.8%) |
Income Below Poverty Among Married-Couple vs Single-Parent Households in Breckenridge

| Children | Married-Couple Families | Single-Parent Households |
| No Children | 0 (0.0%) | 9 (25.0%) |
| 1 or 2 Children | 0 (0.0%) | 12 (34.3%) |
| 3 or 4 Children | 0 (0.0%) | 17 (47.2%) |
| 5 or more Children | 0 (0.0%) | 0 (0.0%) |
| Total | 0 (0.0%) | 38 (35.5%) |
Race in Breckenridge
The most populous races in Breckenridge are White / Caucasian (1,260 | 89.2%), Two or more Races (101 | 7.1%), and Hispanic or Latino (86 | 6.1%).
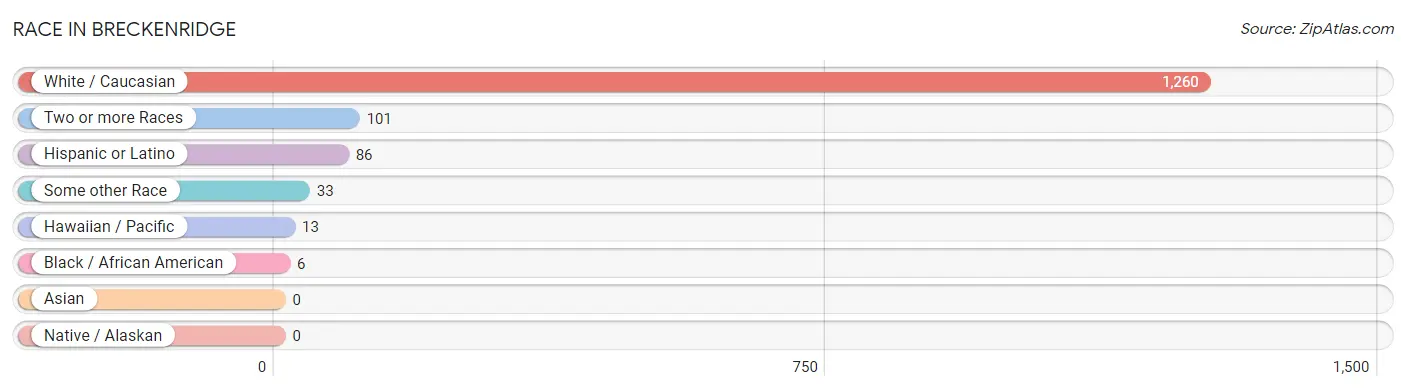
| Race | # Population | % Population |
| Asian | 0 | 0.0% |
| Black / African American | 6 | 0.4% |
| Hawaiian / Pacific | 13 | 0.9% |
| Hispanic or Latino | 86 | 6.1% |
| Native / Alaskan | 0 | 0.0% |
| White / Caucasian | 1,260 | 89.2% |
| Two or more Races | 101 | 7.1% |
| Some other Race | 33 | 2.3% |
| Total | 1,413 | 100.0% |
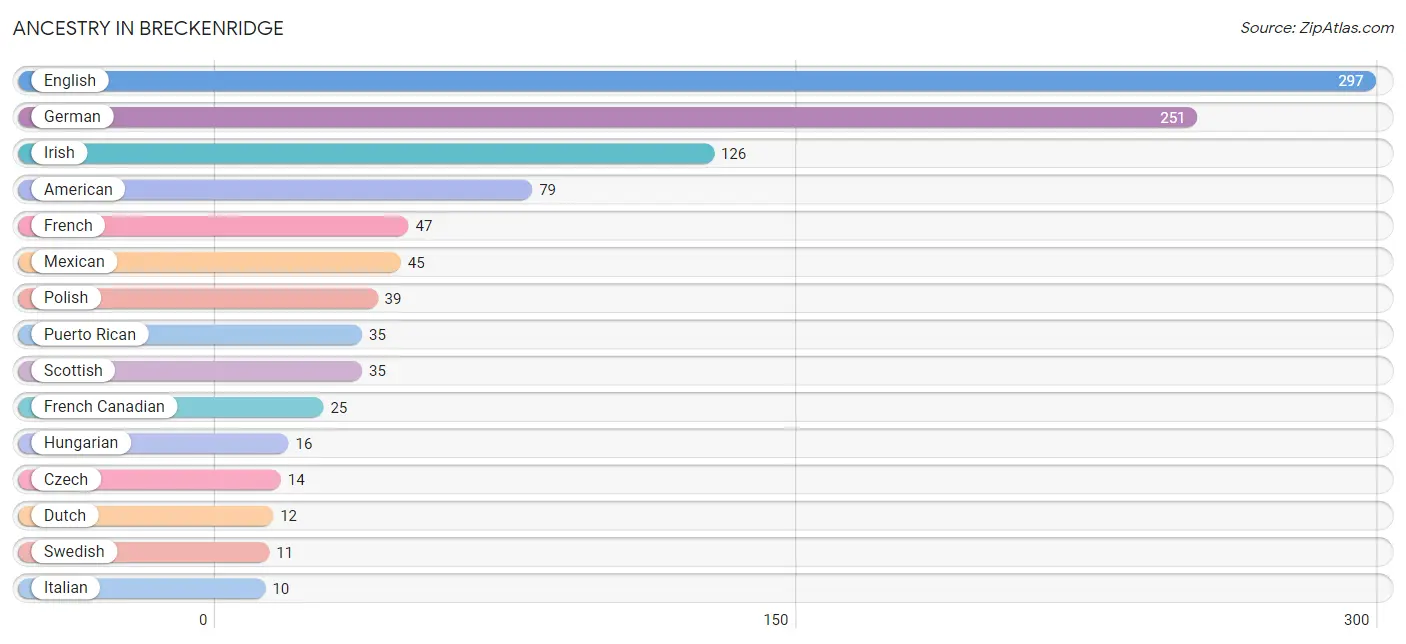
Ancestry in Breckenridge
The most populous ancestries reported in Breckenridge are English (297 | 21.0%), German (251 | 17.8%), Irish (126 | 8.9%), American (79 | 5.6%), and French (47 | 3.3%), together accounting for 56.6% of all Breckenridge residents.
| Ancestry | # Population | % Population |
| American | 79 | 5.6% |
| Blackfeet | 9 | 0.6% |
| British | 3 | 0.2% |
| Central American | 6 | 0.4% |
| Cherokee | 8 | 0.6% |
| Chippewa | 1 | 0.1% |
| Czech | 14 | 1.0% |
| Dutch | 12 | 0.9% |
| English | 297 | 21.0% |
| European | 7 | 0.5% |
| Finnish | 5 | 0.4% |
| French | 47 | 3.3% |
| French Canadian | 25 | 1.8% |
| German | 251 | 17.8% |
| Greek | 4 | 0.3% |
| Haitian | 6 | 0.4% |
| Hungarian | 16 | 1.1% |
| Irish | 126 | 8.9% |
| Italian | 10 | 0.7% |
| Mexican | 45 | 3.2% |
| Norwegian | 2 | 0.1% |
| Panamanian | 6 | 0.4% |
| Polish | 39 | 2.8% |
| Puerto Rican | 35 | 2.5% |
| Scandinavian | 2 | 0.1% |
| Scotch-Irish | 5 | 0.4% |
| Scottish | 35 | 2.5% |
| Sioux | 4 | 0.3% |
| Slovene | 5 | 0.4% |
| Swedish | 11 | 0.8% |
| Welsh | 7 | 0.5% | View All 31 Rows |
Immigrants in Breckenridge
The most numerous immigrant groups reported in Breckenridge came from , and Oceania (6 | 0.4%), together accounting for 0.4% of all Breckenridge residents.

| Immigration Origin | # Population | % Population |
| Oceania | 6 | 0.4% | View All 1 Rows |
Sex and Age in Breckenridge
Sex and Age in Breckenridge
The most populous age groups in Breckenridge are 40 to 44 Years (89 | 12.4%) for men and 60 to 64 Years (112 | 16.2%) for women.
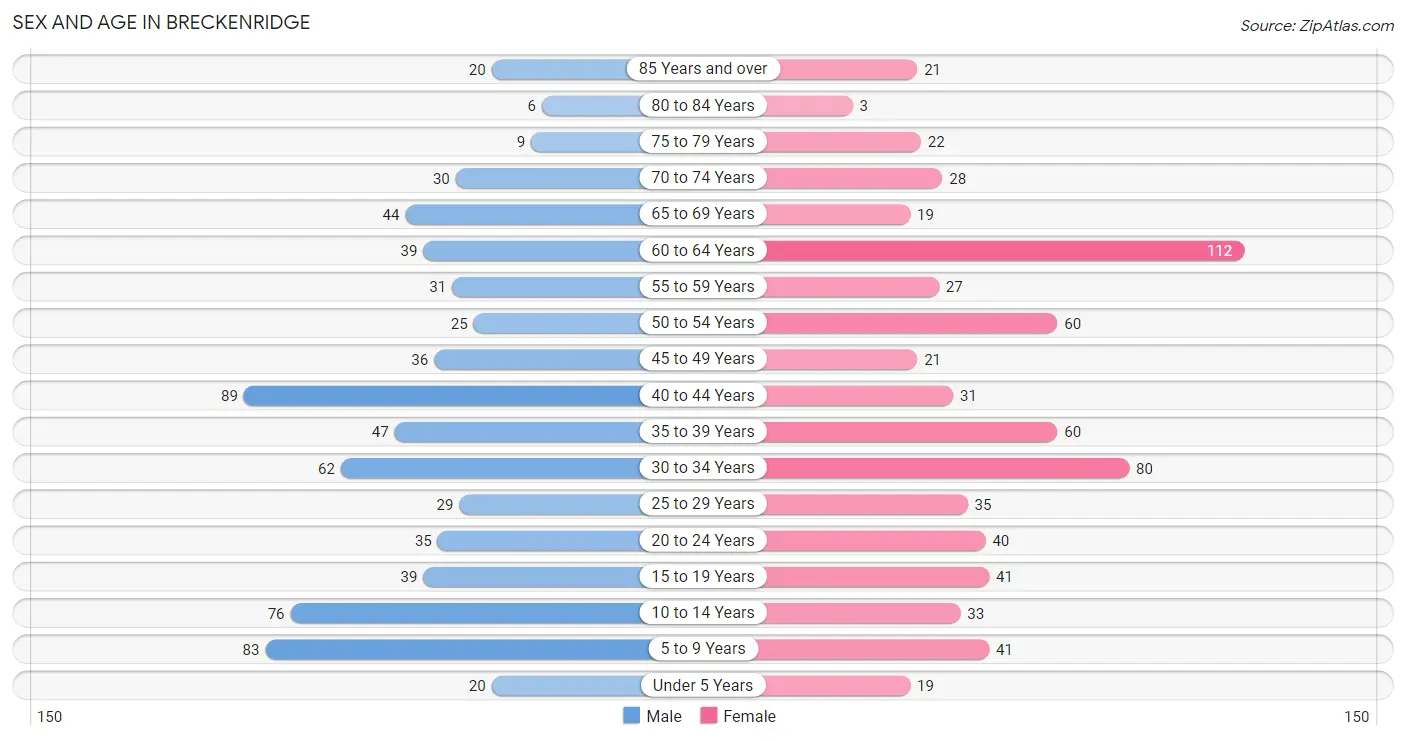
| Age Bracket | Male | Female |
| Under 5 Years | 20 (2.8%) | 19 (2.7%) |
| 5 to 9 Years | 83 (11.5%) | 41 (5.9%) |
| 10 to 14 Years | 76 (10.6%) | 33 (4.8%) |
| 15 to 19 Years | 39 (5.4%) | 41 (5.9%) |
| 20 to 24 Years | 35 (4.9%) | 40 (5.8%) |
| 25 to 29 Years | 29 (4.0%) | 35 (5.1%) |
| 30 to 34 Years | 62 (8.6%) | 80 (11.5%) |
| 35 to 39 Years | 47 (6.5%) | 60 (8.7%) |
| 40 to 44 Years | 89 (12.4%) | 31 (4.5%) |
| 45 to 49 Years | 36 (5.0%) | 21 (3.0%) |
| 50 to 54 Years | 25 (3.5%) | 60 (8.7%) |
| 55 to 59 Years | 31 (4.3%) | 27 (3.9%) |
| 60 to 64 Years | 39 (5.4%) | 112 (16.2%) |
| 65 to 69 Years | 44 (6.1%) | 19 (2.7%) |
| 70 to 74 Years | 30 (4.2%) | 28 (4.0%) |
| 75 to 79 Years | 9 (1.3%) | 22 (3.2%) |
| 80 to 84 Years | 6 (0.8%) | 3 (0.4%) |
| 85 Years and over | 20 (2.8%) | 21 (3.0%) |
| Total | 720 (100.0%) | 693 (100.0%) |
Families and Households in Breckenridge
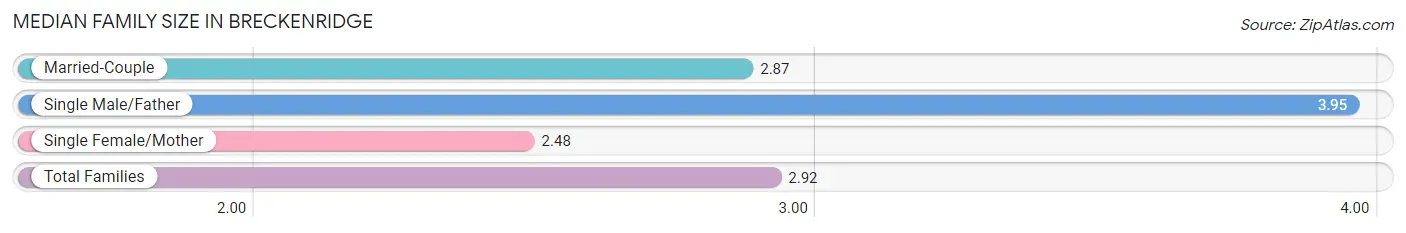
Median Family Size in Breckenridge
The median family size in Breckenridge is 2.92 persons per family, with single male/father families (41 | 10.6%) accounting for the largest median family size of 3.95 persons per family. On the other hand, single female/mother families (66 | 17.1%) represent the smallest median family size with 2.48 persons per family.
| Family Type | # Families | Family Size |
| Married-Couple | 279 (72.3%) | 2.87 |
| Single Male/Father | 41 (10.6%) | 3.95 |
| Single Female/Mother | 66 (17.1%) | 2.48 |
| Total Families | 386 (100.0%) | 2.92 |
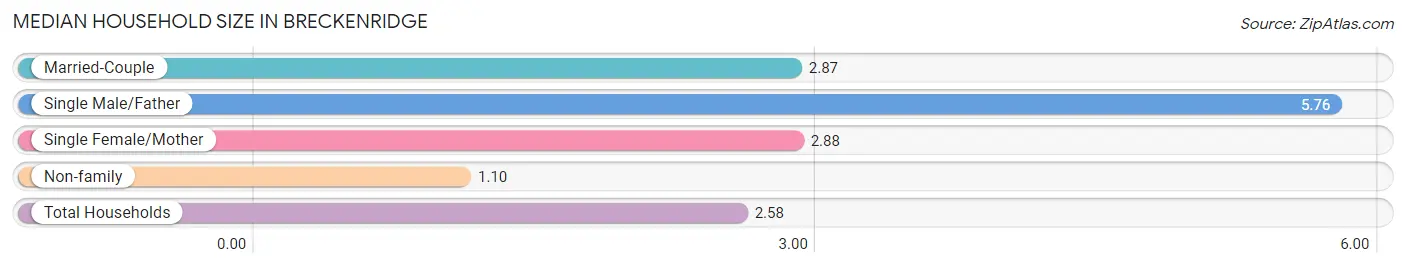
Median Household Size in Breckenridge
The median household size in Breckenridge is 2.58 persons per household, with single male/father households (41 | 7.6%) accounting for the largest median household size of 5.76 persons per household. non-family households (155 | 28.6%) represent the smallest median household size with 1.10 persons per household.
| Household Type | # Households | Household Size |
| Married-Couple | 279 (51.6%) | 2.87 |
| Single Male/Father | 41 (7.6%) | 5.76 |
| Single Female/Mother | 66 (12.2%) | 2.88 |
| Non-family | 155 (28.6%) | 1.10 |
| Total Households | 541 (100.0%) | 2.58 |
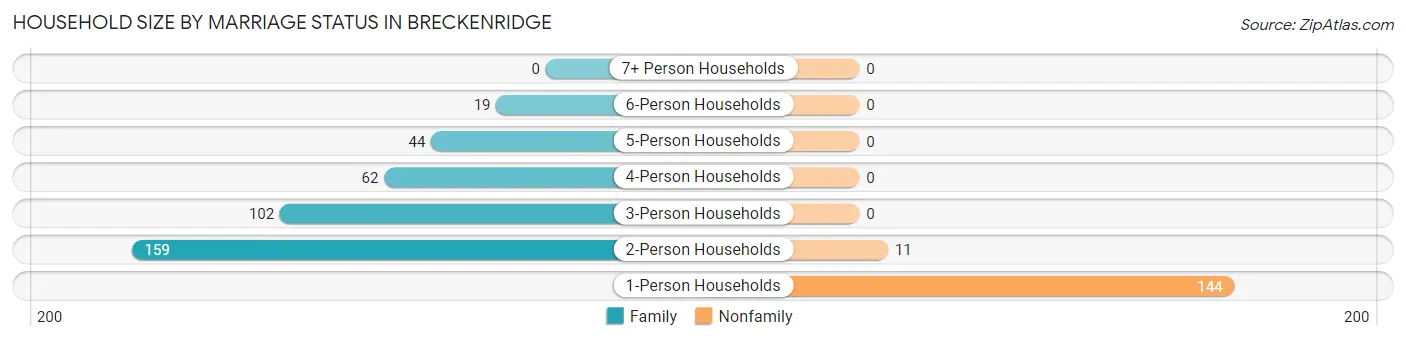
Household Size by Marriage Status in Breckenridge
Out of a total of 541 households in Breckenridge, 386 (71.4%) are family households, while 155 (28.6%) are nonfamily households. The most numerous type of family households are 2-person households, comprising 159, and the most common type of nonfamily households are 1-person households, comprising 144.
| Household Size | Family Households | Nonfamily Households |
| 1-Person Households | - | 144 (26.6%) |
| 2-Person Households | 159 (29.4%) | 11 (2.0%) |
| 3-Person Households | 102 (18.9%) | 0 (0.0%) |
| 4-Person Households | 62 (11.5%) | 0 (0.0%) |
| 5-Person Households | 44 (8.1%) | 0 (0.0%) |
| 6-Person Households | 19 (3.5%) | 0 (0.0%) |
| 7+ Person Households | 0 (0.0%) | 0 (0.0%) |
| Total | 386 (71.4%) | 155 (28.6%) |
Female Fertility in Breckenridge
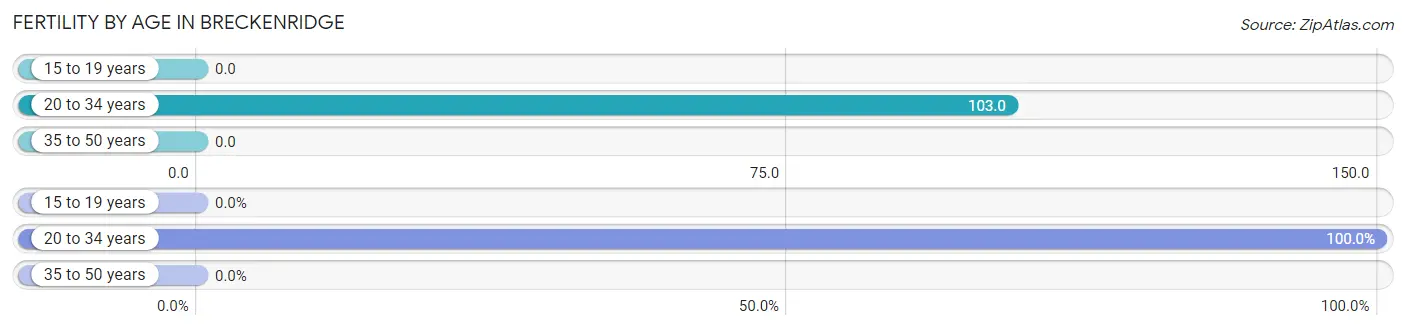
Fertility by Age in Breckenridge
Average fertility rate in Breckenridge is 49.0 births per 1,000 women. Women in the age bracket of 20 to 34 years have the highest fertility rate with 103.0 births per 1,000 women. Women in the age bracket of 20 to 34 years acount for 100.0% of all women with births.
| Age Bracket | Women with Births | Births / 1,000 Women |
| 15 to 19 years | 0 (0.0%) | 0.0 |
| 20 to 34 years | 16 (100.0%) | 103.0 |
| 35 to 50 years | 0 (0.0%) | 0.0 |
| Total | 16 (100.0%) | 49.0 |
Fertility by Age by Marriage Status in Breckenridge
56.2% of women with births (16) in Breckenridge are married. The highest percentage of unmarried women with births falls into 20 to 34 years age bracket with 43.8% of them unmarried at the time of birth, while the lowest percentage of unmarried women with births belong to 20 to 34 years age bracket with 43.8% of them unmarried.
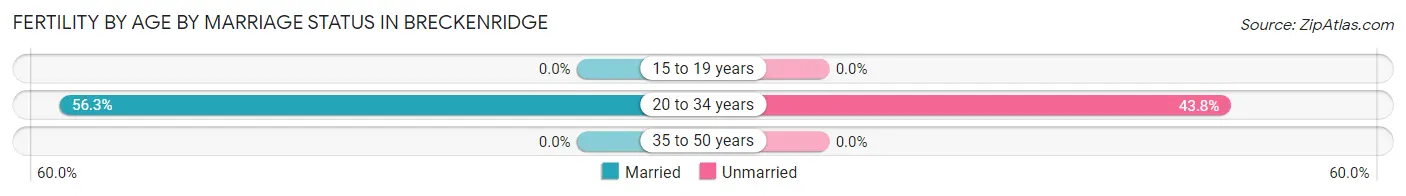
| Age Bracket | Married | Unmarried |
| 15 to 19 years | 0 (0.0%) | 0 (0.0%) |
| 20 to 34 years | 9 (56.2%) | 7 (43.8%) |
| 35 to 50 years | 0 (0.0%) | 0 (0.0%) |
| Total | 9 (56.2%) | 7 (43.8%) |
Fertility by Education in Breckenridge
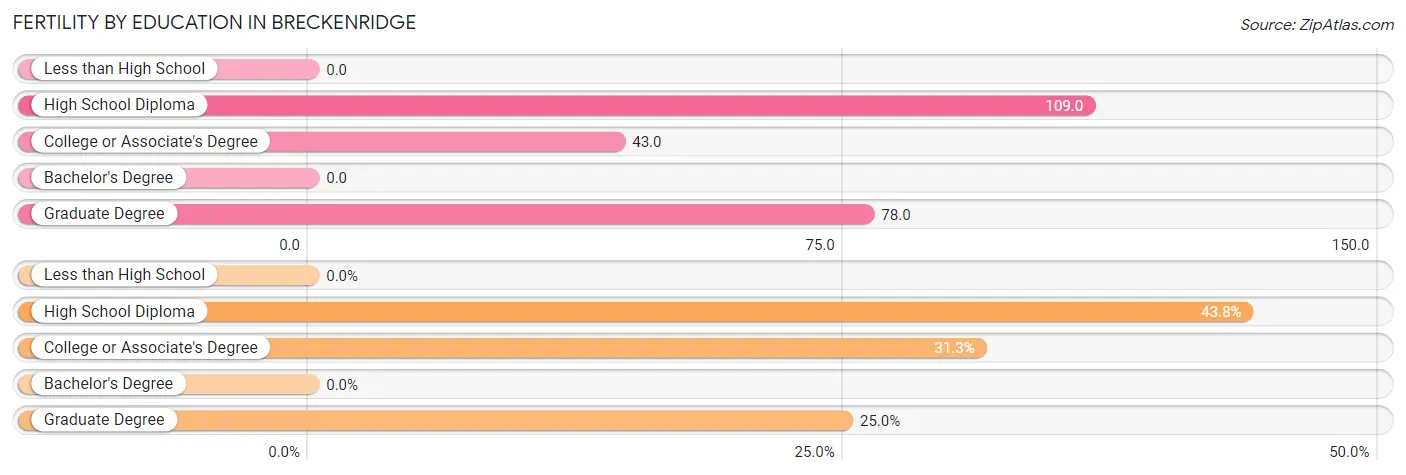
| Educational Attainment | Women with Births | Births / 1,000 Women |
| Less than High School | 0 (0.0%) | 0.0 |
| High School Diploma | 7 (43.8%) | 109.0 |
| College or Associate's Degree | 5 (31.2%) | 43.0 |
| Bachelor's Degree | 0 (0.0%) | 0.0 |
| Graduate Degree | 4 (25.0%) | 78.0 |
| Total | 16 (100.0%) | 49.0 |
Fertility by Education by Marriage Status in Breckenridge
43.8% of women with births in Breckenridge are unmarried. Women with the educational attainment of college or associate's degree are most likely to be married with 100.0% of them married at childbirth, while women with the educational attainment of high school diploma are least likely to be married with 100.0% of them unmarried at childbirth.
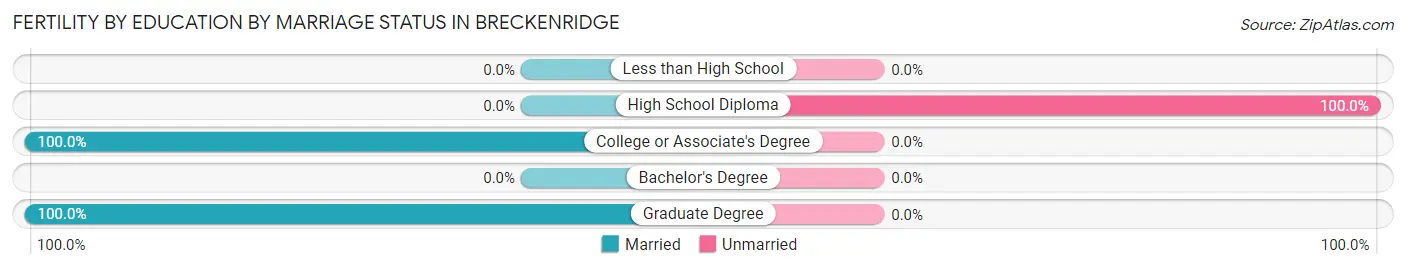
| Educational Attainment | Married | Unmarried |
| Less than High School | 0 (0.0%) | 0 (0.0%) |
| High School Diploma | 0 (0.0%) | 7 (100.0%) |
| College or Associate's Degree | 5 (100.0%) | 0 (0.0%) |
| Bachelor's Degree | 0 (0.0%) | 0 (0.0%) |
| Graduate Degree | 4 (100.0%) | 0 (0.0%) |
| Total | 9 (56.2%) | 7 (43.8%) |
Employment Characteristics in Breckenridge
Employment by Class of Employer in Breckenridge
Among the 598 employed individuals in Breckenridge, private company employees (378 | 63.2%), not-for-profit organizations (91 | 15.2%), and state government employees (56 | 9.4%) make up the most common classes of employment.
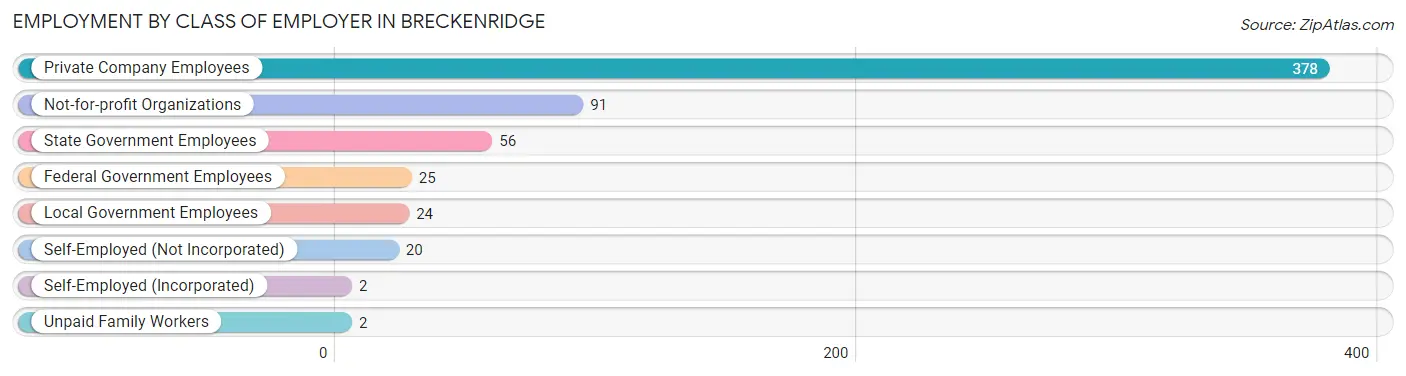
| Employer Class | # Employees | % Employees |
| Private Company Employees | 378 | 63.2% |
| Self-Employed (Incorporated) | 2 | 0.3% |
| Self-Employed (Not Incorporated) | 20 | 3.3% |
| Not-for-profit Organizations | 91 | 15.2% |
| Local Government Employees | 24 | 4.0% |
| State Government Employees | 56 | 9.4% |
| Federal Government Employees | 25 | 4.2% |
| Unpaid Family Workers | 2 | 0.3% |
| Total | 598 | 100.0% |
Employment Status by Age in Breckenridge
According to the labor force statistics for Breckenridge, out of the total population over 16 years of age (1,089), 60.7% or 661 individuals are in the labor force, with 8.2% or 54 of them unemployed. The age group with the highest labor force participation rate is 35 to 44 years, with 89.4% or 203 individuals in the labor force. Within the labor force, the 16 to 19 years age range has the highest percentage of unemployed individuals, with 63.6% or 7 of them being unemployed.
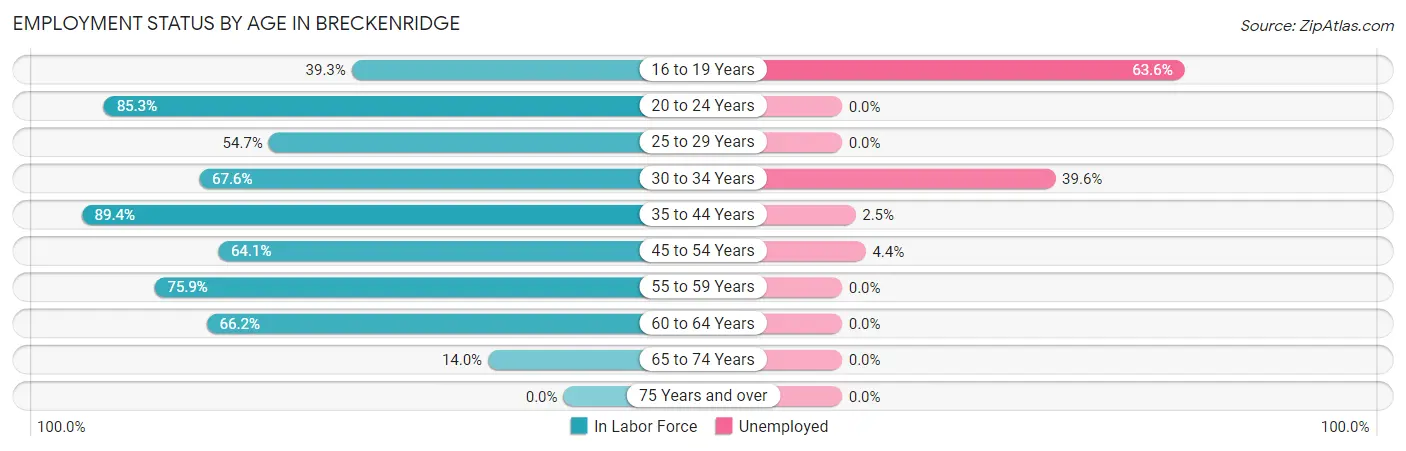
| Age Bracket | In Labor Force | Unemployed |
| 16 to 19 Years | 11 (39.3%) | 7 (63.6%) |
| 20 to 24 Years | 64 (85.3%) | 0 (0.0%) |
| 25 to 29 Years | 35 (54.7%) | 0 (0.0%) |
| 30 to 34 Years | 96 (67.6%) | 38 (39.6%) |
| 35 to 44 Years | 203 (89.4%) | 5 (2.5%) |
| 45 to 54 Years | 91 (64.1%) | 4 (4.4%) |
| 55 to 59 Years | 44 (75.9%) | 0 (0.0%) |
| 60 to 64 Years | 100 (66.2%) | 0 (0.0%) |
| 65 to 74 Years | 17 (14.0%) | 0 (0.0%) |
| 75 Years and over | 0 (0.0%) | 0 (0.0%) |
| Total | 661 (60.7%) | 54 (8.2%) |
Employment Status by Educational Attainment in Breckenridge
According to labor force statistics for Breckenridge, 72.6% of individuals (569) out of the total population between 25 and 64 years of age (784) are in the labor force, with 8.3% or 47 of them being unemployed. The group with the highest labor force participation rate are those with the educational attainment of bachelor's degree or higher, with 89.3% or 125 individuals in the labor force. Within the labor force, individuals with high school diploma education have the highest percentage of unemployment, with 10.8% or 26 of them being unemployed.
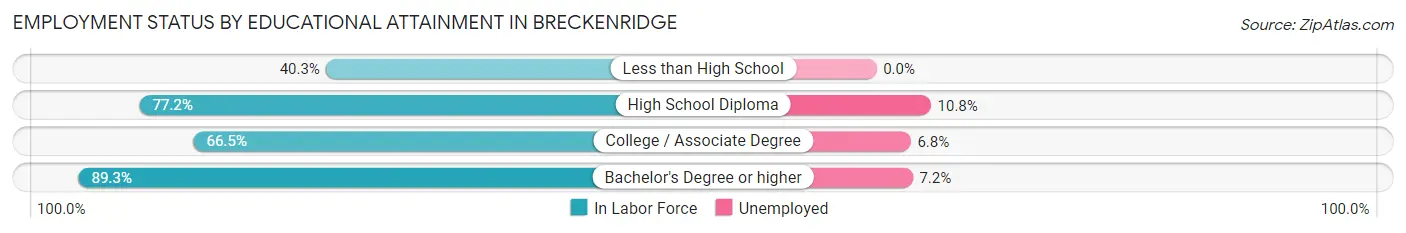
| Educational Attainment | In Labor Force | Unemployed |
| Less than High School | 27 (40.3%) | 0 (0.0%) |
| High School Diploma | 240 (77.2%) | 34 (10.8%) |
| College / Associate Degree | 177 (66.5%) | 18 (6.8%) |
| Bachelor's Degree or higher | 125 (89.3%) | 10 (7.2%) |
| Total | 569 (72.6%) | 65 (8.3%) |
Employment Occupations by Sex in Breckenridge
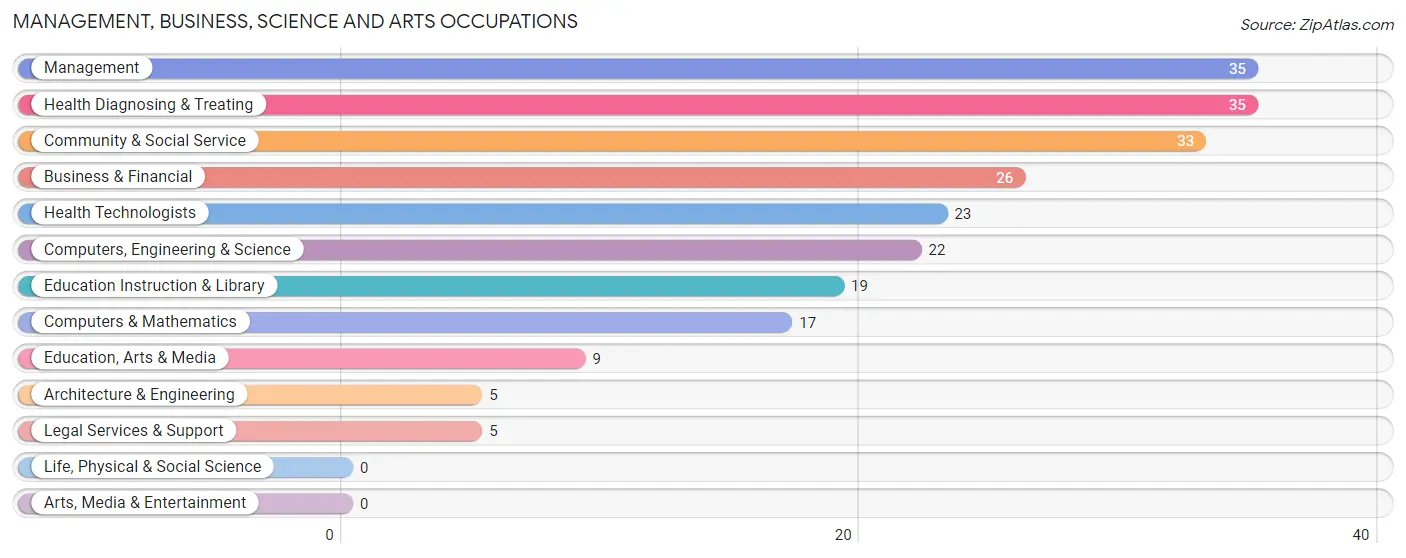
Management, Business, Science and Arts Occupations
The most common Management, Business, Science and Arts occupations in Breckenridge are Management (35 | 5.8%), Health Diagnosing & Treating (35 | 5.8%), Community & Social Service (33 | 5.4%), Business & Financial (26 | 4.3%), and Health Technologists (23 | 3.8%).
Management, Business, Science and Arts Occupations by Sex
Within the Management, Business, Science and Arts occupations in Breckenridge, the most male-oriented occupations are Architecture & Engineering (100.0%), Legal Services & Support (100.0%), and Computers, Engineering & Science (40.9%), while the most female-oriented occupations are Education Instruction & Library (100.0%), Management (94.3%), and Business & Financial (92.3%).
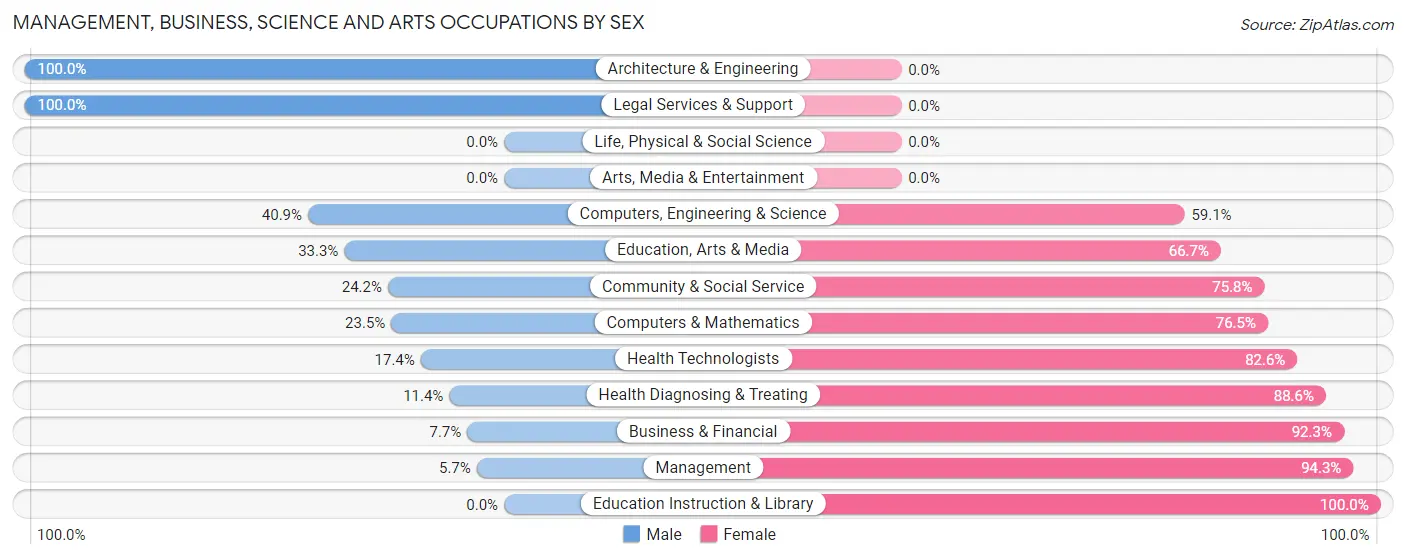
| Occupation | Male | Female |
| Management | 2 (5.7%) | 33 (94.3%) |
| Business & Financial | 2 (7.7%) | 24 (92.3%) |
| Computers, Engineering & Science | 9 (40.9%) | 13 (59.1%) |
| Computers & Mathematics | 4 (23.5%) | 13 (76.5%) |
| Architecture & Engineering | 5 (100.0%) | 0 (0.0%) |
| Life, Physical & Social Science | 0 (0.0%) | 0 (0.0%) |
| Community & Social Service | 8 (24.2%) | 25 (75.8%) |
| Education, Arts & Media | 3 (33.3%) | 6 (66.7%) |
| Legal Services & Support | 5 (100.0%) | 0 (0.0%) |
| Education Instruction & Library | 0 (0.0%) | 19 (100.0%) |
| Arts, Media & Entertainment | 0 (0.0%) | 0 (0.0%) |
| Health Diagnosing & Treating | 4 (11.4%) | 31 (88.6%) |
| Health Technologists | 4 (17.4%) | 19 (82.6%) |
| Total (Category) | 25 (16.6%) | 126 (83.4%) |
| Total (Overall) | 270 (44.5%) | 337 (55.5%) |
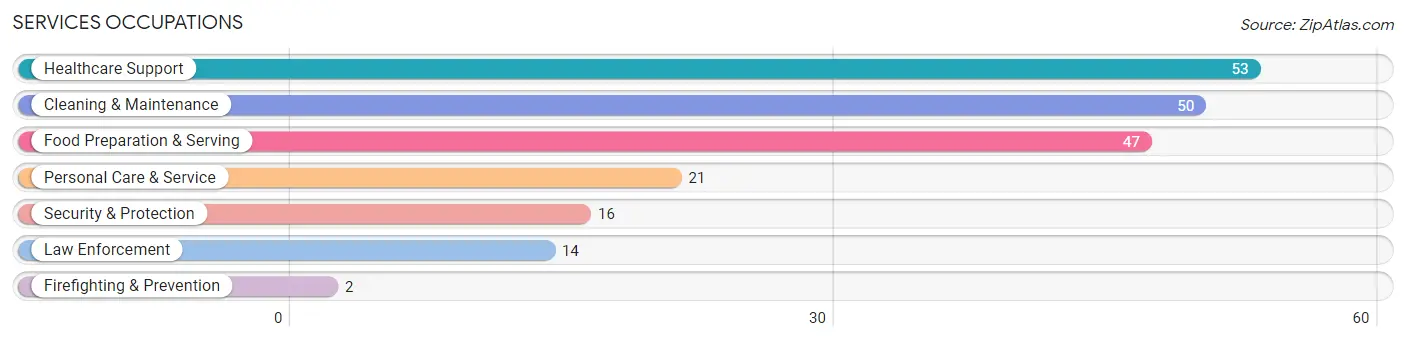
Services Occupations
The most common Services occupations in Breckenridge are Healthcare Support (53 | 8.7%), Cleaning & Maintenance (50 | 8.2%), Food Preparation & Serving (47 | 7.7%), Personal Care & Service (21 | 3.5%), and Security & Protection (16 | 2.6%).
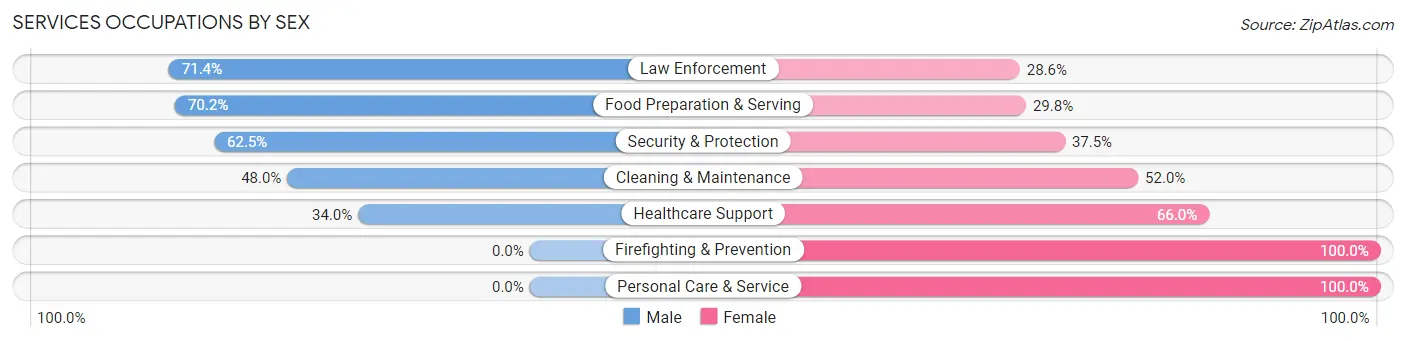
Services Occupations by Sex
Within the Services occupations in Breckenridge, the most male-oriented occupations are Law Enforcement (71.4%), Food Preparation & Serving (70.2%), and Security & Protection (62.5%), while the most female-oriented occupations are Firefighting & Prevention (100.0%), Personal Care & Service (100.0%), and Healthcare Support (66.0%).
| Occupation | Male | Female |
| Healthcare Support | 18 (34.0%) | 35 (66.0%) |
| Security & Protection | 10 (62.5%) | 6 (37.5%) |
| Firefighting & Prevention | 0 (0.0%) | 2 (100.0%) |
| Law Enforcement | 10 (71.4%) | 4 (28.6%) |
| Food Preparation & Serving | 33 (70.2%) | 14 (29.8%) |
| Cleaning & Maintenance | 24 (48.0%) | 26 (52.0%) |
| Personal Care & Service | 0 (0.0%) | 21 (100.0%) |
| Total (Category) | 85 (45.5%) | 102 (54.5%) |
| Total (Overall) | 270 (44.5%) | 337 (55.5%) |
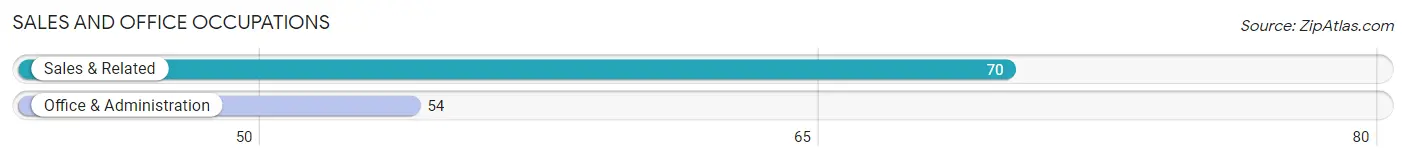
Sales and Office Occupations
The most common Sales and Office occupations in Breckenridge are Sales & Related (70 | 11.5%), and Office & Administration (54 | 8.9%).
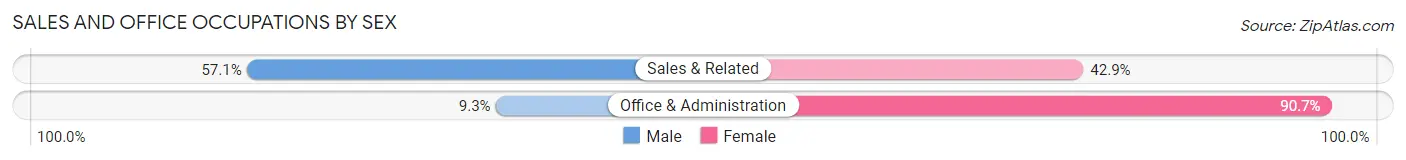
Sales and Office Occupations by Sex
| Occupation | Male | Female |
| Sales & Related | 40 (57.1%) | 30 (42.9%) |
| Office & Administration | 5 (9.3%) | 49 (90.7%) |
| Total (Category) | 45 (36.3%) | 79 (63.7%) |
| Total (Overall) | 270 (44.5%) | 337 (55.5%) |
Natural Resources, Construction and Maintenance Occupations
The most common Natural Resources, Construction and Maintenance occupations in Breckenridge are Construction & Extraction (30 | 4.9%), and Installation, Maintenance & Repair (8 | 1.3%).
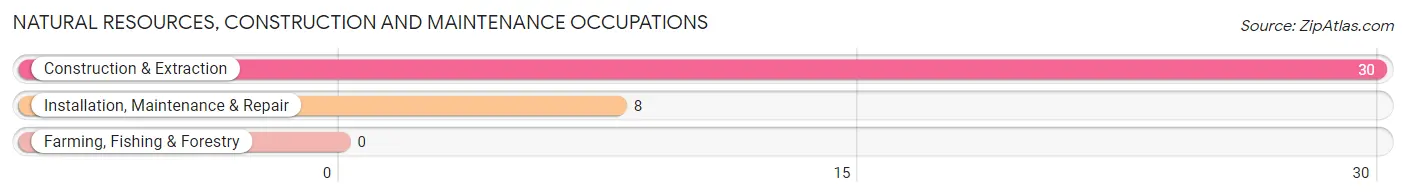
Natural Resources, Construction and Maintenance Occupations by Sex
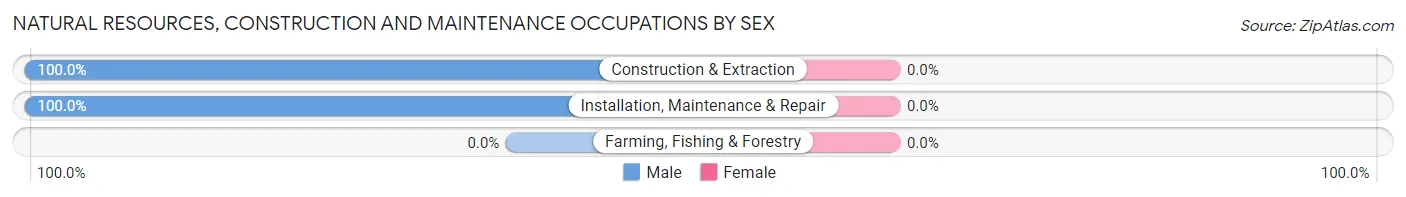
| Occupation | Male | Female |
| Farming, Fishing & Forestry | 0 (0.0%) | 0 (0.0%) |
| Construction & Extraction | 30 (100.0%) | 0 (0.0%) |
| Installation, Maintenance & Repair | 8 (100.0%) | 0 (0.0%) |
| Total (Category) | 38 (100.0%) | 0 (0.0%) |
| Total (Overall) | 270 (44.5%) | 337 (55.5%) |
Production, Transportation and Moving Occupations
The most common Production, Transportation and Moving occupations in Breckenridge are Production (60 | 9.9%), Transportation (27 | 4.4%), and Material Moving (20 | 3.3%).
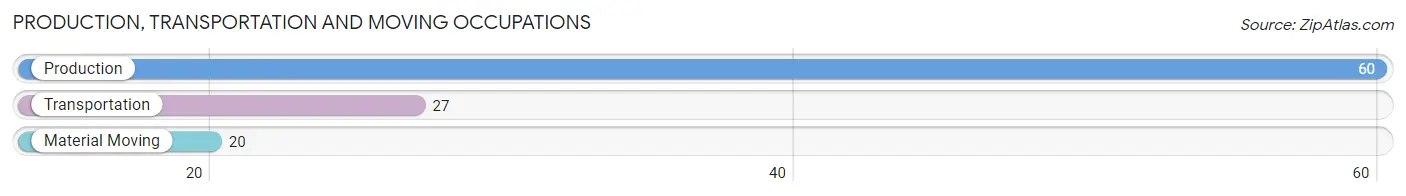
Production, Transportation and Moving Occupations by Sex
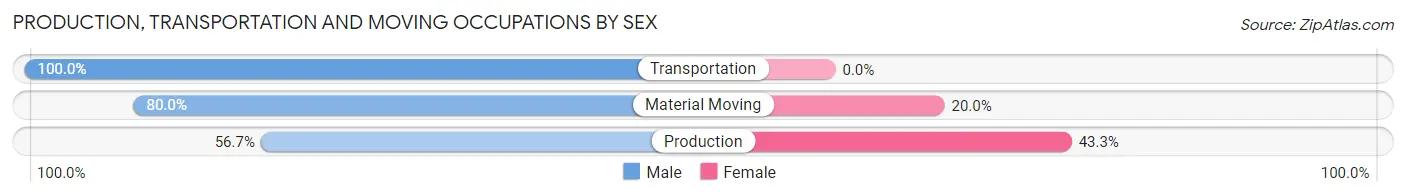
| Occupation | Male | Female |
| Production | 34 (56.7%) | 26 (43.3%) |
| Transportation | 27 (100.0%) | 0 (0.0%) |
| Material Moving | 16 (80.0%) | 4 (20.0%) |
| Total (Category) | 77 (72.0%) | 30 (28.0%) |
| Total (Overall) | 270 (44.5%) | 337 (55.5%) |
Employment Industries by Sex in Breckenridge
Employment Industries in Breckenridge
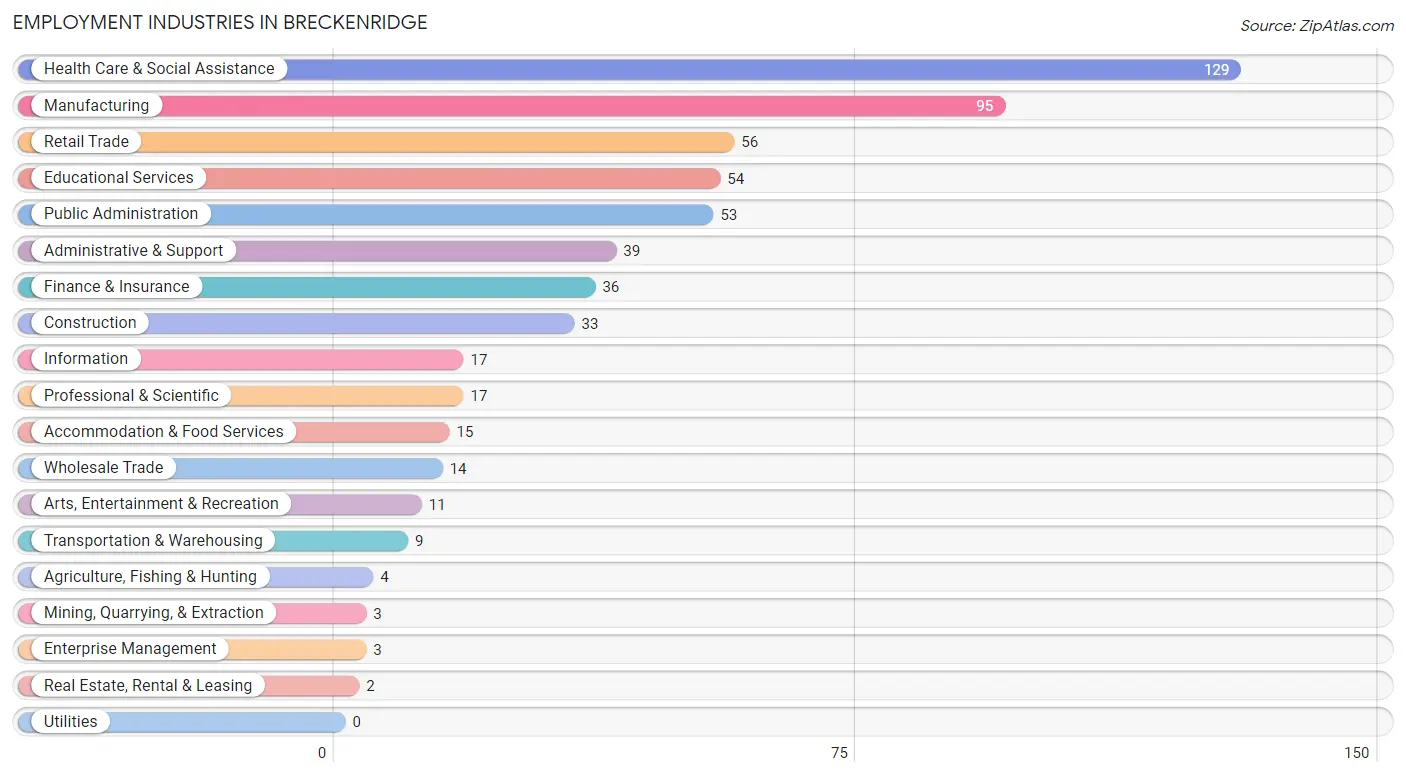
The major employment industries in Breckenridge include Health Care & Social Assistance (129 | 21.2%), Manufacturing (95 | 15.7%), Retail Trade (56 | 9.2%), Educational Services (54 | 8.9%), and Public Administration (53 | 8.7%).
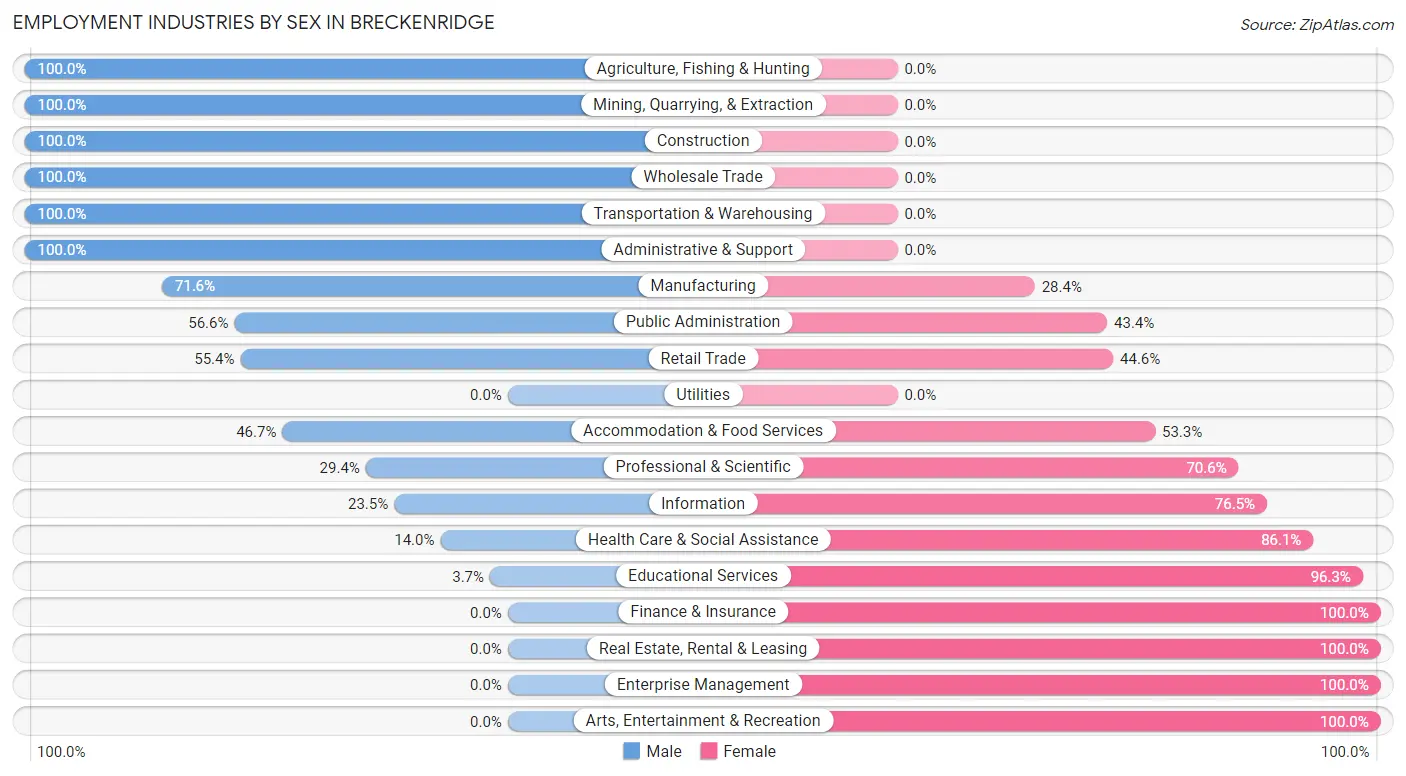
Employment Industries by Sex in Breckenridge
The Breckenridge industries that see more men than women are Agriculture, Fishing & Hunting (100.0%), Mining, Quarrying, & Extraction (100.0%), and Construction (100.0%), whereas the industries that tend to have a higher number of women are Finance & Insurance (100.0%), Real Estate, Rental & Leasing (100.0%), and Enterprise Management (100.0%).
| Industry | Male | Female |
| Agriculture, Fishing & Hunting | 4 (100.0%) | 0 (0.0%) |
| Mining, Quarrying, & Extraction | 3 (100.0%) | 0 (0.0%) |
| Construction | 33 (100.0%) | 0 (0.0%) |
| Manufacturing | 68 (71.6%) | 27 (28.4%) |
| Wholesale Trade | 14 (100.0%) | 0 (0.0%) |
| Retail Trade | 31 (55.4%) | 25 (44.6%) |
| Transportation & Warehousing | 9 (100.0%) | 0 (0.0%) |
| Utilities | 0 (0.0%) | 0 (0.0%) |
| Information | 4 (23.5%) | 13 (76.5%) |
| Finance & Insurance | 0 (0.0%) | 36 (100.0%) |
| Real Estate, Rental & Leasing | 0 (0.0%) | 2 (100.0%) |
| Professional & Scientific | 5 (29.4%) | 12 (70.6%) |
| Enterprise Management | 0 (0.0%) | 3 (100.0%) |
| Administrative & Support | 39 (100.0%) | 0 (0.0%) |
| Educational Services | 2 (3.7%) | 52 (96.3%) |
| Health Care & Social Assistance | 18 (14.0%) | 111 (86.1%) |
| Arts, Entertainment & Recreation | 0 (0.0%) | 11 (100.0%) |
| Accommodation & Food Services | 7 (46.7%) | 8 (53.3%) |
| Public Administration | 30 (56.6%) | 23 (43.4%) |
| Total | 270 (44.5%) | 337 (55.5%) |
Education in Breckenridge
School Enrollment in Breckenridge
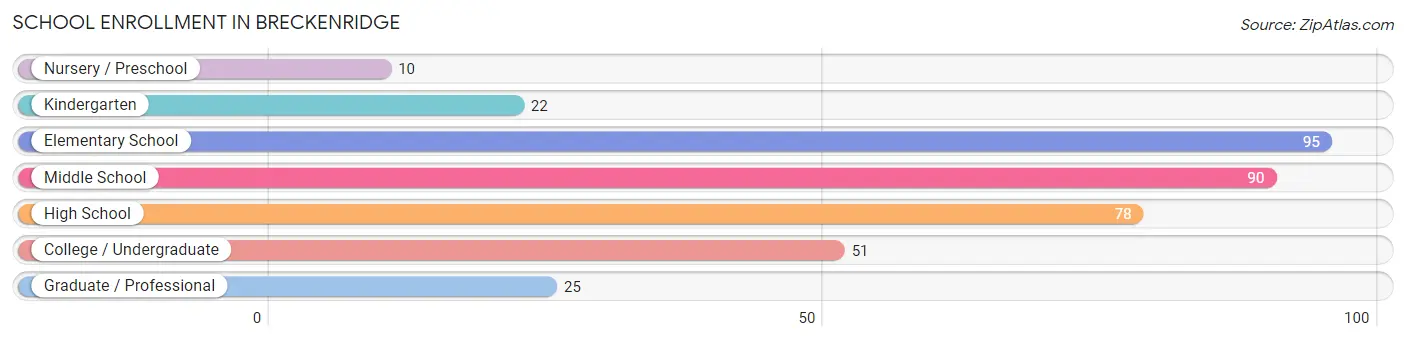
The most common levels of schooling among the 371 students in Breckenridge are elementary school (95 | 25.6%), middle school (90 | 24.3%), and high school (78 | 21.0%).
| School Level | # Students | % Students |
| Nursery / Preschool | 10 | 2.7% |
| Kindergarten | 22 | 5.9% |
| Elementary School | 95 | 25.6% |
| Middle School | 90 | 24.3% |
| High School | 78 | 21.0% |
| College / Undergraduate | 51 | 13.8% |
| Graduate / Professional | 25 | 6.7% |
| Total | 371 | 100.0% |
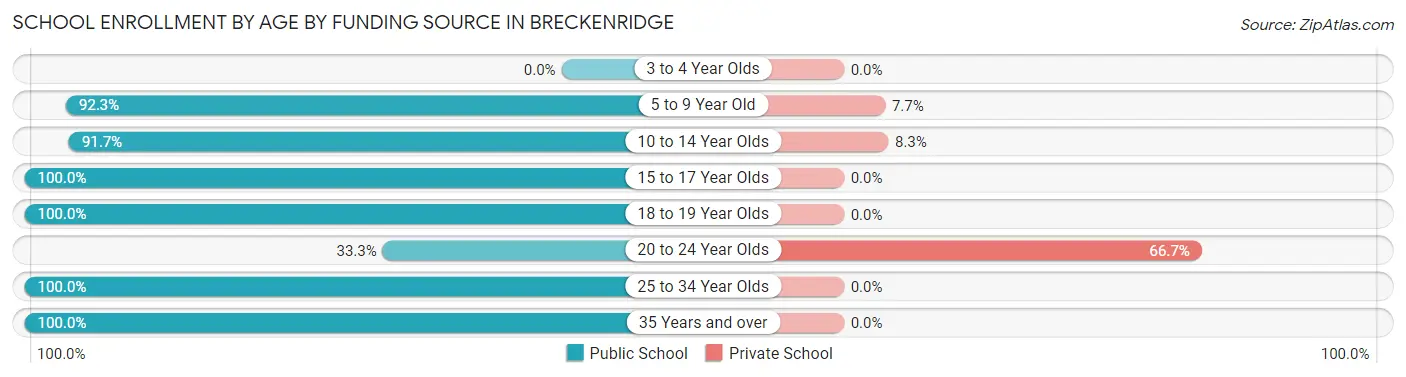
School Enrollment by Age by Funding Source in Breckenridge
Out of a total of 371 students who are enrolled in schools in Breckenridge, 34 (9.2%) attend a private institution, while the remaining 337 (90.8%) are enrolled in public schools. The age group of 20 to 24 year olds has the highest likelihood of being enrolled in private schools, with 16 (66.7% in the age bracket) enrolled. Conversely, the age group of 15 to 17 year olds has the lowest likelihood of being enrolled in a private school, with 64 (100.0% in the age bracket) attending a public institution.
| Age Bracket | Public School | Private School |
| 3 to 4 Year Olds | 0 (0.0%) | 0 (0.0%) |
| 5 to 9 Year Old | 108 (92.3%) | 9 (7.7%) |
| 10 to 14 Year Olds | 100 (91.7%) | 9 (8.3%) |
| 15 to 17 Year Olds | 64 (100.0%) | 0 (0.0%) |
| 18 to 19 Year Olds | 12 (100.0%) | 0 (0.0%) |
| 20 to 24 Year Olds | 8 (33.3%) | 16 (66.7%) |
| 25 to 34 Year Olds | 12 (100.0%) | 0 (0.0%) |
| 35 Years and over | 33 (100.0%) | 0 (0.0%) |
| Total | 337 (90.8%) | 34 (9.2%) |
Educational Attainment by Field of Study in Breckenridge
Business (48 | 26.4%), education (33 | 18.1%), science & technology (23 | 12.6%), visual & performing arts (21 | 11.5%), and social sciences (19 | 10.4%) are the most common fields of study among 182 individuals in Breckenridge who have obtained a bachelor's degree or higher.
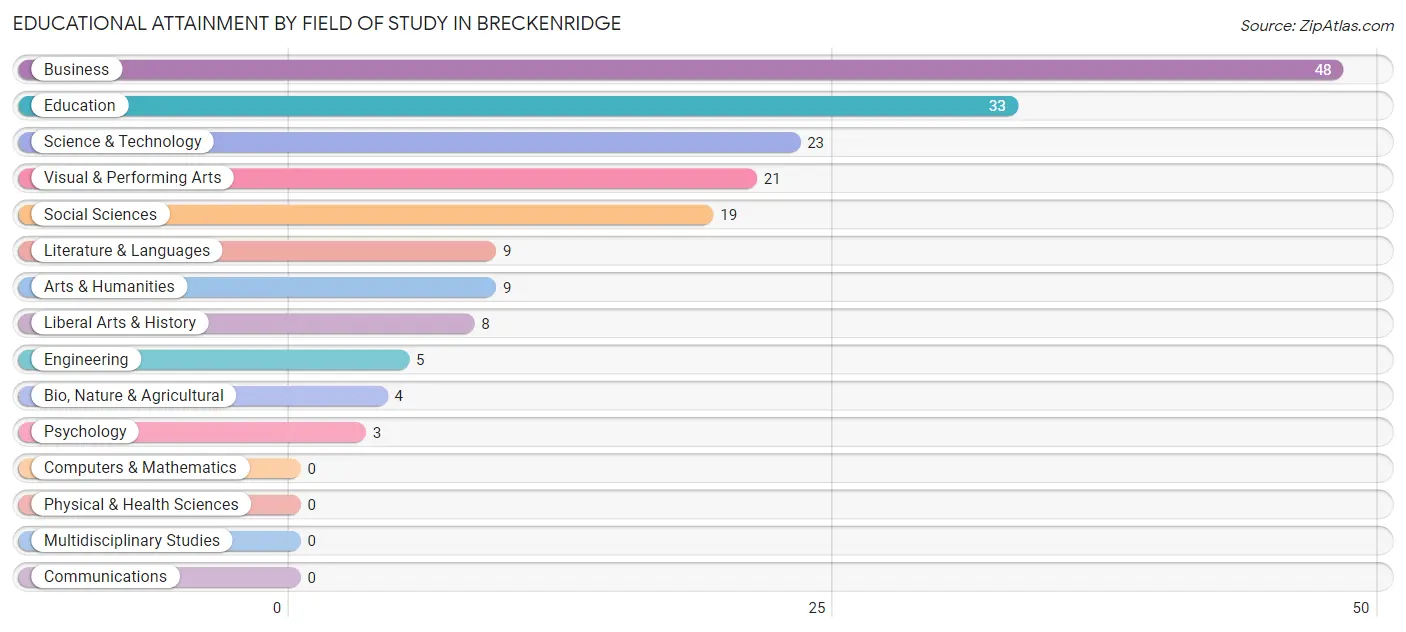
| Field of Study | # Graduates | % Graduates |
| Computers & Mathematics | 0 | 0.0% |
| Bio, Nature & Agricultural | 4 | 2.2% |
| Physical & Health Sciences | 0 | 0.0% |
| Psychology | 3 | 1.7% |
| Social Sciences | 19 | 10.4% |
| Engineering | 5 | 2.8% |
| Multidisciplinary Studies | 0 | 0.0% |
| Science & Technology | 23 | 12.6% |
| Business | 48 | 26.4% |
| Education | 33 | 18.1% |
| Literature & Languages | 9 | 5.0% |
| Liberal Arts & History | 8 | 4.4% |
| Visual & Performing Arts | 21 | 11.5% |
| Communications | 0 | 0.0% |
| Arts & Humanities | 9 | 5.0% |
| Total | 182 | 100.0% |
Transportation & Commute in Breckenridge
Vehicle Availability by Sex in Breckenridge
The most prevalent vehicle ownership categories in Breckenridge are males with 2 vehicles (149, accounting for 55.2%) and females with 2 vehicles (149, making up 45.4%).

| Vehicles Available | Male | Female |
| No Vehicle | 10 (3.7%) | 0 (0.0%) |
| 1 Vehicle | 15 (5.6%) | 94 (28.7%) |
| 2 Vehicles | 149 (55.2%) | 149 (45.4%) |
| 3 Vehicles | 71 (26.3%) | 65 (19.8%) |
| 4 Vehicles | 10 (3.7%) | 11 (3.4%) |
| 5 or more Vehicles | 15 (5.6%) | 9 (2.7%) |
| Total | 270 (100.0%) | 328 (100.0%) |
Commute Time in Breckenridge
The most frequently occuring commute durations in Breckenridge are 10 to 14 minutes (84 commuters, 15.4%), 15 to 19 minutes (72 commuters, 13.2%), and 20 to 24 minutes (71 commuters, 13.0%).
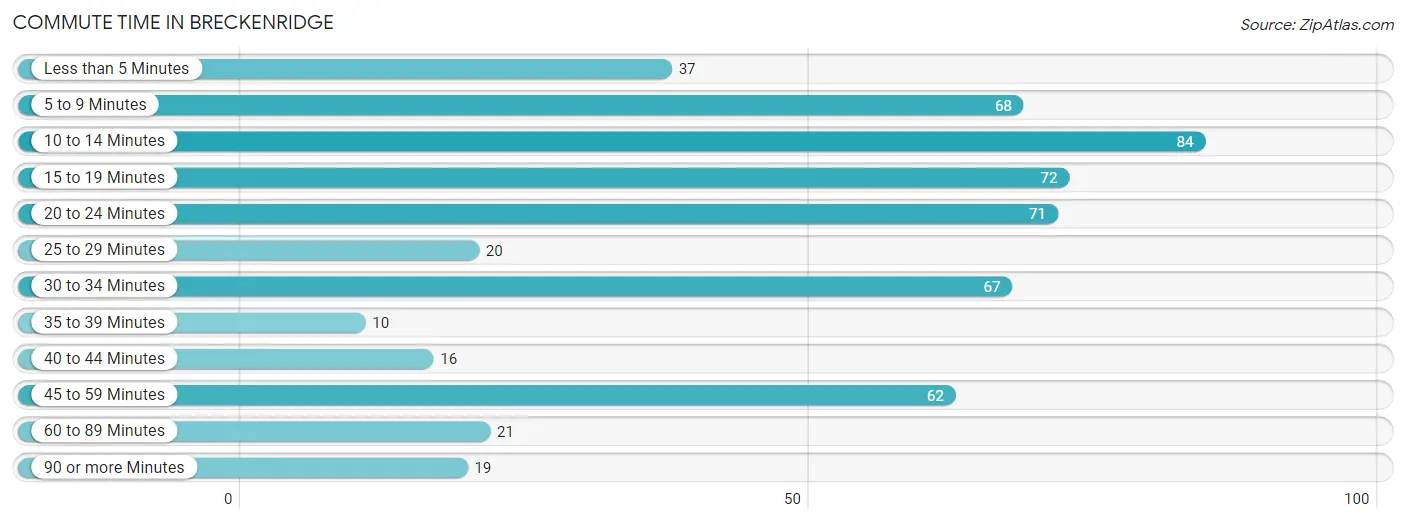
| Commute Time | # Commuters | % Commuters |
| Less than 5 Minutes | 37 | 6.8% |
| 5 to 9 Minutes | 68 | 12.4% |
| 10 to 14 Minutes | 84 | 15.4% |
| 15 to 19 Minutes | 72 | 13.2% |
| 20 to 24 Minutes | 71 | 13.0% |
| 25 to 29 Minutes | 20 | 3.7% |
| 30 to 34 Minutes | 67 | 12.2% |
| 35 to 39 Minutes | 10 | 1.8% |
| 40 to 44 Minutes | 16 | 2.9% |
| 45 to 59 Minutes | 62 | 11.3% |
| 60 to 89 Minutes | 21 | 3.8% |
| 90 or more Minutes | 19 | 3.5% |
Commute Time by Sex in Breckenridge
The most common commute times in Breckenridge are 45 to 59 minutes (43 commuters, 16.4%) for males and 20 to 24 minutes (49 commuters, 17.2%) for females.
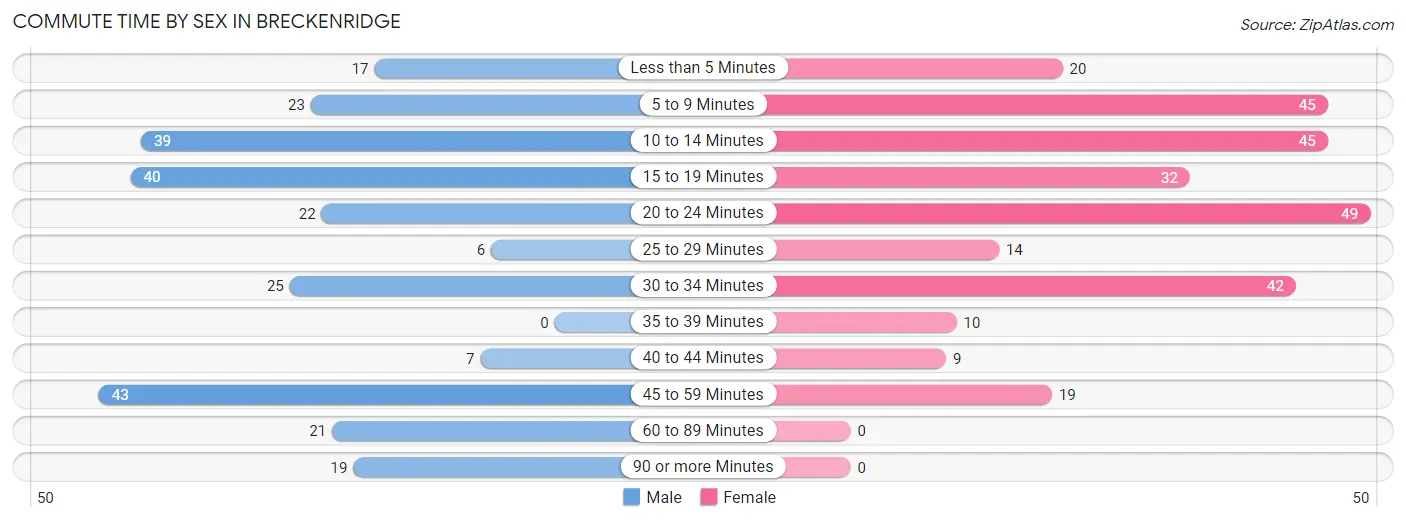
| Commute Time | Male | Female |
| Less than 5 Minutes | 17 (6.5%) | 20 (7.0%) |
| 5 to 9 Minutes | 23 (8.8%) | 45 (15.8%) |
| 10 to 14 Minutes | 39 (14.9%) | 45 (15.8%) |
| 15 to 19 Minutes | 40 (15.3%) | 32 (11.2%) |
| 20 to 24 Minutes | 22 (8.4%) | 49 (17.2%) |
| 25 to 29 Minutes | 6 (2.3%) | 14 (4.9%) |
| 30 to 34 Minutes | 25 (9.5%) | 42 (14.7%) |
| 35 to 39 Minutes | 0 (0.0%) | 10 (3.5%) |
| 40 to 44 Minutes | 7 (2.7%) | 9 (3.2%) |
| 45 to 59 Minutes | 43 (16.4%) | 19 (6.7%) |
| 60 to 89 Minutes | 21 (8.0%) | 0 (0.0%) |
| 90 or more Minutes | 19 (7.2%) | 0 (0.0%) |
Time of Departure to Work by Sex in Breckenridge
The most frequent times of departure to work in Breckenridge are 5:30 AM to 5:59 AM (41, 15.7%) for males and 7:30 AM to 7:59 AM (53, 18.6%) for females.
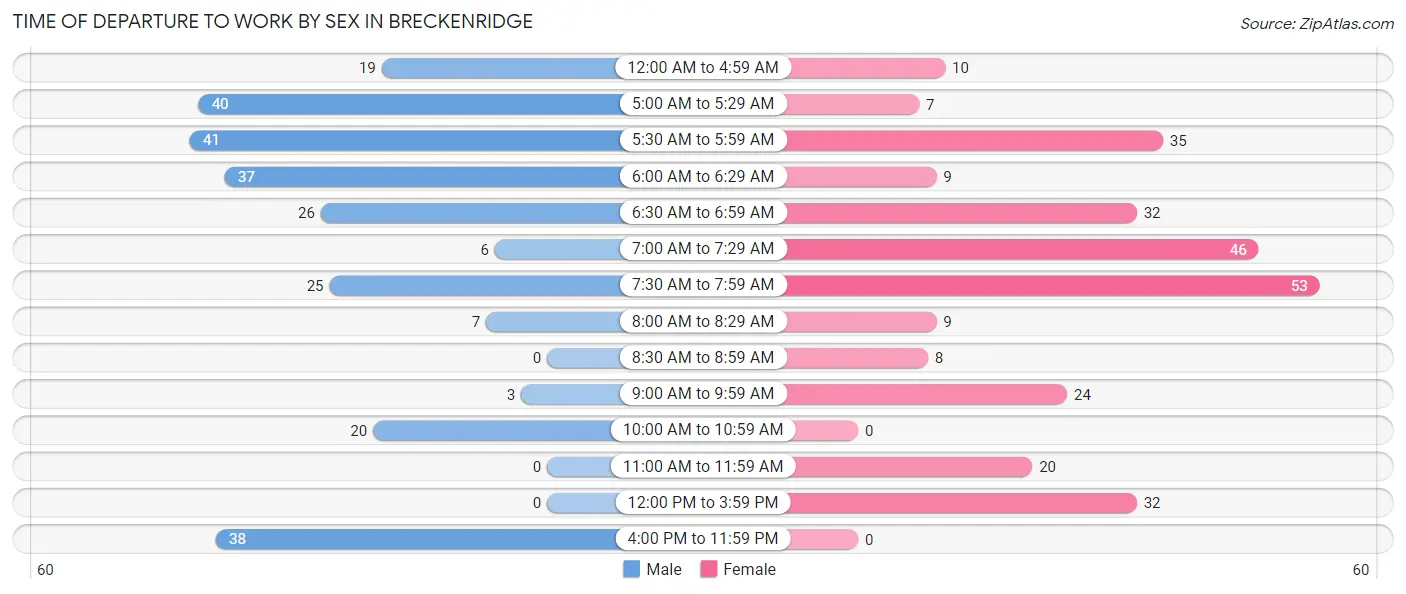
| Time of Departure | Male | Female |
| 12:00 AM to 4:59 AM | 19 (7.2%) | 10 (3.5%) |
| 5:00 AM to 5:29 AM | 40 (15.3%) | 7 (2.5%) |
| 5:30 AM to 5:59 AM | 41 (15.7%) | 35 (12.3%) |
| 6:00 AM to 6:29 AM | 37 (14.1%) | 9 (3.2%) |
| 6:30 AM to 6:59 AM | 26 (9.9%) | 32 (11.2%) |
| 7:00 AM to 7:29 AM | 6 (2.3%) | 46 (16.1%) |
| 7:30 AM to 7:59 AM | 25 (9.5%) | 53 (18.6%) |
| 8:00 AM to 8:29 AM | 7 (2.7%) | 9 (3.2%) |
| 8:30 AM to 8:59 AM | 0 (0.0%) | 8 (2.8%) |
| 9:00 AM to 9:59 AM | 3 (1.1%) | 24 (8.4%) |
| 10:00 AM to 10:59 AM | 20 (7.6%) | 0 (0.0%) |
| 11:00 AM to 11:59 AM | 0 (0.0%) | 20 (7.0%) |
| 12:00 PM to 3:59 PM | 0 (0.0%) | 32 (11.2%) |
| 4:00 PM to 11:59 PM | 38 (14.5%) | 0 (0.0%) |
| Total | 262 (100.0%) | 285 (100.0%) |
Housing Occupancy in Breckenridge
Occupancy by Ownership in Breckenridge
Of the total 541 dwellings in Breckenridge, owner-occupied units account for 379 (70.1%), while renter-occupied units make up 162 (29.9%).
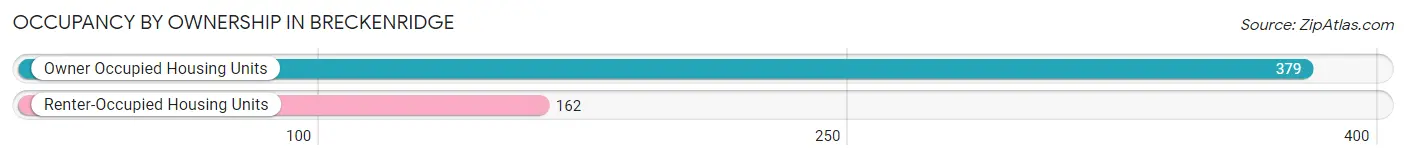
| Occupancy | # Housing Units | % Housing Units |
| Owner Occupied Housing Units | 379 | 70.1% |
| Renter-Occupied Housing Units | 162 | 29.9% |
| Total Occupied Housing Units | 541 | 100.0% |
Occupancy by Household Size in Breckenridge
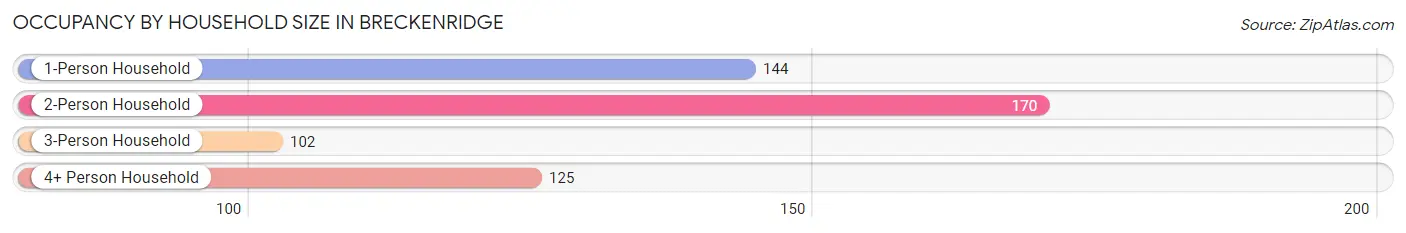
| Household Size | # Housing Units | % Housing Units |
| 1-Person Household | 144 | 26.6% |
| 2-Person Household | 170 | 31.4% |
| 3-Person Household | 102 | 18.9% |
| 4+ Person Household | 125 | 23.1% |
| Total Housing Units | 541 | 100.0% |
Occupancy by Ownership by Household Size in Breckenridge
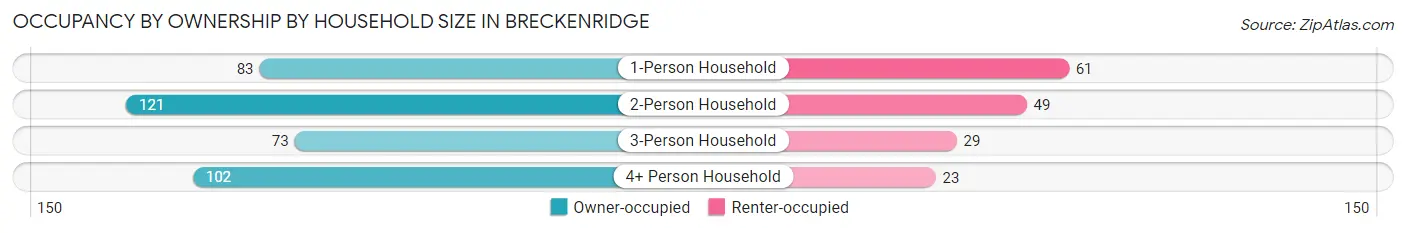
| Household Size | Owner-occupied | Renter-occupied |
| 1-Person Household | 83 (57.6%) | 61 (42.4%) |
| 2-Person Household | 121 (71.2%) | 49 (28.8%) |
| 3-Person Household | 73 (71.6%) | 29 (28.4%) |
| 4+ Person Household | 102 (81.6%) | 23 (18.4%) |
| Total Housing Units | 379 (70.1%) | 162 (29.9%) |
Occupancy by Educational Attainment in Breckenridge
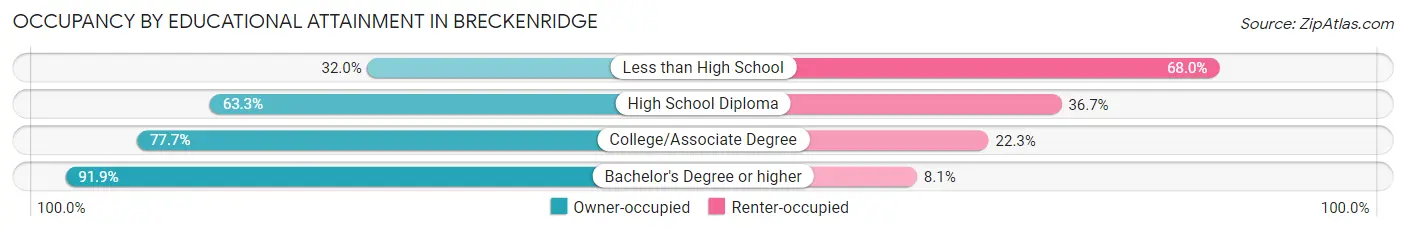
| Household Size | Owner-occupied | Renter-occupied |
| Less than High School | 16 (32.0%) | 34 (68.0%) |
| High School Diploma | 143 (63.3%) | 83 (36.7%) |
| College/Associate Degree | 129 (77.7%) | 37 (22.3%) |
| Bachelor's Degree or higher | 91 (91.9%) | 8 (8.1%) |
Occupancy by Age of Householder in Breckenridge
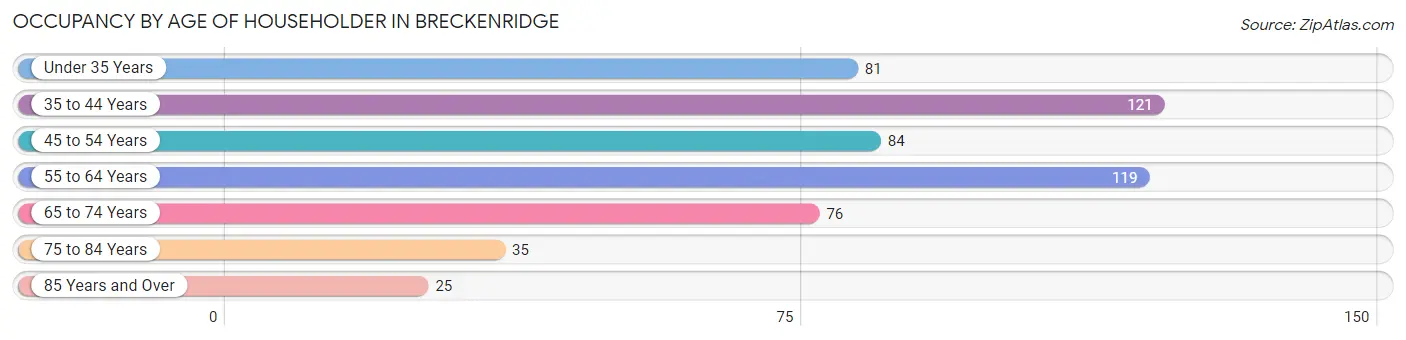
| Age Bracket | # Households | % Households |
| Under 35 Years | 81 | 15.0% |
| 35 to 44 Years | 121 | 22.4% |
| 45 to 54 Years | 84 | 15.5% |
| 55 to 64 Years | 119 | 22.0% |
| 65 to 74 Years | 76 | 14.1% |
| 75 to 84 Years | 35 | 6.5% |
| 85 Years and Over | 25 | 4.6% |
| Total | 541 | 100.0% |
Housing Finances in Breckenridge
Median Income by Occupancy in Breckenridge
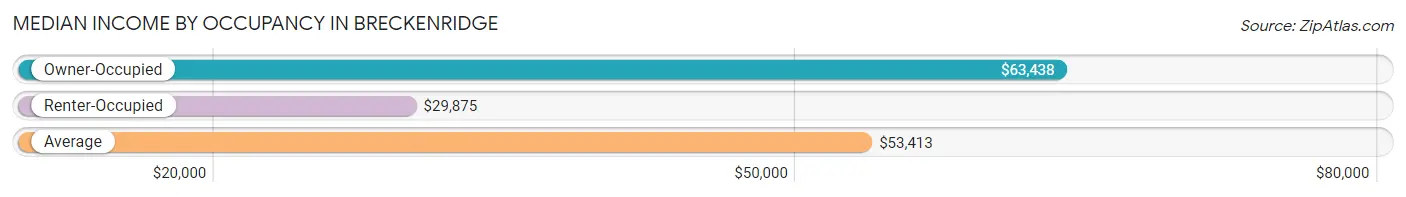
| Occupancy Type | # Households | Median Income |
| Owner-Occupied | 379 (70.1%) | $63,438 |
| Renter-Occupied | 162 (29.9%) | $29,875 |
| Average | 541 (100.0%) | $53,413 |
Occupancy by Householder Income Bracket in Breckenridge
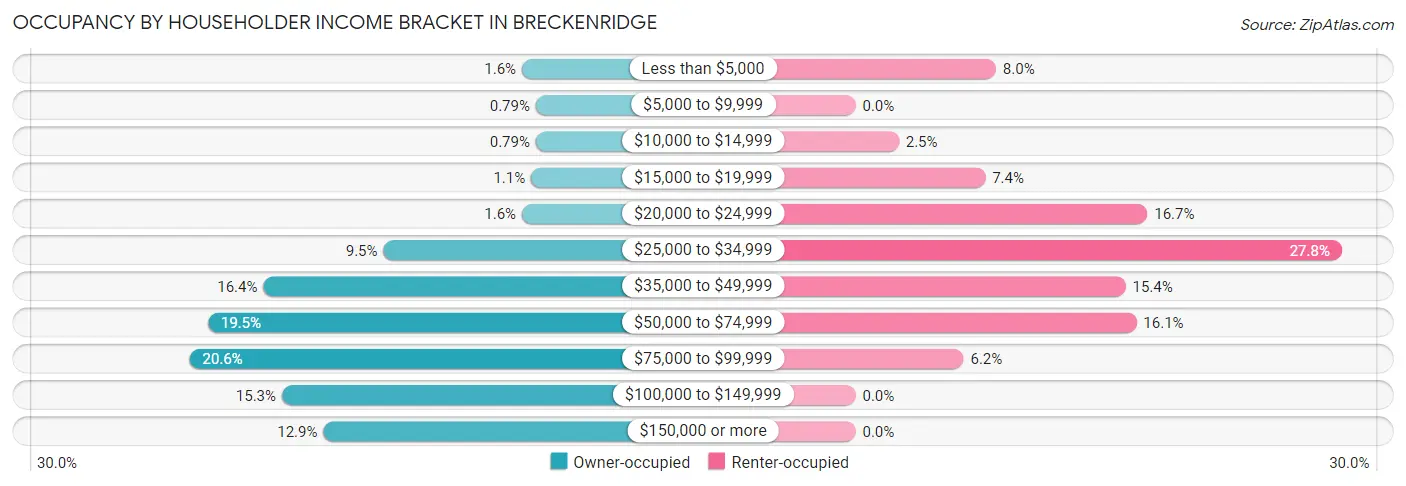
| Income Bracket | Owner-occupied | Renter-occupied |
| Less than $5,000 | 6 (1.6%) | 13 (8.0%) |
| $5,000 to $9,999 | 3 (0.8%) | 0 (0.0%) |
| $10,000 to $14,999 | 3 (0.8%) | 4 (2.5%) |
| $15,000 to $19,999 | 4 (1.1%) | 12 (7.4%) |
| $20,000 to $24,999 | 6 (1.6%) | 27 (16.7%) |
| $25,000 to $34,999 | 36 (9.5%) | 45 (27.8%) |
| $35,000 to $49,999 | 62 (16.4%) | 25 (15.4%) |
| $50,000 to $74,999 | 74 (19.5%) | 26 (16.1%) |
| $75,000 to $99,999 | 78 (20.6%) | 10 (6.2%) |
| $100,000 to $149,999 | 58 (15.3%) | 0 (0.0%) |
| $150,000 or more | 49 (12.9%) | 0 (0.0%) |
| Total | 379 (100.0%) | 162 (100.0%) |
Monthly Housing Cost Tiers in Breckenridge
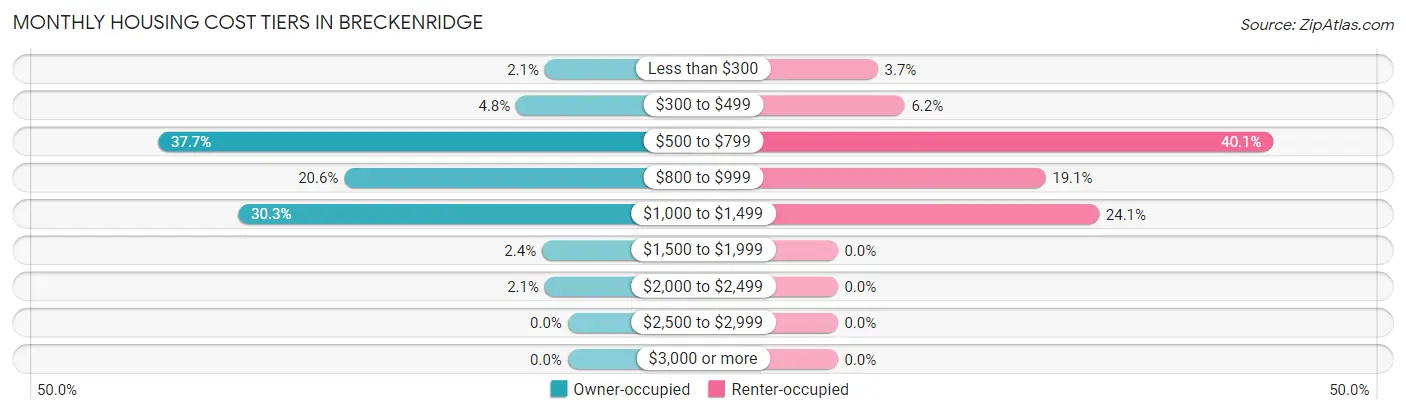
| Monthly Cost | Owner-occupied | Renter-occupied |
| Less than $300 | 8 (2.1%) | 6 (3.7%) |
| $300 to $499 | 18 (4.8%) | 10 (6.2%) |
| $500 to $799 | 143 (37.7%) | 65 (40.1%) |
| $800 to $999 | 78 (20.6%) | 31 (19.1%) |
| $1,000 to $1,499 | 115 (30.3%) | 39 (24.1%) |
| $1,500 to $1,999 | 9 (2.4%) | 0 (0.0%) |
| $2,000 to $2,499 | 8 (2.1%) | 0 (0.0%) |
| $2,500 to $2,999 | 0 (0.0%) | 0 (0.0%) |
| $3,000 or more | 0 (0.0%) | 0 (0.0%) |
| Total | 379 (100.0%) | 162 (100.0%) |
Physical Housing Characteristics in Breckenridge
Housing Structures in Breckenridge
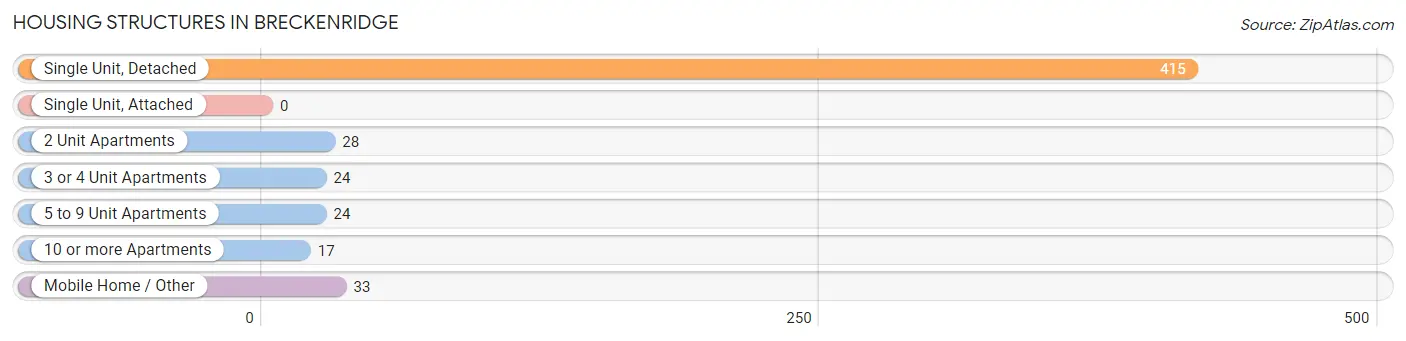
| Structure Type | # Housing Units | % Housing Units |
| Single Unit, Detached | 415 | 76.7% |
| Single Unit, Attached | 0 | 0.0% |
| 2 Unit Apartments | 28 | 5.2% |
| 3 or 4 Unit Apartments | 24 | 4.4% |
| 5 to 9 Unit Apartments | 24 | 4.4% |
| 10 or more Apartments | 17 | 3.1% |
| Mobile Home / Other | 33 | 6.1% |
| Total | 541 | 100.0% |
Housing Structures by Occupancy in Breckenridge
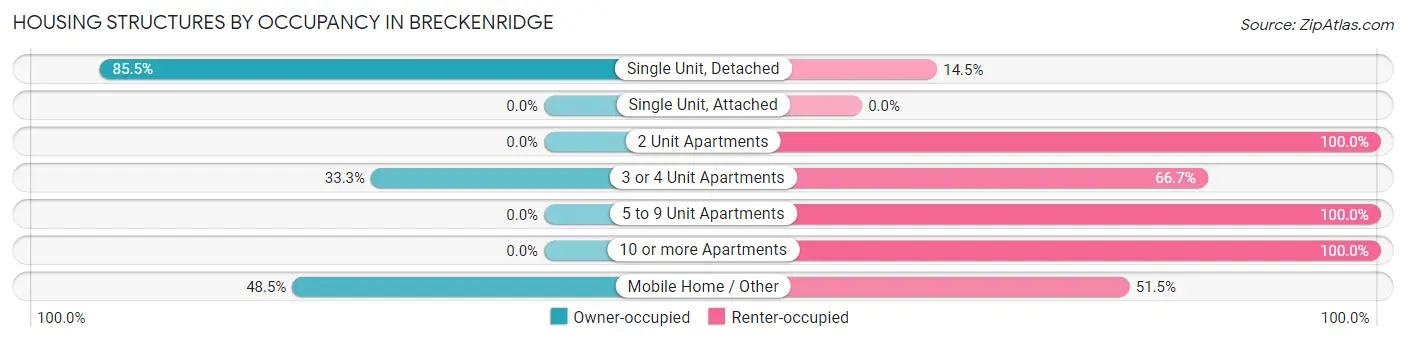
| Structure Type | Owner-occupied | Renter-occupied |
| Single Unit, Detached | 355 (85.5%) | 60 (14.5%) |
| Single Unit, Attached | 0 (0.0%) | 0 (0.0%) |
| 2 Unit Apartments | 0 (0.0%) | 28 (100.0%) |
| 3 or 4 Unit Apartments | 8 (33.3%) | 16 (66.7%) |
| 5 to 9 Unit Apartments | 0 (0.0%) | 24 (100.0%) |
| 10 or more Apartments | 0 (0.0%) | 17 (100.0%) |
| Mobile Home / Other | 16 (48.5%) | 17 (51.5%) |
| Total | 379 (70.1%) | 162 (29.9%) |
Housing Structures by Number of Rooms in Breckenridge
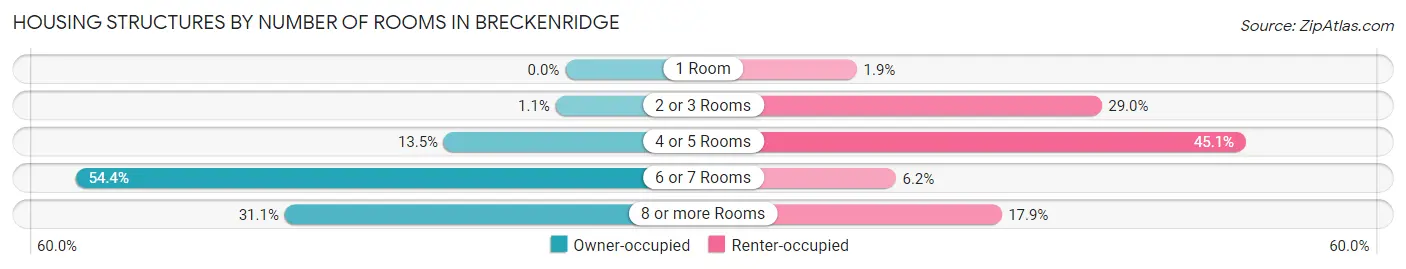
| Number of Rooms | Owner-occupied | Renter-occupied |
| 1 Room | 0 (0.0%) | 3 (1.8%) |
| 2 or 3 Rooms | 4 (1.1%) | 47 (29.0%) |
| 4 or 5 Rooms | 51 (13.5%) | 73 (45.1%) |
| 6 or 7 Rooms | 206 (54.3%) | 10 (6.2%) |
| 8 or more Rooms | 118 (31.1%) | 29 (17.9%) |
| Total | 379 (100.0%) | 162 (100.0%) |
Housing Structure by Heating Type in Breckenridge
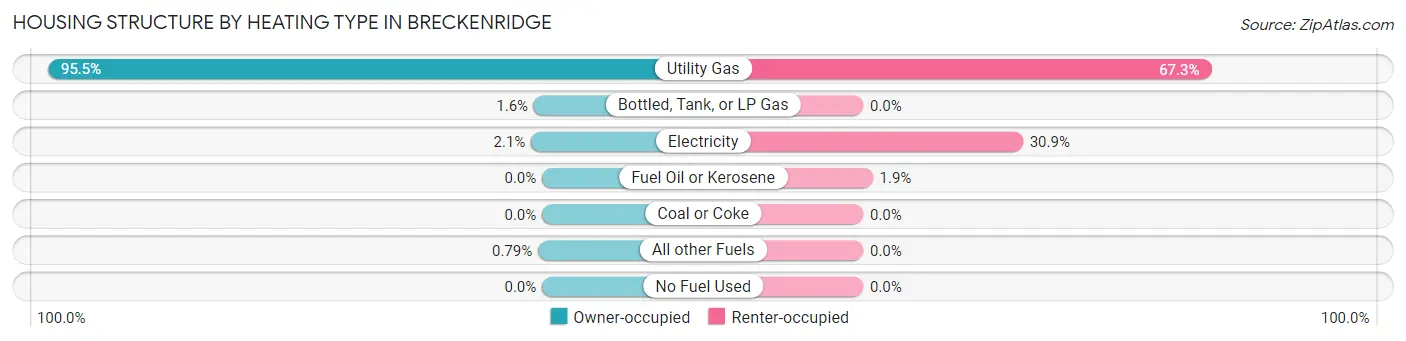
| Heating Type | Owner-occupied | Renter-occupied |
| Utility Gas | 362 (95.5%) | 109 (67.3%) |
| Bottled, Tank, or LP Gas | 6 (1.6%) | 0 (0.0%) |
| Electricity | 8 (2.1%) | 50 (30.9%) |
| Fuel Oil or Kerosene | 0 (0.0%) | 3 (1.8%) |
| Coal or Coke | 0 (0.0%) | 0 (0.0%) |
| All other Fuels | 3 (0.8%) | 0 (0.0%) |
| No Fuel Used | 0 (0.0%) | 0 (0.0%) |
| Total | 379 (100.0%) | 162 (100.0%) |
Household Vehicle Usage in Breckenridge
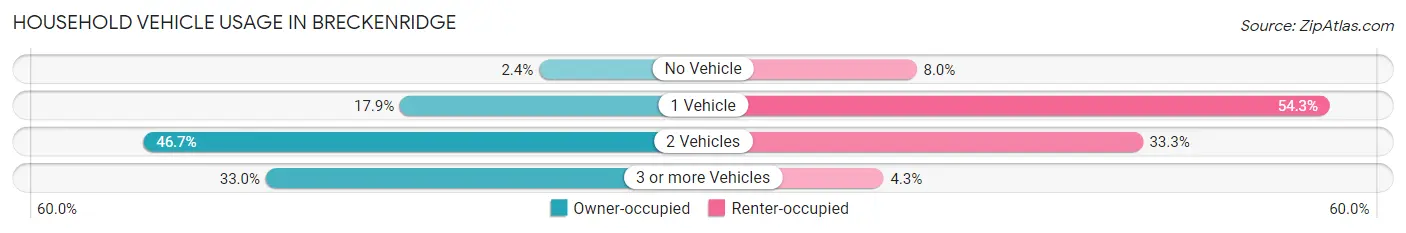
| Vehicles per Household | Owner-occupied | Renter-occupied |
| No Vehicle | 9 (2.4%) | 13 (8.0%) |
| 1 Vehicle | 68 (17.9%) | 88 (54.3%) |
| 2 Vehicles | 177 (46.7%) | 54 (33.3%) |
| 3 or more Vehicles | 125 (33.0%) | 7 (4.3%) |
| Total | 379 (100.0%) | 162 (100.0%) |
Real Estate & Mortgages in Breckenridge
Real Estate and Mortgage Overview in Breckenridge
| Characteristic | Without Mortgage | With Mortgage |
| Housing Units | 154 | 225 |
| Median Property Value | $96,700 | $97,800 |
| Median Household Income | $58,750 | $36 |
| Monthly Housing Costs | $593 | $0 |
| Real Estate Taxes | $1,857 | $7 |
Property Value by Mortgage Status in Breckenridge
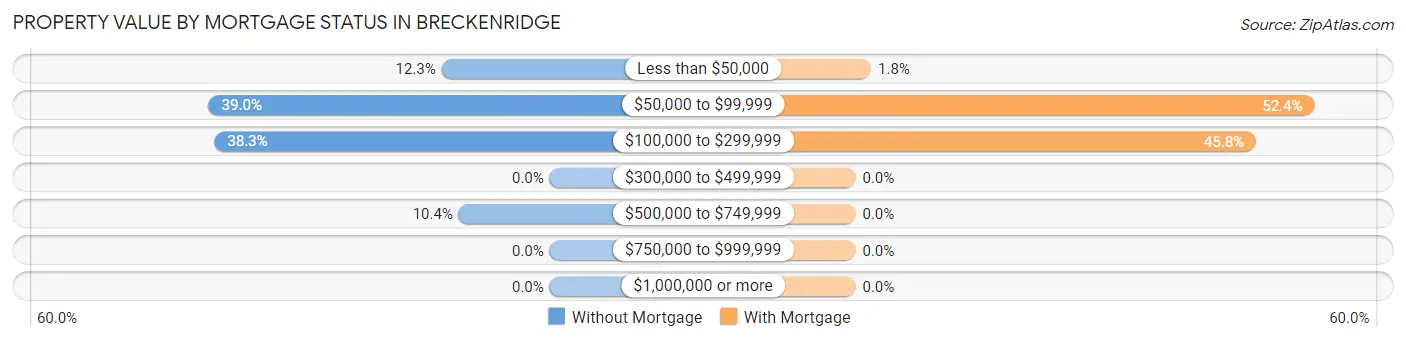
| Property Value | Without Mortgage | With Mortgage |
| Less than $50,000 | 19 (12.3%) | 4 (1.8%) |
| $50,000 to $99,999 | 60 (39.0%) | 118 (52.4%) |
| $100,000 to $299,999 | 59 (38.3%) | 103 (45.8%) |
| $300,000 to $499,999 | 0 (0.0%) | 0 (0.0%) |
| $500,000 to $749,999 | 16 (10.4%) | 0 (0.0%) |
| $750,000 to $999,999 | 0 (0.0%) | 0 (0.0%) |
| $1,000,000 or more | 0 (0.0%) | 0 (0.0%) |
| Total | 154 (100.0%) | 225 (100.0%) |
Household Income by Mortgage Status in Breckenridge
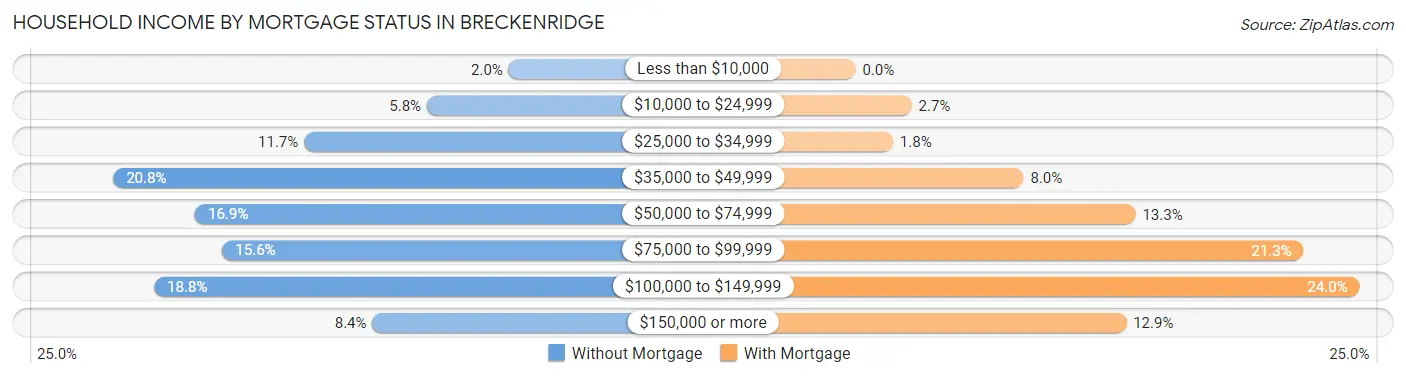
| Household Income | Without Mortgage | With Mortgage |
| Less than $10,000 | 3 (1.9%) | 0 (0.0%) |
| $10,000 to $24,999 | 9 (5.8%) | 6 (2.7%) |
| $25,000 to $34,999 | 18 (11.7%) | 4 (1.8%) |
| $35,000 to $49,999 | 32 (20.8%) | 18 (8.0%) |
| $50,000 to $74,999 | 26 (16.9%) | 30 (13.3%) |
| $75,000 to $99,999 | 24 (15.6%) | 48 (21.3%) |
| $100,000 to $149,999 | 29 (18.8%) | 54 (24.0%) |
| $150,000 or more | 13 (8.4%) | 29 (12.9%) |
| Total | 154 (100.0%) | 225 (100.0%) |
Property Value to Household Income Ratio in Breckenridge
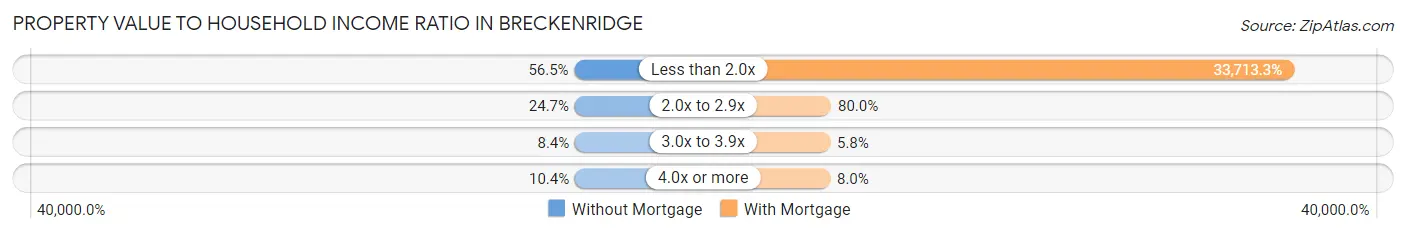
| Value-to-Income Ratio | Without Mortgage | With Mortgage |
| Less than 2.0x | 87 (56.5%) | 75,855 (33,713.3%) |
| 2.0x to 2.9x | 38 (24.7%) | 180 (80.0%) |
| 3.0x to 3.9x | 13 (8.4%) | 13 (5.8%) |
| 4.0x or more | 16 (10.4%) | 18 (8.0%) |
| Total | 154 (100.0%) | 225 (100.0%) |
Real Estate Taxes by Mortgage Status in Breckenridge
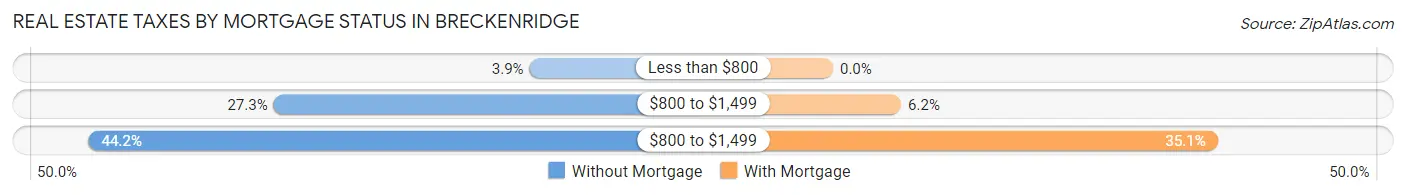
| Property Taxes | Without Mortgage | With Mortgage |
| Less than $800 | 6 (3.9%) | 0 (0.0%) |
| $800 to $1,499 | 42 (27.3%) | 14 (6.2%) |
| $800 to $1,499 | 68 (44.2%) | 79 (35.1%) |
| Total | 154 (100.0%) | 225 (100.0%) |
Health & Disability in Breckenridge
Health Insurance Coverage by Age in Breckenridge
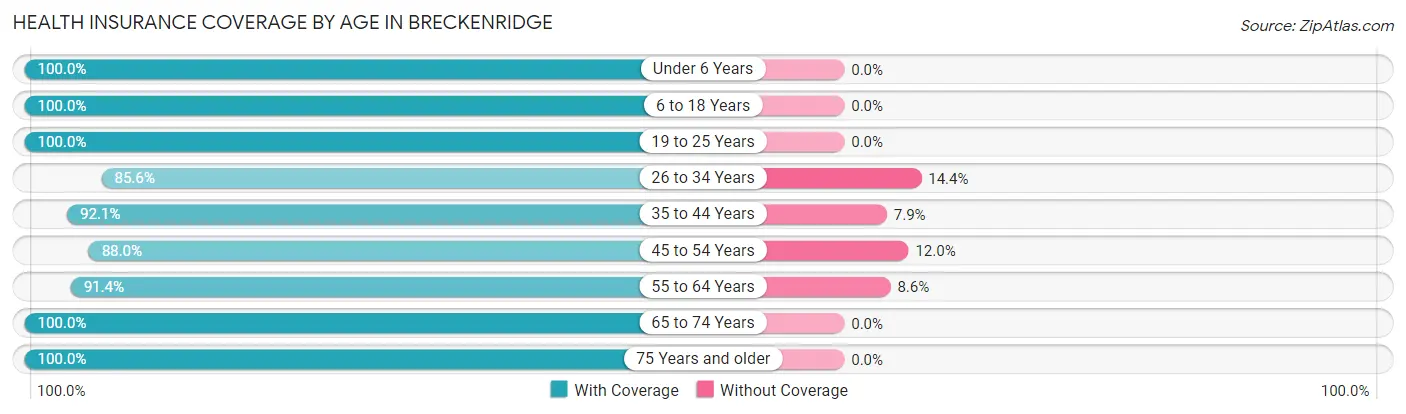
| Age Bracket | With Coverage | Without Coverage |
| Under 6 Years | 71 (100.0%) | 0 (0.0%) |
| 6 to 18 Years | 277 (100.0%) | 0 (0.0%) |
| 19 to 25 Years | 83 (100.0%) | 0 (0.0%) |
| 26 to 34 Years | 173 (85.6%) | 29 (14.4%) |
| 35 to 44 Years | 209 (92.1%) | 18 (7.9%) |
| 45 to 54 Years | 125 (88.0%) | 17 (12.0%) |
| 55 to 64 Years | 191 (91.4%) | 18 (8.6%) |
| 65 to 74 Years | 121 (100.0%) | 0 (0.0%) |
| 75 Years and older | 65 (100.0%) | 0 (0.0%) |
| Total | 1,315 (94.1%) | 82 (5.9%) |
Health Insurance Coverage by Citizenship Status in Breckenridge
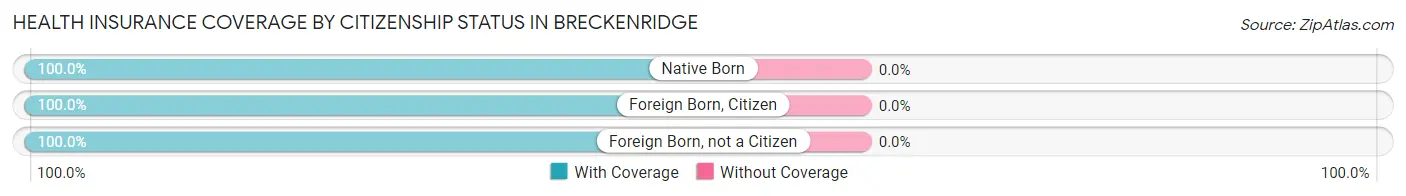
| Citizenship Status | With Coverage | Without Coverage |
| Native Born | 71 (100.0%) | 0 (0.0%) |
| Foreign Born, Citizen | 277 (100.0%) | 0 (0.0%) |
| Foreign Born, not a Citizen | 83 (100.0%) | 0 (0.0%) |
Health Insurance Coverage by Household Income in Breckenridge
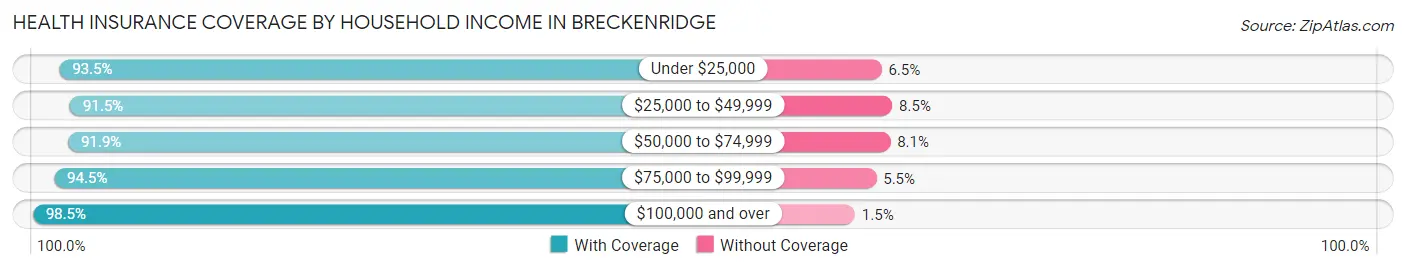
| Household Income | With Coverage | Without Coverage |
| Under $25,000 | 144 (93.5%) | 10 (6.5%) |
| $25,000 to $49,999 | 280 (91.5%) | 26 (8.5%) |
| $50,000 to $74,999 | 260 (91.9%) | 23 (8.1%) |
| $75,000 to $99,999 | 308 (94.5%) | 18 (5.5%) |
| $100,000 and over | 323 (98.5%) | 5 (1.5%) |
Public vs Private Health Insurance Coverage by Age in Breckenridge
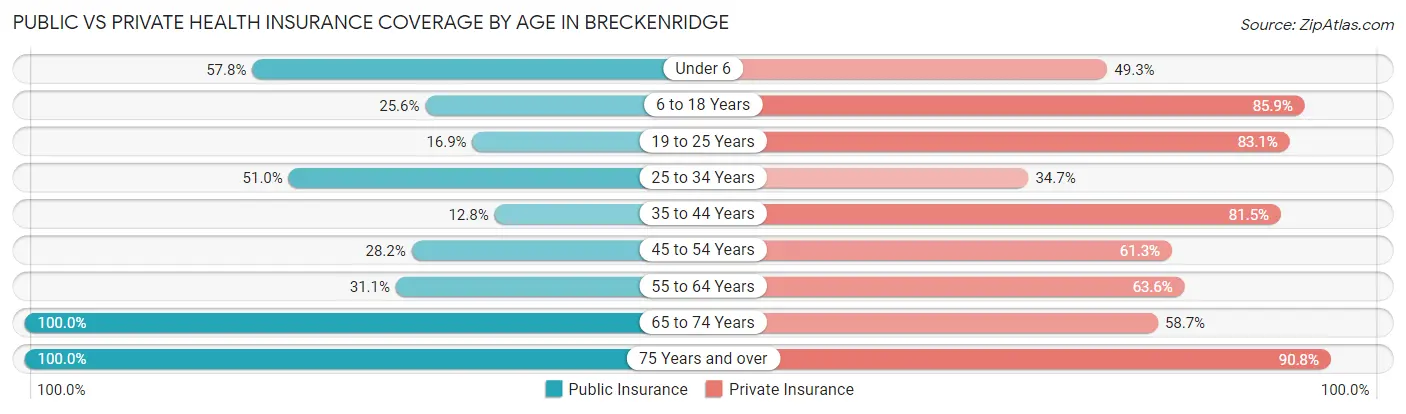
| Age Bracket | Public Insurance | Private Insurance |
| Under 6 | 41 (57.8%) | 35 (49.3%) |
| 6 to 18 Years | 71 (25.6%) | 238 (85.9%) |
| 19 to 25 Years | 14 (16.9%) | 69 (83.1%) |
| 25 to 34 Years | 103 (51.0%) | 70 (34.6%) |
| 35 to 44 Years | 29 (12.8%) | 185 (81.5%) |
| 45 to 54 Years | 40 (28.2%) | 87 (61.3%) |
| 55 to 64 Years | 65 (31.1%) | 133 (63.6%) |
| 65 to 74 Years | 121 (100.0%) | 71 (58.7%) |
| 75 Years and over | 65 (100.0%) | 59 (90.8%) |
| Total | 549 (39.3%) | 947 (67.8%) |
Disability Status by Sex by Age in Breckenridge
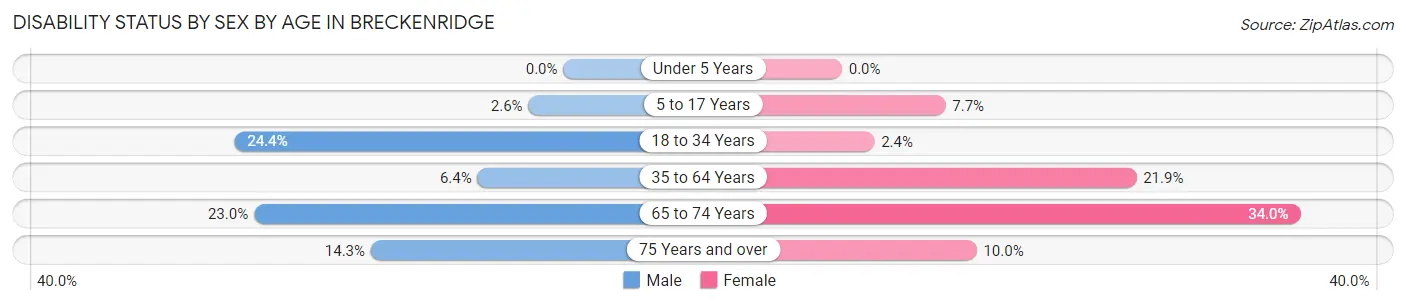
| Age Bracket | Male | Female |
| Under 5 Years | 0 (0.0%) | 0 (0.0%) |
| 5 to 17 Years | 5 (2.6%) | 8 (7.7%) |
| 18 to 34 Years | 32 (24.4%) | 4 (2.4%) |
| 35 to 64 Years | 17 (6.4%) | 68 (21.9%) |
| 65 to 74 Years | 17 (23.0%) | 16 (34.0%) |
| 75 Years and over | 5 (14.3%) | 3 (10.0%) |
Disability Class by Sex by Age in Breckenridge
Disability Class: Hearing Difficulty
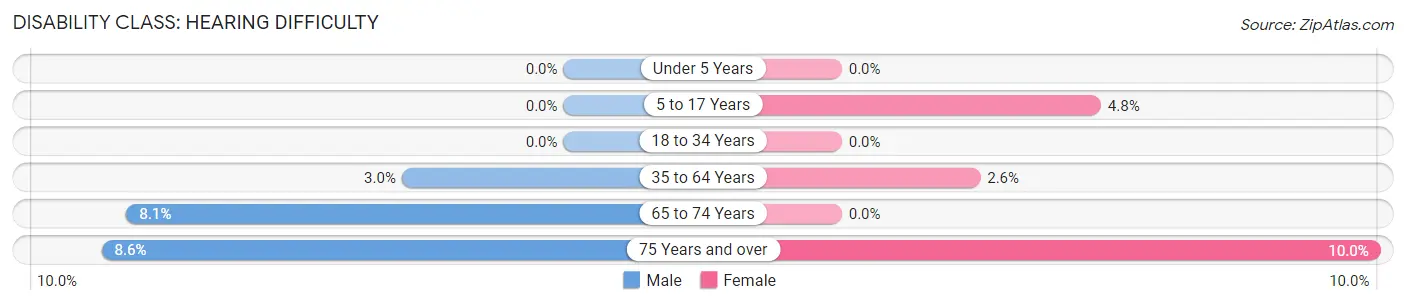
| Age Bracket | Male | Female |
| Under 5 Years | 0 (0.0%) | 0 (0.0%) |
| 5 to 17 Years | 0 (0.0%) | 5 (4.8%) |
| 18 to 34 Years | 0 (0.0%) | 0 (0.0%) |
| 35 to 64 Years | 8 (3.0%) | 8 (2.6%) |
| 65 to 74 Years | 6 (8.1%) | 0 (0.0%) |
| 75 Years and over | 3 (8.6%) | 3 (10.0%) |
Disability Class: Vision Difficulty
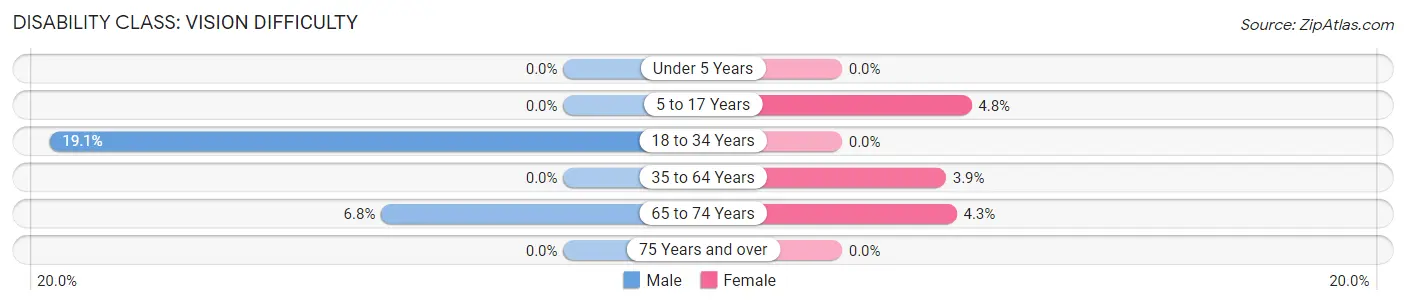
| Age Bracket | Male | Female |
| Under 5 Years | 0 (0.0%) | 0 (0.0%) |
| 5 to 17 Years | 0 (0.0%) | 5 (4.8%) |
| 18 to 34 Years | 25 (19.1%) | 0 (0.0%) |
| 35 to 64 Years | 0 (0.0%) | 12 (3.9%) |
| 65 to 74 Years | 5 (6.8%) | 2 (4.3%) |
| 75 Years and over | 0 (0.0%) | 0 (0.0%) |
Disability Class: Cognitive Difficulty
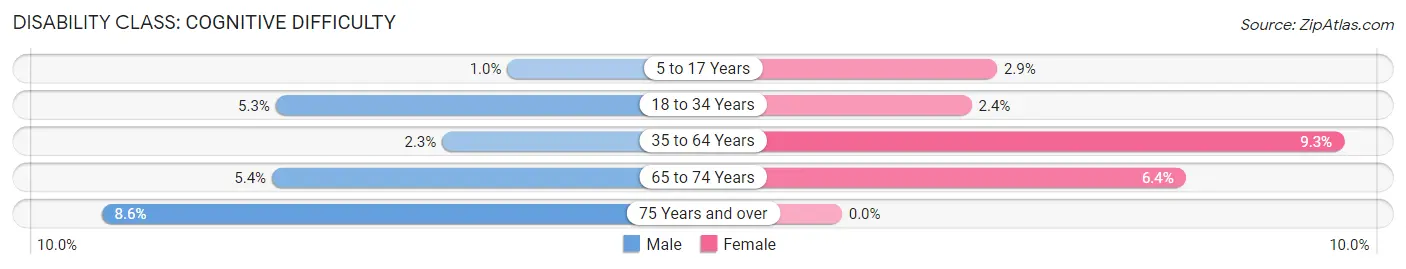
| Age Bracket | Male | Female |
| 5 to 17 Years | 2 (1.0%) | 3 (2.9%) |
| 18 to 34 Years | 7 (5.3%) | 4 (2.4%) |
| 35 to 64 Years | 6 (2.2%) | 29 (9.3%) |
| 65 to 74 Years | 4 (5.4%) | 3 (6.4%) |
| 75 Years and over | 3 (8.6%) | 0 (0.0%) |
Disability Class: Ambulatory Difficulty
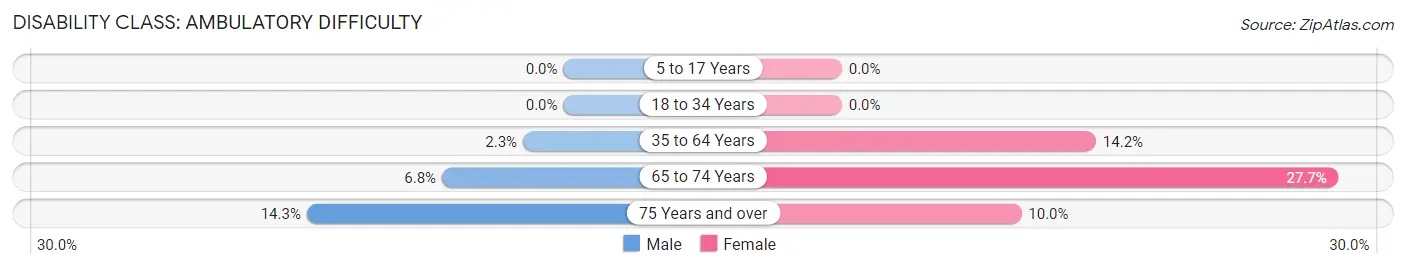
| Age Bracket | Male | Female |
| 5 to 17 Years | 0 (0.0%) | 0 (0.0%) |
| 18 to 34 Years | 0 (0.0%) | 0 (0.0%) |
| 35 to 64 Years | 6 (2.2%) | 44 (14.1%) |
| 65 to 74 Years | 5 (6.8%) | 13 (27.7%) |
| 75 Years and over | 5 (14.3%) | 3 (10.0%) |
Disability Class: Self-Care Difficulty
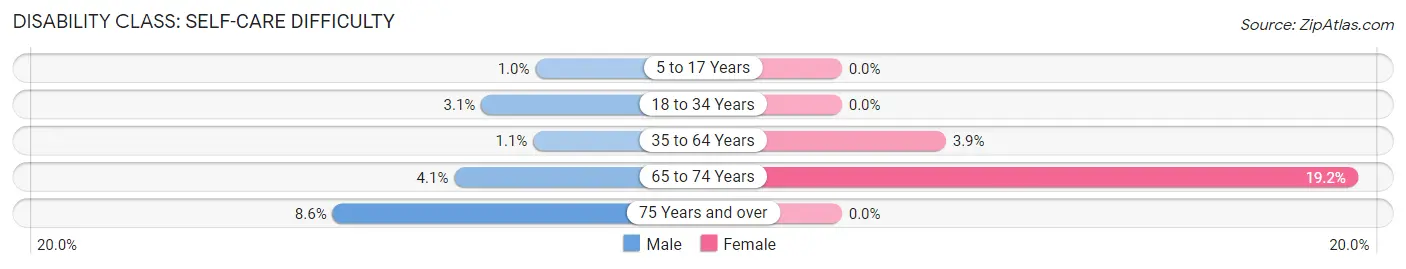
| Age Bracket | Male | Female |
| 5 to 17 Years | 2 (1.0%) | 0 (0.0%) |
| 18 to 34 Years | 4 (3.0%) | 0 (0.0%) |
| 35 to 64 Years | 3 (1.1%) | 12 (3.9%) |
| 65 to 74 Years | 3 (4.1%) | 9 (19.2%) |
| 75 Years and over | 3 (8.6%) | 0 (0.0%) |
Technology Access in Breckenridge
Computing Device Access in Breckenridge
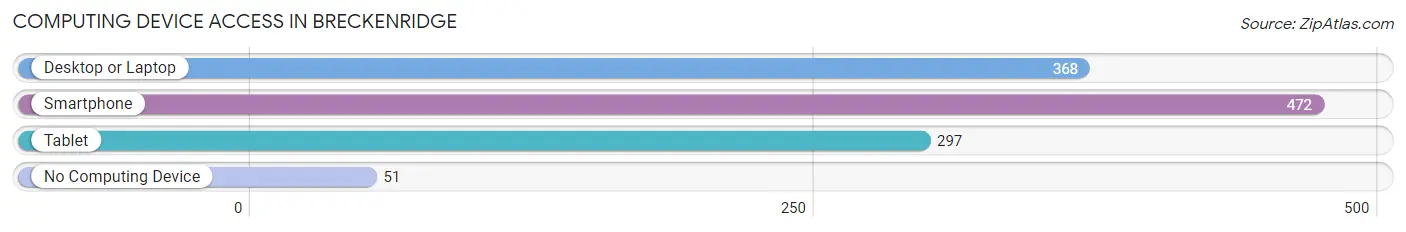
| Device Type | # Households | % Households |
| Desktop or Laptop | 368 | 68.0% |
| Smartphone | 472 | 87.3% |
| Tablet | 297 | 54.9% |
| No Computing Device | 51 | 9.4% |
| Total | 541 | 100.0% |
Internet Access in Breckenridge
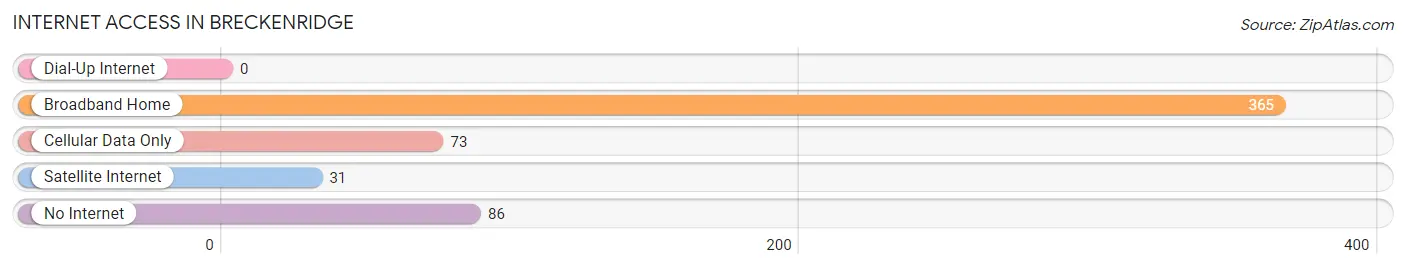
| Internet Type | # Households | % Households |
| Dial-Up Internet | 0 | 0.0% |
| Broadband Home | 365 | 67.5% |
| Cellular Data Only | 73 | 13.5% |
| Satellite Internet | 31 | 5.7% |
| No Internet | 86 | 15.9% |
| Total | 541 | 100.0% |
Breckenridge Summary
Breckenridge, Michigan is a small village located in Saginaw County, Michigan. It is situated on the banks of the Tittabawassee River, approximately 10 miles north of Saginaw. The village has a population of 1,845 people, according to the 2010 census.
History
The area that is now Breckenridge was first settled in 1836 by a group of German immigrants. The village was originally known as “Breckenridge’s Corners”, named after the first settler, John Breckenridge. The village was officially incorporated in 1871.
In the late 19th century, Breckenridge was a thriving agricultural community. The village was home to several mills, including a grist mill, a saw mill, and a woolen mill. The village also had a blacksmith shop, a general store, and a post office.
Geography
Breckenridge is located in Saginaw County, Michigan. It is situated on the banks of the Tittabawassee River, approximately 10 miles north of Saginaw. The village has a total area of 1.2 square miles, all of which is land.
The village is located in a rural area, surrounded by farmland and woodlands. The terrain is mostly flat, with some rolling hills. The climate is humid continental, with cold winters and warm summers.
Economy
The economy of Breckenridge is largely based on agriculture. The village is home to several farms, which produce a variety of crops, including corn, soybeans, wheat, and hay. The village also has several small businesses, including a grocery store, a hardware store, and a restaurant.
Demographics
According to the 2010 census, Breckenridge has a population of 1,845 people. The population is predominantly white (94.3%), with small percentages of African American (2.2%), Hispanic (1.7%), and Asian (1.2%) residents. The median household income is $45,938, and the median age is 43.
Conclusion
Breckenridge, Michigan is a small village located in Saginaw County, Michigan. It has a population of 1,845 people, and is situated on the banks of the Tittabawassee River. The village was first settled in 1836, and was officially incorporated in 1871. The economy of Breckenridge is largely based on agriculture, and the village is home to several small businesses. The population is predominantly white, with small percentages of African American, Hispanic, and Asian residents.
Common Questions
What is Per Capita Income in Breckenridge?
Per Capita income in Breckenridge is $26,453.
What is the Median Family Income in Breckenridge?
Median Family Income in Breckenridge is $61,471.
What is the Median Household income in Breckenridge?
Median Household Income in Breckenridge is $53,413.
What is Income or Wage Gap in Breckenridge?
Income or Wage Gap in Breckenridge is 23.2%.
Women in Breckenridge earn 76.8 cents for every dollar earned by a man.
What is Family Income Deficit in Breckenridge?
Family Income Deficit in Breckenridge is $11,287.
Families that are below poverty line in Breckenridge earn $11,287 less on average than the poverty threshold level.
What is Inequality or Gini Index in Breckenridge?
Inequality or Gini Index in Breckenridge is 0.39.
What is the Total Population of Breckenridge?
Total Population of Breckenridge is 1,413.
What is the Total Male Population of Breckenridge?
Total Male Population of Breckenridge is 720.
What is the Total Female Population of Breckenridge?
Total Female Population of Breckenridge is 693.
What is the Ratio of Males per 100 Females in Breckenridge?
There are 103.90 Males per 100 Females in Breckenridge.
What is the Ratio of Females per 100 Males in Breckenridge?
There are 96.25 Females per 100 Males in Breckenridge.
What is the Median Population Age in Breckenridge?
Median Population Age in Breckenridge is 38.7 Years.
What is the Average Family Size in Breckenridge
Average Family Size in Breckenridge is 2.9 People.
What is the Average Household Size in Breckenridge
Average Household Size in Breckenridge is 2.6 People.
How Large is the Labor Force in Breckenridge?
There are 661 People in the Labor Forcein in Breckenridge.
What is the Percentage of People in the Labor Force in Breckenridge?
60.7% of People are in the Labor Force in Breckenridge.
What is the Unemployment Rate in Breckenridge?
Unemployment Rate in Breckenridge is 8.2%.