Blissfield, MI Map & Demographics
Blissfield Map
Blissfield Overview
$31,428
PER CAPITA INCOME
$67,986
AVG FAMILY INCOME
$62,585
AVG HOUSEHOLD INCOME
54.7%
WAGE / INCOME GAP [ % ]
45.3¢/ $1
WAGE / INCOME GAP [ $ ]
0.35
INEQUALITY / GINI INDEX
3,214
TOTAL POPULATION
1,706
MALE POPULATION
1,508
FEMALE POPULATION
113.13
MALES / 100 FEMALES
88.39
FEMALES / 100 MALES
40.3
MEDIAN AGE
3.0
AVG FAMILY SIZE
2.5
AVG HOUSEHOLD SIZE
1,819
LABOR FORCE [ PEOPLE ]
70.4%
PERCENT IN LABOR FORCE
5.3%
UNEMPLOYMENT RATE
Blissfield Zip Codes
Blissfield Area Codes
Income in Blissfield
Income Overview in Blissfield
Per Capita Income in Blissfield is $31,428, while median incomes of families and households are $67,986 and $62,585 respectively.
| Characteristic | Number | Measure |
| Per Capita Income | 3,214 | $31,428 |
| Median Family Income | 914 | $67,986 |
| Mean Family Income | 914 | $87,172 |
| Median Household Income | 1,273 | $62,585 |
| Mean Household Income | 1,273 | $77,133 |
| Income Deficit | 914 | $0 |
| Wage / Income Gap (%) | 3,214 | 54.71% |
| Wage / Income Gap ($) | 3,214 | 45.29¢ per $1 |
| Gini / Inequality Index | 3,214 | 0.35 |
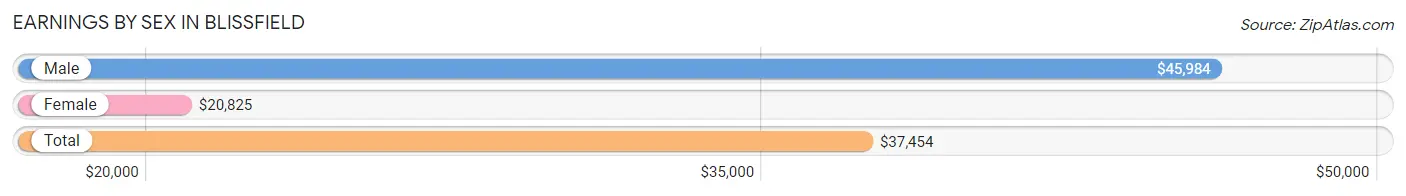
Earnings by Sex in Blissfield
Average Earnings in Blissfield are $37,454, $45,984 for men and $20,825 for women, a difference of 54.7%.
| Sex | Number | Average Earnings |
| Male | 1,157 (60.0%) | $45,984 |
| Female | 771 (40.0%) | $20,825 |
| Total | 1,928 (100.0%) | $37,454 |
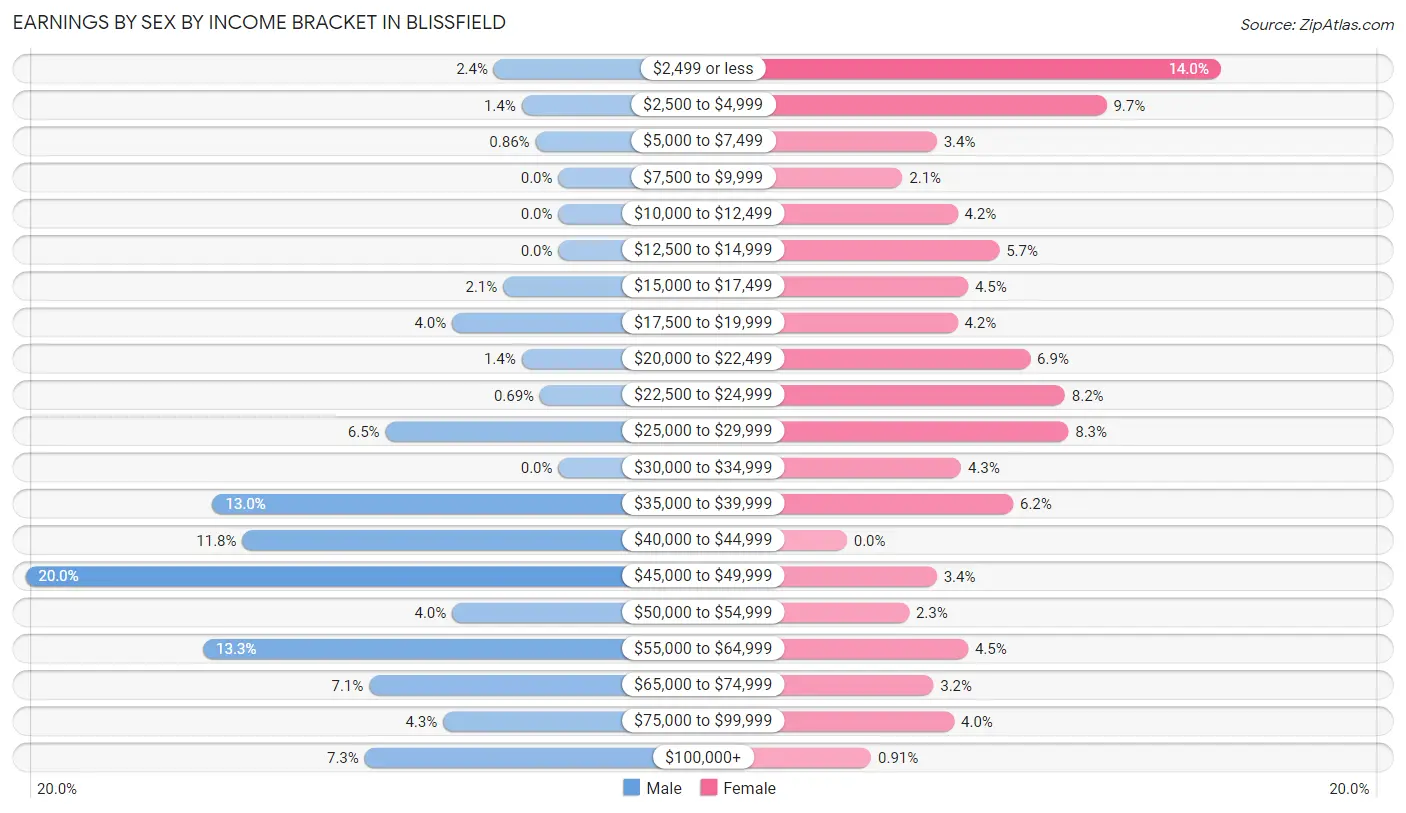
Earnings by Sex by Income Bracket in Blissfield
The most common earnings brackets in Blissfield are $45,000 to $49,999 for men (231 | 20.0%) and $2,499 or less for women (108 | 14.0%).
| Income | Male | Female |
| $2,499 or less | 28 (2.4%) | 108 (14.0%) |
| $2,500 to $4,999 | 16 (1.4%) | 75 (9.7%) |
| $5,000 to $7,499 | 10 (0.9%) | 26 (3.4%) |
| $7,500 to $9,999 | 0 (0.0%) | 16 (2.1%) |
| $10,000 to $12,499 | 0 (0.0%) | 32 (4.2%) |
| $12,500 to $14,999 | 0 (0.0%) | 44 (5.7%) |
| $15,000 to $17,499 | 24 (2.1%) | 35 (4.5%) |
| $17,500 to $19,999 | 46 (4.0%) | 32 (4.2%) |
| $20,000 to $22,499 | 16 (1.4%) | 53 (6.9%) |
| $22,500 to $24,999 | 8 (0.7%) | 63 (8.2%) |
| $25,000 to $29,999 | 75 (6.5%) | 64 (8.3%) |
| $30,000 to $34,999 | 0 (0.0%) | 33 (4.3%) |
| $35,000 to $39,999 | 150 (13.0%) | 48 (6.2%) |
| $40,000 to $44,999 | 137 (11.8%) | 0 (0.0%) |
| $45,000 to $49,999 | 231 (20.0%) | 26 (3.4%) |
| $50,000 to $54,999 | 46 (4.0%) | 18 (2.3%) |
| $55,000 to $64,999 | 154 (13.3%) | 35 (4.5%) |
| $65,000 to $74,999 | 82 (7.1%) | 25 (3.2%) |
| $75,000 to $99,999 | 50 (4.3%) | 31 (4.0%) |
| $100,000+ | 84 (7.3%) | 7 (0.9%) |
| Total | 1,157 (100.0%) | 771 (100.0%) |
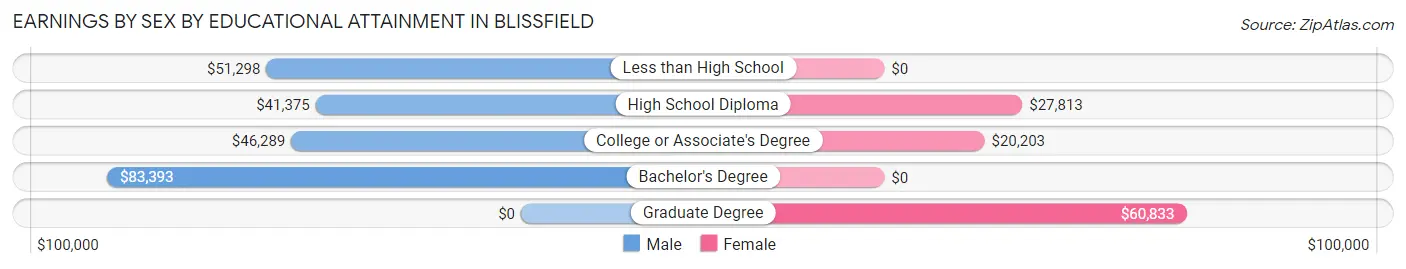
Earnings by Sex by Educational Attainment in Blissfield
Average earnings in Blissfield are $46,566 for men and $21,179 for women, a difference of 54.5%. Men with an educational attainment of bachelor's degree enjoy the highest average annual earnings of $83,393, while those with high school diploma education earn the least with $41,375. Women with an educational attainment of graduate degree earn the most with the average annual earnings of $60,833, while those with college or associate's degree education have the smallest earnings of $20,203.
| Educational Attainment | Male Income | Female Income |
| Less than High School | $51,298 | $0 |
| High School Diploma | $41,375 | $27,813 |
| College or Associate's Degree | $46,289 | $20,203 |
| Bachelor's Degree | $83,393 | $0 |
| Graduate Degree | - | - |
| Total | $46,566 | $21,179 |
Family Income in Blissfield
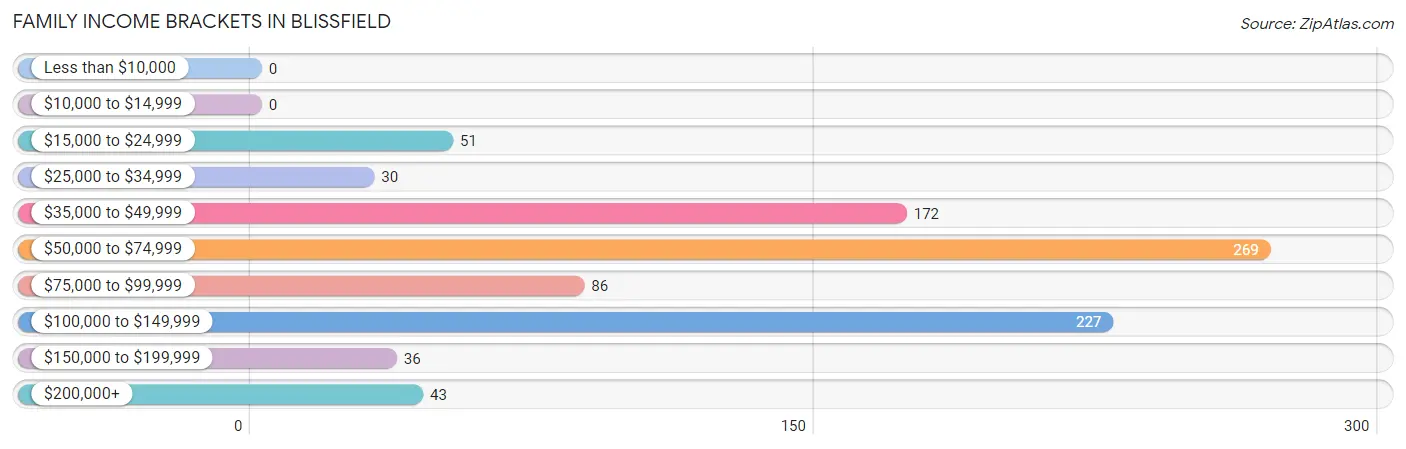
Family Income Brackets in Blissfield
According to the Blissfield family income data, there are 269 families falling into the $50,000 to $74,999 income range, which is the most common income bracket and makes up 29.4% of all families.
| Income Bracket | # Families | % Families |
| Less than $10,000 | 0 | 0.0% |
| $10,000 to $14,999 | 0 | 0.0% |
| $15,000 to $24,999 | 51 | 5.6% |
| $25,000 to $34,999 | 30 | 3.3% |
| $35,000 to $49,999 | 172 | 18.8% |
| $50,000 to $74,999 | 269 | 29.4% |
| $75,000 to $99,999 | 86 | 9.4% |
| $100,000 to $149,999 | 227 | 24.8% |
| $150,000 to $199,999 | 36 | 3.9% |
| $200,000+ | 43 | 4.7% |
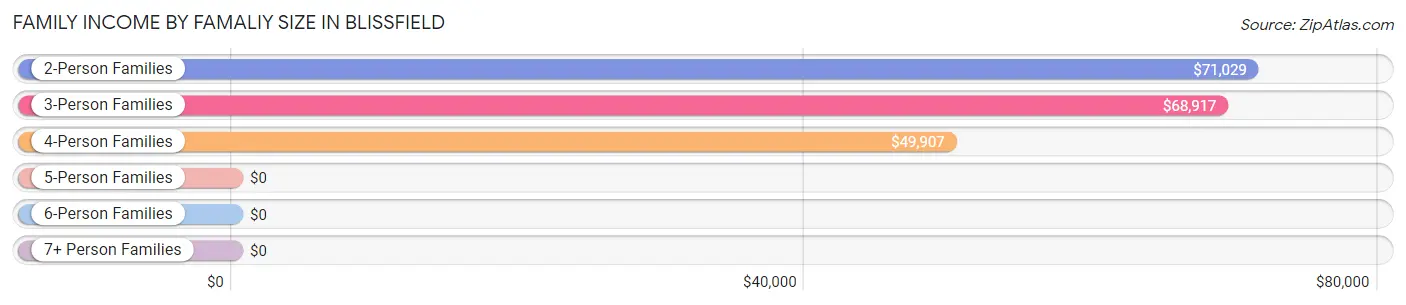
Family Income by Famaliy Size in Blissfield
2-person families (358 | 39.2%) account for the highest median family income in Blissfield with $71,029 per family, while 2-person families (358 | 39.2%) have the highest median income of $35,514 per family member.
| Income Bracket | # Families | Median Income |
| 2-Person Families | 358 (39.2%) | $71,029 |
| 3-Person Families | 265 (29.0%) | $68,917 |
| 4-Person Families | 233 (25.5%) | $49,907 |
| 5-Person Families | 52 (5.7%) | $0 |
| 6-Person Families | 6 (0.7%) | $0 |
| 7+ Person Families | 0 (0.0%) | $0 |
| Total | 914 (100.0%) | $67,986 |
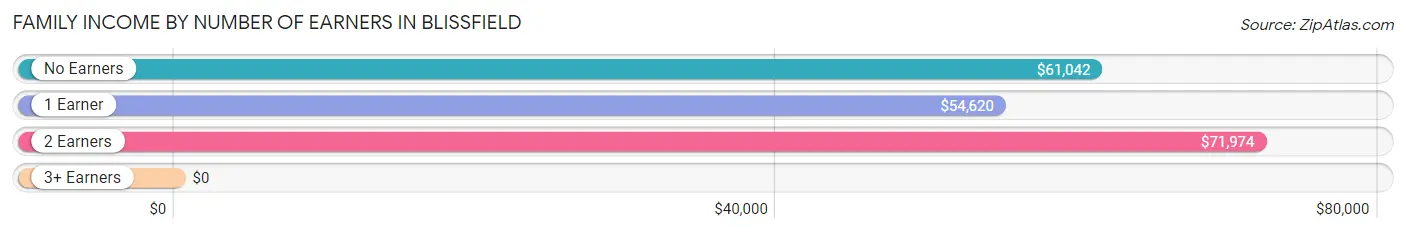
Family Income by Number of Earners in Blissfield
| Number of Earners | # Families | Median Income |
| No Earners | 99 (10.8%) | $61,042 |
| 1 Earner | 243 (26.6%) | $54,620 |
| 2 Earners | 460 (50.3%) | $71,974 |
| 3+ Earners | 112 (12.2%) | $0 |
| Total | 914 (100.0%) | $67,986 |
Household Income in Blissfield
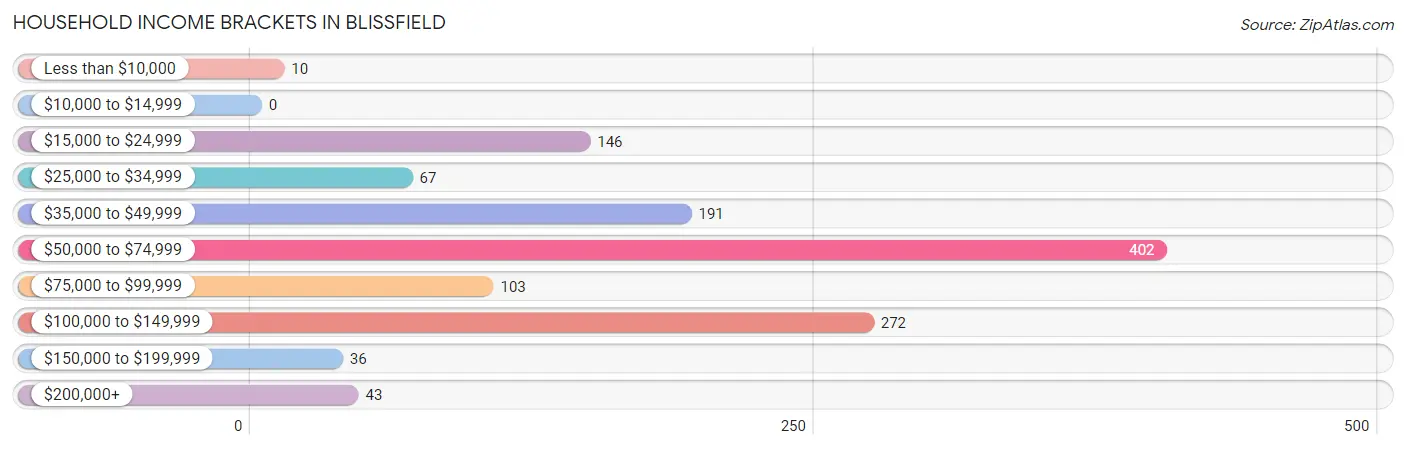
Household Income Brackets in Blissfield
With 402 households falling in the category, the $50,000 to $74,999 income range is the most frequent in Blissfield, accounting for 31.6% of all households.
| Income Bracket | # Households | % Households |
| Less than $10,000 | 10 | 0.8% |
| $10,000 to $14,999 | 0 | 0.0% |
| $15,000 to $24,999 | 146 | 11.5% |
| $25,000 to $34,999 | 67 | 5.3% |
| $35,000 to $49,999 | 191 | 15.0% |
| $50,000 to $74,999 | 402 | 31.6% |
| $75,000 to $99,999 | 103 | 8.1% |
| $100,000 to $149,999 | 272 | 21.4% |
| $150,000 to $199,999 | 36 | 2.8% |
| $200,000+ | 43 | 3.4% |
Household Income by Householder Age in Blissfield
The median household income in Blissfield is $62,585, with the highest median household income of $103,750 found in the 45 to 64 years age bracket for the primary householder. A total of 313 households (24.6%) fall into this category. Meanwhile, the 65+ years age bracket for the primary householder has the lowest median household income of $55,497, with 393 households (30.9%) in this group.
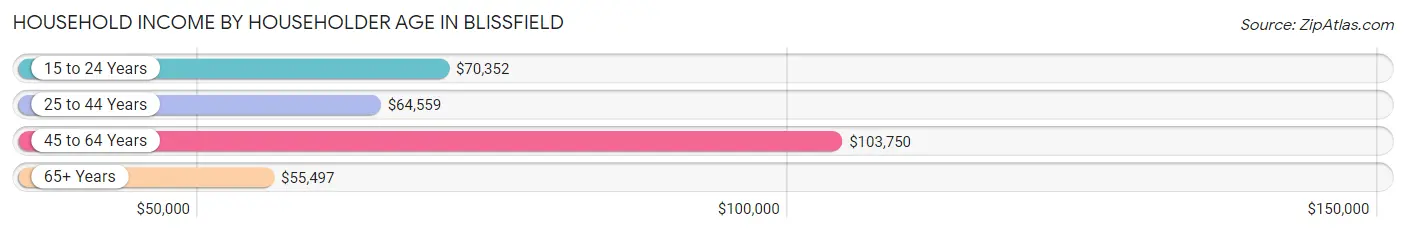
| Income Bracket | # Households | Median Income |
| 15 to 24 Years | 55 (4.3%) | $70,352 |
| 25 to 44 Years | 512 (40.2%) | $64,559 |
| 45 to 64 Years | 313 (24.6%) | $103,750 |
| 65+ Years | 393 (30.9%) | $55,497 |
| Total | 1,273 (100.0%) | $62,585 |
Poverty in Blissfield
Income Below Poverty by Sex and Age in Blissfield
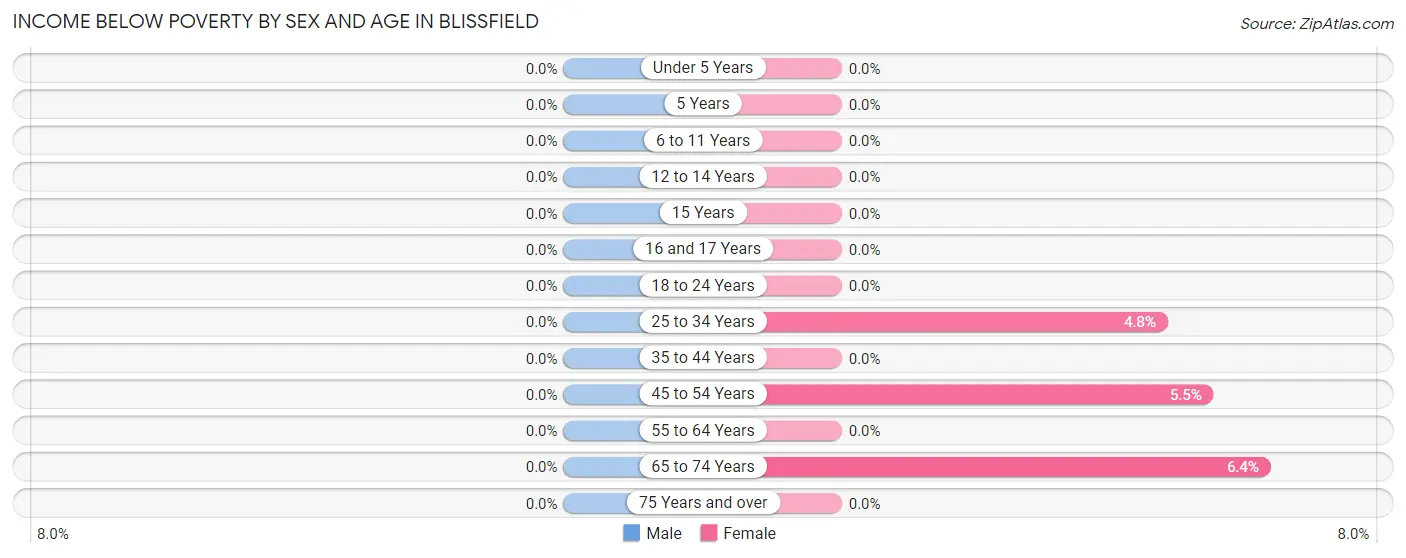
| Age Bracket | Male | Female |
| Under 5 Years | 0 (0.0%) | 0 (0.0%) |
| 5 Years | 0 (0.0%) | 0 (0.0%) |
| 6 to 11 Years | 0 (0.0%) | 0 (0.0%) |
| 12 to 14 Years | 0 (0.0%) | 0 (0.0%) |
| 15 Years | 0 (0.0%) | 0 (0.0%) |
| 16 and 17 Years | 0 (0.0%) | 0 (0.0%) |
| 18 to 24 Years | 0 (0.0%) | 0 (0.0%) |
| 25 to 34 Years | 0 (0.0%) | 9 (4.8%) |
| 35 to 44 Years | 0 (0.0%) | 0 (0.0%) |
| 45 to 54 Years | 0 (0.0%) | 8 (5.5%) |
| 55 to 64 Years | 0 (0.0%) | 0 (0.0%) |
| 65 to 74 Years | 0 (0.0%) | 10 (6.4%) |
| 75 Years and over | 0 (0.0%) | 0 (0.0%) |
| Total | 0 (0.0%) | 27 (1.8%) |
Income Above Poverty by Sex and Age in Blissfield
According to the poverty statistics in Blissfield, males aged under 5 years and females aged under 5 years are the age groups that are most secure financially, with 100.0% of males and 100.0% of females in these age groups living above the poverty line.
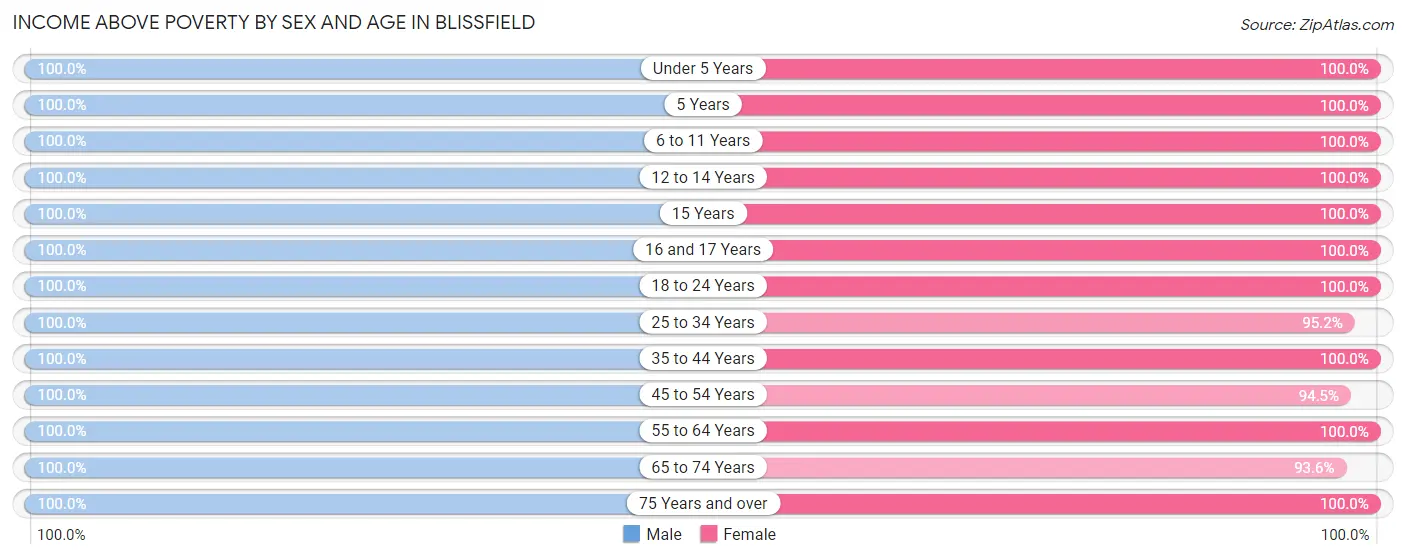
| Age Bracket | Male | Female |
| Under 5 Years | 120 (100.0%) | 198 (100.0%) |
| 5 Years | 5 (100.0%) | 10 (100.0%) |
| 6 to 11 Years | 62 (100.0%) | 50 (100.0%) |
| 12 to 14 Years | 57 (100.0%) | 54 (100.0%) |
| 15 Years | 40 (100.0%) | 34 (100.0%) |
| 16 and 17 Years | 36 (100.0%) | 47 (100.0%) |
| 18 to 24 Years | 131 (100.0%) | 92 (100.0%) |
| 25 to 34 Years | 299 (100.0%) | 177 (95.2%) |
| 35 to 44 Years | 331 (100.0%) | 214 (100.0%) |
| 45 to 54 Years | 120 (100.0%) | 137 (94.5%) |
| 55 to 64 Years | 250 (100.0%) | 165 (100.0%) |
| 65 to 74 Years | 166 (100.0%) | 147 (93.6%) |
| 75 Years and over | 89 (100.0%) | 156 (100.0%) |
| Total | 1,706 (100.0%) | 1,481 (98.2%) |
Income Below Poverty Among Married-Couple Families in Blissfield
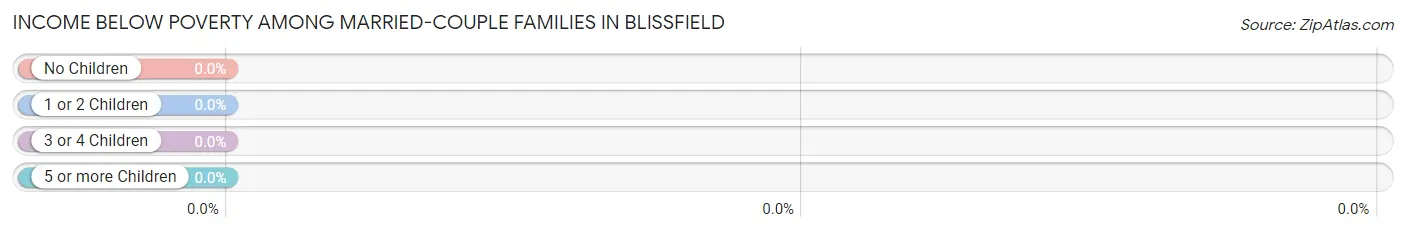
| Children | Above Poverty | Below Poverty |
| No Children | 392 (100.0%) | 0 (0.0%) |
| 1 or 2 Children | 350 (100.0%) | 0 (0.0%) |
| 3 or 4 Children | 32 (100.0%) | 0 (0.0%) |
| 5 or more Children | 0 (0.0%) | 0 (0.0%) |
| Total | 774 (100.0%) | 0 (0.0%) |
Income Below Poverty Among Single-Parent Households in Blissfield
| Children | Single Father | Single Mother |
| No Children | 0 (0.0%) | 0 (0.0%) |
| 1 or 2 Children | 0 (0.0%) | 0 (0.0%) |
| 3 or 4 Children | 0 (0.0%) | 0 (0.0%) |
| 5 or more Children | 0 (0.0%) | 0 (0.0%) |
| Total | 0 (0.0%) | 0 (0.0%) |
Income Below Poverty Among Married-Couple vs Single-Parent Households in Blissfield
| Children | Married-Couple Families | Single-Parent Households |
| No Children | 0 (0.0%) | 0 (0.0%) |
| 1 or 2 Children | 0 (0.0%) | 0 (0.0%) |
| 3 or 4 Children | 0 (0.0%) | 0 (0.0%) |
| 5 or more Children | 0 (0.0%) | 0 (0.0%) |
| Total | 0 (0.0%) | 0 (0.0%) |
Race in Blissfield
The most populous races in Blissfield are White / Caucasian (3,083 | 95.9%), Two or more Races (101 | 3.1%), and Hispanic or Latino (55 | 1.7%).
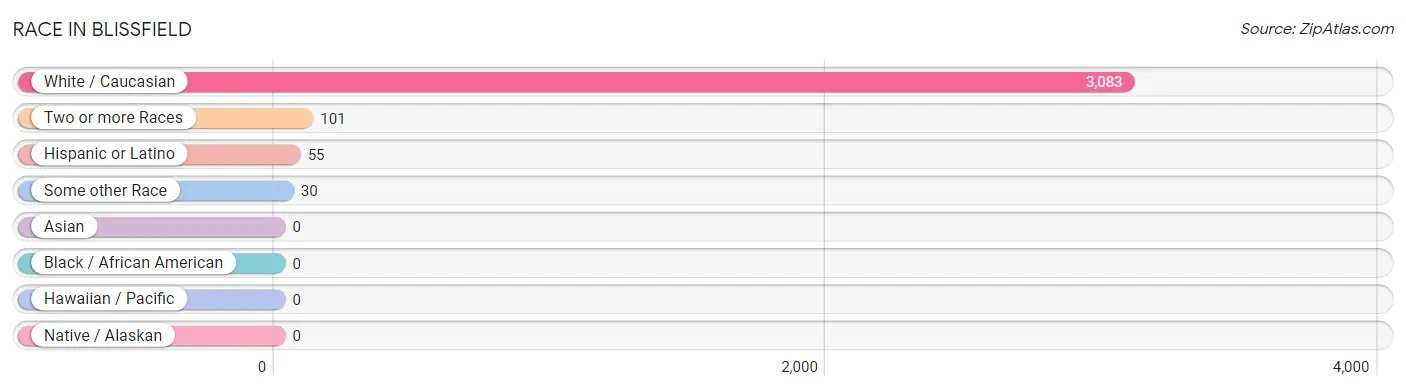
| Race | # Population | % Population |
| Asian | 0 | 0.0% |
| Black / African American | 0 | 0.0% |
| Hawaiian / Pacific | 0 | 0.0% |
| Hispanic or Latino | 55 | 1.7% |
| Native / Alaskan | 0 | 0.0% |
| White / Caucasian | 3,083 | 95.9% |
| Two or more Races | 101 | 3.1% |
| Some other Race | 30 | 0.9% |
| Total | 3,214 | 100.0% |
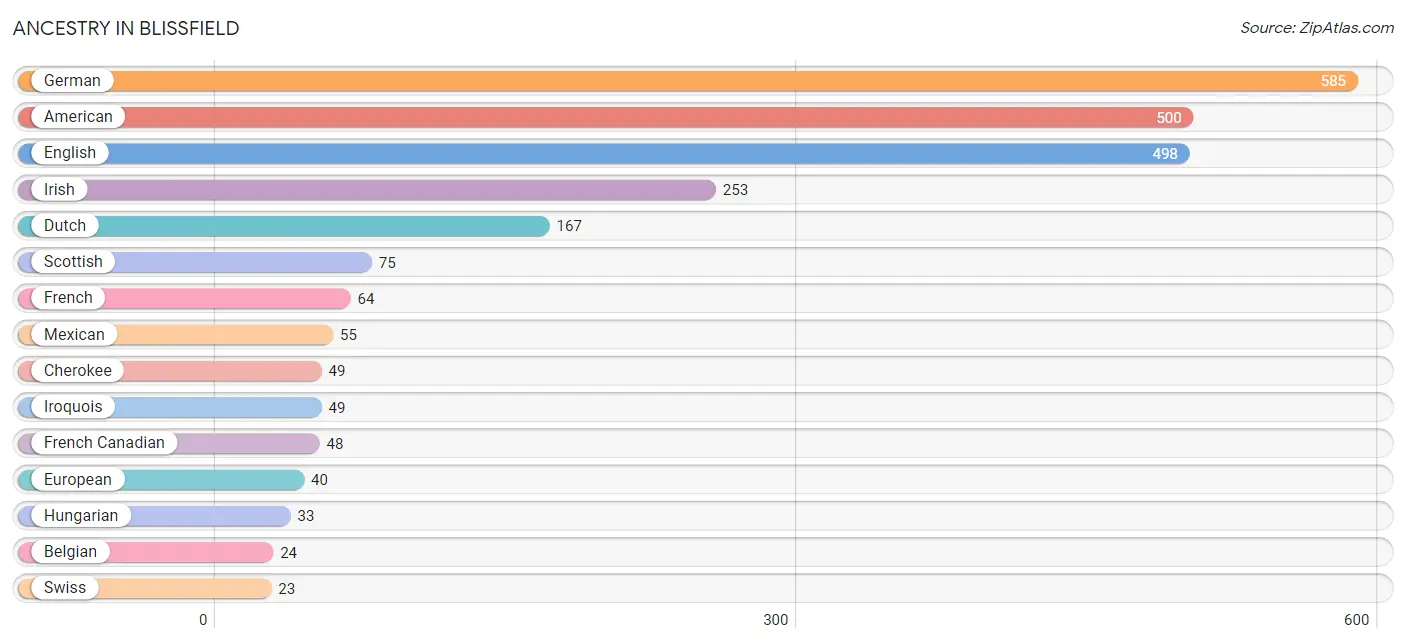
Ancestry in Blissfield
The most populous ancestries reported in Blissfield are German (585 | 18.2%), American (500 | 15.6%), English (498 | 15.5%), Irish (253 | 7.9%), and Dutch (167 | 5.2%), together accounting for 62.3% of all Blissfield residents.
| Ancestry | # Population | % Population |
| American | 500 | 15.6% |
| Arab | 7 | 0.2% |
| Austrian | 18 | 0.6% |
| Belgian | 24 | 0.7% |
| British | 18 | 0.6% |
| Cherokee | 49 | 1.5% |
| Chippewa | 2 | 0.1% |
| Czech | 10 | 0.3% |
| Danish | 16 | 0.5% |
| Dutch | 167 | 5.2% |
| English | 498 | 15.5% |
| European | 40 | 1.2% |
| Finnish | 22 | 0.7% |
| French | 64 | 2.0% |
| French Canadian | 48 | 1.5% |
| German | 585 | 18.2% |
| Hungarian | 33 | 1.0% |
| Irish | 253 | 7.9% |
| Iroquois | 49 | 1.5% |
| Italian | 16 | 0.5% |
| Lebanese | 7 | 0.2% |
| Lithuanian | 2 | 0.1% |
| Mexican | 55 | 1.7% |
| Norwegian | 9 | 0.3% |
| Polish | 16 | 0.5% |
| Potawatomi | 17 | 0.5% |
| Scottish | 75 | 2.3% |
| Swiss | 23 | 0.7% |
| Ukrainian | 7 | 0.2% |
| Welsh | 16 | 0.5% | View All 30 Rows |
Immigrants in Blissfield
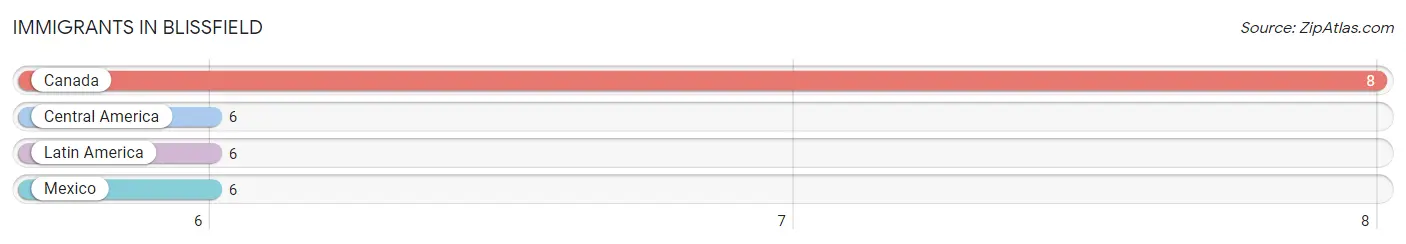
The most numerous immigrant groups reported in Blissfield came from Canada (8 | 0.3%), Central America (6 | 0.2%), Latin America (6 | 0.2%), and Mexico (6 | 0.2%), together accounting for 0.8% of all Blissfield residents.
| Immigration Origin | # Population | % Population |
| Canada | 8 | 0.3% |
| Central America | 6 | 0.2% |
| Latin America | 6 | 0.2% |
| Mexico | 6 | 0.2% | View All 4 Rows |
Sex and Age in Blissfield
Sex and Age in Blissfield
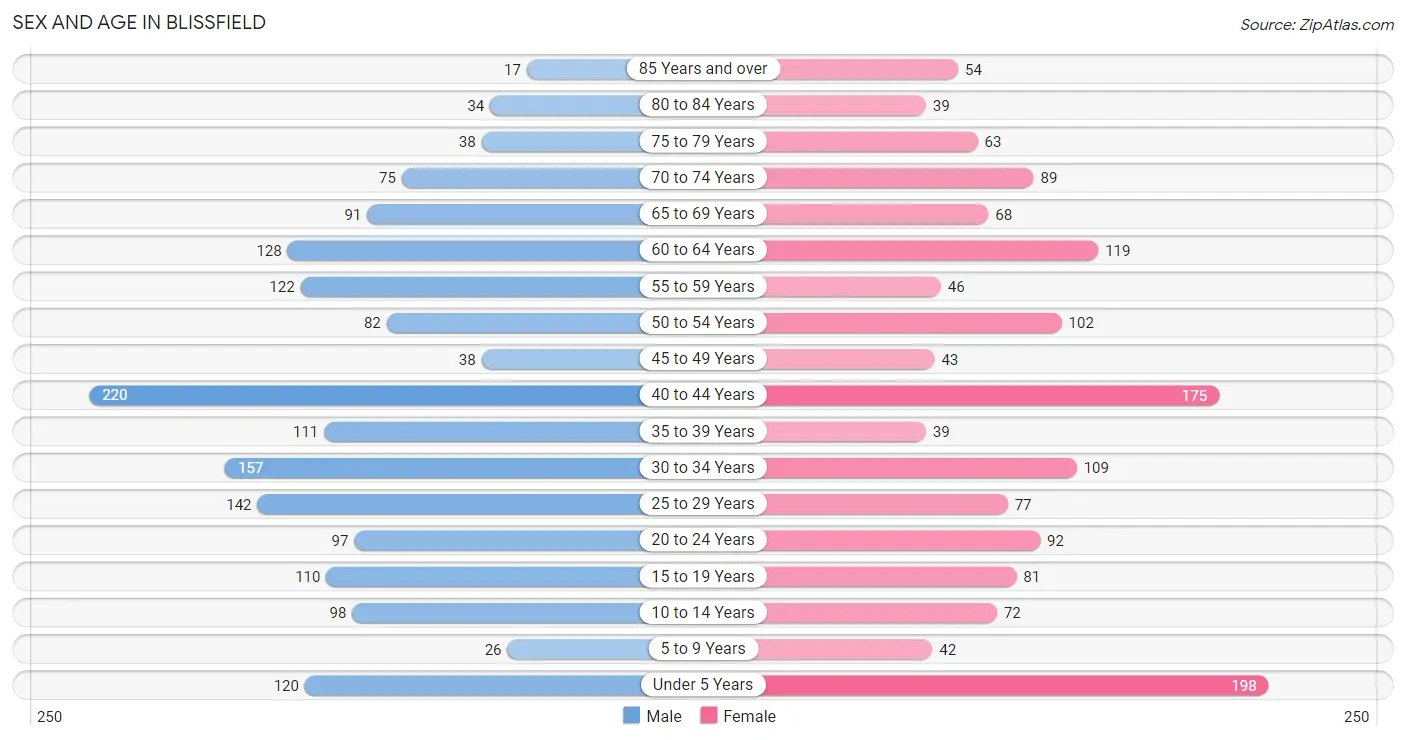
The most populous age groups in Blissfield are 40 to 44 Years (220 | 12.9%) for men and Under 5 Years (198 | 13.1%) for women.
| Age Bracket | Male | Female |
| Under 5 Years | 120 (7.0%) | 198 (13.1%) |
| 5 to 9 Years | 26 (1.5%) | 42 (2.8%) |
| 10 to 14 Years | 98 (5.7%) | 72 (4.8%) |
| 15 to 19 Years | 110 (6.5%) | 81 (5.4%) |
| 20 to 24 Years | 97 (5.7%) | 92 (6.1%) |
| 25 to 29 Years | 142 (8.3%) | 77 (5.1%) |
| 30 to 34 Years | 157 (9.2%) | 109 (7.2%) |
| 35 to 39 Years | 111 (6.5%) | 39 (2.6%) |
| 40 to 44 Years | 220 (12.9%) | 175 (11.6%) |
| 45 to 49 Years | 38 (2.2%) | 43 (2.9%) |
| 50 to 54 Years | 82 (4.8%) | 102 (6.8%) |
| 55 to 59 Years | 122 (7.1%) | 46 (3.0%) |
| 60 to 64 Years | 128 (7.5%) | 119 (7.9%) |
| 65 to 69 Years | 91 (5.3%) | 68 (4.5%) |
| 70 to 74 Years | 75 (4.4%) | 89 (5.9%) |
| 75 to 79 Years | 38 (2.2%) | 63 (4.2%) |
| 80 to 84 Years | 34 (2.0%) | 39 (2.6%) |
| 85 Years and over | 17 (1.0%) | 54 (3.6%) |
| Total | 1,706 (100.0%) | 1,508 (100.0%) |
Families and Households in Blissfield
Median Family Size in Blissfield
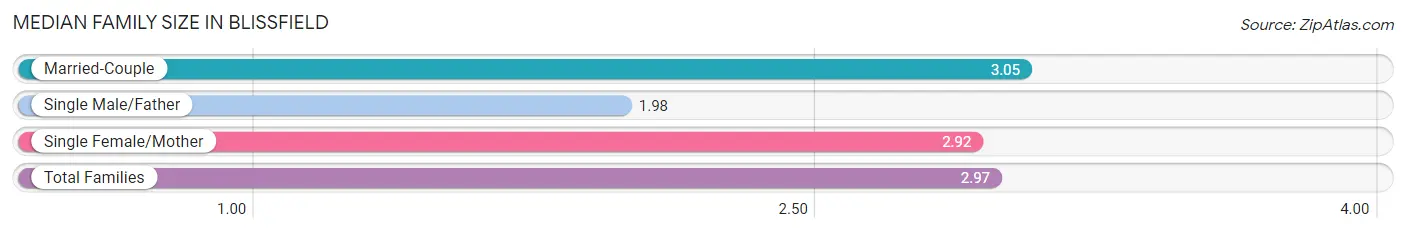
The median family size in Blissfield is 2.97 persons per family, with married-couple families (774 | 84.7%) accounting for the largest median family size of 3.05 persons per family. On the other hand, single male/father families (55 | 6.0%) represent the smallest median family size with 1.98 persons per family.
| Family Type | # Families | Family Size |
| Married-Couple | 774 (84.7%) | 3.05 |
| Single Male/Father | 55 (6.0%) | 1.98 |
| Single Female/Mother | 85 (9.3%) | 2.92 |
| Total Families | 914 (100.0%) | 2.97 |
Median Household Size in Blissfield
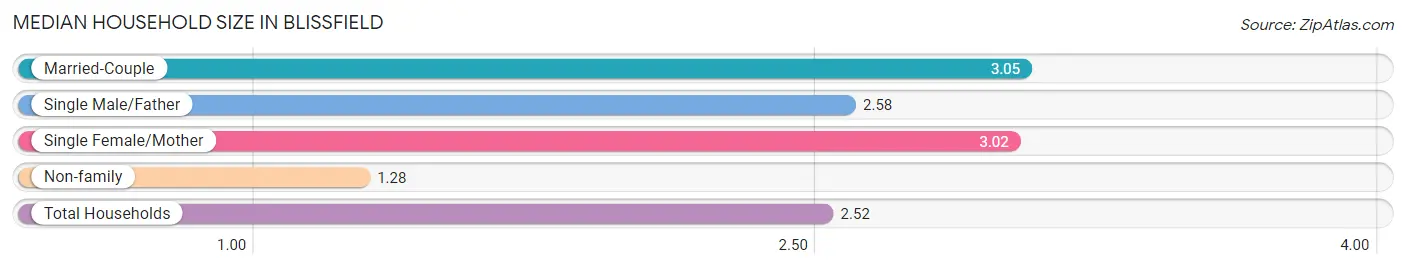
The median household size in Blissfield is 2.52 persons per household, with married-couple households (774 | 60.8%) accounting for the largest median household size of 3.05 persons per household. non-family households (359 | 28.2%) represent the smallest median household size with 1.28 persons per household.
| Household Type | # Households | Household Size |
| Married-Couple | 774 (60.8%) | 3.05 |
| Single Male/Father | 55 (4.3%) | 2.58 |
| Single Female/Mother | 85 (6.7%) | 3.02 |
| Non-family | 359 (28.2%) | 1.28 |
| Total Households | 1,273 (100.0%) | 2.52 |
Household Size by Marriage Status in Blissfield
Out of a total of 1,273 households in Blissfield, 914 (71.8%) are family households, while 359 (28.2%) are nonfamily households. The most numerous type of family households are 2-person households, comprising 319, and the most common type of nonfamily households are 1-person households, comprising 288.
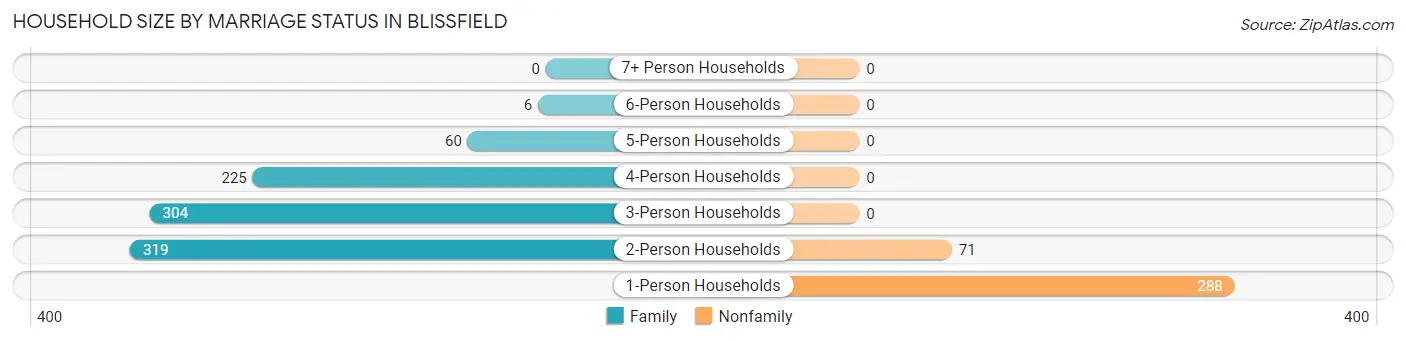
| Household Size | Family Households | Nonfamily Households |
| 1-Person Households | - | 288 (22.6%) |
| 2-Person Households | 319 (25.1%) | 71 (5.6%) |
| 3-Person Households | 304 (23.9%) | 0 (0.0%) |
| 4-Person Households | 225 (17.7%) | 0 (0.0%) |
| 5-Person Households | 60 (4.7%) | 0 (0.0%) |
| 6-Person Households | 6 (0.5%) | 0 (0.0%) |
| 7+ Person Households | 0 (0.0%) | 0 (0.0%) |
| Total | 914 (71.8%) | 359 (28.2%) |
Female Fertility in Blissfield
Fertility by Age in Blissfield
Average fertility rate in Blissfield is 16.0 births per 1,000 women. Women in the age bracket of 20 to 34 years have the highest fertility rate with 36.0 births per 1,000 women. Women in the age bracket of 20 to 34 years acount for 100.0% of all women with births.
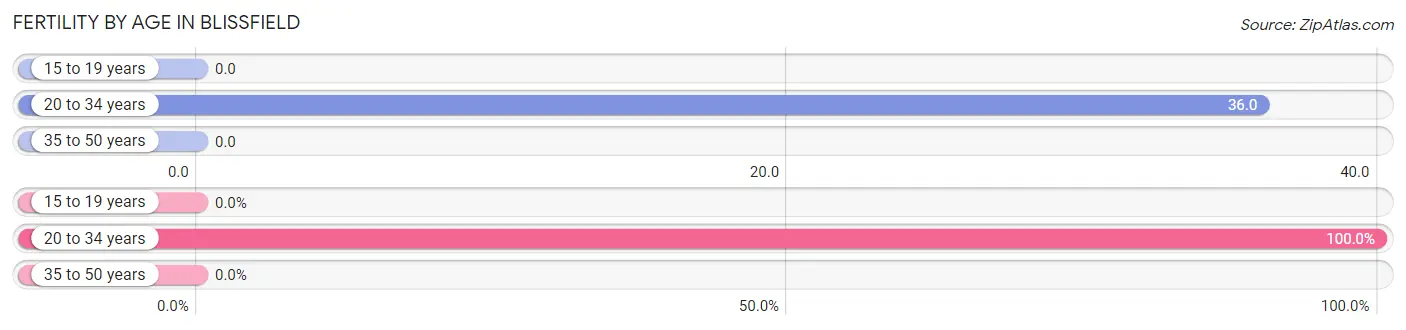
| Age Bracket | Women with Births | Births / 1,000 Women |
| 15 to 19 years | 0 (0.0%) | 0.0 |
| 20 to 34 years | 10 (100.0%) | 36.0 |
| 35 to 50 years | 0 (0.0%) | 0.0 |
| Total | 10 (100.0%) | 16.0 |
Fertility by Age by Marriage Status in Blissfield
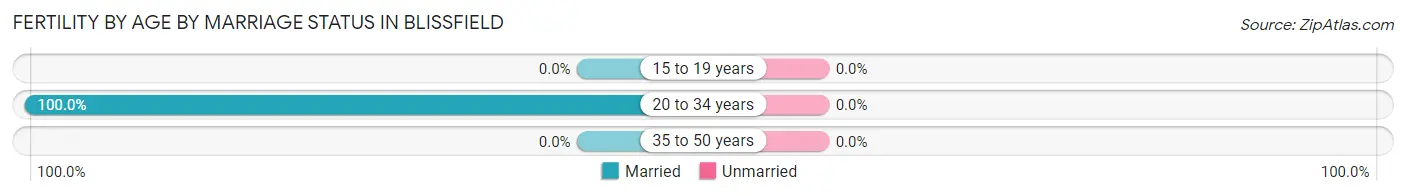
| Age Bracket | Married | Unmarried |
| 15 to 19 years | 0 (0.0%) | 0 (0.0%) |
| 20 to 34 years | 10 (100.0%) | 0 (0.0%) |
| 35 to 50 years | 0 (0.0%) | 0 (0.0%) |
| Total | 10 (100.0%) | 0 (0.0%) |
Fertility by Education in Blissfield
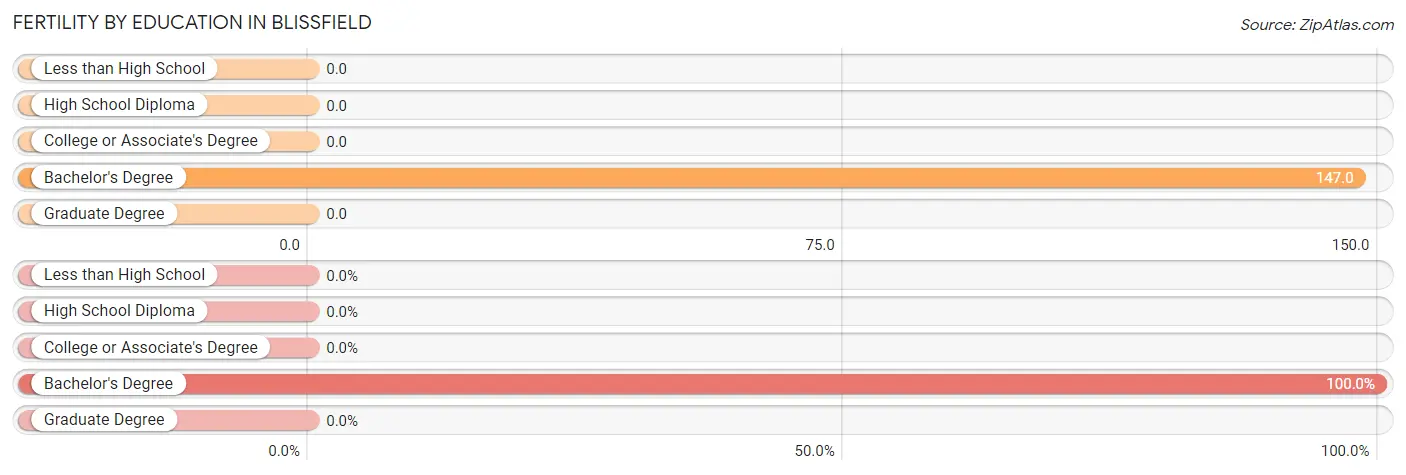
| Educational Attainment | Women with Births | Births / 1,000 Women |
| Less than High School | 0 (0.0%) | 0.0 |
| High School Diploma | 0 (0.0%) | 0.0 |
| College or Associate's Degree | 0 (0.0%) | 0.0 |
| Bachelor's Degree | 10 (100.0%) | 147.0 |
| Graduate Degree | 0 (0.0%) | 0.0 |
| Total | 10 (100.0%) | 16.0 |
Fertility by Education by Marriage Status in Blissfield
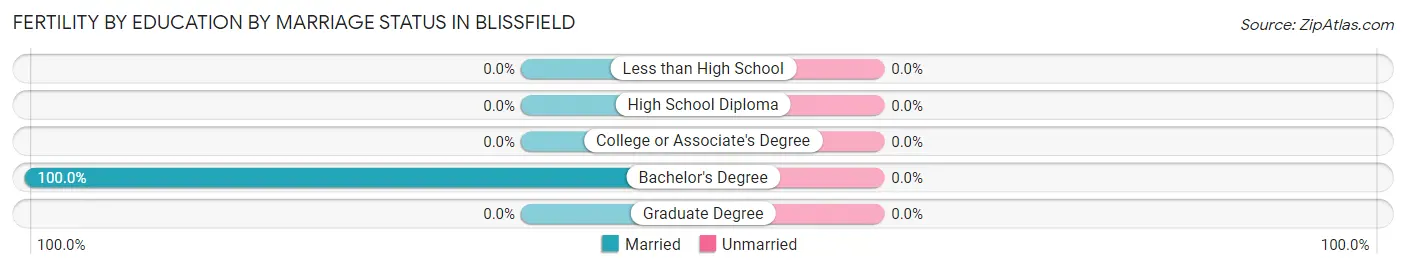
| Educational Attainment | Married | Unmarried |
| Less than High School | 0 (0.0%) | 0 (0.0%) |
| High School Diploma | 0 (0.0%) | 0 (0.0%) |
| College or Associate's Degree | 0 (0.0%) | 0 (0.0%) |
| Bachelor's Degree | 10 (100.0%) | 0 (0.0%) |
| Graduate Degree | 0 (0.0%) | 0 (0.0%) |
| Total | 10 (100.0%) | 0 (0.0%) |
Employment Characteristics in Blissfield
Employment by Class of Employer in Blissfield
Among the 1,619 employed individuals in Blissfield, private company employees (1,180 | 72.9%), not-for-profit organizations (194 | 12.0%), and local government employees (83 | 5.1%) make up the most common classes of employment.
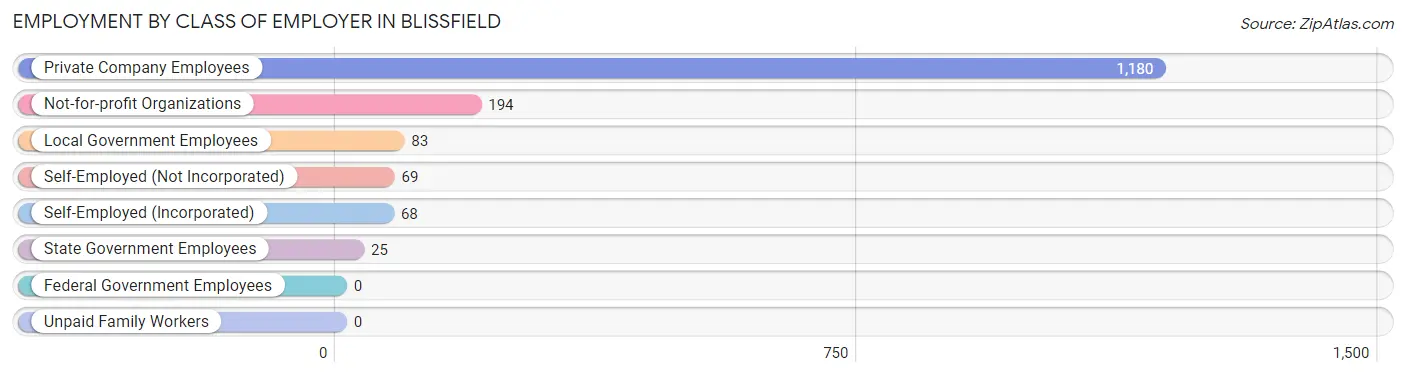
| Employer Class | # Employees | % Employees |
| Private Company Employees | 1,180 | 72.9% |
| Self-Employed (Incorporated) | 68 | 4.2% |
| Self-Employed (Not Incorporated) | 69 | 4.3% |
| Not-for-profit Organizations | 194 | 12.0% |
| Local Government Employees | 83 | 5.1% |
| State Government Employees | 25 | 1.5% |
| Federal Government Employees | 0 | 0.0% |
| Unpaid Family Workers | 0 | 0.0% |
| Total | 1,619 | 100.0% |
Employment Status by Age in Blissfield
According to the labor force statistics for Blissfield, out of the total population over 16 years of age (2,584), 70.4% or 1,819 individuals are in the labor force, with 5.3% or 96 of them unemployed. The age group with the highest labor force participation rate is 20 to 24 years, with 100.0% or 189 individuals in the labor force. Within the labor force, the 16 to 19 years age range has the highest percentage of unemployed individuals, with 50.5% or 48 of them being unemployed.
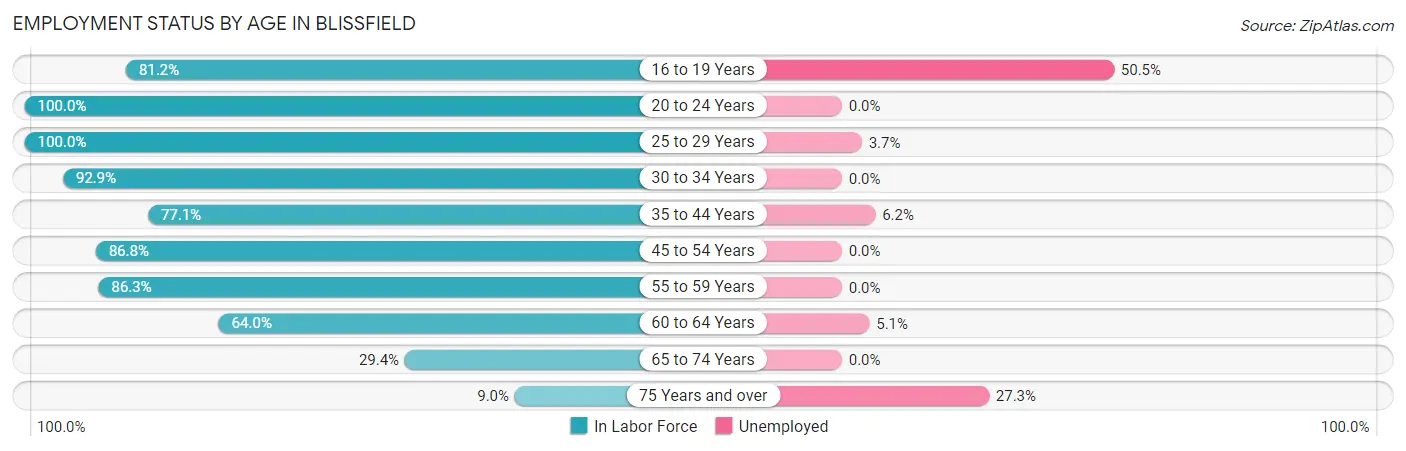
| Age Bracket | In Labor Force | Unemployed |
| 16 to 19 Years | 95 (81.2%) | 48 (50.5%) |
| 20 to 24 Years | 189 (100.0%) | 0 (0.0%) |
| 25 to 29 Years | 219 (100.0%) | 8 (3.7%) |
| 30 to 34 Years | 247 (92.9%) | 0 (0.0%) |
| 35 to 44 Years | 420 (77.1%) | 26 (6.2%) |
| 45 to 54 Years | 230 (86.8%) | 0 (0.0%) |
| 55 to 59 Years | 145 (86.3%) | 0 (0.0%) |
| 60 to 64 Years | 158 (64.0%) | 8 (5.1%) |
| 65 to 74 Years | 95 (29.4%) | 0 (0.0%) |
| 75 Years and over | 22 (9.0%) | 6 (27.3%) |
| Total | 1,819 (70.4%) | 96 (5.3%) |
Employment Status by Educational Attainment in Blissfield
According to labor force statistics for Blissfield, 83.0% of individuals (1,419) out of the total population between 25 and 64 years of age (1,710) are in the labor force, with 3.0% or 43 of them being unemployed. The group with the highest labor force participation rate are those with the educational attainment of college / associate degree, with 87.4% or 808 individuals in the labor force. Within the labor force, individuals with less than high school education have the highest percentage of unemployment, with 53.1% or 26 of them being unemployed.
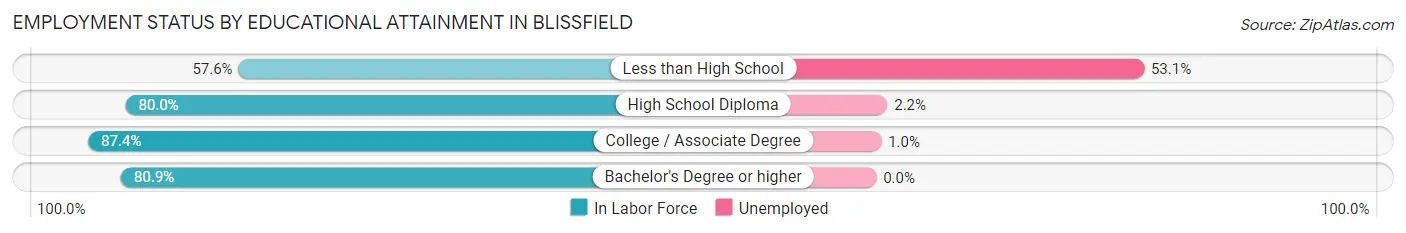
| Educational Attainment | In Labor Force | Unemployed |
| Less than High School | 49 (57.6%) | 45 (53.1%) |
| High School Diploma | 372 (80.0%) | 10 (2.2%) |
| College / Associate Degree | 808 (87.4%) | 9 (1.0%) |
| Bachelor's Degree or higher | 190 (80.9%) | 0 (0.0%) |
| Total | 1,419 (83.0%) | 51 (3.0%) |
Employment Occupations by Sex in Blissfield
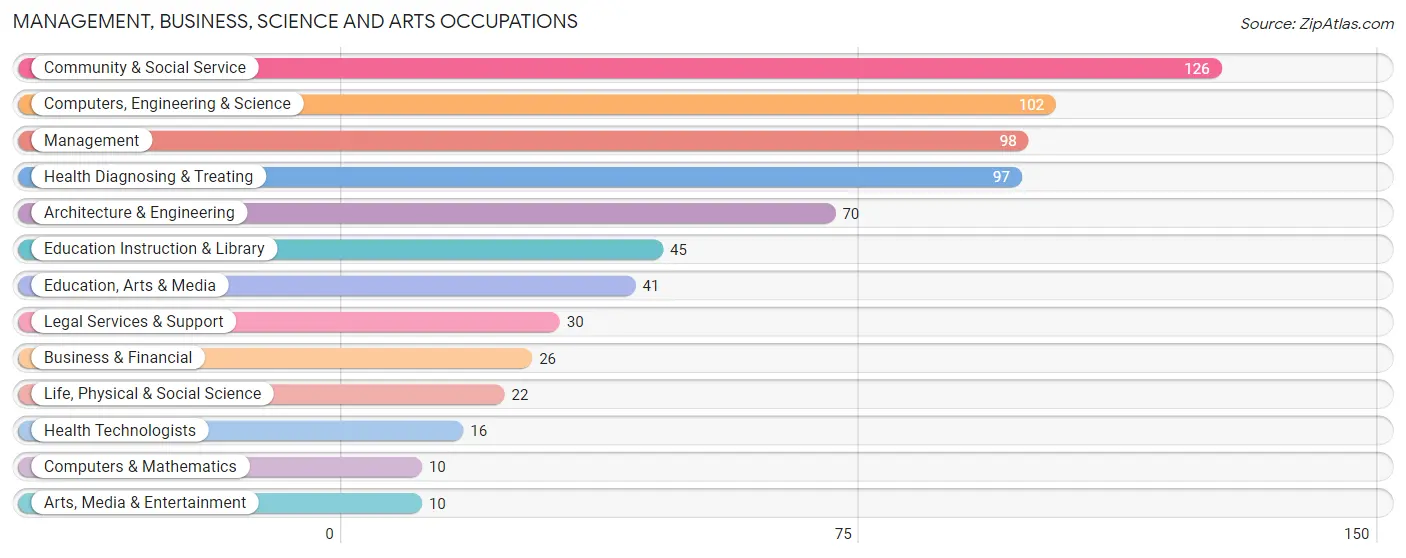
Management, Business, Science and Arts Occupations
The most common Management, Business, Science and Arts occupations in Blissfield are Community & Social Service (126 | 7.3%), Computers, Engineering & Science (102 | 5.9%), Management (98 | 5.7%), Health Diagnosing & Treating (97 | 5.6%), and Architecture & Engineering (70 | 4.1%).
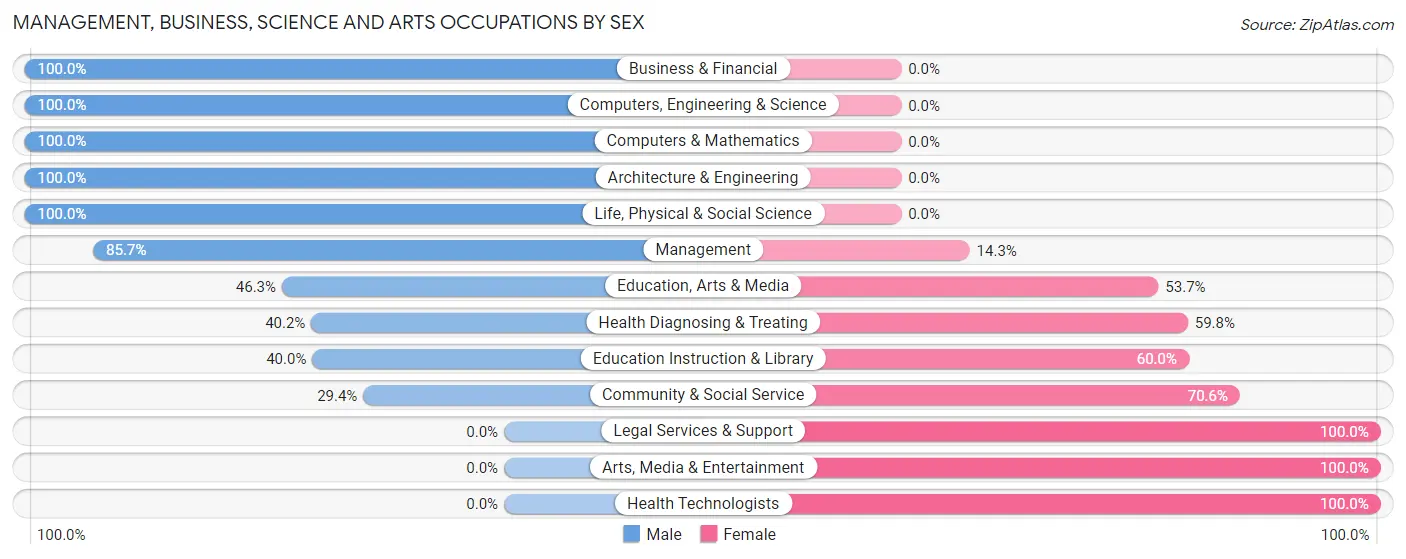
Management, Business, Science and Arts Occupations by Sex
Within the Management, Business, Science and Arts occupations in Blissfield, the most male-oriented occupations are Business & Financial (100.0%), Computers, Engineering & Science (100.0%), and Computers & Mathematics (100.0%), while the most female-oriented occupations are Legal Services & Support (100.0%), Arts, Media & Entertainment (100.0%), and Health Technologists (100.0%).
| Occupation | Male | Female |
| Management | 84 (85.7%) | 14 (14.3%) |
| Business & Financial | 26 (100.0%) | 0 (0.0%) |
| Computers, Engineering & Science | 102 (100.0%) | 0 (0.0%) |
| Computers & Mathematics | 10 (100.0%) | 0 (0.0%) |
| Architecture & Engineering | 70 (100.0%) | 0 (0.0%) |
| Life, Physical & Social Science | 22 (100.0%) | 0 (0.0%) |
| Community & Social Service | 37 (29.4%) | 89 (70.6%) |
| Education, Arts & Media | 19 (46.3%) | 22 (53.7%) |
| Legal Services & Support | 0 (0.0%) | 30 (100.0%) |
| Education Instruction & Library | 18 (40.0%) | 27 (60.0%) |
| Arts, Media & Entertainment | 0 (0.0%) | 10 (100.0%) |
| Health Diagnosing & Treating | 39 (40.2%) | 58 (59.8%) |
| Health Technologists | 0 (0.0%) | 16 (100.0%) |
| Total (Category) | 288 (64.1%) | 161 (35.9%) |
| Total (Overall) | 1,092 (63.3%) | 632 (36.7%) |
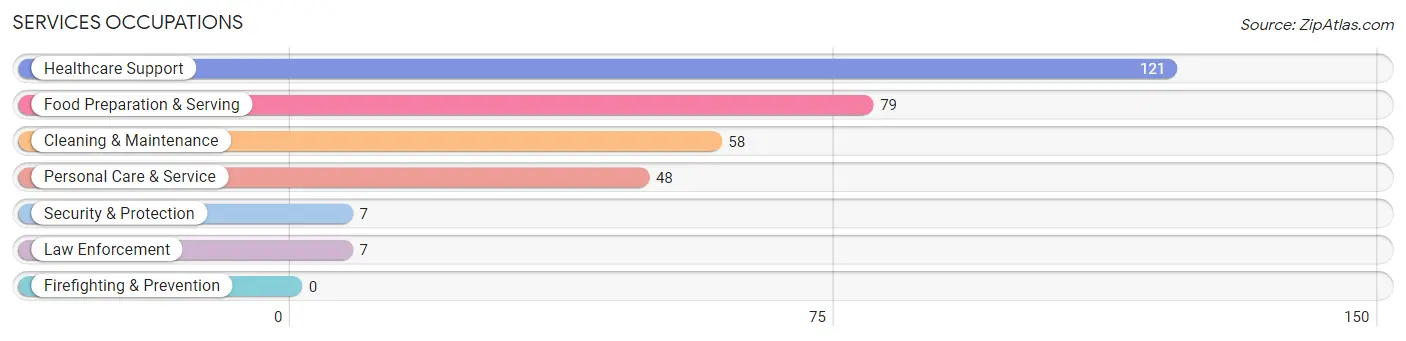
Services Occupations
The most common Services occupations in Blissfield are Healthcare Support (121 | 7.0%), Food Preparation & Serving (79 | 4.6%), Cleaning & Maintenance (58 | 3.4%), Personal Care & Service (48 | 2.8%), and Security & Protection (7 | 0.4%).
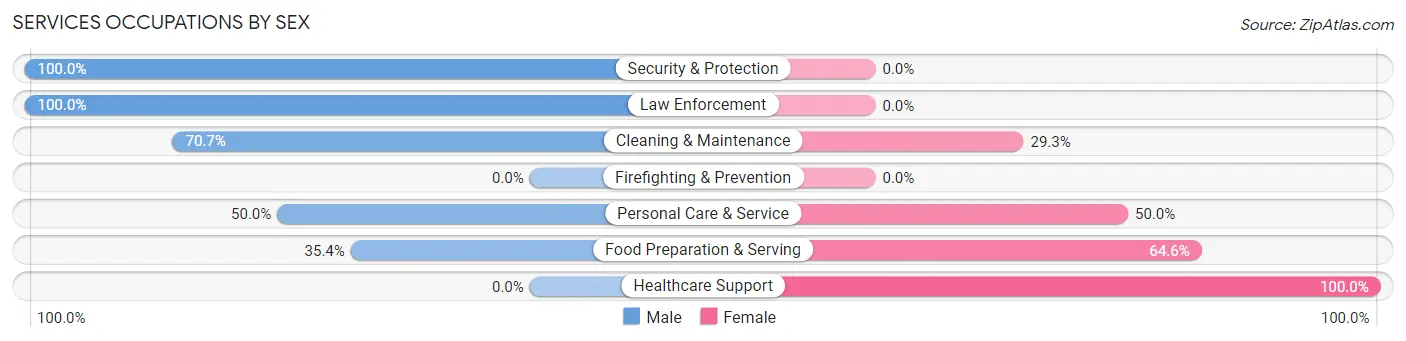
Services Occupations by Sex
Within the Services occupations in Blissfield, the most male-oriented occupations are Security & Protection (100.0%), Law Enforcement (100.0%), and Cleaning & Maintenance (70.7%), while the most female-oriented occupations are Healthcare Support (100.0%), Food Preparation & Serving (64.6%), and Personal Care & Service (50.0%).
| Occupation | Male | Female |
| Healthcare Support | 0 (0.0%) | 121 (100.0%) |
| Security & Protection | 7 (100.0%) | 0 (0.0%) |
| Firefighting & Prevention | 0 (0.0%) | 0 (0.0%) |
| Law Enforcement | 7 (100.0%) | 0 (0.0%) |
| Food Preparation & Serving | 28 (35.4%) | 51 (64.6%) |
| Cleaning & Maintenance | 41 (70.7%) | 17 (29.3%) |
| Personal Care & Service | 24 (50.0%) | 24 (50.0%) |
| Total (Category) | 100 (32.0%) | 213 (68.0%) |
| Total (Overall) | 1,092 (63.3%) | 632 (36.7%) |
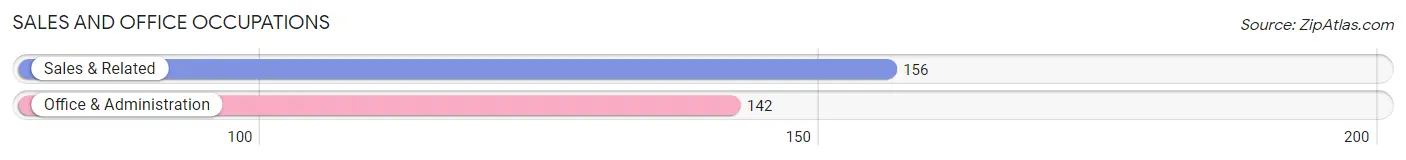
Sales and Office Occupations
The most common Sales and Office occupations in Blissfield are Sales & Related (156 | 9.0%), and Office & Administration (142 | 8.2%).
Sales and Office Occupations by Sex
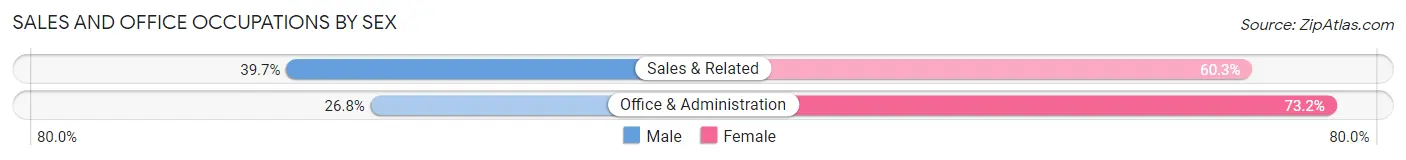
| Occupation | Male | Female |
| Sales & Related | 62 (39.7%) | 94 (60.3%) |
| Office & Administration | 38 (26.8%) | 104 (73.2%) |
| Total (Category) | 100 (33.6%) | 198 (66.4%) |
| Total (Overall) | 1,092 (63.3%) | 632 (36.7%) |
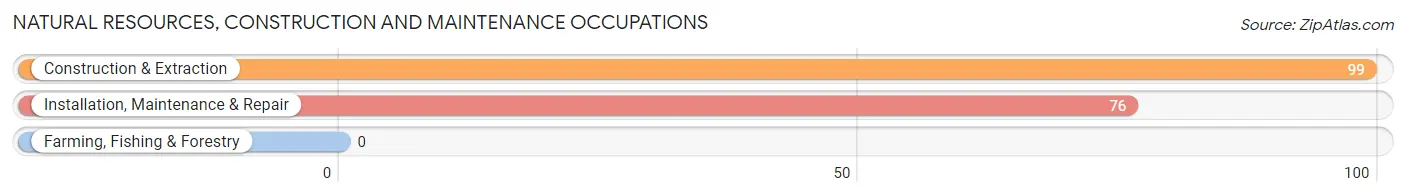
Natural Resources, Construction and Maintenance Occupations
The most common Natural Resources, Construction and Maintenance occupations in Blissfield are Construction & Extraction (99 | 5.7%), and Installation, Maintenance & Repair (76 | 4.4%).
Natural Resources, Construction and Maintenance Occupations by Sex
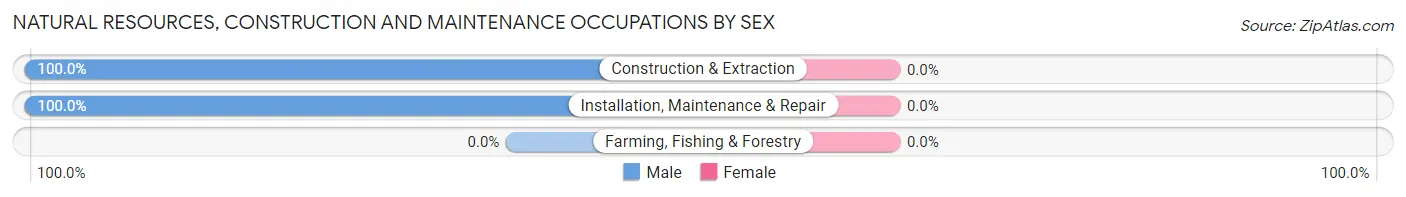
| Occupation | Male | Female |
| Farming, Fishing & Forestry | 0 (0.0%) | 0 (0.0%) |
| Construction & Extraction | 99 (100.0%) | 0 (0.0%) |
| Installation, Maintenance & Repair | 76 (100.0%) | 0 (0.0%) |
| Total (Category) | 175 (100.0%) | 0 (0.0%) |
| Total (Overall) | 1,092 (63.3%) | 632 (36.7%) |
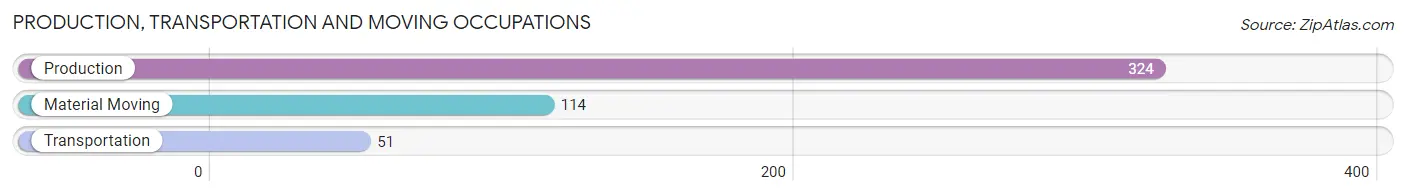
Production, Transportation and Moving Occupations
The most common Production, Transportation and Moving occupations in Blissfield are Production (324 | 18.8%), Material Moving (114 | 6.6%), and Transportation (51 | 3.0%).
Production, Transportation and Moving Occupations by Sex
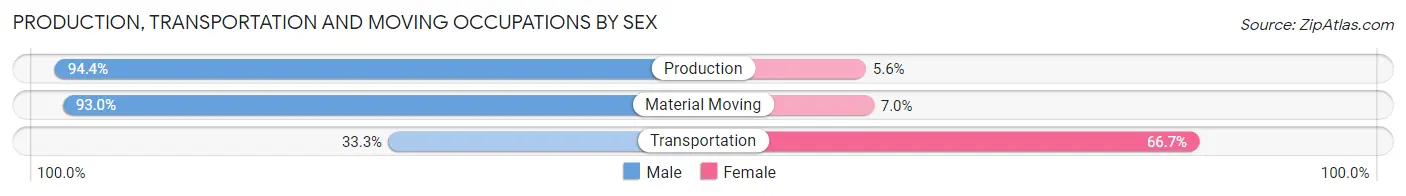
| Occupation | Male | Female |
| Production | 306 (94.4%) | 18 (5.6%) |
| Transportation | 17 (33.3%) | 34 (66.7%) |
| Material Moving | 106 (93.0%) | 8 (7.0%) |
| Total (Category) | 429 (87.7%) | 60 (12.3%) |
| Total (Overall) | 1,092 (63.3%) | 632 (36.7%) |
Employment Industries by Sex in Blissfield
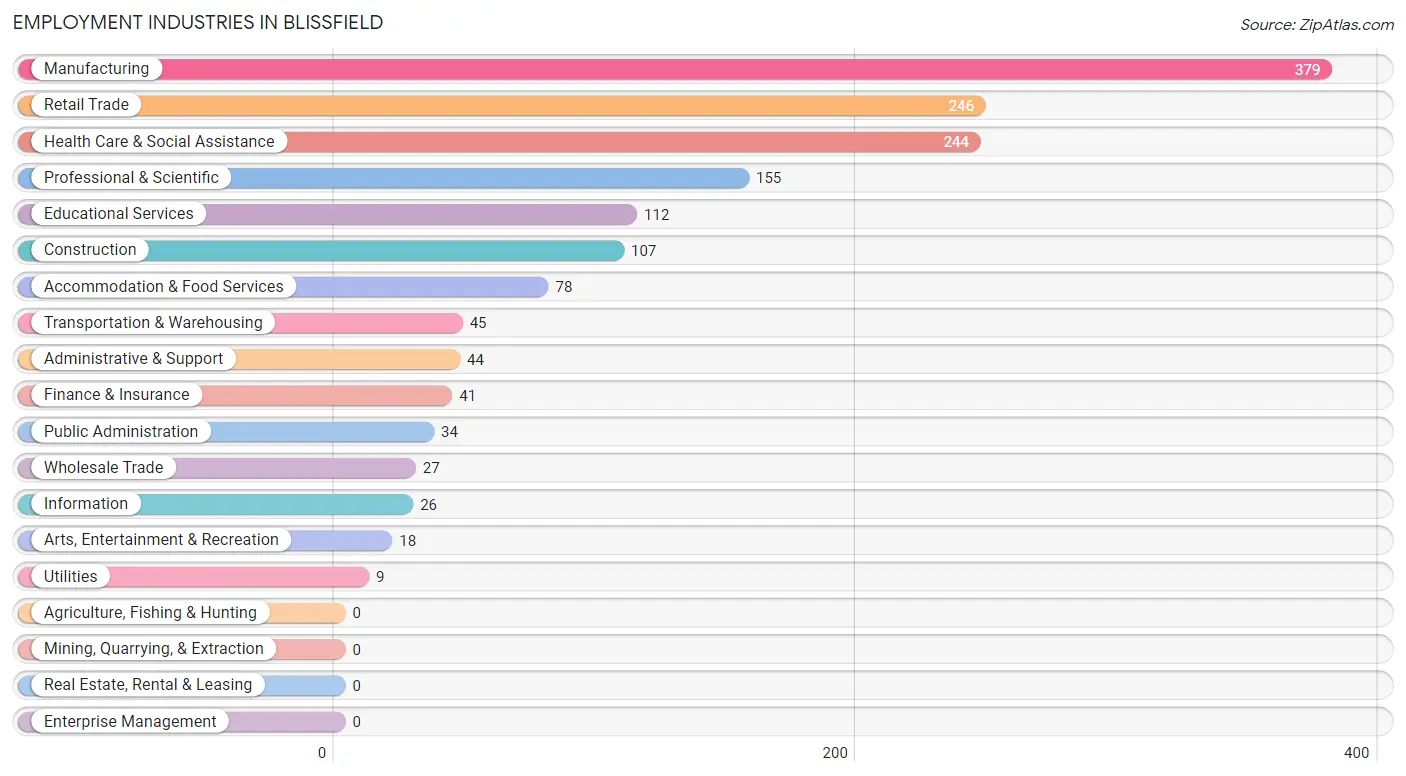
Employment Industries in Blissfield
The major employment industries in Blissfield include Manufacturing (379 | 22.0%), Retail Trade (246 | 14.3%), Health Care & Social Assistance (244 | 14.1%), Professional & Scientific (155 | 9.0%), and Educational Services (112 | 6.5%).
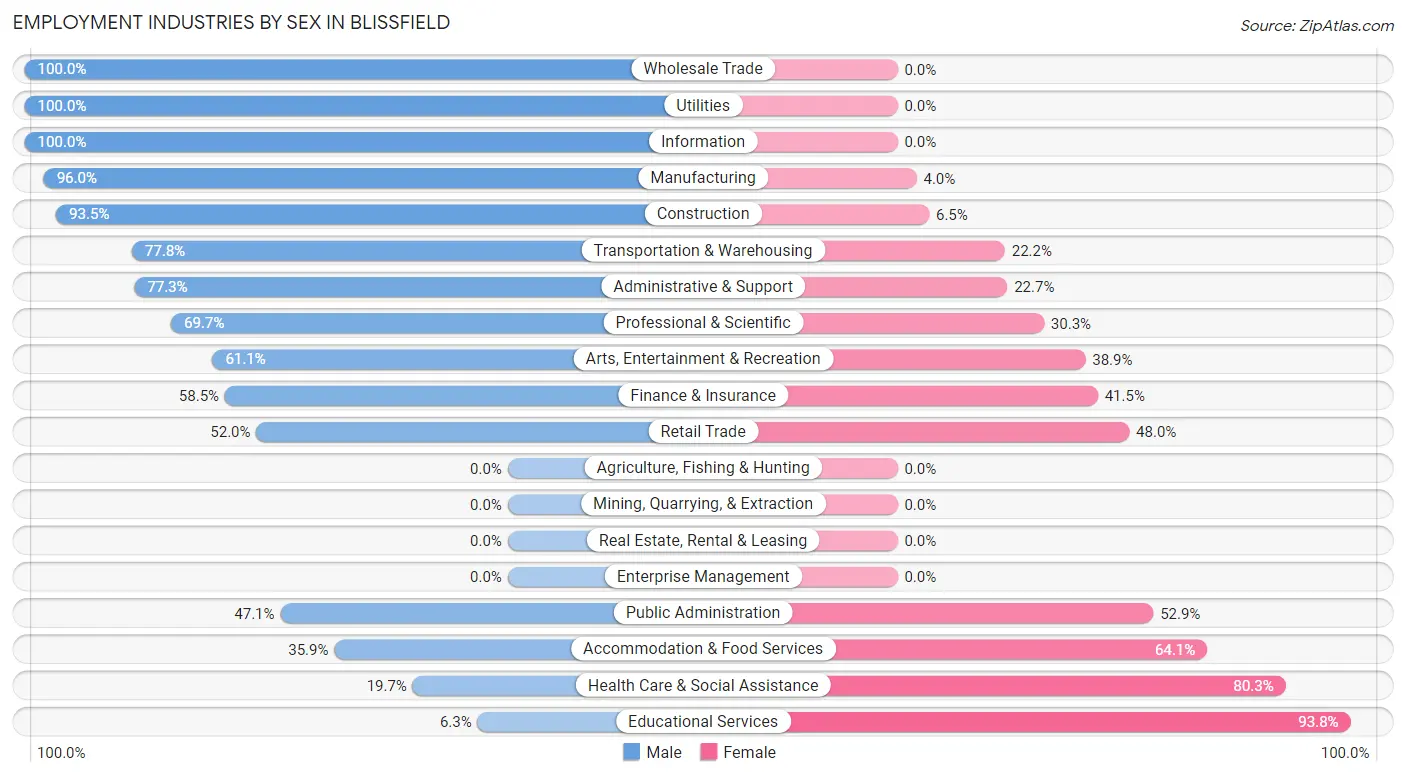
Employment Industries by Sex in Blissfield
The Blissfield industries that see more men than women are Wholesale Trade (100.0%), Utilities (100.0%), and Information (100.0%), whereas the industries that tend to have a higher number of women are Educational Services (93.8%), Health Care & Social Assistance (80.3%), and Accommodation & Food Services (64.1%).
| Industry | Male | Female |
| Agriculture, Fishing & Hunting | 0 (0.0%) | 0 (0.0%) |
| Mining, Quarrying, & Extraction | 0 (0.0%) | 0 (0.0%) |
| Construction | 100 (93.5%) | 7 (6.5%) |
| Manufacturing | 364 (96.0%) | 15 (4.0%) |
| Wholesale Trade | 27 (100.0%) | 0 (0.0%) |
| Retail Trade | 128 (52.0%) | 118 (48.0%) |
| Transportation & Warehousing | 35 (77.8%) | 10 (22.2%) |
| Utilities | 9 (100.0%) | 0 (0.0%) |
| Information | 26 (100.0%) | 0 (0.0%) |
| Finance & Insurance | 24 (58.5%) | 17 (41.5%) |
| Real Estate, Rental & Leasing | 0 (0.0%) | 0 (0.0%) |
| Professional & Scientific | 108 (69.7%) | 47 (30.3%) |
| Enterprise Management | 0 (0.0%) | 0 (0.0%) |
| Administrative & Support | 34 (77.3%) | 10 (22.7%) |
| Educational Services | 7 (6.2%) | 105 (93.8%) |
| Health Care & Social Assistance | 48 (19.7%) | 196 (80.3%) |
| Arts, Entertainment & Recreation | 11 (61.1%) | 7 (38.9%) |
| Accommodation & Food Services | 28 (35.9%) | 50 (64.1%) |
| Public Administration | 16 (47.1%) | 18 (52.9%) |
| Total | 1,092 (63.3%) | 632 (36.7%) |
Education in Blissfield
School Enrollment in Blissfield
The most common levels of schooling among the 657 students in Blissfield are high school (230 | 35.0%), college / undergraduate (150 | 22.8%), and middle school (96 | 14.6%).
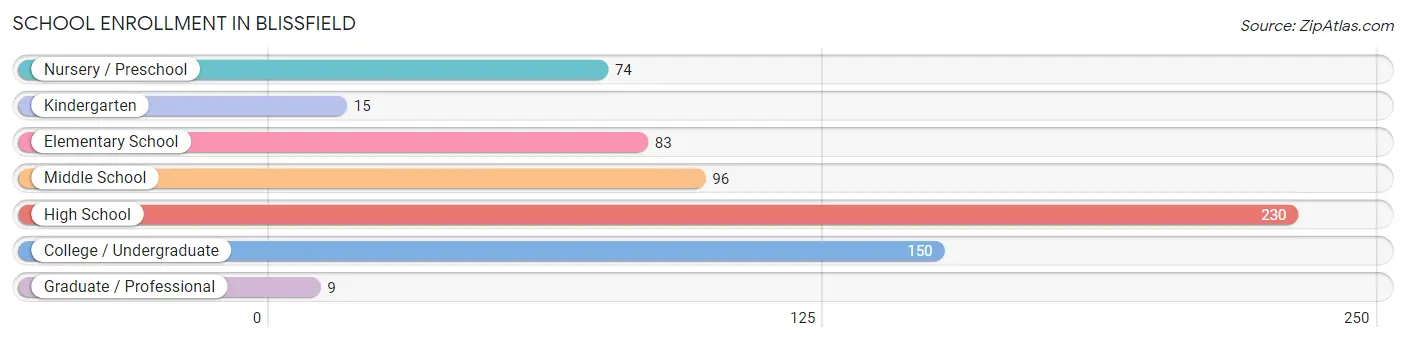
| School Level | # Students | % Students |
| Nursery / Preschool | 74 | 11.3% |
| Kindergarten | 15 | 2.3% |
| Elementary School | 83 | 12.6% |
| Middle School | 96 | 14.6% |
| High School | 230 | 35.0% |
| College / Undergraduate | 150 | 22.8% |
| Graduate / Professional | 9 | 1.4% |
| Total | 657 | 100.0% |
School Enrollment by Age by Funding Source in Blissfield
Out of a total of 657 students who are enrolled in schools in Blissfield, 102 (15.5%) attend a private institution, while the remaining 555 (84.5%) are enrolled in public schools. The age group of 20 to 24 year olds has the highest likelihood of being enrolled in private schools, with 64 (100.0% in the age bracket) enrolled. Conversely, the age group of 3 to 4 year olds has the lowest likelihood of being enrolled in a private school, with 74 (100.0% in the age bracket) attending a public institution.
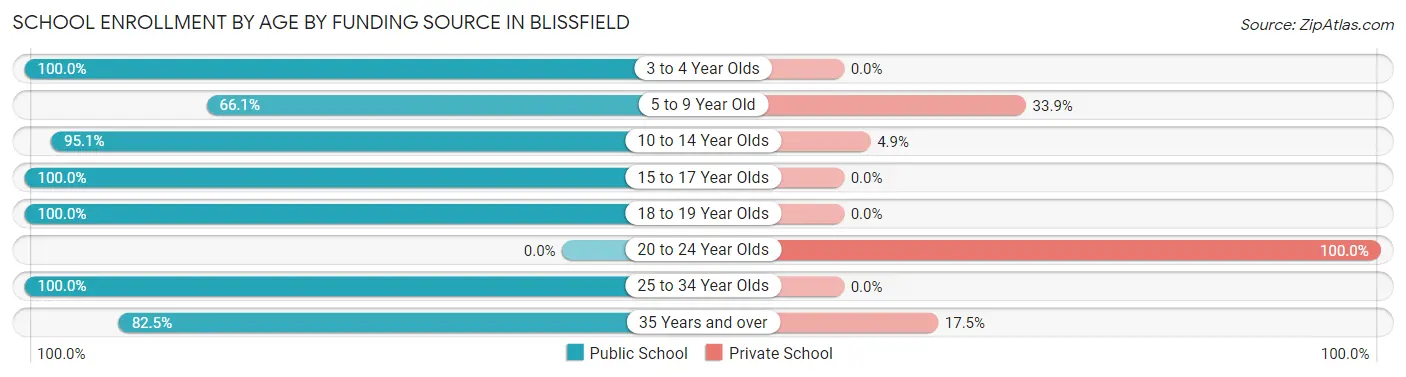
| Age Bracket | Public School | Private School |
| 3 to 4 Year Olds | 74 (100.0%) | 0 (0.0%) |
| 5 to 9 Year Old | 39 (66.1%) | 20 (33.9%) |
| 10 to 14 Year Olds | 154 (95.1%) | 8 (4.9%) |
| 15 to 17 Year Olds | 157 (100.0%) | 0 (0.0%) |
| 18 to 19 Year Olds | 18 (100.0%) | 0 (0.0%) |
| 20 to 24 Year Olds | 0 (0.0%) | 64 (100.0%) |
| 25 to 34 Year Olds | 66 (100.0%) | 0 (0.0%) |
| 35 Years and over | 47 (82.5%) | 10 (17.5%) |
| Total | 555 (84.5%) | 102 (15.5%) |
Educational Attainment by Field of Study in Blissfield
Education (113 | 29.0%), liberal arts & history (48 | 12.3%), business (46 | 11.8%), social sciences (39 | 10.0%), and literature & languages (24 | 6.2%) are the most common fields of study among 389 individuals in Blissfield who have obtained a bachelor's degree or higher.
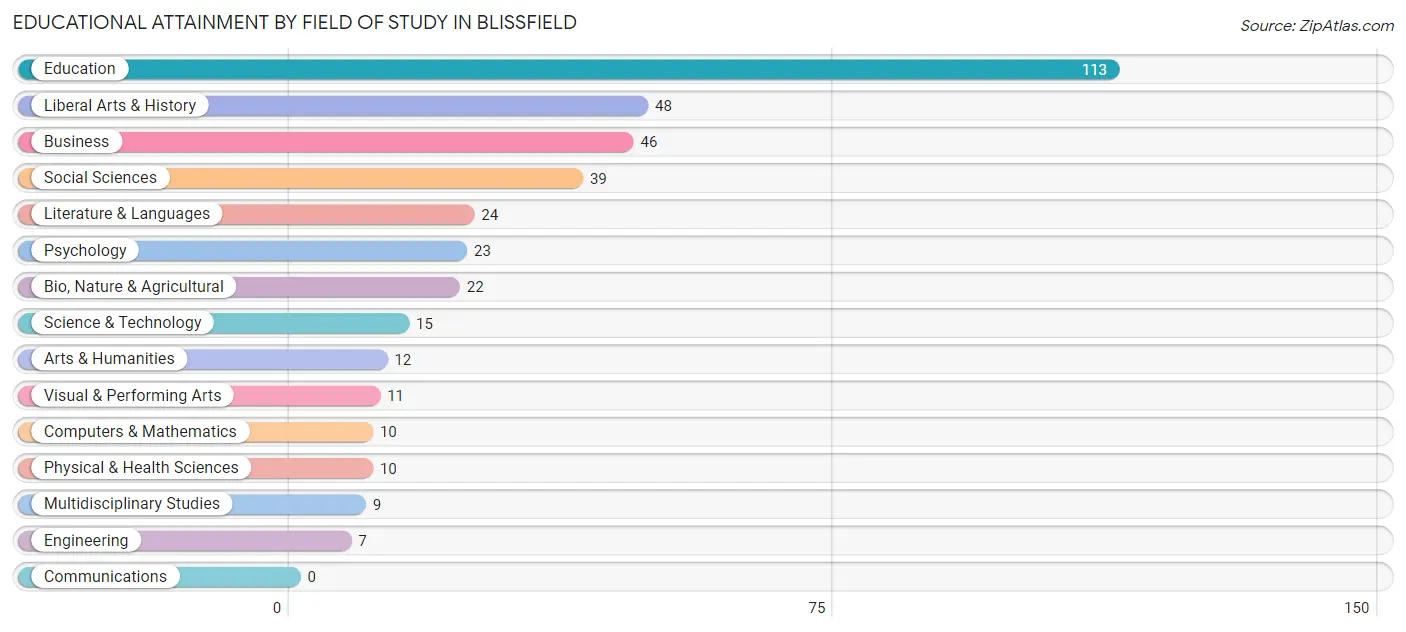
| Field of Study | # Graduates | % Graduates |
| Computers & Mathematics | 10 | 2.6% |
| Bio, Nature & Agricultural | 22 | 5.7% |
| Physical & Health Sciences | 10 | 2.6% |
| Psychology | 23 | 5.9% |
| Social Sciences | 39 | 10.0% |
| Engineering | 7 | 1.8% |
| Multidisciplinary Studies | 9 | 2.3% |
| Science & Technology | 15 | 3.9% |
| Business | 46 | 11.8% |
| Education | 113 | 29.0% |
| Literature & Languages | 24 | 6.2% |
| Liberal Arts & History | 48 | 12.3% |
| Visual & Performing Arts | 11 | 2.8% |
| Communications | 0 | 0.0% |
| Arts & Humanities | 12 | 3.1% |
| Total | 389 | 100.0% |
Transportation & Commute in Blissfield
Vehicle Availability by Sex in Blissfield
The most prevalent vehicle ownership categories in Blissfield are males with 2 vehicles (499, accounting for 48.2%) and females with 2 vehicles (191, making up 85.5%).
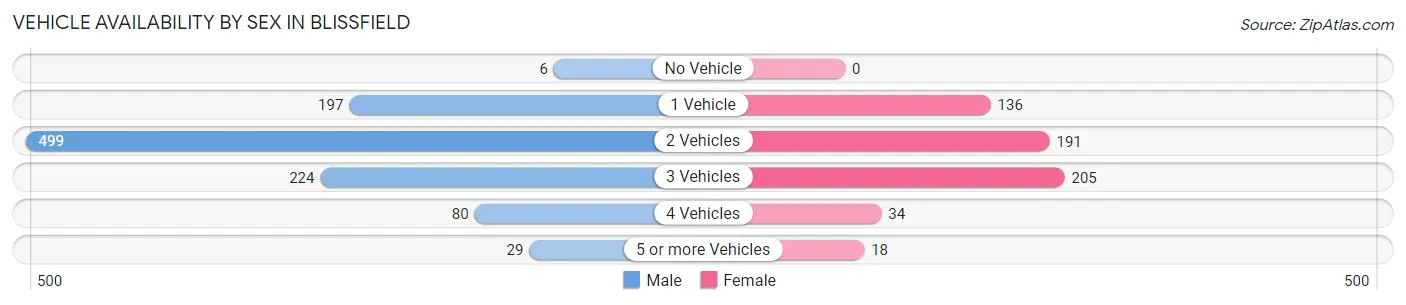
| Vehicles Available | Male | Female |
| No Vehicle | 6 (0.6%) | 0 (0.0%) |
| 1 Vehicle | 197 (19.0%) | 136 (23.3%) |
| 2 Vehicles | 499 (48.2%) | 191 (32.7%) |
| 3 Vehicles | 224 (21.6%) | 205 (35.1%) |
| 4 Vehicles | 80 (7.7%) | 34 (5.8%) |
| 5 or more Vehicles | 29 (2.8%) | 18 (3.1%) |
| Total | 1,035 (100.0%) | 584 (100.0%) |
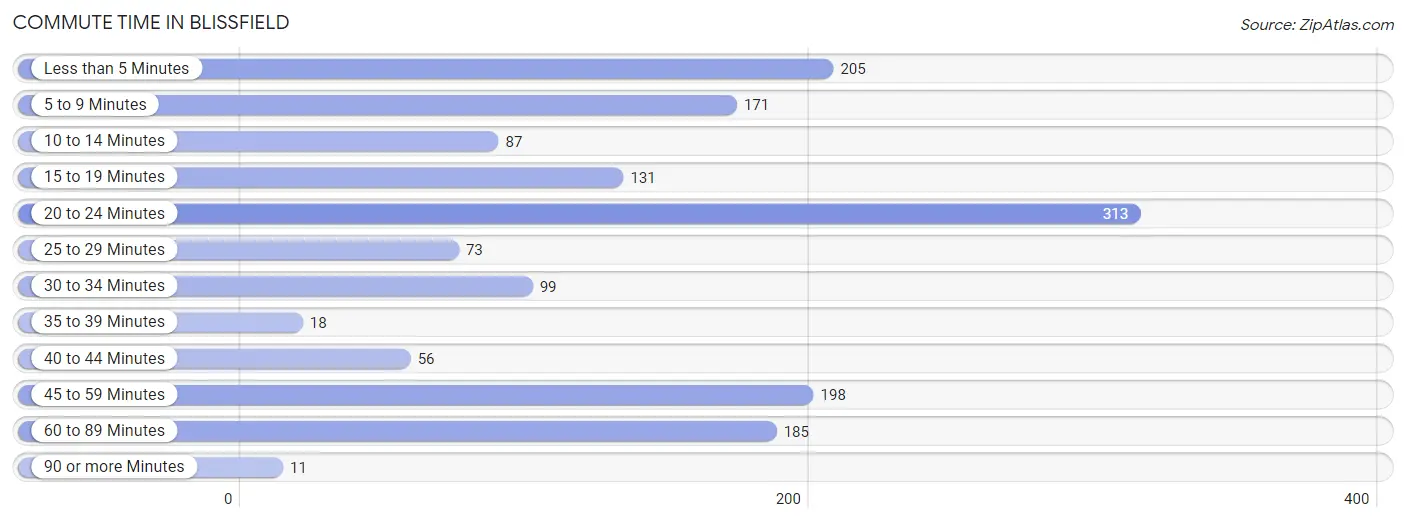
Commute Time in Blissfield
The most frequently occuring commute durations in Blissfield are 20 to 24 minutes (313 commuters, 20.2%), less than 5 minutes (205 commuters, 13.3%), and 45 to 59 minutes (198 commuters, 12.8%).
| Commute Time | # Commuters | % Commuters |
| Less than 5 Minutes | 205 | 13.3% |
| 5 to 9 Minutes | 171 | 11.1% |
| 10 to 14 Minutes | 87 | 5.6% |
| 15 to 19 Minutes | 131 | 8.5% |
| 20 to 24 Minutes | 313 | 20.2% |
| 25 to 29 Minutes | 73 | 4.7% |
| 30 to 34 Minutes | 99 | 6.4% |
| 35 to 39 Minutes | 18 | 1.2% |
| 40 to 44 Minutes | 56 | 3.6% |
| 45 to 59 Minutes | 198 | 12.8% |
| 60 to 89 Minutes | 185 | 12.0% |
| 90 or more Minutes | 11 | 0.7% |
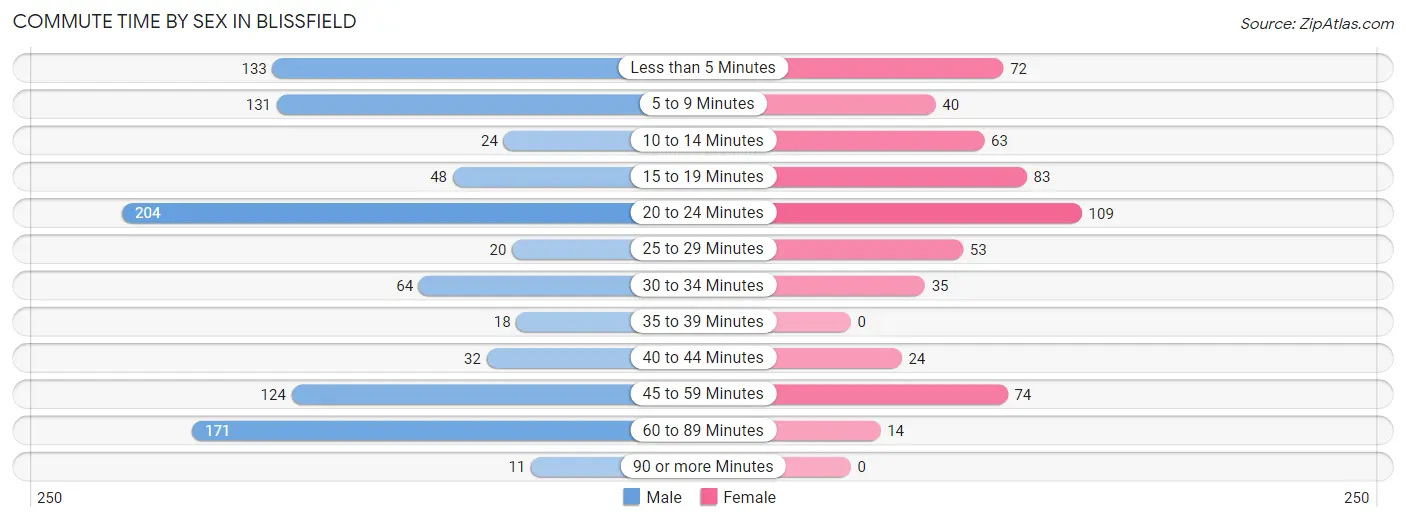
Commute Time by Sex in Blissfield
The most common commute times in Blissfield are 20 to 24 minutes (204 commuters, 20.8%) for males and 20 to 24 minutes (109 commuters, 19.2%) for females.
| Commute Time | Male | Female |
| Less than 5 Minutes | 133 (13.6%) | 72 (12.7%) |
| 5 to 9 Minutes | 131 (13.4%) | 40 (7.0%) |
| 10 to 14 Minutes | 24 (2.5%) | 63 (11.1%) |
| 15 to 19 Minutes | 48 (4.9%) | 83 (14.6%) |
| 20 to 24 Minutes | 204 (20.8%) | 109 (19.2%) |
| 25 to 29 Minutes | 20 (2.0%) | 53 (9.3%) |
| 30 to 34 Minutes | 64 (6.5%) | 35 (6.2%) |
| 35 to 39 Minutes | 18 (1.8%) | 0 (0.0%) |
| 40 to 44 Minutes | 32 (3.3%) | 24 (4.2%) |
| 45 to 59 Minutes | 124 (12.7%) | 74 (13.1%) |
| 60 to 89 Minutes | 171 (17.4%) | 14 (2.5%) |
| 90 or more Minutes | 11 (1.1%) | 0 (0.0%) |
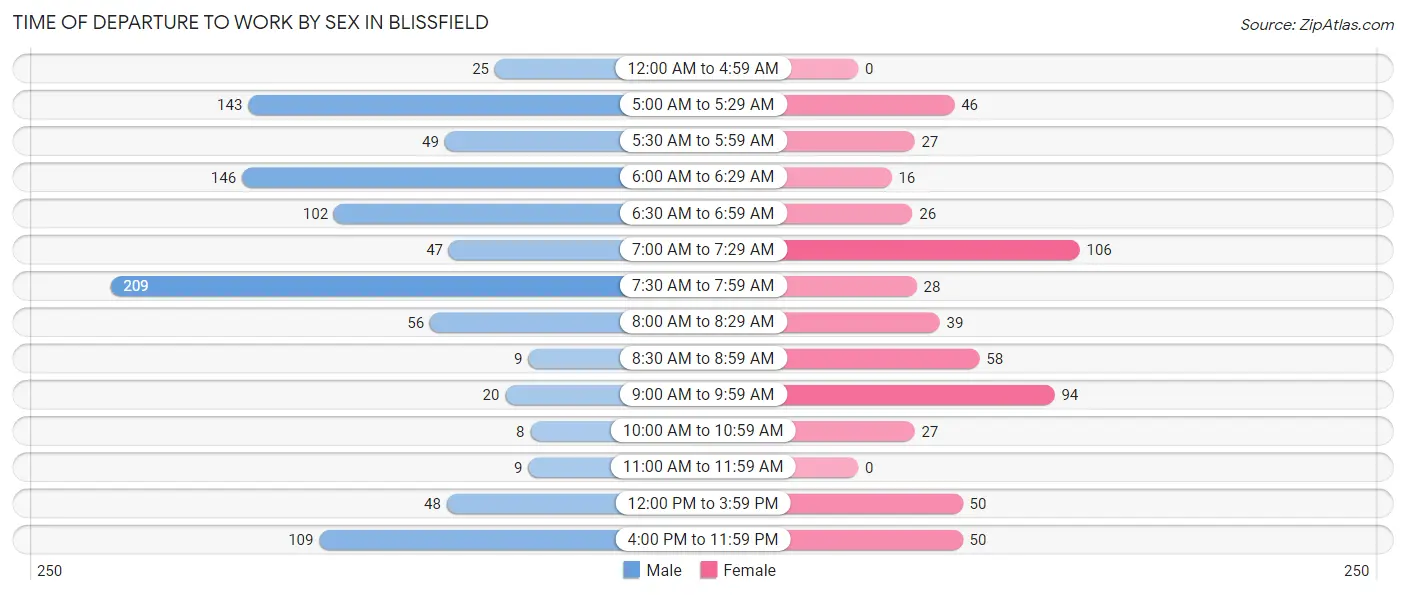
Time of Departure to Work by Sex in Blissfield
The most frequent times of departure to work in Blissfield are 7:30 AM to 7:59 AM (209, 21.3%) for males and 7:00 AM to 7:29 AM (106, 18.7%) for females.
| Time of Departure | Male | Female |
| 12:00 AM to 4:59 AM | 25 (2.5%) | 0 (0.0%) |
| 5:00 AM to 5:29 AM | 143 (14.6%) | 46 (8.1%) |
| 5:30 AM to 5:59 AM | 49 (5.0%) | 27 (4.8%) |
| 6:00 AM to 6:29 AM | 146 (14.9%) | 16 (2.8%) |
| 6:30 AM to 6:59 AM | 102 (10.4%) | 26 (4.6%) |
| 7:00 AM to 7:29 AM | 47 (4.8%) | 106 (18.7%) |
| 7:30 AM to 7:59 AM | 209 (21.3%) | 28 (4.9%) |
| 8:00 AM to 8:29 AM | 56 (5.7%) | 39 (6.9%) |
| 8:30 AM to 8:59 AM | 9 (0.9%) | 58 (10.2%) |
| 9:00 AM to 9:59 AM | 20 (2.0%) | 94 (16.6%) |
| 10:00 AM to 10:59 AM | 8 (0.8%) | 27 (4.8%) |
| 11:00 AM to 11:59 AM | 9 (0.9%) | 0 (0.0%) |
| 12:00 PM to 3:59 PM | 48 (4.9%) | 50 (8.8%) |
| 4:00 PM to 11:59 PM | 109 (11.1%) | 50 (8.8%) |
| Total | 980 (100.0%) | 567 (100.0%) |
Housing Occupancy in Blissfield
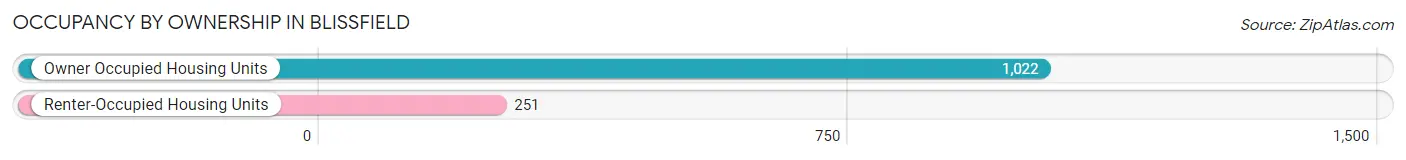
Occupancy by Ownership in Blissfield
Of the total 1,273 dwellings in Blissfield, owner-occupied units account for 1,022 (80.3%), while renter-occupied units make up 251 (19.7%).
| Occupancy | # Housing Units | % Housing Units |
| Owner Occupied Housing Units | 1,022 | 80.3% |
| Renter-Occupied Housing Units | 251 | 19.7% |
| Total Occupied Housing Units | 1,273 | 100.0% |
Occupancy by Household Size in Blissfield
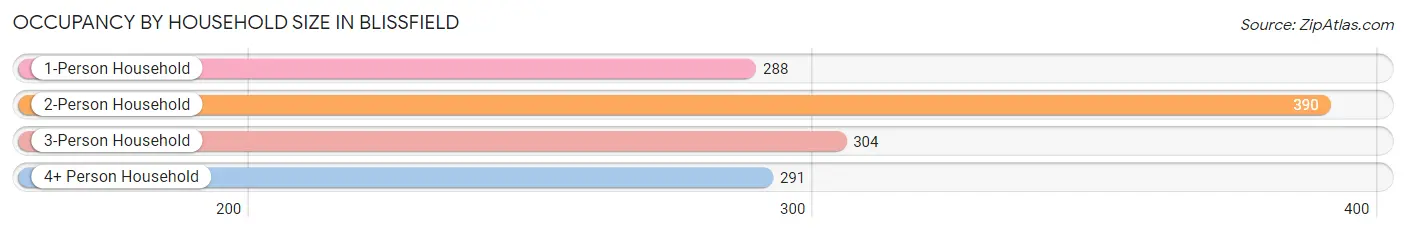
| Household Size | # Housing Units | % Housing Units |
| 1-Person Household | 288 | 22.6% |
| 2-Person Household | 390 | 30.6% |
| 3-Person Household | 304 | 23.9% |
| 4+ Person Household | 291 | 22.9% |
| Total Housing Units | 1,273 | 100.0% |
Occupancy by Ownership by Household Size in Blissfield
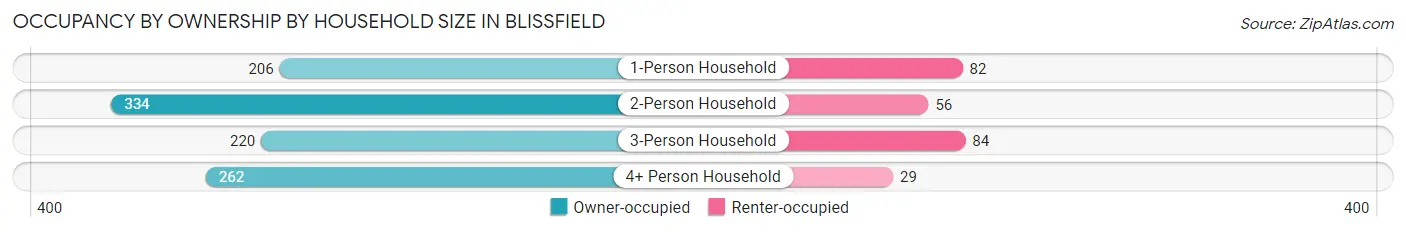
| Household Size | Owner-occupied | Renter-occupied |
| 1-Person Household | 206 (71.5%) | 82 (28.5%) |
| 2-Person Household | 334 (85.6%) | 56 (14.4%) |
| 3-Person Household | 220 (72.4%) | 84 (27.6%) |
| 4+ Person Household | 262 (90.0%) | 29 (10.0%) |
| Total Housing Units | 1,022 (80.3%) | 251 (19.7%) |
Occupancy by Educational Attainment in Blissfield
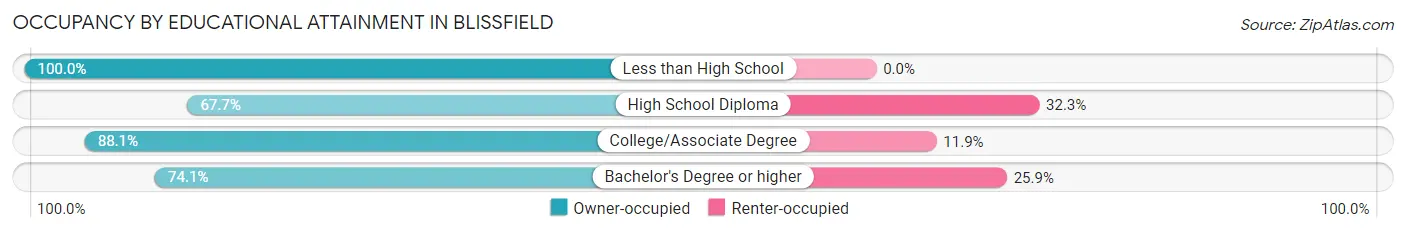
| Household Size | Owner-occupied | Renter-occupied |
| Less than High School | 61 (100.0%) | 0 (0.0%) |
| High School Diploma | 262 (67.7%) | 125 (32.3%) |
| College/Associate Degree | 553 (88.1%) | 75 (11.9%) |
| Bachelor's Degree or higher | 146 (74.1%) | 51 (25.9%) |
Occupancy by Age of Householder in Blissfield
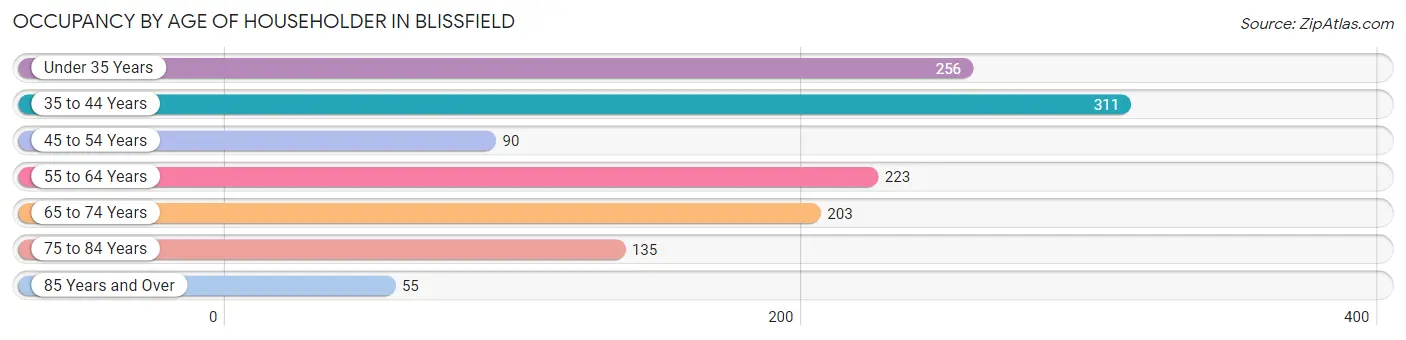
| Age Bracket | # Households | % Households |
| Under 35 Years | 256 | 20.1% |
| 35 to 44 Years | 311 | 24.4% |
| 45 to 54 Years | 90 | 7.1% |
| 55 to 64 Years | 223 | 17.5% |
| 65 to 74 Years | 203 | 16.0% |
| 75 to 84 Years | 135 | 10.6% |
| 85 Years and Over | 55 | 4.3% |
| Total | 1,273 | 100.0% |
Housing Finances in Blissfield
Median Income by Occupancy in Blissfield
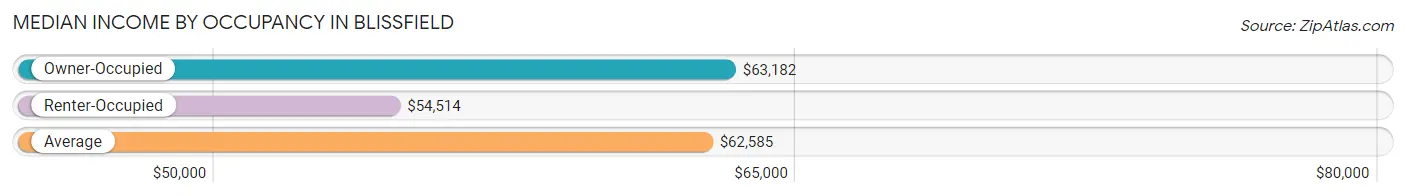
| Occupancy Type | # Households | Median Income |
| Owner-Occupied | 1,022 (80.3%) | $63,182 |
| Renter-Occupied | 251 (19.7%) | $54,514 |
| Average | 1,273 (100.0%) | $62,585 |
Occupancy by Householder Income Bracket in Blissfield
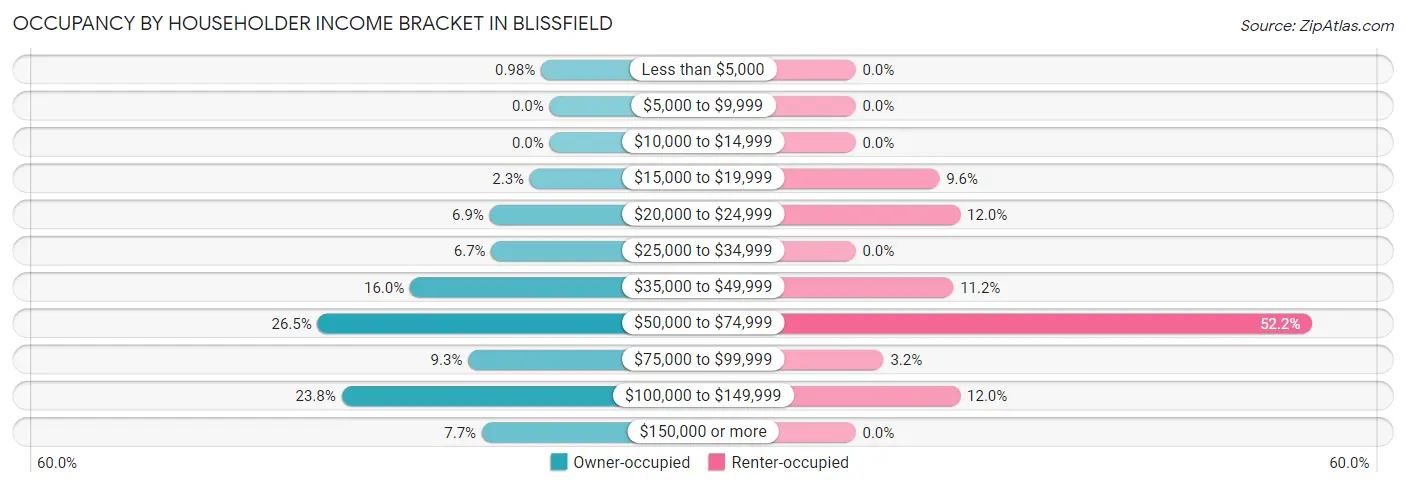
| Income Bracket | Owner-occupied | Renter-occupied |
| Less than $5,000 | 10 (1.0%) | 0 (0.0%) |
| $5,000 to $9,999 | 0 (0.0%) | 0 (0.0%) |
| $10,000 to $14,999 | 0 (0.0%) | 0 (0.0%) |
| $15,000 to $19,999 | 23 (2.2%) | 24 (9.6%) |
| $20,000 to $24,999 | 70 (6.9%) | 30 (11.9%) |
| $25,000 to $34,999 | 68 (6.7%) | 0 (0.0%) |
| $35,000 to $49,999 | 163 (16.0%) | 28 (11.2%) |
| $50,000 to $74,999 | 271 (26.5%) | 131 (52.2%) |
| $75,000 to $99,999 | 95 (9.3%) | 8 (3.2%) |
| $100,000 to $149,999 | 243 (23.8%) | 30 (11.9%) |
| $150,000 or more | 79 (7.7%) | 0 (0.0%) |
| Total | 1,022 (100.0%) | 251 (100.0%) |
Monthly Housing Cost Tiers in Blissfield
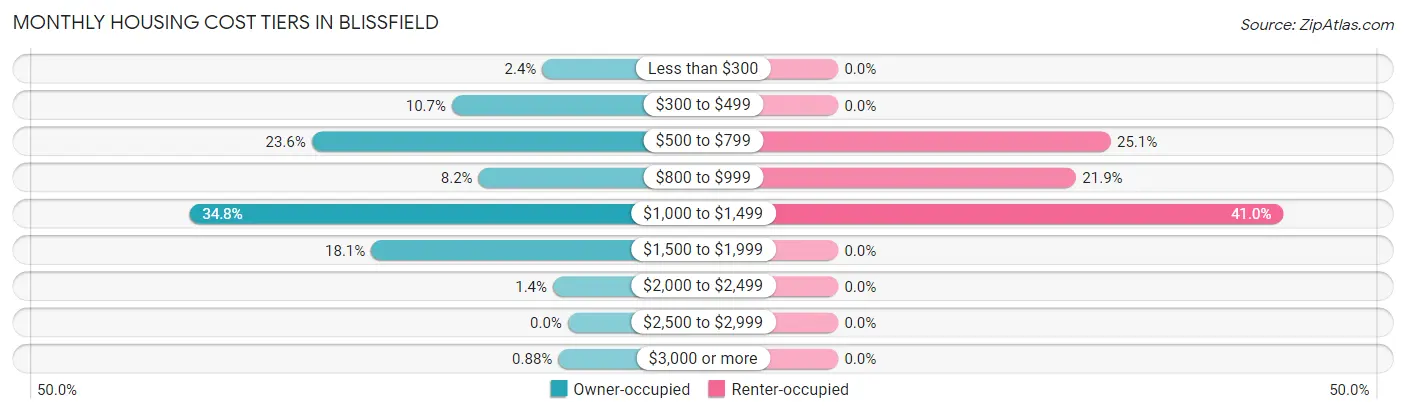
| Monthly Cost | Owner-occupied | Renter-occupied |
| Less than $300 | 24 (2.4%) | 0 (0.0%) |
| $300 to $499 | 109 (10.7%) | 0 (0.0%) |
| $500 to $799 | 241 (23.6%) | 63 (25.1%) |
| $800 to $999 | 84 (8.2%) | 55 (21.9%) |
| $1,000 to $1,499 | 356 (34.8%) | 103 (41.0%) |
| $1,500 to $1,999 | 185 (18.1%) | 0 (0.0%) |
| $2,000 to $2,499 | 14 (1.4%) | 0 (0.0%) |
| $2,500 to $2,999 | 0 (0.0%) | 0 (0.0%) |
| $3,000 or more | 9 (0.9%) | 0 (0.0%) |
| Total | 1,022 (100.0%) | 251 (100.0%) |
Physical Housing Characteristics in Blissfield
Housing Structures in Blissfield
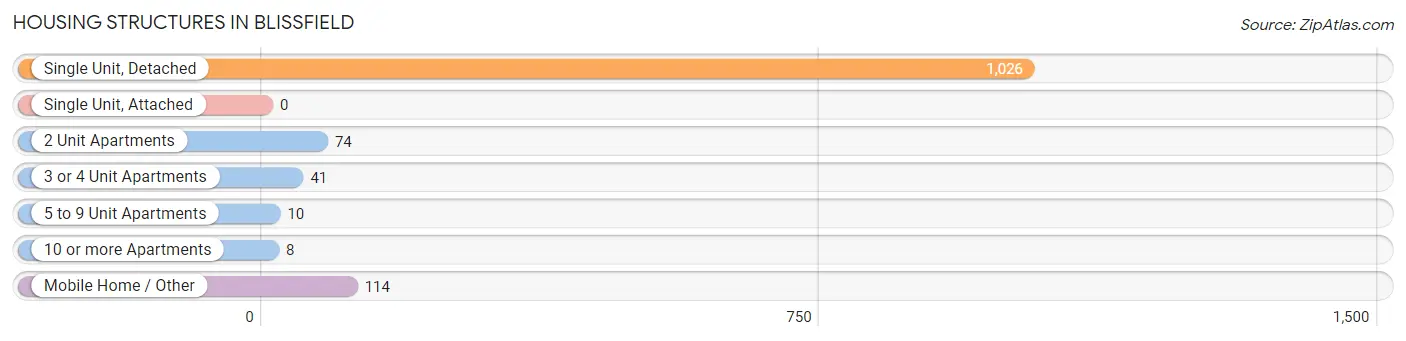
| Structure Type | # Housing Units | % Housing Units |
| Single Unit, Detached | 1,026 | 80.6% |
| Single Unit, Attached | 0 | 0.0% |
| 2 Unit Apartments | 74 | 5.8% |
| 3 or 4 Unit Apartments | 41 | 3.2% |
| 5 to 9 Unit Apartments | 10 | 0.8% |
| 10 or more Apartments | 8 | 0.6% |
| Mobile Home / Other | 114 | 9.0% |
| Total | 1,273 | 100.0% |
Housing Structures by Occupancy in Blissfield
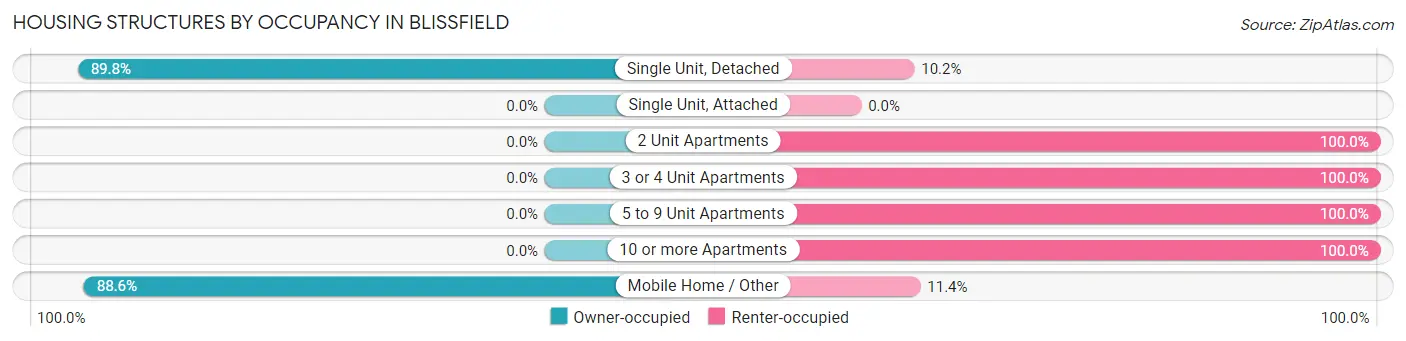
| Structure Type | Owner-occupied | Renter-occupied |
| Single Unit, Detached | 921 (89.8%) | 105 (10.2%) |
| Single Unit, Attached | 0 (0.0%) | 0 (0.0%) |
| 2 Unit Apartments | 0 (0.0%) | 74 (100.0%) |
| 3 or 4 Unit Apartments | 0 (0.0%) | 41 (100.0%) |
| 5 to 9 Unit Apartments | 0 (0.0%) | 10 (100.0%) |
| 10 or more Apartments | 0 (0.0%) | 8 (100.0%) |
| Mobile Home / Other | 101 (88.6%) | 13 (11.4%) |
| Total | 1,022 (80.3%) | 251 (19.7%) |
Housing Structures by Number of Rooms in Blissfield
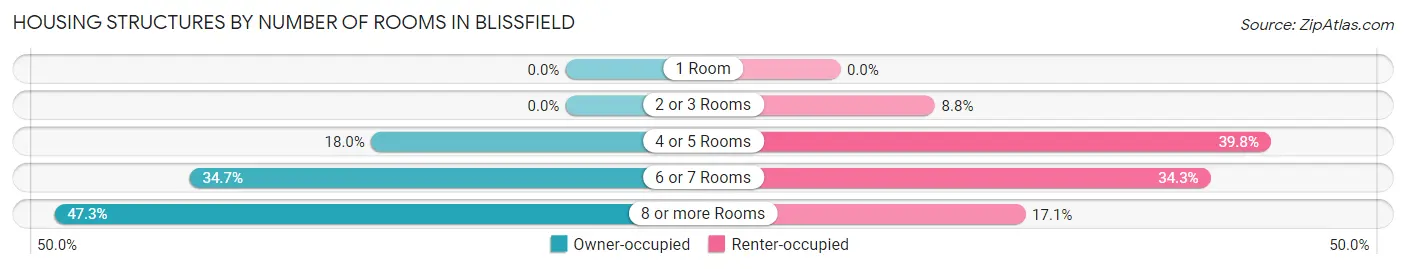
| Number of Rooms | Owner-occupied | Renter-occupied |
| 1 Room | 0 (0.0%) | 0 (0.0%) |
| 2 or 3 Rooms | 0 (0.0%) | 22 (8.8%) |
| 4 or 5 Rooms | 184 (18.0%) | 100 (39.8%) |
| 6 or 7 Rooms | 355 (34.7%) | 86 (34.3%) |
| 8 or more Rooms | 483 (47.3%) | 43 (17.1%) |
| Total | 1,022 (100.0%) | 251 (100.0%) |
Housing Structure by Heating Type in Blissfield
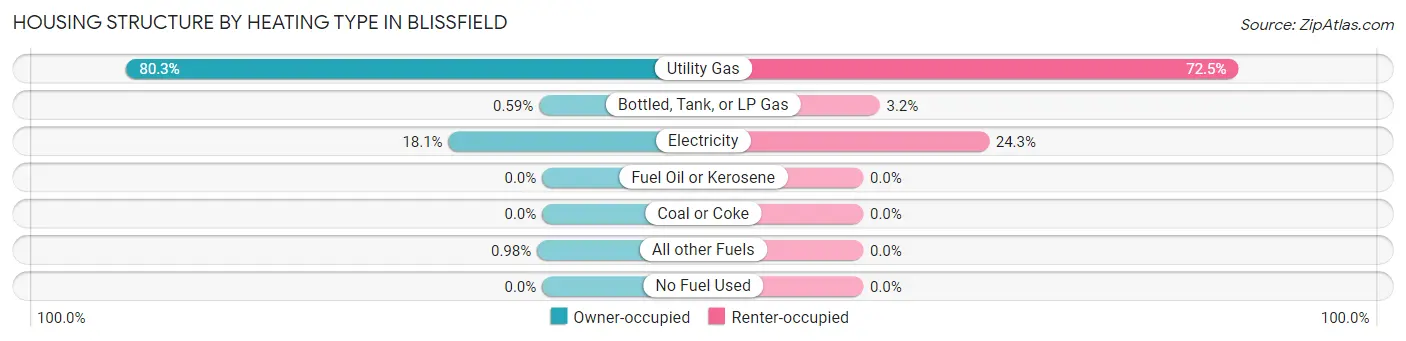
| Heating Type | Owner-occupied | Renter-occupied |
| Utility Gas | 821 (80.3%) | 182 (72.5%) |
| Bottled, Tank, or LP Gas | 6 (0.6%) | 8 (3.2%) |
| Electricity | 185 (18.1%) | 61 (24.3%) |
| Fuel Oil or Kerosene | 0 (0.0%) | 0 (0.0%) |
| Coal or Coke | 0 (0.0%) | 0 (0.0%) |
| All other Fuels | 10 (1.0%) | 0 (0.0%) |
| No Fuel Used | 0 (0.0%) | 0 (0.0%) |
| Total | 1,022 (100.0%) | 251 (100.0%) |
Household Vehicle Usage in Blissfield
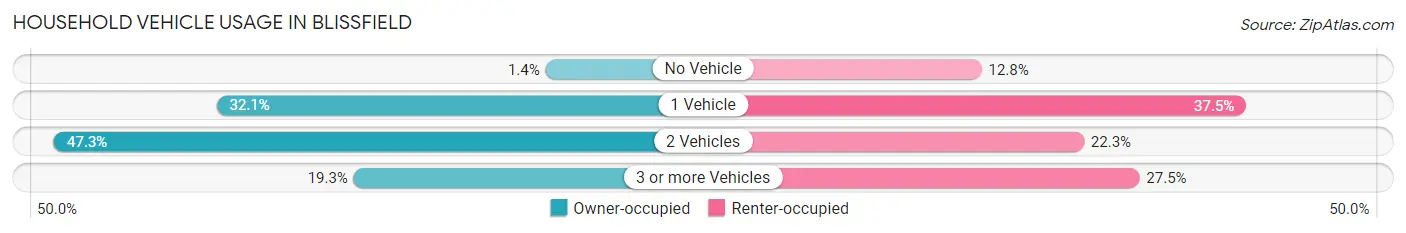
| Vehicles per Household | Owner-occupied | Renter-occupied |
| No Vehicle | 14 (1.4%) | 32 (12.8%) |
| 1 Vehicle | 328 (32.1%) | 94 (37.4%) |
| 2 Vehicles | 483 (47.3%) | 56 (22.3%) |
| 3 or more Vehicles | 197 (19.3%) | 69 (27.5%) |
| Total | 1,022 (100.0%) | 251 (100.0%) |
Real Estate & Mortgages in Blissfield
Real Estate and Mortgage Overview in Blissfield
| Characteristic | Without Mortgage | With Mortgage |
| Housing Units | 386 | 636 |
| Median Property Value | $117,200 | $145,600 |
| Median Household Income | $57,462 | $44 |
| Monthly Housing Costs | $548 | $9 |
| Real Estate Taxes | $2,194 | $8 |
Property Value by Mortgage Status in Blissfield
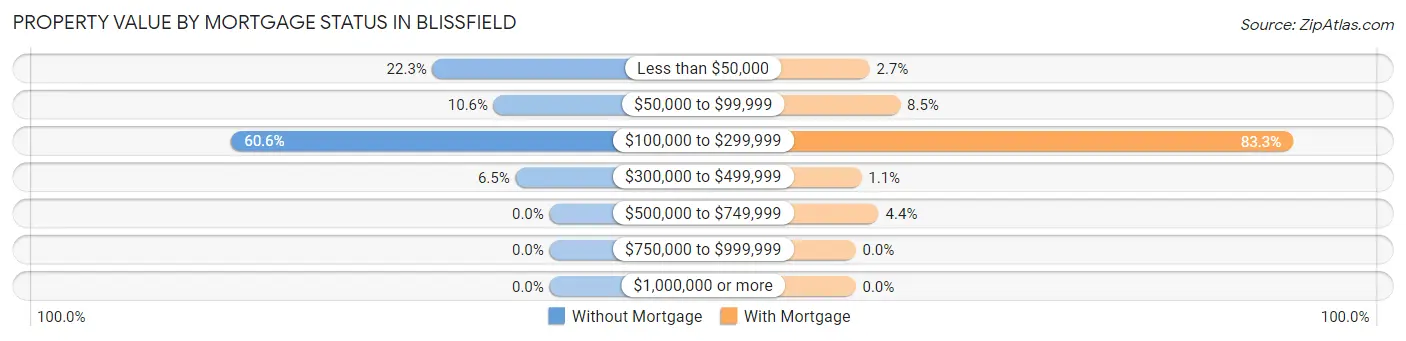
| Property Value | Without Mortgage | With Mortgage |
| Less than $50,000 | 86 (22.3%) | 17 (2.7%) |
| $50,000 to $99,999 | 41 (10.6%) | 54 (8.5%) |
| $100,000 to $299,999 | 234 (60.6%) | 530 (83.3%) |
| $300,000 to $499,999 | 25 (6.5%) | 7 (1.1%) |
| $500,000 to $749,999 | 0 (0.0%) | 28 (4.4%) |
| $750,000 to $999,999 | 0 (0.0%) | 0 (0.0%) |
| $1,000,000 or more | 0 (0.0%) | 0 (0.0%) |
| Total | 386 (100.0%) | 636 (100.0%) |
Household Income by Mortgage Status in Blissfield
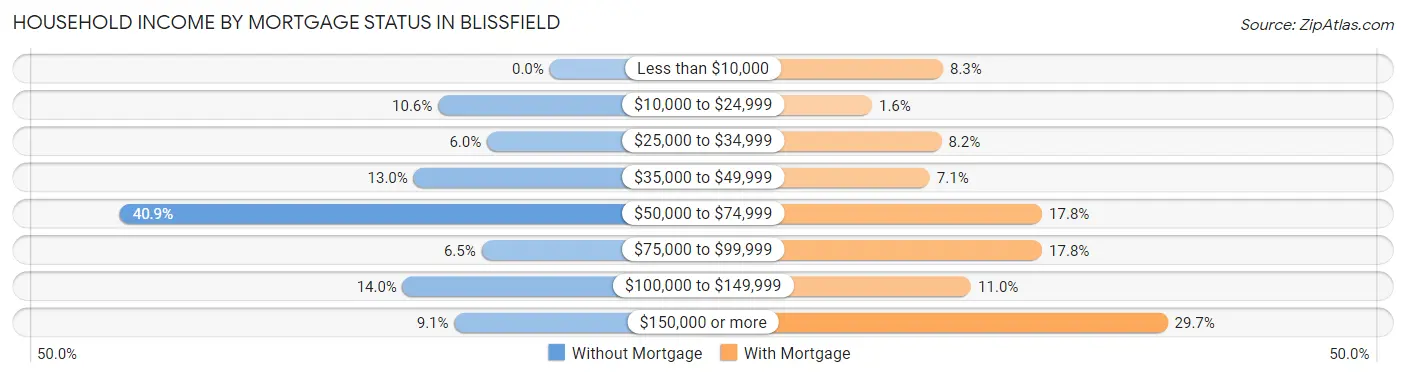
| Household Income | Without Mortgage | With Mortgage |
| Less than $10,000 | 0 (0.0%) | 53 (8.3%) |
| $10,000 to $24,999 | 41 (10.6%) | 10 (1.6%) |
| $25,000 to $34,999 | 23 (6.0%) | 52 (8.2%) |
| $35,000 to $49,999 | 50 (13.0%) | 45 (7.1%) |
| $50,000 to $74,999 | 158 (40.9%) | 113 (17.8%) |
| $75,000 to $99,999 | 25 (6.5%) | 113 (17.8%) |
| $100,000 to $149,999 | 54 (14.0%) | 70 (11.0%) |
| $150,000 or more | 35 (9.1%) | 189 (29.7%) |
| Total | 386 (100.0%) | 636 (100.0%) |
Property Value to Household Income Ratio in Blissfield
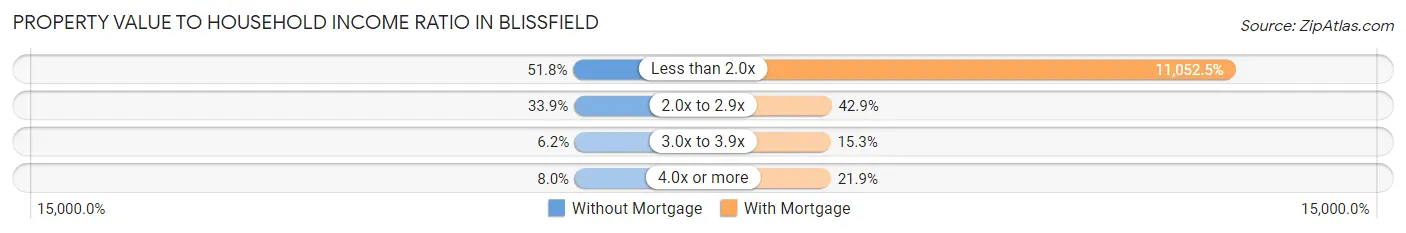
| Value-to-Income Ratio | Without Mortgage | With Mortgage |
| Less than 2.0x | 200 (51.8%) | 70,294 (11,052.5%) |
| 2.0x to 2.9x | 131 (33.9%) | 273 (42.9%) |
| 3.0x to 3.9x | 24 (6.2%) | 97 (15.2%) |
| 4.0x or more | 31 (8.0%) | 139 (21.9%) |
| Total | 386 (100.0%) | 636 (100.0%) |
Real Estate Taxes by Mortgage Status in Blissfield
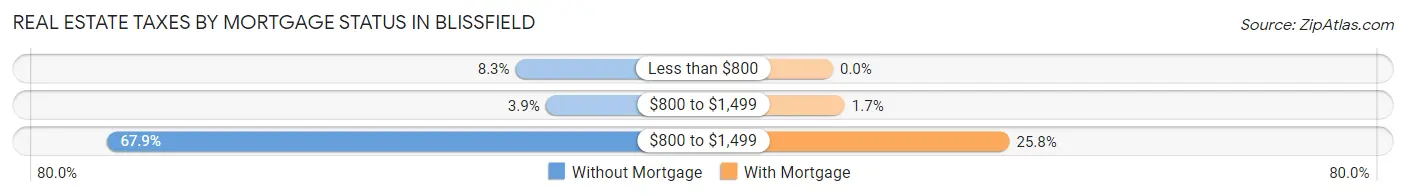
| Property Taxes | Without Mortgage | With Mortgage |
| Less than $800 | 32 (8.3%) | 0 (0.0%) |
| $800 to $1,499 | 15 (3.9%) | 11 (1.7%) |
| $800 to $1,499 | 262 (67.9%) | 164 (25.8%) |
| Total | 386 (100.0%) | 636 (100.0%) |
Health & Disability in Blissfield
Health Insurance Coverage by Age in Blissfield
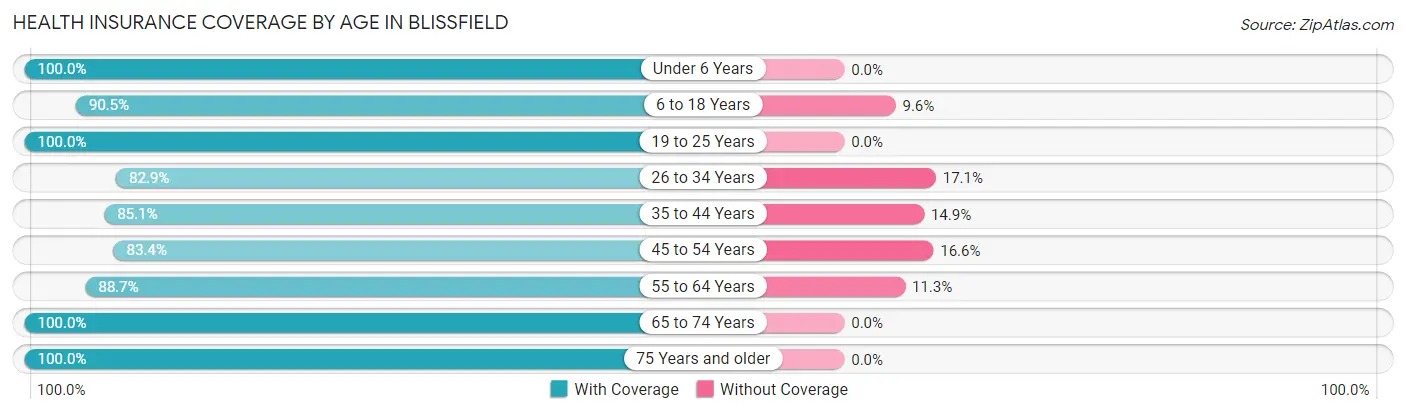
| Age Bracket | With Coverage | Without Coverage |
| Under 6 Years | 333 (100.0%) | 0 (0.0%) |
| 6 to 18 Years | 360 (90.4%) | 38 (9.6%) |
| 19 to 25 Years | 227 (100.0%) | 0 (0.0%) |
| 26 to 34 Years | 384 (82.9%) | 79 (17.1%) |
| 35 to 44 Years | 464 (85.1%) | 81 (14.9%) |
| 45 to 54 Years | 221 (83.4%) | 44 (16.6%) |
| 55 to 64 Years | 368 (88.7%) | 47 (11.3%) |
| 65 to 74 Years | 323 (100.0%) | 0 (0.0%) |
| 75 Years and older | 245 (100.0%) | 0 (0.0%) |
| Total | 2,925 (91.0%) | 289 (9.0%) |
Health Insurance Coverage by Citizenship Status in Blissfield
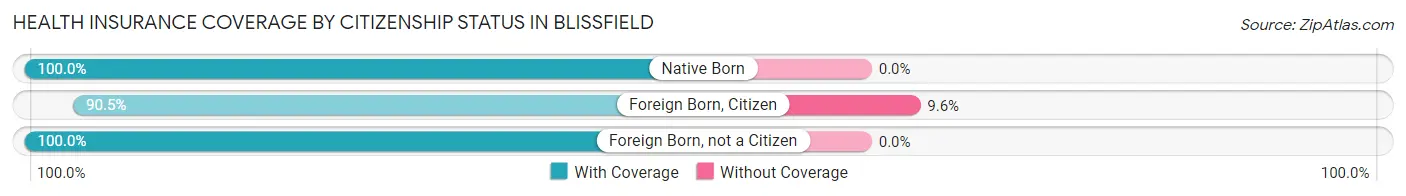
| Citizenship Status | With Coverage | Without Coverage |
| Native Born | 333 (100.0%) | 0 (0.0%) |
| Foreign Born, Citizen | 360 (90.4%) | 38 (9.6%) |
| Foreign Born, not a Citizen | 227 (100.0%) | 0 (0.0%) |
Health Insurance Coverage by Household Income in Blissfield
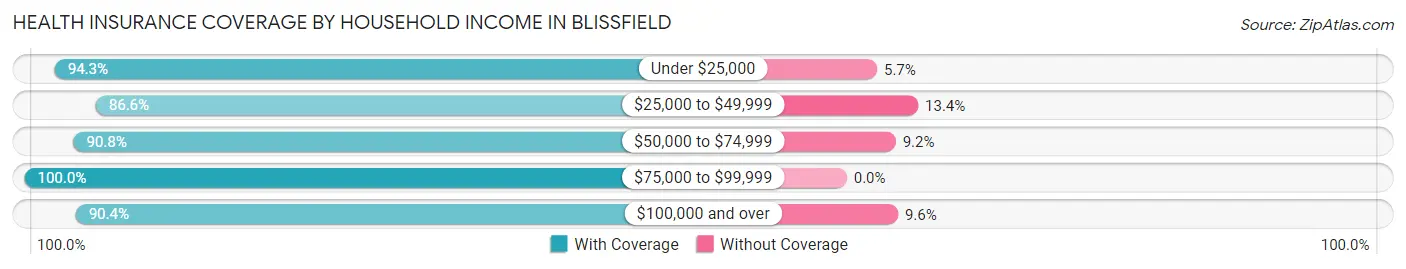
| Household Income | With Coverage | Without Coverage |
| Under $25,000 | 233 (94.3%) | 14 (5.7%) |
| $25,000 to $49,999 | 467 (86.6%) | 72 (13.4%) |
| $50,000 to $74,999 | 921 (90.8%) | 93 (9.2%) |
| $75,000 to $99,999 | 267 (100.0%) | 0 (0.0%) |
| $100,000 and over | 1,037 (90.4%) | 110 (9.6%) |
Public vs Private Health Insurance Coverage by Age in Blissfield
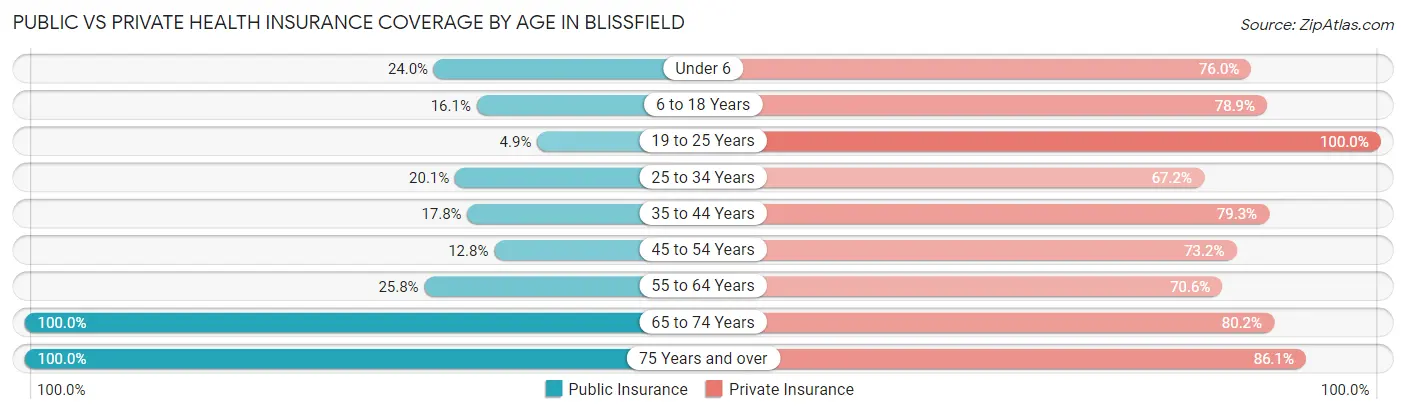
| Age Bracket | Public Insurance | Private Insurance |
| Under 6 | 80 (24.0%) | 253 (76.0%) |
| 6 to 18 Years | 64 (16.1%) | 314 (78.9%) |
| 19 to 25 Years | 11 (4.9%) | 227 (100.0%) |
| 25 to 34 Years | 93 (20.1%) | 311 (67.2%) |
| 35 to 44 Years | 97 (17.8%) | 432 (79.3%) |
| 45 to 54 Years | 34 (12.8%) | 194 (73.2%) |
| 55 to 64 Years | 107 (25.8%) | 293 (70.6%) |
| 65 to 74 Years | 323 (100.0%) | 259 (80.2%) |
| 75 Years and over | 245 (100.0%) | 211 (86.1%) |
| Total | 1,054 (32.8%) | 2,494 (77.6%) |
Disability Status by Sex by Age in Blissfield
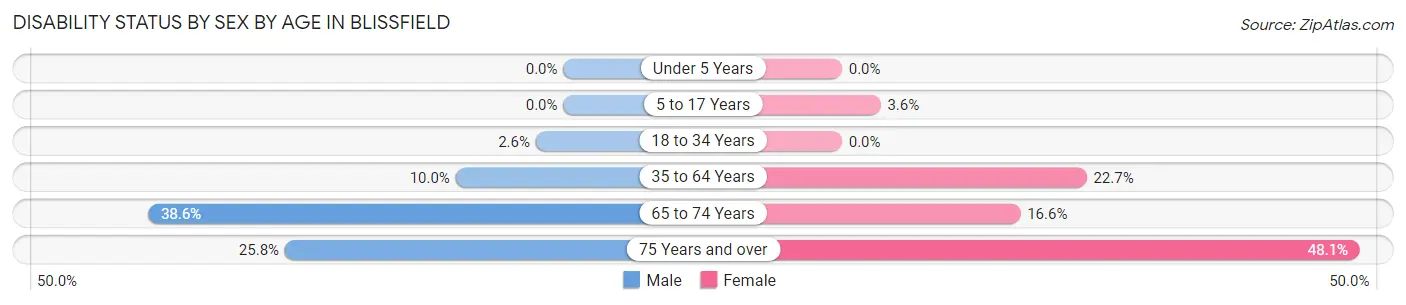
| Age Bracket | Male | Female |
| Under 5 Years | 0 (0.0%) | 0 (0.0%) |
| 5 to 17 Years | 0 (0.0%) | 7 (3.6%) |
| 18 to 34 Years | 11 (2.6%) | 0 (0.0%) |
| 35 to 64 Years | 70 (10.0%) | 119 (22.7%) |
| 65 to 74 Years | 64 (38.6%) | 26 (16.6%) |
| 75 Years and over | 23 (25.8%) | 75 (48.1%) |
Disability Class by Sex by Age in Blissfield
Disability Class: Hearing Difficulty
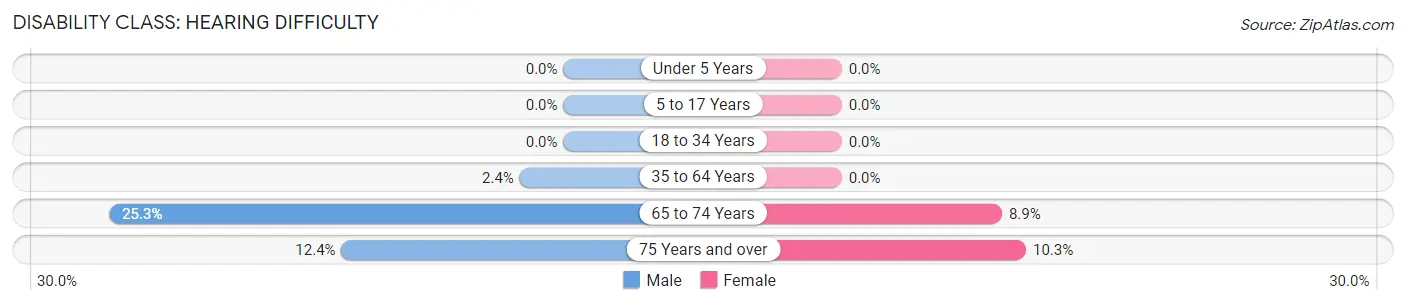
| Age Bracket | Male | Female |
| Under 5 Years | 0 (0.0%) | 0 (0.0%) |
| 5 to 17 Years | 0 (0.0%) | 0 (0.0%) |
| 18 to 34 Years | 0 (0.0%) | 0 (0.0%) |
| 35 to 64 Years | 17 (2.4%) | 0 (0.0%) |
| 65 to 74 Years | 42 (25.3%) | 14 (8.9%) |
| 75 Years and over | 11 (12.4%) | 16 (10.3%) |
Disability Class: Vision Difficulty
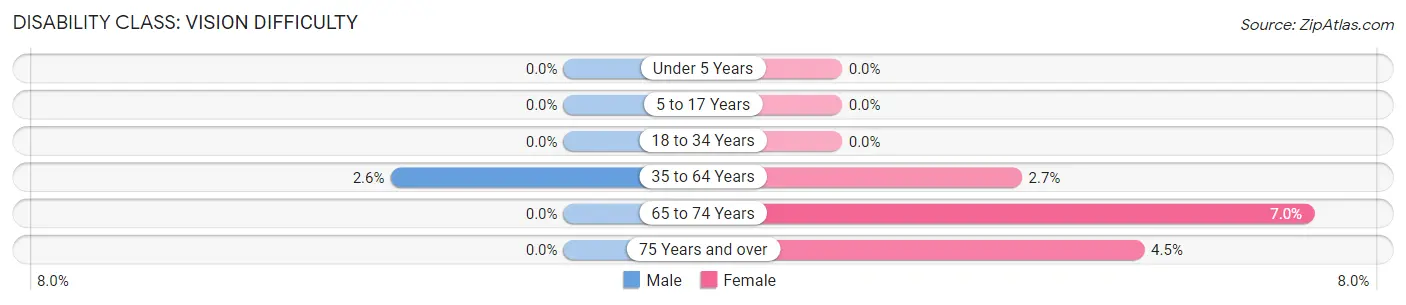
| Age Bracket | Male | Female |
| Under 5 Years | 0 (0.0%) | 0 (0.0%) |
| 5 to 17 Years | 0 (0.0%) | 0 (0.0%) |
| 18 to 34 Years | 0 (0.0%) | 0 (0.0%) |
| 35 to 64 Years | 18 (2.6%) | 14 (2.7%) |
| 65 to 74 Years | 0 (0.0%) | 11 (7.0%) |
| 75 Years and over | 0 (0.0%) | 7 (4.5%) |
Disability Class: Cognitive Difficulty
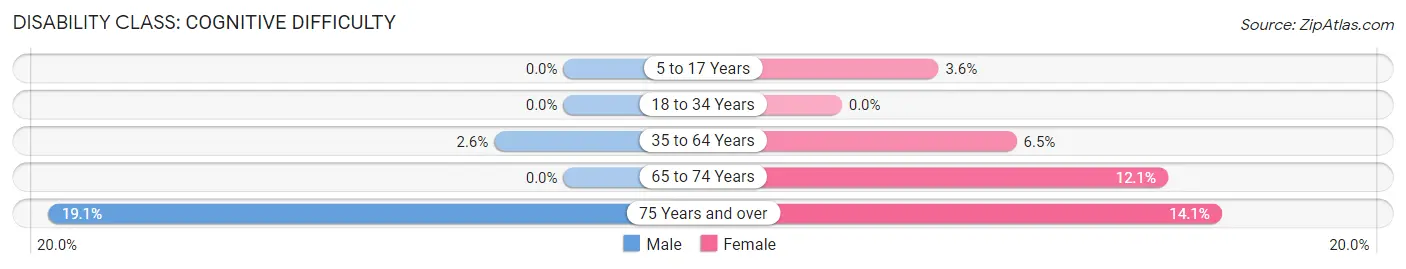
| Age Bracket | Male | Female |
| 5 to 17 Years | 0 (0.0%) | 7 (3.6%) |
| 18 to 34 Years | 0 (0.0%) | 0 (0.0%) |
| 35 to 64 Years | 18 (2.6%) | 34 (6.5%) |
| 65 to 74 Years | 0 (0.0%) | 19 (12.1%) |
| 75 Years and over | 17 (19.1%) | 22 (14.1%) |
Disability Class: Ambulatory Difficulty
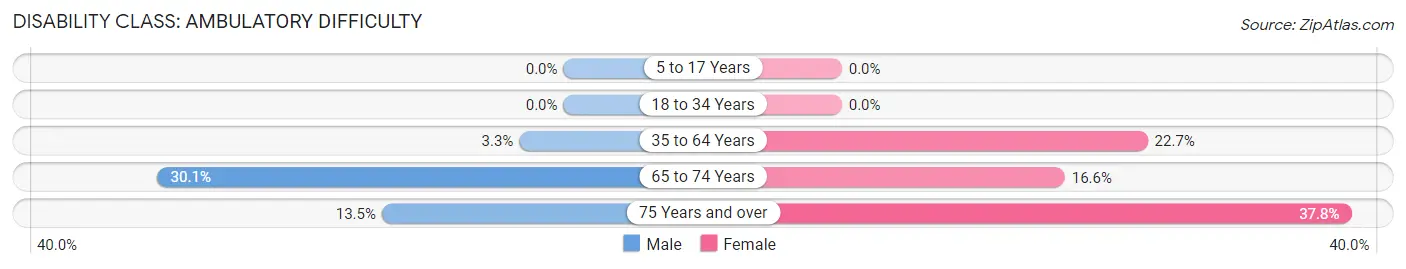
| Age Bracket | Male | Female |
| 5 to 17 Years | 0 (0.0%) | 0 (0.0%) |
| 18 to 34 Years | 0 (0.0%) | 0 (0.0%) |
| 35 to 64 Years | 23 (3.3%) | 119 (22.7%) |
| 65 to 74 Years | 50 (30.1%) | 26 (16.6%) |
| 75 Years and over | 12 (13.5%) | 59 (37.8%) |
Disability Class: Self-Care Difficulty
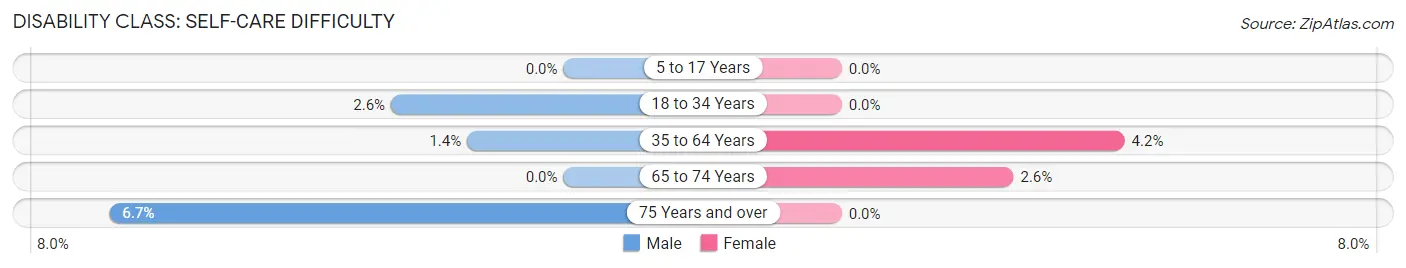
| Age Bracket | Male | Female |
| 5 to 17 Years | 0 (0.0%) | 0 (0.0%) |
| 18 to 34 Years | 11 (2.6%) | 0 (0.0%) |
| 35 to 64 Years | 10 (1.4%) | 22 (4.2%) |
| 65 to 74 Years | 0 (0.0%) | 4 (2.5%) |
| 75 Years and over | 6 (6.7%) | 0 (0.0%) |
Technology Access in Blissfield
Computing Device Access in Blissfield
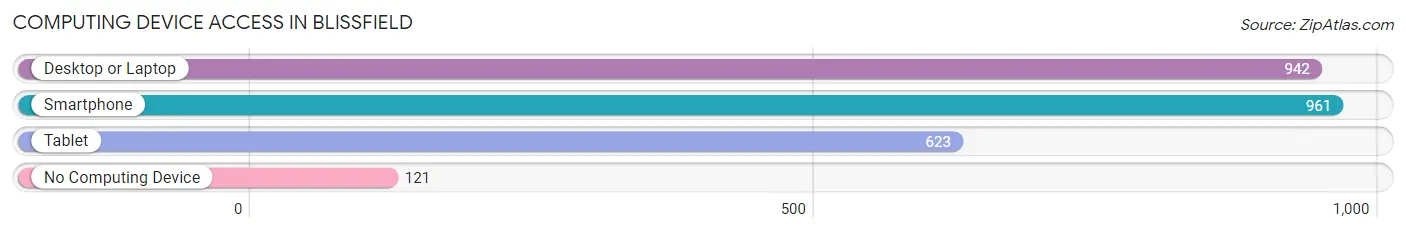
| Device Type | # Households | % Households |
| Desktop or Laptop | 942 | 74.0% |
| Smartphone | 961 | 75.5% |
| Tablet | 623 | 48.9% |
| No Computing Device | 121 | 9.5% |
| Total | 1,273 | 100.0% |
Internet Access in Blissfield
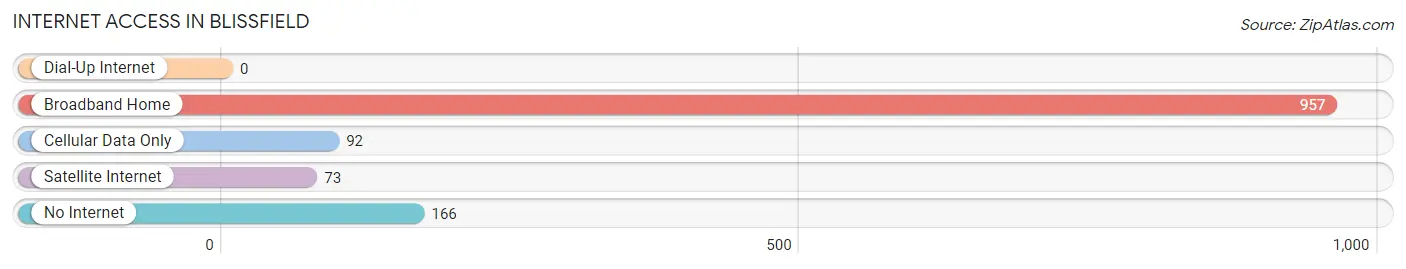
| Internet Type | # Households | % Households |
| Dial-Up Internet | 0 | 0.0% |
| Broadband Home | 957 | 75.2% |
| Cellular Data Only | 92 | 7.2% |
| Satellite Internet | 73 | 5.7% |
| No Internet | 166 | 13.0% |
| Total | 1,273 | 100.0% |
Blissfield Summary
Blissfield is a village located in Lenawee County, Michigan, United States. The population was 2,597 at the 2010 census. It is located in the southeast corner of the county, along the Raisin River.
History
Blissfield was founded in 1836 by William Bliss, a native of Massachusetts. He purchased the land from the government and named it after himself. The village was incorporated in 1838.
In the early days, Blissfield was a farming community. The village was also known for its brickyards, which produced bricks for many of the buildings in the area.
In the late 19th century, Blissfield became a popular tourist destination. The village was home to several resorts, including the Blissfield House, which was built in 1876. The resort was a popular destination for wealthy Detroiters looking to escape the city.
Geography
Blissfield is located at 41°51'25" North, 84°7'25" West (41.857139, -84.123545). According to the United States Census Bureau, the village has a total area of 1.2 square miles (3.1 km2), all land.
Economy
The economy of Blissfield is largely based on agriculture and tourism. The village is home to several farms, which produce a variety of crops, including corn, soybeans, wheat, and hay.
The village is also home to several small businesses, including restaurants, retail stores, and service providers. The village is also home to several manufacturing companies, including Blissfield Manufacturing, which produces automotive parts.
Demographics
As of the census of 2010, there were 2,597 people, 1,072 households, and 690 families residing in the village. The population density was 2,164.2 people per square mile (832.7/km2). There were 1,164 housing units at an average density of 972.5 per square mile (375.3/km2). The racial makeup of the village was 95.2% White, 0.7% African American, 0.3% Native American, 0.4% Asian, 0.1% Pacific Islander, 1.2% from other races, and 2.1% from two or more races. Hispanic or Latino of any race were 3.3% of the population.
There were 1,072 households, out of which 30.2% had children under the age of 18 living with them, 48.2% were married couples living together, 11.7% had a female householder with no husband present, and 35.2% were non-families. 30.2% of all households were made up of individuals, and 14.2% had someone living alone who was 65 years of age or older. The average household size was 2.41 and the average family size was 2.97.
In the village, the population was spread out, with 25.2% under the age of 18, 8.2% from 18 to 24, 28.2% from 25 to 44, 22.2% from 45 to 64, and 16.2% who were 65 years of age or older. The median age was 37 years. For every 100 females, there were 92.2 males. For every 100 females age 18 and over, there were 88.2 males.
The median income for a household in the village was $41,964, and the median income for a family was $50,000. Males had a median income of $37,500 versus $25,000 for females. The per capita income for the village was $20,945. About 5.2% of families and 8.2% of the population were below the poverty line, including 10.2% of those under age 18 and 6.2% of those age 65 or over.
Common Questions
What is Per Capita Income in Blissfield?
Per Capita income in Blissfield is $31,428.
What is the Median Family Income in Blissfield?
Median Family Income in Blissfield is $67,986.
What is the Median Household income in Blissfield?
Median Household Income in Blissfield is $62,585.
What is Income or Wage Gap in Blissfield?
Income or Wage Gap in Blissfield is 54.7%.
Women in Blissfield earn 45.3 cents for every dollar earned by a man.
What is Inequality or Gini Index in Blissfield?
Inequality or Gini Index in Blissfield is 0.35.
What is the Total Population of Blissfield?
Total Population of Blissfield is 3,214.
What is the Total Male Population of Blissfield?
Total Male Population of Blissfield is 1,706.
What is the Total Female Population of Blissfield?
Total Female Population of Blissfield is 1,508.
What is the Ratio of Males per 100 Females in Blissfield?
There are 113.13 Males per 100 Females in Blissfield.
What is the Ratio of Females per 100 Males in Blissfield?
There are 88.39 Females per 100 Males in Blissfield.
What is the Median Population Age in Blissfield?
Median Population Age in Blissfield is 40.3 Years.
What is the Average Family Size in Blissfield
Average Family Size in Blissfield is 3.0 People.
What is the Average Household Size in Blissfield
Average Household Size in Blissfield is 2.5 People.
How Large is the Labor Force in Blissfield?
There are 1,819 People in the Labor Forcein in Blissfield.
What is the Percentage of People in the Labor Force in Blissfield?
70.4% of People are in the Labor Force in Blissfield.
What is the Unemployment Rate in Blissfield?
Unemployment Rate in Blissfield is 5.3%.