Big Bay, MI Map & Demographics
Big Bay Map
Big Bay Overview
$32,556
PER CAPITA INCOME
$61,875
AVG FAMILY INCOME
$46,372
AVG HOUSEHOLD INCOME
0.21
INEQUALITY / GINI INDEX
468
TOTAL POPULATION
268
MALE POPULATION
200
FEMALE POPULATION
134.00
MALES / 100 FEMALES
74.63
FEMALES / 100 MALES
67.7
MEDIAN AGE
2.5
AVG FAMILY SIZE
1.5
AVG HOUSEHOLD SIZE
92
LABOR FORCE [ PEOPLE ]
22.0%
PERCENT IN LABOR FORCE
Big Bay Zip Codes
Big Bay Area Codes
Income in Big Bay
Income Overview in Big Bay
Per Capita Income in Big Bay is $32,556, while median incomes of families and households are $61,875 and $46,372 respectively.
| Characteristic | Number | Measure |
| Per Capita Income | 468 | $32,556 |
| Median Family Income | 66 | $61,875 |
| Mean Family Income | 66 | $58,956 |
| Median Household Income | 305 | $46,372 |
| Mean Household Income | 305 | $49,546 |
| Income Deficit | 66 | $0 |
| Wage / Income Gap (%) | 468 | 0.00% |
| Wage / Income Gap ($) | 468 | 100.00¢ per $1 |
| Gini / Inequality Index | 468 | 0.21 |
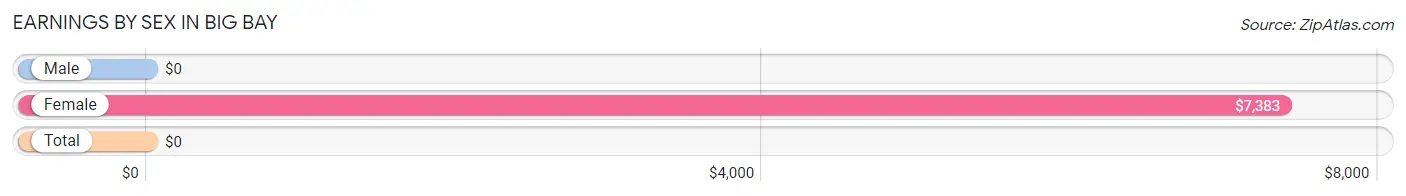
Earnings by Sex in Big Bay
| Sex | Number | Average Earnings |
| Male | 53 (39.6%) | $0 |
| Female | 81 (60.5%) | $7,383 |
| Total | 134 (100.0%) | $0 |
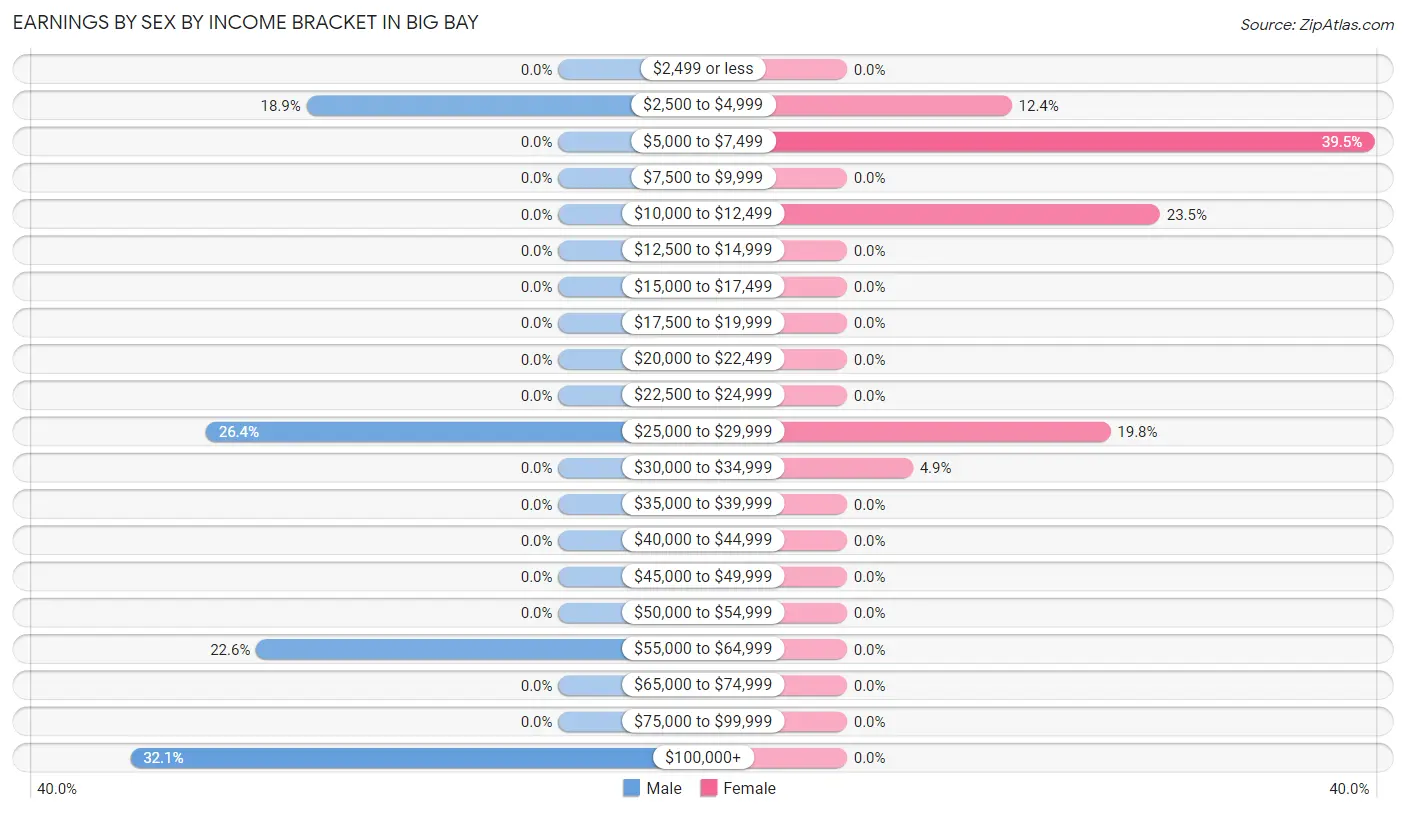
Earnings by Sex by Income Bracket in Big Bay
The most common earnings brackets in Big Bay are $100,000+ for men (17 | 32.1%) and $5,000 to $7,499 for women (32 | 39.5%).
| Income | Male | Female |
| $2,499 or less | 0 (0.0%) | 0 (0.0%) |
| $2,500 to $4,999 | 10 (18.9%) | 10 (12.3%) |
| $5,000 to $7,499 | 0 (0.0%) | 32 (39.5%) |
| $7,500 to $9,999 | 0 (0.0%) | 0 (0.0%) |
| $10,000 to $12,499 | 0 (0.0%) | 19 (23.5%) |
| $12,500 to $14,999 | 0 (0.0%) | 0 (0.0%) |
| $15,000 to $17,499 | 0 (0.0%) | 0 (0.0%) |
| $17,500 to $19,999 | 0 (0.0%) | 0 (0.0%) |
| $20,000 to $22,499 | 0 (0.0%) | 0 (0.0%) |
| $22,500 to $24,999 | 0 (0.0%) | 0 (0.0%) |
| $25,000 to $29,999 | 14 (26.4%) | 16 (19.8%) |
| $30,000 to $34,999 | 0 (0.0%) | 4 (4.9%) |
| $35,000 to $39,999 | 0 (0.0%) | 0 (0.0%) |
| $40,000 to $44,999 | 0 (0.0%) | 0 (0.0%) |
| $45,000 to $49,999 | 0 (0.0%) | 0 (0.0%) |
| $50,000 to $54,999 | 0 (0.0%) | 0 (0.0%) |
| $55,000 to $64,999 | 12 (22.6%) | 0 (0.0%) |
| $65,000 to $74,999 | 0 (0.0%) | 0 (0.0%) |
| $75,000 to $99,999 | 0 (0.0%) | 0 (0.0%) |
| $100,000+ | 17 (32.1%) | 0 (0.0%) |
| Total | 53 (100.0%) | 81 (100.0%) |
Earnings by Sex by Educational Attainment in Big Bay
| Educational Attainment | Male Income | Female Income |
| Less than High School | - | - |
| High School Diploma | - | - |
| College or Associate's Degree | - | - |
| Bachelor's Degree | - | - |
| Graduate Degree | - | - |
| Total | - | - |
Family Income in Big Bay
Family Income Brackets in Big Bay
According to the Big Bay family income data, there are 32 families falling into the $50,000 to $74,999 income range, which is the most common income bracket and makes up 48.5% of all families.
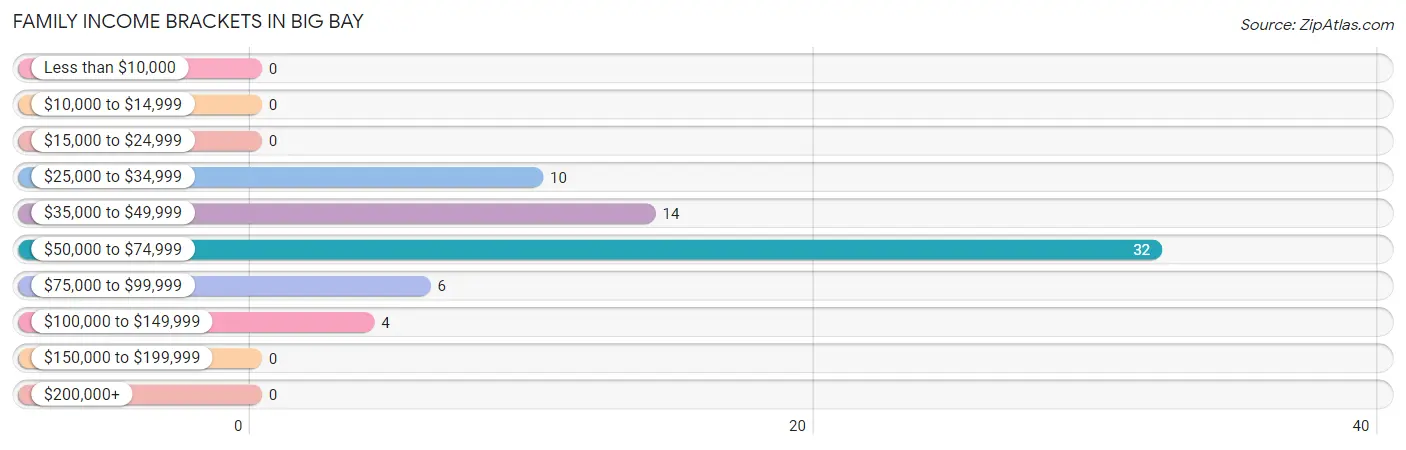
| Income Bracket | # Families | % Families |
| Less than $10,000 | 0 | 0.0% |
| $10,000 to $14,999 | 0 | 0.0% |
| $15,000 to $24,999 | 0 | 0.0% |
| $25,000 to $34,999 | 10 | 15.2% |
| $35,000 to $49,999 | 14 | 21.2% |
| $50,000 to $74,999 | 32 | 48.5% |
| $75,000 to $99,999 | 6 | 9.1% |
| $100,000 to $149,999 | 4 | 6.1% |
| $150,000 to $199,999 | 0 | 0.0% |
| $200,000+ | 0 | 0.0% |
Family Income by Famaliy Size in Big Bay
2-person families (48 | 72.7%) account for the highest median family income in Big Bay with $66,500 per family, while 2-person families (48 | 72.7%) have the highest median income of $33,250 per family member.
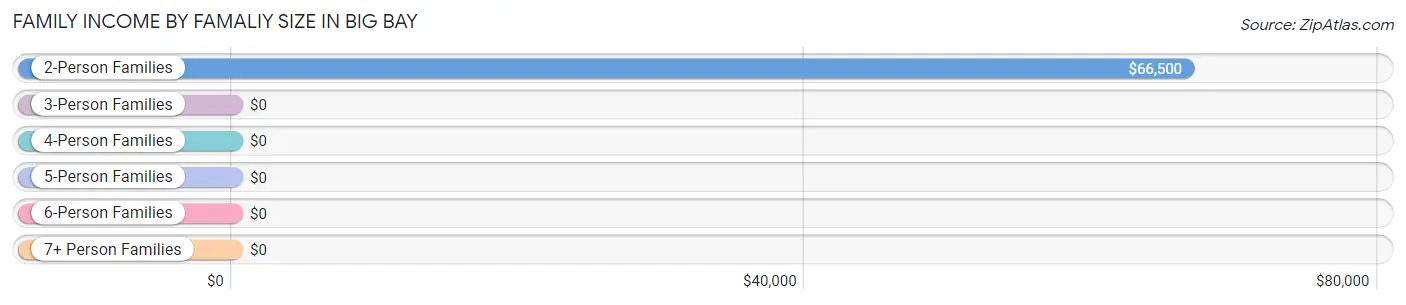
| Income Bracket | # Families | Median Income |
| 2-Person Families | 48 (72.7%) | $66,500 |
| 3-Person Families | 14 (21.2%) | $0 |
| 4-Person Families | 0 (0.0%) | $0 |
| 5-Person Families | 0 (0.0%) | $0 |
| 6-Person Families | 4 (6.1%) | $0 |
| 7+ Person Families | 0 (0.0%) | $0 |
| Total | 66 (100.0%) | $61,875 |
Family Income by Number of Earners in Big Bay
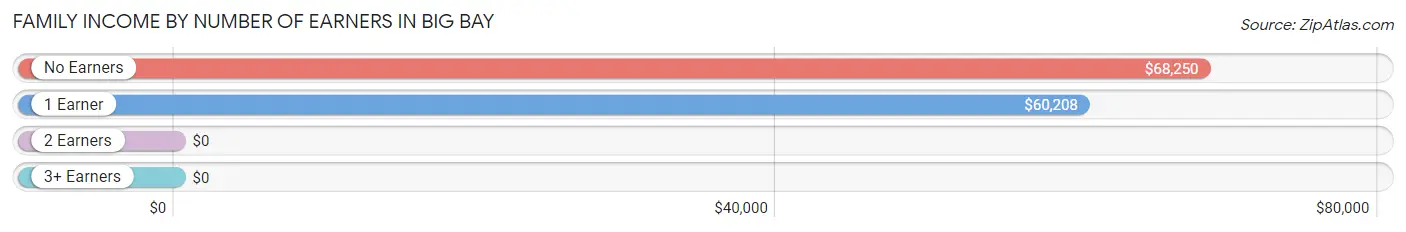
| Number of Earners | # Families | Median Income |
| No Earners | 26 (39.4%) | $68,250 |
| 1 Earner | 30 (45.5%) | $60,208 |
| 2 Earners | 10 (15.1%) | $0 |
| 3+ Earners | 0 (0.0%) | $0 |
| Total | 66 (100.0%) | $61,875 |
Household Income in Big Bay
Household Income Brackets in Big Bay
With 187 households falling in the category, the $35,000 to $49,999 income range is the most frequent in Big Bay, accounting for 61.3% of all households.
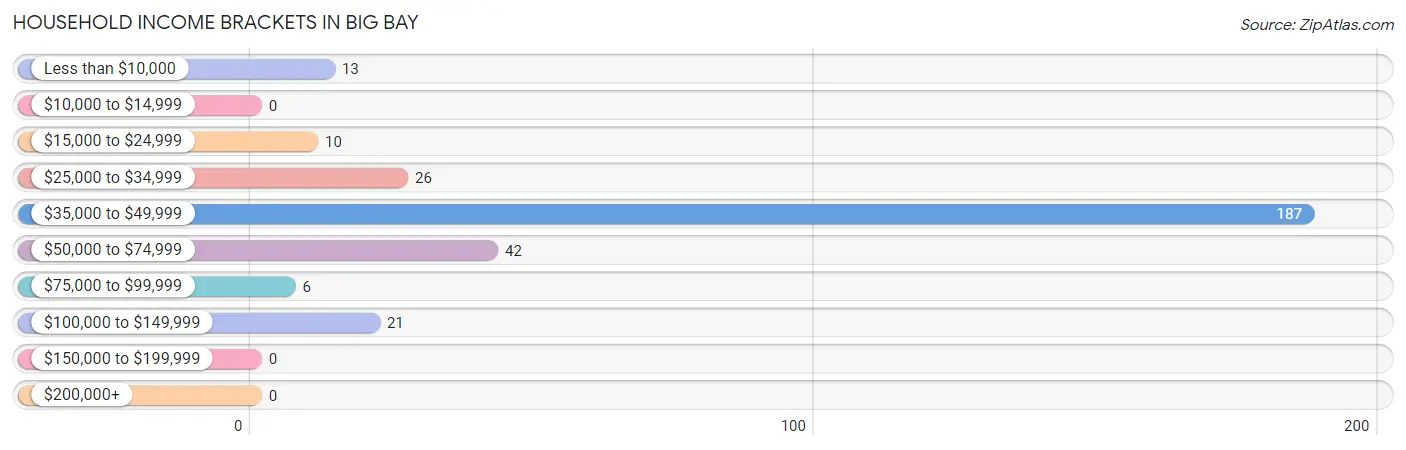
| Income Bracket | # Households | % Households |
| Less than $10,000 | 13 | 4.3% |
| $10,000 to $14,999 | 0 | 0.0% |
| $15,000 to $24,999 | 10 | 3.3% |
| $25,000 to $34,999 | 26 | 8.5% |
| $35,000 to $49,999 | 187 | 61.3% |
| $50,000 to $74,999 | 42 | 13.8% |
| $75,000 to $99,999 | 6 | 2.0% |
| $100,000 to $149,999 | 21 | 6.9% |
| $150,000 to $199,999 | 0 | 0.0% |
| $200,000+ | 0 | 0.0% |
Household Income by Householder Age in Big Bay
The median household income in Big Bay is $46,372, with the highest median household income of $67,708 found in the 45 to 64 years age bracket for the primary householder. A total of 41 households (13.4%) fall into this category.
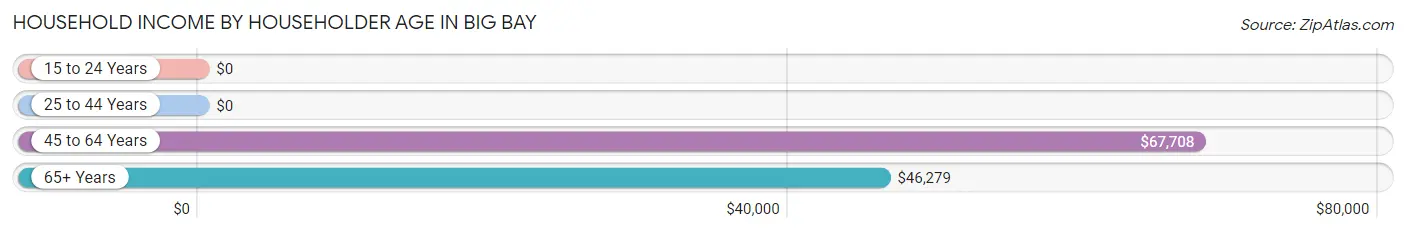
| Income Bracket | # Households | Median Income |
| 15 to 24 Years | 0 (0.0%) | $0 |
| 25 to 44 Years | 45 (14.7%) | $0 |
| 45 to 64 Years | 41 (13.4%) | $67,708 |
| 65+ Years | 219 (71.8%) | $46,279 |
| Total | 305 (100.0%) | $46,372 |
Poverty in Big Bay
Income Below Poverty by Sex and Age in Big Bay
With 3.0% poverty level for males and 28.7% for females among the residents of Big Bay, 35 to 44 year old males and 25 to 34 year old females are the most vulnerable to poverty, with 8 males (66.7%) and 17 females (100.0%) in their respective age groups living below the poverty level.
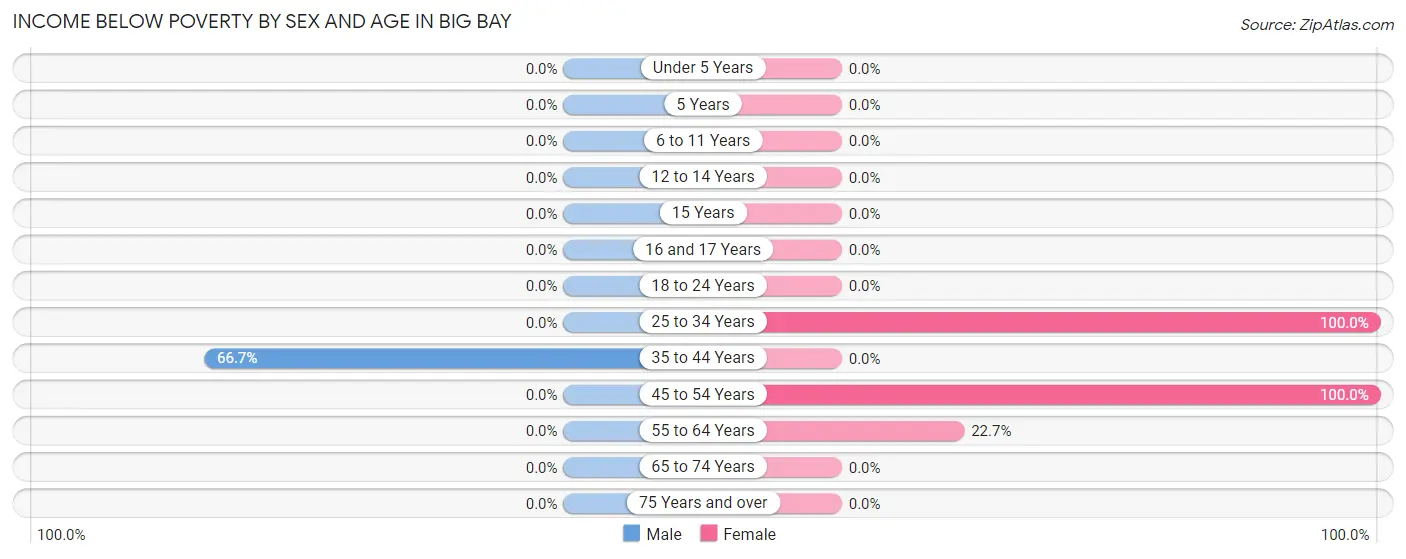
| Age Bracket | Male | Female |
| Under 5 Years | 0 (0.0%) | 0 (0.0%) |
| 5 Years | 0 (0.0%) | 0 (0.0%) |
| 6 to 11 Years | 0 (0.0%) | 0 (0.0%) |
| 12 to 14 Years | 0 (0.0%) | 0 (0.0%) |
| 15 Years | 0 (0.0%) | 0 (0.0%) |
| 16 and 17 Years | 0 (0.0%) | 0 (0.0%) |
| 18 to 24 Years | 0 (0.0%) | 0 (0.0%) |
| 25 to 34 Years | 0 (0.0%) | 17 (100.0%) |
| 35 to 44 Years | 8 (66.7%) | 0 (0.0%) |
| 45 to 54 Years | 0 (0.0%) | 32 (100.0%) |
| 55 to 64 Years | 0 (0.0%) | 5 (22.7%) |
| 65 to 74 Years | 0 (0.0%) | 0 (0.0%) |
| 75 Years and over | 0 (0.0%) | 0 (0.0%) |
| Total | 8 (3.0%) | 54 (28.7%) |
Income Above Poverty by Sex and Age in Big Bay
According to the poverty statistics in Big Bay, males aged 12 to 14 years and females aged under 5 years are the age groups that are most secure financially, with 100.0% of males and 100.0% of females in these age groups living above the poverty line.
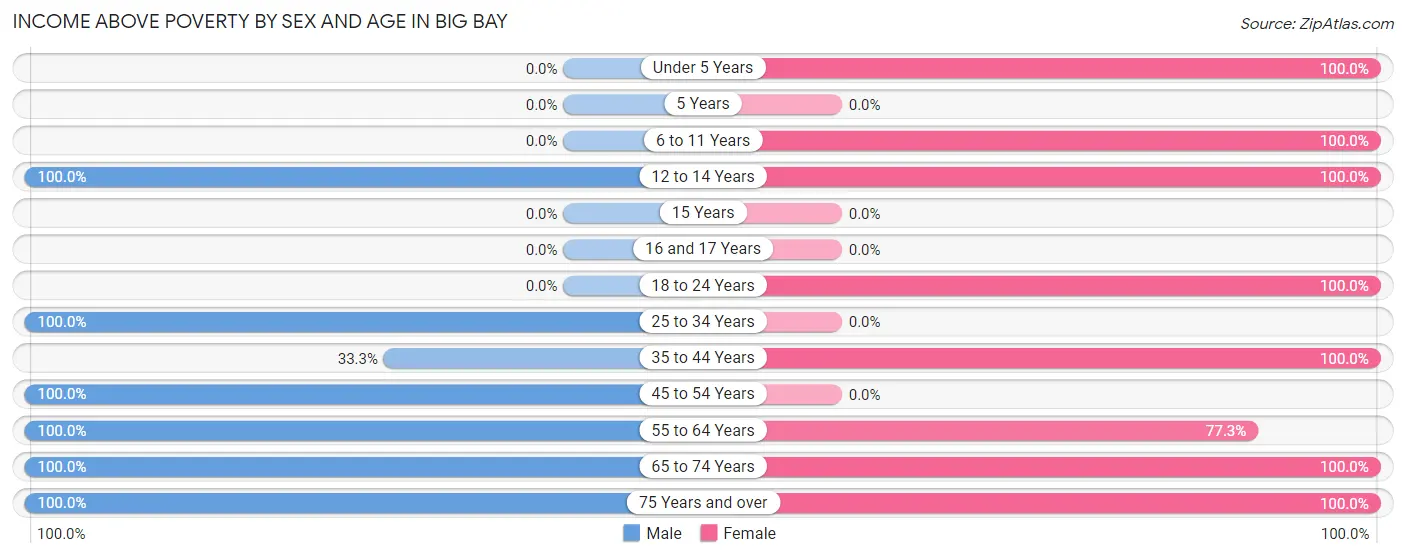
| Age Bracket | Male | Female |
| Under 5 Years | 0 (0.0%) | 10 (100.0%) |
| 5 Years | 0 (0.0%) | 0 (0.0%) |
| 6 to 11 Years | 0 (0.0%) | 12 (100.0%) |
| 12 to 14 Years | 4 (100.0%) | 12 (100.0%) |
| 15 Years | 0 (0.0%) | 0 (0.0%) |
| 16 and 17 Years | 0 (0.0%) | 0 (0.0%) |
| 18 to 24 Years | 0 (0.0%) | 21 (100.0%) |
| 25 to 34 Years | 17 (100.0%) | 0 (0.0%) |
| 35 to 44 Years | 4 (33.3%) | 20 (100.0%) |
| 45 to 54 Years | 14 (100.0%) | 0 (0.0%) |
| 55 to 64 Years | 22 (100.0%) | 17 (77.3%) |
| 65 to 74 Years | 26 (100.0%) | 32 (100.0%) |
| 75 Years and over | 173 (100.0%) | 10 (100.0%) |
| Total | 260 (97.0%) | 134 (71.3%) |
Income Below Poverty Among Married-Couple Families in Big Bay
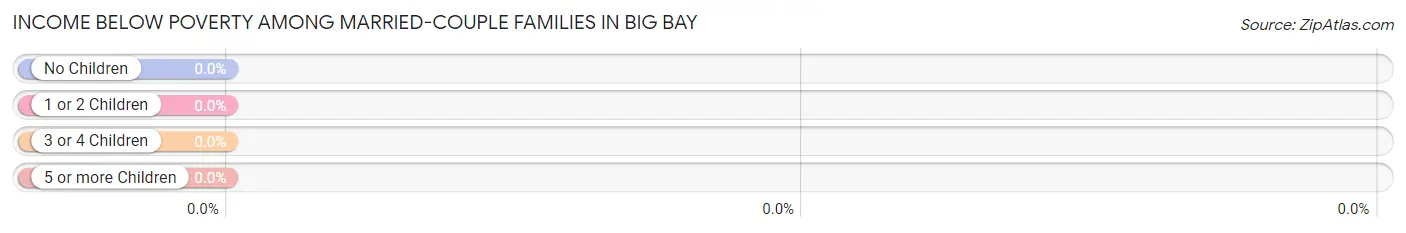
| Children | Above Poverty | Below Poverty |
| No Children | 40 (100.0%) | 0 (0.0%) |
| 1 or 2 Children | 0 (0.0%) | 0 (0.0%) |
| 3 or 4 Children | 4 (100.0%) | 0 (0.0%) |
| 5 or more Children | 0 (0.0%) | 0 (0.0%) |
| Total | 44 (100.0%) | 0 (0.0%) |
Income Below Poverty Among Single-Parent Households in Big Bay
| Children | Single Father | Single Mother |
| No Children | 0 (0.0%) | 0 (0.0%) |
| 1 or 2 Children | 0 (0.0%) | 0 (0.0%) |
| 3 or 4 Children | 0 (0.0%) | 0 (0.0%) |
| 5 or more Children | 0 (0.0%) | 0 (0.0%) |
| Total | 0 (0.0%) | 0 (0.0%) |
Income Below Poverty Among Married-Couple vs Single-Parent Households in Big Bay
| Children | Married-Couple Families | Single-Parent Households |
| No Children | 0 (0.0%) | 0 (0.0%) |
| 1 or 2 Children | 0 (0.0%) | 0 (0.0%) |
| 3 or 4 Children | 0 (0.0%) | 0 (0.0%) |
| 5 or more Children | 0 (0.0%) | 0 (0.0%) |
| Total | 0 (0.0%) | 0 (0.0%) |
Race in Big Bay
The most populous races in Big Bay are White / Caucasian (450 | 96.2%), and Two or more Races (18 | 3.8%).
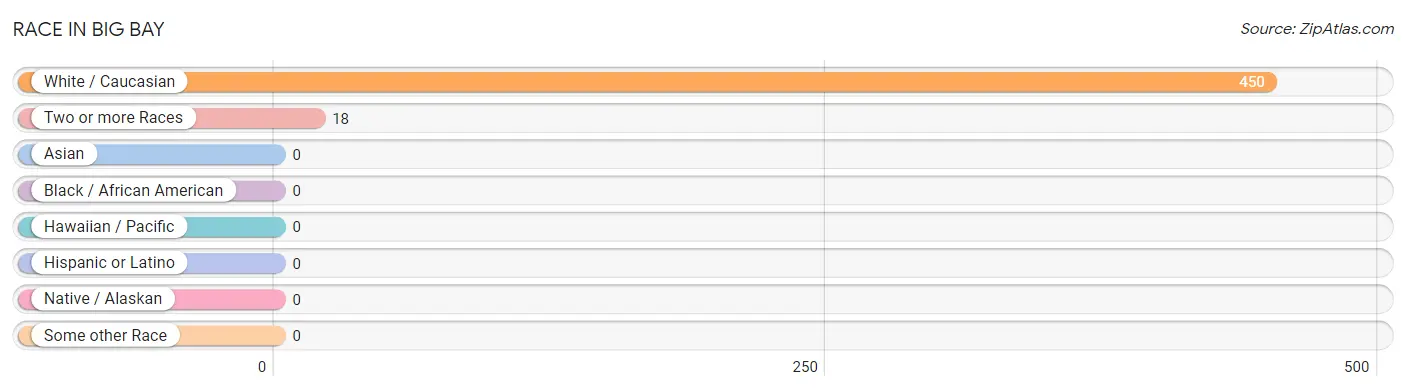
| Race | # Population | % Population |
| Asian | 0 | 0.0% |
| Black / African American | 0 | 0.0% |
| Hawaiian / Pacific | 0 | 0.0% |
| Hispanic or Latino | 0 | 0.0% |
| Native / Alaskan | 0 | 0.0% |
| White / Caucasian | 450 | 96.2% |
| Two or more Races | 18 | 3.8% |
| Some other Race | 0 | 0.0% |
| Total | 468 | 100.0% |
Ancestry in Big Bay
The most populous ancestries reported in Big Bay are German (309 | 66.0%), Irish (107 | 22.9%), French (39 | 8.3%), Norwegian (38 | 8.1%), and English (32 | 6.8%), together accounting for 112.2% of all Big Bay residents.
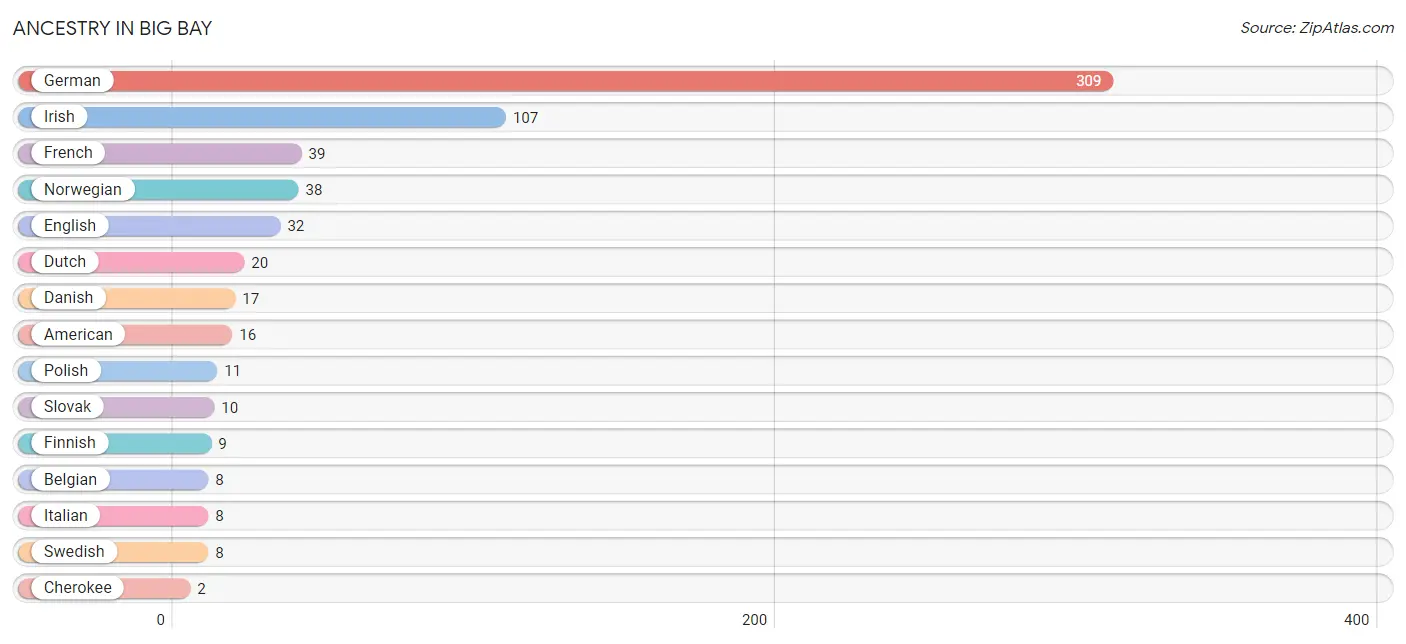
| Ancestry | # Population | % Population |
| American | 16 | 3.4% |
| Belgian | 8 | 1.7% |
| Cherokee | 2 | 0.4% |
| Danish | 17 | 3.6% |
| Dutch | 20 | 4.3% |
| English | 32 | 6.8% |
| Finnish | 9 | 1.9% |
| French | 39 | 8.3% |
| German | 309 | 66.0% |
| Irish | 107 | 22.9% |
| Italian | 8 | 1.7% |
| Norwegian | 38 | 8.1% |
| Polish | 11 | 2.4% |
| Slovak | 10 | 2.1% |
| Swedish | 8 | 1.7% | View All 15 Rows |
Immigrants in Big Bay

| Immigration Origin | # Population | % Population | View All 0 Rows |
Sex and Age in Big Bay
Sex and Age in Big Bay
The most populous age groups in Big Bay are 85 Years and over (173 | 64.5%) for men and 50 to 54 Years (32 | 16.0%) for women.
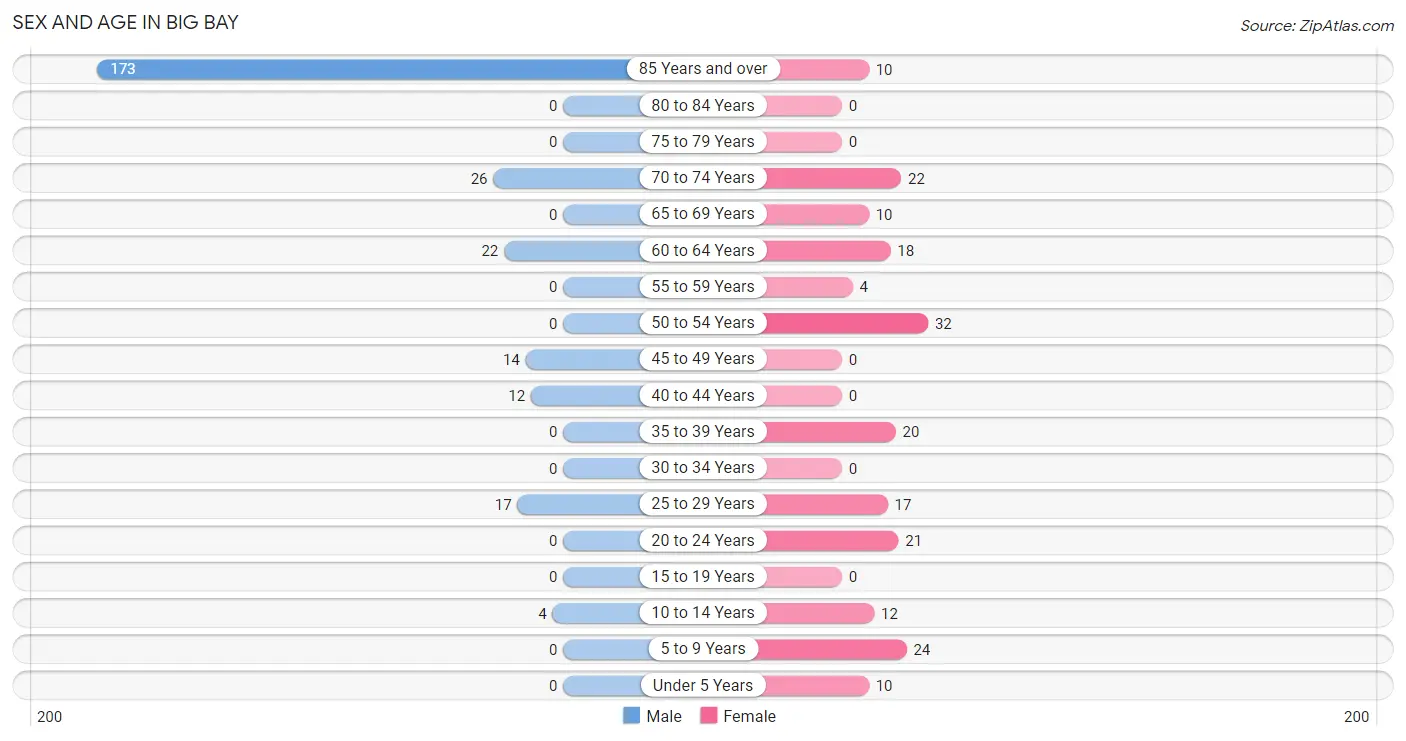
| Age Bracket | Male | Female |
| Under 5 Years | 0 (0.0%) | 10 (5.0%) |
| 5 to 9 Years | 0 (0.0%) | 24 (12.0%) |
| 10 to 14 Years | 4 (1.5%) | 12 (6.0%) |
| 15 to 19 Years | 0 (0.0%) | 0 (0.0%) |
| 20 to 24 Years | 0 (0.0%) | 21 (10.5%) |
| 25 to 29 Years | 17 (6.3%) | 17 (8.5%) |
| 30 to 34 Years | 0 (0.0%) | 0 (0.0%) |
| 35 to 39 Years | 0 (0.0%) | 20 (10.0%) |
| 40 to 44 Years | 12 (4.5%) | 0 (0.0%) |
| 45 to 49 Years | 14 (5.2%) | 0 (0.0%) |
| 50 to 54 Years | 0 (0.0%) | 32 (16.0%) |
| 55 to 59 Years | 0 (0.0%) | 4 (2.0%) |
| 60 to 64 Years | 22 (8.2%) | 18 (9.0%) |
| 65 to 69 Years | 0 (0.0%) | 10 (5.0%) |
| 70 to 74 Years | 26 (9.7%) | 22 (11.0%) |
| 75 to 79 Years | 0 (0.0%) | 0 (0.0%) |
| 80 to 84 Years | 0 (0.0%) | 0 (0.0%) |
| 85 Years and over | 173 (64.5%) | 10 (5.0%) |
| Total | 268 (100.0%) | 200 (100.0%) |
Families and Households in Big Bay
Median Family Size in Big Bay
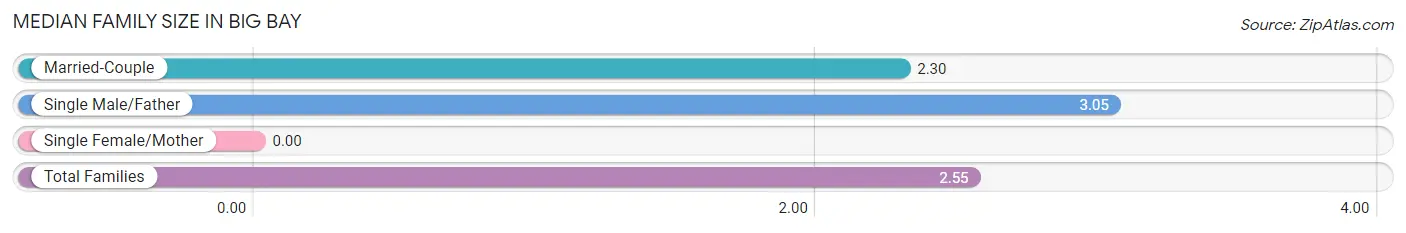
| Family Type | # Families | Family Size |
| Married-Couple | 44 (66.7%) | 2.30 |
| Single Male/Father | 22 (33.3%) | 3.05 |
| Single Female/Mother | 0 (0.0%) | - |
| Total Families | 66 (100.0%) | 2.55 |
Median Household Size in Big Bay
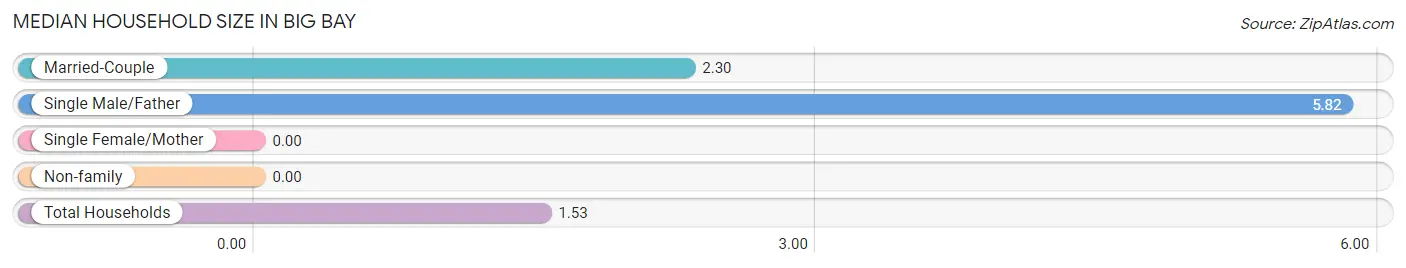
| Household Type | # Households | Household Size |
| Married-Couple | 44 (14.4%) | 2.30 |
| Single Male/Father | 22 (7.2%) | 5.82 |
| Single Female/Mother | 0 (0.0%) | - |
| Non-family | 239 (78.4%) | - |
| Total Households | 305 (100.0%) | 1.53 |
Household Size by Marriage Status in Big Bay
Out of a total of 305 households in Big Bay, 66 (21.6%) are family households, while 239 (78.4%) are nonfamily households. The most numerous type of family households are 2-person households, comprising 40, and the most common type of nonfamily households are 1-person households, comprising 239.
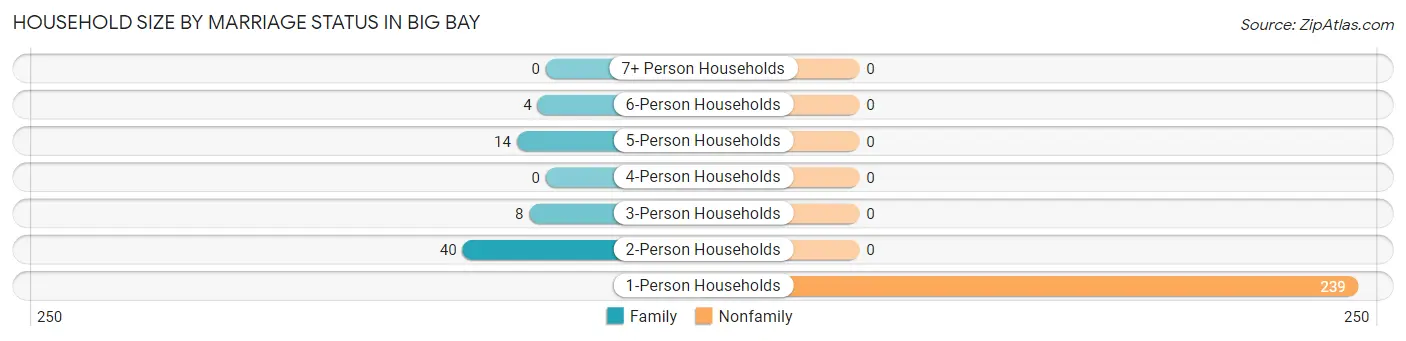
| Household Size | Family Households | Nonfamily Households |
| 1-Person Households | - | 239 (78.4%) |
| 2-Person Households | 40 (13.1%) | 0 (0.0%) |
| 3-Person Households | 8 (2.6%) | 0 (0.0%) |
| 4-Person Households | 0 (0.0%) | 0 (0.0%) |
| 5-Person Households | 14 (4.6%) | 0 (0.0%) |
| 6-Person Households | 4 (1.3%) | 0 (0.0%) |
| 7+ Person Households | 0 (0.0%) | 0 (0.0%) |
| Total | 66 (21.6%) | 239 (78.4%) |
Female Fertility in Big Bay
Fertility by Age in Big Bay
| Age Bracket | Women with Births | Births / 1,000 Women |
| 15 to 19 years | 0 (0.0%) | 0.0 |
| 20 to 34 years | 0 (0.0%) | 0.0 |
| 35 to 50 years | 0 (0.0%) | 0.0 |
| Total | 0 (0.0%) | 0.0 |
Fertility by Age by Marriage Status in Big Bay
| Age Bracket | Married | Unmarried |
| 15 to 19 years | 0 (0.0%) | 0 (0.0%) |
| 20 to 34 years | 0 (0.0%) | 0 (0.0%) |
| 35 to 50 years | 0 (0.0%) | 0 (0.0%) |
| Total | 0 (0.0%) | 0 (0.0%) |
Fertility by Education in Big Bay
| Educational Attainment | Women with Births | Births / 1,000 Women |
| Less than High School | 0 (0.0%) | 0.0 |
| High School Diploma | 0 (0.0%) | 0.0 |
| College or Associate's Degree | 0 (0.0%) | 0.0 |
| Bachelor's Degree | 0 (0.0%) | 0.0 |
| Graduate Degree | 0 (0.0%) | 0.0 |
| Total | 0 (0.0%) | 0.0 |
Fertility by Education by Marriage Status in Big Bay
| Educational Attainment | Married | Unmarried |
| Less than High School | 0 (0.0%) | 0 (0.0%) |
| High School Diploma | 0 (0.0%) | 0 (0.0%) |
| College or Associate's Degree | 0 (0.0%) | 0 (0.0%) |
| Bachelor's Degree | 0 (0.0%) | 0 (0.0%) |
| Graduate Degree | 0 (0.0%) | 0 (0.0%) |
| Total | 0 (0.0%) | 0 (0.0%) |
Employment Characteristics in Big Bay
Employment by Class of Employer in Big Bay
Among the 92 employed individuals in Big Bay, private company employees (60 | 65.2%), not-for-profit organizations (16 | 17.4%), and self-employed (not incorporated) (10 | 10.9%) make up the most common classes of employment.
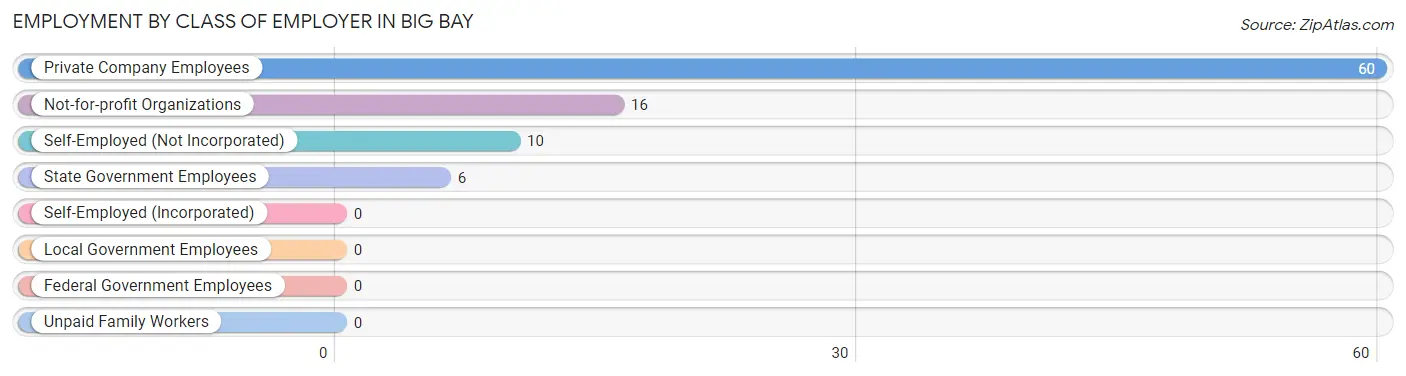
| Employer Class | # Employees | % Employees |
| Private Company Employees | 60 | 65.2% |
| Self-Employed (Incorporated) | 0 | 0.0% |
| Self-Employed (Not Incorporated) | 10 | 10.9% |
| Not-for-profit Organizations | 16 | 17.4% |
| Local Government Employees | 0 | 0.0% |
| State Government Employees | 6 | 6.5% |
| Federal Government Employees | 0 | 0.0% |
| Unpaid Family Workers | 0 | 0.0% |
| Total | 92 | 100.0% |
Employment Status by Age in Big Bay
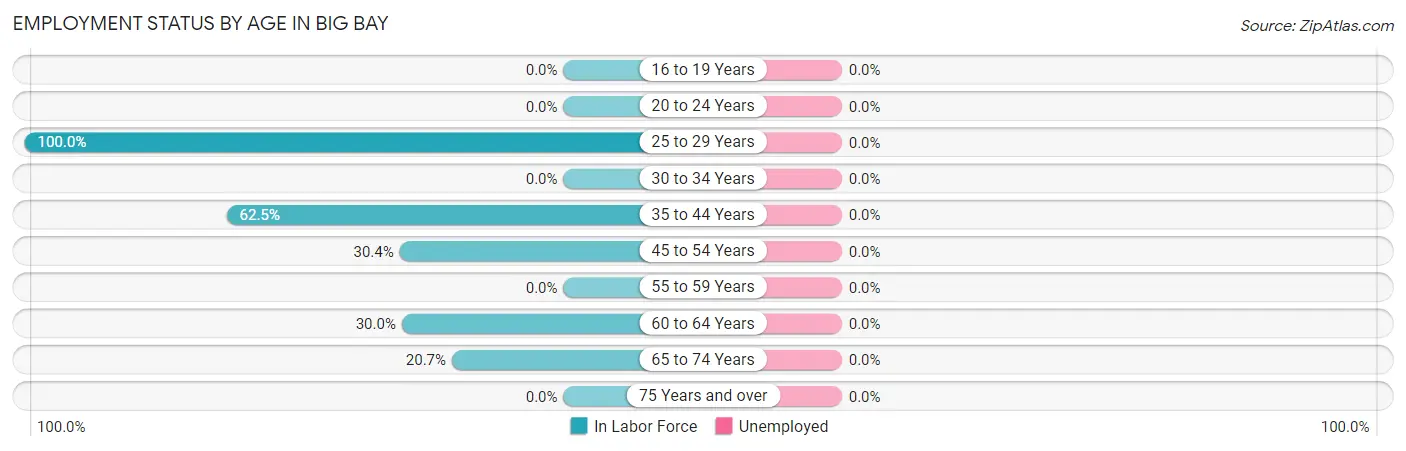
| Age Bracket | In Labor Force | Unemployed |
| 16 to 19 Years | 0 (0.0%) | 0 (0.0%) |
| 20 to 24 Years | 0 (0.0%) | 0 (0.0%) |
| 25 to 29 Years | 34 (100.0%) | 0 (0.0%) |
| 30 to 34 Years | 0 (0.0%) | 0 (0.0%) |
| 35 to 44 Years | 20 (62.5%) | 0 (0.0%) |
| 45 to 54 Years | 14 (30.4%) | 0 (0.0%) |
| 55 to 59 Years | 0 (0.0%) | 0 (0.0%) |
| 60 to 64 Years | 12 (30.0%) | 0 (0.0%) |
| 65 to 74 Years | 12 (20.7%) | 0 (0.0%) |
| 75 Years and over | 0 (0.0%) | 0 (0.0%) |
| Total | 92 (22.0%) | 0 (0.0%) |
Employment Status by Educational Attainment in Big Bay
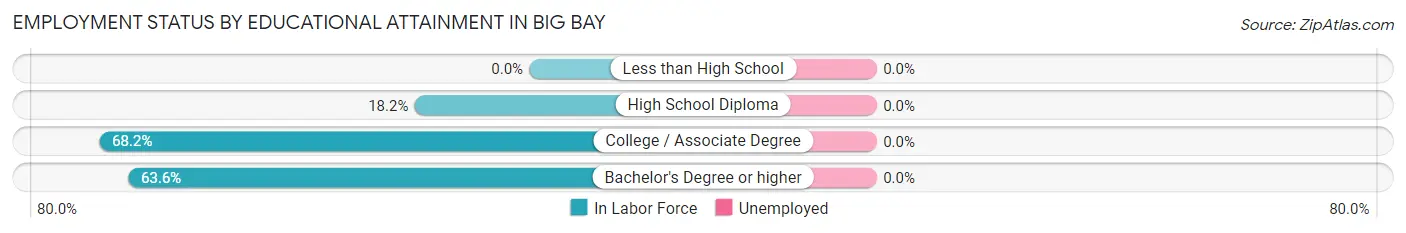
| Educational Attainment | In Labor Force | Unemployed |
| Less than High School | 0 (0.0%) | 0 (0.0%) |
| High School Diploma | 8 (18.2%) | 0 (0.0%) |
| College / Associate Degree | 58 (68.2%) | 0 (0.0%) |
| Bachelor's Degree or higher | 14 (63.6%) | 0 (0.0%) |
| Total | 80 (51.3%) | 0 (0.0%) |
Employment Occupations by Sex in Big Bay
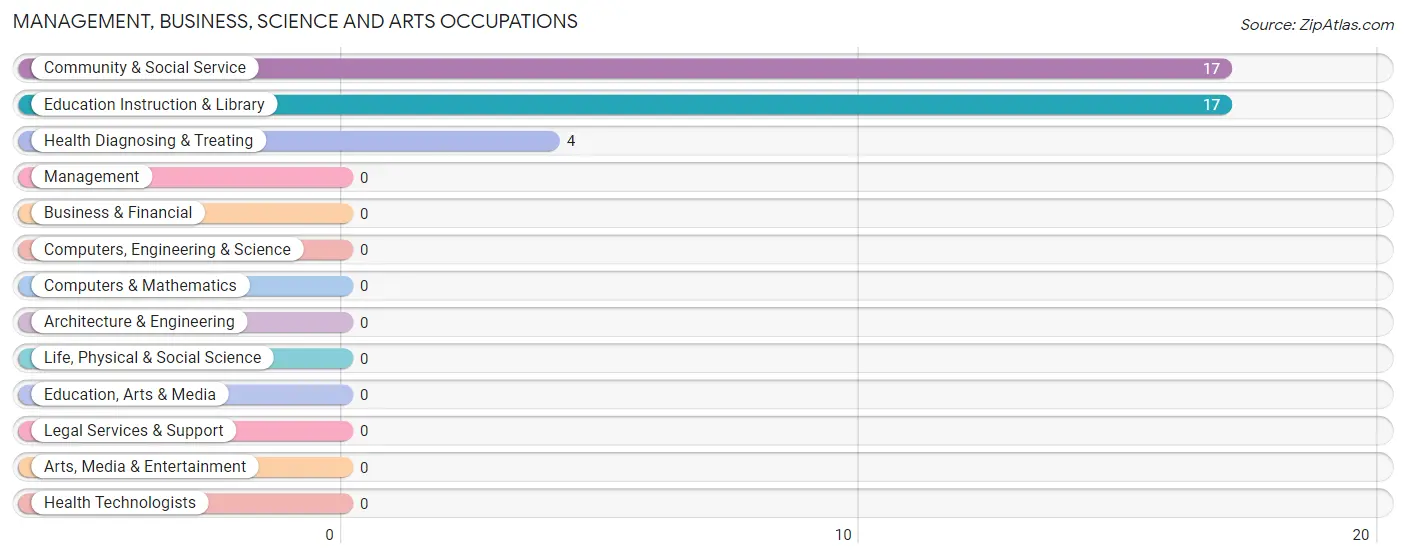
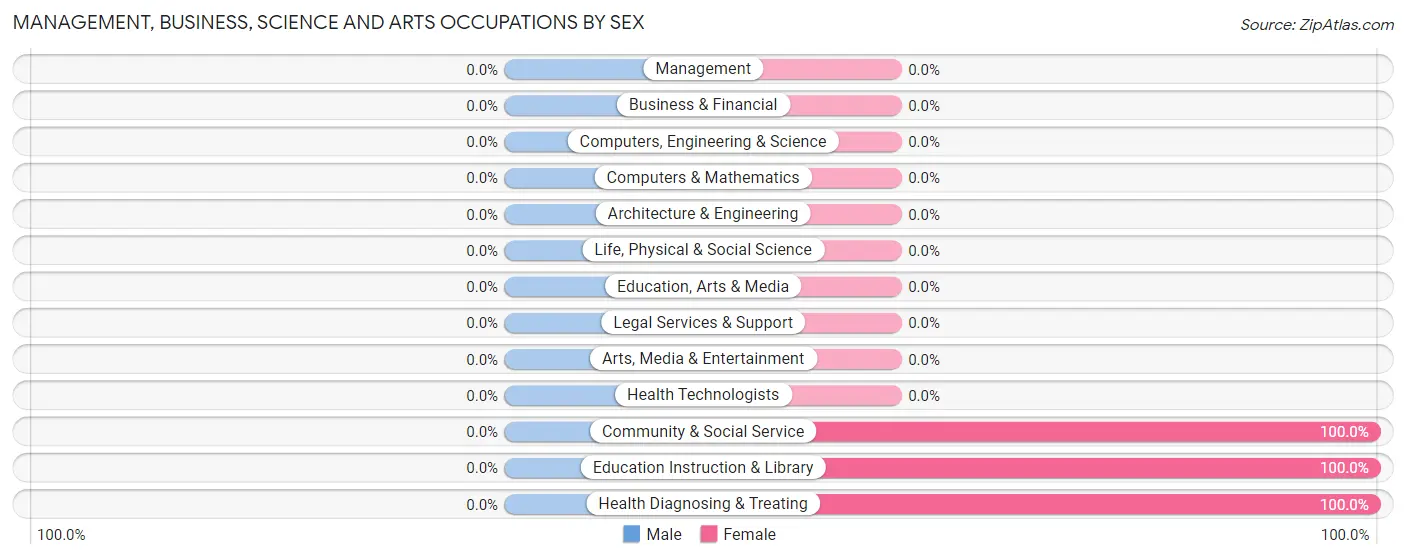
Management, Business, Science and Arts Occupations
The most common Management, Business, Science and Arts occupations in Big Bay are Community & Social Service (17 | 18.5%), Education Instruction & Library (17 | 18.5%), and Health Diagnosing & Treating (4 | 4.3%).
Management, Business, Science and Arts Occupations by Sex
| Occupation | Male | Female |
| Management | 0 (0.0%) | 0 (0.0%) |
| Business & Financial | 0 (0.0%) | 0 (0.0%) |
| Computers, Engineering & Science | 0 (0.0%) | 0 (0.0%) |
| Computers & Mathematics | 0 (0.0%) | 0 (0.0%) |
| Architecture & Engineering | 0 (0.0%) | 0 (0.0%) |
| Life, Physical & Social Science | 0 (0.0%) | 0 (0.0%) |
| Community & Social Service | 0 (0.0%) | 17 (100.0%) |
| Education, Arts & Media | 0 (0.0%) | 0 (0.0%) |
| Legal Services & Support | 0 (0.0%) | 0 (0.0%) |
| Education Instruction & Library | 0 (0.0%) | 17 (100.0%) |
| Arts, Media & Entertainment | 0 (0.0%) | 0 (0.0%) |
| Health Diagnosing & Treating | 0 (0.0%) | 4 (100.0%) |
| Health Technologists | 0 (0.0%) | 0 (0.0%) |
| Total (Category) | 0 (0.0%) | 21 (100.0%) |
| Total (Overall) | 43 (46.7%) | 49 (53.3%) |
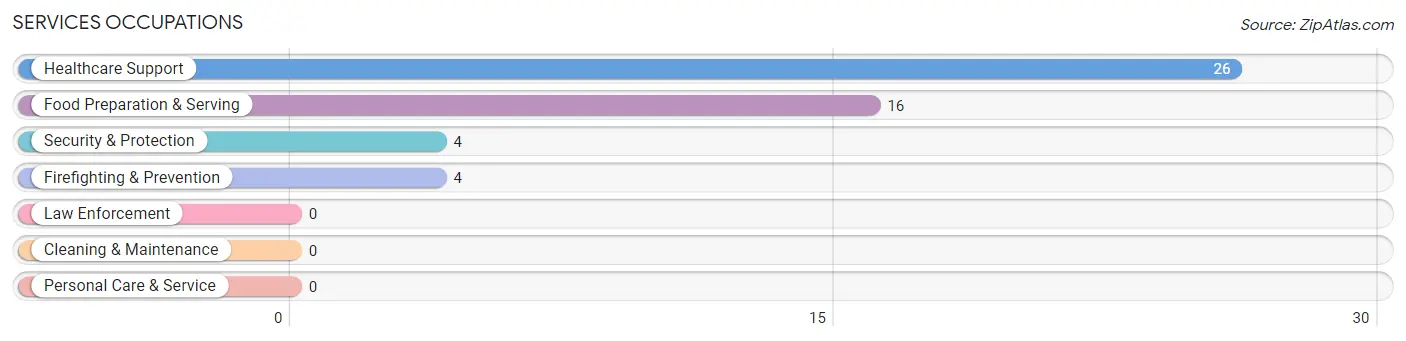
Services Occupations
The most common Services occupations in Big Bay are Healthcare Support (26 | 28.3%), Food Preparation & Serving (16 | 17.4%), Security & Protection (4 | 4.3%), and Firefighting & Prevention (4 | 4.3%).
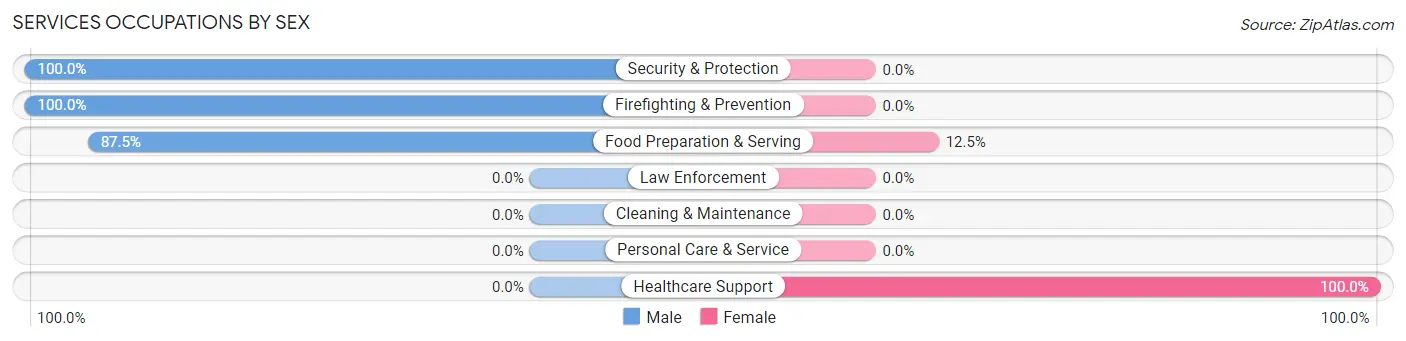
Services Occupations by Sex
Within the Services occupations in Big Bay, the most male-oriented occupations are Security & Protection (100.0%), Firefighting & Prevention (100.0%), and Food Preparation & Serving (87.5%), while the most female-oriented occupations are Healthcare Support (100.0%), and Food Preparation & Serving (12.5%).
| Occupation | Male | Female |
| Healthcare Support | 0 (0.0%) | 26 (100.0%) |
| Security & Protection | 4 (100.0%) | 0 (0.0%) |
| Firefighting & Prevention | 4 (100.0%) | 0 (0.0%) |
| Law Enforcement | 0 (0.0%) | 0 (0.0%) |
| Food Preparation & Serving | 14 (87.5%) | 2 (12.5%) |
| Cleaning & Maintenance | 0 (0.0%) | 0 (0.0%) |
| Personal Care & Service | 0 (0.0%) | 0 (0.0%) |
| Total (Category) | 18 (39.1%) | 28 (60.9%) |
| Total (Overall) | 43 (46.7%) | 49 (53.3%) |
Sales and Office Occupations
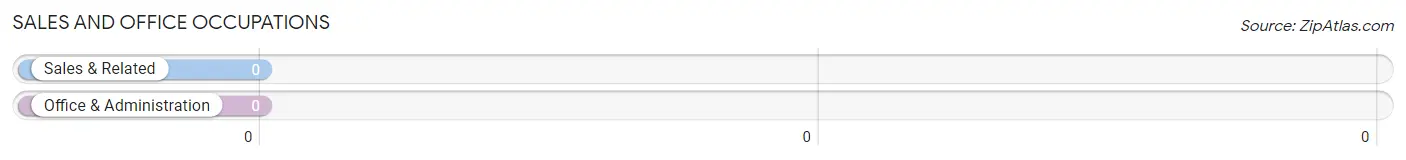
Sales and Office Occupations by Sex
| Occupation | Male | Female |
| Sales & Related | 0 (0.0%) | 0 (0.0%) |
| Office & Administration | 0 (0.0%) | 0 (0.0%) |
| Total (Category) | 0 (0.0%) | 0 (0.0%) |
| Total (Overall) | 43 (46.7%) | 49 (53.3%) |
Natural Resources, Construction and Maintenance Occupations
The most common Natural Resources, Construction and Maintenance occupations in Big Bay are , and Construction & Extraction (25 | 27.2%).
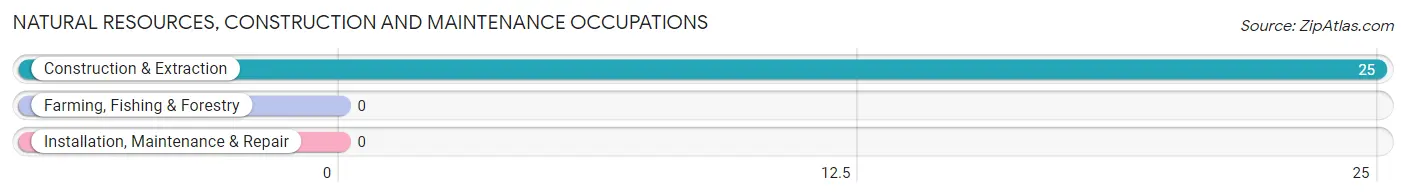
Natural Resources, Construction and Maintenance Occupations by Sex
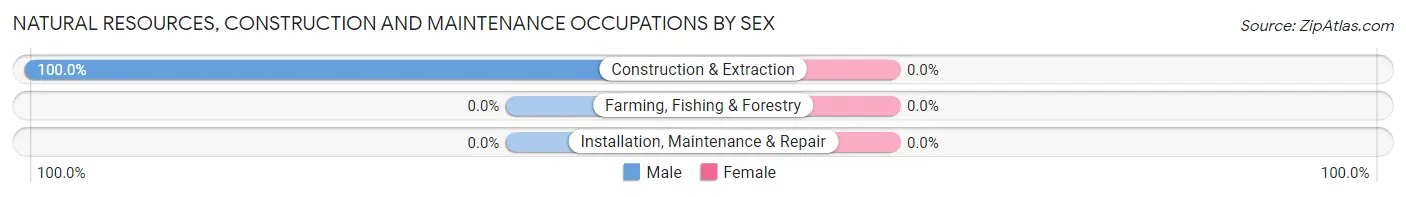
| Occupation | Male | Female |
| Farming, Fishing & Forestry | 0 (0.0%) | 0 (0.0%) |
| Construction & Extraction | 25 (100.0%) | 0 (0.0%) |
| Installation, Maintenance & Repair | 0 (0.0%) | 0 (0.0%) |
| Total (Category) | 25 (100.0%) | 0 (0.0%) |
| Total (Overall) | 43 (46.7%) | 49 (53.3%) |
Production, Transportation and Moving Occupations
Production, Transportation and Moving Occupations by Sex
| Occupation | Male | Female |
| Production | 0 (0.0%) | 0 (0.0%) |
| Transportation | 0 (0.0%) | 0 (0.0%) |
| Material Moving | 0 (0.0%) | 0 (0.0%) |
| Total (Category) | 0 (0.0%) | 0 (0.0%) |
| Total (Overall) | 43 (46.7%) | 49 (53.3%) |
Employment Industries by Sex in Big Bay
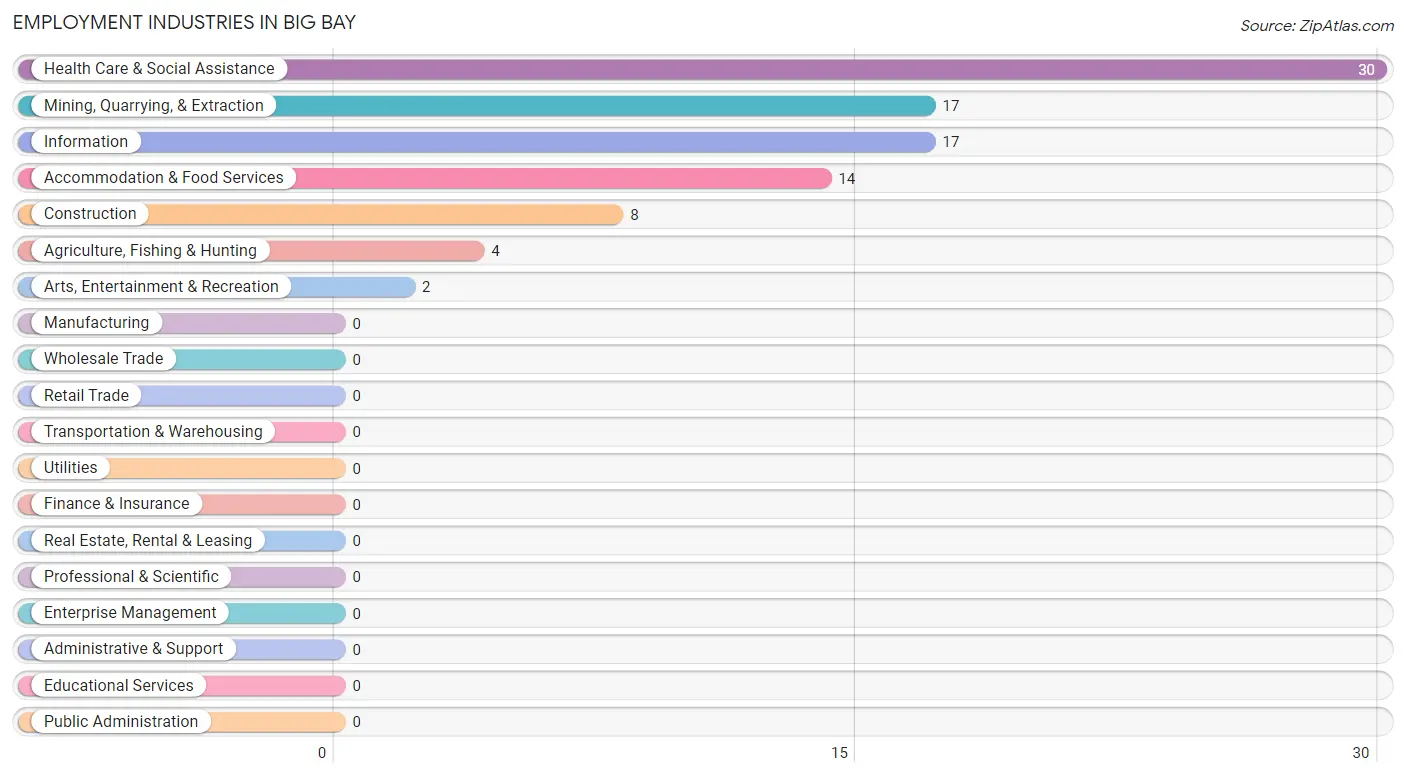
Employment Industries in Big Bay
The major employment industries in Big Bay include Health Care & Social Assistance (30 | 32.6%), Mining, Quarrying, & Extraction (17 | 18.5%), Information (17 | 18.5%), Accommodation & Food Services (14 | 15.2%), and Construction (8 | 8.7%).
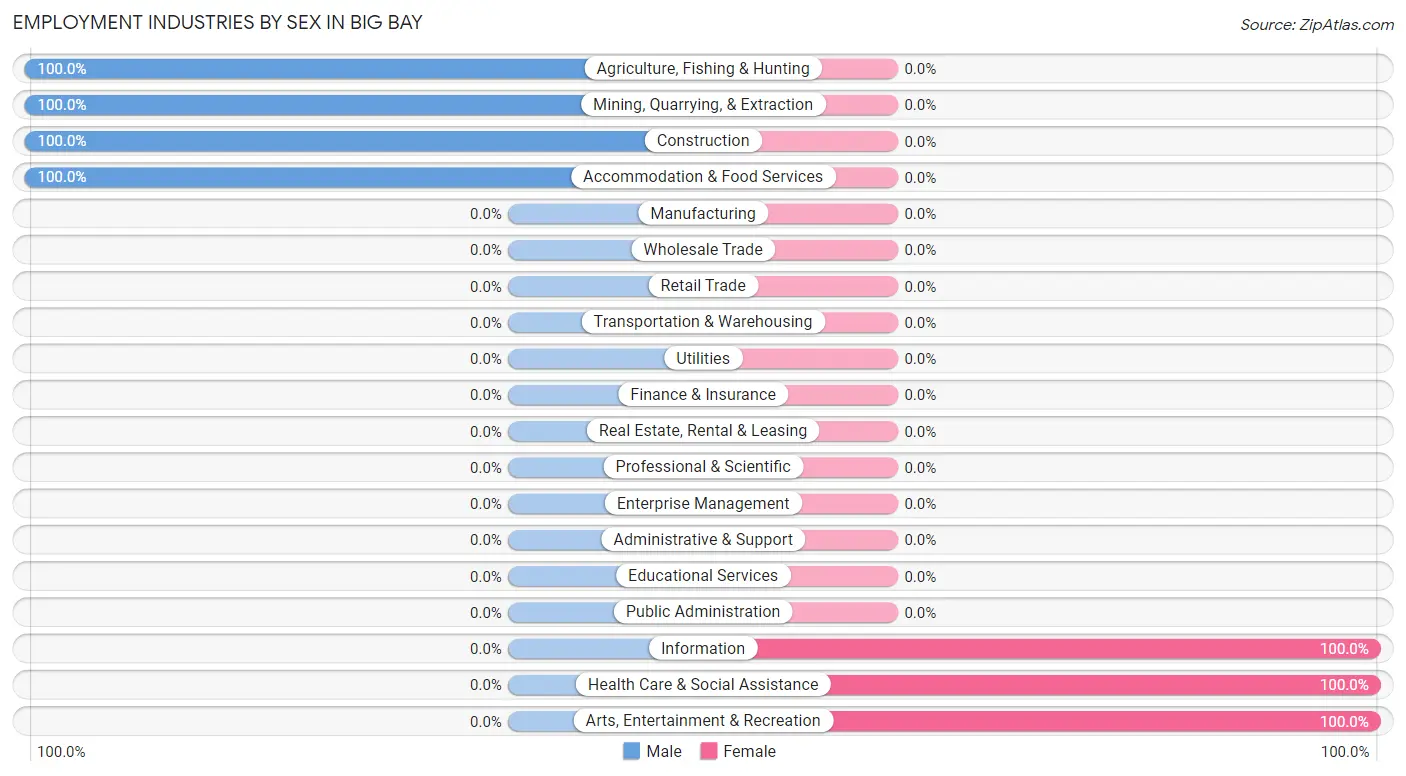
Employment Industries by Sex in Big Bay
The Big Bay industries that see more men than women are Agriculture, Fishing & Hunting (100.0%), Mining, Quarrying, & Extraction (100.0%), and Construction (100.0%), whereas the industries that tend to have a higher number of women are Information (100.0%), Health Care & Social Assistance (100.0%), and Arts, Entertainment & Recreation (100.0%).
| Industry | Male | Female |
| Agriculture, Fishing & Hunting | 4 (100.0%) | 0 (0.0%) |
| Mining, Quarrying, & Extraction | 17 (100.0%) | 0 (0.0%) |
| Construction | 8 (100.0%) | 0 (0.0%) |
| Manufacturing | 0 (0.0%) | 0 (0.0%) |
| Wholesale Trade | 0 (0.0%) | 0 (0.0%) |
| Retail Trade | 0 (0.0%) | 0 (0.0%) |
| Transportation & Warehousing | 0 (0.0%) | 0 (0.0%) |
| Utilities | 0 (0.0%) | 0 (0.0%) |
| Information | 0 (0.0%) | 17 (100.0%) |
| Finance & Insurance | 0 (0.0%) | 0 (0.0%) |
| Real Estate, Rental & Leasing | 0 (0.0%) | 0 (0.0%) |
| Professional & Scientific | 0 (0.0%) | 0 (0.0%) |
| Enterprise Management | 0 (0.0%) | 0 (0.0%) |
| Administrative & Support | 0 (0.0%) | 0 (0.0%) |
| Educational Services | 0 (0.0%) | 0 (0.0%) |
| Health Care & Social Assistance | 0 (0.0%) | 30 (100.0%) |
| Arts, Entertainment & Recreation | 0 (0.0%) | 2 (100.0%) |
| Accommodation & Food Services | 14 (100.0%) | 0 (0.0%) |
| Public Administration | 0 (0.0%) | 0 (0.0%) |
| Total | 43 (46.7%) | 49 (53.3%) |
Education in Big Bay
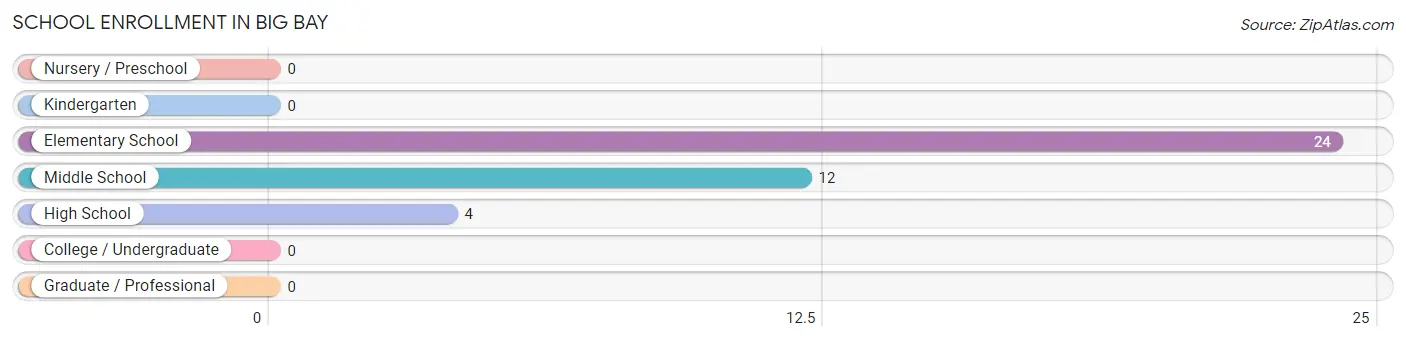
School Enrollment in Big Bay
The most common levels of schooling among the 40 students in Big Bay are elementary school (24 | 60.0%), middle school (12 | 30.0%), and high school (4 | 10.0%).
| School Level | # Students | % Students |
| Nursery / Preschool | 0 | 0.0% |
| Kindergarten | 0 | 0.0% |
| Elementary School | 24 | 60.0% |
| Middle School | 12 | 30.0% |
| High School | 4 | 10.0% |
| College / Undergraduate | 0 | 0.0% |
| Graduate / Professional | 0 | 0.0% |
| Total | 40 | 100.0% |
School Enrollment by Age by Funding Source in Big Bay
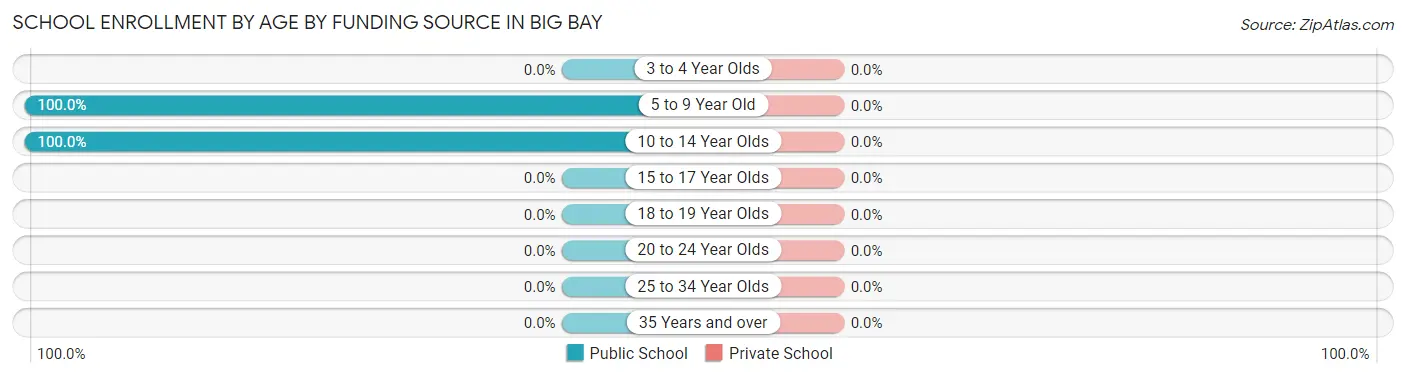
| Age Bracket | Public School | Private School |
| 3 to 4 Year Olds | 0 (0.0%) | 0 (0.0%) |
| 5 to 9 Year Old | 24 (100.0%) | 0 (0.0%) |
| 10 to 14 Year Olds | 16 (100.0%) | 0 (0.0%) |
| 15 to 17 Year Olds | 0 (0.0%) | 0 (0.0%) |
| 18 to 19 Year Olds | 0 (0.0%) | 0 (0.0%) |
| 20 to 24 Year Olds | 0 (0.0%) | 0 (0.0%) |
| 25 to 34 Year Olds | 0 (0.0%) | 0 (0.0%) |
| 35 Years and over | 0 (0.0%) | 0 (0.0%) |
| Total | 40 (100.0%) | 0 (0.0%) |
Educational Attainment by Field of Study in Big Bay
Bio, nature & agricultural (20 | 20.0%), social sciences (20 | 20.0%), arts & humanities (16 | 16.0%), liberal arts & history (14 | 14.0%), and computers & mathematics (10 | 10.0%) are the most common fields of study among 100 individuals in Big Bay who have obtained a bachelor's degree or higher.
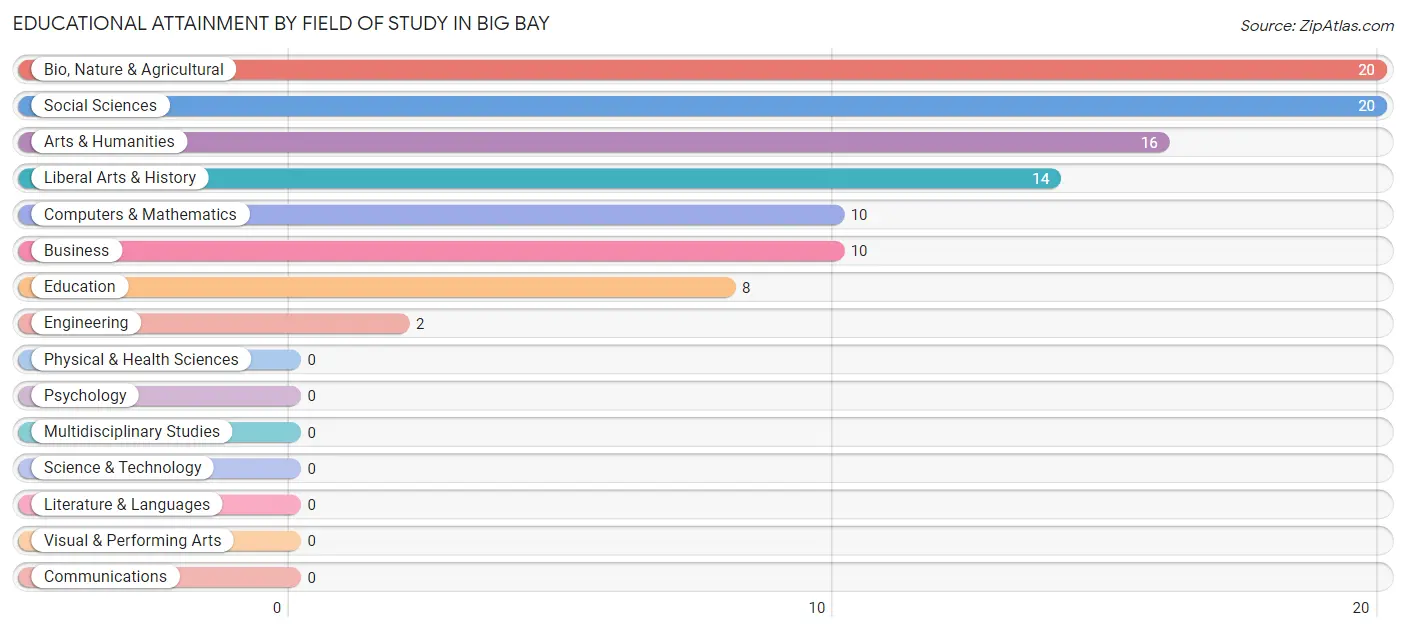
| Field of Study | # Graduates | % Graduates |
| Computers & Mathematics | 10 | 10.0% |
| Bio, Nature & Agricultural | 20 | 20.0% |
| Physical & Health Sciences | 0 | 0.0% |
| Psychology | 0 | 0.0% |
| Social Sciences | 20 | 20.0% |
| Engineering | 2 | 2.0% |
| Multidisciplinary Studies | 0 | 0.0% |
| Science & Technology | 0 | 0.0% |
| Business | 10 | 10.0% |
| Education | 8 | 8.0% |
| Literature & Languages | 0 | 0.0% |
| Liberal Arts & History | 14 | 14.0% |
| Visual & Performing Arts | 0 | 0.0% |
| Communications | 0 | 0.0% |
| Arts & Humanities | 16 | 16.0% |
| Total | 100 | 100.0% |
Transportation & Commute in Big Bay
Vehicle Availability by Sex in Big Bay
The most prevalent vehicle ownership categories in Big Bay are males with 4 vehicles (18, accounting for 41.9%) and females with 4 vehicles (17, making up 36.7%).
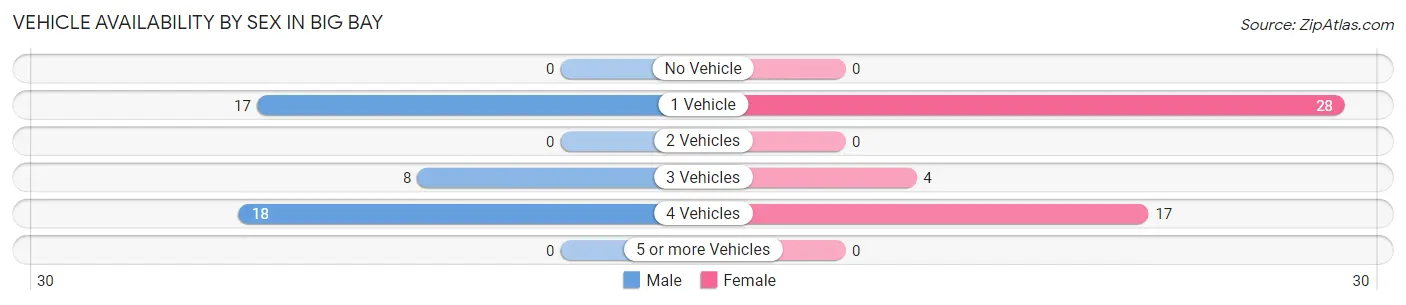
| Vehicles Available | Male | Female |
| No Vehicle | 0 (0.0%) | 0 (0.0%) |
| 1 Vehicle | 17 (39.5%) | 28 (57.1%) |
| 2 Vehicles | 0 (0.0%) | 0 (0.0%) |
| 3 Vehicles | 8 (18.6%) | 4 (8.2%) |
| 4 Vehicles | 18 (41.9%) | 17 (34.7%) |
| 5 or more Vehicles | 0 (0.0%) | 0 (0.0%) |
| Total | 43 (100.0%) | 49 (100.0%) |
Commute Time in Big Bay
The most frequently occuring commute durations in Big Bay are 5 to 9 minutes (33 commuters, 35.9%), 20 to 24 minutes (17 commuters, 18.5%), and 40 to 44 minutes (16 commuters, 17.4%).
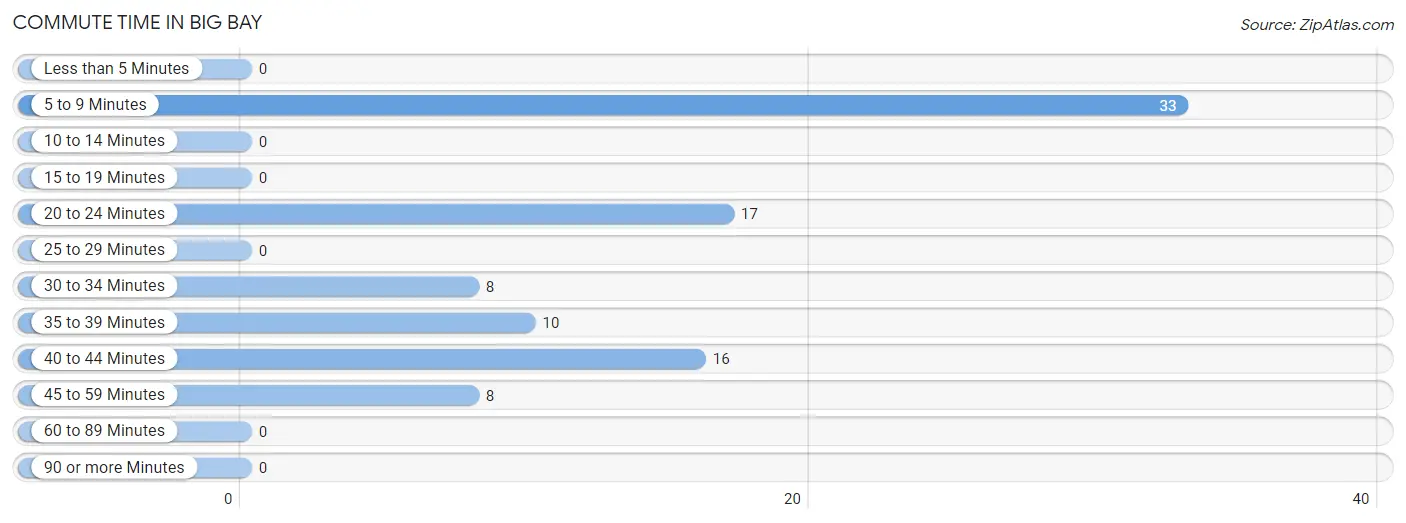
| Commute Time | # Commuters | % Commuters |
| Less than 5 Minutes | 0 | 0.0% |
| 5 to 9 Minutes | 33 | 35.9% |
| 10 to 14 Minutes | 0 | 0.0% |
| 15 to 19 Minutes | 0 | 0.0% |
| 20 to 24 Minutes | 17 | 18.5% |
| 25 to 29 Minutes | 0 | 0.0% |
| 30 to 34 Minutes | 8 | 8.7% |
| 35 to 39 Minutes | 10 | 10.9% |
| 40 to 44 Minutes | 16 | 17.4% |
| 45 to 59 Minutes | 8 | 8.7% |
| 60 to 89 Minutes | 0 | 0.0% |
| 90 or more Minutes | 0 | 0.0% |
Commute Time by Sex in Big Bay
The most common commute times in Big Bay are 20 to 24 minutes (17 commuters, 39.5%) for males and 5 to 9 minutes (19 commuters, 38.8%) for females.
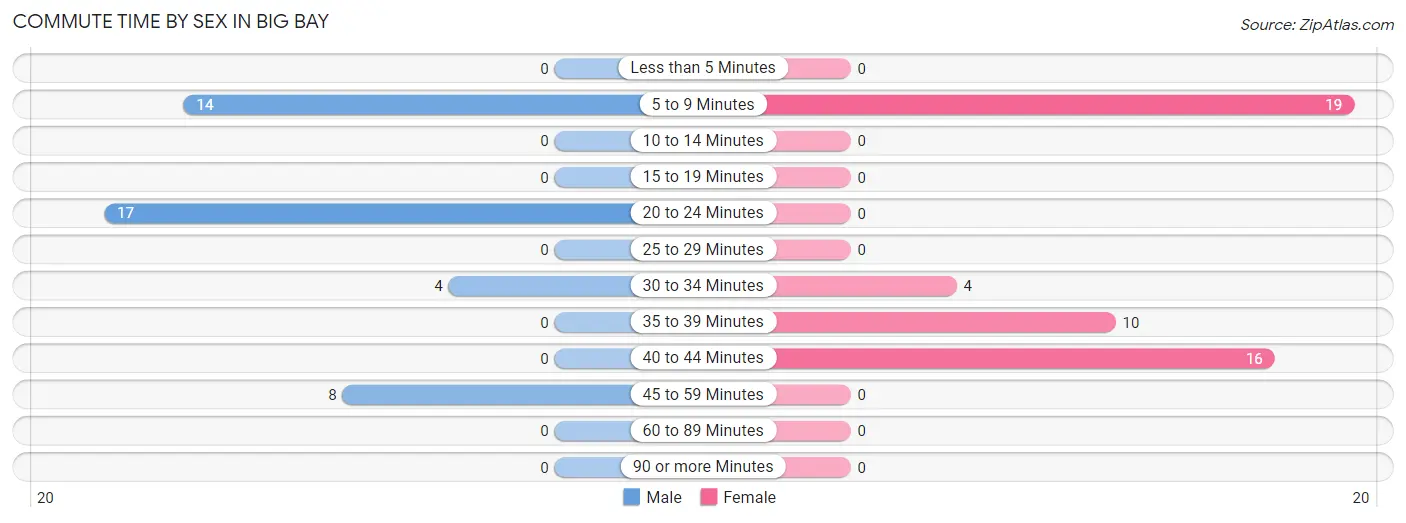
| Commute Time | Male | Female |
| Less than 5 Minutes | 0 (0.0%) | 0 (0.0%) |
| 5 to 9 Minutes | 14 (32.6%) | 19 (38.8%) |
| 10 to 14 Minutes | 0 (0.0%) | 0 (0.0%) |
| 15 to 19 Minutes | 0 (0.0%) | 0 (0.0%) |
| 20 to 24 Minutes | 17 (39.5%) | 0 (0.0%) |
| 25 to 29 Minutes | 0 (0.0%) | 0 (0.0%) |
| 30 to 34 Minutes | 4 (9.3%) | 4 (8.2%) |
| 35 to 39 Minutes | 0 (0.0%) | 10 (20.4%) |
| 40 to 44 Minutes | 0 (0.0%) | 16 (32.7%) |
| 45 to 59 Minutes | 8 (18.6%) | 0 (0.0%) |
| 60 to 89 Minutes | 0 (0.0%) | 0 (0.0%) |
| 90 or more Minutes | 0 (0.0%) | 0 (0.0%) |
Time of Departure to Work by Sex in Big Bay
The most frequent times of departure to work in Big Bay are 4:00 PM to 11:59 PM (17, 39.5%) for males and 12:00 PM to 3:59 PM (33, 67.3%) for females.
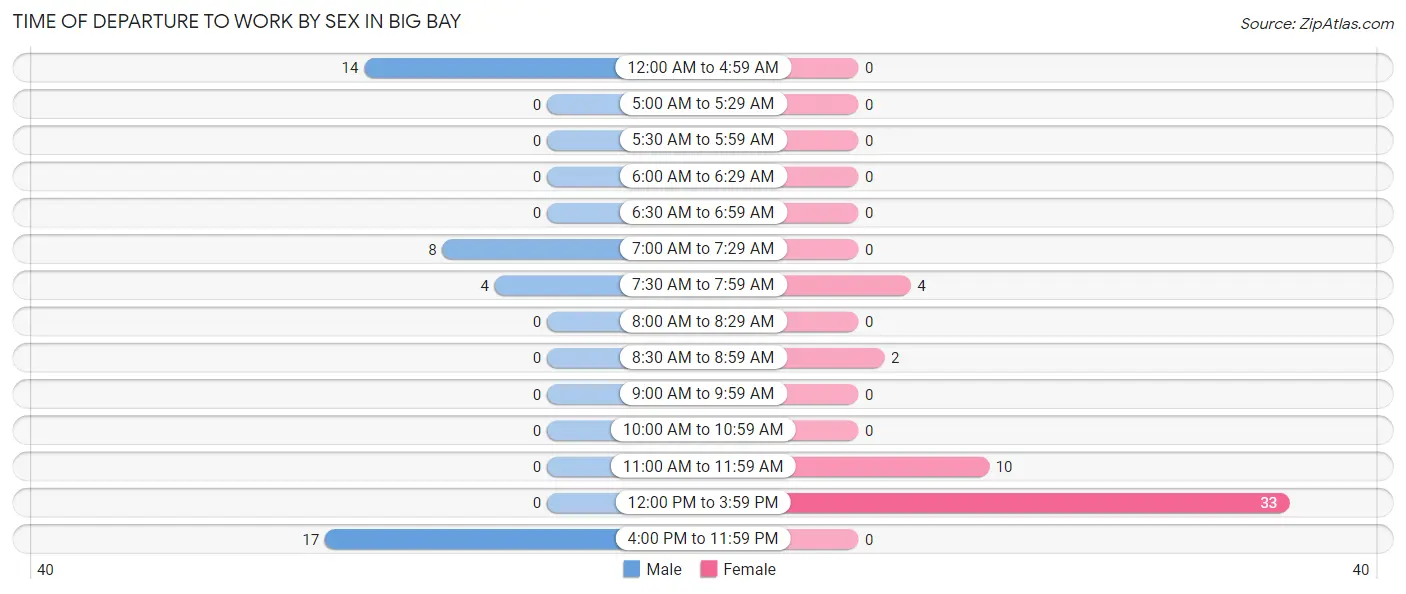
| Time of Departure | Male | Female |
| 12:00 AM to 4:59 AM | 14 (32.6%) | 0 (0.0%) |
| 5:00 AM to 5:29 AM | 0 (0.0%) | 0 (0.0%) |
| 5:30 AM to 5:59 AM | 0 (0.0%) | 0 (0.0%) |
| 6:00 AM to 6:29 AM | 0 (0.0%) | 0 (0.0%) |
| 6:30 AM to 6:59 AM | 0 (0.0%) | 0 (0.0%) |
| 7:00 AM to 7:29 AM | 8 (18.6%) | 0 (0.0%) |
| 7:30 AM to 7:59 AM | 4 (9.3%) | 4 (8.2%) |
| 8:00 AM to 8:29 AM | 0 (0.0%) | 0 (0.0%) |
| 8:30 AM to 8:59 AM | 0 (0.0%) | 2 (4.1%) |
| 9:00 AM to 9:59 AM | 0 (0.0%) | 0 (0.0%) |
| 10:00 AM to 10:59 AM | 0 (0.0%) | 0 (0.0%) |
| 11:00 AM to 11:59 AM | 0 (0.0%) | 10 (20.4%) |
| 12:00 PM to 3:59 PM | 0 (0.0%) | 33 (67.3%) |
| 4:00 PM to 11:59 PM | 17 (39.5%) | 0 (0.0%) |
| Total | 43 (100.0%) | 49 (100.0%) |
Housing Occupancy in Big Bay
Occupancy by Ownership in Big Bay
Of the total 305 dwellings in Big Bay, owner-occupied units account for 267 (87.5%), while renter-occupied units make up 38 (12.5%).
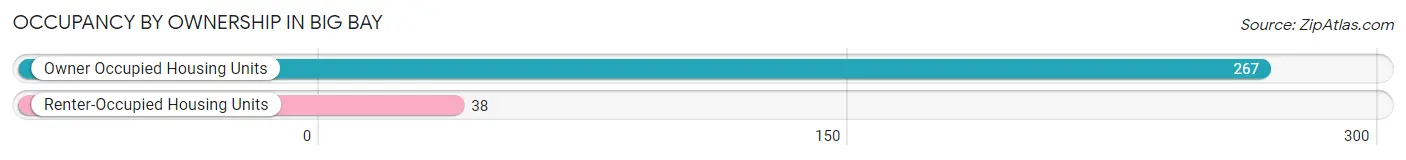
| Occupancy | # Housing Units | % Housing Units |
| Owner Occupied Housing Units | 267 | 87.5% |
| Renter-Occupied Housing Units | 38 | 12.5% |
| Total Occupied Housing Units | 305 | 100.0% |
Occupancy by Household Size in Big Bay
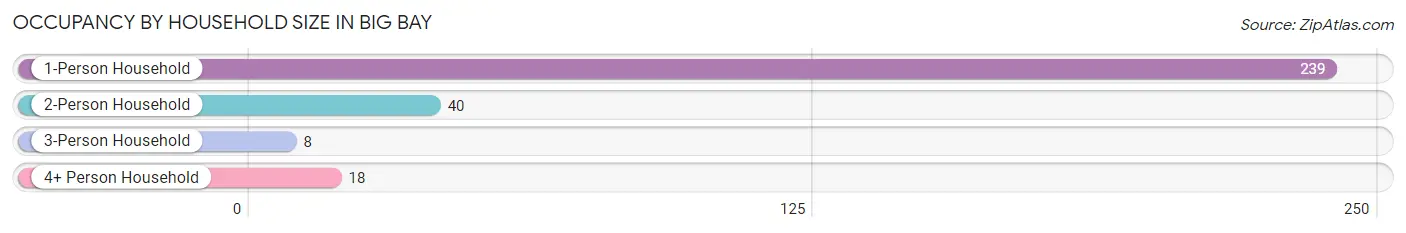
| Household Size | # Housing Units | % Housing Units |
| 1-Person Household | 239 | 78.4% |
| 2-Person Household | 40 | 13.1% |
| 3-Person Household | 8 | 2.6% |
| 4+ Person Household | 18 | 5.9% |
| Total Housing Units | 305 | 100.0% |
Occupancy by Ownership by Household Size in Big Bay
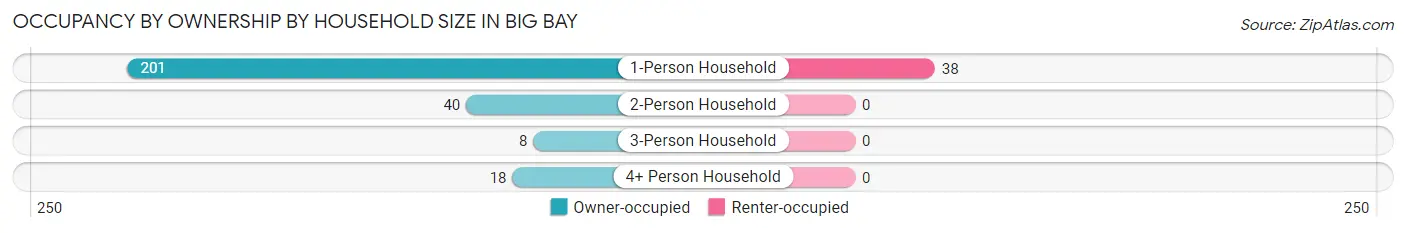
| Household Size | Owner-occupied | Renter-occupied |
| 1-Person Household | 201 (84.1%) | 38 (15.9%) |
| 2-Person Household | 40 (100.0%) | 0 (0.0%) |
| 3-Person Household | 8 (100.0%) | 0 (0.0%) |
| 4+ Person Household | 18 (100.0%) | 0 (0.0%) |
| Total Housing Units | 267 (87.5%) | 38 (12.5%) |
Occupancy by Educational Attainment in Big Bay
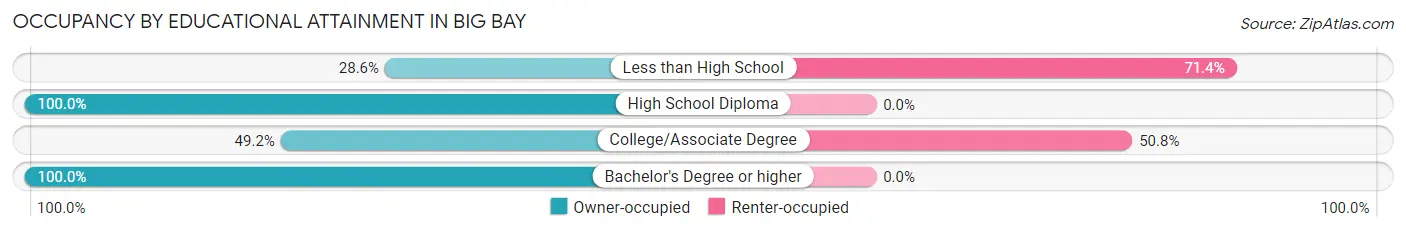
| Household Size | Owner-occupied | Renter-occupied |
| Less than High School | 2 (28.6%) | 5 (71.4%) |
| High School Diploma | 179 (100.0%) | 0 (0.0%) |
| College/Associate Degree | 32 (49.2%) | 33 (50.8%) |
| Bachelor's Degree or higher | 54 (100.0%) | 0 (0.0%) |
Occupancy by Age of Householder in Big Bay
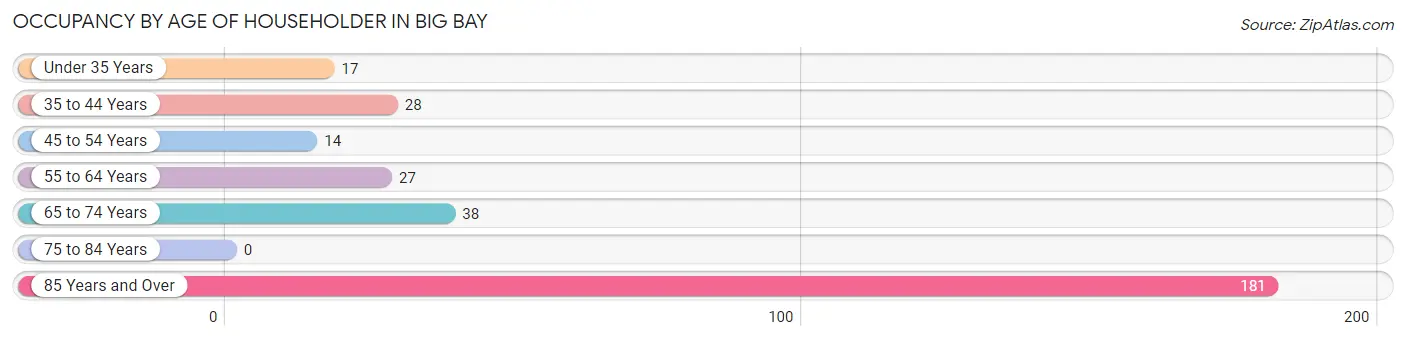
| Age Bracket | # Households | % Households |
| Under 35 Years | 17 | 5.6% |
| 35 to 44 Years | 28 | 9.2% |
| 45 to 54 Years | 14 | 4.6% |
| 55 to 64 Years | 27 | 8.8% |
| 65 to 74 Years | 38 | 12.5% |
| 75 to 84 Years | 0 | 0.0% |
| 85 Years and Over | 181 | 59.3% |
| Total | 305 | 100.0% |
Housing Finances in Big Bay
Median Income by Occupancy in Big Bay
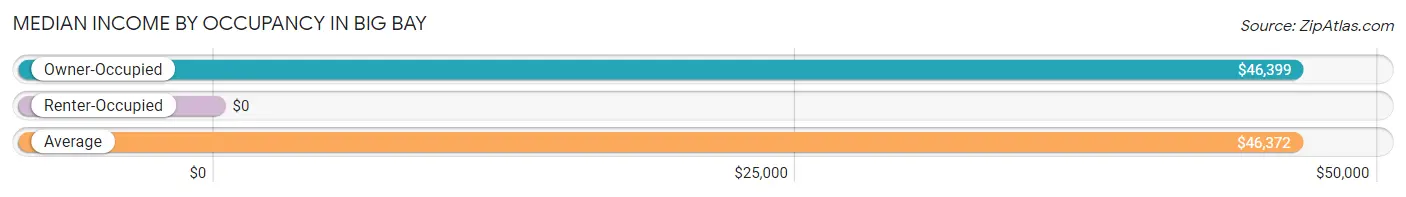
| Occupancy Type | # Households | Median Income |
| Owner-Occupied | 267 (87.5%) | $46,399 |
| Renter-Occupied | 38 (12.5%) | $0 |
| Average | 305 (100.0%) | $46,372 |
Occupancy by Householder Income Bracket in Big Bay
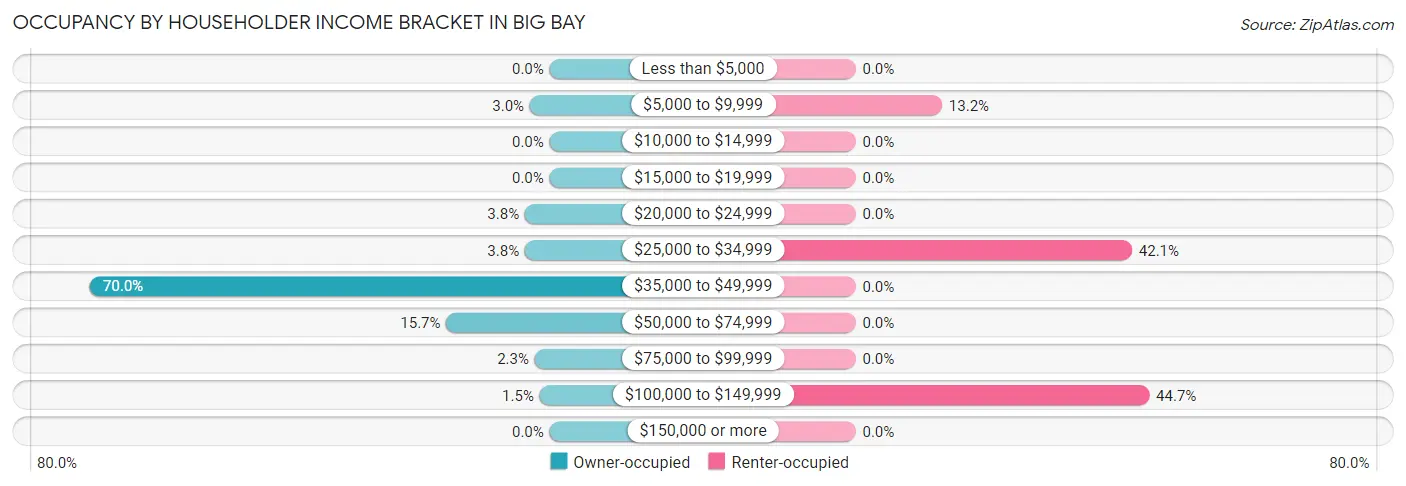
| Income Bracket | Owner-occupied | Renter-occupied |
| Less than $5,000 | 0 (0.0%) | 0 (0.0%) |
| $5,000 to $9,999 | 8 (3.0%) | 5 (13.2%) |
| $10,000 to $14,999 | 0 (0.0%) | 0 (0.0%) |
| $15,000 to $19,999 | 0 (0.0%) | 0 (0.0%) |
| $20,000 to $24,999 | 10 (3.7%) | 0 (0.0%) |
| $25,000 to $34,999 | 10 (3.7%) | 16 (42.1%) |
| $35,000 to $49,999 | 187 (70.0%) | 0 (0.0%) |
| $50,000 to $74,999 | 42 (15.7%) | 0 (0.0%) |
| $75,000 to $99,999 | 6 (2.2%) | 0 (0.0%) |
| $100,000 to $149,999 | 4 (1.5%) | 17 (44.7%) |
| $150,000 or more | 0 (0.0%) | 0 (0.0%) |
| Total | 267 (100.0%) | 38 (100.0%) |
Monthly Housing Cost Tiers in Big Bay
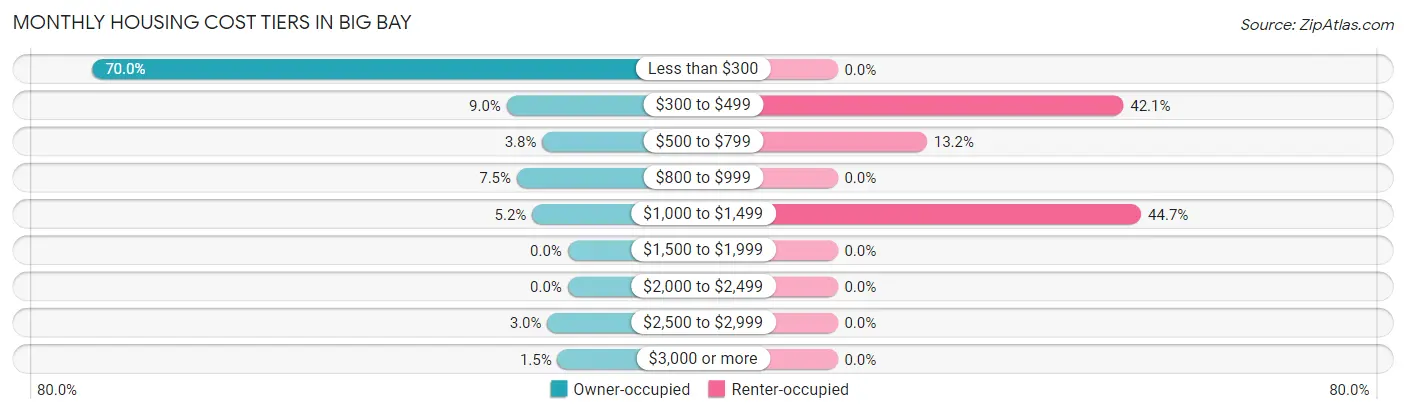
| Monthly Cost | Owner-occupied | Renter-occupied |
| Less than $300 | 187 (70.0%) | 0 (0.0%) |
| $300 to $499 | 24 (9.0%) | 16 (42.1%) |
| $500 to $799 | 10 (3.7%) | 5 (13.2%) |
| $800 to $999 | 20 (7.5%) | 0 (0.0%) |
| $1,000 to $1,499 | 14 (5.2%) | 17 (44.7%) |
| $1,500 to $1,999 | 0 (0.0%) | 0 (0.0%) |
| $2,000 to $2,499 | 0 (0.0%) | 0 (0.0%) |
| $2,500 to $2,999 | 8 (3.0%) | 0 (0.0%) |
| $3,000 or more | 4 (1.5%) | 0 (0.0%) |
| Total | 267 (100.0%) | 38 (100.0%) |
Physical Housing Characteristics in Big Bay
Housing Structures in Big Bay
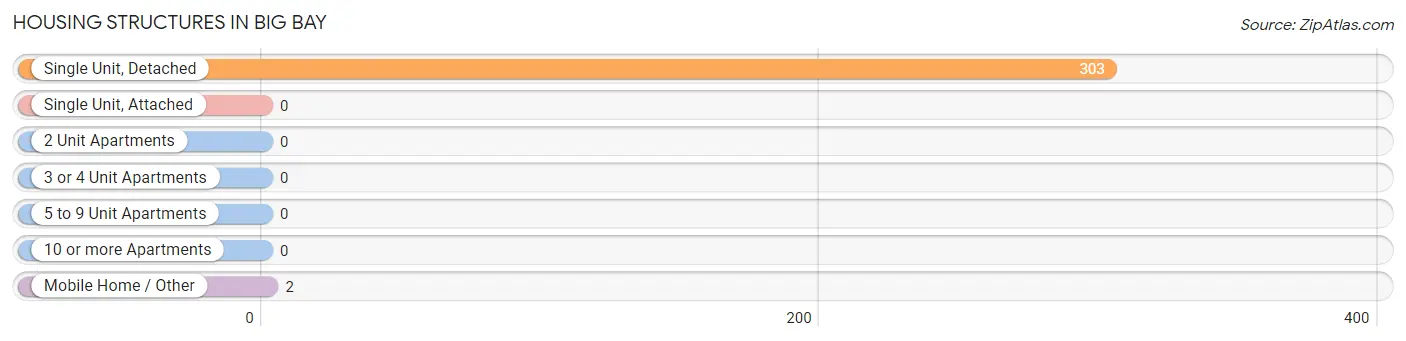
| Structure Type | # Housing Units | % Housing Units |
| Single Unit, Detached | 303 | 99.3% |
| Single Unit, Attached | 0 | 0.0% |
| 2 Unit Apartments | 0 | 0.0% |
| 3 or 4 Unit Apartments | 0 | 0.0% |
| 5 to 9 Unit Apartments | 0 | 0.0% |
| 10 or more Apartments | 0 | 0.0% |
| Mobile Home / Other | 2 | 0.7% |
| Total | 305 | 100.0% |
Housing Structures by Occupancy in Big Bay
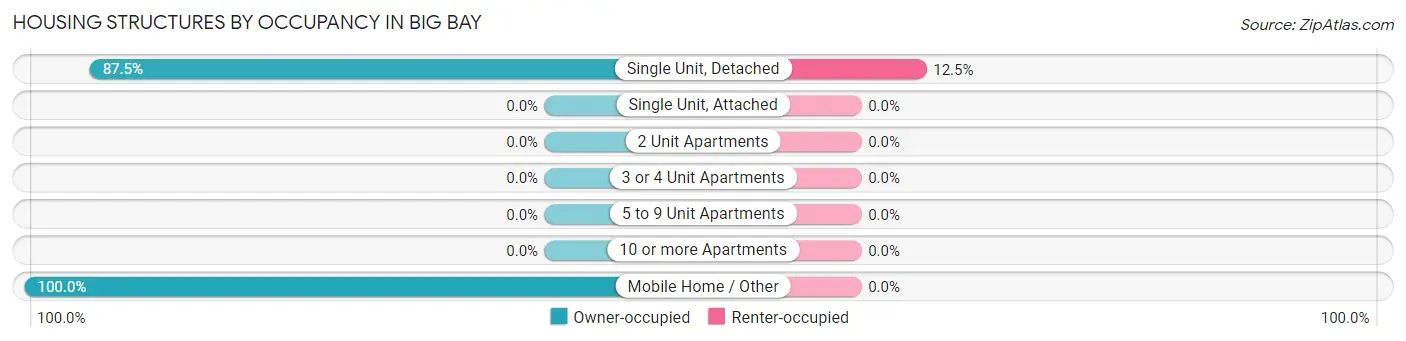
| Structure Type | Owner-occupied | Renter-occupied |
| Single Unit, Detached | 265 (87.5%) | 38 (12.5%) |
| Single Unit, Attached | 0 (0.0%) | 0 (0.0%) |
| 2 Unit Apartments | 0 (0.0%) | 0 (0.0%) |
| 3 or 4 Unit Apartments | 0 (0.0%) | 0 (0.0%) |
| 5 to 9 Unit Apartments | 0 (0.0%) | 0 (0.0%) |
| 10 or more Apartments | 0 (0.0%) | 0 (0.0%) |
| Mobile Home / Other | 2 (100.0%) | 0 (0.0%) |
| Total | 267 (87.5%) | 38 (12.5%) |
Housing Structures by Number of Rooms in Big Bay

| Number of Rooms | Owner-occupied | Renter-occupied |
| 1 Room | 0 (0.0%) | 0 (0.0%) |
| 2 or 3 Rooms | 0 (0.0%) | 33 (86.8%) |
| 4 or 5 Rooms | 201 (75.3%) | 0 (0.0%) |
| 6 or 7 Rooms | 46 (17.2%) | 5 (13.2%) |
| 8 or more Rooms | 20 (7.5%) | 0 (0.0%) |
| Total | 267 (100.0%) | 38 (100.0%) |
Housing Structure by Heating Type in Big Bay
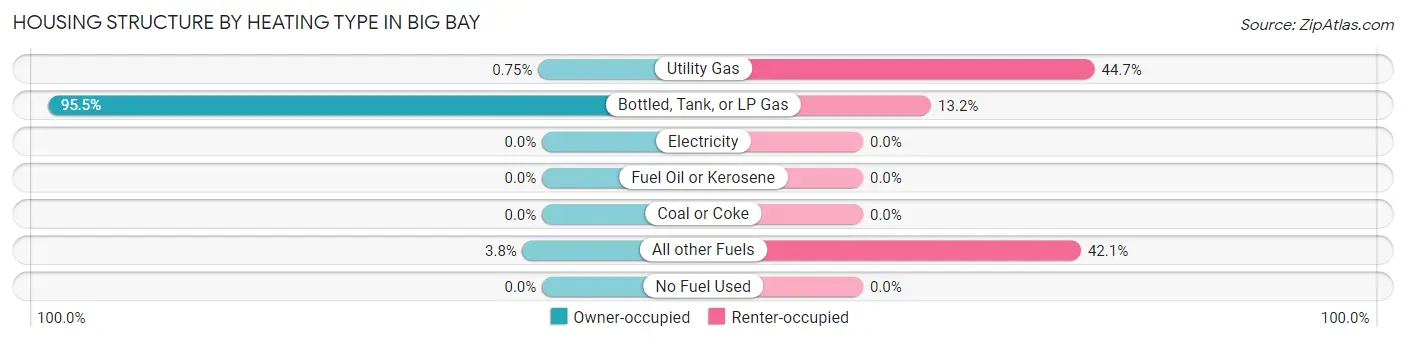
| Heating Type | Owner-occupied | Renter-occupied |
| Utility Gas | 2 (0.7%) | 17 (44.7%) |
| Bottled, Tank, or LP Gas | 255 (95.5%) | 5 (13.2%) |
| Electricity | 0 (0.0%) | 0 (0.0%) |
| Fuel Oil or Kerosene | 0 (0.0%) | 0 (0.0%) |
| Coal or Coke | 0 (0.0%) | 0 (0.0%) |
| All other Fuels | 10 (3.7%) | 16 (42.1%) |
| No Fuel Used | 0 (0.0%) | 0 (0.0%) |
| Total | 267 (100.0%) | 38 (100.0%) |
Household Vehicle Usage in Big Bay
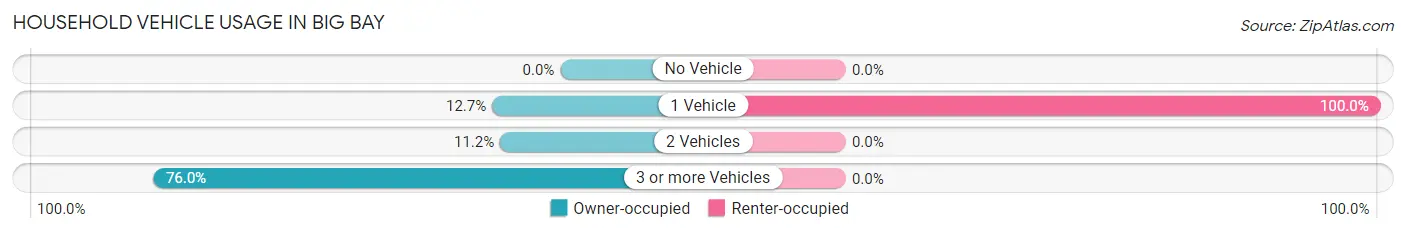
| Vehicles per Household | Owner-occupied | Renter-occupied |
| No Vehicle | 0 (0.0%) | 0 (0.0%) |
| 1 Vehicle | 34 (12.7%) | 38 (100.0%) |
| 2 Vehicles | 30 (11.2%) | 0 (0.0%) |
| 3 or more Vehicles | 203 (76.0%) | 0 (0.0%) |
| Total | 267 (100.0%) | 38 (100.0%) |
Real Estate & Mortgages in Big Bay
Real Estate and Mortgage Overview in Big Bay
| Characteristic | Without Mortgage | With Mortgage |
| Housing Units | 221 | 46 |
| Median Property Value | $139,100 | $245,000 |
| Median Household Income | $46,469 | $0 |
| Monthly Housing Costs | $230 | $4 |
| Real Estate Taxes | $724 | $0 |
Property Value by Mortgage Status in Big Bay
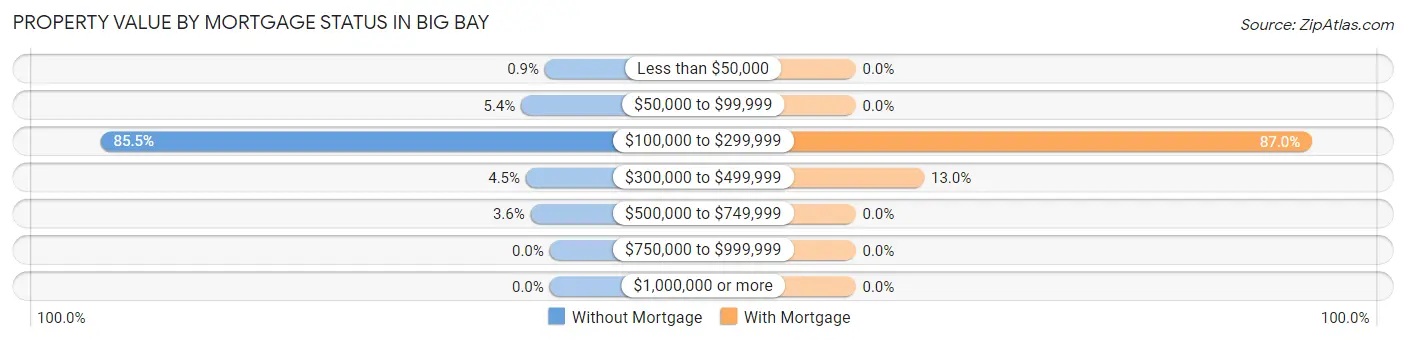
| Property Value | Without Mortgage | With Mortgage |
| Less than $50,000 | 2 (0.9%) | 0 (0.0%) |
| $50,000 to $99,999 | 12 (5.4%) | 0 (0.0%) |
| $100,000 to $299,999 | 189 (85.5%) | 40 (87.0%) |
| $300,000 to $499,999 | 10 (4.5%) | 6 (13.0%) |
| $500,000 to $749,999 | 8 (3.6%) | 0 (0.0%) |
| $750,000 to $999,999 | 0 (0.0%) | 0 (0.0%) |
| $1,000,000 or more | 0 (0.0%) | 0 (0.0%) |
| Total | 221 (100.0%) | 46 (100.0%) |
Household Income by Mortgage Status in Big Bay
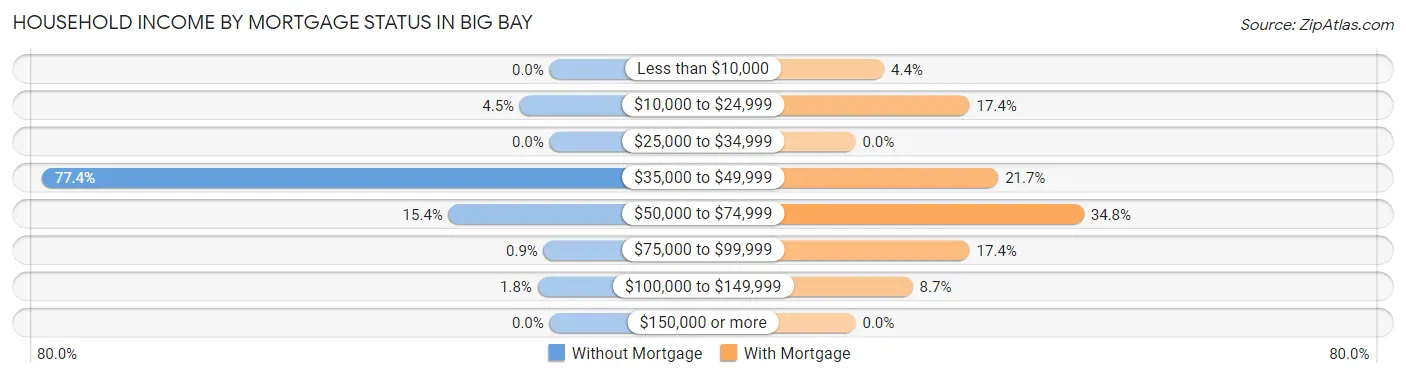
| Household Income | Without Mortgage | With Mortgage |
| Less than $10,000 | 0 (0.0%) | 2 (4.3%) |
| $10,000 to $24,999 | 10 (4.5%) | 8 (17.4%) |
| $25,000 to $34,999 | 0 (0.0%) | 0 (0.0%) |
| $35,000 to $49,999 | 171 (77.4%) | 10 (21.7%) |
| $50,000 to $74,999 | 34 (15.4%) | 16 (34.8%) |
| $75,000 to $99,999 | 2 (0.9%) | 8 (17.4%) |
| $100,000 to $149,999 | 4 (1.8%) | 4 (8.7%) |
| $150,000 or more | 0 (0.0%) | 0 (0.0%) |
| Total | 221 (100.0%) | 46 (100.0%) |
Property Value to Household Income Ratio in Big Bay
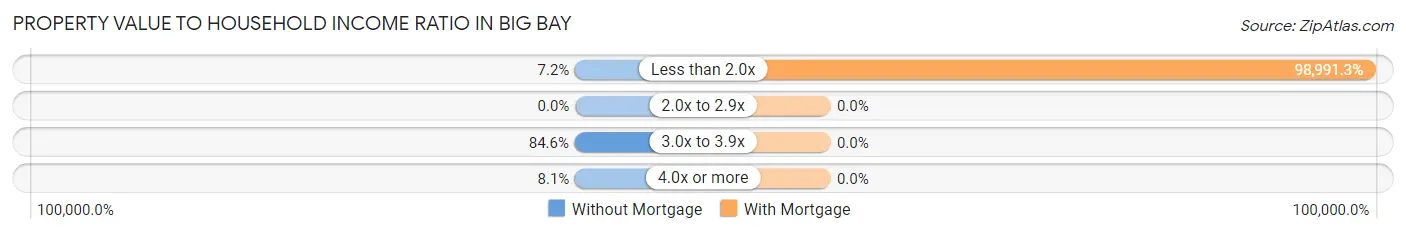
| Value-to-Income Ratio | Without Mortgage | With Mortgage |
| Less than 2.0x | 16 (7.2%) | 45,536 (98,991.3%) |
| 2.0x to 2.9x | 0 (0.0%) | 0 (0.0%) |
| 3.0x to 3.9x | 187 (84.6%) | 0 (0.0%) |
| 4.0x or more | 18 (8.1%) | 0 (0.0%) |
| Total | 221 (100.0%) | 46 (100.0%) |
Real Estate Taxes by Mortgage Status in Big Bay
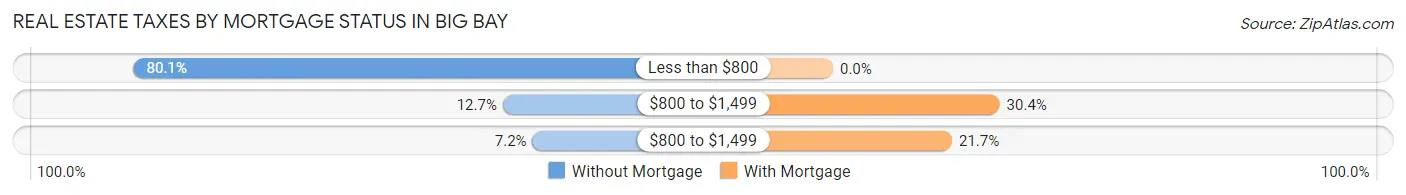
| Property Taxes | Without Mortgage | With Mortgage |
| Less than $800 | 177 (80.1%) | 0 (0.0%) |
| $800 to $1,499 | 28 (12.7%) | 14 (30.4%) |
| $800 to $1,499 | 16 (7.2%) | 10 (21.7%) |
| Total | 221 (100.0%) | 46 (100.0%) |
Health & Disability in Big Bay
Health Insurance Coverage by Age in Big Bay
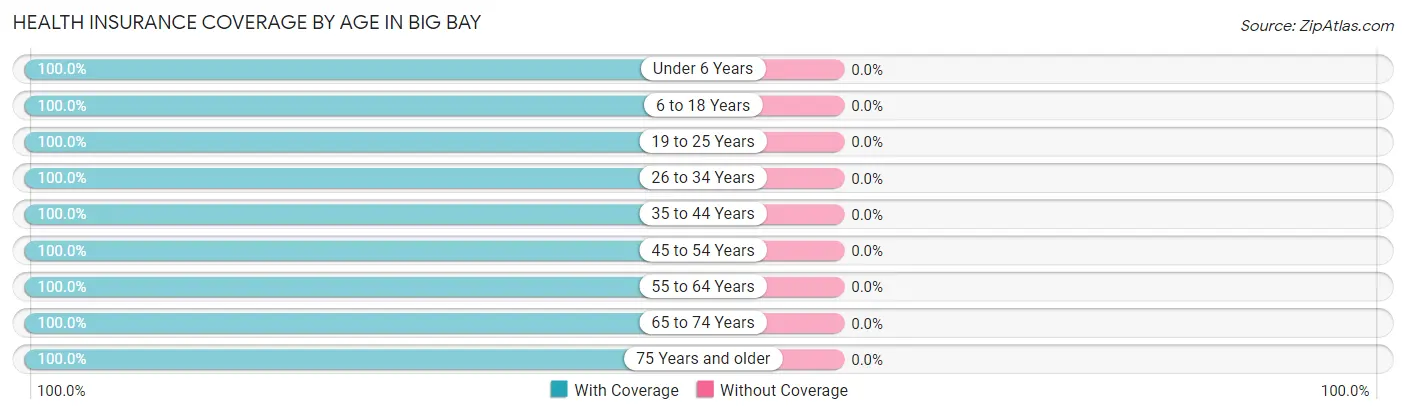
| Age Bracket | With Coverage | Without Coverage |
| Under 6 Years | 10 (100.0%) | 0 (0.0%) |
| 6 to 18 Years | 40 (100.0%) | 0 (0.0%) |
| 19 to 25 Years | 21 (100.0%) | 0 (0.0%) |
| 26 to 34 Years | 34 (100.0%) | 0 (0.0%) |
| 35 to 44 Years | 32 (100.0%) | 0 (0.0%) |
| 45 to 54 Years | 46 (100.0%) | 0 (0.0%) |
| 55 to 64 Years | 44 (100.0%) | 0 (0.0%) |
| 65 to 74 Years | 58 (100.0%) | 0 (0.0%) |
| 75 Years and older | 183 (100.0%) | 0 (0.0%) |
| Total | 468 (100.0%) | 0 (0.0%) |
Health Insurance Coverage by Citizenship Status in Big Bay
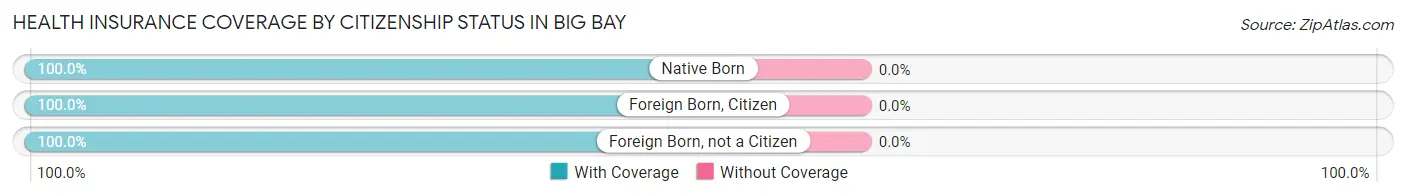
| Citizenship Status | With Coverage | Without Coverage |
| Native Born | 10 (100.0%) | 0 (0.0%) |
| Foreign Born, Citizen | 40 (100.0%) | 0 (0.0%) |
| Foreign Born, not a Citizen | 21 (100.0%) | 0 (0.0%) |
Health Insurance Coverage by Household Income in Big Bay
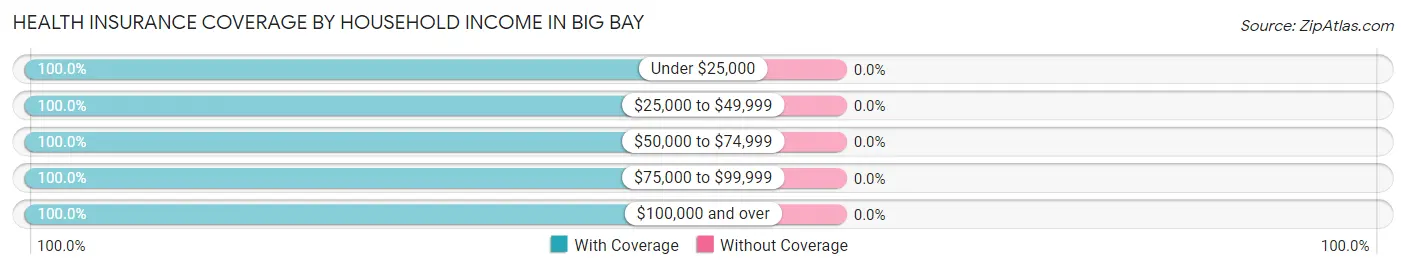
| Household Income | With Coverage | Without Coverage |
| Under $25,000 | 23 (100.0%) | 0 (0.0%) |
| $25,000 to $49,999 | 276 (100.0%) | 0 (0.0%) |
| $50,000 to $74,999 | 132 (100.0%) | 0 (0.0%) |
| $75,000 to $99,999 | 12 (100.0%) | 0 (0.0%) |
| $100,000 and over | 25 (100.0%) | 0 (0.0%) |
Public vs Private Health Insurance Coverage by Age in Big Bay
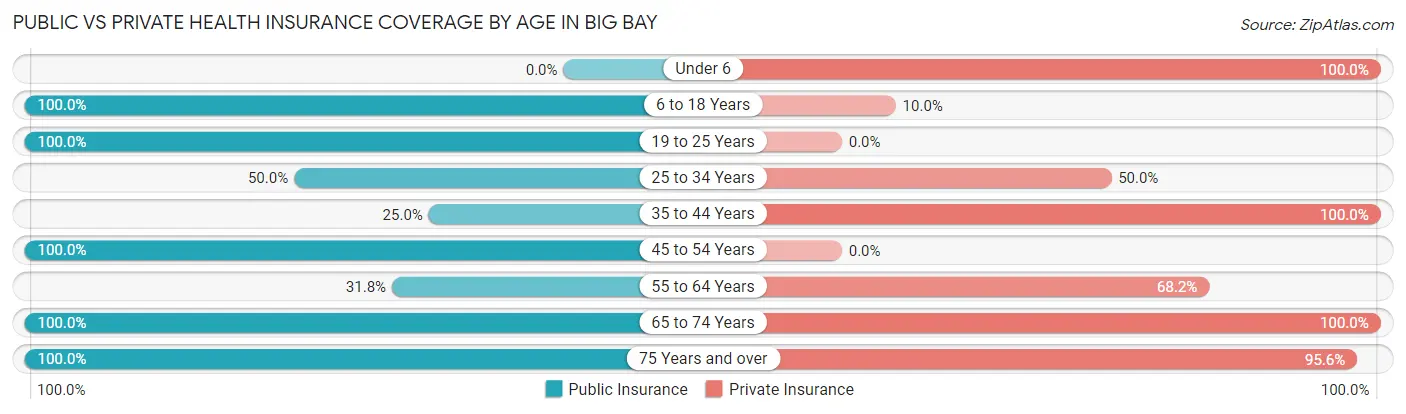
| Age Bracket | Public Insurance | Private Insurance |
| Under 6 | 0 (0.0%) | 10 (100.0%) |
| 6 to 18 Years | 40 (100.0%) | 4 (10.0%) |
| 19 to 25 Years | 21 (100.0%) | 0 (0.0%) |
| 25 to 34 Years | 17 (50.0%) | 17 (50.0%) |
| 35 to 44 Years | 8 (25.0%) | 32 (100.0%) |
| 45 to 54 Years | 46 (100.0%) | 0 (0.0%) |
| 55 to 64 Years | 14 (31.8%) | 30 (68.2%) |
| 65 to 74 Years | 58 (100.0%) | 58 (100.0%) |
| 75 Years and over | 183 (100.0%) | 175 (95.6%) |
| Total | 387 (82.7%) | 326 (69.7%) |
Disability Status by Sex by Age in Big Bay
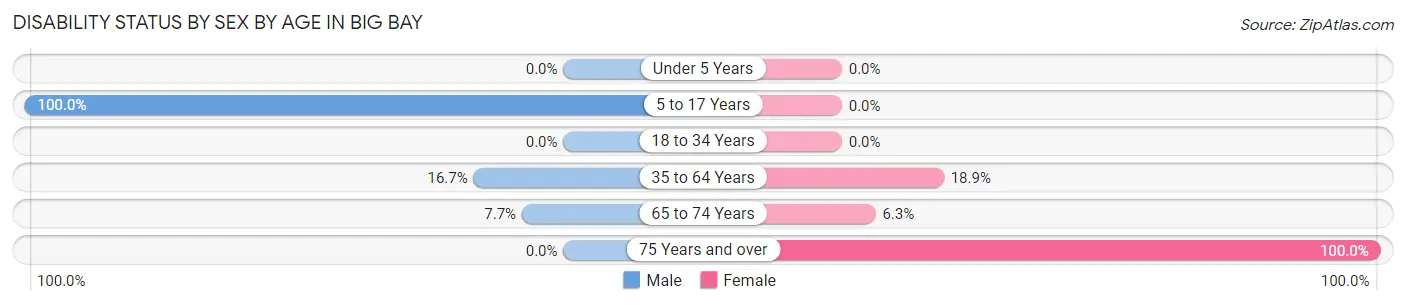
| Age Bracket | Male | Female |
| Under 5 Years | 0 (0.0%) | 0 (0.0%) |
| 5 to 17 Years | 4 (100.0%) | 0 (0.0%) |
| 18 to 34 Years | 0 (0.0%) | 0 (0.0%) |
| 35 to 64 Years | 8 (16.7%) | 14 (18.9%) |
| 65 to 74 Years | 2 (7.7%) | 2 (6.2%) |
| 75 Years and over | 0 (0.0%) | 10 (100.0%) |
Disability Class by Sex by Age in Big Bay
Disability Class: Hearing Difficulty
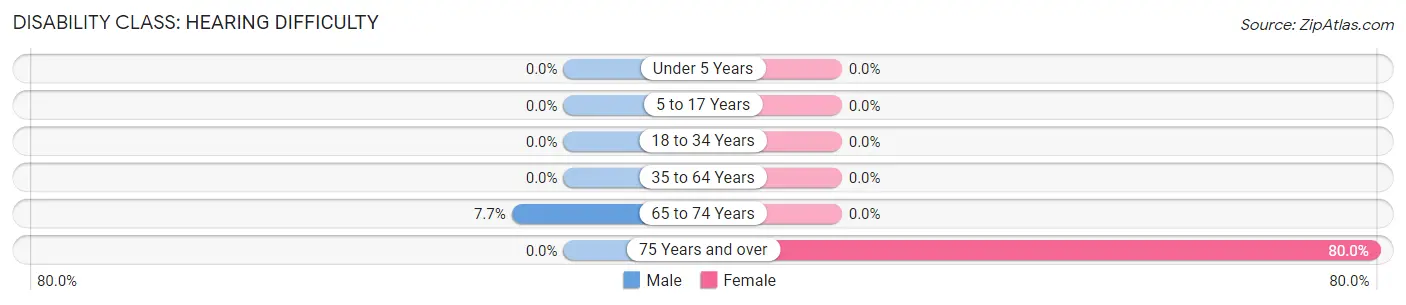
| Age Bracket | Male | Female |
| Under 5 Years | 0 (0.0%) | 0 (0.0%) |
| 5 to 17 Years | 0 (0.0%) | 0 (0.0%) |
| 18 to 34 Years | 0 (0.0%) | 0 (0.0%) |
| 35 to 64 Years | 0 (0.0%) | 0 (0.0%) |
| 65 to 74 Years | 2 (7.7%) | 0 (0.0%) |
| 75 Years and over | 0 (0.0%) | 8 (80.0%) |
Disability Class: Vision Difficulty
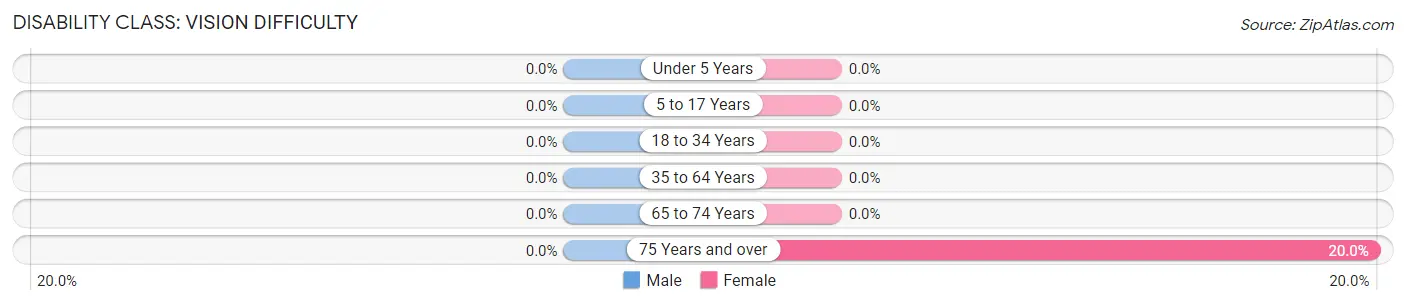
| Age Bracket | Male | Female |
| Under 5 Years | 0 (0.0%) | 0 (0.0%) |
| 5 to 17 Years | 0 (0.0%) | 0 (0.0%) |
| 18 to 34 Years | 0 (0.0%) | 0 (0.0%) |
| 35 to 64 Years | 0 (0.0%) | 0 (0.0%) |
| 65 to 74 Years | 0 (0.0%) | 0 (0.0%) |
| 75 Years and over | 0 (0.0%) | 2 (20.0%) |
Disability Class: Cognitive Difficulty
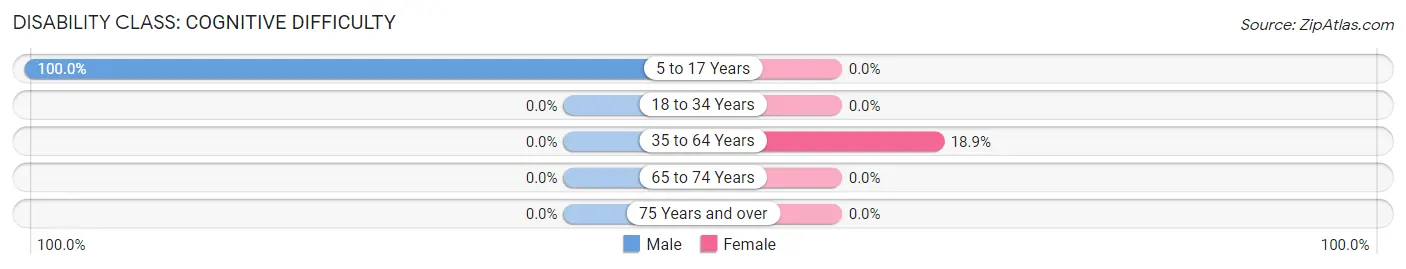
| Age Bracket | Male | Female |
| 5 to 17 Years | 4 (100.0%) | 0 (0.0%) |
| 18 to 34 Years | 0 (0.0%) | 0 (0.0%) |
| 35 to 64 Years | 0 (0.0%) | 14 (18.9%) |
| 65 to 74 Years | 0 (0.0%) | 0 (0.0%) |
| 75 Years and over | 0 (0.0%) | 0 (0.0%) |
Disability Class: Ambulatory Difficulty
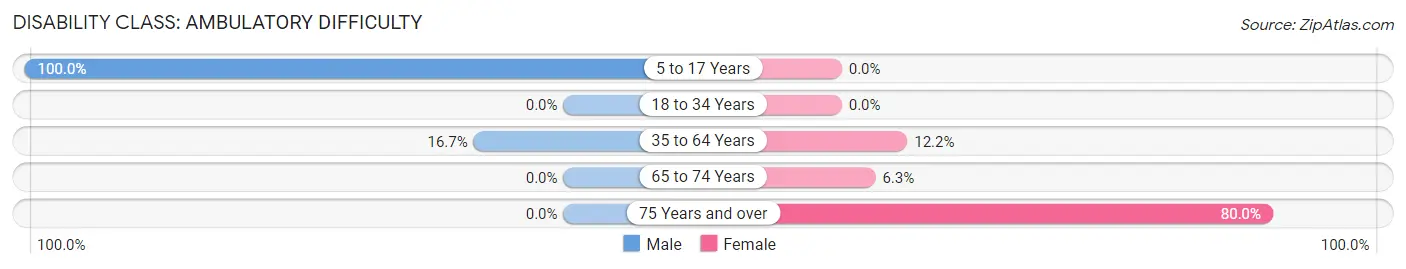
| Age Bracket | Male | Female |
| 5 to 17 Years | 4 (100.0%) | 0 (0.0%) |
| 18 to 34 Years | 0 (0.0%) | 0 (0.0%) |
| 35 to 64 Years | 8 (16.7%) | 9 (12.2%) |
| 65 to 74 Years | 0 (0.0%) | 2 (6.2%) |
| 75 Years and over | 0 (0.0%) | 8 (80.0%) |
Disability Class: Self-Care Difficulty
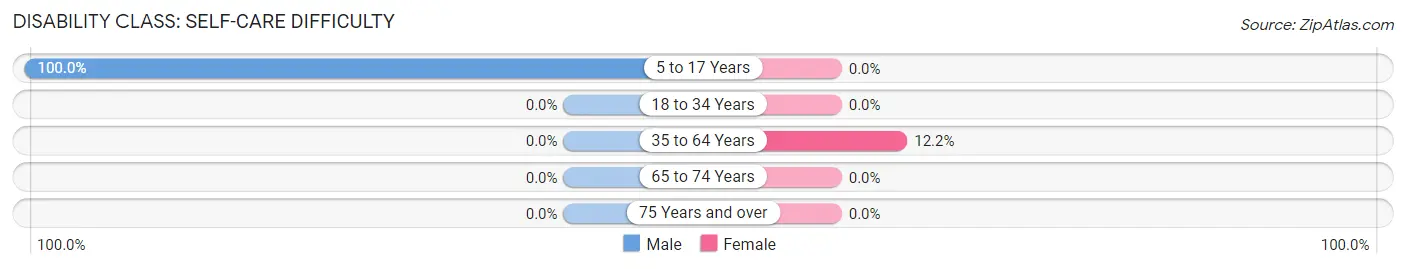
| Age Bracket | Male | Female |
| 5 to 17 Years | 4 (100.0%) | 0 (0.0%) |
| 18 to 34 Years | 0 (0.0%) | 0 (0.0%) |
| 35 to 64 Years | 0 (0.0%) | 9 (12.2%) |
| 65 to 74 Years | 0 (0.0%) | 0 (0.0%) |
| 75 Years and over | 0 (0.0%) | 0 (0.0%) |
Technology Access in Big Bay
Computing Device Access in Big Bay
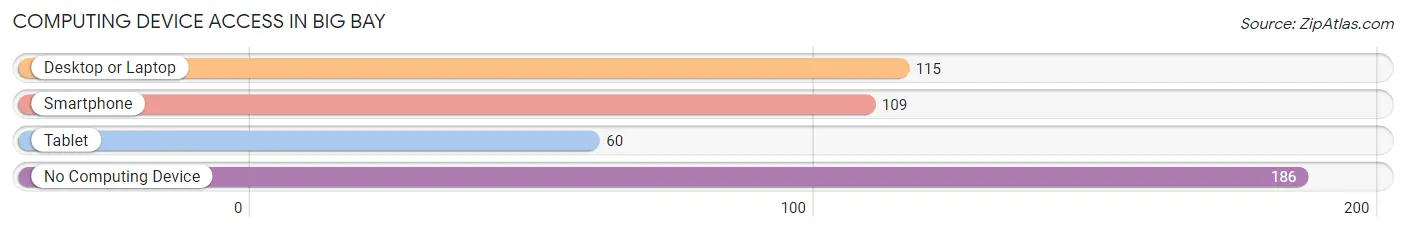
| Device Type | # Households | % Households |
| Desktop or Laptop | 115 | 37.7% |
| Smartphone | 109 | 35.7% |
| Tablet | 60 | 19.7% |
| No Computing Device | 186 | 61.0% |
| Total | 305 | 100.0% |
Internet Access in Big Bay
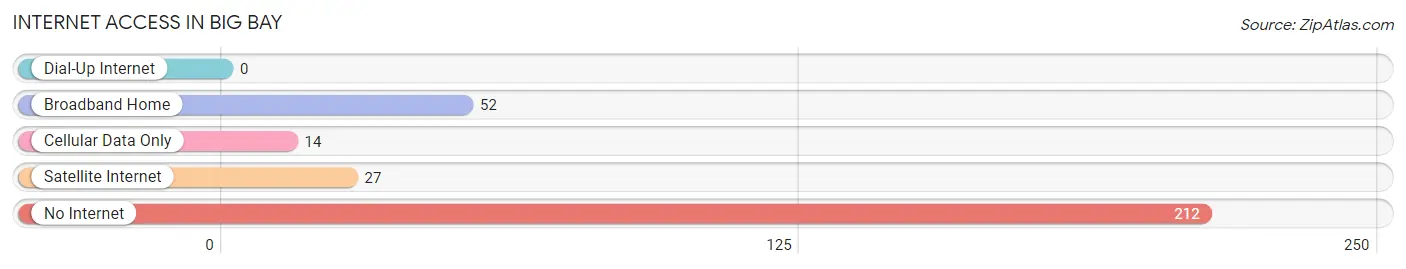
| Internet Type | # Households | % Households |
| Dial-Up Internet | 0 | 0.0% |
| Broadband Home | 52 | 17.1% |
| Cellular Data Only | 14 | 4.6% |
| Satellite Internet | 27 | 8.8% |
| No Internet | 212 | 69.5% |
| Total | 305 | 100.0% |
Big Bay Summary
Bay Township is located in the Upper Peninsula of Michigan, in the county of Delta. It is bordered by the townships of Garden, Masonville, and Nahma. The township is situated on the shores of Lake Michigan, and is home to the village of Big Bay.
History
The area that is now Bay Township was first inhabited by the Ojibwe people, who were the original inhabitants of the Upper Peninsula. The first European settlers arrived in the area in the late 1800s, and the township was officially organized in 1883. The village of Big Bay was established in 1887, and was named after the bay that it was situated on.
The area was primarily a logging and fishing community, and the economy was largely based on these industries. The logging industry was especially important, as the area was home to some of the largest stands of white pine in the Upper Peninsula. The logging industry declined in the early 1900s, and the economy shifted to tourism and recreation.
Geography
Bay Township is located in the Upper Peninsula of Michigan, in the county of Delta. It is bordered by the townships of Garden, Masonville, and Nahma. The township is situated on the shores of Lake Michigan, and is home to the village of Big Bay.
The township covers an area of approximately 36 square miles, and is mostly forested. The terrain is mostly flat, with some rolling hills. The area is home to several lakes, including Big Bay Lake, Little Bay Lake, and Lake Independence.
Economy
The economy of Bay Township is largely based on tourism and recreation. The area is home to several resorts and campgrounds, as well as a number of recreational activities such as fishing, hunting, and boating. The area is also home to several wineries and breweries, as well as a number of restaurants and shops.
The township is also home to several manufacturing companies, including a paper mill and a furniture factory. The area is also home to several logging companies, as well as a number of small businesses.
Demographics
As of the 2010 census, the population of Bay Township was 1,845. The population is largely white (94.3%), with a small percentage of Native American (2.2%) and African American (1.2%) residents. The median household income is $41,250, and the median home value is $117,000. The unemployment rate is 6.2%.
Common Questions
What is Per Capita Income in Big Bay?
Per Capita income in Big Bay is $32,556.
What is the Median Family Income in Big Bay?
Median Family Income in Big Bay is $61,875.
What is the Median Household income in Big Bay?
Median Household Income in Big Bay is $46,372.
What is Inequality or Gini Index in Big Bay?
Inequality or Gini Index in Big Bay is 0.21.
What is the Total Population of Big Bay?
Total Population of Big Bay is 468.
What is the Total Male Population of Big Bay?
Total Male Population of Big Bay is 268.
What is the Total Female Population of Big Bay?
Total Female Population of Big Bay is 200.
What is the Ratio of Males per 100 Females in Big Bay?
There are 134.00 Males per 100 Females in Big Bay.
What is the Ratio of Females per 100 Males in Big Bay?
There are 74.63 Females per 100 Males in Big Bay.
What is the Median Population Age in Big Bay?
Median Population Age in Big Bay is 67.7 Years.
What is the Average Family Size in Big Bay
Average Family Size in Big Bay is 2.5 People.
What is the Average Household Size in Big Bay
Average Household Size in Big Bay is 1.5 People.
How Large is the Labor Force in Big Bay?
There are 92 People in the Labor Forcein in Big Bay.
What is the Percentage of People in the Labor Force in Big Bay?
22.0% of People are in the Labor Force in Big Bay.