Baroda, MI Map & Demographics
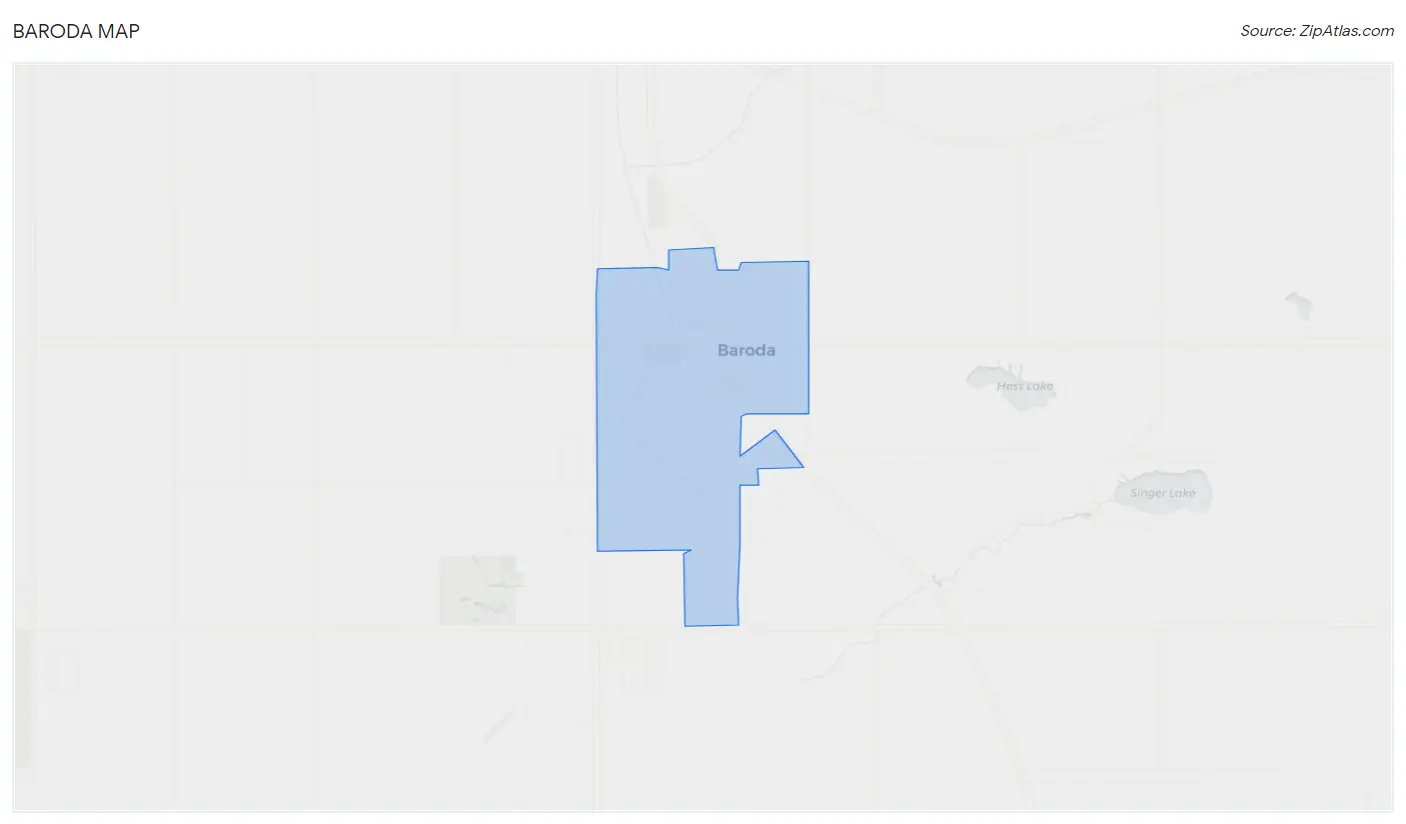
Baroda Map
Baroda Overview
$34,519
PER CAPITA INCOME
$72,813
AVG FAMILY INCOME
$62,679
AVG HOUSEHOLD INCOME
12.6%
WAGE / INCOME GAP [ % ]
87.4¢/ $1
WAGE / INCOME GAP [ $ ]
0.38
INEQUALITY / GINI INDEX
896
TOTAL POPULATION
398
MALE POPULATION
498
FEMALE POPULATION
79.92
MALES / 100 FEMALES
125.13
FEMALES / 100 MALES
39.9
MEDIAN AGE
3.0
AVG FAMILY SIZE
2.2
AVG HOUSEHOLD SIZE
519
LABOR FORCE [ PEOPLE ]
70.5%
PERCENT IN LABOR FORCE
4.4%
UNEMPLOYMENT RATE
Baroda Zip Codes
Baroda Area Codes
Income in Baroda
Income Overview in Baroda
Per Capita Income in Baroda is $34,519, while median incomes of families and households are $72,813 and $62,679 respectively.
| Characteristic | Number | Measure |
| Per Capita Income | 896 | $34,519 |
| Median Family Income | 226 | $72,813 |
| Mean Family Income | 226 | $90,738 |
| Median Household Income | 407 | $62,679 |
| Mean Household Income | 407 | $74,857 |
| Income Deficit | 226 | $0 |
| Wage / Income Gap (%) | 896 | 12.61% |
| Wage / Income Gap ($) | 896 | 87.39¢ per $1 |
| Gini / Inequality Index | 896 | 0.38 |
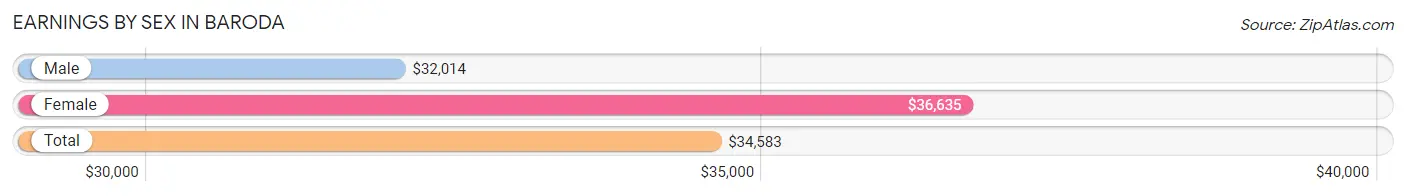
Earnings by Sex in Baroda
Average Earnings in Baroda are $34,583, $32,014 for men and $36,635 for women, a difference of 12.6%.
| Sex | Number | Average Earnings |
| Male | 251 (43.6%) | $32,014 |
| Female | 325 (56.4%) | $36,635 |
| Total | 576 (100.0%) | $34,583 |
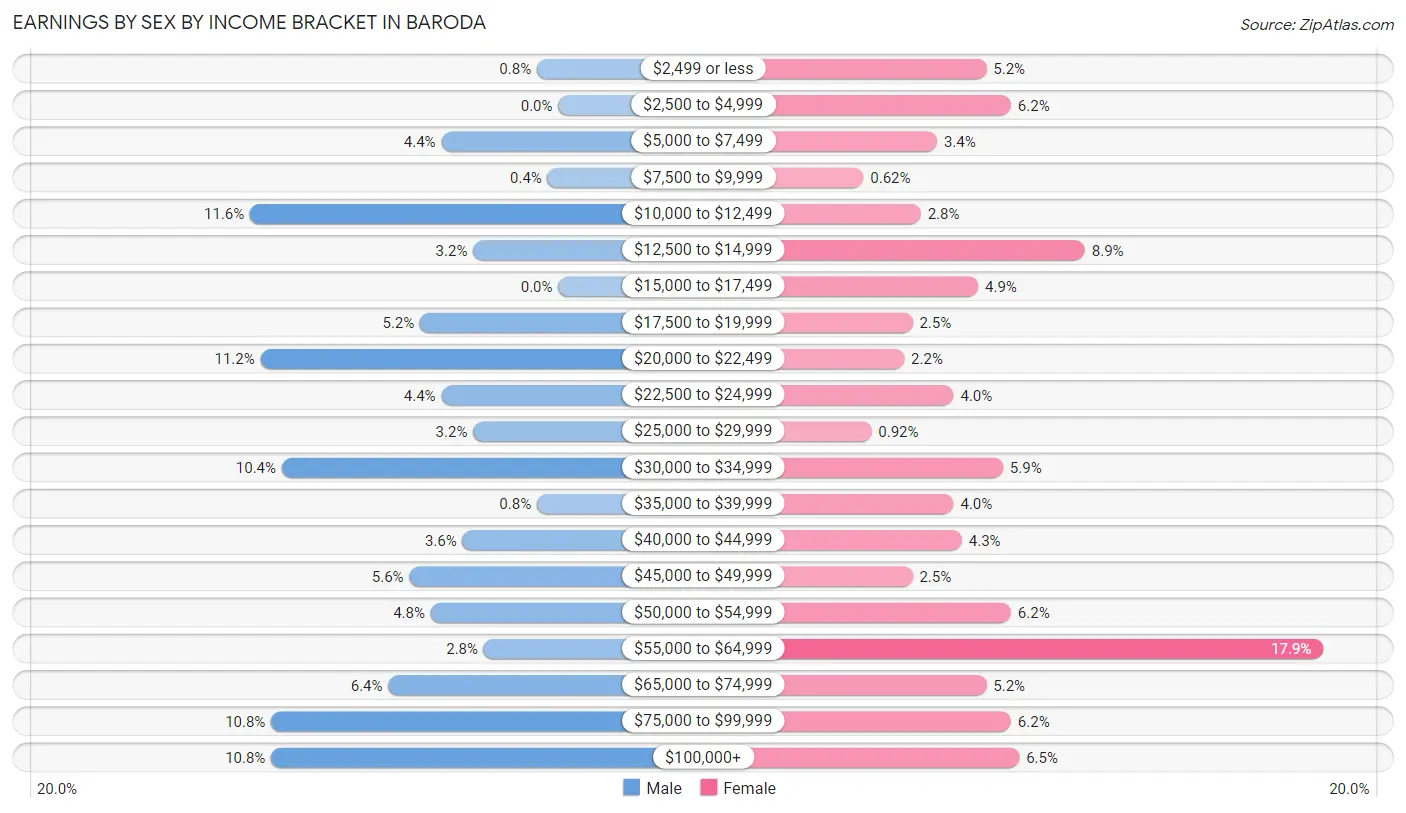
Earnings by Sex by Income Bracket in Baroda
The most common earnings brackets in Baroda are $10,000 to $12,499 for men (29 | 11.6%) and $55,000 to $64,999 for women (58 | 17.8%).
| Income | Male | Female |
| $2,499 or less | 2 (0.8%) | 17 (5.2%) |
| $2,500 to $4,999 | 0 (0.0%) | 20 (6.1%) |
| $5,000 to $7,499 | 11 (4.4%) | 11 (3.4%) |
| $7,500 to $9,999 | 1 (0.4%) | 2 (0.6%) |
| $10,000 to $12,499 | 29 (11.6%) | 9 (2.8%) |
| $12,500 to $14,999 | 8 (3.2%) | 29 (8.9%) |
| $15,000 to $17,499 | 0 (0.0%) | 16 (4.9%) |
| $17,500 to $19,999 | 13 (5.2%) | 8 (2.5%) |
| $20,000 to $22,499 | 28 (11.2%) | 7 (2.1%) |
| $22,500 to $24,999 | 11 (4.4%) | 13 (4.0%) |
| $25,000 to $29,999 | 8 (3.2%) | 3 (0.9%) |
| $30,000 to $34,999 | 26 (10.4%) | 19 (5.9%) |
| $35,000 to $39,999 | 2 (0.8%) | 13 (4.0%) |
| $40,000 to $44,999 | 9 (3.6%) | 14 (4.3%) |
| $45,000 to $49,999 | 14 (5.6%) | 8 (2.5%) |
| $50,000 to $54,999 | 12 (4.8%) | 20 (6.1%) |
| $55,000 to $64,999 | 7 (2.8%) | 58 (17.8%) |
| $65,000 to $74,999 | 16 (6.4%) | 17 (5.2%) |
| $75,000 to $99,999 | 27 (10.8%) | 20 (6.1%) |
| $100,000+ | 27 (10.8%) | 21 (6.5%) |
| Total | 251 (100.0%) | 325 (100.0%) |
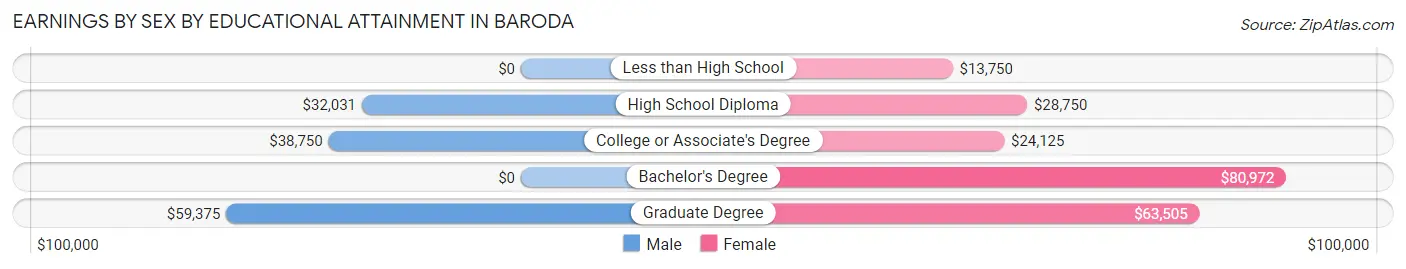
Earnings by Sex by Educational Attainment in Baroda
Average earnings in Baroda are $41,042 for men and $42,292 for women, a difference of 3.0%. Men with an educational attainment of graduate degree enjoy the highest average annual earnings of $59,375, while those with high school diploma education earn the least with $32,031. Women with an educational attainment of bachelor's degree earn the most with the average annual earnings of $80,972, while those with less than high school education have the smallest earnings of $13,750.
| Educational Attainment | Male Income | Female Income |
| Less than High School | - | - |
| High School Diploma | $32,031 | $28,750 |
| College or Associate's Degree | $38,750 | $24,125 |
| Bachelor's Degree | - | - |
| Graduate Degree | $59,375 | $63,505 |
| Total | $41,042 | $42,292 |
Family Income in Baroda
Family Income Brackets in Baroda
According to the Baroda family income data, there are 64 families falling into the $100,000 to $149,999 income range, which is the most common income bracket and makes up 28.3% of all families. Conversely, the less than $10,000 income bracket is the least frequent group with only 3 families (1.3%) belonging to this category.
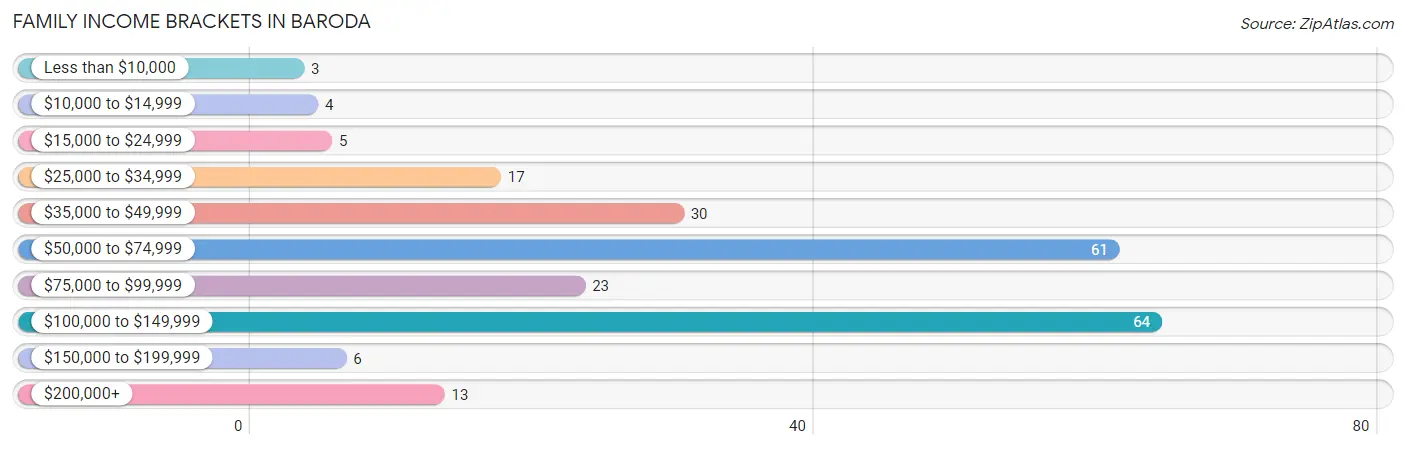
| Income Bracket | # Families | % Families |
| Less than $10,000 | 3 | 1.3% |
| $10,000 to $14,999 | 4 | 1.8% |
| $15,000 to $24,999 | 5 | 2.2% |
| $25,000 to $34,999 | 17 | 7.5% |
| $35,000 to $49,999 | 30 | 13.3% |
| $50,000 to $74,999 | 61 | 27.0% |
| $75,000 to $99,999 | 23 | 10.2% |
| $100,000 to $149,999 | 64 | 28.3% |
| $150,000 to $199,999 | 6 | 2.7% |
| $200,000+ | 13 | 5.8% |
Family Income by Famaliy Size in Baroda
5-person families (33 | 14.6%) account for the highest median family income in Baroda with $139,688 per family, while 4-person families (13 | 5.8%) have the highest median income of $31,172 per family member.
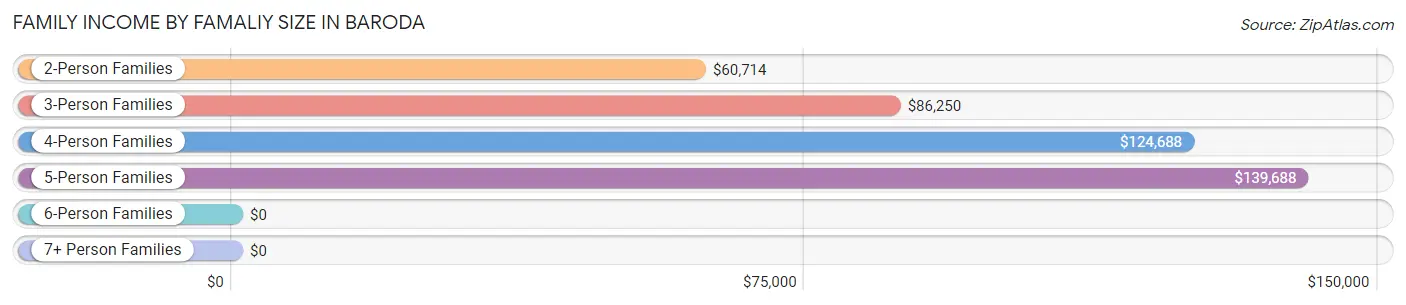
| Income Bracket | # Families | Median Income |
| 2-Person Families | 132 (58.4%) | $60,714 |
| 3-Person Families | 44 (19.5%) | $86,250 |
| 4-Person Families | 13 (5.8%) | $124,688 |
| 5-Person Families | 33 (14.6%) | $139,688 |
| 6-Person Families | 4 (1.8%) | $0 |
| 7+ Person Families | 0 (0.0%) | $0 |
| Total | 226 (100.0%) | $72,813 |
Family Income by Number of Earners in Baroda
The median family income in Baroda is $72,813, with families comprising 3+ earners (29) having the highest median family income of $140,469, while families with no earners (33) have the lowest median family income of $46,458, accounting for 12.8% and 14.6% of families, respectively.
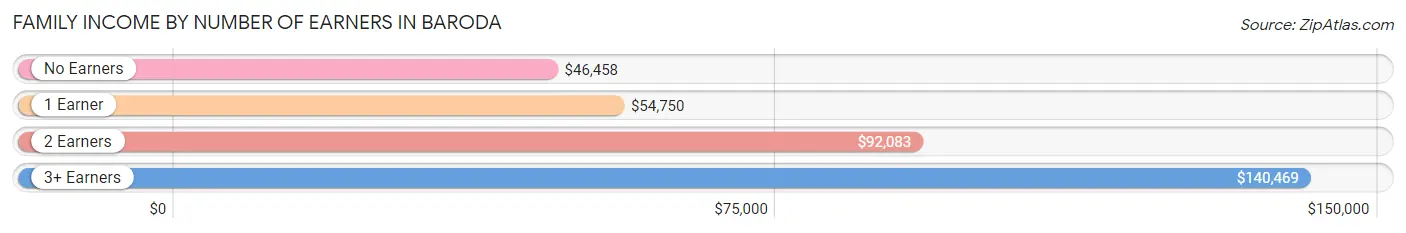
| Number of Earners | # Families | Median Income |
| No Earners | 33 (14.6%) | $46,458 |
| 1 Earner | 49 (21.7%) | $54,750 |
| 2 Earners | 115 (50.9%) | $92,083 |
| 3+ Earners | 29 (12.8%) | $140,469 |
| Total | 226 (100.0%) | $72,813 |
Household Income in Baroda
Household Income Brackets in Baroda
With 122 households falling in the category, the $50,000 to $74,999 income range is the most frequent in Baroda, accounting for 30.0% of all households. In contrast, only 3 households (0.7%) fall into the $150,000 to $199,999 income bracket, making it the least populous group.
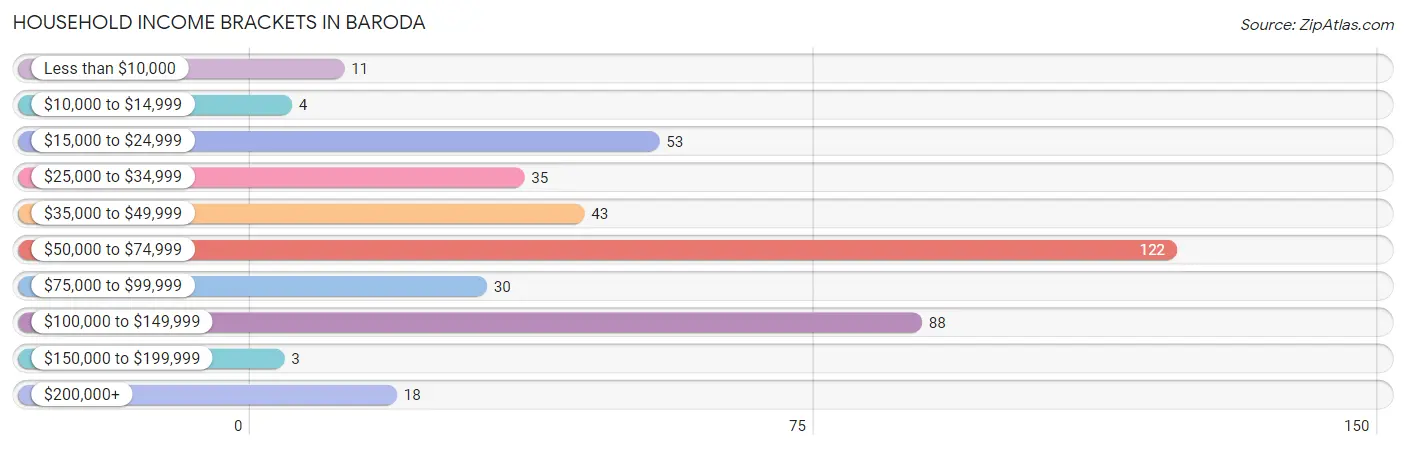
| Income Bracket | # Households | % Households |
| Less than $10,000 | 11 | 2.7% |
| $10,000 to $14,999 | 4 | 1.0% |
| $15,000 to $24,999 | 53 | 13.0% |
| $25,000 to $34,999 | 35 | 8.6% |
| $35,000 to $49,999 | 43 | 10.6% |
| $50,000 to $74,999 | 122 | 30.0% |
| $75,000 to $99,999 | 30 | 7.4% |
| $100,000 to $149,999 | 88 | 21.6% |
| $150,000 to $199,999 | 3 | 0.7% |
| $200,000+ | 18 | 4.4% |
Household Income by Householder Age in Baroda
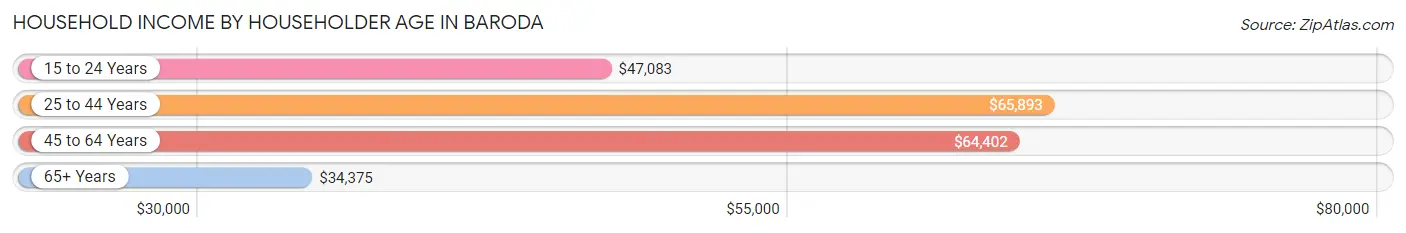
The median household income in Baroda is $62,679, with the highest median household income of $65,893 found in the 25 to 44 years age bracket for the primary householder. A total of 111 households (27.3%) fall into this category. Meanwhile, the 65+ years age bracket for the primary householder has the lowest median household income of $34,375, with 95 households (23.3%) in this group.
| Income Bracket | # Households | Median Income |
| 15 to 24 Years | 11 (2.7%) | $47,083 |
| 25 to 44 Years | 111 (27.3%) | $65,893 |
| 45 to 64 Years | 190 (46.7%) | $64,402 |
| 65+ Years | 95 (23.3%) | $34,375 |
| Total | 407 (100.0%) | $62,679 |
Poverty in Baroda
Income Below Poverty by Sex and Age in Baroda
With 6.5% poverty level for males and 7.7% for females among the residents of Baroda, 16 and 17 year old males and 5 year old females are the most vulnerable to poverty, with 2 males (50.0%) and 5 females (35.7%) in their respective age groups living below the poverty level.
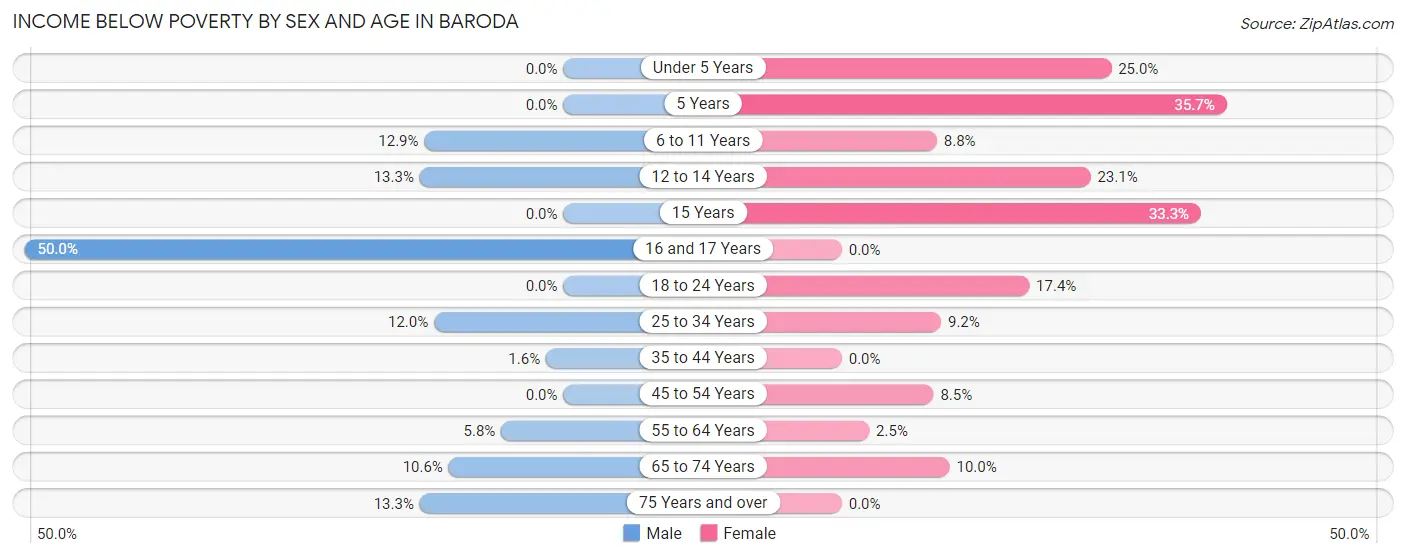
| Age Bracket | Male | Female |
| Under 5 Years | 0 (0.0%) | 3 (25.0%) |
| 5 Years | 0 (0.0%) | 5 (35.7%) |
| 6 to 11 Years | 4 (12.9%) | 3 (8.8%) |
| 12 to 14 Years | 2 (13.3%) | 3 (23.1%) |
| 15 Years | 0 (0.0%) | 3 (33.3%) |
| 16 and 17 Years | 2 (50.0%) | 0 (0.0%) |
| 18 to 24 Years | 0 (0.0%) | 4 (17.4%) |
| 25 to 34 Years | 6 (12.0%) | 7 (9.2%) |
| 35 to 44 Years | 1 (1.6%) | 0 (0.0%) |
| 45 to 54 Years | 0 (0.0%) | 4 (8.5%) |
| 55 to 64 Years | 3 (5.8%) | 3 (2.5%) |
| 65 to 74 Years | 5 (10.6%) | 3 (10.0%) |
| 75 Years and over | 2 (13.3%) | 0 (0.0%) |
| Total | 25 (6.5%) | 38 (7.7%) |
Income Above Poverty by Sex and Age in Baroda
According to the poverty statistics in Baroda, males aged under 5 years and females aged 16 and 17 years are the age groups that are most secure financially, with 100.0% of males and 100.0% of females in these age groups living above the poverty line.
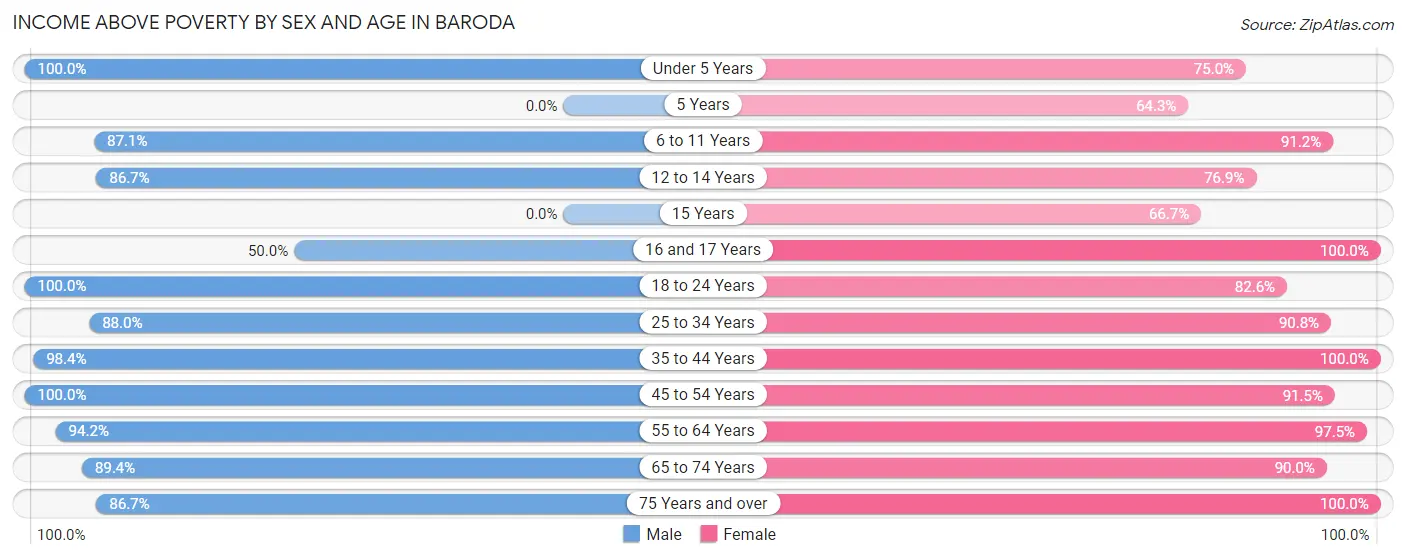
| Age Bracket | Male | Female |
| Under 5 Years | 15 (100.0%) | 9 (75.0%) |
| 5 Years | 0 (0.0%) | 9 (64.3%) |
| 6 to 11 Years | 27 (87.1%) | 31 (91.2%) |
| 12 to 14 Years | 13 (86.7%) | 10 (76.9%) |
| 15 Years | 0 (0.0%) | 6 (66.7%) |
| 16 and 17 Years | 2 (50.0%) | 12 (100.0%) |
| 18 to 24 Years | 46 (100.0%) | 19 (82.6%) |
| 25 to 34 Years | 44 (88.0%) | 69 (90.8%) |
| 35 to 44 Years | 61 (98.4%) | 52 (100.0%) |
| 45 to 54 Years | 49 (100.0%) | 43 (91.5%) |
| 55 to 64 Years | 49 (94.2%) | 115 (97.5%) |
| 65 to 74 Years | 42 (89.4%) | 27 (90.0%) |
| 75 Years and over | 13 (86.7%) | 53 (100.0%) |
| Total | 361 (93.5%) | 455 (92.3%) |
Income Below Poverty Among Married-Couple Families in Baroda
The poverty statistics for married-couple families in Baroda show that 4.7% or 8 of the total 170 families live below the poverty line. Families with 3 or 4 children have the highest poverty rate of 15.6%, comprising of 5 families. On the other hand, families with 1 or 2 children have the lowest poverty rate of 0.0%, which includes 0 families.
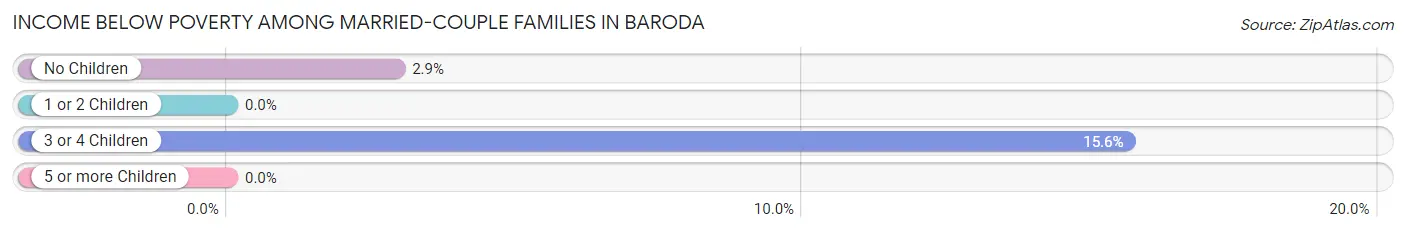
| Children | Above Poverty | Below Poverty |
| No Children | 100 (97.1%) | 3 (2.9%) |
| 1 or 2 Children | 35 (100.0%) | 0 (0.0%) |
| 3 or 4 Children | 27 (84.4%) | 5 (15.6%) |
| 5 or more Children | 0 (0.0%) | 0 (0.0%) |
| Total | 162 (95.3%) | 8 (4.7%) |
Income Below Poverty Among Single-Parent Households in Baroda
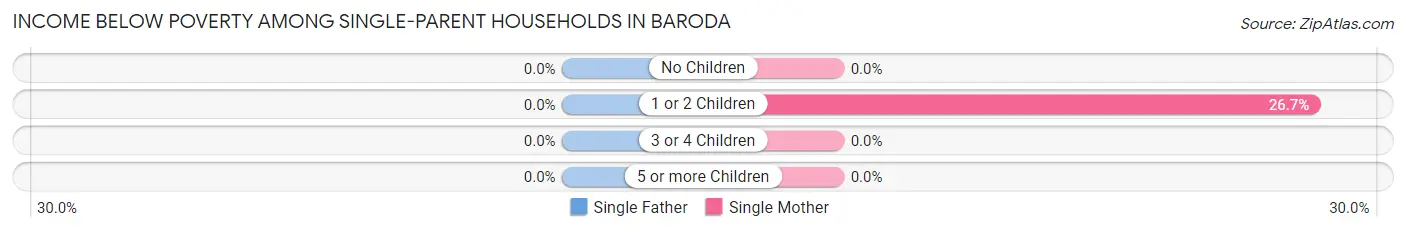
| Children | Single Father | Single Mother |
| No Children | 0 (0.0%) | 0 (0.0%) |
| 1 or 2 Children | 0 (0.0%) | 4 (26.7%) |
| 3 or 4 Children | 0 (0.0%) | 0 (0.0%) |
| 5 or more Children | 0 (0.0%) | 0 (0.0%) |
| Total | 0 (0.0%) | 4 (9.1%) |
Income Below Poverty Among Married-Couple vs Single-Parent Households in Baroda
The poverty data for Baroda shows that 8 of the married-couple family households (4.7%) and 4 of the single-parent households (7.1%) are living below the poverty level. Within the married-couple family households, those with 3 or 4 children have the highest poverty rate, with 5 households (15.6%) falling below the poverty line. Among the single-parent households, those with 1 or 2 children have the highest poverty rate, with 4 household (20.0%) living below poverty.
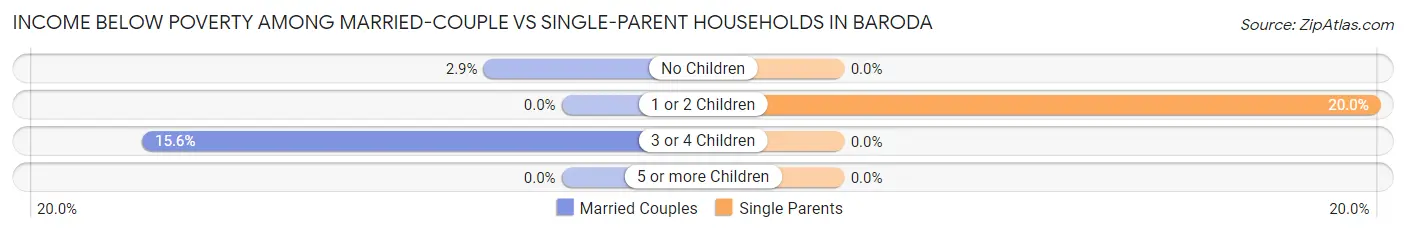
| Children | Married-Couple Families | Single-Parent Households |
| No Children | 3 (2.9%) | 0 (0.0%) |
| 1 or 2 Children | 0 (0.0%) | 4 (20.0%) |
| 3 or 4 Children | 5 (15.6%) | 0 (0.0%) |
| 5 or more Children | 0 (0.0%) | 0 (0.0%) |
| Total | 8 (4.7%) | 4 (7.1%) |
Race in Baroda
The most populous races in Baroda are White / Caucasian (769 | 85.8%), Two or more Races (77 | 8.6%), and Hispanic or Latino (44 | 4.9%).
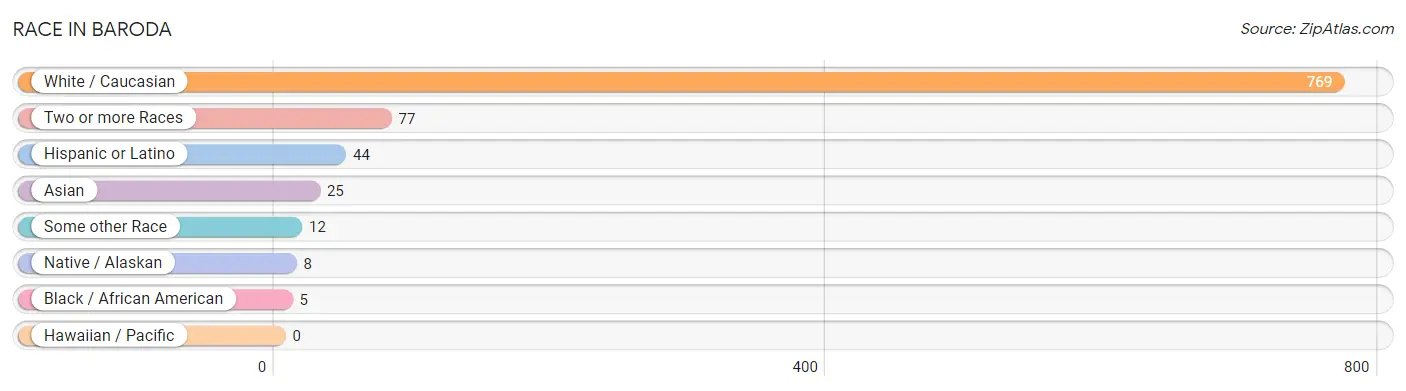
| Race | # Population | % Population |
| Asian | 25 | 2.8% |
| Black / African American | 5 | 0.6% |
| Hawaiian / Pacific | 0 | 0.0% |
| Hispanic or Latino | 44 | 4.9% |
| Native / Alaskan | 8 | 0.9% |
| White / Caucasian | 769 | 85.8% |
| Two or more Races | 77 | 8.6% |
| Some other Race | 12 | 1.3% |
| Total | 896 | 100.0% |
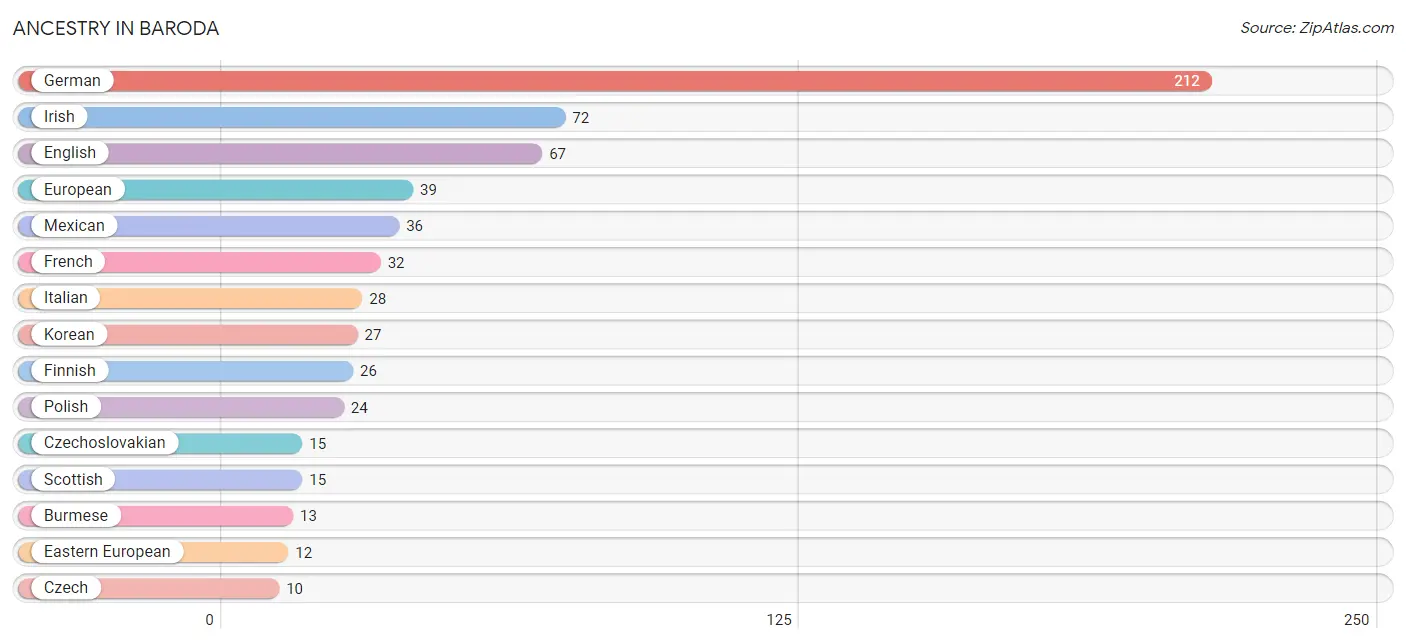
Ancestry in Baroda
The most populous ancestries reported in Baroda are German (212 | 23.7%), Irish (72 | 8.0%), English (67 | 7.5%), European (39 | 4.3%), and Mexican (36 | 4.0%), together accounting for 47.6% of all Baroda residents.
| Ancestry | # Population | % Population |
| American | 6 | 0.7% |
| Belgian | 7 | 0.8% |
| British | 5 | 0.6% |
| Burmese | 13 | 1.5% |
| Canadian | 4 | 0.4% |
| Central American | 8 | 0.9% |
| Croatian | 4 | 0.4% |
| Czech | 10 | 1.1% |
| Czechoslovakian | 15 | 1.7% |
| Danish | 2 | 0.2% |
| Dutch | 6 | 0.7% |
| Eastern European | 12 | 1.3% |
| English | 67 | 7.5% |
| European | 39 | 4.3% |
| Finnish | 26 | 2.9% |
| French | 32 | 3.6% |
| German | 212 | 23.7% |
| Greek | 4 | 0.4% |
| Hungarian | 3 | 0.3% |
| Indian (Asian) | 6 | 0.7% |
| Irish | 72 | 8.0% |
| Italian | 28 | 3.1% |
| Korean | 27 | 3.0% |
| Mexican | 36 | 4.0% |
| Nicaraguan | 8 | 0.9% |
| Norwegian | 3 | 0.3% |
| Polish | 24 | 2.7% |
| Potawatomi | 1 | 0.1% |
| Russian | 4 | 0.4% |
| Scandinavian | 7 | 0.8% |
| Scottish | 15 | 1.7% |
| Sioux | 7 | 0.8% |
| Swedish | 7 | 0.8% |
| Swiss | 3 | 0.3% |
| Welsh | 9 | 1.0% | View All 35 Rows |
Immigrants in Baroda
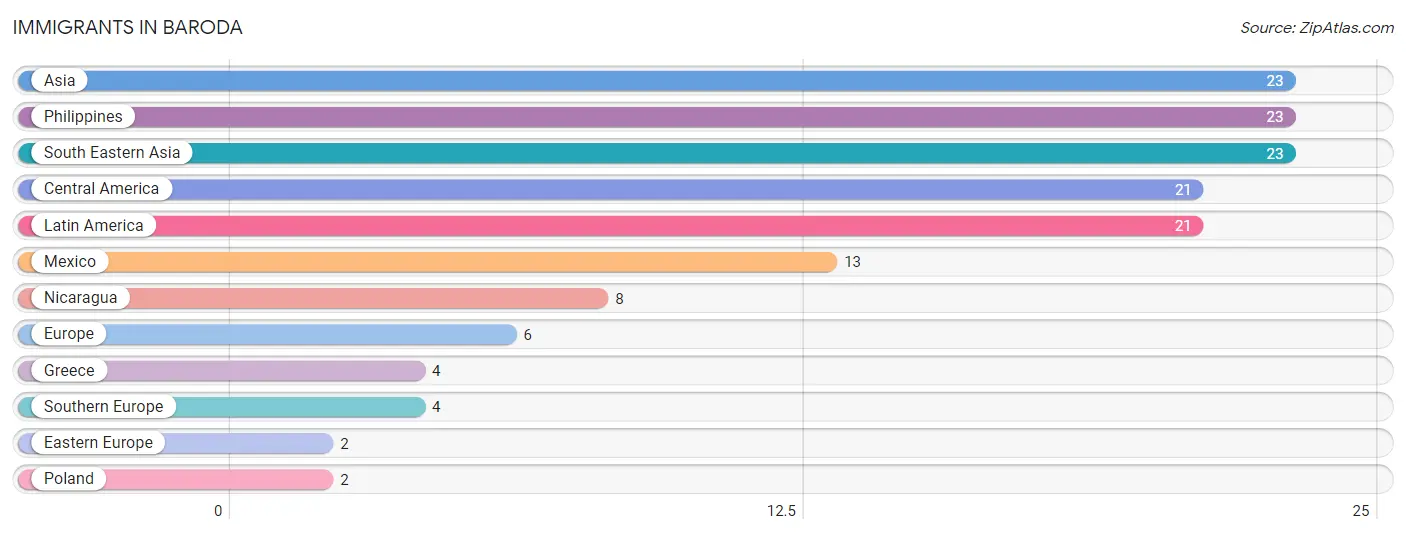
The most numerous immigrant groups reported in Baroda came from Asia (23 | 2.6%), Philippines (23 | 2.6%), South Eastern Asia (23 | 2.6%), Central America (21 | 2.3%), and Latin America (21 | 2.3%), together accounting for 12.4% of all Baroda residents.
| Immigration Origin | # Population | % Population |
| Asia | 23 | 2.6% |
| Central America | 21 | 2.3% |
| Eastern Europe | 2 | 0.2% |
| Europe | 6 | 0.7% |
| Greece | 4 | 0.4% |
| Latin America | 21 | 2.3% |
| Mexico | 13 | 1.5% |
| Nicaragua | 8 | 0.9% |
| Philippines | 23 | 2.6% |
| Poland | 2 | 0.2% |
| South Eastern Asia | 23 | 2.6% |
| Southern Europe | 4 | 0.4% | View All 12 Rows |
Sex and Age in Baroda
Sex and Age in Baroda
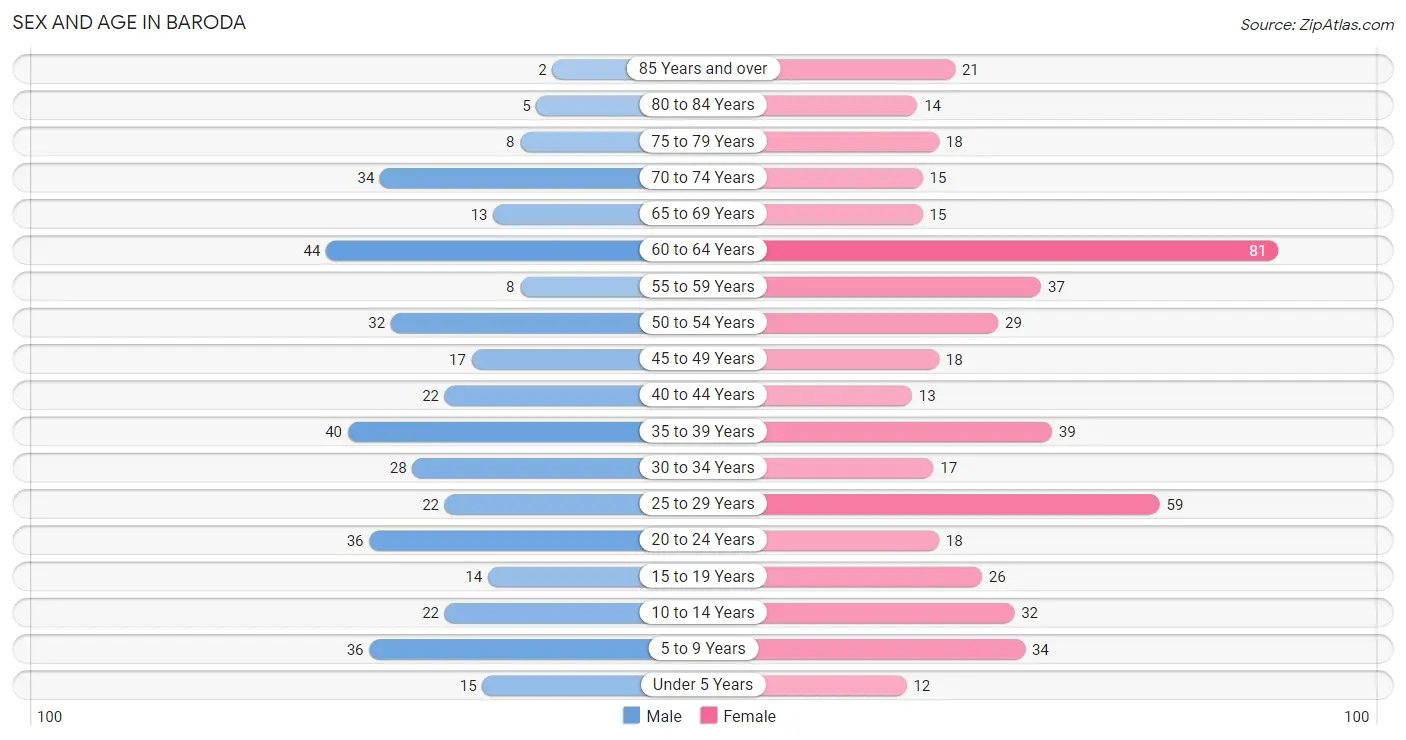
The most populous age groups in Baroda are 60 to 64 Years (44 | 11.1%) for men and 60 to 64 Years (81 | 16.3%) for women.
| Age Bracket | Male | Female |
| Under 5 Years | 15 (3.8%) | 12 (2.4%) |
| 5 to 9 Years | 36 (9.0%) | 34 (6.8%) |
| 10 to 14 Years | 22 (5.5%) | 32 (6.4%) |
| 15 to 19 Years | 14 (3.5%) | 26 (5.2%) |
| 20 to 24 Years | 36 (9.0%) | 18 (3.6%) |
| 25 to 29 Years | 22 (5.5%) | 59 (11.8%) |
| 30 to 34 Years | 28 (7.0%) | 17 (3.4%) |
| 35 to 39 Years | 40 (10.1%) | 39 (7.8%) |
| 40 to 44 Years | 22 (5.5%) | 13 (2.6%) |
| 45 to 49 Years | 17 (4.3%) | 18 (3.6%) |
| 50 to 54 Years | 32 (8.0%) | 29 (5.8%) |
| 55 to 59 Years | 8 (2.0%) | 37 (7.4%) |
| 60 to 64 Years | 44 (11.1%) | 81 (16.3%) |
| 65 to 69 Years | 13 (3.3%) | 15 (3.0%) |
| 70 to 74 Years | 34 (8.5%) | 15 (3.0%) |
| 75 to 79 Years | 8 (2.0%) | 18 (3.6%) |
| 80 to 84 Years | 5 (1.3%) | 14 (2.8%) |
| 85 Years and over | 2 (0.5%) | 21 (4.2%) |
| Total | 398 (100.0%) | 498 (100.0%) |
Families and Households in Baroda
Median Family Size in Baroda
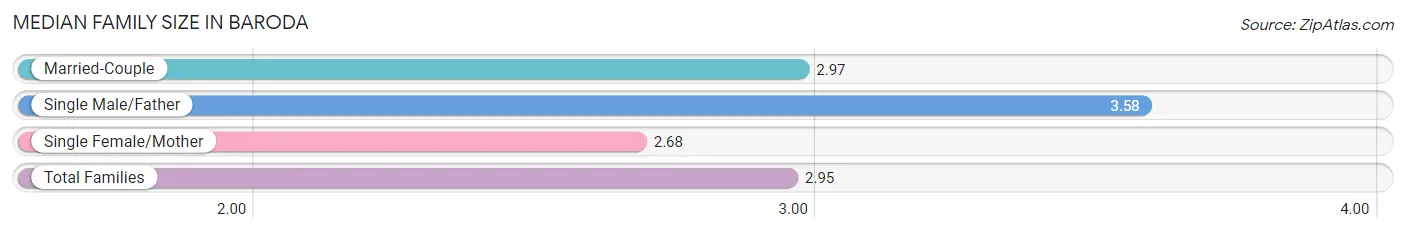
The median family size in Baroda is 2.95 persons per family, with single male/father families (12 | 5.3%) accounting for the largest median family size of 3.58 persons per family. On the other hand, single female/mother families (44 | 19.5%) represent the smallest median family size with 2.68 persons per family.
| Family Type | # Families | Family Size |
| Married-Couple | 170 (75.2%) | 2.97 |
| Single Male/Father | 12 (5.3%) | 3.58 |
| Single Female/Mother | 44 (19.5%) | 2.68 |
| Total Families | 226 (100.0%) | 2.95 |
Median Household Size in Baroda
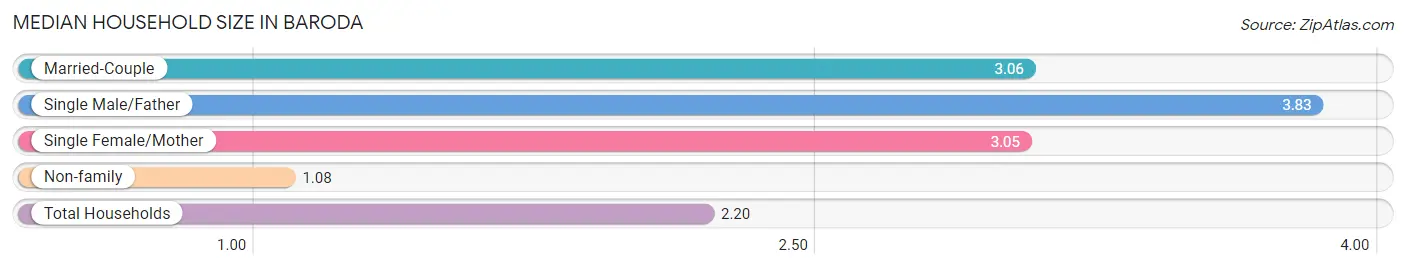
The median household size in Baroda is 2.20 persons per household, with single male/father households (12 | 2.9%) accounting for the largest median household size of 3.83 persons per household. non-family households (181 | 44.5%) represent the smallest median household size with 1.08 persons per household.
| Household Type | # Households | Household Size |
| Married-Couple | 170 (41.8%) | 3.06 |
| Single Male/Father | 12 (2.9%) | 3.83 |
| Single Female/Mother | 44 (10.8%) | 3.05 |
| Non-family | 181 (44.5%) | 1.08 |
| Total Households | 407 (100.0%) | 2.20 |
Household Size by Marriage Status in Baroda
Out of a total of 407 households in Baroda, 226 (55.5%) are family households, while 181 (44.5%) are nonfamily households. The most numerous type of family households are 2-person households, comprising 118, and the most common type of nonfamily households are 1-person households, comprising 165.
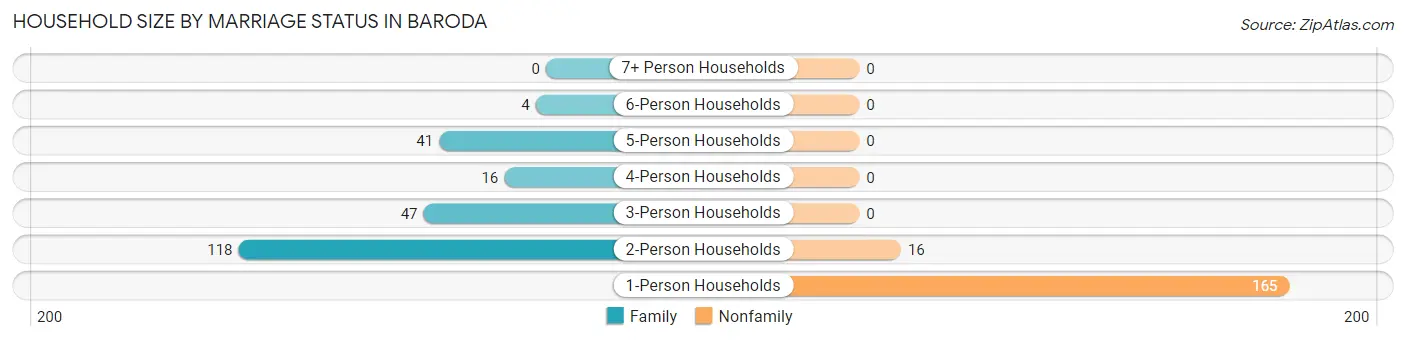
| Household Size | Family Households | Nonfamily Households |
| 1-Person Households | - | 165 (40.5%) |
| 2-Person Households | 118 (29.0%) | 16 (3.9%) |
| 3-Person Households | 47 (11.6%) | 0 (0.0%) |
| 4-Person Households | 16 (3.9%) | 0 (0.0%) |
| 5-Person Households | 41 (10.1%) | 0 (0.0%) |
| 6-Person Households | 4 (1.0%) | 0 (0.0%) |
| 7+ Person Households | 0 (0.0%) | 0 (0.0%) |
| Total | 226 (55.5%) | 181 (44.5%) |
Female Fertility in Baroda
Fertility by Age in Baroda
Average fertility rate in Baroda is 10.0 births per 1,000 women. Women in the age bracket of 20 to 34 years have the highest fertility rate with 21.0 births per 1,000 women. Women in the age bracket of 20 to 34 years acount for 100.0% of all women with births.
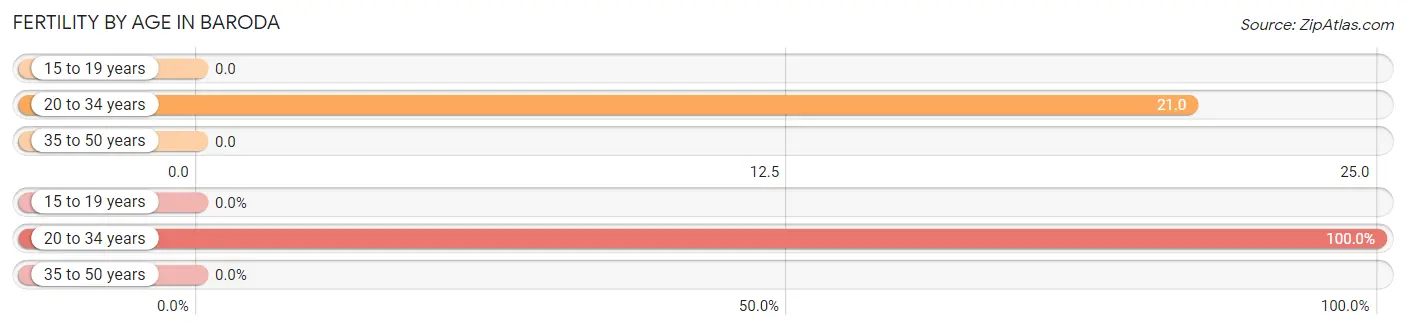
| Age Bracket | Women with Births | Births / 1,000 Women |
| 15 to 19 years | 0 (0.0%) | 0.0 |
| 20 to 34 years | 2 (100.0%) | 21.0 |
| 35 to 50 years | 0 (0.0%) | 0.0 |
| Total | 2 (100.0%) | 10.0 |
Fertility by Age by Marriage Status in Baroda
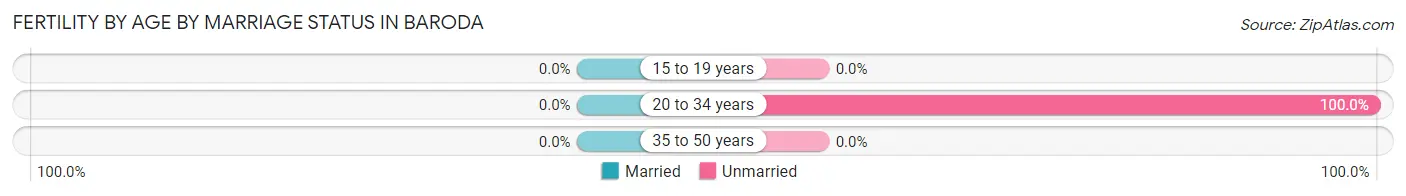
| Age Bracket | Married | Unmarried |
| 15 to 19 years | 0 (0.0%) | 0 (0.0%) |
| 20 to 34 years | 0 (0.0%) | 2 (100.0%) |
| 35 to 50 years | 0 (0.0%) | 0 (0.0%) |
| Total | 0 (0.0%) | 2 (100.0%) |
Fertility by Education in Baroda
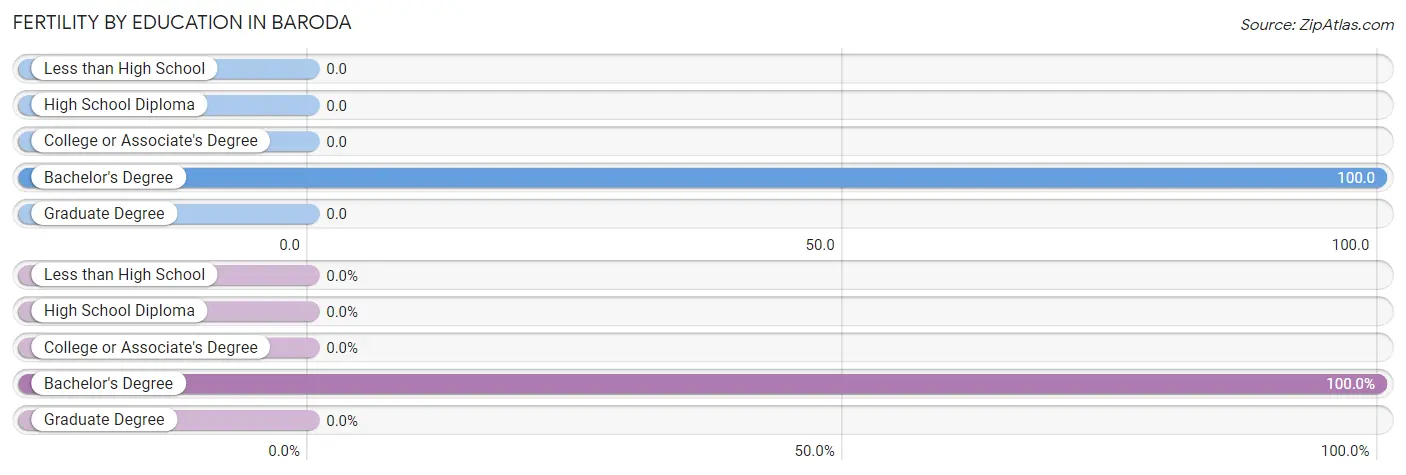
| Educational Attainment | Women with Births | Births / 1,000 Women |
| Less than High School | 0 (0.0%) | 0.0 |
| High School Diploma | 0 (0.0%) | 0.0 |
| College or Associate's Degree | 0 (0.0%) | 0.0 |
| Bachelor's Degree | 2 (100.0%) | 100.0 |
| Graduate Degree | 0 (0.0%) | 0.0 |
| Total | 2 (100.0%) | 10.0 |
Fertility by Education by Marriage Status in Baroda
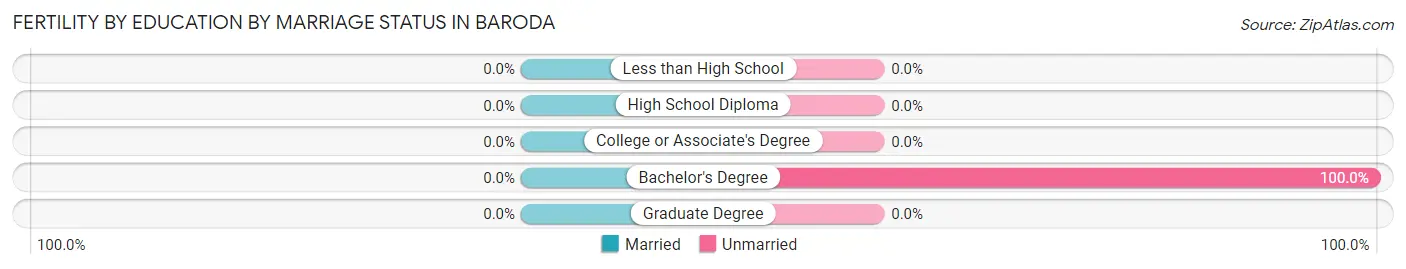
| Educational Attainment | Married | Unmarried |
| Less than High School | 0 (0.0%) | 0 (0.0%) |
| High School Diploma | 0 (0.0%) | 0 (0.0%) |
| College or Associate's Degree | 0 (0.0%) | 0 (0.0%) |
| Bachelor's Degree | 0 (0.0%) | 2 (100.0%) |
| Graduate Degree | 0 (0.0%) | 0 (0.0%) |
| Total | 0 (0.0%) | 2 (100.0%) |
Employment Characteristics in Baroda
Employment by Class of Employer in Baroda
Among the 494 employed individuals in Baroda, private company employees (386 | 78.1%), local government employees (30 | 6.1%), and self-employed (not incorporated) (27 | 5.5%) make up the most common classes of employment.
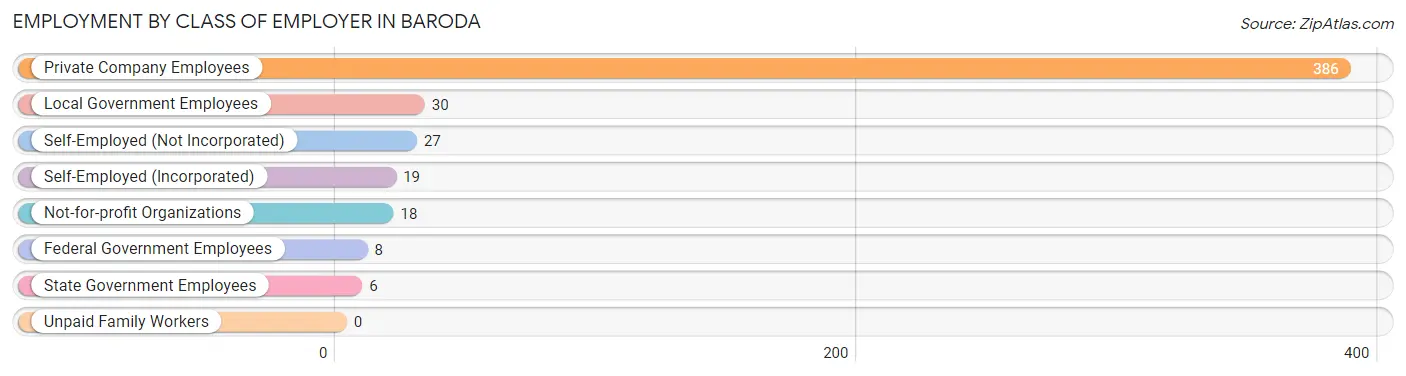
| Employer Class | # Employees | % Employees |
| Private Company Employees | 386 | 78.1% |
| Self-Employed (Incorporated) | 19 | 3.8% |
| Self-Employed (Not Incorporated) | 27 | 5.5% |
| Not-for-profit Organizations | 18 | 3.6% |
| Local Government Employees | 30 | 6.1% |
| State Government Employees | 6 | 1.2% |
| Federal Government Employees | 8 | 1.6% |
| Unpaid Family Workers | 0 | 0.0% |
| Total | 494 | 100.0% |
Employment Status by Age in Baroda
According to the labor force statistics for Baroda, out of the total population over 16 years of age (736), 70.5% or 519 individuals are in the labor force, with 4.4% or 23 of them unemployed. The age group with the highest labor force participation rate is 25 to 29 years, with 95.1% or 77 individuals in the labor force. Within the labor force, the 55 to 59 years age range has the highest percentage of unemployed individuals, with 13.2% or 5 of them being unemployed.
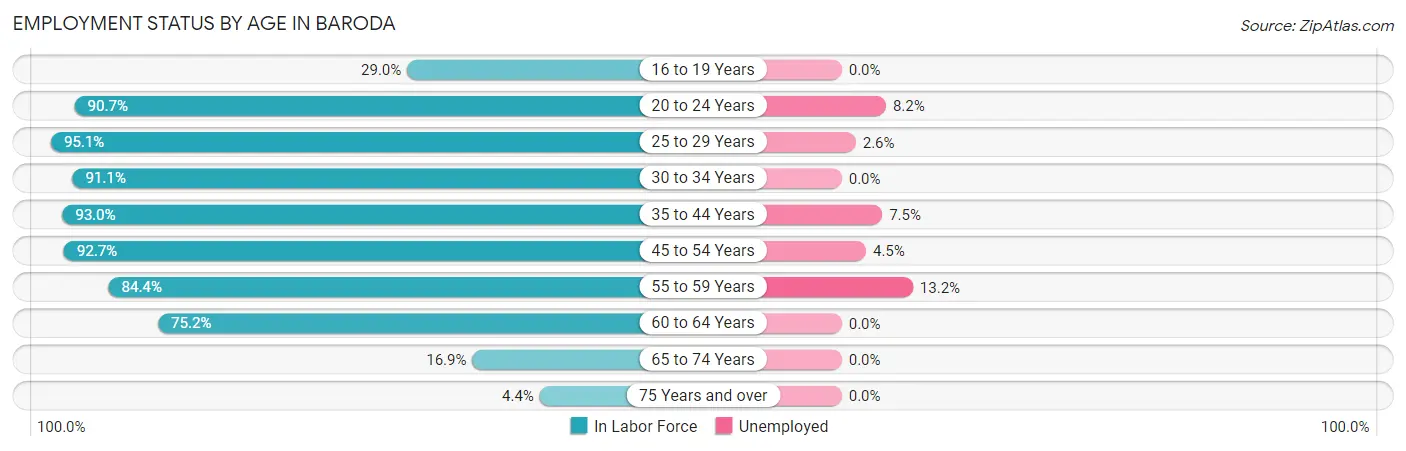
| Age Bracket | In Labor Force | Unemployed |
| 16 to 19 Years | 9 (29.0%) | 0 (0.0%) |
| 20 to 24 Years | 49 (90.7%) | 4 (8.2%) |
| 25 to 29 Years | 77 (95.1%) | 2 (2.6%) |
| 30 to 34 Years | 41 (91.1%) | 0 (0.0%) |
| 35 to 44 Years | 106 (93.0%) | 8 (7.5%) |
| 45 to 54 Years | 89 (92.7%) | 4 (4.5%) |
| 55 to 59 Years | 38 (84.4%) | 5 (13.2%) |
| 60 to 64 Years | 94 (75.2%) | 0 (0.0%) |
| 65 to 74 Years | 13 (16.9%) | 0 (0.0%) |
| 75 Years and over | 3 (4.4%) | 0 (0.0%) |
| Total | 519 (70.5%) | 23 (4.4%) |
Employment Status by Educational Attainment in Baroda
According to labor force statistics for Baroda, 87.9% of individuals (445) out of the total population between 25 and 64 years of age (506) are in the labor force, with 4.3% or 19 of them being unemployed. The group with the highest labor force participation rate are those with the educational attainment of bachelor's degree or higher, with 93.5% or 157 individuals in the labor force. Within the labor force, individuals with less than high school education have the highest percentage of unemployment, with 28.6% or 8 of them being unemployed.
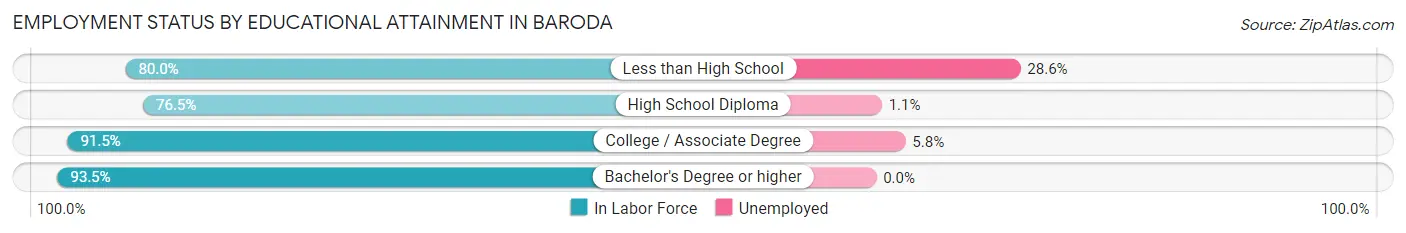
| Educational Attainment | In Labor Force | Unemployed |
| Less than High School | 28 (80.0%) | 10 (28.6%) |
| High School Diploma | 88 (76.5%) | 1 (1.1%) |
| College / Associate Degree | 172 (91.5%) | 11 (5.8%) |
| Bachelor's Degree or higher | 157 (93.5%) | 0 (0.0%) |
| Total | 445 (87.9%) | 22 (4.3%) |
Employment Occupations by Sex in Baroda
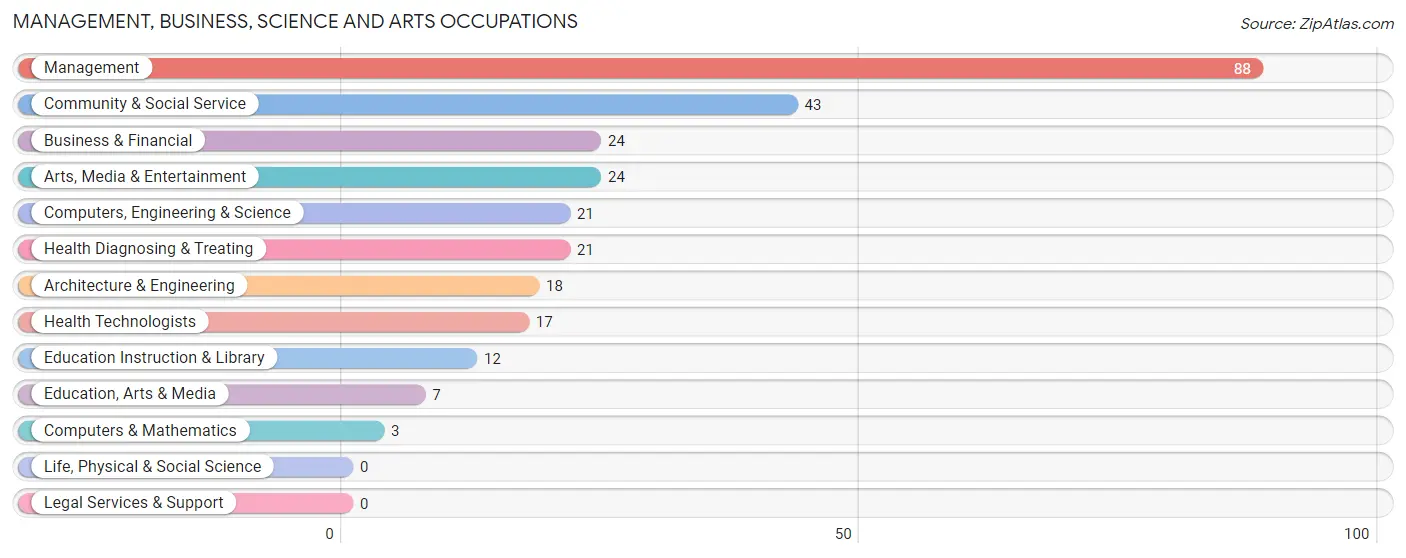
Management, Business, Science and Arts Occupations
The most common Management, Business, Science and Arts occupations in Baroda are Management (88 | 17.7%), Community & Social Service (43 | 8.7%), Business & Financial (24 | 4.8%), Arts, Media & Entertainment (24 | 4.8%), and Computers, Engineering & Science (21 | 4.2%).
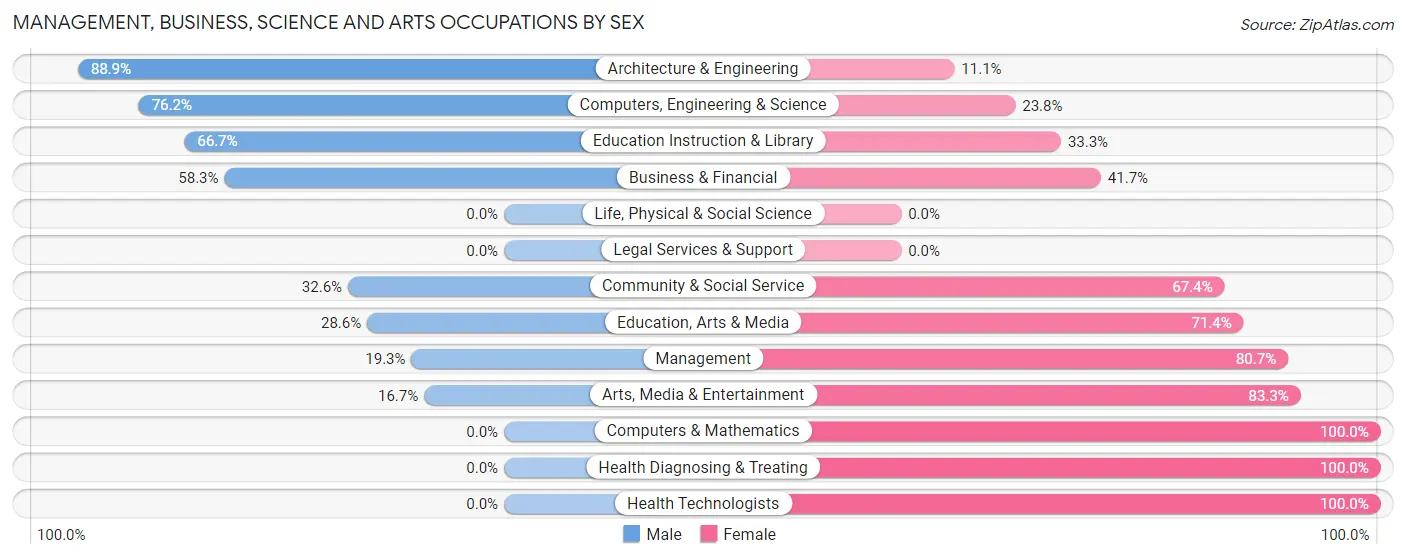
Management, Business, Science and Arts Occupations by Sex
Within the Management, Business, Science and Arts occupations in Baroda, the most male-oriented occupations are Architecture & Engineering (88.9%), Computers, Engineering & Science (76.2%), and Education Instruction & Library (66.7%), while the most female-oriented occupations are Computers & Mathematics (100.0%), Health Diagnosing & Treating (100.0%), and Health Technologists (100.0%).
| Occupation | Male | Female |
| Management | 17 (19.3%) | 71 (80.7%) |
| Business & Financial | 14 (58.3%) | 10 (41.7%) |
| Computers, Engineering & Science | 16 (76.2%) | 5 (23.8%) |
| Computers & Mathematics | 0 (0.0%) | 3 (100.0%) |
| Architecture & Engineering | 16 (88.9%) | 2 (11.1%) |
| Life, Physical & Social Science | 0 (0.0%) | 0 (0.0%) |
| Community & Social Service | 14 (32.6%) | 29 (67.4%) |
| Education, Arts & Media | 2 (28.6%) | 5 (71.4%) |
| Legal Services & Support | 0 (0.0%) | 0 (0.0%) |
| Education Instruction & Library | 8 (66.7%) | 4 (33.3%) |
| Arts, Media & Entertainment | 4 (16.7%) | 20 (83.3%) |
| Health Diagnosing & Treating | 0 (0.0%) | 21 (100.0%) |
| Health Technologists | 0 (0.0%) | 17 (100.0%) |
| Total (Category) | 61 (31.0%) | 136 (69.0%) |
| Total (Overall) | 221 (44.6%) | 275 (55.4%) |
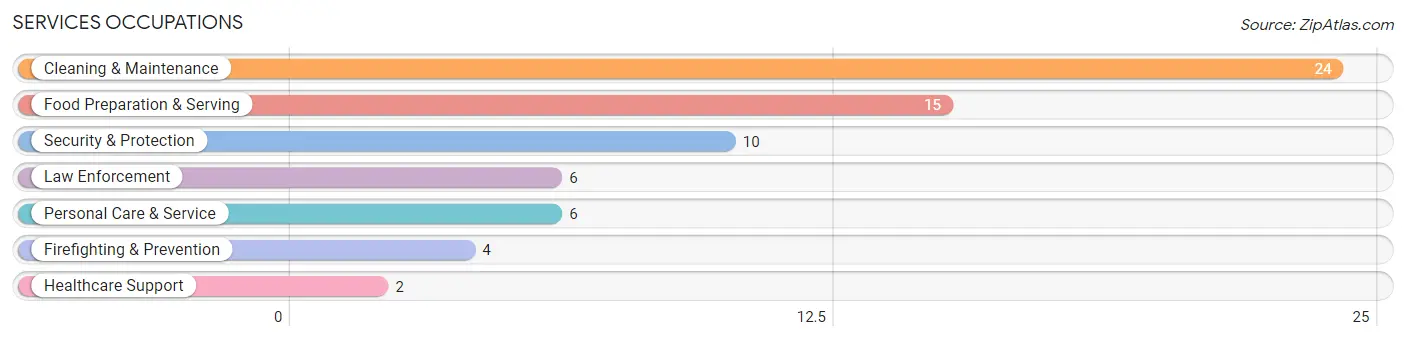
Services Occupations
The most common Services occupations in Baroda are Cleaning & Maintenance (24 | 4.8%), Food Preparation & Serving (15 | 3.0%), Security & Protection (10 | 2.0%), Law Enforcement (6 | 1.2%), and Personal Care & Service (6 | 1.2%).
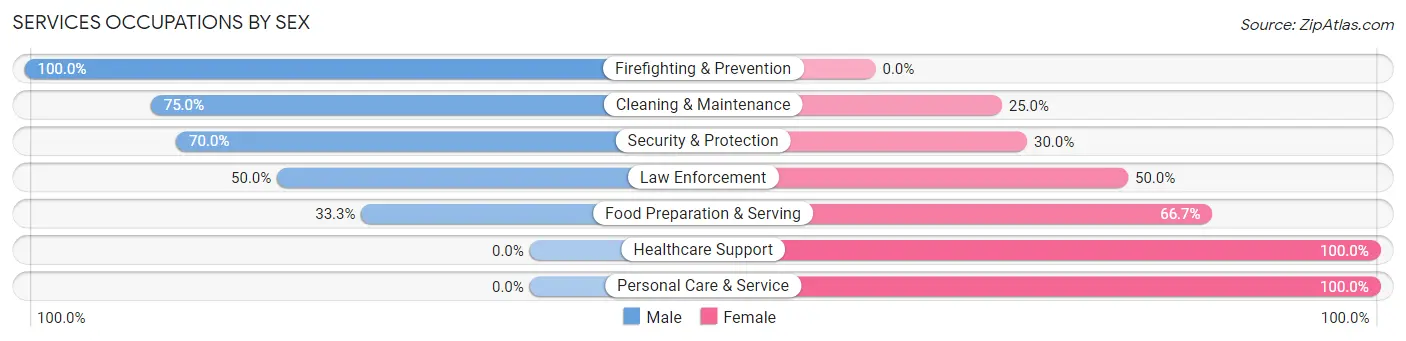
Services Occupations by Sex
Within the Services occupations in Baroda, the most male-oriented occupations are Firefighting & Prevention (100.0%), Cleaning & Maintenance (75.0%), and Security & Protection (70.0%), while the most female-oriented occupations are Healthcare Support (100.0%), Personal Care & Service (100.0%), and Food Preparation & Serving (66.7%).
| Occupation | Male | Female |
| Healthcare Support | 0 (0.0%) | 2 (100.0%) |
| Security & Protection | 7 (70.0%) | 3 (30.0%) |
| Firefighting & Prevention | 4 (100.0%) | 0 (0.0%) |
| Law Enforcement | 3 (50.0%) | 3 (50.0%) |
| Food Preparation & Serving | 5 (33.3%) | 10 (66.7%) |
| Cleaning & Maintenance | 18 (75.0%) | 6 (25.0%) |
| Personal Care & Service | 0 (0.0%) | 6 (100.0%) |
| Total (Category) | 30 (52.6%) | 27 (47.4%) |
| Total (Overall) | 221 (44.6%) | 275 (55.4%) |
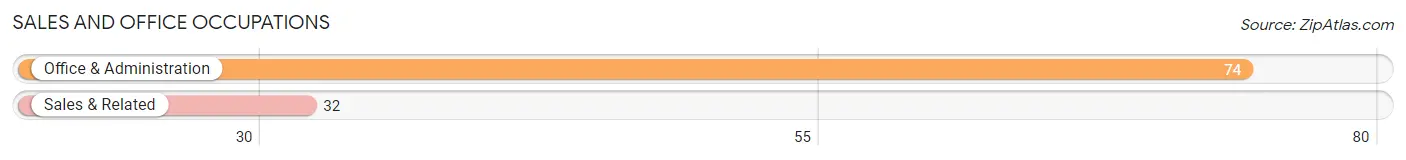
Sales and Office Occupations
The most common Sales and Office occupations in Baroda are Office & Administration (74 | 14.9%), and Sales & Related (32 | 6.5%).
Sales and Office Occupations by Sex
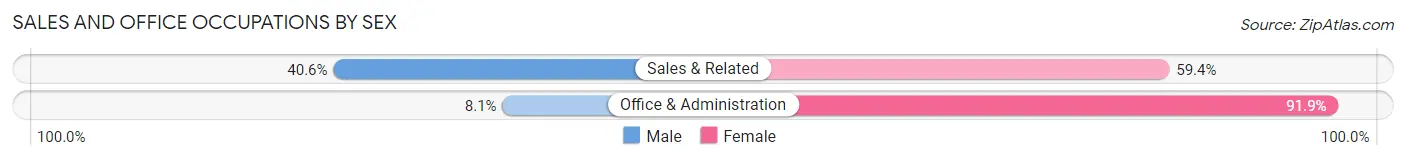
| Occupation | Male | Female |
| Sales & Related | 13 (40.6%) | 19 (59.4%) |
| Office & Administration | 6 (8.1%) | 68 (91.9%) |
| Total (Category) | 19 (17.9%) | 87 (82.1%) |
| Total (Overall) | 221 (44.6%) | 275 (55.4%) |
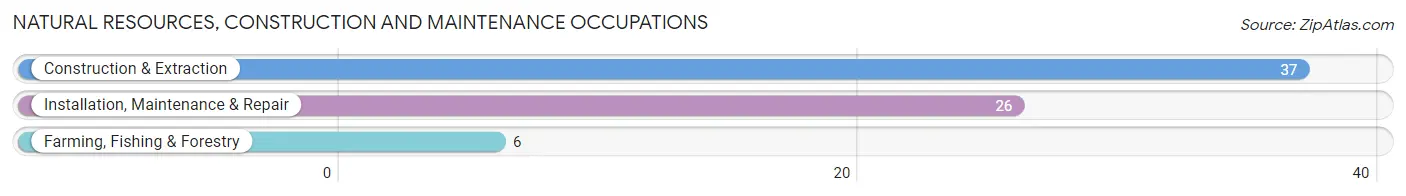
Natural Resources, Construction and Maintenance Occupations
The most common Natural Resources, Construction and Maintenance occupations in Baroda are Construction & Extraction (37 | 7.5%), Installation, Maintenance & Repair (26 | 5.2%), and Farming, Fishing & Forestry (6 | 1.2%).
Natural Resources, Construction and Maintenance Occupations by Sex
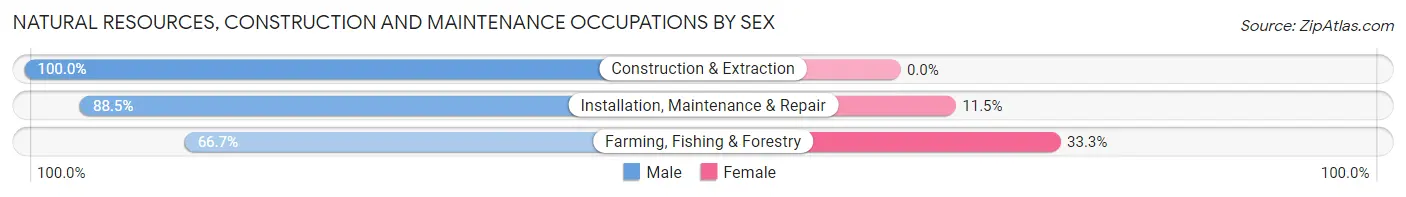
| Occupation | Male | Female |
| Farming, Fishing & Forestry | 4 (66.7%) | 2 (33.3%) |
| Construction & Extraction | 37 (100.0%) | 0 (0.0%) |
| Installation, Maintenance & Repair | 23 (88.5%) | 3 (11.5%) |
| Total (Category) | 64 (92.7%) | 5 (7.2%) |
| Total (Overall) | 221 (44.6%) | 275 (55.4%) |
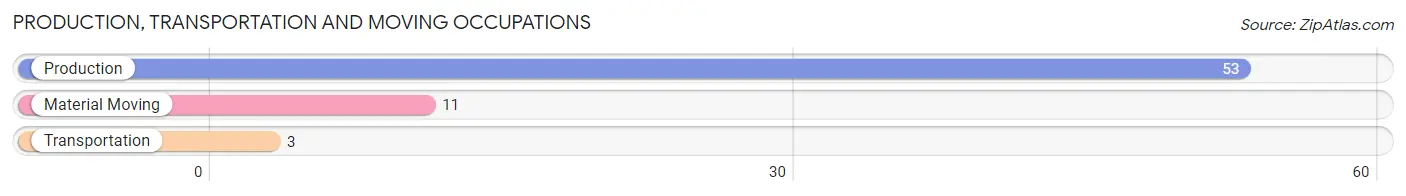
Production, Transportation and Moving Occupations
The most common Production, Transportation and Moving occupations in Baroda are Production (53 | 10.7%), Material Moving (11 | 2.2%), and Transportation (3 | 0.6%).
Production, Transportation and Moving Occupations by Sex
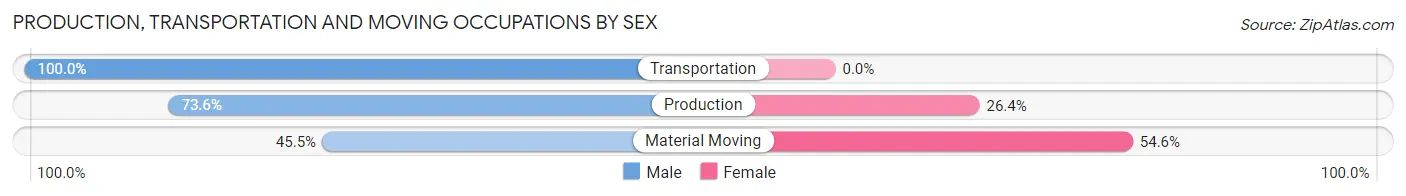
| Occupation | Male | Female |
| Production | 39 (73.6%) | 14 (26.4%) |
| Transportation | 3 (100.0%) | 0 (0.0%) |
| Material Moving | 5 (45.5%) | 6 (54.5%) |
| Total (Category) | 47 (70.2%) | 20 (29.8%) |
| Total (Overall) | 221 (44.6%) | 275 (55.4%) |
Employment Industries by Sex in Baroda
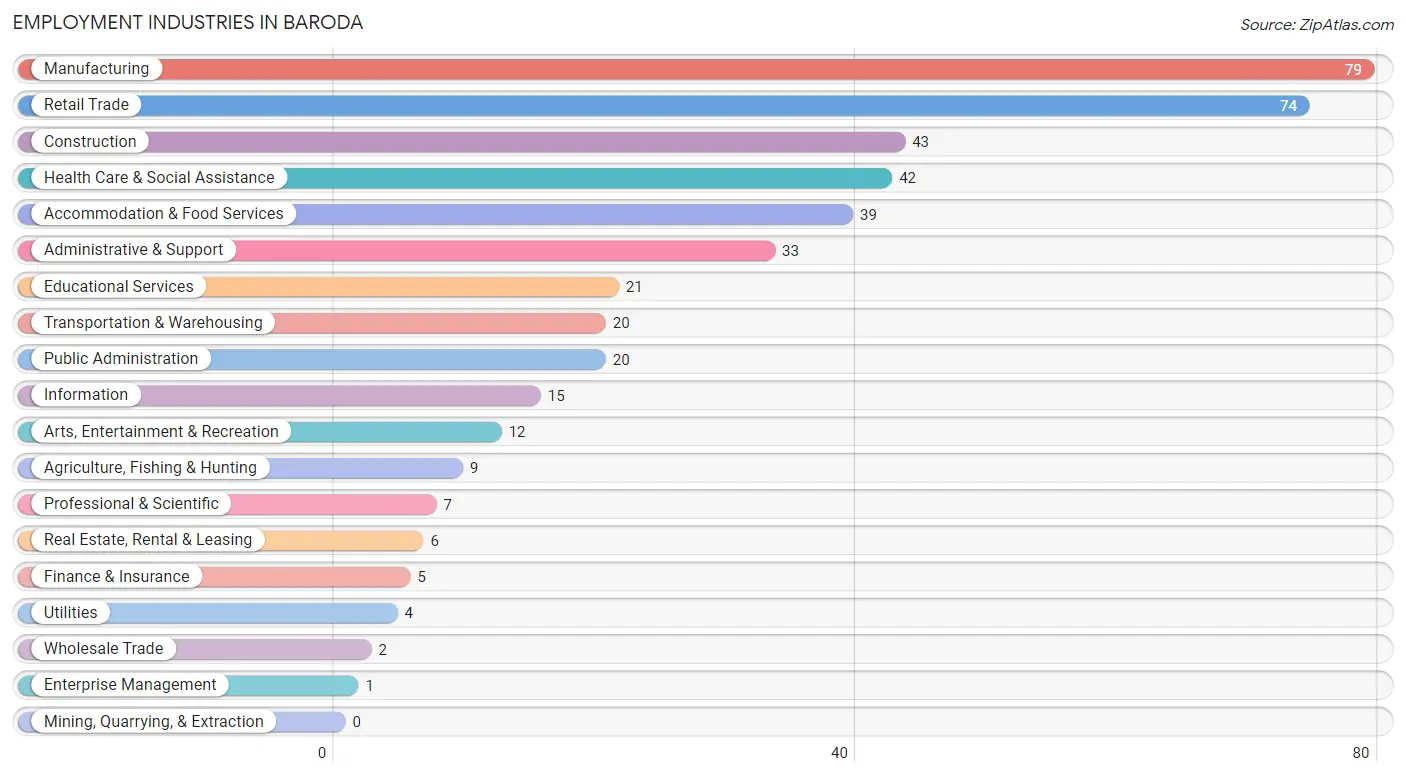
Employment Industries in Baroda
The major employment industries in Baroda include Manufacturing (79 | 15.9%), Retail Trade (74 | 14.9%), Construction (43 | 8.7%), Health Care & Social Assistance (42 | 8.5%), and Accommodation & Food Services (39 | 7.9%).
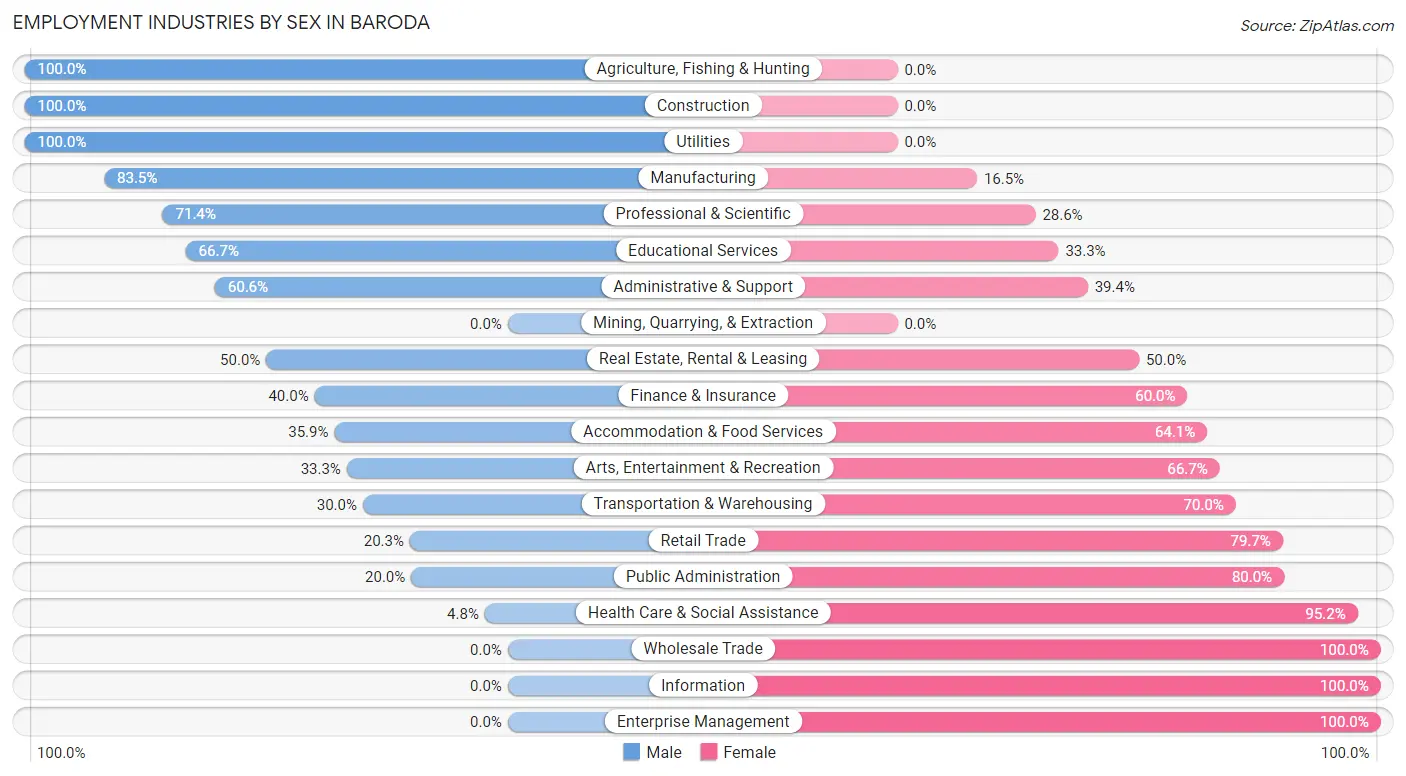
Employment Industries by Sex in Baroda
The Baroda industries that see more men than women are Agriculture, Fishing & Hunting (100.0%), Construction (100.0%), and Utilities (100.0%), whereas the industries that tend to have a higher number of women are Wholesale Trade (100.0%), Information (100.0%), and Enterprise Management (100.0%).
| Industry | Male | Female |
| Agriculture, Fishing & Hunting | 9 (100.0%) | 0 (0.0%) |
| Mining, Quarrying, & Extraction | 0 (0.0%) | 0 (0.0%) |
| Construction | 43 (100.0%) | 0 (0.0%) |
| Manufacturing | 66 (83.5%) | 13 (16.5%) |
| Wholesale Trade | 0 (0.0%) | 2 (100.0%) |
| Retail Trade | 15 (20.3%) | 59 (79.7%) |
| Transportation & Warehousing | 6 (30.0%) | 14 (70.0%) |
| Utilities | 4 (100.0%) | 0 (0.0%) |
| Information | 0 (0.0%) | 15 (100.0%) |
| Finance & Insurance | 2 (40.0%) | 3 (60.0%) |
| Real Estate, Rental & Leasing | 3 (50.0%) | 3 (50.0%) |
| Professional & Scientific | 5 (71.4%) | 2 (28.6%) |
| Enterprise Management | 0 (0.0%) | 1 (100.0%) |
| Administrative & Support | 20 (60.6%) | 13 (39.4%) |
| Educational Services | 14 (66.7%) | 7 (33.3%) |
| Health Care & Social Assistance | 2 (4.8%) | 40 (95.2%) |
| Arts, Entertainment & Recreation | 4 (33.3%) | 8 (66.7%) |
| Accommodation & Food Services | 14 (35.9%) | 25 (64.1%) |
| Public Administration | 4 (20.0%) | 16 (80.0%) |
| Total | 221 (44.6%) | 275 (55.4%) |
Education in Baroda
School Enrollment in Baroda
The most common levels of schooling among the 203 students in Baroda are middle school (49 | 24.1%), college / undergraduate (47 | 23.2%), and elementary school (41 | 20.2%).
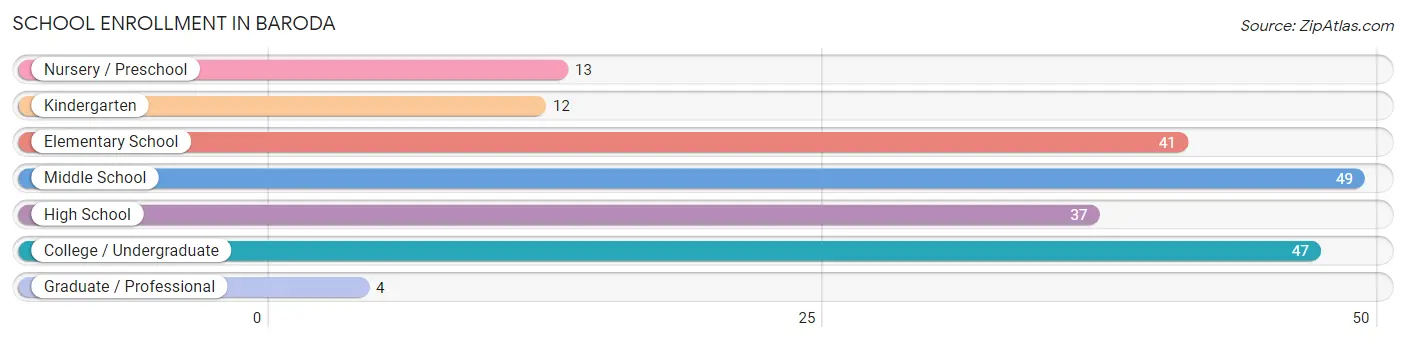
| School Level | # Students | % Students |
| Nursery / Preschool | 13 | 6.4% |
| Kindergarten | 12 | 5.9% |
| Elementary School | 41 | 20.2% |
| Middle School | 49 | 24.1% |
| High School | 37 | 18.2% |
| College / Undergraduate | 47 | 23.2% |
| Graduate / Professional | 4 | 2.0% |
| Total | 203 | 100.0% |
School Enrollment by Age by Funding Source in Baroda
Out of a total of 203 students who are enrolled in schools in Baroda, 21 (10.3%) attend a private institution, while the remaining 182 (89.7%) are enrolled in public schools. The age group of 15 to 17 year olds has the highest likelihood of being enrolled in private schools, with 11 (44.0% in the age bracket) enrolled. Conversely, the age group of 18 to 19 year olds has the lowest likelihood of being enrolled in a private school, with 12 (100.0% in the age bracket) attending a public institution.
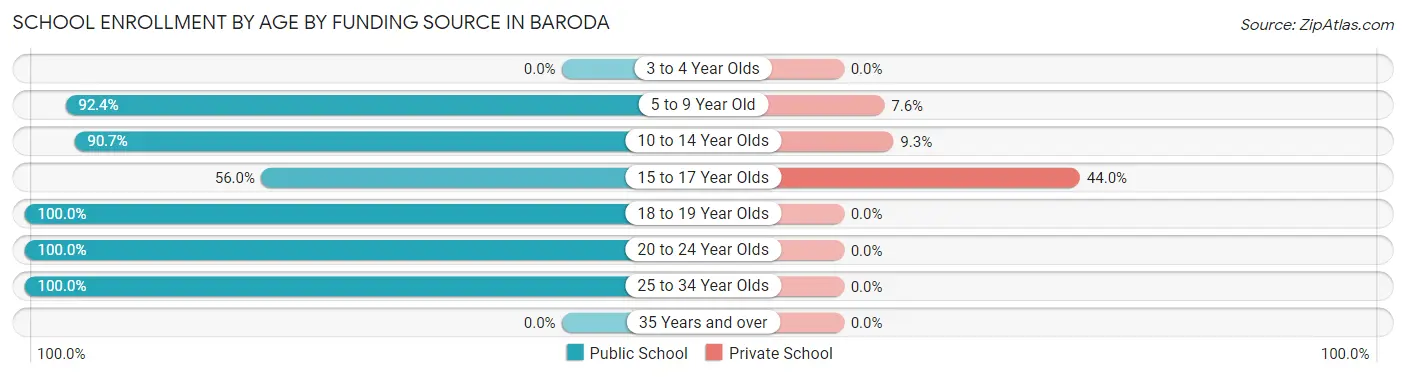
| Age Bracket | Public School | Private School |
| 3 to 4 Year Olds | 0 (0.0%) | 0 (0.0%) |
| 5 to 9 Year Old | 61 (92.4%) | 5 (7.6%) |
| 10 to 14 Year Olds | 49 (90.7%) | 5 (9.3%) |
| 15 to 17 Year Olds | 14 (56.0%) | 11 (44.0%) |
| 18 to 19 Year Olds | 12 (100.0%) | 0 (0.0%) |
| 20 to 24 Year Olds | 18 (100.0%) | 0 (0.0%) |
| 25 to 34 Year Olds | 28 (100.0%) | 0 (0.0%) |
| 35 Years and over | 0 (0.0%) | 0 (0.0%) |
| Total | 182 (89.7%) | 21 (10.3%) |
Educational Attainment by Field of Study in Baroda
Education (69 | 35.2%), business (32 | 16.3%), arts & humanities (24 | 12.2%), engineering (21 | 10.7%), and communications (16 | 8.2%) are the most common fields of study among 196 individuals in Baroda who have obtained a bachelor's degree or higher.
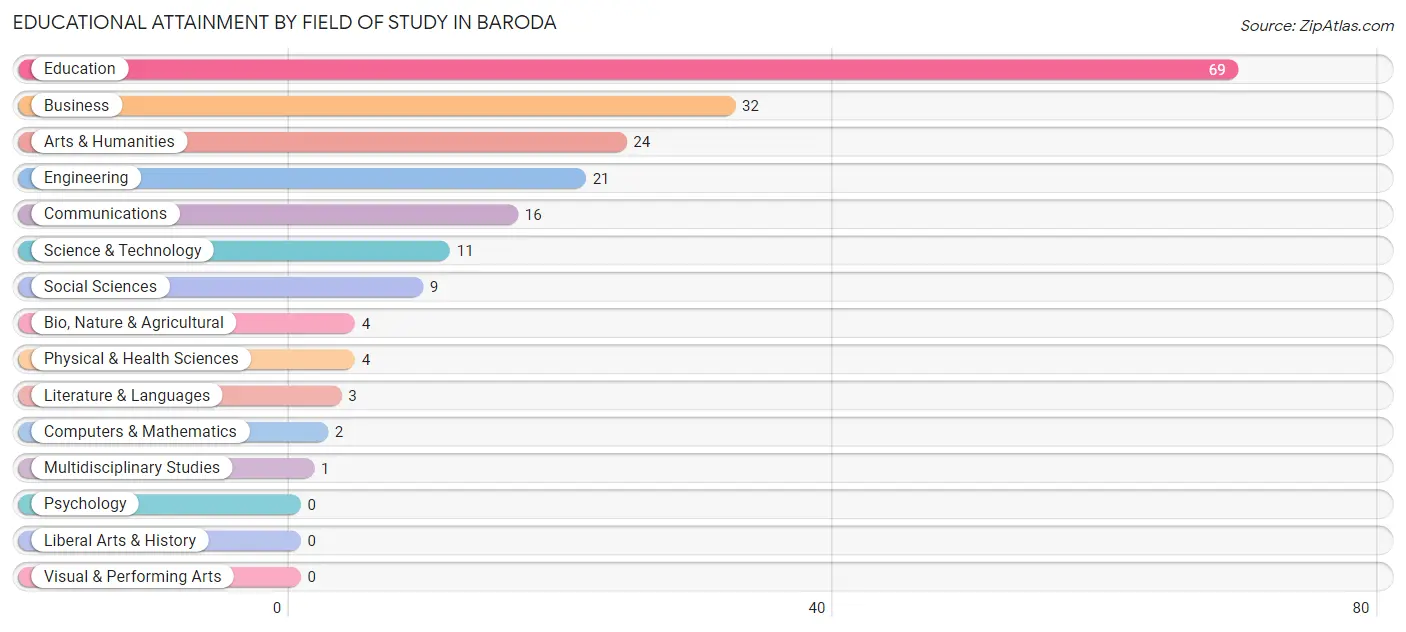
| Field of Study | # Graduates | % Graduates |
| Computers & Mathematics | 2 | 1.0% |
| Bio, Nature & Agricultural | 4 | 2.0% |
| Physical & Health Sciences | 4 | 2.0% |
| Psychology | 0 | 0.0% |
| Social Sciences | 9 | 4.6% |
| Engineering | 21 | 10.7% |
| Multidisciplinary Studies | 1 | 0.5% |
| Science & Technology | 11 | 5.6% |
| Business | 32 | 16.3% |
| Education | 69 | 35.2% |
| Literature & Languages | 3 | 1.5% |
| Liberal Arts & History | 0 | 0.0% |
| Visual & Performing Arts | 0 | 0.0% |
| Communications | 16 | 8.2% |
| Arts & Humanities | 24 | 12.2% |
| Total | 196 | 100.0% |
Transportation & Commute in Baroda
Vehicle Availability by Sex in Baroda
The most prevalent vehicle ownership categories in Baroda are males with 2 vehicles (100, accounting for 45.3%) and females with 2 vehicles (138, making up 36.6%).
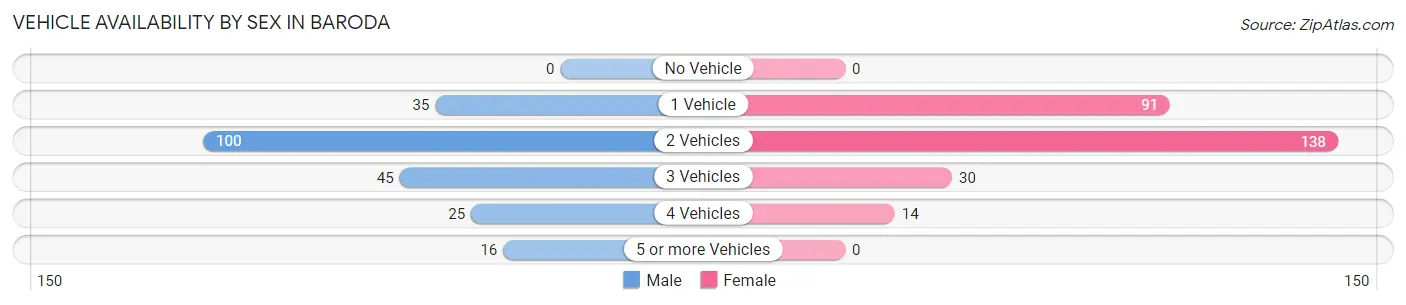
| Vehicles Available | Male | Female |
| No Vehicle | 0 (0.0%) | 0 (0.0%) |
| 1 Vehicle | 35 (15.8%) | 91 (33.3%) |
| 2 Vehicles | 100 (45.3%) | 138 (50.5%) |
| 3 Vehicles | 45 (20.4%) | 30 (11.0%) |
| 4 Vehicles | 25 (11.3%) | 14 (5.1%) |
| 5 or more Vehicles | 16 (7.2%) | 0 (0.0%) |
| Total | 221 (100.0%) | 273 (100.0%) |
Commute Time in Baroda
The most frequently occuring commute durations in Baroda are 15 to 19 minutes (100 commuters, 21.5%), 10 to 14 minutes (90 commuters, 19.3%), and 20 to 24 minutes (90 commuters, 19.3%).
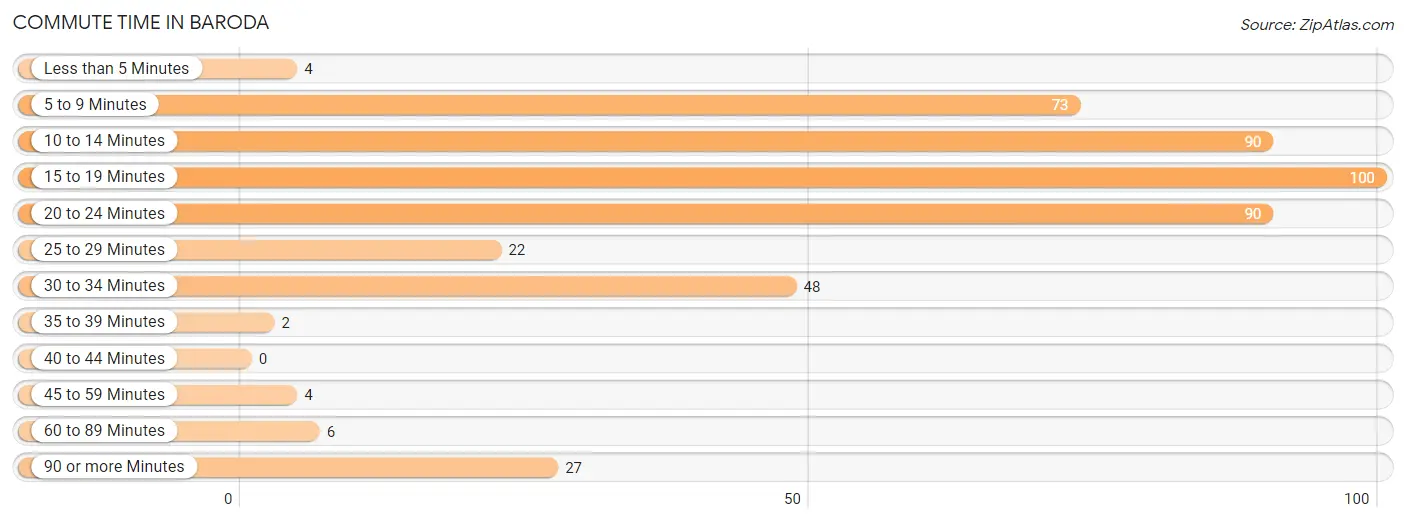
| Commute Time | # Commuters | % Commuters |
| Less than 5 Minutes | 4 | 0.9% |
| 5 to 9 Minutes | 73 | 15.7% |
| 10 to 14 Minutes | 90 | 19.3% |
| 15 to 19 Minutes | 100 | 21.5% |
| 20 to 24 Minutes | 90 | 19.3% |
| 25 to 29 Minutes | 22 | 4.7% |
| 30 to 34 Minutes | 48 | 10.3% |
| 35 to 39 Minutes | 2 | 0.4% |
| 40 to 44 Minutes | 0 | 0.0% |
| 45 to 59 Minutes | 4 | 0.9% |
| 60 to 89 Minutes | 6 | 1.3% |
| 90 or more Minutes | 27 | 5.8% |
Commute Time by Sex in Baroda
The most common commute times in Baroda are 20 to 24 minutes (50 commuters, 23.6%) for males and 10 to 14 minutes (67 commuters, 26.4%) for females.
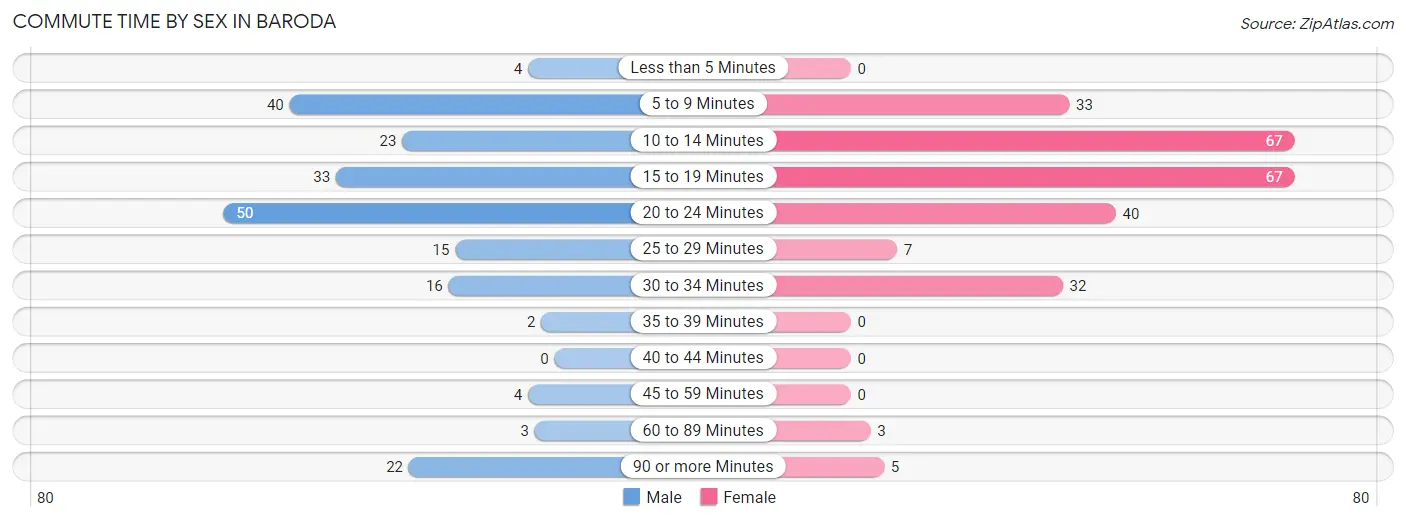
| Commute Time | Male | Female |
| Less than 5 Minutes | 4 (1.9%) | 0 (0.0%) |
| 5 to 9 Minutes | 40 (18.9%) | 33 (13.0%) |
| 10 to 14 Minutes | 23 (10.8%) | 67 (26.4%) |
| 15 to 19 Minutes | 33 (15.6%) | 67 (26.4%) |
| 20 to 24 Minutes | 50 (23.6%) | 40 (15.8%) |
| 25 to 29 Minutes | 15 (7.1%) | 7 (2.8%) |
| 30 to 34 Minutes | 16 (7.5%) | 32 (12.6%) |
| 35 to 39 Minutes | 2 (0.9%) | 0 (0.0%) |
| 40 to 44 Minutes | 0 (0.0%) | 0 (0.0%) |
| 45 to 59 Minutes | 4 (1.9%) | 0 (0.0%) |
| 60 to 89 Minutes | 3 (1.4%) | 3 (1.2%) |
| 90 or more Minutes | 22 (10.4%) | 5 (2.0%) |
Time of Departure to Work by Sex in Baroda
The most frequent times of departure to work in Baroda are 9:00 AM to 9:59 AM (32, 15.1%) for males and 7:30 AM to 7:59 AM (90, 35.4%) for females.
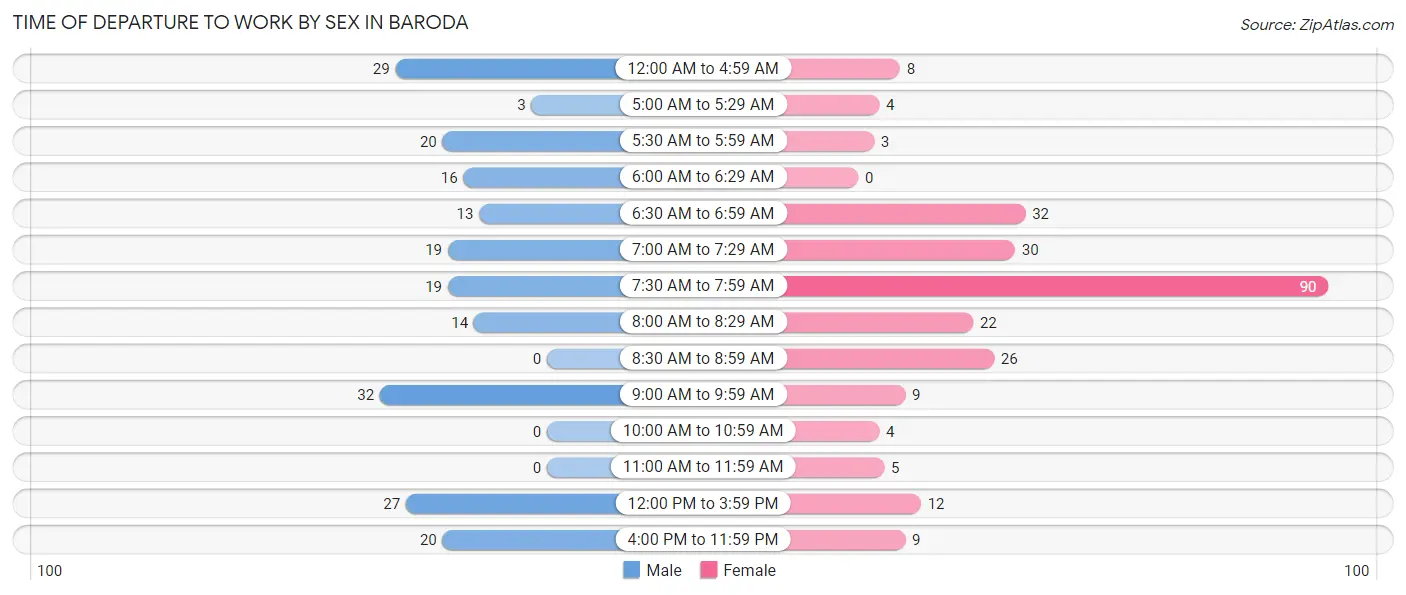
| Time of Departure | Male | Female |
| 12:00 AM to 4:59 AM | 29 (13.7%) | 8 (3.2%) |
| 5:00 AM to 5:29 AM | 3 (1.4%) | 4 (1.6%) |
| 5:30 AM to 5:59 AM | 20 (9.4%) | 3 (1.2%) |
| 6:00 AM to 6:29 AM | 16 (7.5%) | 0 (0.0%) |
| 6:30 AM to 6:59 AM | 13 (6.1%) | 32 (12.6%) |
| 7:00 AM to 7:29 AM | 19 (9.0%) | 30 (11.8%) |
| 7:30 AM to 7:59 AM | 19 (9.0%) | 90 (35.4%) |
| 8:00 AM to 8:29 AM | 14 (6.6%) | 22 (8.7%) |
| 8:30 AM to 8:59 AM | 0 (0.0%) | 26 (10.2%) |
| 9:00 AM to 9:59 AM | 32 (15.1%) | 9 (3.5%) |
| 10:00 AM to 10:59 AM | 0 (0.0%) | 4 (1.6%) |
| 11:00 AM to 11:59 AM | 0 (0.0%) | 5 (2.0%) |
| 12:00 PM to 3:59 PM | 27 (12.7%) | 12 (4.7%) |
| 4:00 PM to 11:59 PM | 20 (9.4%) | 9 (3.5%) |
| Total | 212 (100.0%) | 254 (100.0%) |
Housing Occupancy in Baroda
Occupancy by Ownership in Baroda
Of the total 407 dwellings in Baroda, owner-occupied units account for 342 (84.0%), while renter-occupied units make up 65 (16.0%).
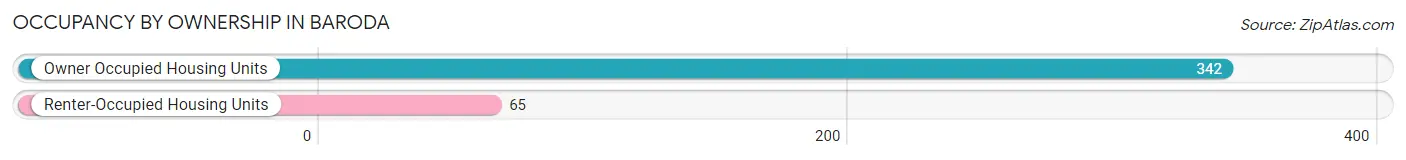
| Occupancy | # Housing Units | % Housing Units |
| Owner Occupied Housing Units | 342 | 84.0% |
| Renter-Occupied Housing Units | 65 | 16.0% |
| Total Occupied Housing Units | 407 | 100.0% |
Occupancy by Household Size in Baroda
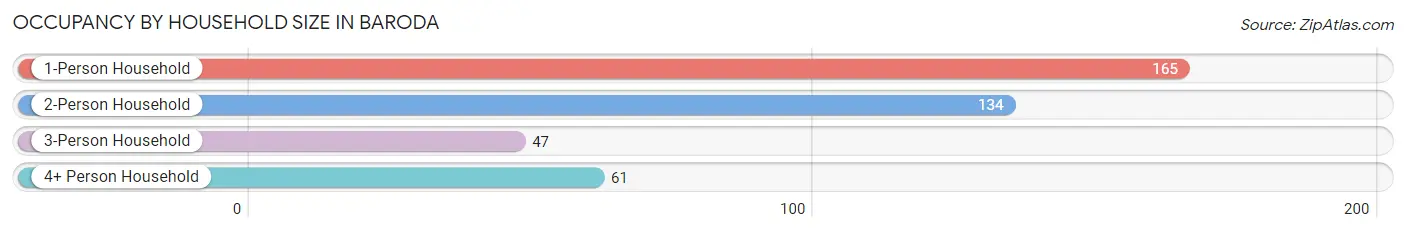
| Household Size | # Housing Units | % Housing Units |
| 1-Person Household | 165 | 40.5% |
| 2-Person Household | 134 | 32.9% |
| 3-Person Household | 47 | 11.6% |
| 4+ Person Household | 61 | 15.0% |
| Total Housing Units | 407 | 100.0% |
Occupancy by Ownership by Household Size in Baroda
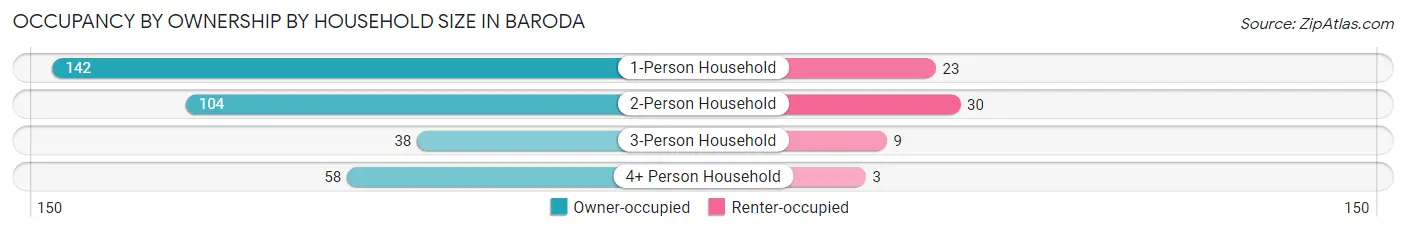
| Household Size | Owner-occupied | Renter-occupied |
| 1-Person Household | 142 (86.1%) | 23 (13.9%) |
| 2-Person Household | 104 (77.6%) | 30 (22.4%) |
| 3-Person Household | 38 (80.8%) | 9 (19.2%) |
| 4+ Person Household | 58 (95.1%) | 3 (4.9%) |
| Total Housing Units | 342 (84.0%) | 65 (16.0%) |
Occupancy by Educational Attainment in Baroda
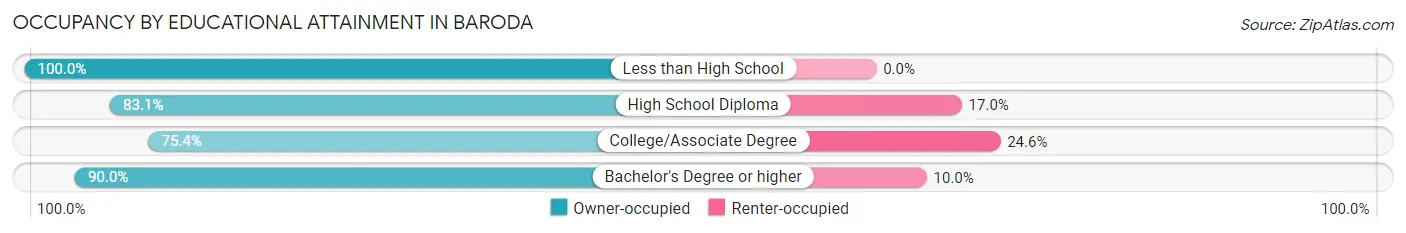
| Household Size | Owner-occupied | Renter-occupied |
| Less than High School | 23 (100.0%) | 0 (0.0%) |
| High School Diploma | 98 (83.1%) | 20 (17.0%) |
| College/Associate Degree | 95 (75.4%) | 31 (24.6%) |
| Bachelor's Degree or higher | 126 (90.0%) | 14 (10.0%) |
Occupancy by Age of Householder in Baroda
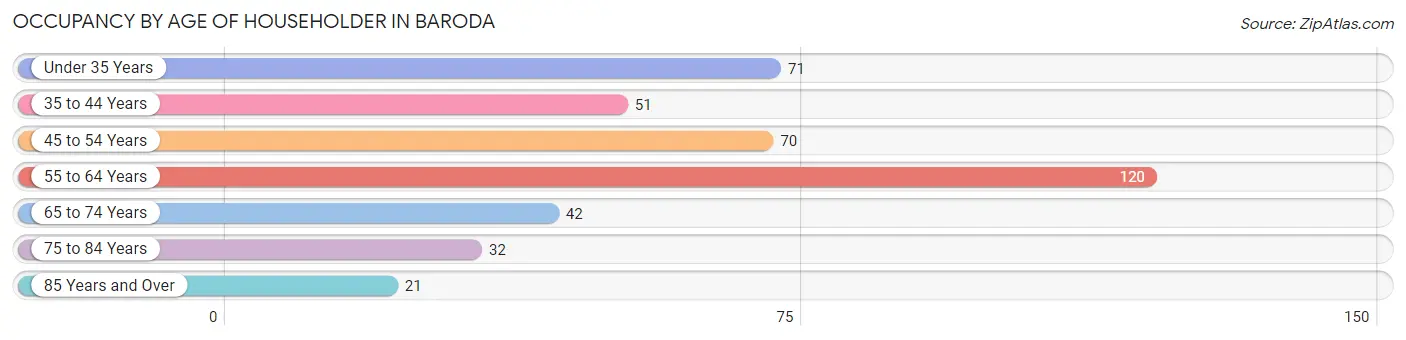
| Age Bracket | # Households | % Households |
| Under 35 Years | 71 | 17.4% |
| 35 to 44 Years | 51 | 12.5% |
| 45 to 54 Years | 70 | 17.2% |
| 55 to 64 Years | 120 | 29.5% |
| 65 to 74 Years | 42 | 10.3% |
| 75 to 84 Years | 32 | 7.9% |
| 85 Years and Over | 21 | 5.2% |
| Total | 407 | 100.0% |
Housing Finances in Baroda
Median Income by Occupancy in Baroda
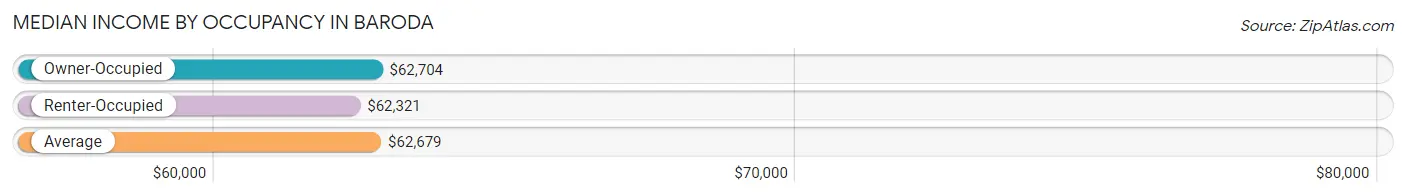
| Occupancy Type | # Households | Median Income |
| Owner-Occupied | 342 (84.0%) | $62,704 |
| Renter-Occupied | 65 (16.0%) | $62,321 |
| Average | 407 (100.0%) | $62,679 |
Occupancy by Householder Income Bracket in Baroda
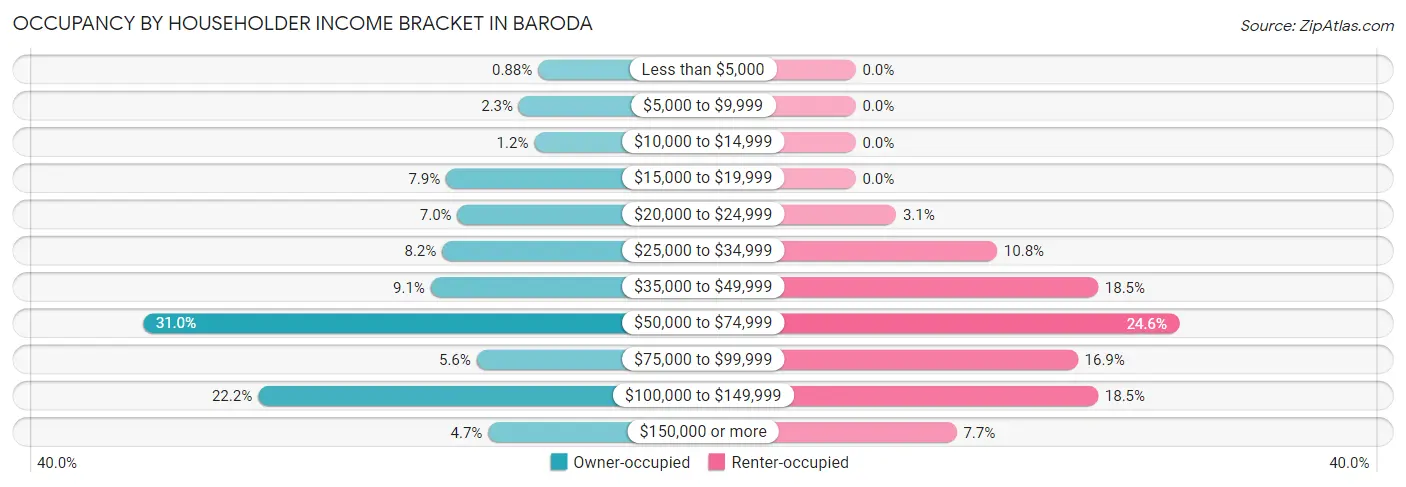
| Income Bracket | Owner-occupied | Renter-occupied |
| Less than $5,000 | 3 (0.9%) | 0 (0.0%) |
| $5,000 to $9,999 | 8 (2.3%) | 0 (0.0%) |
| $10,000 to $14,999 | 4 (1.2%) | 0 (0.0%) |
| $15,000 to $19,999 | 27 (7.9%) | 0 (0.0%) |
| $20,000 to $24,999 | 24 (7.0%) | 2 (3.1%) |
| $25,000 to $34,999 | 28 (8.2%) | 7 (10.8%) |
| $35,000 to $49,999 | 31 (9.1%) | 12 (18.5%) |
| $50,000 to $74,999 | 106 (31.0%) | 16 (24.6%) |
| $75,000 to $99,999 | 19 (5.6%) | 11 (16.9%) |
| $100,000 to $149,999 | 76 (22.2%) | 12 (18.5%) |
| $150,000 or more | 16 (4.7%) | 5 (7.7%) |
| Total | 342 (100.0%) | 65 (100.0%) |
Monthly Housing Cost Tiers in Baroda
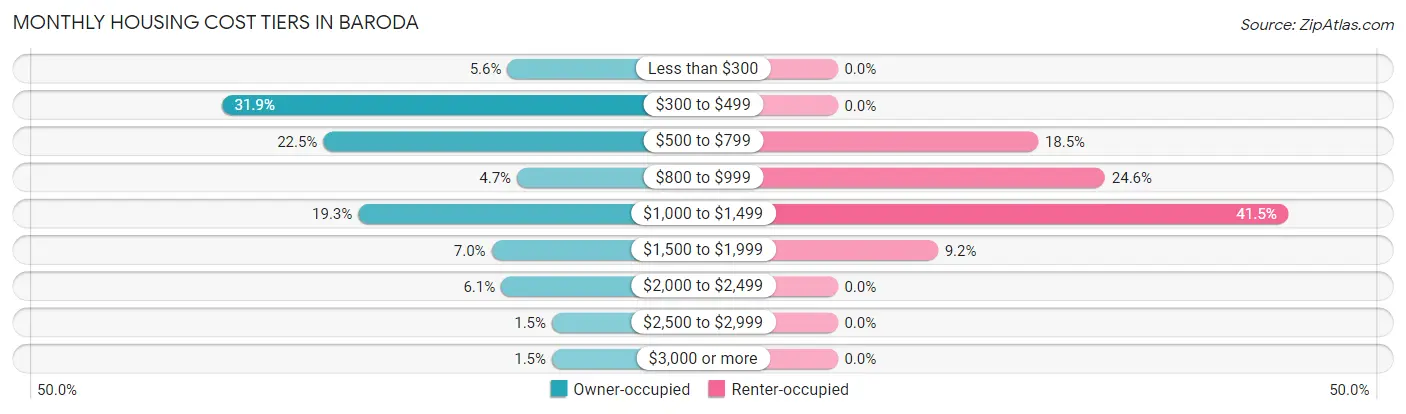
| Monthly Cost | Owner-occupied | Renter-occupied |
| Less than $300 | 19 (5.6%) | 0 (0.0%) |
| $300 to $499 | 109 (31.9%) | 0 (0.0%) |
| $500 to $799 | 77 (22.5%) | 12 (18.5%) |
| $800 to $999 | 16 (4.7%) | 16 (24.6%) |
| $1,000 to $1,499 | 66 (19.3%) | 27 (41.5%) |
| $1,500 to $1,999 | 24 (7.0%) | 6 (9.2%) |
| $2,000 to $2,499 | 21 (6.1%) | 0 (0.0%) |
| $2,500 to $2,999 | 5 (1.5%) | 0 (0.0%) |
| $3,000 or more | 5 (1.5%) | 0 (0.0%) |
| Total | 342 (100.0%) | 65 (100.0%) |
Physical Housing Characteristics in Baroda
Housing Structures in Baroda
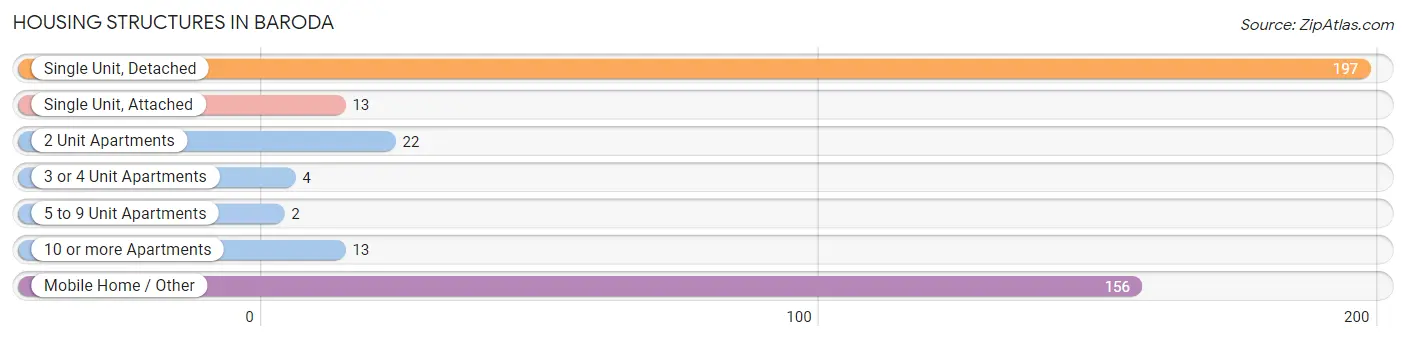
| Structure Type | # Housing Units | % Housing Units |
| Single Unit, Detached | 197 | 48.4% |
| Single Unit, Attached | 13 | 3.2% |
| 2 Unit Apartments | 22 | 5.4% |
| 3 or 4 Unit Apartments | 4 | 1.0% |
| 5 to 9 Unit Apartments | 2 | 0.5% |
| 10 or more Apartments | 13 | 3.2% |
| Mobile Home / Other | 156 | 38.3% |
| Total | 407 | 100.0% |
Housing Structures by Occupancy in Baroda
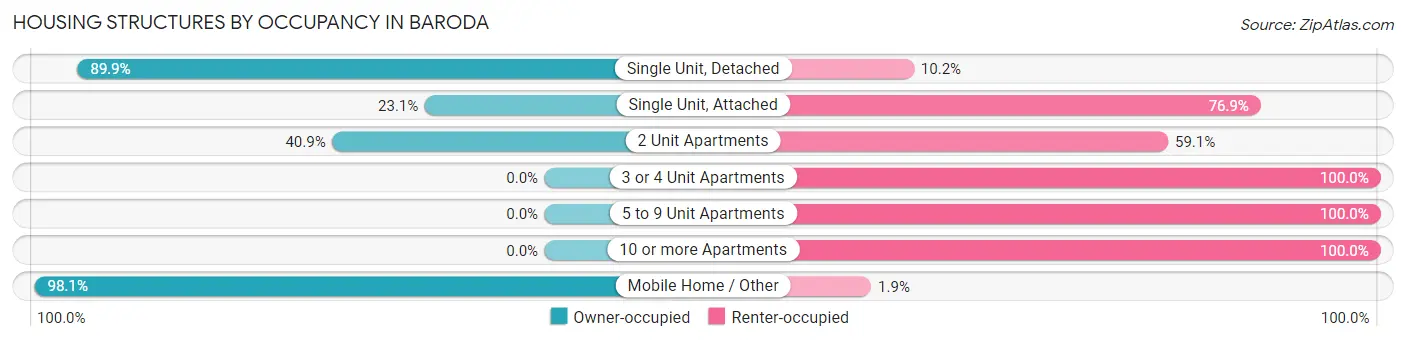
| Structure Type | Owner-occupied | Renter-occupied |
| Single Unit, Detached | 177 (89.8%) | 20 (10.2%) |
| Single Unit, Attached | 3 (23.1%) | 10 (76.9%) |
| 2 Unit Apartments | 9 (40.9%) | 13 (59.1%) |
| 3 or 4 Unit Apartments | 0 (0.0%) | 4 (100.0%) |
| 5 to 9 Unit Apartments | 0 (0.0%) | 2 (100.0%) |
| 10 or more Apartments | 0 (0.0%) | 13 (100.0%) |
| Mobile Home / Other | 153 (98.1%) | 3 (1.9%) |
| Total | 342 (84.0%) | 65 (16.0%) |
Housing Structures by Number of Rooms in Baroda
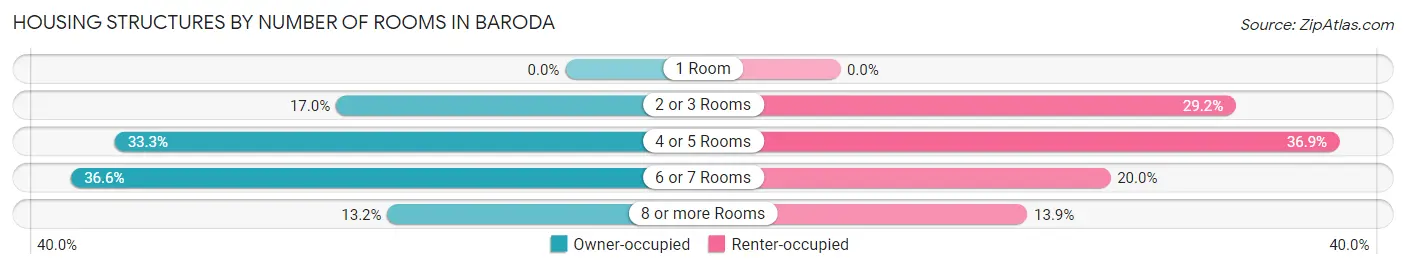
| Number of Rooms | Owner-occupied | Renter-occupied |
| 1 Room | 0 (0.0%) | 0 (0.0%) |
| 2 or 3 Rooms | 58 (17.0%) | 19 (29.2%) |
| 4 or 5 Rooms | 114 (33.3%) | 24 (36.9%) |
| 6 or 7 Rooms | 125 (36.5%) | 13 (20.0%) |
| 8 or more Rooms | 45 (13.2%) | 9 (13.9%) |
| Total | 342 (100.0%) | 65 (100.0%) |
Housing Structure by Heating Type in Baroda
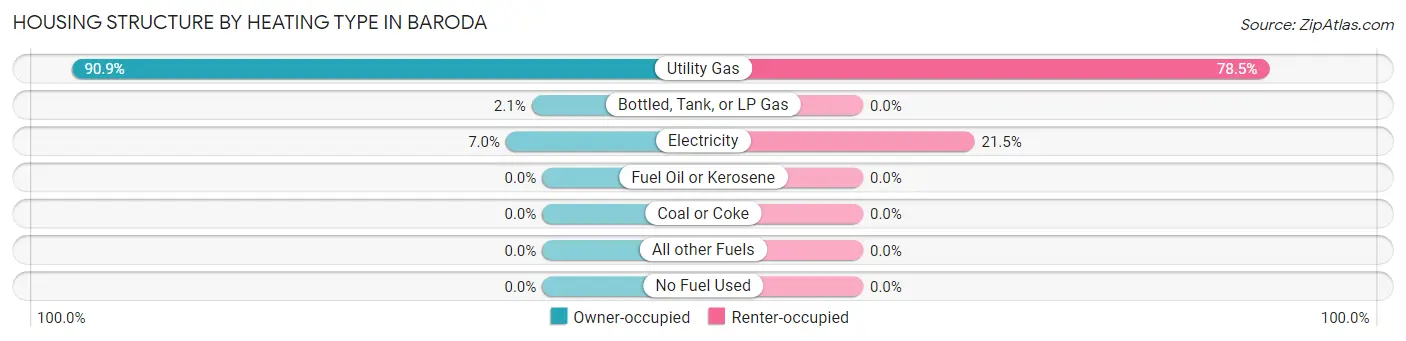
| Heating Type | Owner-occupied | Renter-occupied |
| Utility Gas | 311 (90.9%) | 51 (78.5%) |
| Bottled, Tank, or LP Gas | 7 (2.1%) | 0 (0.0%) |
| Electricity | 24 (7.0%) | 14 (21.5%) |
| Fuel Oil or Kerosene | 0 (0.0%) | 0 (0.0%) |
| Coal or Coke | 0 (0.0%) | 0 (0.0%) |
| All other Fuels | 0 (0.0%) | 0 (0.0%) |
| No Fuel Used | 0 (0.0%) | 0 (0.0%) |
| Total | 342 (100.0%) | 65 (100.0%) |
Household Vehicle Usage in Baroda
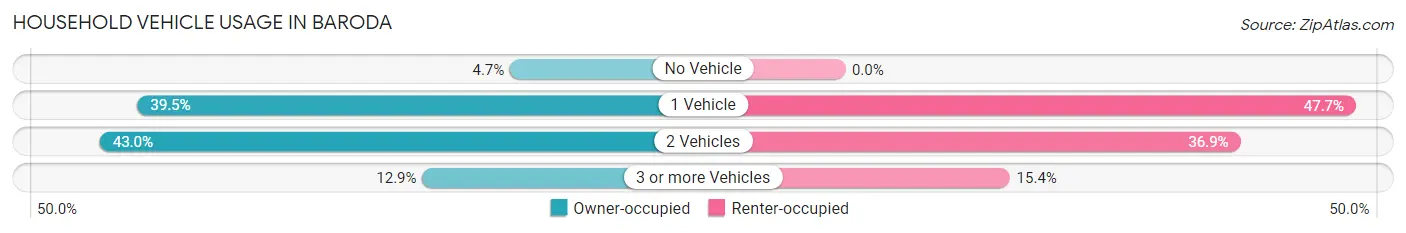
| Vehicles per Household | Owner-occupied | Renter-occupied |
| No Vehicle | 16 (4.7%) | 0 (0.0%) |
| 1 Vehicle | 135 (39.5%) | 31 (47.7%) |
| 2 Vehicles | 147 (43.0%) | 24 (36.9%) |
| 3 or more Vehicles | 44 (12.9%) | 10 (15.4%) |
| Total | 342 (100.0%) | 65 (100.0%) |
Real Estate & Mortgages in Baroda
Real Estate and Mortgage Overview in Baroda
| Characteristic | Without Mortgage | With Mortgage |
| Housing Units | 206 | 136 |
| Median Property Value | $13,100 | $191,300 |
| Median Household Income | $49,000 | $13 |
| Monthly Housing Costs | $473 | $5 |
| Real Estate Taxes | $2,891 | $5 |
Property Value by Mortgage Status in Baroda
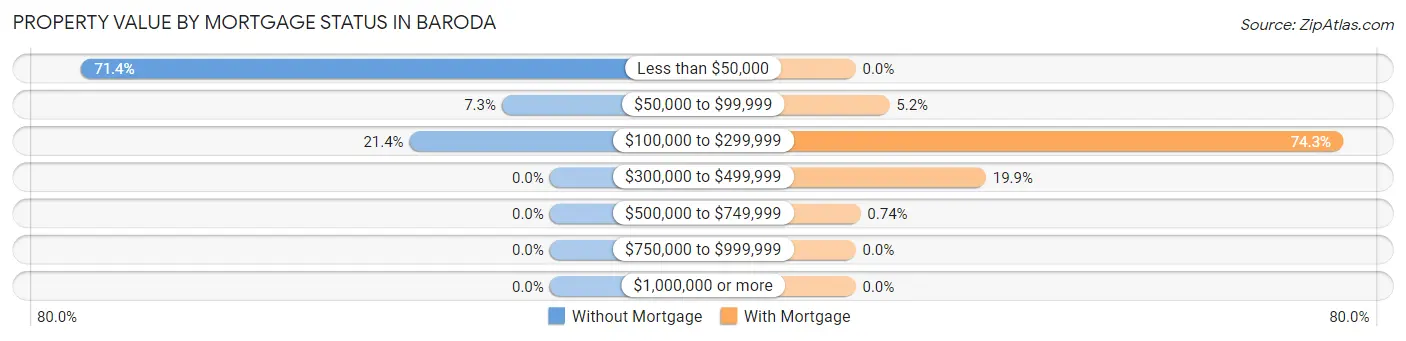
| Property Value | Without Mortgage | With Mortgage |
| Less than $50,000 | 147 (71.4%) | 0 (0.0%) |
| $50,000 to $99,999 | 15 (7.3%) | 7 (5.1%) |
| $100,000 to $299,999 | 44 (21.4%) | 101 (74.3%) |
| $300,000 to $499,999 | 0 (0.0%) | 27 (19.9%) |
| $500,000 to $749,999 | 0 (0.0%) | 1 (0.7%) |
| $750,000 to $999,999 | 0 (0.0%) | 0 (0.0%) |
| $1,000,000 or more | 0 (0.0%) | 0 (0.0%) |
| Total | 206 (100.0%) | 136 (100.0%) |
Household Income by Mortgage Status in Baroda
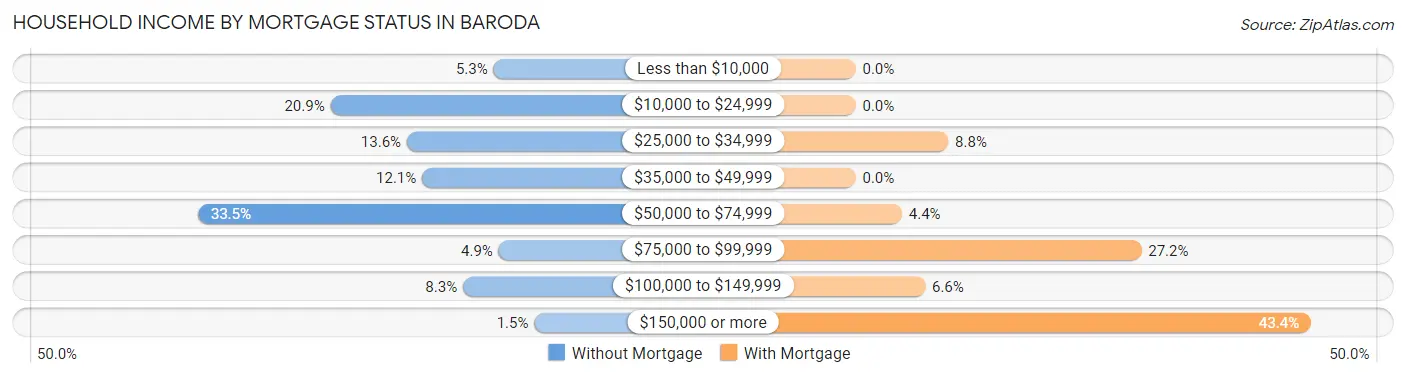
| Household Income | Without Mortgage | With Mortgage |
| Less than $10,000 | 11 (5.3%) | 0 (0.0%) |
| $10,000 to $24,999 | 43 (20.9%) | 0 (0.0%) |
| $25,000 to $34,999 | 28 (13.6%) | 12 (8.8%) |
| $35,000 to $49,999 | 25 (12.1%) | 0 (0.0%) |
| $50,000 to $74,999 | 69 (33.5%) | 6 (4.4%) |
| $75,000 to $99,999 | 10 (4.9%) | 37 (27.2%) |
| $100,000 to $149,999 | 17 (8.3%) | 9 (6.6%) |
| $150,000 or more | 3 (1.5%) | 59 (43.4%) |
| Total | 206 (100.0%) | 136 (100.0%) |
Property Value to Household Income Ratio in Baroda
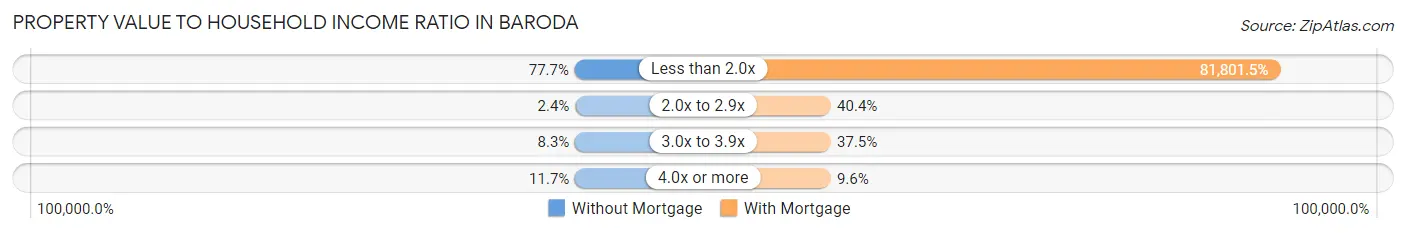
| Value-to-Income Ratio | Without Mortgage | With Mortgage |
| Less than 2.0x | 160 (77.7%) | 111,250 (81,801.5%) |
| 2.0x to 2.9x | 5 (2.4%) | 55 (40.4%) |
| 3.0x to 3.9x | 17 (8.3%) | 51 (37.5%) |
| 4.0x or more | 24 (11.7%) | 13 (9.6%) |
| Total | 206 (100.0%) | 136 (100.0%) |
Real Estate Taxes by Mortgage Status in Baroda
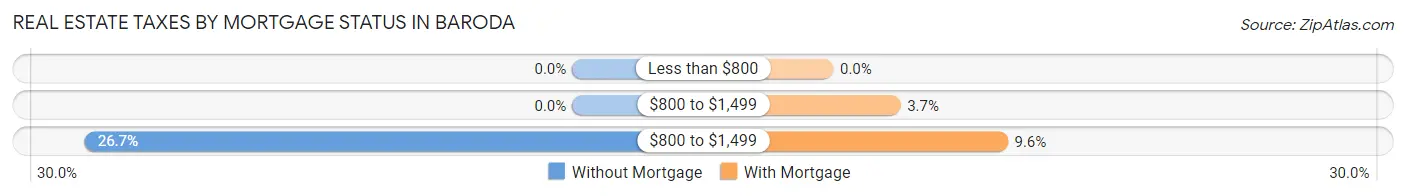
| Property Taxes | Without Mortgage | With Mortgage |
| Less than $800 | 0 (0.0%) | 0 (0.0%) |
| $800 to $1,499 | 0 (0.0%) | 5 (3.7%) |
| $800 to $1,499 | 55 (26.7%) | 13 (9.6%) |
| Total | 206 (100.0%) | 136 (100.0%) |
Health & Disability in Baroda
Health Insurance Coverage by Age in Baroda
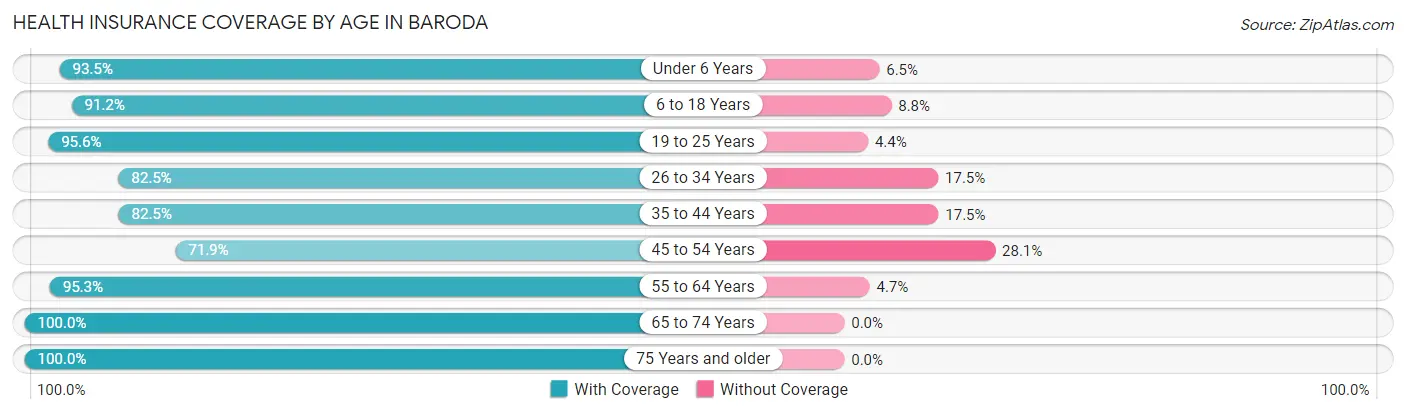
| Age Bracket | With Coverage | Without Coverage |
| Under 6 Years | 43 (93.5%) | 3 (6.5%) |
| 6 to 18 Years | 125 (91.2%) | 12 (8.8%) |
| 19 to 25 Years | 65 (95.6%) | 3 (4.4%) |
| 26 to 34 Years | 99 (82.5%) | 21 (17.5%) |
| 35 to 44 Years | 94 (82.5%) | 20 (17.5%) |
| 45 to 54 Years | 69 (71.9%) | 27 (28.1%) |
| 55 to 64 Years | 162 (95.3%) | 8 (4.7%) |
| 65 to 74 Years | 77 (100.0%) | 0 (0.0%) |
| 75 Years and older | 68 (100.0%) | 0 (0.0%) |
| Total | 802 (89.5%) | 94 (10.5%) |
Health Insurance Coverage by Citizenship Status in Baroda
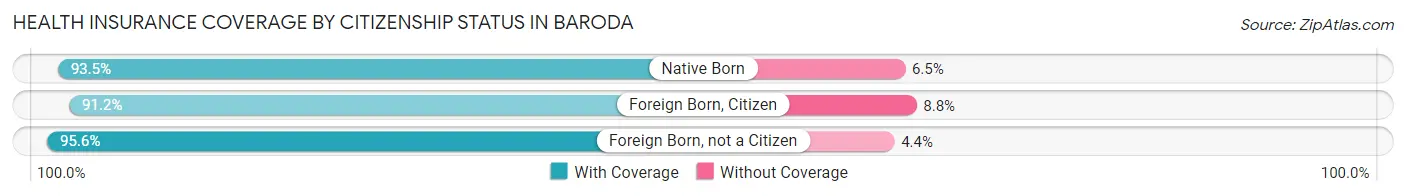
| Citizenship Status | With Coverage | Without Coverage |
| Native Born | 43 (93.5%) | 3 (6.5%) |
| Foreign Born, Citizen | 125 (91.2%) | 12 (8.8%) |
| Foreign Born, not a Citizen | 65 (95.6%) | 3 (4.4%) |
Health Insurance Coverage by Household Income in Baroda
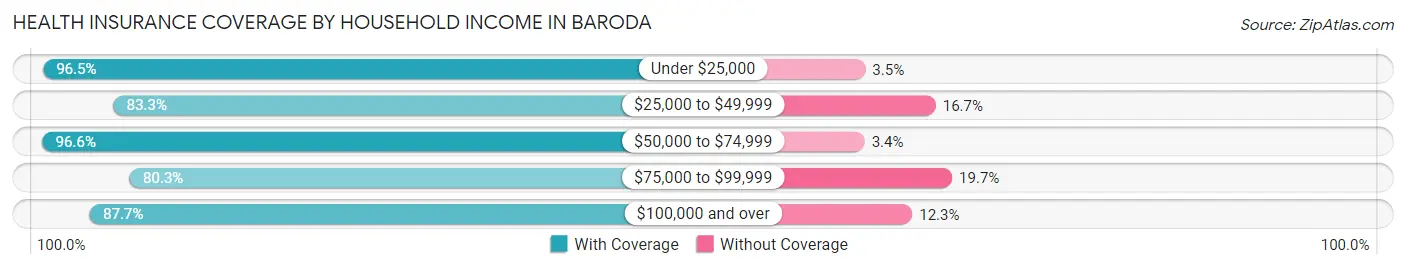
| Household Income | With Coverage | Without Coverage |
| Under $25,000 | 83 (96.5%) | 3 (3.5%) |
| $25,000 to $49,999 | 135 (83.3%) | 27 (16.7%) |
| $50,000 to $74,999 | 230 (96.6%) | 8 (3.4%) |
| $75,000 to $99,999 | 61 (80.3%) | 15 (19.7%) |
| $100,000 and over | 293 (87.7%) | 41 (12.3%) |
Public vs Private Health Insurance Coverage by Age in Baroda
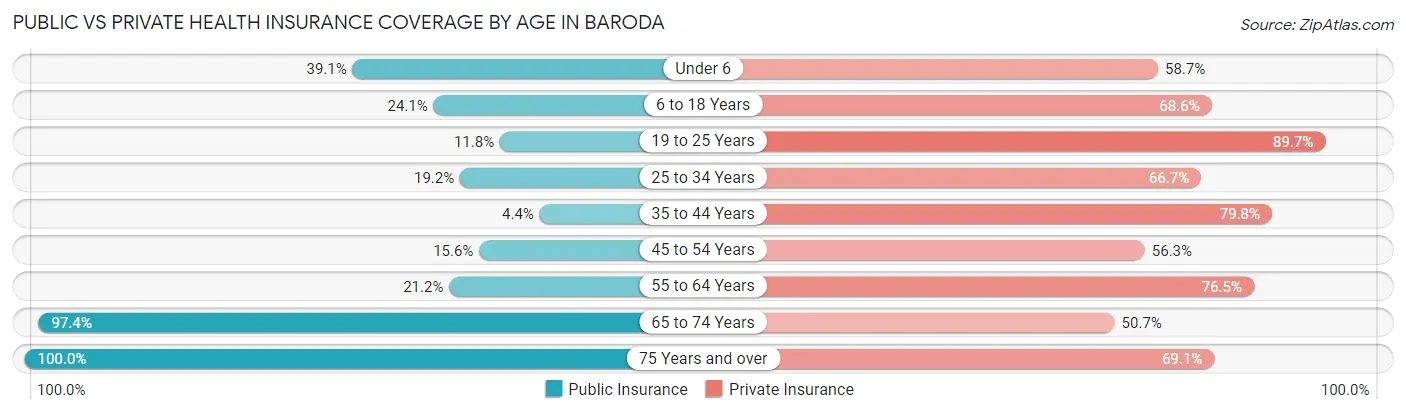
| Age Bracket | Public Insurance | Private Insurance |
| Under 6 | 18 (39.1%) | 27 (58.7%) |
| 6 to 18 Years | 33 (24.1%) | 94 (68.6%) |
| 19 to 25 Years | 8 (11.8%) | 61 (89.7%) |
| 25 to 34 Years | 23 (19.2%) | 80 (66.7%) |
| 35 to 44 Years | 5 (4.4%) | 91 (79.8%) |
| 45 to 54 Years | 15 (15.6%) | 54 (56.2%) |
| 55 to 64 Years | 36 (21.2%) | 130 (76.5%) |
| 65 to 74 Years | 75 (97.4%) | 39 (50.6%) |
| 75 Years and over | 68 (100.0%) | 47 (69.1%) |
| Total | 281 (31.4%) | 623 (69.5%) |
Disability Status by Sex by Age in Baroda
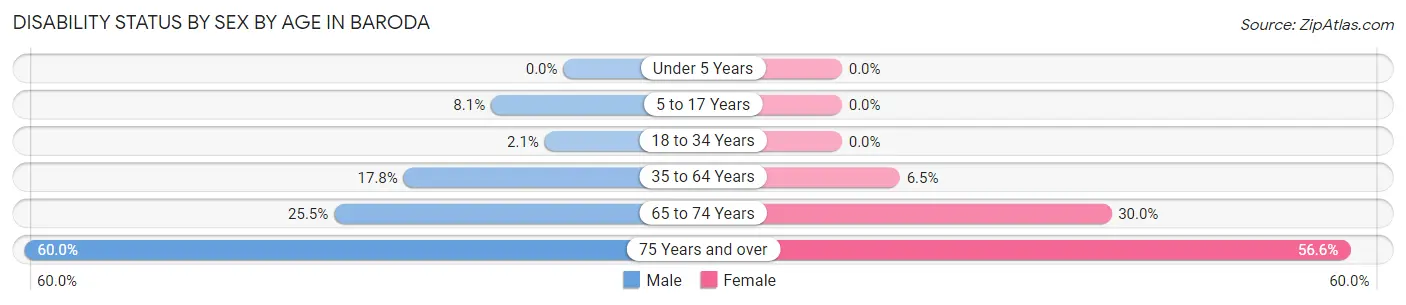
| Age Bracket | Male | Female |
| Under 5 Years | 0 (0.0%) | 0 (0.0%) |
| 5 to 17 Years | 5 (8.1%) | 0 (0.0%) |
| 18 to 34 Years | 2 (2.1%) | 0 (0.0%) |
| 35 to 64 Years | 29 (17.8%) | 14 (6.5%) |
| 65 to 74 Years | 12 (25.5%) | 9 (30.0%) |
| 75 Years and over | 9 (60.0%) | 30 (56.6%) |
Disability Class by Sex by Age in Baroda
Disability Class: Hearing Difficulty
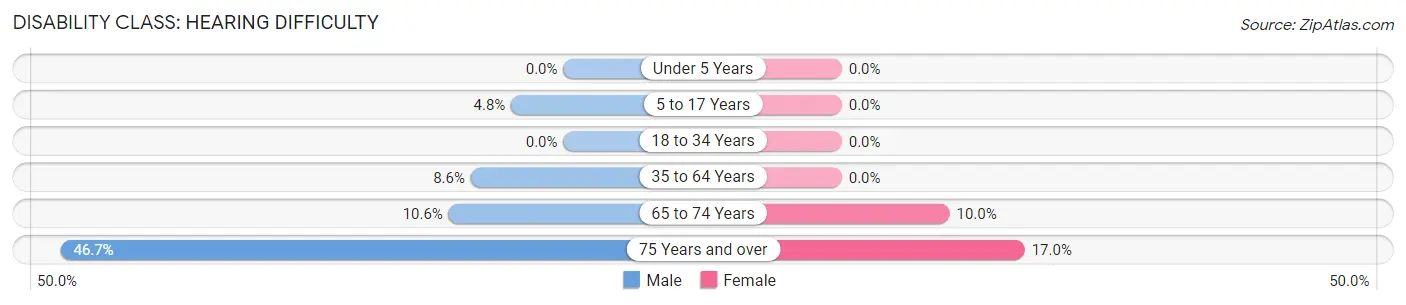
| Age Bracket | Male | Female |
| Under 5 Years | 0 (0.0%) | 0 (0.0%) |
| 5 to 17 Years | 3 (4.8%) | 0 (0.0%) |
| 18 to 34 Years | 0 (0.0%) | 0 (0.0%) |
| 35 to 64 Years | 14 (8.6%) | 0 (0.0%) |
| 65 to 74 Years | 5 (10.6%) | 3 (10.0%) |
| 75 Years and over | 7 (46.7%) | 9 (17.0%) |
Disability Class: Vision Difficulty
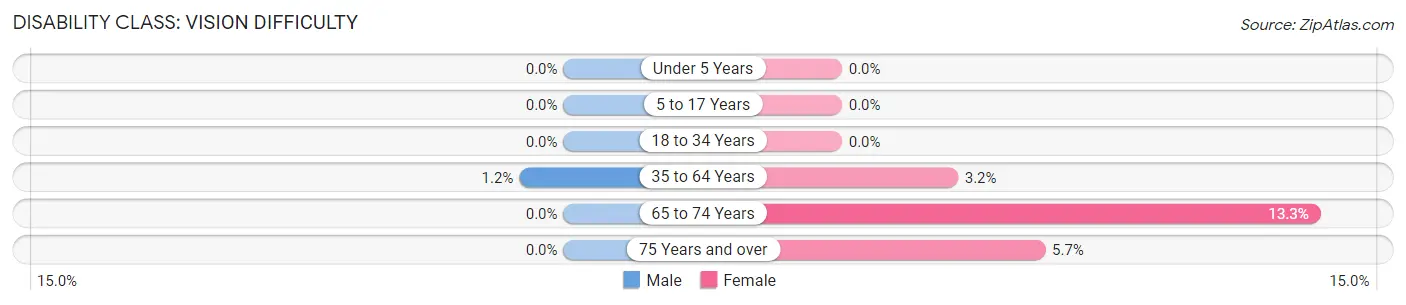
| Age Bracket | Male | Female |
| Under 5 Years | 0 (0.0%) | 0 (0.0%) |
| 5 to 17 Years | 0 (0.0%) | 0 (0.0%) |
| 18 to 34 Years | 0 (0.0%) | 0 (0.0%) |
| 35 to 64 Years | 2 (1.2%) | 7 (3.2%) |
| 65 to 74 Years | 0 (0.0%) | 4 (13.3%) |
| 75 Years and over | 0 (0.0%) | 3 (5.7%) |
Disability Class: Cognitive Difficulty
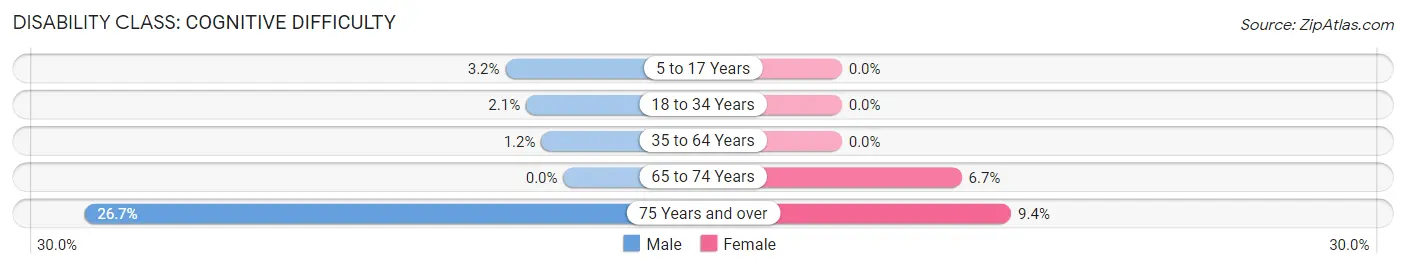
| Age Bracket | Male | Female |
| 5 to 17 Years | 2 (3.2%) | 0 (0.0%) |
| 18 to 34 Years | 2 (2.1%) | 0 (0.0%) |
| 35 to 64 Years | 2 (1.2%) | 0 (0.0%) |
| 65 to 74 Years | 0 (0.0%) | 2 (6.7%) |
| 75 Years and over | 4 (26.7%) | 5 (9.4%) |
Disability Class: Ambulatory Difficulty
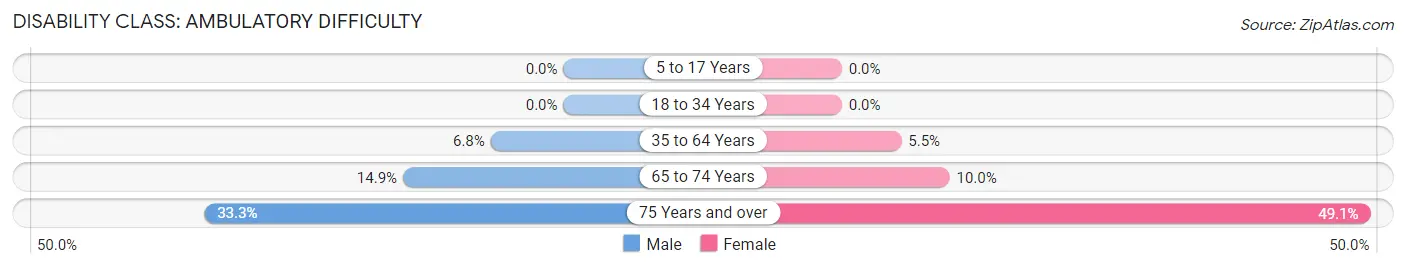
| Age Bracket | Male | Female |
| 5 to 17 Years | 0 (0.0%) | 0 (0.0%) |
| 18 to 34 Years | 0 (0.0%) | 0 (0.0%) |
| 35 to 64 Years | 11 (6.8%) | 12 (5.5%) |
| 65 to 74 Years | 7 (14.9%) | 3 (10.0%) |
| 75 Years and over | 5 (33.3%) | 26 (49.1%) |
Disability Class: Self-Care Difficulty
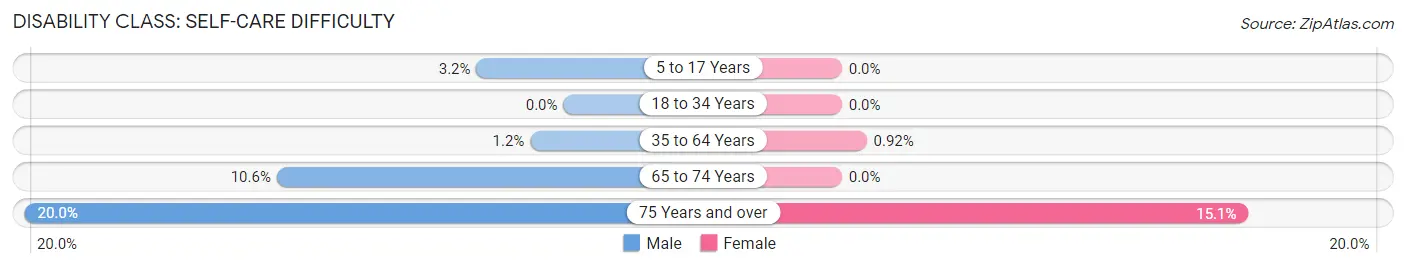
| Age Bracket | Male | Female |
| 5 to 17 Years | 2 (3.2%) | 0 (0.0%) |
| 18 to 34 Years | 0 (0.0%) | 0 (0.0%) |
| 35 to 64 Years | 2 (1.2%) | 2 (0.9%) |
| 65 to 74 Years | 5 (10.6%) | 0 (0.0%) |
| 75 Years and over | 3 (20.0%) | 8 (15.1%) |
Technology Access in Baroda
Computing Device Access in Baroda
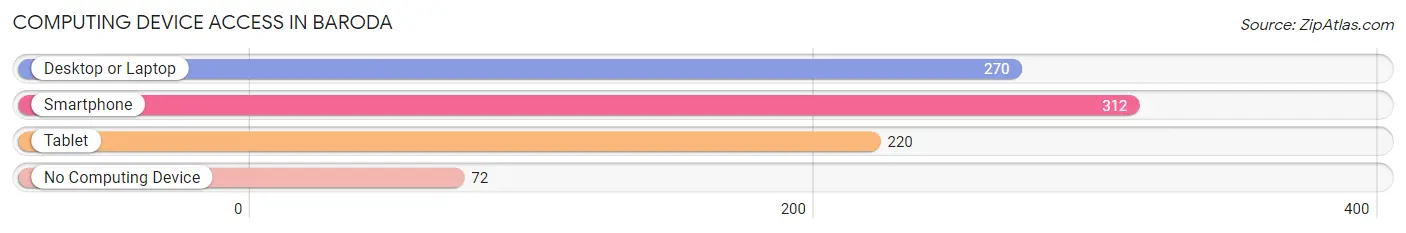
| Device Type | # Households | % Households |
| Desktop or Laptop | 270 | 66.3% |
| Smartphone | 312 | 76.7% |
| Tablet | 220 | 54.0% |
| No Computing Device | 72 | 17.7% |
| Total | 407 | 100.0% |
Internet Access in Baroda
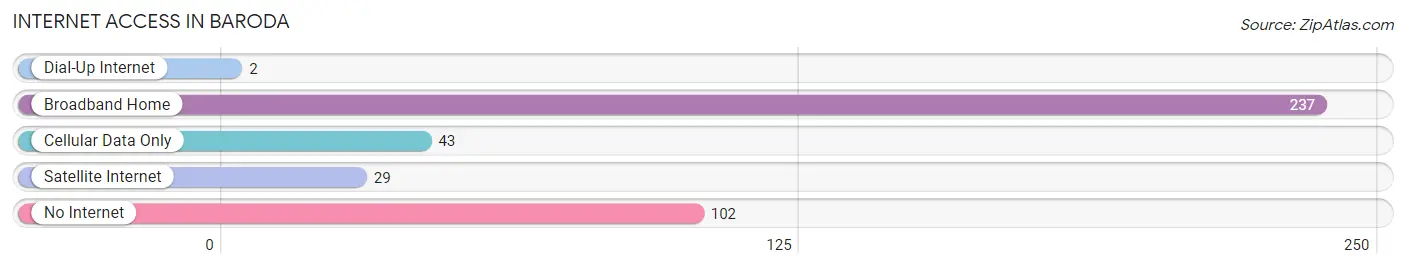
| Internet Type | # Households | % Households |
| Dial-Up Internet | 2 | 0.5% |
| Broadband Home | 237 | 58.2% |
| Cellular Data Only | 43 | 10.6% |
| Satellite Internet | 29 | 7.1% |
| No Internet | 102 | 25.1% |
| Total | 407 | 100.0% |
Baroda Summary
Baroda, Michigan is a small village located in the southwestern corner of Michigan’s Van Buren County. It is situated on the banks of the Paw Paw River, and is surrounded by the townships of Waverly, Lawrence, and Decatur. The village has a population of approximately 1,500 people, and is home to a variety of businesses, including a grocery store, a hardware store, a bank, and a post office.
History
Baroda was first settled in 1837 by a group of settlers from New York. The village was originally known as “New York Settlement”, but was later renamed Baroda after the nearby Baroda Creek. The village was officially incorporated in 1867.
In the late 19th century, Baroda was a thriving agricultural community, with a variety of crops being grown in the area. The village was also home to a number of small businesses, including a sawmill, a grist mill, and a blacksmith shop.
In the early 20th century, Baroda began to experience a decline in population as many of its residents moved away in search of better economic opportunities. The village was also affected by the Great Depression, and many of its businesses closed.
Geography
Baroda is located in the southwestern corner of Michigan’s Van Buren County. It is situated on the banks of the Paw Paw River, and is surrounded by the townships of Waverly, Lawrence, and Decatur. The village has a total area of 0.7 square miles, all of which is land.
The village is located in a rural area, and is surrounded by farmland and woodlands. The nearest major city is Kalamazoo, which is located approximately 25 miles to the east.
Economy
Baroda’s economy is largely based on agriculture and tourism. The village is home to a number of small businesses, including a grocery store, a hardware store, a bank, and a post office.
The village is also home to a number of tourist attractions, including the Baroda Historical Museum, the Baroda Winery, and the Baroda Farmers Market. The village also hosts a number of annual events, including the Baroda Summer Festival and the Baroda Harvest Festival.
Demographics
As of the 2010 census, Baroda had a population of 1,500 people. The racial makeup of the village was 97.3% White, 0.7% African American, 0.3% Native American, 0.3% Asian, and 1.3% from other races.
The median household income in Baroda was $41,250, and the median family income was $50,000. The per capita income in the village was $20,000. Approximately 8.3% of the population was below the poverty line.
Conclusion
Baroda, Michigan is a small village located in the southwestern corner of Michigan’s Van Buren County. It is situated on the banks of the Paw Paw River, and is surrounded by the townships of Waverly, Lawrence, and Decatur. The village has a population of approximately 1,500 people, and is home to a variety of businesses, including a grocery store, a hardware store, a bank, and a post office. The village’s economy is largely based on agriculture and tourism, and it is home to a number of tourist attractions, including the Baroda Historical Museum, the Baroda Winery, and the Baroda Farmers Market. The racial makeup of the village is 97.3% White, 0.7% African American, 0.3% Native American, 0.3% Asian, and 1.3% from other races. The median household income in Baroda was $41,250, and the median family income was $50,000. Approximately 8.3% of the population was below the poverty line.
Common Questions
What is Per Capita Income in Baroda?
Per Capita income in Baroda is $34,519.
What is the Median Family Income in Baroda?
Median Family Income in Baroda is $72,813.
What is the Median Household income in Baroda?
Median Household Income in Baroda is $62,679.
What is Income or Wage Gap in Baroda?
Income or Wage Gap in Baroda is 12.6%.
Women in Baroda earn 87.4 cents for every dollar earned by a man.
What is Inequality or Gini Index in Baroda?
Inequality or Gini Index in Baroda is 0.38.
What is the Total Population of Baroda?
Total Population of Baroda is 896.
What is the Total Male Population of Baroda?
Total Male Population of Baroda is 398.
What is the Total Female Population of Baroda?
Total Female Population of Baroda is 498.
What is the Ratio of Males per 100 Females in Baroda?
There are 79.92 Males per 100 Females in Baroda.
What is the Ratio of Females per 100 Males in Baroda?
There are 125.13 Females per 100 Males in Baroda.
What is the Median Population Age in Baroda?
Median Population Age in Baroda is 39.9 Years.
What is the Average Family Size in Baroda
Average Family Size in Baroda is 3.0 People.
What is the Average Household Size in Baroda
Average Household Size in Baroda is 2.2 People.
How Large is the Labor Force in Baroda?
There are 519 People in the Labor Forcein in Baroda.
What is the Percentage of People in the Labor Force in Baroda?
70.5% of People are in the Labor Force in Baroda.
What is the Unemployment Rate in Baroda?
Unemployment Rate in Baroda is 4.4%.