Augusta, MI Map & Demographics
Augusta Map
Augusta Overview
$27,241
PER CAPITA INCOME
$66,463
AVG FAMILY INCOME
$66,144
AVG HOUSEHOLD INCOME
21.8%
WAGE / INCOME GAP [ % ]
78.2¢/ $1
WAGE / INCOME GAP [ $ ]
0.30
INEQUALITY / GINI INDEX
955
TOTAL POPULATION
410
MALE POPULATION
545
FEMALE POPULATION
75.23
MALES / 100 FEMALES
132.93
FEMALES / 100 MALES
29.5
MEDIAN AGE
3.0
AVG FAMILY SIZE
2.6
AVG HOUSEHOLD SIZE
559
LABOR FORCE [ PEOPLE ]
76.9%
PERCENT IN LABOR FORCE
9.0%
UNEMPLOYMENT RATE
Augusta Zip Codes
Augusta Area Codes
Income in Augusta
Income Overview in Augusta
Per Capita Income in Augusta is $27,241, while median incomes of families and households are $66,463 and $66,144 respectively.
| Characteristic | Number | Measure |
| Per Capita Income | 955 | $27,241 |
| Median Family Income | 248 | $66,463 |
| Mean Family Income | 248 | $75,998 |
| Median Household Income | 371 | $66,144 |
| Mean Household Income | 371 | $70,311 |
| Income Deficit | 248 | $0 |
| Wage / Income Gap (%) | 955 | 21.77% |
| Wage / Income Gap ($) | 955 | 78.23¢ per $1 |
| Gini / Inequality Index | 955 | 0.30 |
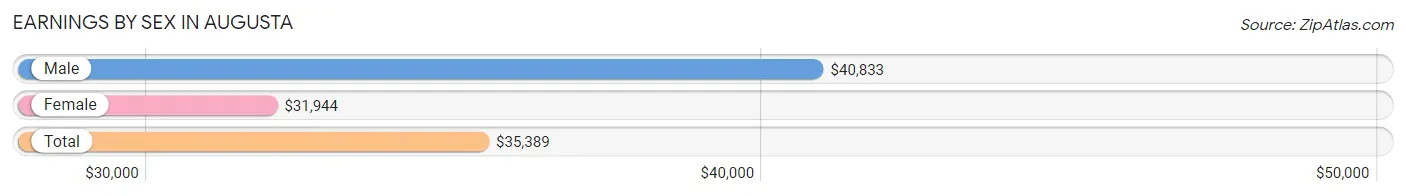
Earnings by Sex in Augusta
Average Earnings in Augusta are $35,389, $40,833 for men and $31,944 for women, a difference of 21.8%.
| Sex | Number | Average Earnings |
| Male | 326 (55.2%) | $40,833 |
| Female | 264 (44.8%) | $31,944 |
| Total | 590 (100.0%) | $35,389 |
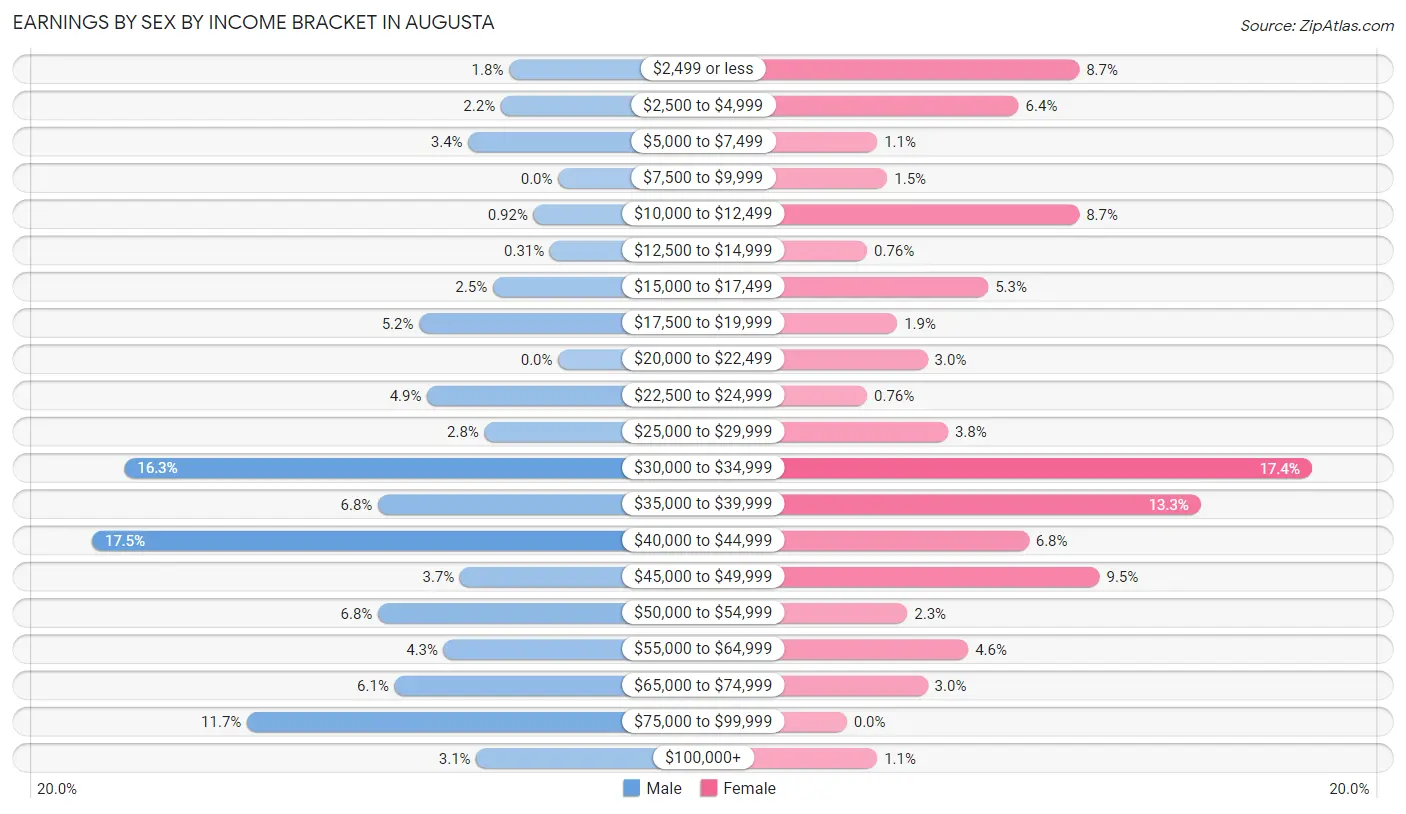
Earnings by Sex by Income Bracket in Augusta
The most common earnings brackets in Augusta are $40,000 to $44,999 for men (57 | 17.5%) and $30,000 to $34,999 for women (46 | 17.4%).
| Income | Male | Female |
| $2,499 or less | 6 (1.8%) | 23 (8.7%) |
| $2,500 to $4,999 | 7 (2.1%) | 17 (6.4%) |
| $5,000 to $7,499 | 11 (3.4%) | 3 (1.1%) |
| $7,500 to $9,999 | 0 (0.0%) | 4 (1.5%) |
| $10,000 to $12,499 | 3 (0.9%) | 23 (8.7%) |
| $12,500 to $14,999 | 1 (0.3%) | 2 (0.8%) |
| $15,000 to $17,499 | 8 (2.5%) | 14 (5.3%) |
| $17,500 to $19,999 | 17 (5.2%) | 5 (1.9%) |
| $20,000 to $22,499 | 0 (0.0%) | 8 (3.0%) |
| $22,500 to $24,999 | 16 (4.9%) | 2 (0.8%) |
| $25,000 to $29,999 | 9 (2.8%) | 10 (3.8%) |
| $30,000 to $34,999 | 53 (16.3%) | 46 (17.4%) |
| $35,000 to $39,999 | 22 (6.8%) | 35 (13.3%) |
| $40,000 to $44,999 | 57 (17.5%) | 18 (6.8%) |
| $45,000 to $49,999 | 12 (3.7%) | 25 (9.5%) |
| $50,000 to $54,999 | 22 (6.8%) | 6 (2.3%) |
| $55,000 to $64,999 | 14 (4.3%) | 12 (4.5%) |
| $65,000 to $74,999 | 20 (6.1%) | 8 (3.0%) |
| $75,000 to $99,999 | 38 (11.7%) | 0 (0.0%) |
| $100,000+ | 10 (3.1%) | 3 (1.1%) |
| Total | 326 (100.0%) | 264 (100.0%) |
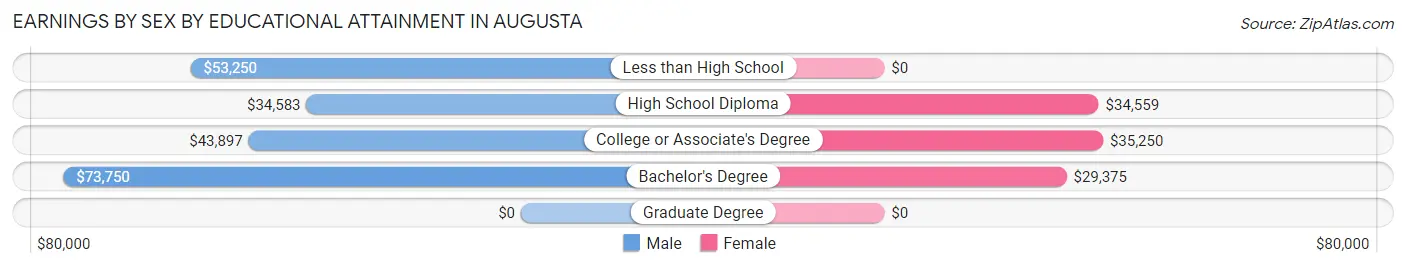
Earnings by Sex by Educational Attainment in Augusta
Average earnings in Augusta are $42,917 for men and $34,211 for women, a difference of 20.3%. Men with an educational attainment of bachelor's degree enjoy the highest average annual earnings of $73,750, while those with high school diploma education earn the least with $34,583. Women with an educational attainment of college or associate's degree earn the most with the average annual earnings of $35,250, while those with bachelor's degree education have the smallest earnings of $29,375.
| Educational Attainment | Male Income | Female Income |
| Less than High School | $53,250 | $0 |
| High School Diploma | $34,583 | $34,559 |
| College or Associate's Degree | $43,897 | $35,250 |
| Bachelor's Degree | $73,750 | $29,375 |
| Graduate Degree | - | - |
| Total | $42,917 | $34,211 |
Family Income in Augusta
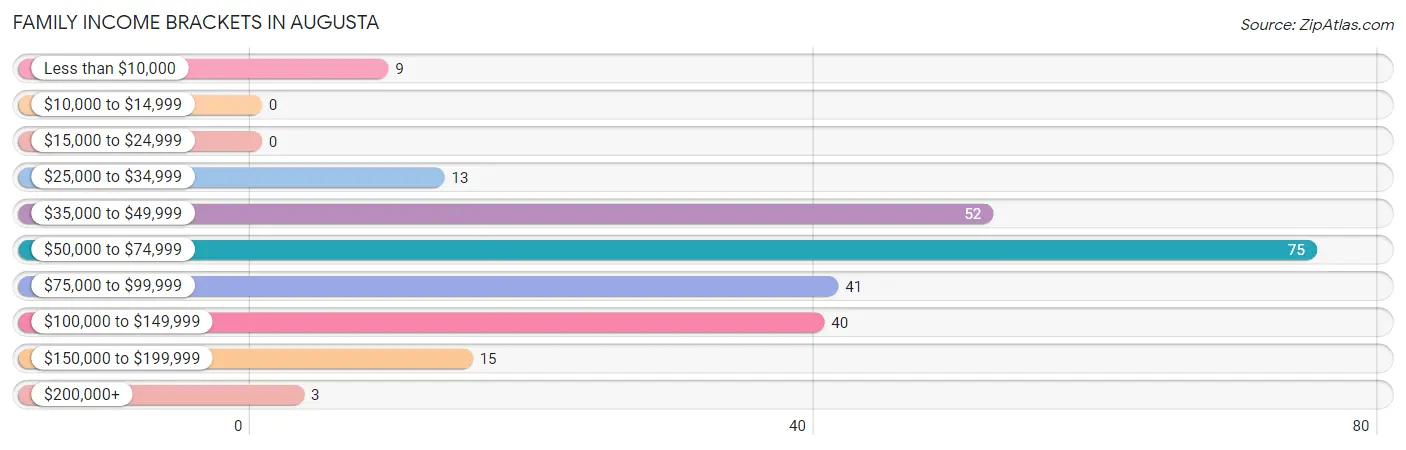
Family Income Brackets in Augusta
According to the Augusta family income data, there are 75 families falling into the $50,000 to $74,999 income range, which is the most common income bracket and makes up 30.2% of all families.
| Income Bracket | # Families | % Families |
| Less than $10,000 | 9 | 3.6% |
| $10,000 to $14,999 | 0 | 0.0% |
| $15,000 to $24,999 | 0 | 0.0% |
| $25,000 to $34,999 | 13 | 5.2% |
| $35,000 to $49,999 | 52 | 21.0% |
| $50,000 to $74,999 | 75 | 30.2% |
| $75,000 to $99,999 | 41 | 16.5% |
| $100,000 to $149,999 | 40 | 16.1% |
| $150,000 to $199,999 | 15 | 6.0% |
| $200,000+ | 3 | 1.2% |
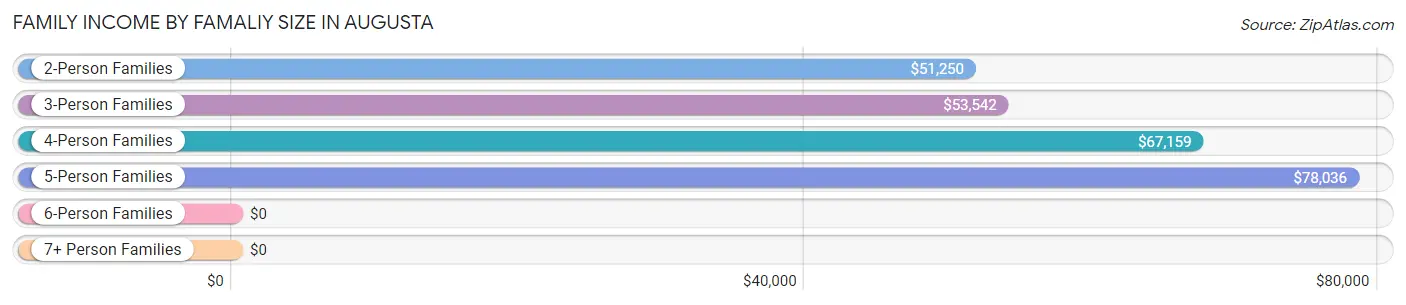
Family Income by Famaliy Size in Augusta
5-person families (15 | 6.0%) account for the highest median family income in Augusta with $78,036 per family, while 2-person families (83 | 33.5%) have the highest median income of $25,625 per family member.
| Income Bracket | # Families | Median Income |
| 2-Person Families | 83 (33.5%) | $51,250 |
| 3-Person Families | 88 (35.5%) | $53,542 |
| 4-Person Families | 57 (23.0%) | $67,159 |
| 5-Person Families | 15 (6.0%) | $78,036 |
| 6-Person Families | 0 (0.0%) | $0 |
| 7+ Person Families | 5 (2.0%) | $0 |
| Total | 248 (100.0%) | $66,463 |
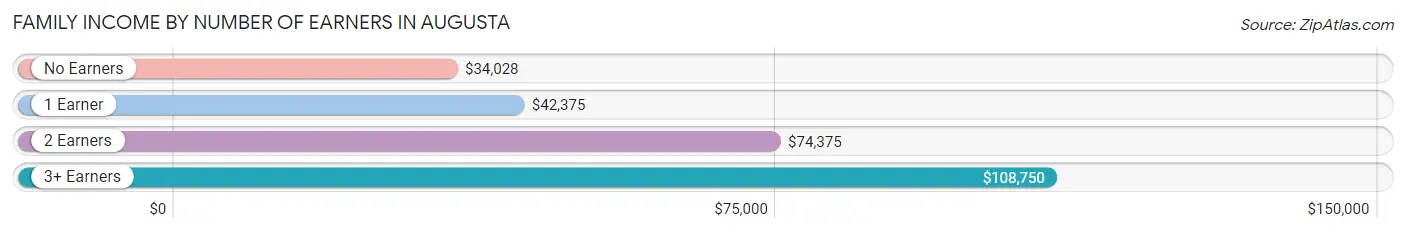
Family Income by Number of Earners in Augusta
The median family income in Augusta is $66,463, with families comprising 3+ earners (42) having the highest median family income of $108,750, while families with no earners (25) have the lowest median family income of $34,028, accounting for 16.9% and 10.1% of families, respectively.
| Number of Earners | # Families | Median Income |
| No Earners | 25 (10.1%) | $34,028 |
| 1 Earner | 61 (24.6%) | $42,375 |
| 2 Earners | 120 (48.4%) | $74,375 |
| 3+ Earners | 42 (16.9%) | $108,750 |
| Total | 248 (100.0%) | $66,463 |
Household Income in Augusta
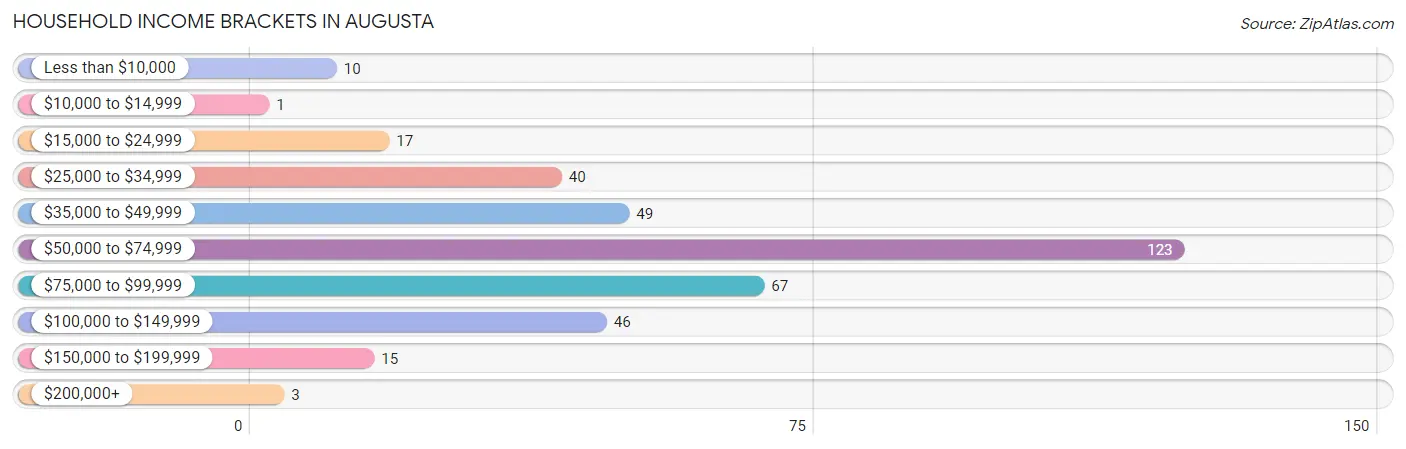
Household Income Brackets in Augusta
With 123 households falling in the category, the $50,000 to $74,999 income range is the most frequent in Augusta, accounting for 33.2% of all households. In contrast, only 1 households (0.3%) fall into the $10,000 to $14,999 income bracket, making it the least populous group.
| Income Bracket | # Households | % Households |
| Less than $10,000 | 10 | 2.7% |
| $10,000 to $14,999 | 1 | 0.3% |
| $15,000 to $24,999 | 17 | 4.6% |
| $25,000 to $34,999 | 40 | 10.8% |
| $35,000 to $49,999 | 49 | 13.2% |
| $50,000 to $74,999 | 123 | 33.2% |
| $75,000 to $99,999 | 67 | 18.1% |
| $100,000 to $149,999 | 46 | 12.4% |
| $150,000 to $199,999 | 15 | 4.0% |
| $200,000+ | 3 | 0.8% |
Household Income by Householder Age in Augusta
The median household income in Augusta is $66,144, with the highest median household income of $68,438 found in the 45 to 64 years age bracket for the primary householder. A total of 143 households (38.5%) fall into this category. Meanwhile, the 15 to 24 years age bracket for the primary householder has the lowest median household income of $0, with 23 households (6.2%) in this group.
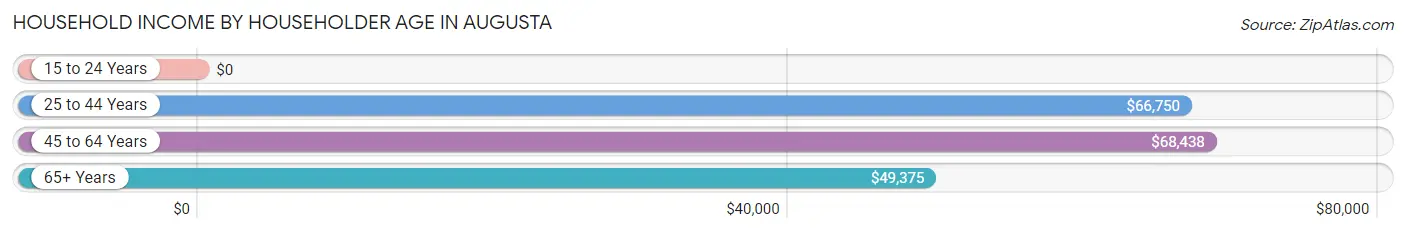
| Income Bracket | # Households | Median Income |
| 15 to 24 Years | 23 (6.2%) | $0 |
| 25 to 44 Years | 163 (43.9%) | $66,750 |
| 45 to 64 Years | 143 (38.5%) | $68,438 |
| 65+ Years | 42 (11.3%) | $49,375 |
| Total | 371 (100.0%) | $66,144 |
Poverty in Augusta
Income Below Poverty by Sex and Age in Augusta
With 5.1% poverty level for males and 4.3% for females among the residents of Augusta, under 5 year old males and 35 to 44 year old females are the most vulnerable to poverty, with 6 males (66.7%) and 6 females (18.8%) in their respective age groups living below the poverty level.
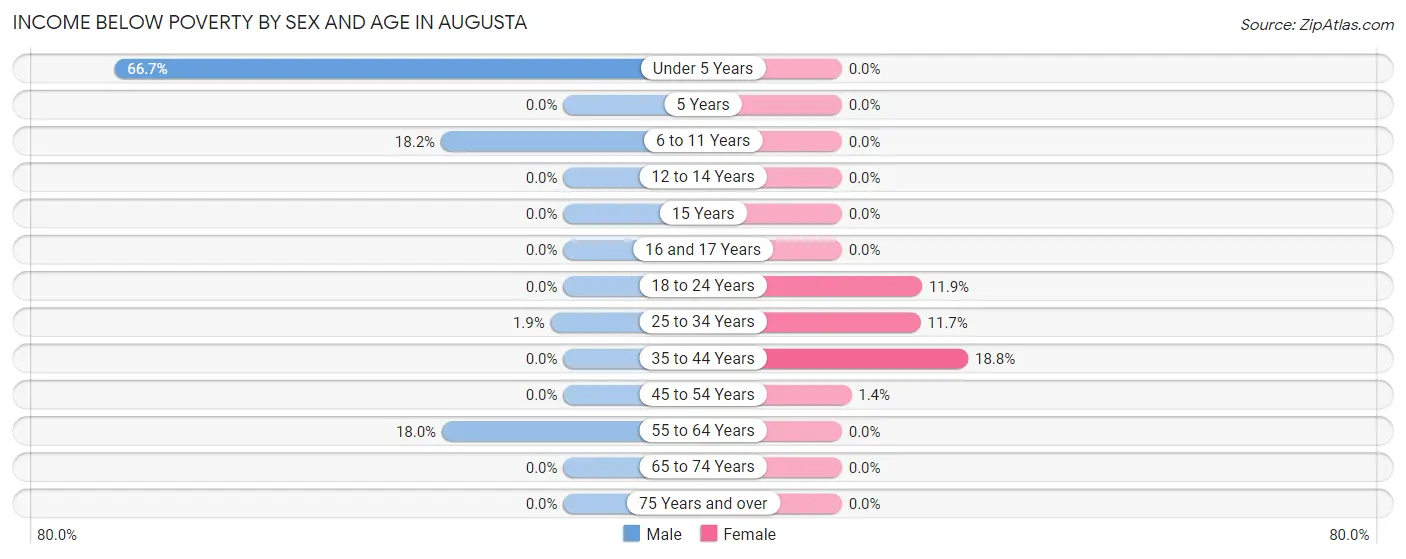
| Age Bracket | Male | Female |
| Under 5 Years | 6 (66.7%) | 0 (0.0%) |
| 5 Years | 0 (0.0%) | 0 (0.0%) |
| 6 to 11 Years | 2 (18.2%) | 0 (0.0%) |
| 12 to 14 Years | 0 (0.0%) | 0 (0.0%) |
| 15 Years | 0 (0.0%) | 0 (0.0%) |
| 16 and 17 Years | 0 (0.0%) | 0 (0.0%) |
| 18 to 24 Years | 0 (0.0%) | 5 (11.9%) |
| 25 to 34 Years | 2 (1.9%) | 11 (11.7%) |
| 35 to 44 Years | 0 (0.0%) | 6 (18.8%) |
| 45 to 54 Years | 0 (0.0%) | 1 (1.4%) |
| 55 to 64 Years | 11 (18.0%) | 0 (0.0%) |
| 65 to 74 Years | 0 (0.0%) | 0 (0.0%) |
| 75 Years and over | 0 (0.0%) | 0 (0.0%) |
| Total | 21 (5.1%) | 23 (4.3%) |
Income Above Poverty by Sex and Age in Augusta
According to the poverty statistics in Augusta, males aged 5 years and females aged under 5 years are the age groups that are most secure financially, with 100.0% of males and 100.0% of females in these age groups living above the poverty line.
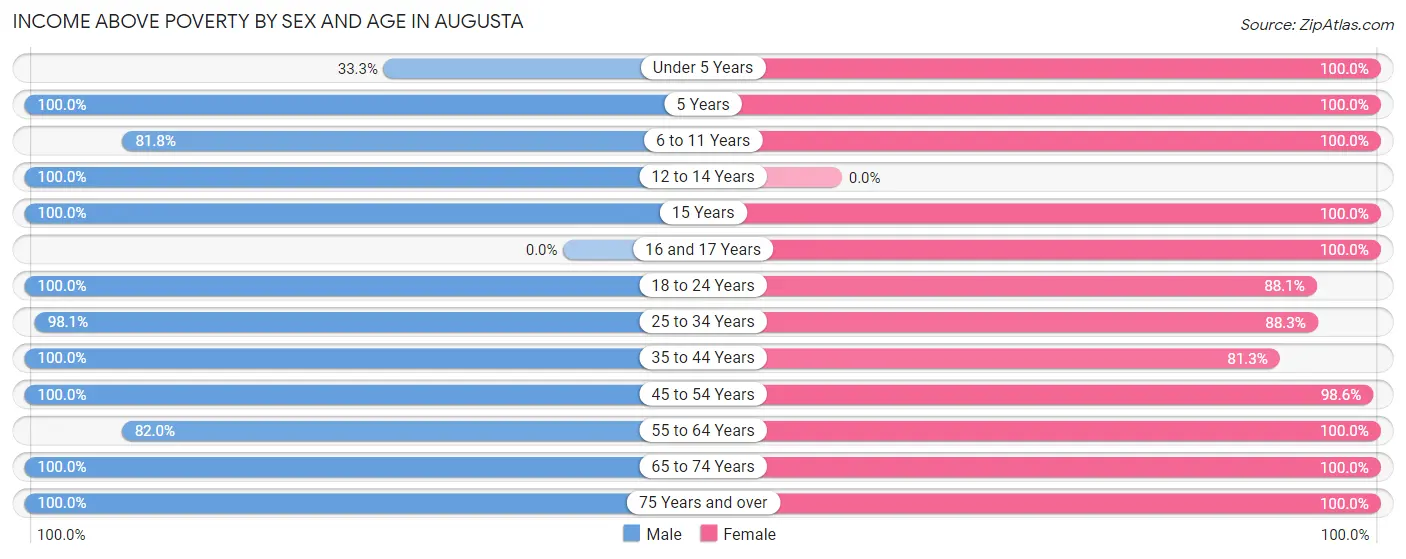
| Age Bracket | Male | Female |
| Under 5 Years | 3 (33.3%) | 61 (100.0%) |
| 5 Years | 5 (100.0%) | 12 (100.0%) |
| 6 to 11 Years | 9 (81.8%) | 105 (100.0%) |
| 12 to 14 Years | 6 (100.0%) | 0 (0.0%) |
| 15 Years | 3 (100.0%) | 10 (100.0%) |
| 16 and 17 Years | 0 (0.0%) | 33 (100.0%) |
| 18 to 24 Years | 64 (100.0%) | 37 (88.1%) |
| 25 to 34 Years | 103 (98.1%) | 83 (88.3%) |
| 35 to 44 Years | 49 (100.0%) | 26 (81.2%) |
| 45 to 54 Years | 74 (100.0%) | 70 (98.6%) |
| 55 to 64 Years | 50 (82.0%) | 44 (100.0%) |
| 65 to 74 Years | 15 (100.0%) | 19 (100.0%) |
| 75 Years and over | 8 (100.0%) | 16 (100.0%) |
| Total | 389 (94.9%) | 516 (95.7%) |
Income Below Poverty Among Married-Couple Families in Augusta
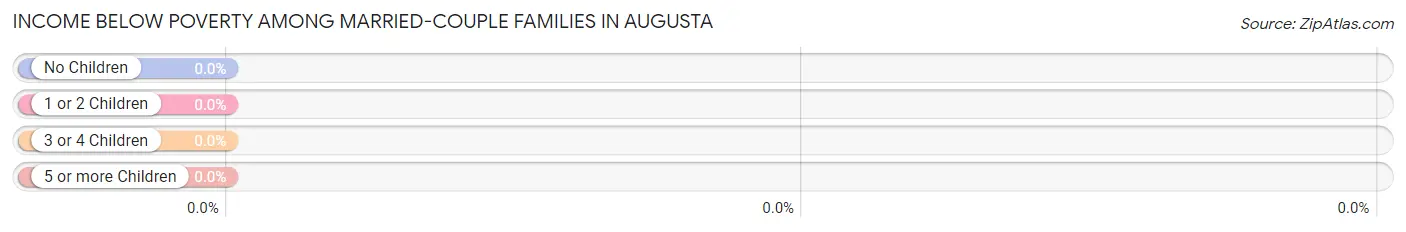
| Children | Above Poverty | Below Poverty |
| No Children | 69 (100.0%) | 0 (0.0%) |
| 1 or 2 Children | 91 (100.0%) | 0 (0.0%) |
| 3 or 4 Children | 13 (100.0%) | 0 (0.0%) |
| 5 or more Children | 0 (0.0%) | 0 (0.0%) |
| Total | 173 (100.0%) | 0 (0.0%) |
Income Below Poverty Among Single-Parent Households in Augusta
According to the poverty data in Augusta, 10.3% or 3 single-father households and 13.0% or 6 single-mother households are living below the poverty line. Among single-father households, those with 1 or 2 children have the highest poverty rate, with 3 households (14.3%) experiencing poverty. Likewise, among single-mother households, those with 1 or 2 children have the highest poverty rate, with 5 households (14.3%) falling below the poverty line.
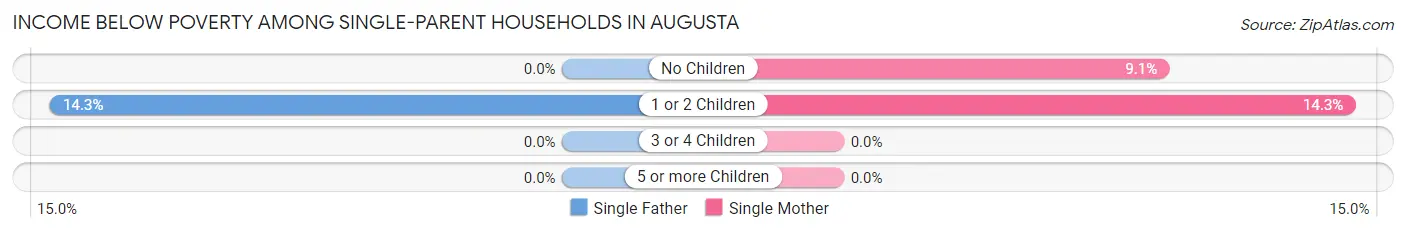
| Children | Single Father | Single Mother |
| No Children | 0 (0.0%) | 1 (9.1%) |
| 1 or 2 Children | 3 (14.3%) | 5 (14.3%) |
| 3 or 4 Children | 0 (0.0%) | 0 (0.0%) |
| 5 or more Children | 0 (0.0%) | 0 (0.0%) |
| Total | 3 (10.3%) | 6 (13.0%) |
Income Below Poverty Among Married-Couple vs Single-Parent Households in Augusta
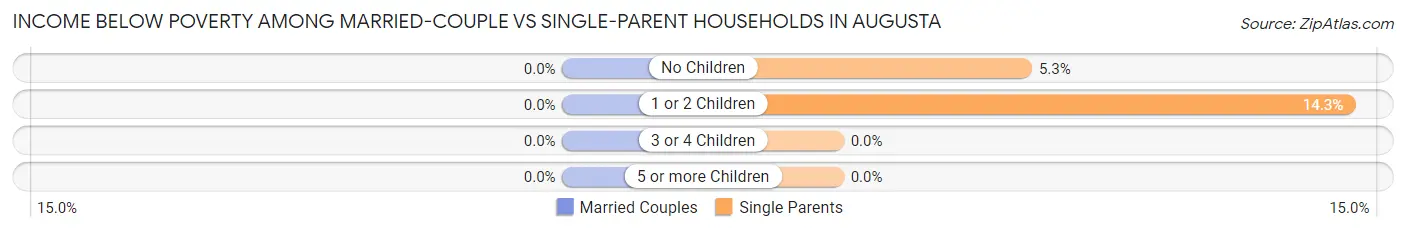
| Children | Married-Couple Families | Single-Parent Households |
| No Children | 0 (0.0%) | 1 (5.3%) |
| 1 or 2 Children | 0 (0.0%) | 8 (14.3%) |
| 3 or 4 Children | 0 (0.0%) | 0 (0.0%) |
| 5 or more Children | 0 (0.0%) | 0 (0.0%) |
| Total | 0 (0.0%) | 9 (12.0%) |
Race in Augusta
The most populous races in Augusta are White / Caucasian (862 | 90.3%), Hispanic or Latino (92 | 9.6%), and Two or more Races (86 | 9.0%).
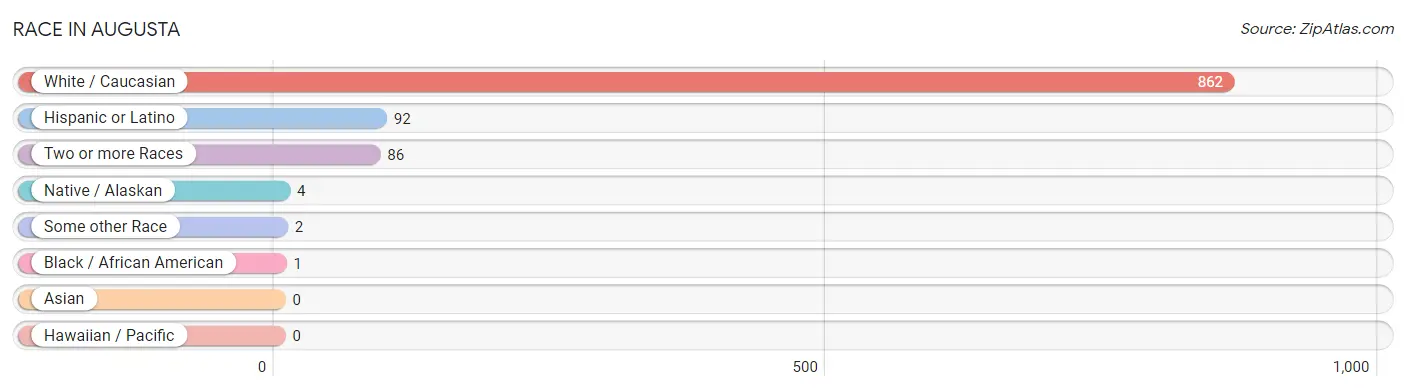
| Race | # Population | % Population |
| Asian | 0 | 0.0% |
| Black / African American | 1 | 0.1% |
| Hawaiian / Pacific | 0 | 0.0% |
| Hispanic or Latino | 92 | 9.6% |
| Native / Alaskan | 4 | 0.4% |
| White / Caucasian | 862 | 90.3% |
| Two or more Races | 86 | 9.0% |
| Some other Race | 2 | 0.2% |
| Total | 955 | 100.0% |
Ancestry in Augusta
The most populous ancestries reported in Augusta are Irish (162 | 17.0%), German (159 | 16.7%), English (106 | 11.1%), American (87 | 9.1%), and Cuban (70 | 7.3%), together accounting for 61.2% of all Augusta residents.
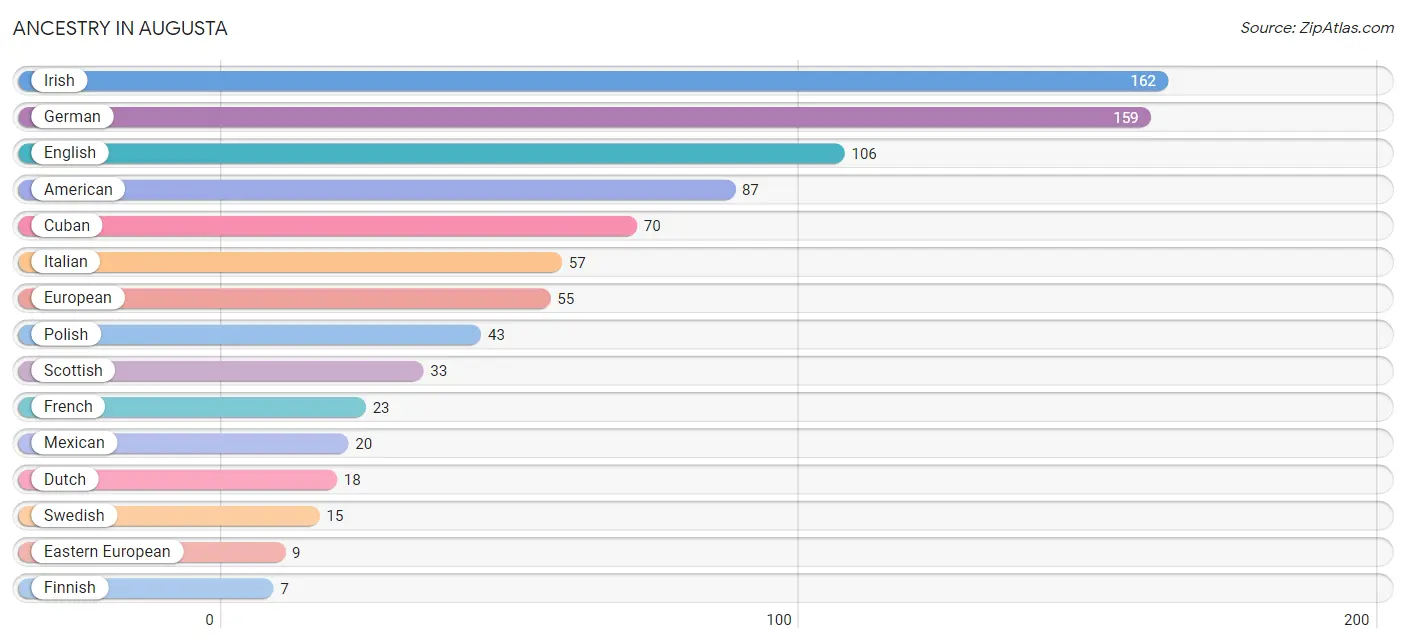
| Ancestry | # Population | % Population |
| American | 87 | 9.1% |
| Austrian | 3 | 0.3% |
| Cuban | 70 | 7.3% |
| Dutch | 18 | 1.9% |
| Eastern European | 9 | 0.9% |
| English | 106 | 11.1% |
| European | 55 | 5.8% |
| Finnish | 7 | 0.7% |
| French | 23 | 2.4% |
| French Canadian | 6 | 0.6% |
| German | 159 | 16.7% |
| Hungarian | 1 | 0.1% |
| Irish | 162 | 17.0% |
| Italian | 57 | 6.0% |
| Latvian | 7 | 0.7% |
| Lithuanian | 6 | 0.6% |
| Mexican | 20 | 2.1% |
| Northern European | 5 | 0.5% |
| Norwegian | 5 | 0.5% |
| Ottawa | 2 | 0.2% |
| Polish | 43 | 4.5% |
| Scotch-Irish | 2 | 0.2% |
| Scottish | 33 | 3.5% |
| Spanish | 2 | 0.2% |
| Swedish | 15 | 1.6% |
| Welsh | 3 | 0.3% | View All 26 Rows |
Immigrants in Augusta
The most numerous immigrant groups reported in Augusta came from Central America (6 | 0.6%), Latin America (6 | 0.6%), Mexico (6 | 0.6%), England (5 | 0.5%), and Europe (5 | 0.5%), together accounting for 2.9% of all Augusta residents.
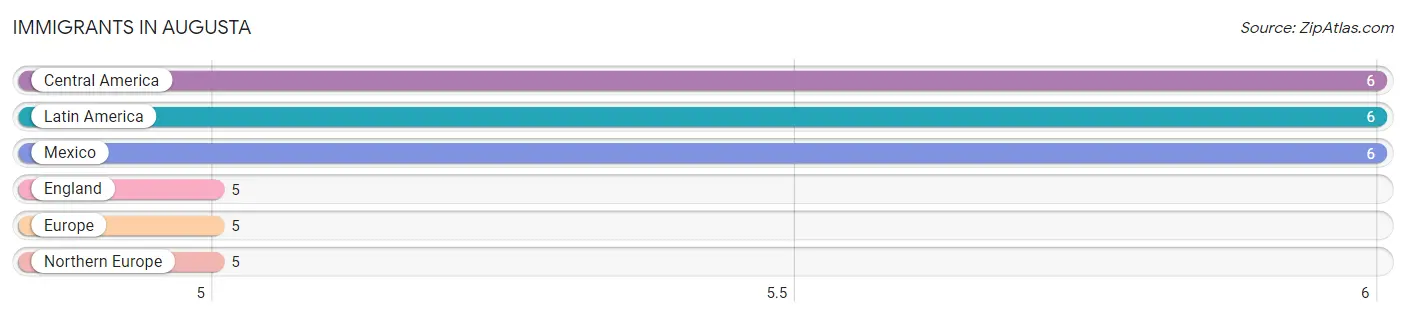
| Immigration Origin | # Population | % Population |
| Central America | 6 | 0.6% |
| England | 5 | 0.5% |
| Europe | 5 | 0.5% |
| Latin America | 6 | 0.6% |
| Mexico | 6 | 0.6% |
| Northern Europe | 5 | 0.5% | View All 6 Rows |
Sex and Age in Augusta
Sex and Age in Augusta
The most populous age groups in Augusta are 25 to 29 Years (67 | 16.3%) for men and 10 to 14 Years (69 | 12.7%) for women.
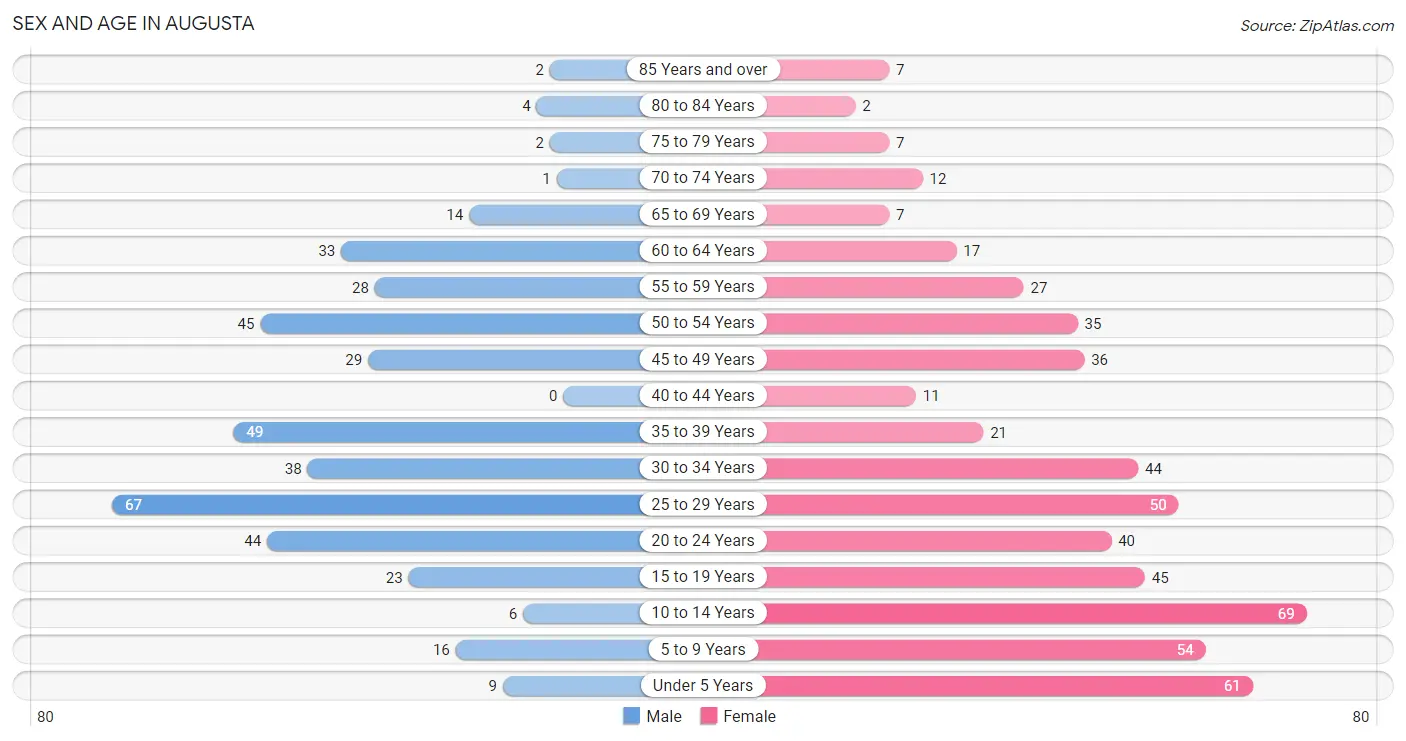
| Age Bracket | Male | Female |
| Under 5 Years | 9 (2.2%) | 61 (11.2%) |
| 5 to 9 Years | 16 (3.9%) | 54 (9.9%) |
| 10 to 14 Years | 6 (1.5%) | 69 (12.7%) |
| 15 to 19 Years | 23 (5.6%) | 45 (8.3%) |
| 20 to 24 Years | 44 (10.7%) | 40 (7.3%) |
| 25 to 29 Years | 67 (16.3%) | 50 (9.2%) |
| 30 to 34 Years | 38 (9.3%) | 44 (8.1%) |
| 35 to 39 Years | 49 (11.9%) | 21 (3.8%) |
| 40 to 44 Years | 0 (0.0%) | 11 (2.0%) |
| 45 to 49 Years | 29 (7.1%) | 36 (6.6%) |
| 50 to 54 Years | 45 (11.0%) | 35 (6.4%) |
| 55 to 59 Years | 28 (6.8%) | 27 (5.0%) |
| 60 to 64 Years | 33 (8.1%) | 17 (3.1%) |
| 65 to 69 Years | 14 (3.4%) | 7 (1.3%) |
| 70 to 74 Years | 1 (0.2%) | 12 (2.2%) |
| 75 to 79 Years | 2 (0.5%) | 7 (1.3%) |
| 80 to 84 Years | 4 (1.0%) | 2 (0.4%) |
| 85 Years and over | 2 (0.5%) | 7 (1.3%) |
| Total | 410 (100.0%) | 545 (100.0%) |
Families and Households in Augusta
Median Family Size in Augusta
The median family size in Augusta is 3.05 persons per family, with married-couple families (173 | 69.8%) accounting for the largest median family size of 3.29 persons per family. On the other hand, single female/mother families (46 | 18.5%) represent the smallest median family size with 2.41 persons per family.
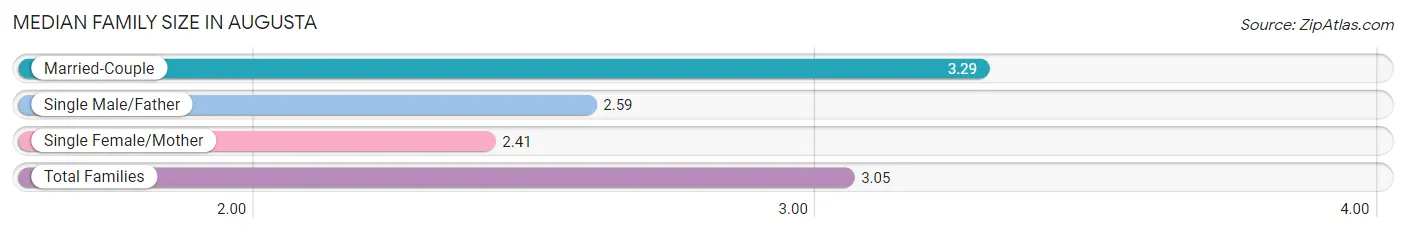
| Family Type | # Families | Family Size |
| Married-Couple | 173 (69.8%) | 3.29 |
| Single Male/Father | 29 (11.7%) | 2.59 |
| Single Female/Mother | 46 (18.5%) | 2.41 |
| Total Families | 248 (100.0%) | 3.05 |
Median Household Size in Augusta
The median household size in Augusta is 2.57 persons per household, with single male/father households (29 | 7.8%) accounting for the largest median household size of 3.45 persons per household. non-family households (123 | 33.2%) represent the smallest median household size with 1.16 persons per household.
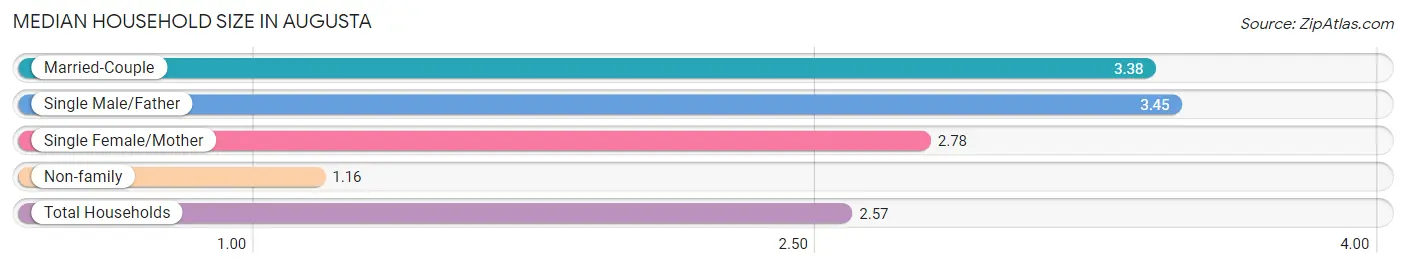
| Household Type | # Households | Household Size |
| Married-Couple | 173 (46.6%) | 3.38 |
| Single Male/Father | 29 (7.8%) | 3.45 |
| Single Female/Mother | 46 (12.4%) | 2.78 |
| Non-family | 123 (33.2%) | 1.16 |
| Total Households | 371 (100.0%) | 2.57 |
Household Size by Marriage Status in Augusta
Out of a total of 371 households in Augusta, 248 (66.8%) are family households, while 123 (33.2%) are nonfamily households. The most numerous type of family households are 4-person households, comprising 84, and the most common type of nonfamily households are 1-person households, comprising 104.

| Household Size | Family Households | Nonfamily Households |
| 1-Person Households | - | 104 (28.0%) |
| 2-Person Households | 71 (19.1%) | 19 (5.1%) |
| 3-Person Households | 70 (18.9%) | 0 (0.0%) |
| 4-Person Households | 84 (22.6%) | 0 (0.0%) |
| 5-Person Households | 11 (3.0%) | 0 (0.0%) |
| 6-Person Households | 7 (1.9%) | 0 (0.0%) |
| 7+ Person Households | 5 (1.3%) | 0 (0.0%) |
| Total | 248 (66.8%) | 123 (33.2%) |
Female Fertility in Augusta
Fertility by Age in Augusta
Average fertility rate in Augusta is 118.0 births per 1,000 women. Women in the age bracket of 20 to 34 years have the highest fertility rate with 224.0 births per 1,000 women. Women in the age bracket of 20 to 34 years acount for 100.0% of all women with births.
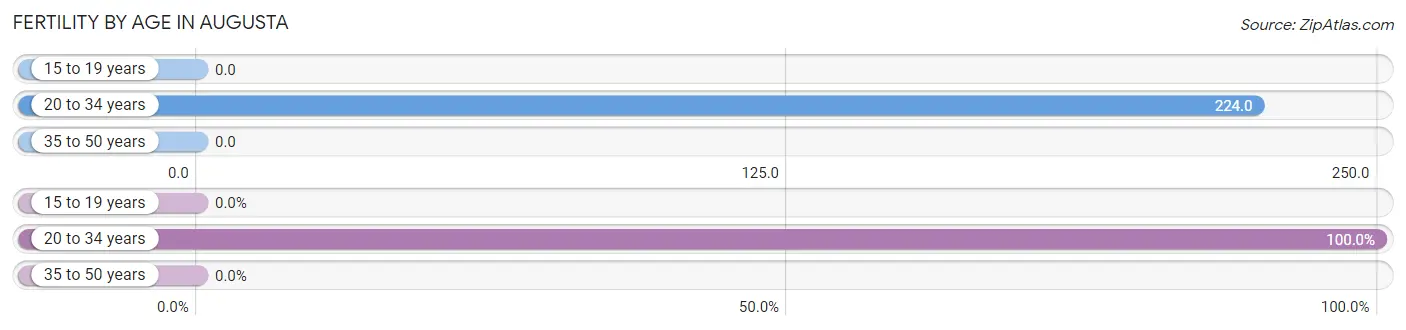
| Age Bracket | Women with Births | Births / 1,000 Women |
| 15 to 19 years | 0 (0.0%) | 0.0 |
| 20 to 34 years | 30 (100.0%) | 224.0 |
| 35 to 50 years | 0 (0.0%) | 0.0 |
| Total | 30 (100.0%) | 118.0 |
Fertility by Age by Marriage Status in Augusta
73.3% of women with births (30) in Augusta are married. The highest percentage of unmarried women with births falls into 20 to 34 years age bracket with 26.7% of them unmarried at the time of birth, while the lowest percentage of unmarried women with births belong to 20 to 34 years age bracket with 26.7% of them unmarried.
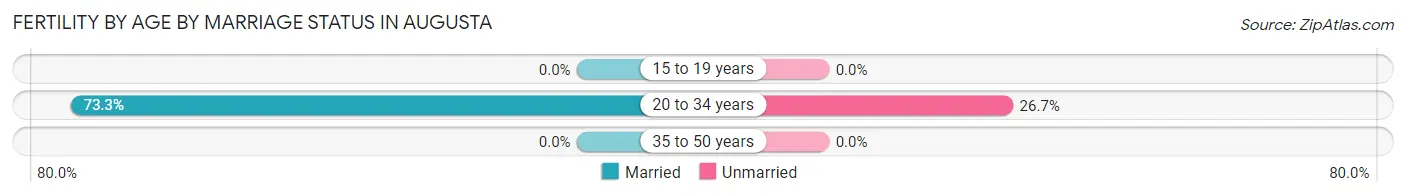
| Age Bracket | Married | Unmarried |
| 15 to 19 years | 0 (0.0%) | 0 (0.0%) |
| 20 to 34 years | 22 (73.3%) | 8 (26.7%) |
| 35 to 50 years | 0 (0.0%) | 0 (0.0%) |
| Total | 22 (73.3%) | 8 (26.7%) |
Fertility by Education in Augusta
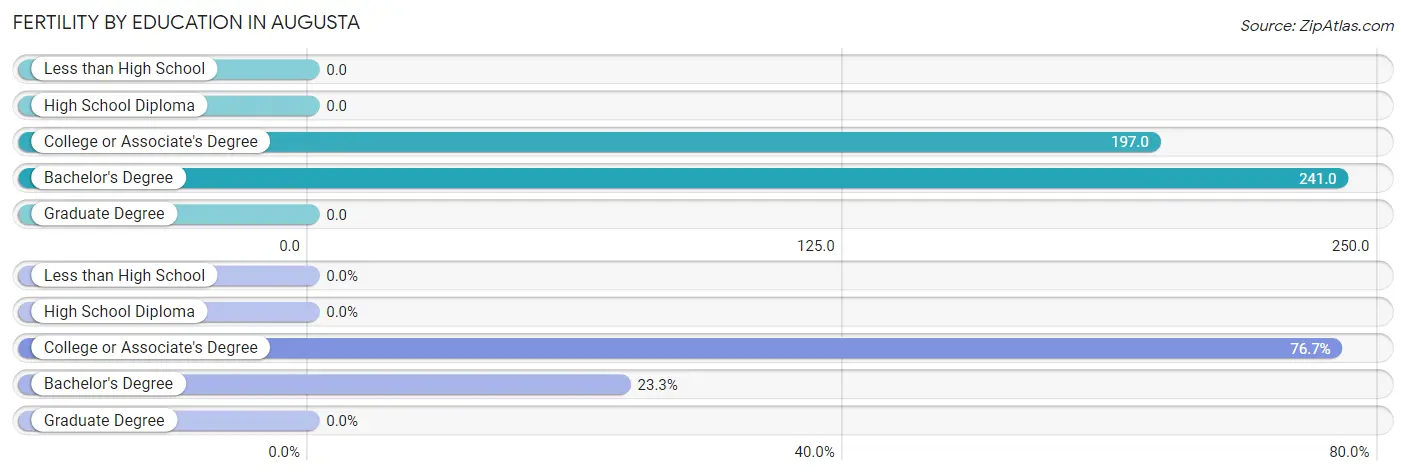
| Educational Attainment | Women with Births | Births / 1,000 Women |
| Less than High School | 0 (0.0%) | 0.0 |
| High School Diploma | 0 (0.0%) | 0.0 |
| College or Associate's Degree | 23 (76.7%) | 197.0 |
| Bachelor's Degree | 7 (23.3%) | 241.0 |
| Graduate Degree | 0 (0.0%) | 0.0 |
| Total | 30 (100.0%) | 118.0 |
Fertility by Education by Marriage Status in Augusta
26.7% of women with births in Augusta are unmarried. Women with the educational attainment of bachelor's degree are most likely to be married with 100.0% of them married at childbirth, while women with the educational attainment of college or associate's degree are least likely to be married with 34.8% of them unmarried at childbirth.
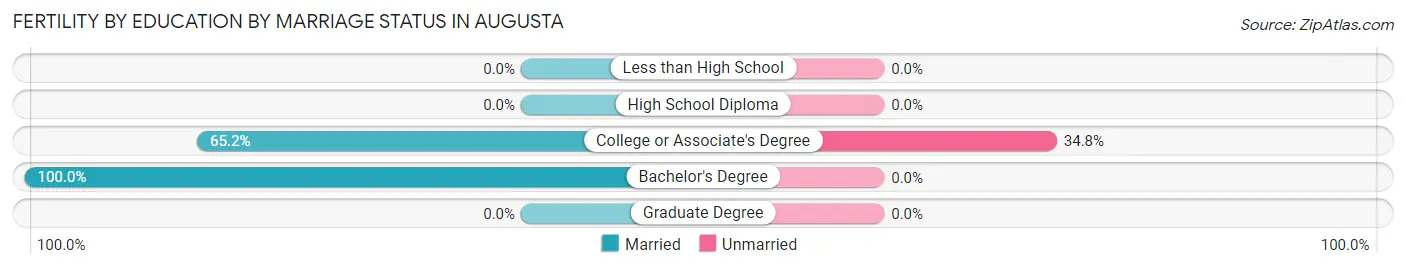
| Educational Attainment | Married | Unmarried |
| Less than High School | 0 (0.0%) | 0 (0.0%) |
| High School Diploma | 0 (0.0%) | 0 (0.0%) |
| College or Associate's Degree | 15 (65.2%) | 8 (34.8%) |
| Bachelor's Degree | 7 (100.0%) | 0 (0.0%) |
| Graduate Degree | 0 (0.0%) | 0 (0.0%) |
| Total | 22 (73.3%) | 8 (26.7%) |
Employment Characteristics in Augusta
Employment by Class of Employer in Augusta
Among the 494 employed individuals in Augusta, private company employees (380 | 76.9%), not-for-profit organizations (58 | 11.7%), and federal government employees (26 | 5.3%) make up the most common classes of employment.
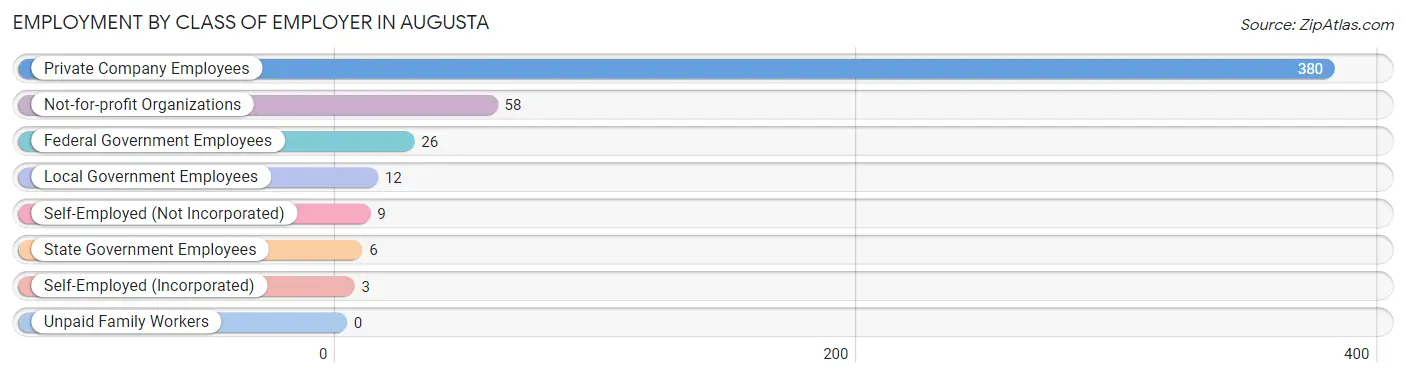
| Employer Class | # Employees | % Employees |
| Private Company Employees | 380 | 76.9% |
| Self-Employed (Incorporated) | 3 | 0.6% |
| Self-Employed (Not Incorporated) | 9 | 1.8% |
| Not-for-profit Organizations | 58 | 11.7% |
| Local Government Employees | 12 | 2.4% |
| State Government Employees | 6 | 1.2% |
| Federal Government Employees | 26 | 5.3% |
| Unpaid Family Workers | 0 | 0.0% |
| Total | 494 | 100.0% |
Employment Status by Age in Augusta
According to the labor force statistics for Augusta, out of the total population over 16 years of age (727), 76.9% or 559 individuals are in the labor force, with 9.0% or 50 of them unemployed. The age group with the highest labor force participation rate is 20 to 24 years, with 100.0% or 84 individuals in the labor force. Within the labor force, the 60 to 64 years age range has the highest percentage of unemployed individuals, with 22.9% or 8 of them being unemployed.
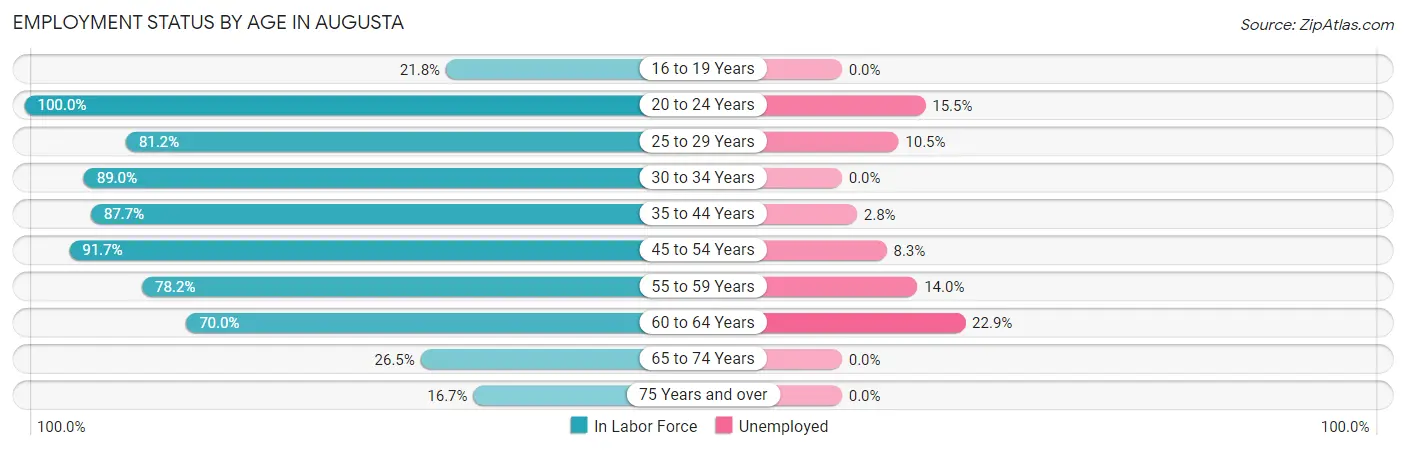
| Age Bracket | In Labor Force | Unemployed |
| 16 to 19 Years | 12 (21.8%) | 0 (0.0%) |
| 20 to 24 Years | 84 (100.0%) | 13 (15.5%) |
| 25 to 29 Years | 95 (81.2%) | 10 (10.5%) |
| 30 to 34 Years | 73 (89.0%) | 0 (0.0%) |
| 35 to 44 Years | 71 (87.7%) | 2 (2.8%) |
| 45 to 54 Years | 133 (91.7%) | 11 (8.3%) |
| 55 to 59 Years | 43 (78.2%) | 6 (14.0%) |
| 60 to 64 Years | 35 (70.0%) | 8 (22.9%) |
| 65 to 74 Years | 9 (26.5%) | 0 (0.0%) |
| 75 Years and over | 4 (16.7%) | 0 (0.0%) |
| Total | 559 (76.9%) | 50 (9.0%) |
Employment Status by Educational Attainment in Augusta
According to labor force statistics for Augusta, 84.9% of individuals (450) out of the total population between 25 and 64 years of age (530) are in the labor force, with 8.3% or 37 of them being unemployed. The group with the highest labor force participation rate are those with the educational attainment of bachelor's degree or higher, with 91.3% or 63 individuals in the labor force. Within the labor force, individuals with less than high school education have the highest percentage of unemployment, with 21.7% or 5 of them being unemployed.
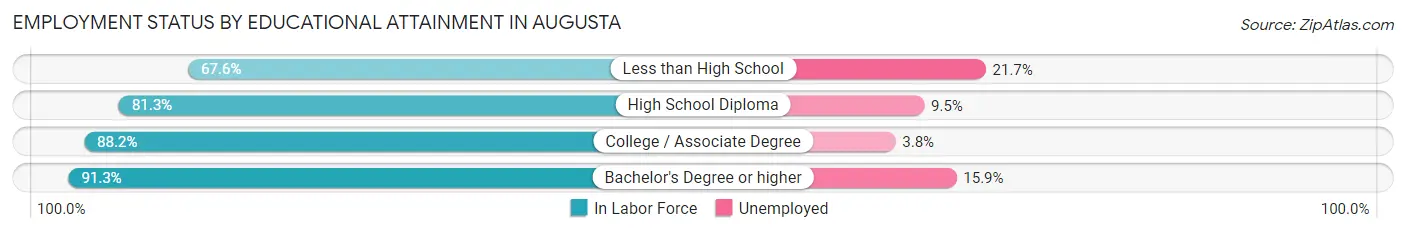
| Educational Attainment | In Labor Force | Unemployed |
| Less than High School | 23 (67.6%) | 7 (21.7%) |
| High School Diploma | 148 (81.3%) | 17 (9.5%) |
| College / Associate Degree | 216 (88.2%) | 9 (3.8%) |
| Bachelor's Degree or higher | 63 (91.3%) | 11 (15.9%) |
| Total | 450 (84.9%) | 44 (8.3%) |
Employment Occupations by Sex in Augusta
Management, Business, Science and Arts Occupations
The most common Management, Business, Science and Arts occupations in Augusta are Management (50 | 9.9%), Community & Social Service (37 | 7.3%), Computers, Engineering & Science (24 | 4.8%), Architecture & Engineering (18 | 3.6%), and Education Instruction & Library (18 | 3.6%).

Management, Business, Science and Arts Occupations by Sex
Within the Management, Business, Science and Arts occupations in Augusta, the most male-oriented occupations are Architecture & Engineering (100.0%), Life, Physical & Social Science (100.0%), and Computers, Engineering & Science (91.7%), while the most female-oriented occupations are Computers & Mathematics (100.0%), Education Instruction & Library (100.0%), and Health Diagnosing & Treating (100.0%).
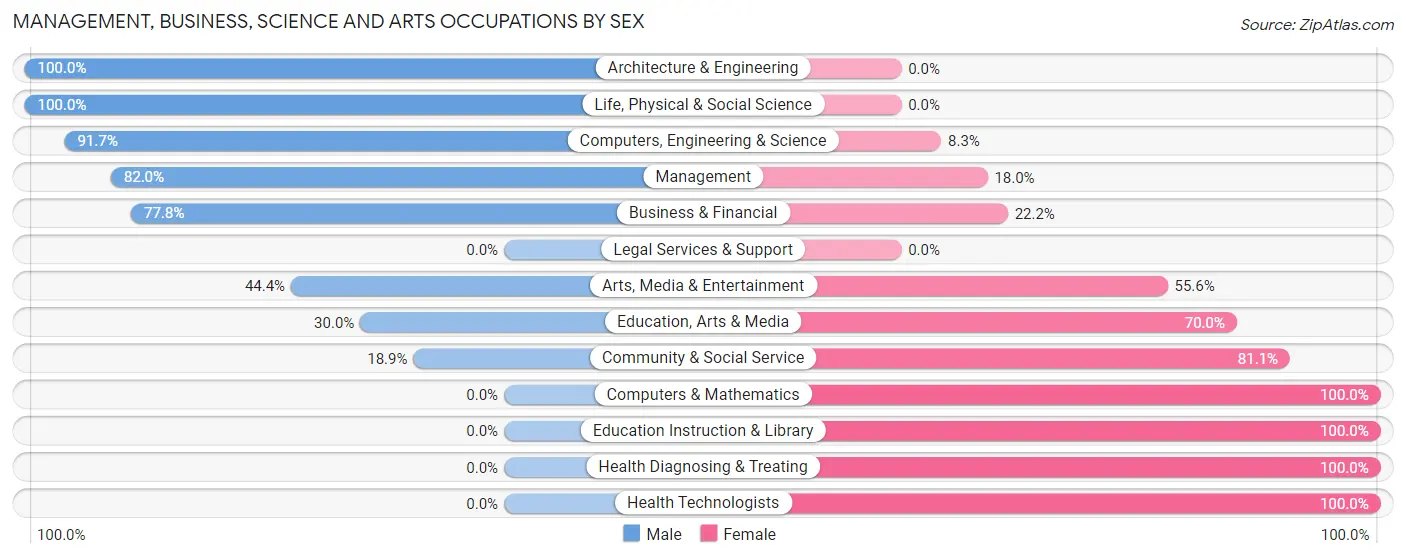
| Occupation | Male | Female |
| Management | 41 (82.0%) | 9 (18.0%) |
| Business & Financial | 7 (77.8%) | 2 (22.2%) |
| Computers, Engineering & Science | 22 (91.7%) | 2 (8.3%) |
| Computers & Mathematics | 0 (0.0%) | 2 (100.0%) |
| Architecture & Engineering | 18 (100.0%) | 0 (0.0%) |
| Life, Physical & Social Science | 4 (100.0%) | 0 (0.0%) |
| Community & Social Service | 7 (18.9%) | 30 (81.1%) |
| Education, Arts & Media | 3 (30.0%) | 7 (70.0%) |
| Legal Services & Support | 0 (0.0%) | 0 (0.0%) |
| Education Instruction & Library | 0 (0.0%) | 18 (100.0%) |
| Arts, Media & Entertainment | 4 (44.4%) | 5 (55.6%) |
| Health Diagnosing & Treating | 0 (0.0%) | 12 (100.0%) |
| Health Technologists | 0 (0.0%) | 8 (100.0%) |
| Total (Category) | 77 (58.3%) | 55 (41.7%) |
| Total (Overall) | 283 (56.1%) | 221 (43.9%) |
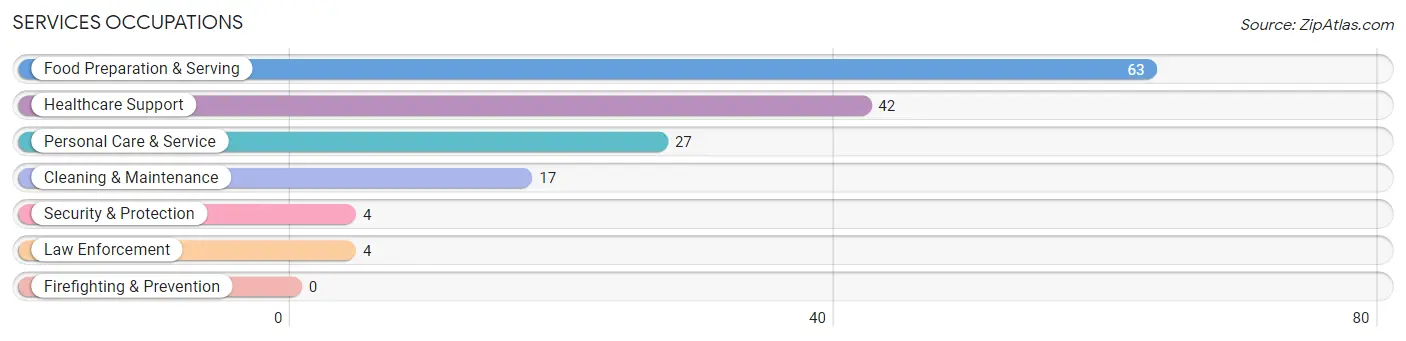
Services Occupations
The most common Services occupations in Augusta are Food Preparation & Serving (63 | 12.5%), Healthcare Support (42 | 8.3%), Personal Care & Service (27 | 5.4%), Cleaning & Maintenance (17 | 3.4%), and Security & Protection (4 | 0.8%).
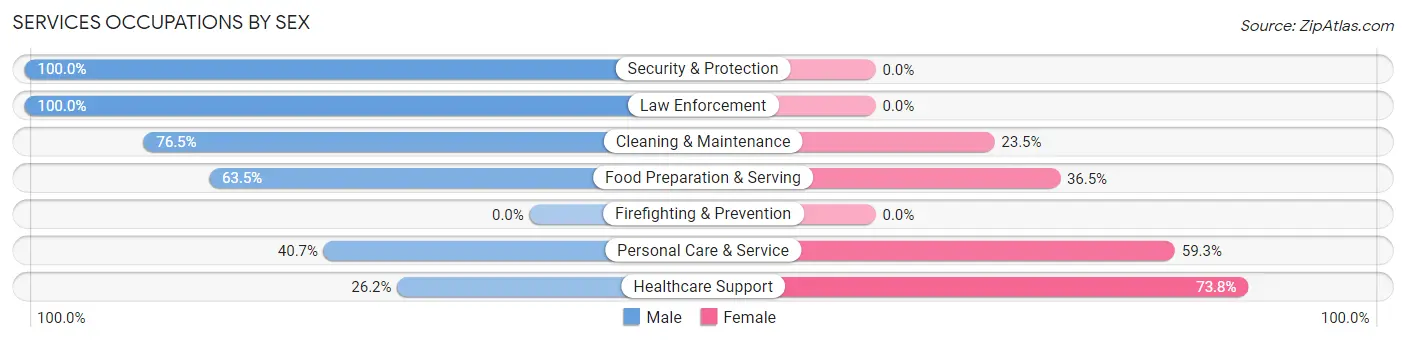
Services Occupations by Sex
Within the Services occupations in Augusta, the most male-oriented occupations are Security & Protection (100.0%), Law Enforcement (100.0%), and Cleaning & Maintenance (76.5%), while the most female-oriented occupations are Healthcare Support (73.8%), Personal Care & Service (59.3%), and Food Preparation & Serving (36.5%).
| Occupation | Male | Female |
| Healthcare Support | 11 (26.2%) | 31 (73.8%) |
| Security & Protection | 4 (100.0%) | 0 (0.0%) |
| Firefighting & Prevention | 0 (0.0%) | 0 (0.0%) |
| Law Enforcement | 4 (100.0%) | 0 (0.0%) |
| Food Preparation & Serving | 40 (63.5%) | 23 (36.5%) |
| Cleaning & Maintenance | 13 (76.5%) | 4 (23.5%) |
| Personal Care & Service | 11 (40.7%) | 16 (59.3%) |
| Total (Category) | 79 (51.6%) | 74 (48.4%) |
| Total (Overall) | 283 (56.1%) | 221 (43.9%) |
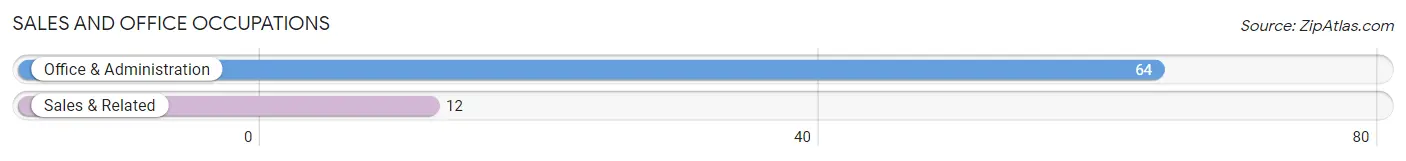
Sales and Office Occupations
The most common Sales and Office occupations in Augusta are Office & Administration (64 | 12.7%), and Sales & Related (12 | 2.4%).
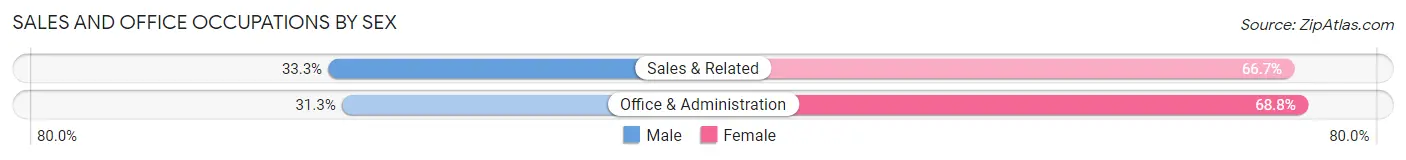
Sales and Office Occupations by Sex
| Occupation | Male | Female |
| Sales & Related | 4 (33.3%) | 8 (66.7%) |
| Office & Administration | 20 (31.2%) | 44 (68.8%) |
| Total (Category) | 24 (31.6%) | 52 (68.4%) |
| Total (Overall) | 283 (56.1%) | 221 (43.9%) |
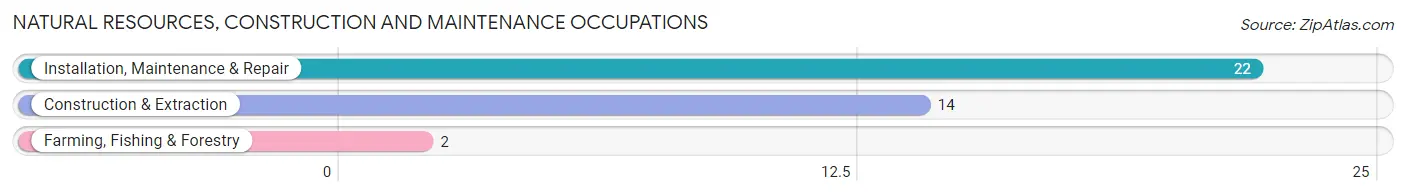
Natural Resources, Construction and Maintenance Occupations
The most common Natural Resources, Construction and Maintenance occupations in Augusta are Installation, Maintenance & Repair (22 | 4.4%), Construction & Extraction (14 | 2.8%), and Farming, Fishing & Forestry (2 | 0.4%).
Natural Resources, Construction and Maintenance Occupations by Sex
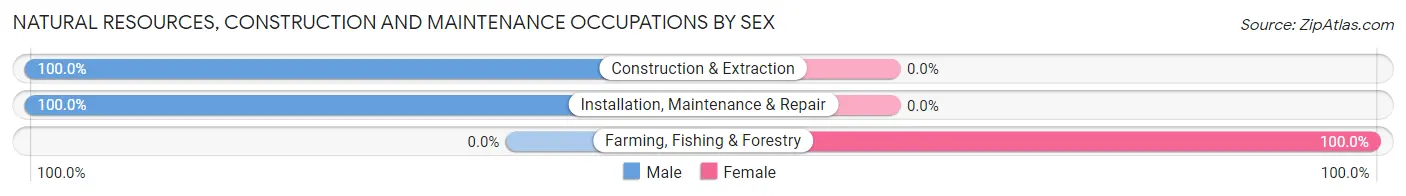
| Occupation | Male | Female |
| Farming, Fishing & Forestry | 0 (0.0%) | 2 (100.0%) |
| Construction & Extraction | 14 (100.0%) | 0 (0.0%) |
| Installation, Maintenance & Repair | 22 (100.0%) | 0 (0.0%) |
| Total (Category) | 36 (94.7%) | 2 (5.3%) |
| Total (Overall) | 283 (56.1%) | 221 (43.9%) |
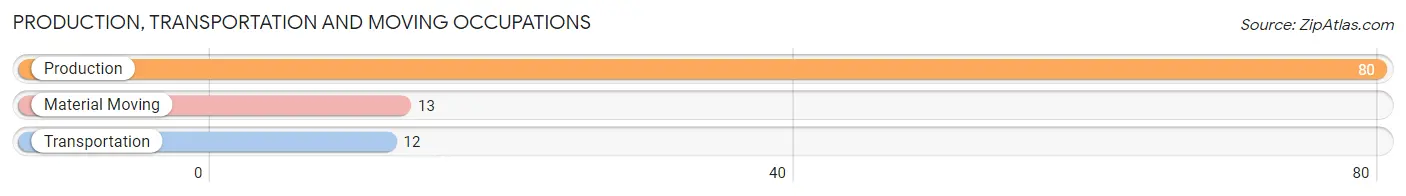
Production, Transportation and Moving Occupations
The most common Production, Transportation and Moving occupations in Augusta are Production (80 | 15.9%), Material Moving (13 | 2.6%), and Transportation (12 | 2.4%).
Production, Transportation and Moving Occupations by Sex
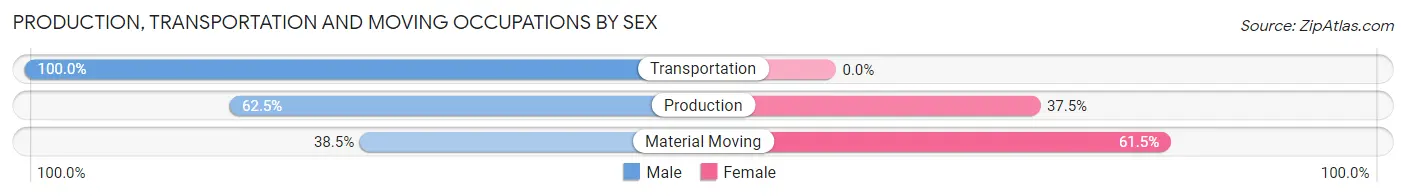
| Occupation | Male | Female |
| Production | 50 (62.5%) | 30 (37.5%) |
| Transportation | 12 (100.0%) | 0 (0.0%) |
| Material Moving | 5 (38.5%) | 8 (61.5%) |
| Total (Category) | 67 (63.8%) | 38 (36.2%) |
| Total (Overall) | 283 (56.1%) | 221 (43.9%) |
Employment Industries by Sex in Augusta
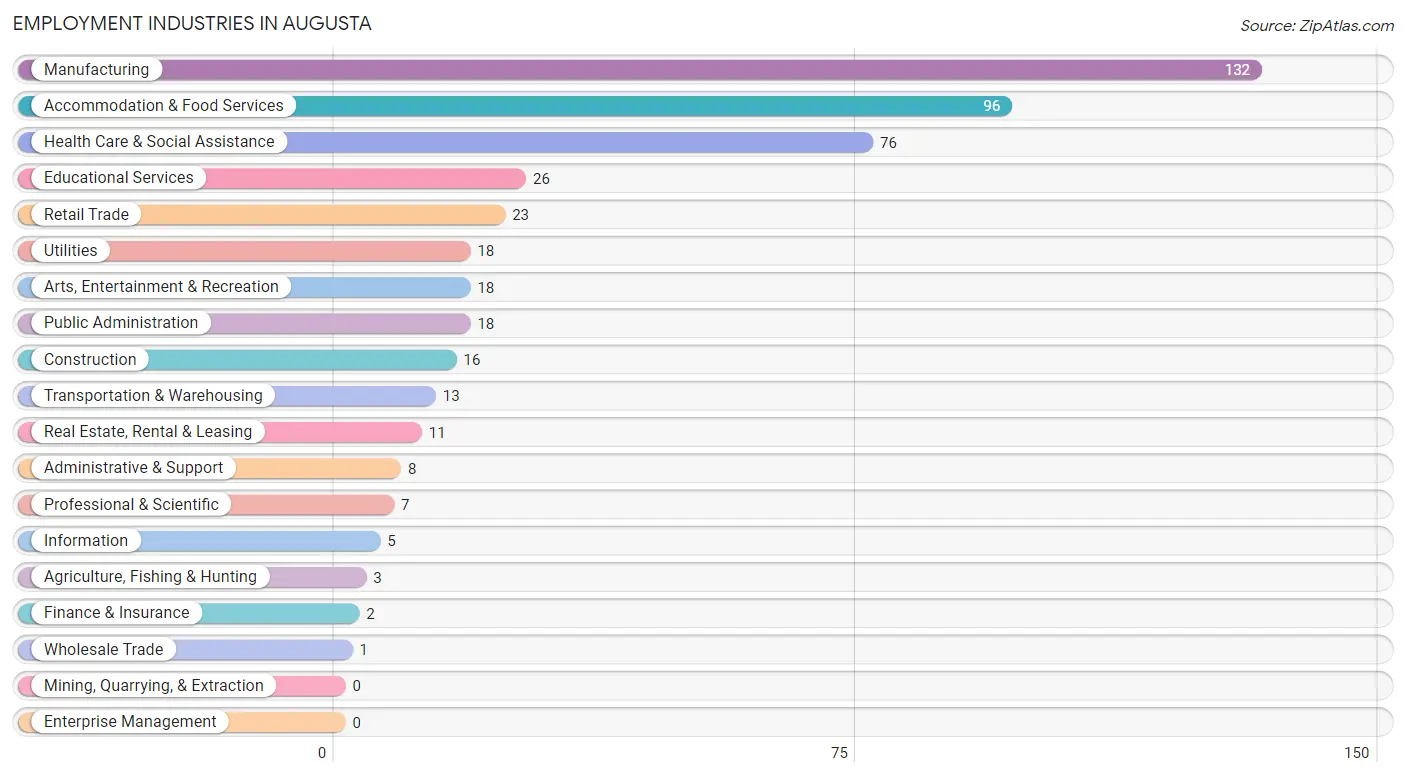
Employment Industries in Augusta
The major employment industries in Augusta include Manufacturing (132 | 26.2%), Accommodation & Food Services (96 | 19.1%), Health Care & Social Assistance (76 | 15.1%), Educational Services (26 | 5.2%), and Retail Trade (23 | 4.6%).
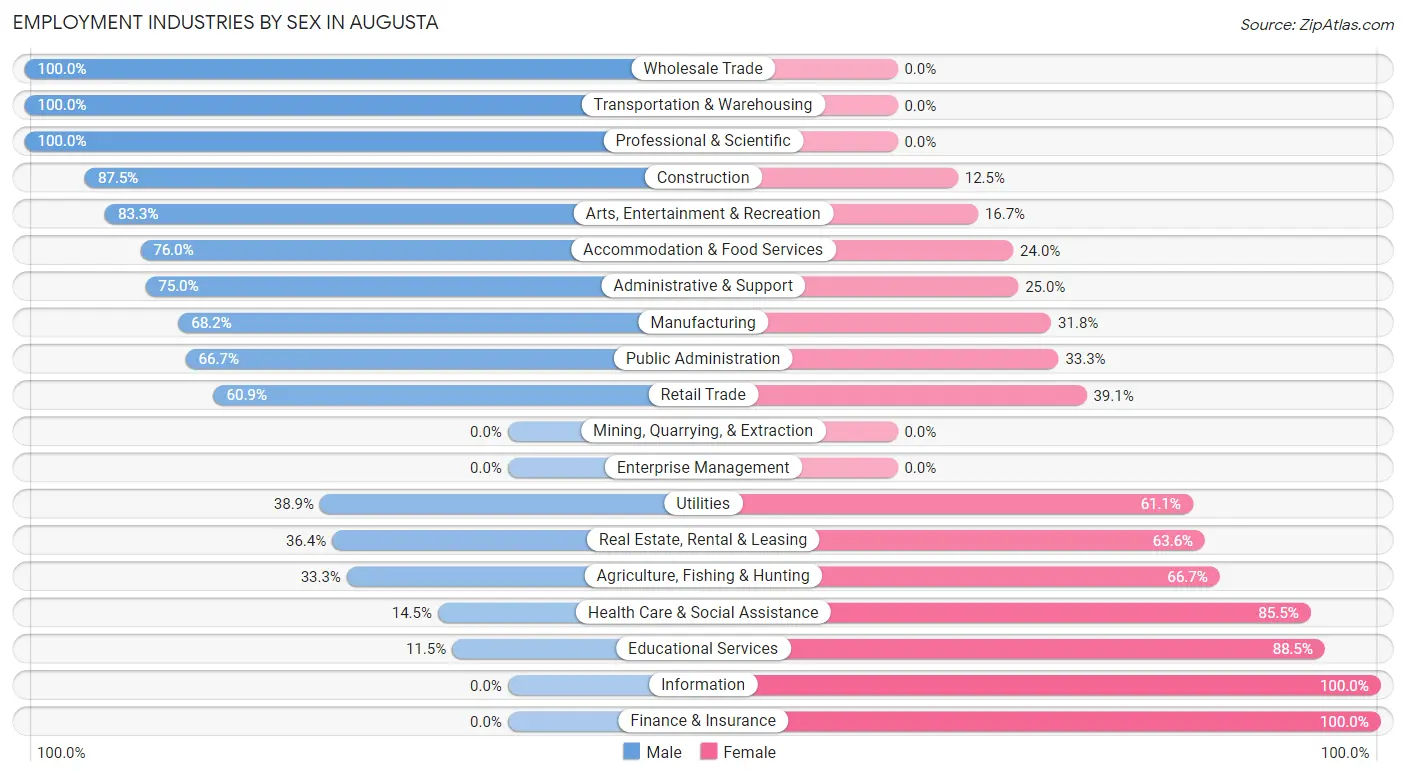
Employment Industries by Sex in Augusta
The Augusta industries that see more men than women are Wholesale Trade (100.0%), Transportation & Warehousing (100.0%), and Professional & Scientific (100.0%), whereas the industries that tend to have a higher number of women are Information (100.0%), Finance & Insurance (100.0%), and Educational Services (88.5%).
| Industry | Male | Female |
| Agriculture, Fishing & Hunting | 1 (33.3%) | 2 (66.7%) |
| Mining, Quarrying, & Extraction | 0 (0.0%) | 0 (0.0%) |
| Construction | 14 (87.5%) | 2 (12.5%) |
| Manufacturing | 90 (68.2%) | 42 (31.8%) |
| Wholesale Trade | 1 (100.0%) | 0 (0.0%) |
| Retail Trade | 14 (60.9%) | 9 (39.1%) |
| Transportation & Warehousing | 13 (100.0%) | 0 (0.0%) |
| Utilities | 7 (38.9%) | 11 (61.1%) |
| Information | 0 (0.0%) | 5 (100.0%) |
| Finance & Insurance | 0 (0.0%) | 2 (100.0%) |
| Real Estate, Rental & Leasing | 4 (36.4%) | 7 (63.6%) |
| Professional & Scientific | 7 (100.0%) | 0 (0.0%) |
| Enterprise Management | 0 (0.0%) | 0 (0.0%) |
| Administrative & Support | 6 (75.0%) | 2 (25.0%) |
| Educational Services | 3 (11.5%) | 23 (88.5%) |
| Health Care & Social Assistance | 11 (14.5%) | 65 (85.5%) |
| Arts, Entertainment & Recreation | 15 (83.3%) | 3 (16.7%) |
| Accommodation & Food Services | 73 (76.0%) | 23 (24.0%) |
| Public Administration | 12 (66.7%) | 6 (33.3%) |
| Total | 283 (56.1%) | 221 (43.9%) |
Education in Augusta
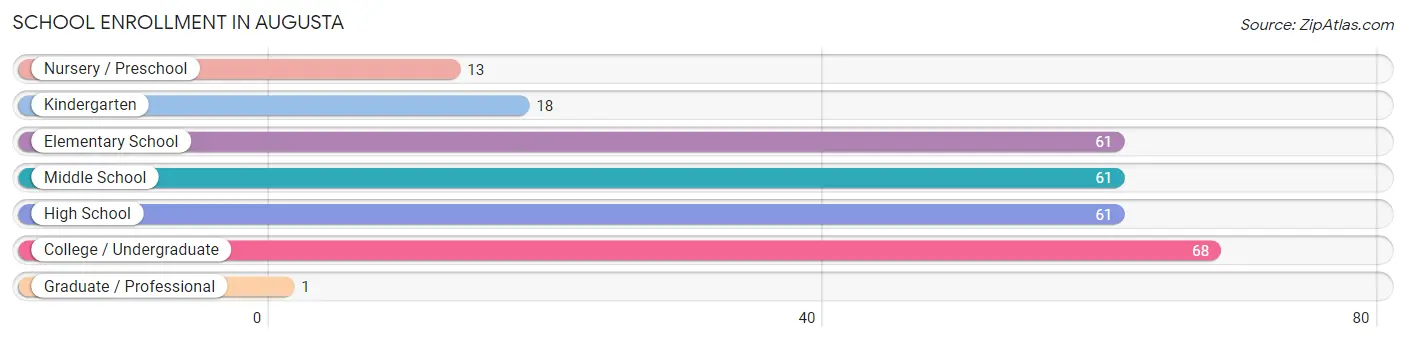
School Enrollment in Augusta
The most common levels of schooling among the 283 students in Augusta are college / undergraduate (68 | 24.0%), elementary school (61 | 21.5%), and middle school (61 | 21.5%).
| School Level | # Students | % Students |
| Nursery / Preschool | 13 | 4.6% |
| Kindergarten | 18 | 6.4% |
| Elementary School | 61 | 21.5% |
| Middle School | 61 | 21.5% |
| High School | 61 | 21.5% |
| College / Undergraduate | 68 | 24.0% |
| Graduate / Professional | 1 | 0.4% |
| Total | 283 | 100.0% |
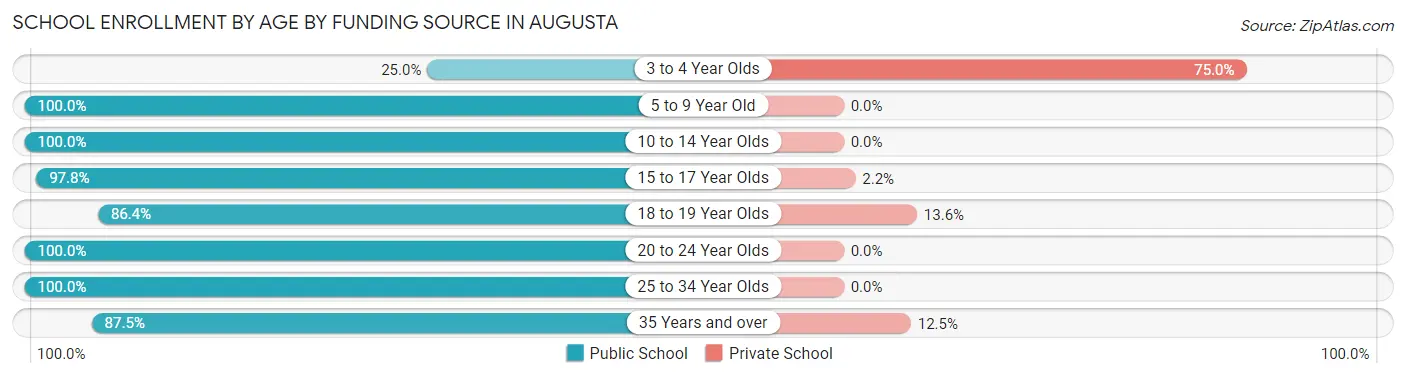
School Enrollment by Age by Funding Source in Augusta
Out of a total of 283 students who are enrolled in schools in Augusta, 12 (4.2%) attend a private institution, while the remaining 271 (95.8%) are enrolled in public schools. The age group of 3 to 4 year olds has the highest likelihood of being enrolled in private schools, with 6 (75.0% in the age bracket) enrolled. Conversely, the age group of 5 to 9 year old has the lowest likelihood of being enrolled in a private school, with 70 (100.0% in the age bracket) attending a public institution.
| Age Bracket | Public School | Private School |
| 3 to 4 Year Olds | 2 (25.0%) | 6 (75.0%) |
| 5 to 9 Year Old | 70 (100.0%) | 0 (0.0%) |
| 10 to 14 Year Olds | 75 (100.0%) | 0 (0.0%) |
| 15 to 17 Year Olds | 45 (97.8%) | 1 (2.2%) |
| 18 to 19 Year Olds | 19 (86.4%) | 3 (13.6%) |
| 20 to 24 Year Olds | 37 (100.0%) | 0 (0.0%) |
| 25 to 34 Year Olds | 9 (100.0%) | 0 (0.0%) |
| 35 Years and over | 14 (87.5%) | 2 (12.5%) |
| Total | 271 (95.8%) | 12 (4.2%) |
Educational Attainment by Field of Study in Augusta
Education (20 | 21.5%), science & technology (15 | 16.1%), bio, nature & agricultural (14 | 15.0%), engineering (13 | 14.0%), and business (12 | 12.9%) are the most common fields of study among 93 individuals in Augusta who have obtained a bachelor's degree or higher.
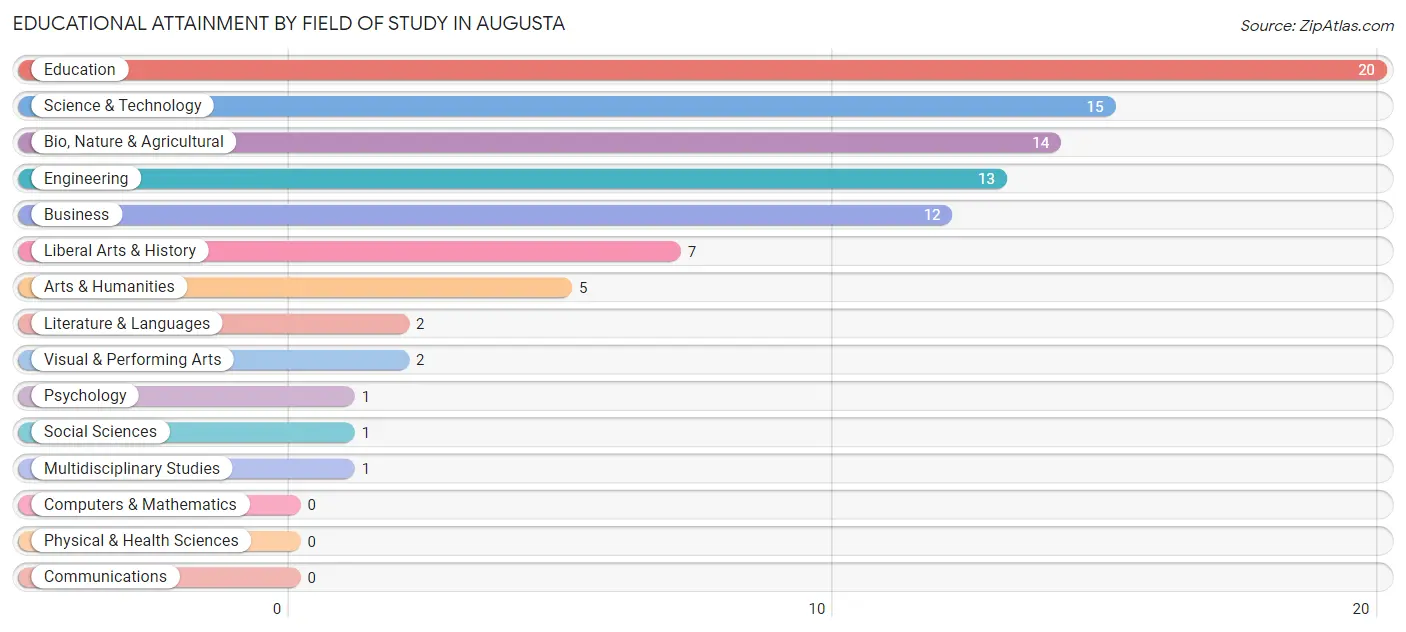
| Field of Study | # Graduates | % Graduates |
| Computers & Mathematics | 0 | 0.0% |
| Bio, Nature & Agricultural | 14 | 15.0% |
| Physical & Health Sciences | 0 | 0.0% |
| Psychology | 1 | 1.1% |
| Social Sciences | 1 | 1.1% |
| Engineering | 13 | 14.0% |
| Multidisciplinary Studies | 1 | 1.1% |
| Science & Technology | 15 | 16.1% |
| Business | 12 | 12.9% |
| Education | 20 | 21.5% |
| Literature & Languages | 2 | 2.1% |
| Liberal Arts & History | 7 | 7.5% |
| Visual & Performing Arts | 2 | 2.1% |
| Communications | 0 | 0.0% |
| Arts & Humanities | 5 | 5.4% |
| Total | 93 | 100.0% |
Transportation & Commute in Augusta
Vehicle Availability by Sex in Augusta
The most prevalent vehicle ownership categories in Augusta are males with 2 vehicles (143, accounting for 50.3%) and females with 2 vehicles (72, making up 68.1%).
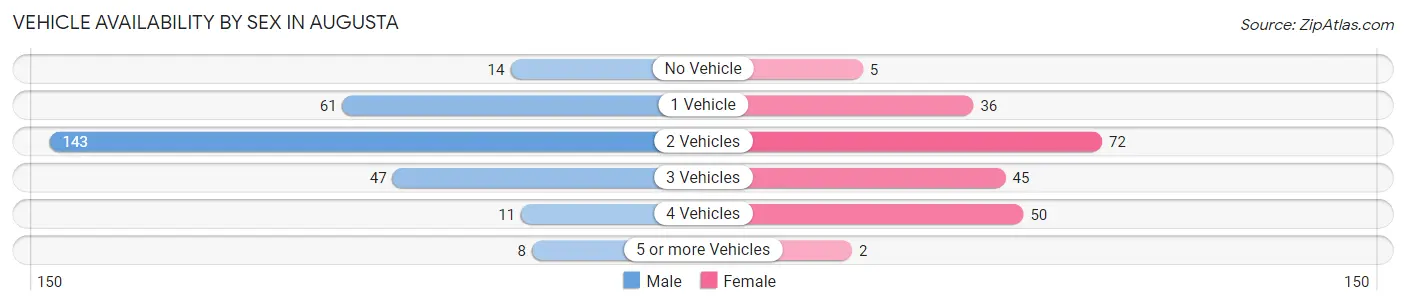
| Vehicles Available | Male | Female |
| No Vehicle | 14 (4.9%) | 5 (2.4%) |
| 1 Vehicle | 61 (21.5%) | 36 (17.1%) |
| 2 Vehicles | 143 (50.3%) | 72 (34.3%) |
| 3 Vehicles | 47 (16.6%) | 45 (21.4%) |
| 4 Vehicles | 11 (3.9%) | 50 (23.8%) |
| 5 or more Vehicles | 8 (2.8%) | 2 (0.9%) |
| Total | 284 (100.0%) | 210 (100.0%) |
Commute Time in Augusta
The most frequently occuring commute durations in Augusta are 20 to 24 minutes (95 commuters, 19.5%), 25 to 29 minutes (93 commuters, 19.1%), and 10 to 14 minutes (78 commuters, 16.0%).
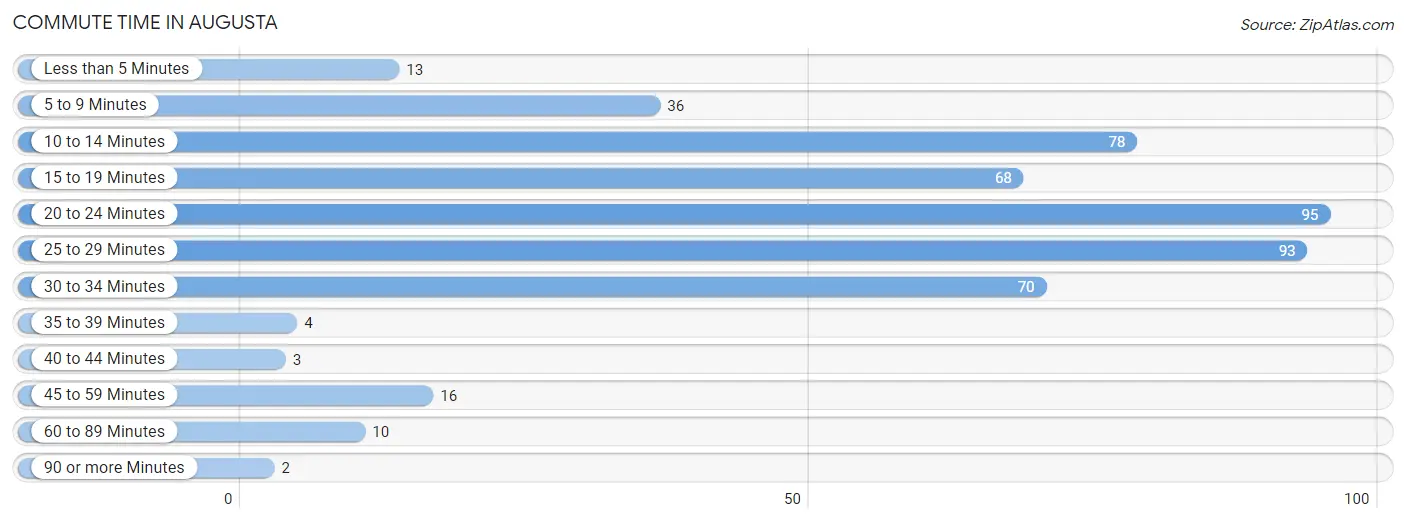
| Commute Time | # Commuters | % Commuters |
| Less than 5 Minutes | 13 | 2.7% |
| 5 to 9 Minutes | 36 | 7.4% |
| 10 to 14 Minutes | 78 | 16.0% |
| 15 to 19 Minutes | 68 | 13.9% |
| 20 to 24 Minutes | 95 | 19.5% |
| 25 to 29 Minutes | 93 | 19.1% |
| 30 to 34 Minutes | 70 | 14.3% |
| 35 to 39 Minutes | 4 | 0.8% |
| 40 to 44 Minutes | 3 | 0.6% |
| 45 to 59 Minutes | 16 | 3.3% |
| 60 to 89 Minutes | 10 | 2.1% |
| 90 or more Minutes | 2 | 0.4% |
Commute Time by Sex in Augusta
The most common commute times in Augusta are 20 to 24 minutes (64 commuters, 22.7%) for males and 25 to 29 minutes (46 commuters, 22.3%) for females.
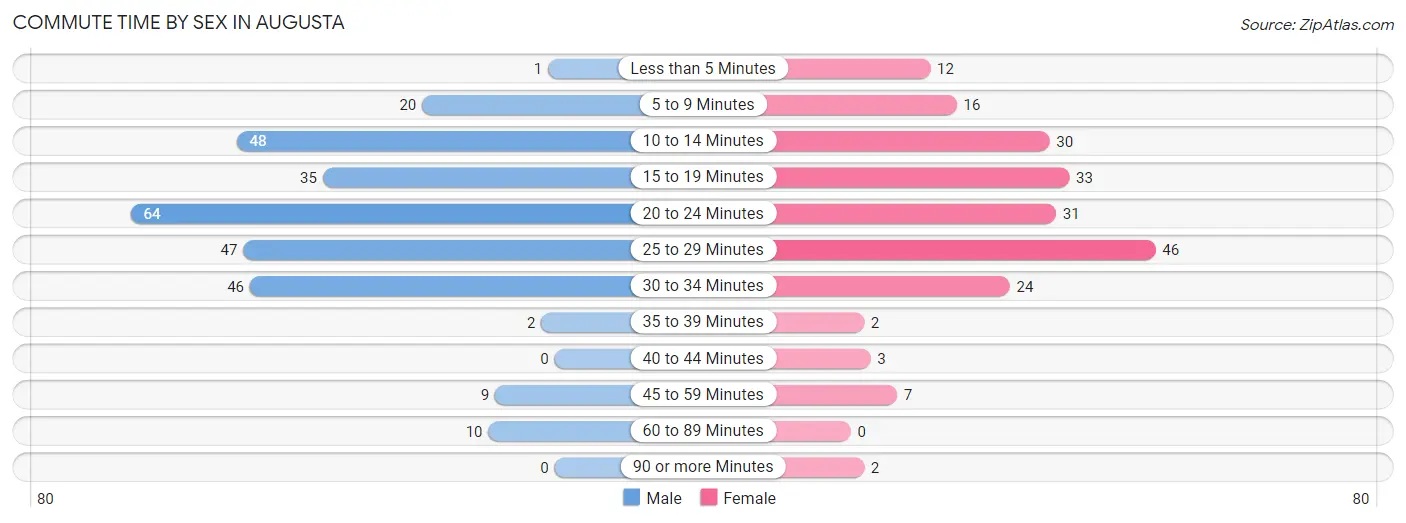
| Commute Time | Male | Female |
| Less than 5 Minutes | 1 (0.4%) | 12 (5.8%) |
| 5 to 9 Minutes | 20 (7.1%) | 16 (7.8%) |
| 10 to 14 Minutes | 48 (17.0%) | 30 (14.6%) |
| 15 to 19 Minutes | 35 (12.4%) | 33 (16.0%) |
| 20 to 24 Minutes | 64 (22.7%) | 31 (15.0%) |
| 25 to 29 Minutes | 47 (16.7%) | 46 (22.3%) |
| 30 to 34 Minutes | 46 (16.3%) | 24 (11.7%) |
| 35 to 39 Minutes | 2 (0.7%) | 2 (1.0%) |
| 40 to 44 Minutes | 0 (0.0%) | 3 (1.5%) |
| 45 to 59 Minutes | 9 (3.2%) | 7 (3.4%) |
| 60 to 89 Minutes | 10 (3.5%) | 0 (0.0%) |
| 90 or more Minutes | 0 (0.0%) | 2 (1.0%) |
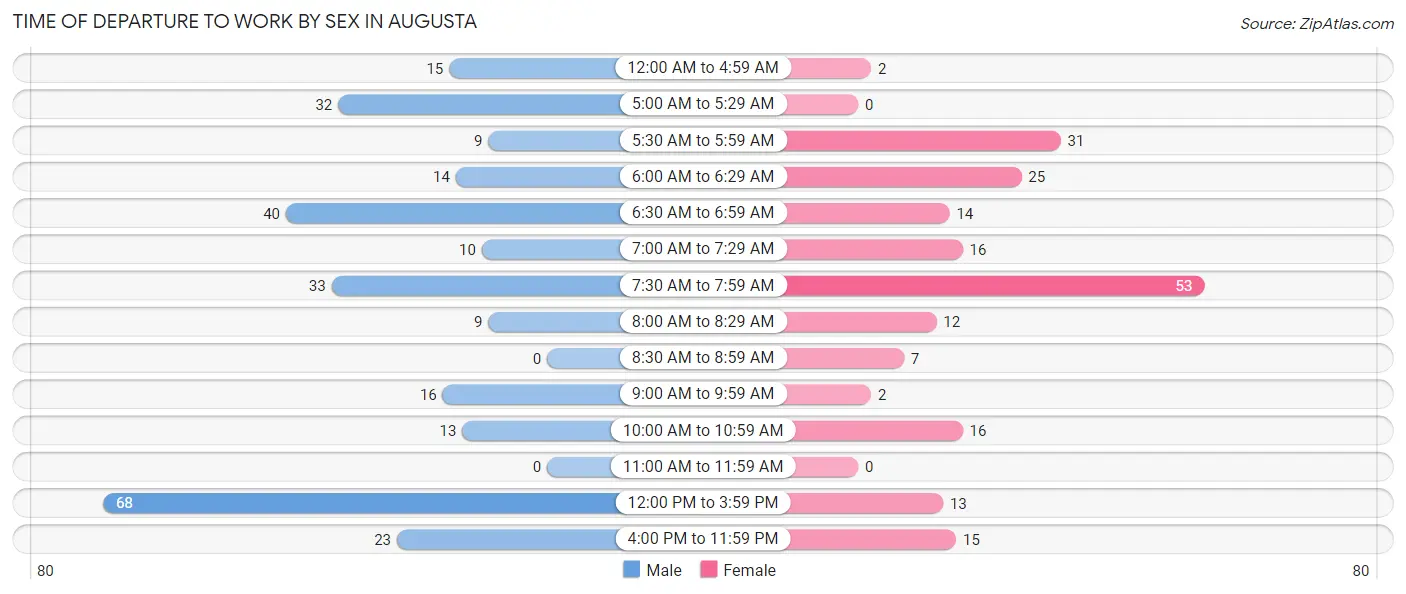
Time of Departure to Work by Sex in Augusta
The most frequent times of departure to work in Augusta are 12:00 PM to 3:59 PM (68, 24.1%) for males and 7:30 AM to 7:59 AM (53, 25.7%) for females.
| Time of Departure | Male | Female |
| 12:00 AM to 4:59 AM | 15 (5.3%) | 2 (1.0%) |
| 5:00 AM to 5:29 AM | 32 (11.4%) | 0 (0.0%) |
| 5:30 AM to 5:59 AM | 9 (3.2%) | 31 (15.0%) |
| 6:00 AM to 6:29 AM | 14 (5.0%) | 25 (12.1%) |
| 6:30 AM to 6:59 AM | 40 (14.2%) | 14 (6.8%) |
| 7:00 AM to 7:29 AM | 10 (3.5%) | 16 (7.8%) |
| 7:30 AM to 7:59 AM | 33 (11.7%) | 53 (25.7%) |
| 8:00 AM to 8:29 AM | 9 (3.2%) | 12 (5.8%) |
| 8:30 AM to 8:59 AM | 0 (0.0%) | 7 (3.4%) |
| 9:00 AM to 9:59 AM | 16 (5.7%) | 2 (1.0%) |
| 10:00 AM to 10:59 AM | 13 (4.6%) | 16 (7.8%) |
| 11:00 AM to 11:59 AM | 0 (0.0%) | 0 (0.0%) |
| 12:00 PM to 3:59 PM | 68 (24.1%) | 13 (6.3%) |
| 4:00 PM to 11:59 PM | 23 (8.2%) | 15 (7.3%) |
| Total | 282 (100.0%) | 206 (100.0%) |
Housing Occupancy in Augusta
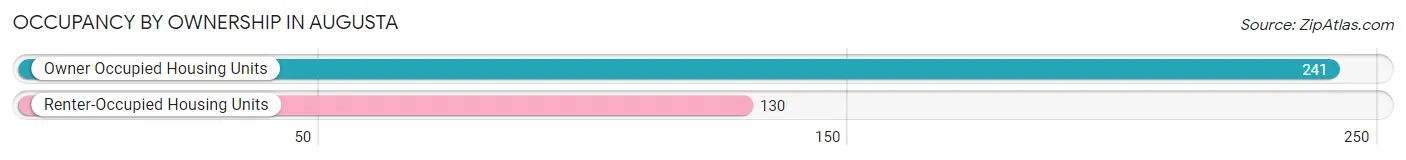
Occupancy by Ownership in Augusta
Of the total 371 dwellings in Augusta, owner-occupied units account for 241 (65.0%), while renter-occupied units make up 130 (35.0%).
| Occupancy | # Housing Units | % Housing Units |
| Owner Occupied Housing Units | 241 | 65.0% |
| Renter-Occupied Housing Units | 130 | 35.0% |
| Total Occupied Housing Units | 371 | 100.0% |
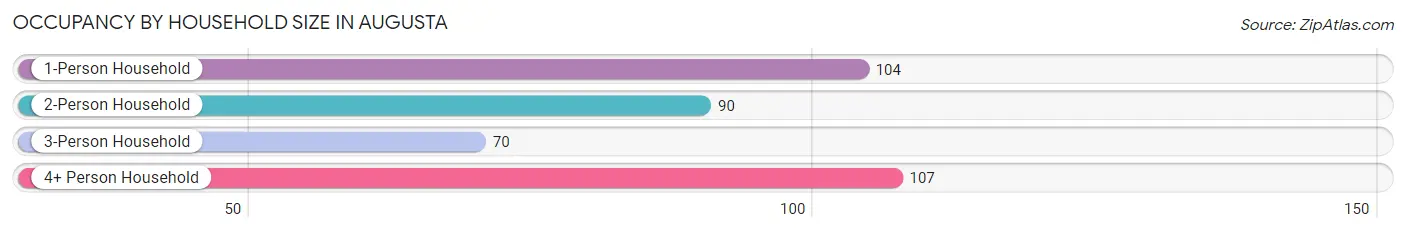
Occupancy by Household Size in Augusta
| Household Size | # Housing Units | % Housing Units |
| 1-Person Household | 104 | 28.0% |
| 2-Person Household | 90 | 24.3% |
| 3-Person Household | 70 | 18.9% |
| 4+ Person Household | 107 | 28.8% |
| Total Housing Units | 371 | 100.0% |
Occupancy by Ownership by Household Size in Augusta
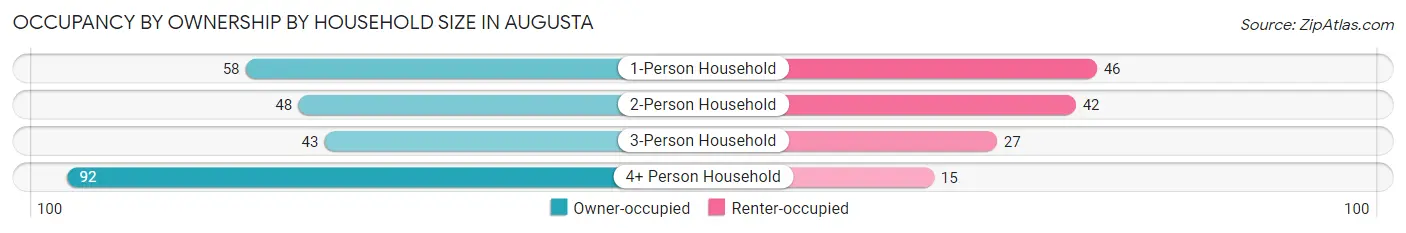
| Household Size | Owner-occupied | Renter-occupied |
| 1-Person Household | 58 (55.8%) | 46 (44.2%) |
| 2-Person Household | 48 (53.3%) | 42 (46.7%) |
| 3-Person Household | 43 (61.4%) | 27 (38.6%) |
| 4+ Person Household | 92 (86.0%) | 15 (14.0%) |
| Total Housing Units | 241 (65.0%) | 130 (35.0%) |
Occupancy by Educational Attainment in Augusta
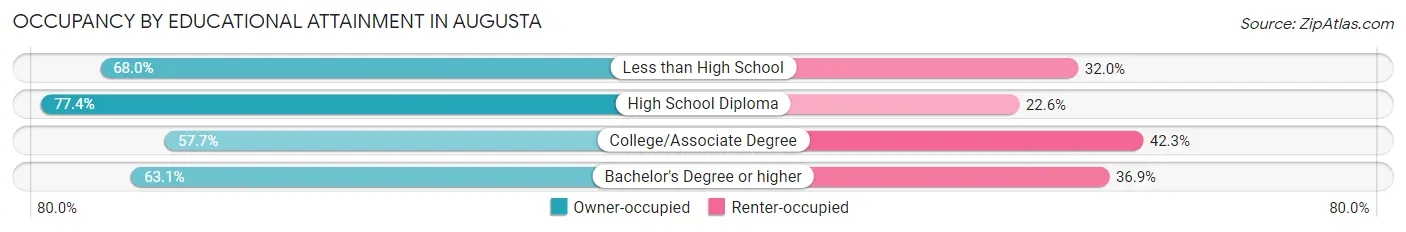
| Household Size | Owner-occupied | Renter-occupied |
| Less than High School | 17 (68.0%) | 8 (32.0%) |
| High School Diploma | 82 (77.4%) | 24 (22.6%) |
| College/Associate Degree | 101 (57.7%) | 74 (42.3%) |
| Bachelor's Degree or higher | 41 (63.1%) | 24 (36.9%) |
Occupancy by Age of Householder in Augusta
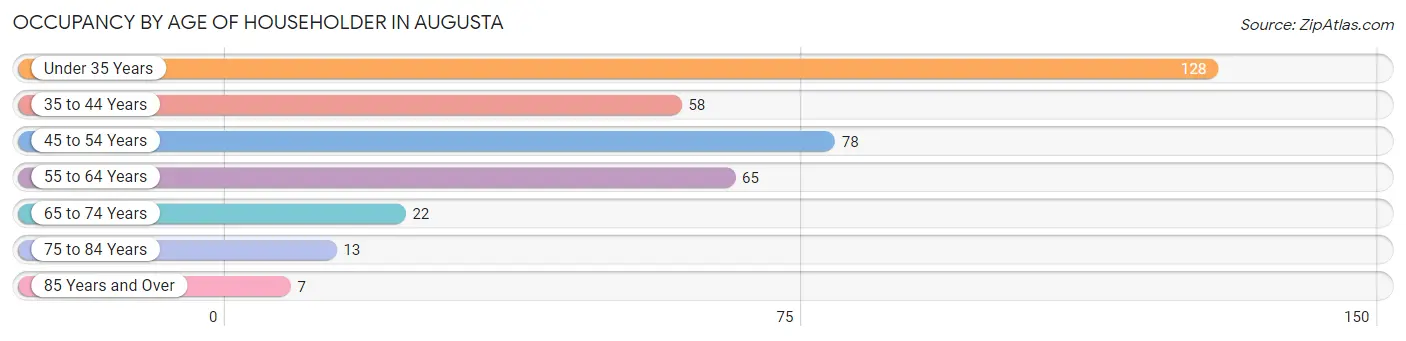
| Age Bracket | # Households | % Households |
| Under 35 Years | 128 | 34.5% |
| 35 to 44 Years | 58 | 15.6% |
| 45 to 54 Years | 78 | 21.0% |
| 55 to 64 Years | 65 | 17.5% |
| 65 to 74 Years | 22 | 5.9% |
| 75 to 84 Years | 13 | 3.5% |
| 85 Years and Over | 7 | 1.9% |
| Total | 371 | 100.0% |
Housing Finances in Augusta
Median Income by Occupancy in Augusta
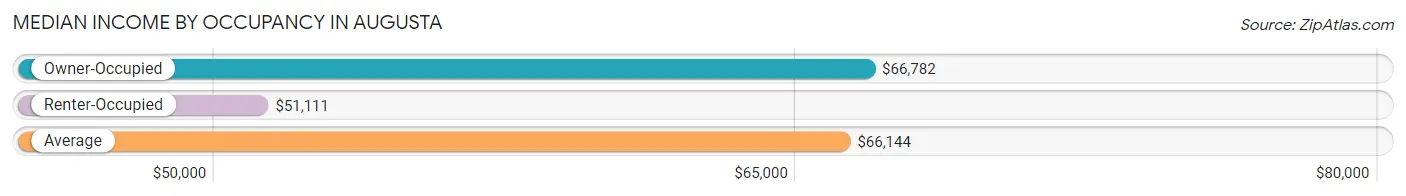
| Occupancy Type | # Households | Median Income |
| Owner-Occupied | 241 (65.0%) | $66,782 |
| Renter-Occupied | 130 (35.0%) | $51,111 |
| Average | 371 (100.0%) | $66,144 |
Occupancy by Householder Income Bracket in Augusta
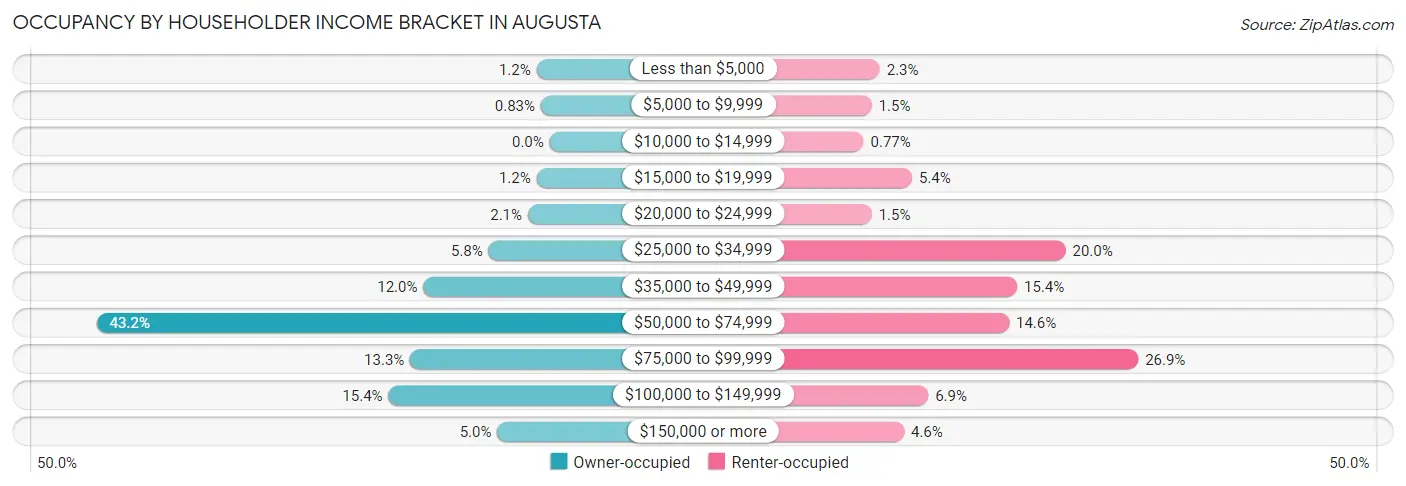
| Income Bracket | Owner-occupied | Renter-occupied |
| Less than $5,000 | 3 (1.2%) | 3 (2.3%) |
| $5,000 to $9,999 | 2 (0.8%) | 2 (1.5%) |
| $10,000 to $14,999 | 0 (0.0%) | 1 (0.8%) |
| $15,000 to $19,999 | 3 (1.2%) | 7 (5.4%) |
| $20,000 to $24,999 | 5 (2.1%) | 2 (1.5%) |
| $25,000 to $34,999 | 14 (5.8%) | 26 (20.0%) |
| $35,000 to $49,999 | 29 (12.0%) | 20 (15.4%) |
| $50,000 to $74,999 | 104 (43.1%) | 19 (14.6%) |
| $75,000 to $99,999 | 32 (13.3%) | 35 (26.9%) |
| $100,000 to $149,999 | 37 (15.3%) | 9 (6.9%) |
| $150,000 or more | 12 (5.0%) | 6 (4.6%) |
| Total | 241 (100.0%) | 130 (100.0%) |
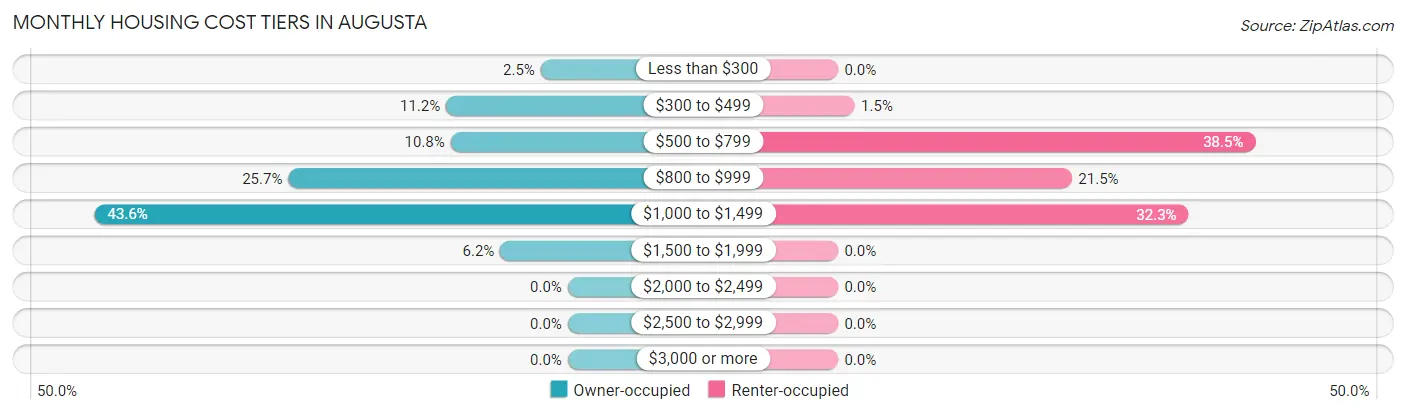
Monthly Housing Cost Tiers in Augusta
| Monthly Cost | Owner-occupied | Renter-occupied |
| Less than $300 | 6 (2.5%) | 0 (0.0%) |
| $300 to $499 | 27 (11.2%) | 2 (1.5%) |
| $500 to $799 | 26 (10.8%) | 50 (38.5%) |
| $800 to $999 | 62 (25.7%) | 28 (21.5%) |
| $1,000 to $1,499 | 105 (43.6%) | 42 (32.3%) |
| $1,500 to $1,999 | 15 (6.2%) | 0 (0.0%) |
| $2,000 to $2,499 | 0 (0.0%) | 0 (0.0%) |
| $2,500 to $2,999 | 0 (0.0%) | 0 (0.0%) |
| $3,000 or more | 0 (0.0%) | 0 (0.0%) |
| Total | 241 (100.0%) | 130 (100.0%) |
Physical Housing Characteristics in Augusta
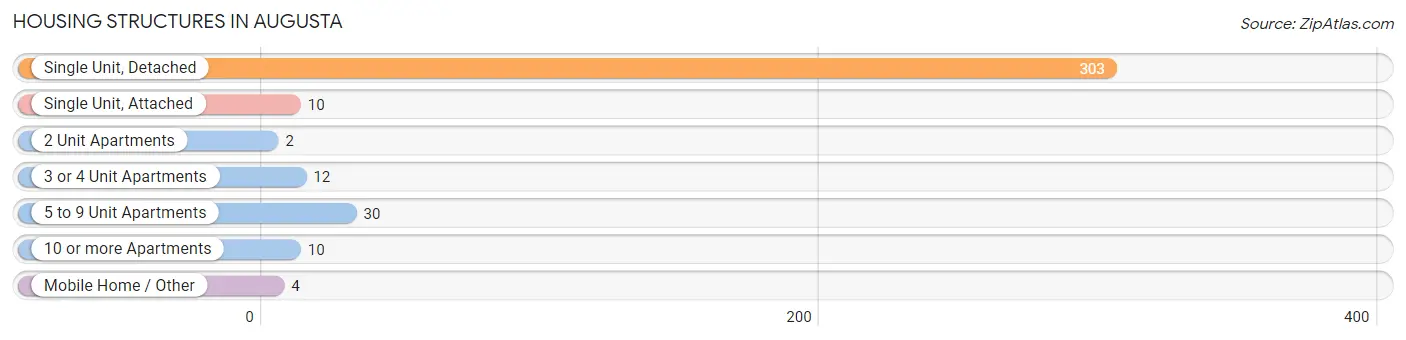
Housing Structures in Augusta
| Structure Type | # Housing Units | % Housing Units |
| Single Unit, Detached | 303 | 81.7% |
| Single Unit, Attached | 10 | 2.7% |
| 2 Unit Apartments | 2 | 0.5% |
| 3 or 4 Unit Apartments | 12 | 3.2% |
| 5 to 9 Unit Apartments | 30 | 8.1% |
| 10 or more Apartments | 10 | 2.7% |
| Mobile Home / Other | 4 | 1.1% |
| Total | 371 | 100.0% |
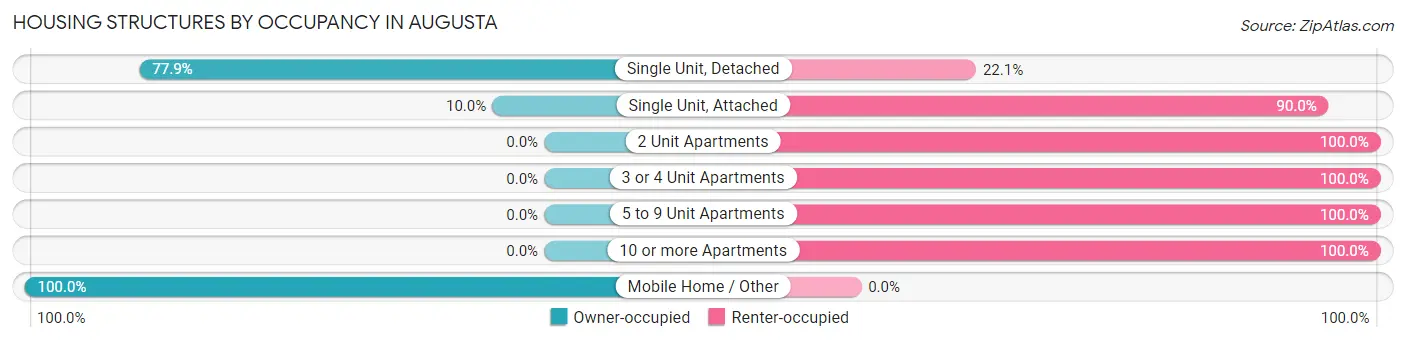
Housing Structures by Occupancy in Augusta
| Structure Type | Owner-occupied | Renter-occupied |
| Single Unit, Detached | 236 (77.9%) | 67 (22.1%) |
| Single Unit, Attached | 1 (10.0%) | 9 (90.0%) |
| 2 Unit Apartments | 0 (0.0%) | 2 (100.0%) |
| 3 or 4 Unit Apartments | 0 (0.0%) | 12 (100.0%) |
| 5 to 9 Unit Apartments | 0 (0.0%) | 30 (100.0%) |
| 10 or more Apartments | 0 (0.0%) | 10 (100.0%) |
| Mobile Home / Other | 4 (100.0%) | 0 (0.0%) |
| Total | 241 (65.0%) | 130 (35.0%) |
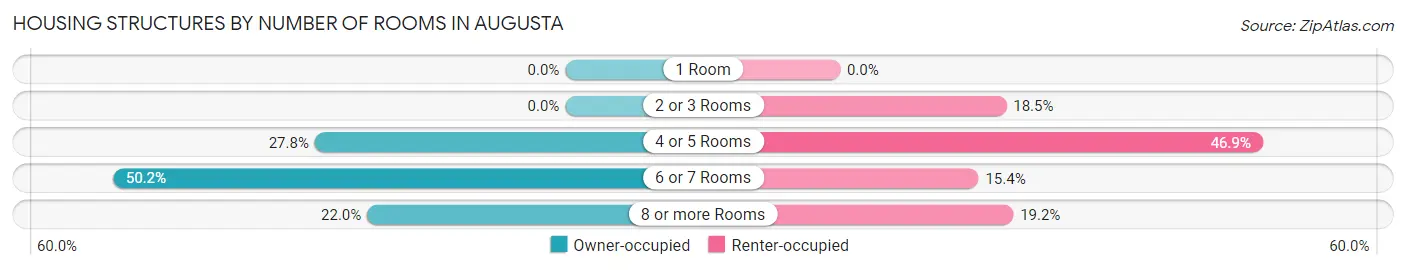
Housing Structures by Number of Rooms in Augusta
| Number of Rooms | Owner-occupied | Renter-occupied |
| 1 Room | 0 (0.0%) | 0 (0.0%) |
| 2 or 3 Rooms | 0 (0.0%) | 24 (18.5%) |
| 4 or 5 Rooms | 67 (27.8%) | 61 (46.9%) |
| 6 or 7 Rooms | 121 (50.2%) | 20 (15.4%) |
| 8 or more Rooms | 53 (22.0%) | 25 (19.2%) |
| Total | 241 (100.0%) | 130 (100.0%) |
Housing Structure by Heating Type in Augusta
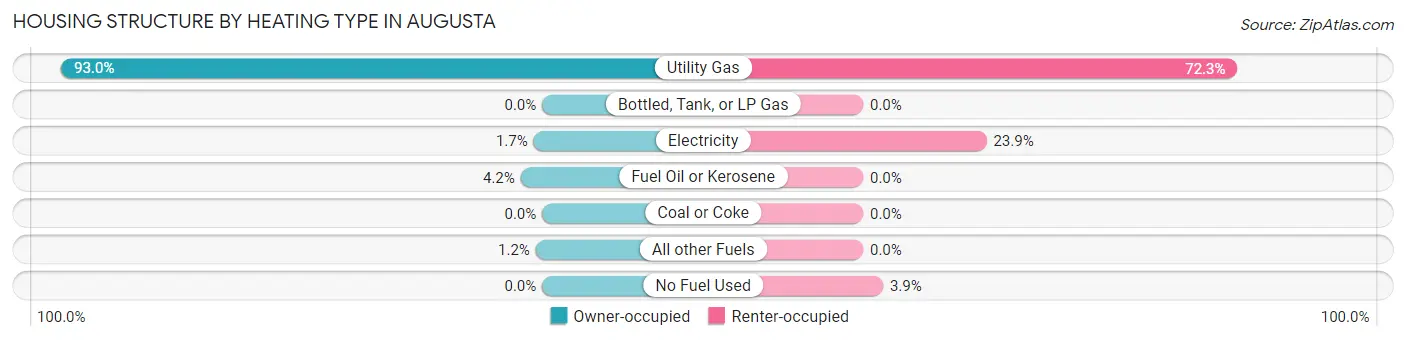
| Heating Type | Owner-occupied | Renter-occupied |
| Utility Gas | 224 (92.9%) | 94 (72.3%) |
| Bottled, Tank, or LP Gas | 0 (0.0%) | 0 (0.0%) |
| Electricity | 4 (1.7%) | 31 (23.8%) |
| Fuel Oil or Kerosene | 10 (4.2%) | 0 (0.0%) |
| Coal or Coke | 0 (0.0%) | 0 (0.0%) |
| All other Fuels | 3 (1.2%) | 0 (0.0%) |
| No Fuel Used | 0 (0.0%) | 5 (3.8%) |
| Total | 241 (100.0%) | 130 (100.0%) |
Household Vehicle Usage in Augusta
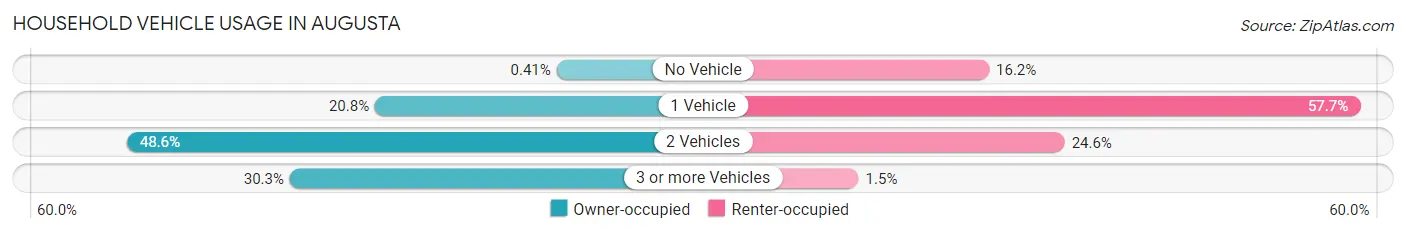
| Vehicles per Household | Owner-occupied | Renter-occupied |
| No Vehicle | 1 (0.4%) | 21 (16.2%) |
| 1 Vehicle | 50 (20.7%) | 75 (57.7%) |
| 2 Vehicles | 117 (48.5%) | 32 (24.6%) |
| 3 or more Vehicles | 73 (30.3%) | 2 (1.5%) |
| Total | 241 (100.0%) | 130 (100.0%) |
Real Estate & Mortgages in Augusta
Real Estate and Mortgage Overview in Augusta
| Characteristic | Without Mortgage | With Mortgage |
| Housing Units | 55 | 186 |
| Median Property Value | $135,600 | $120,000 |
| Median Household Income | $54,688 | $11 |
| Monthly Housing Costs | $489 | $0 |
| Real Estate Taxes | $2,333 | $4 |
Property Value by Mortgage Status in Augusta
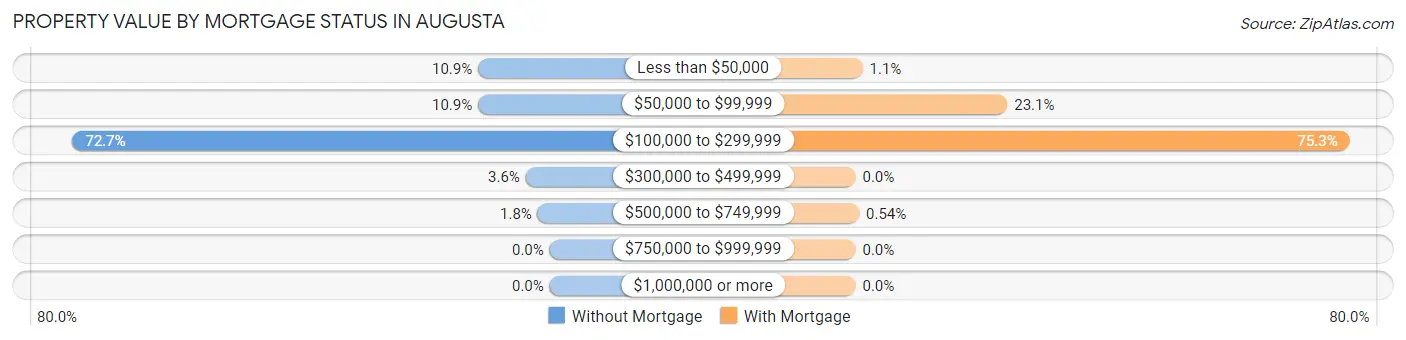
| Property Value | Without Mortgage | With Mortgage |
| Less than $50,000 | 6 (10.9%) | 2 (1.1%) |
| $50,000 to $99,999 | 6 (10.9%) | 43 (23.1%) |
| $100,000 to $299,999 | 40 (72.7%) | 140 (75.3%) |
| $300,000 to $499,999 | 2 (3.6%) | 0 (0.0%) |
| $500,000 to $749,999 | 1 (1.8%) | 1 (0.5%) |
| $750,000 to $999,999 | 0 (0.0%) | 0 (0.0%) |
| $1,000,000 or more | 0 (0.0%) | 0 (0.0%) |
| Total | 55 (100.0%) | 186 (100.0%) |
Household Income by Mortgage Status in Augusta
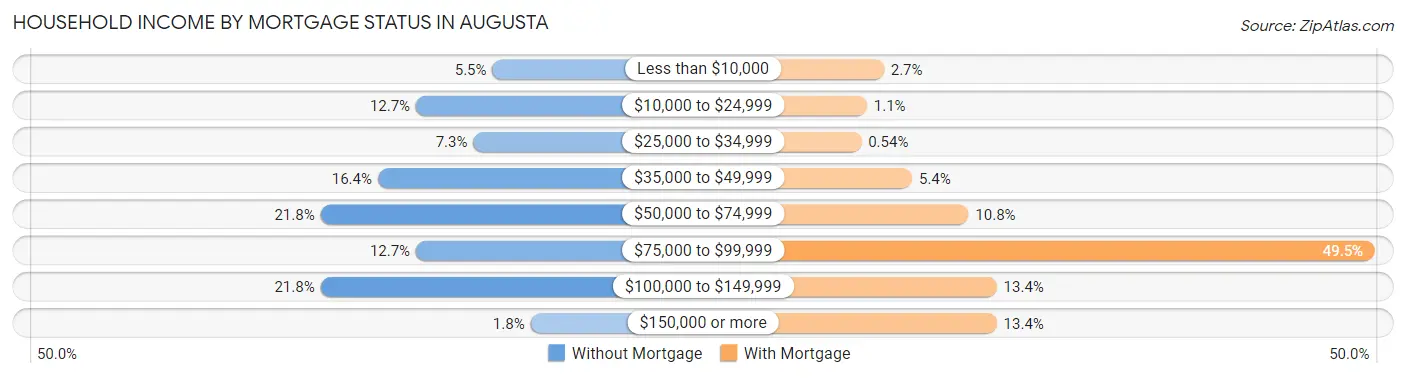
| Household Income | Without Mortgage | With Mortgage |
| Less than $10,000 | 3 (5.4%) | 5 (2.7%) |
| $10,000 to $24,999 | 7 (12.7%) | 2 (1.1%) |
| $25,000 to $34,999 | 4 (7.3%) | 1 (0.5%) |
| $35,000 to $49,999 | 9 (16.4%) | 10 (5.4%) |
| $50,000 to $74,999 | 12 (21.8%) | 20 (10.7%) |
| $75,000 to $99,999 | 7 (12.7%) | 92 (49.5%) |
| $100,000 to $149,999 | 12 (21.8%) | 25 (13.4%) |
| $150,000 or more | 1 (1.8%) | 25 (13.4%) |
| Total | 55 (100.0%) | 186 (100.0%) |
Property Value to Household Income Ratio in Augusta
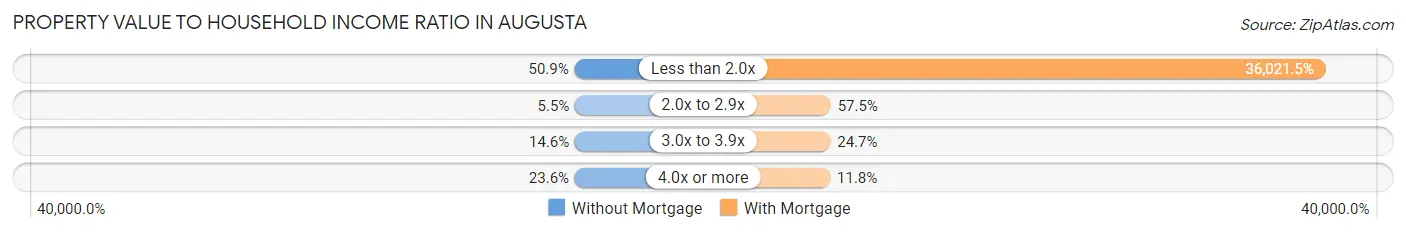
| Value-to-Income Ratio | Without Mortgage | With Mortgage |
| Less than 2.0x | 28 (50.9%) | 67,000 (36,021.5%) |
| 2.0x to 2.9x | 3 (5.4%) | 107 (57.5%) |
| 3.0x to 3.9x | 8 (14.5%) | 46 (24.7%) |
| 4.0x or more | 13 (23.6%) | 22 (11.8%) |
| Total | 55 (100.0%) | 186 (100.0%) |
Real Estate Taxes by Mortgage Status in Augusta
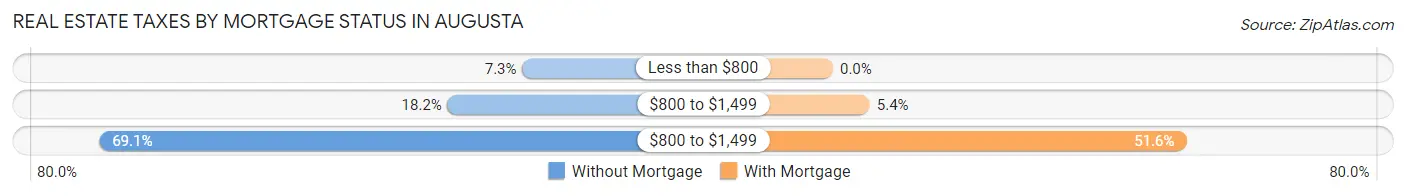
| Property Taxes | Without Mortgage | With Mortgage |
| Less than $800 | 4 (7.3%) | 0 (0.0%) |
| $800 to $1,499 | 10 (18.2%) | 10 (5.4%) |
| $800 to $1,499 | 38 (69.1%) | 96 (51.6%) |
| Total | 55 (100.0%) | 186 (100.0%) |
Health & Disability in Augusta
Health Insurance Coverage by Age in Augusta
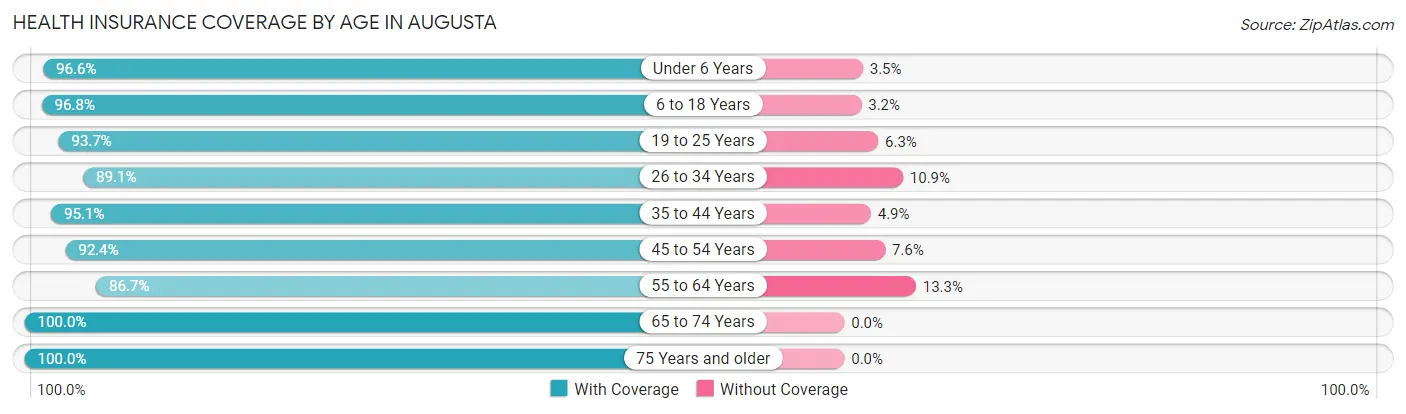
| Age Bracket | With Coverage | Without Coverage |
| Under 6 Years | 84 (96.6%) | 3 (3.5%) |
| 6 to 18 Years | 183 (96.8%) | 6 (3.2%) |
| 19 to 25 Years | 104 (93.7%) | 7 (6.3%) |
| 26 to 34 Years | 155 (89.1%) | 19 (10.9%) |
| 35 to 44 Years | 77 (95.1%) | 4 (4.9%) |
| 45 to 54 Years | 134 (92.4%) | 11 (7.6%) |
| 55 to 64 Years | 91 (86.7%) | 14 (13.3%) |
| 65 to 74 Years | 34 (100.0%) | 0 (0.0%) |
| 75 Years and older | 24 (100.0%) | 0 (0.0%) |
| Total | 886 (93.3%) | 64 (6.7%) |
Health Insurance Coverage by Citizenship Status in Augusta
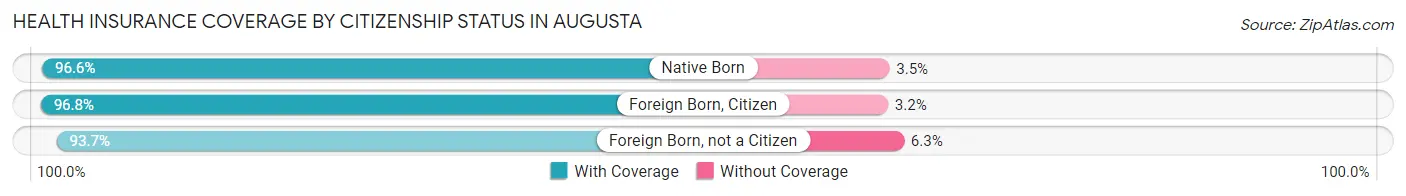
| Citizenship Status | With Coverage | Without Coverage |
| Native Born | 84 (96.6%) | 3 (3.5%) |
| Foreign Born, Citizen | 183 (96.8%) | 6 (3.2%) |
| Foreign Born, not a Citizen | 104 (93.7%) | 7 (6.3%) |
Health Insurance Coverage by Household Income in Augusta
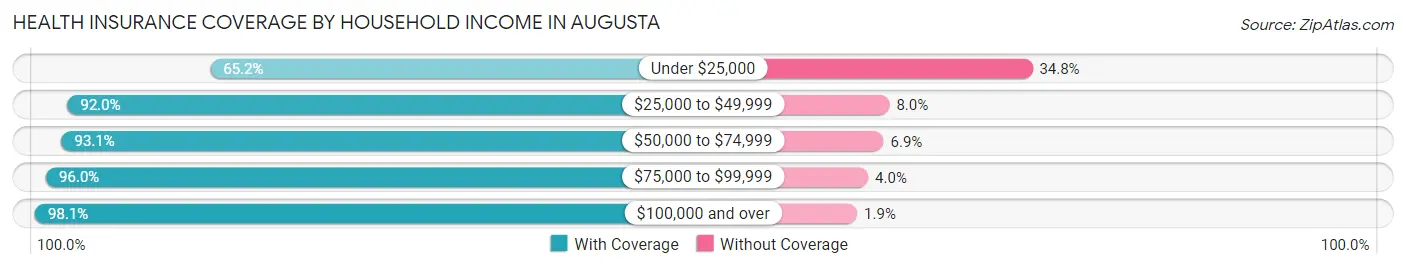
| Household Income | With Coverage | Without Coverage |
| Under $25,000 | 30 (65.2%) | 16 (34.8%) |
| $25,000 to $49,999 | 138 (92.0%) | 12 (8.0%) |
| $50,000 to $74,999 | 324 (93.1%) | 24 (6.9%) |
| $75,000 to $99,999 | 192 (96.0%) | 8 (4.0%) |
| $100,000 and over | 202 (98.1%) | 4 (1.9%) |
Public vs Private Health Insurance Coverage by Age in Augusta
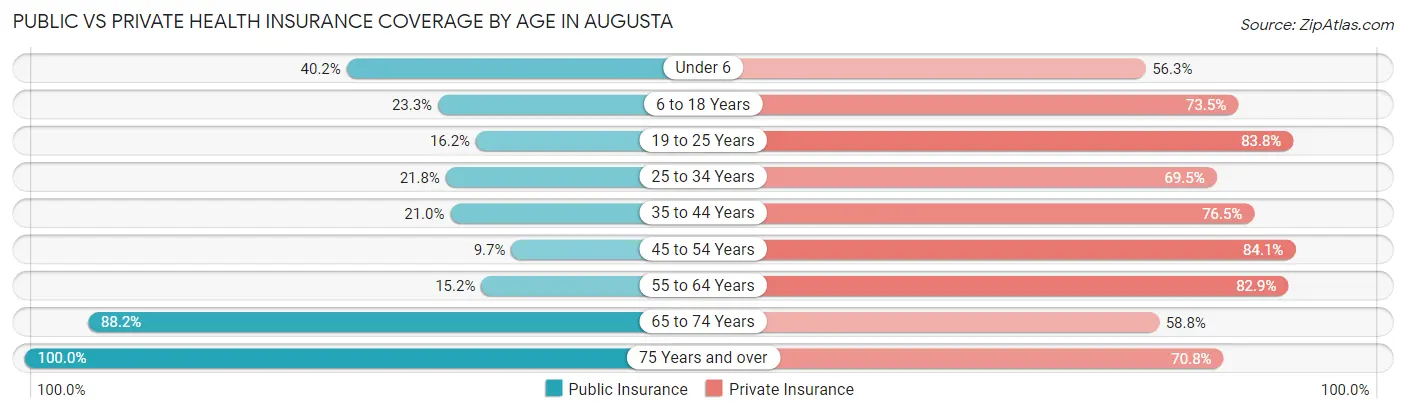
| Age Bracket | Public Insurance | Private Insurance |
| Under 6 | 35 (40.2%) | 49 (56.3%) |
| 6 to 18 Years | 44 (23.3%) | 139 (73.5%) |
| 19 to 25 Years | 18 (16.2%) | 93 (83.8%) |
| 25 to 34 Years | 38 (21.8%) | 121 (69.5%) |
| 35 to 44 Years | 17 (21.0%) | 62 (76.5%) |
| 45 to 54 Years | 14 (9.7%) | 122 (84.1%) |
| 55 to 64 Years | 16 (15.2%) | 87 (82.9%) |
| 65 to 74 Years | 30 (88.2%) | 20 (58.8%) |
| 75 Years and over | 24 (100.0%) | 17 (70.8%) |
| Total | 236 (24.8%) | 710 (74.7%) |
Disability Status by Sex by Age in Augusta
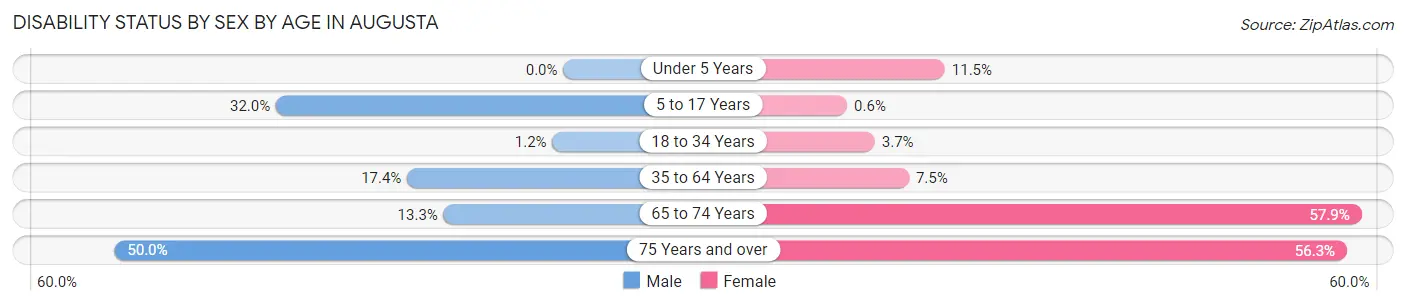
| Age Bracket | Male | Female |
| Under 5 Years | 0 (0.0%) | 7 (11.5%) |
| 5 to 17 Years | 8 (32.0%) | 1 (0.6%) |
| 18 to 34 Years | 2 (1.2%) | 5 (3.7%) |
| 35 to 64 Years | 32 (17.4%) | 11 (7.5%) |
| 65 to 74 Years | 2 (13.3%) | 11 (57.9%) |
| 75 Years and over | 4 (50.0%) | 9 (56.2%) |
Disability Class by Sex by Age in Augusta
Disability Class: Hearing Difficulty
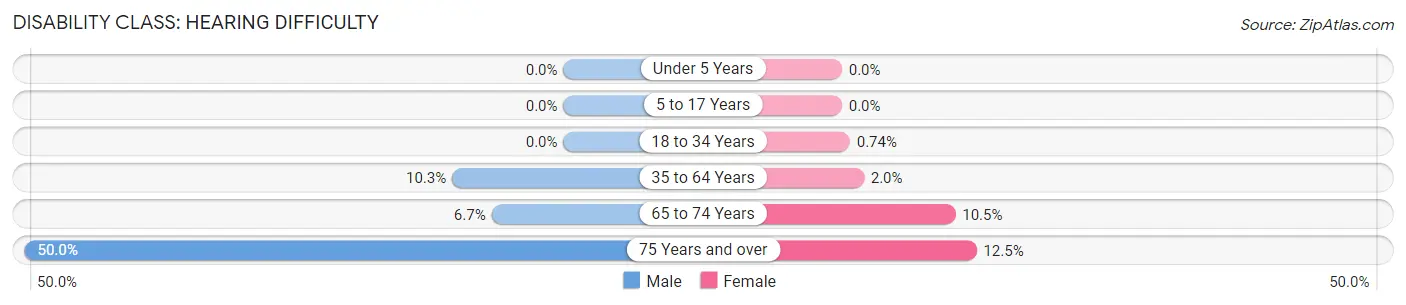
| Age Bracket | Male | Female |
| Under 5 Years | 0 (0.0%) | 0 (0.0%) |
| 5 to 17 Years | 0 (0.0%) | 0 (0.0%) |
| 18 to 34 Years | 0 (0.0%) | 1 (0.7%) |
| 35 to 64 Years | 19 (10.3%) | 3 (2.0%) |
| 65 to 74 Years | 1 (6.7%) | 2 (10.5%) |
| 75 Years and over | 4 (50.0%) | 2 (12.5%) |
Disability Class: Vision Difficulty
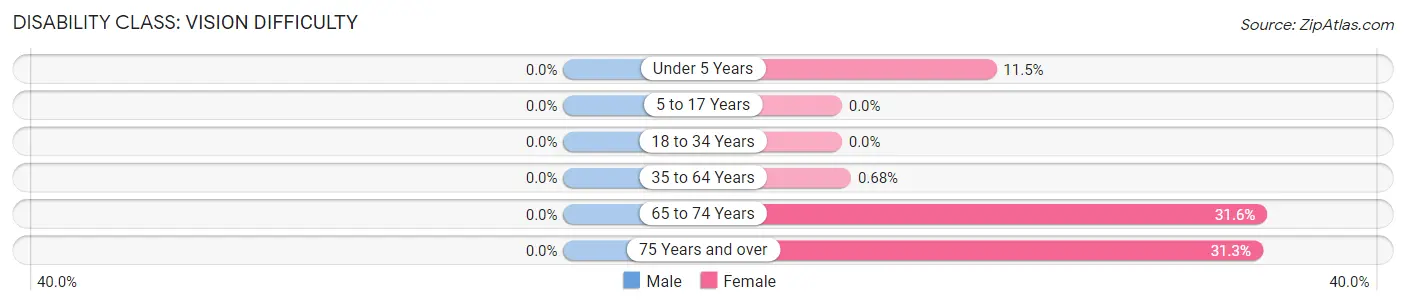
| Age Bracket | Male | Female |
| Under 5 Years | 0 (0.0%) | 7 (11.5%) |
| 5 to 17 Years | 0 (0.0%) | 0 (0.0%) |
| 18 to 34 Years | 0 (0.0%) | 0 (0.0%) |
| 35 to 64 Years | 0 (0.0%) | 1 (0.7%) |
| 65 to 74 Years | 0 (0.0%) | 6 (31.6%) |
| 75 Years and over | 0 (0.0%) | 5 (31.2%) |
Disability Class: Cognitive Difficulty
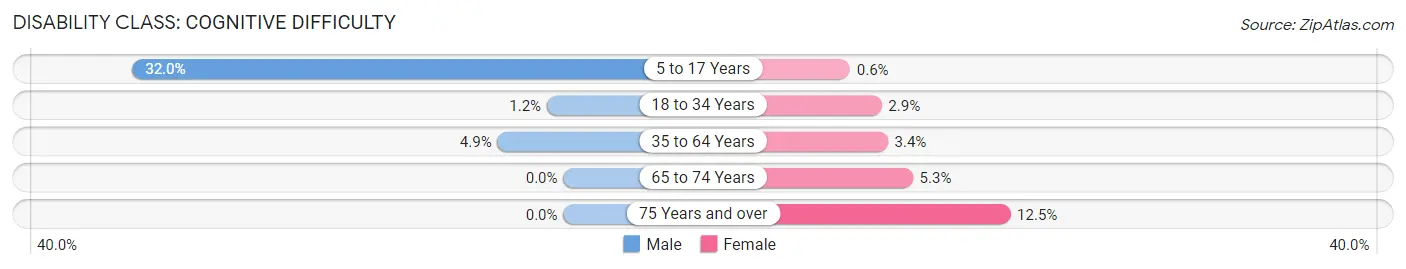
| Age Bracket | Male | Female |
| 5 to 17 Years | 8 (32.0%) | 1 (0.6%) |
| 18 to 34 Years | 2 (1.2%) | 4 (2.9%) |
| 35 to 64 Years | 9 (4.9%) | 5 (3.4%) |
| 65 to 74 Years | 0 (0.0%) | 1 (5.3%) |
| 75 Years and over | 0 (0.0%) | 2 (12.5%) |
Disability Class: Ambulatory Difficulty
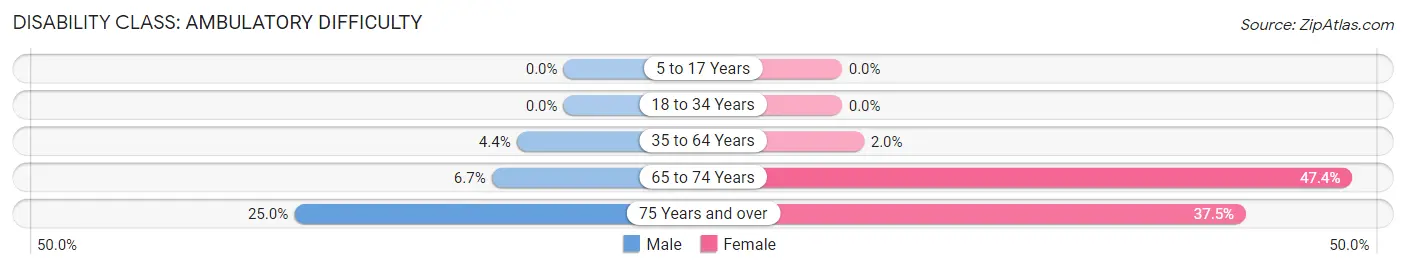
| Age Bracket | Male | Female |
| 5 to 17 Years | 0 (0.0%) | 0 (0.0%) |
| 18 to 34 Years | 0 (0.0%) | 0 (0.0%) |
| 35 to 64 Years | 8 (4.3%) | 3 (2.0%) |
| 65 to 74 Years | 1 (6.7%) | 9 (47.4%) |
| 75 Years and over | 2 (25.0%) | 6 (37.5%) |
Disability Class: Self-Care Difficulty
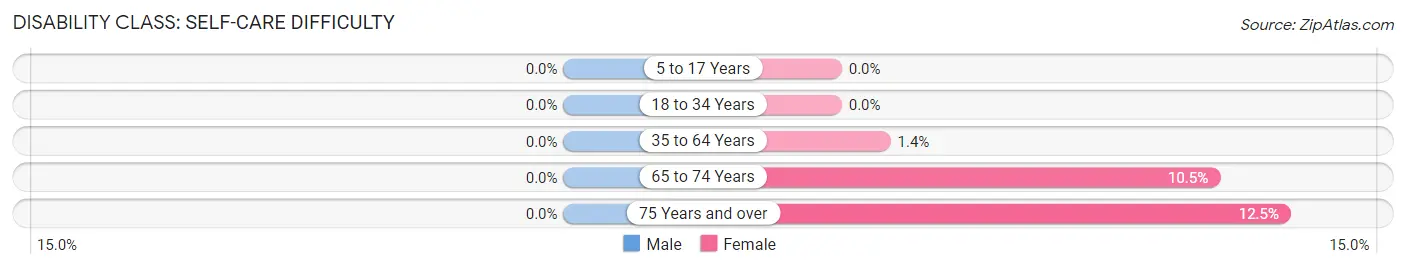
| Age Bracket | Male | Female |
| 5 to 17 Years | 0 (0.0%) | 0 (0.0%) |
| 18 to 34 Years | 0 (0.0%) | 0 (0.0%) |
| 35 to 64 Years | 0 (0.0%) | 2 (1.4%) |
| 65 to 74 Years | 0 (0.0%) | 2 (10.5%) |
| 75 Years and over | 0 (0.0%) | 2 (12.5%) |
Technology Access in Augusta
Computing Device Access in Augusta
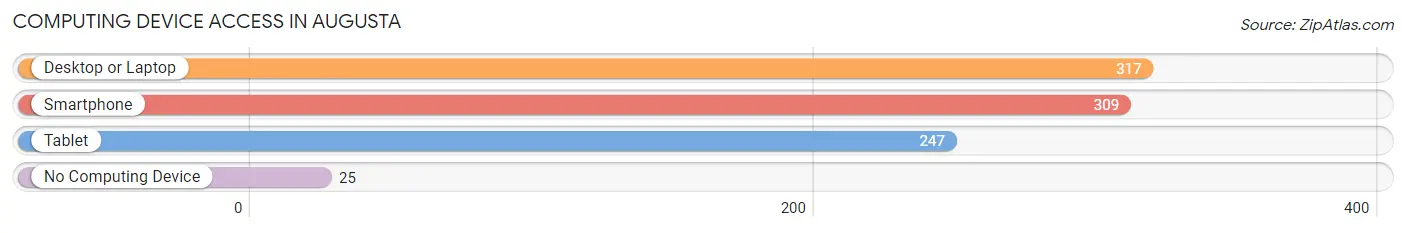
| Device Type | # Households | % Households |
| Desktop or Laptop | 317 | 85.4% |
| Smartphone | 309 | 83.3% |
| Tablet | 247 | 66.6% |
| No Computing Device | 25 | 6.7% |
| Total | 371 | 100.0% |
Internet Access in Augusta
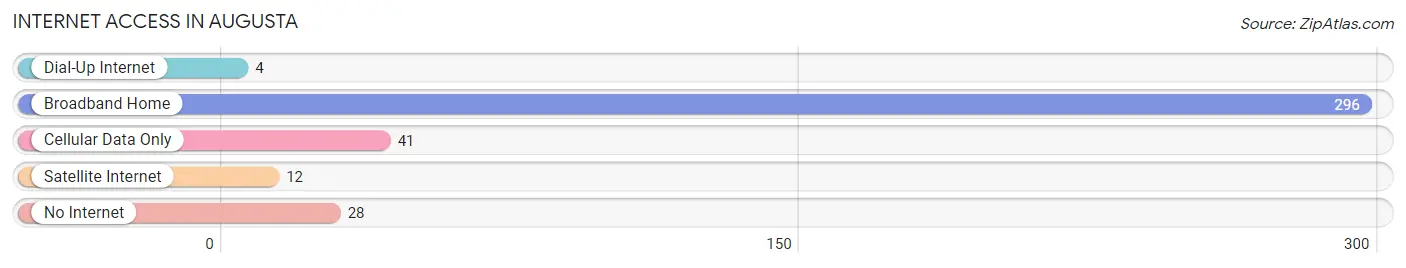
| Internet Type | # Households | % Households |
| Dial-Up Internet | 4 | 1.1% |
| Broadband Home | 296 | 79.8% |
| Cellular Data Only | 41 | 11.1% |
| Satellite Internet | 12 | 3.2% |
| No Internet | 28 | 7.5% |
| Total | 371 | 100.0% |
Augusta Summary
Augusta is a small village located in Kalamazoo County, Michigan. It is situated on the banks of the Kalamazoo River, approximately 10 miles south of the city of Kalamazoo. The village has a population of 1,845 people, according to the 2010 census.
Geography
Augusta is located in the southwestern corner of Kalamazoo County, Michigan. It is situated on the banks of the Kalamazoo River, approximately 10 miles south of the city of Kalamazoo. The village is surrounded by the townships of Comstock, Pavilion, and Wakeshma. Augusta is located in the Central Lowlands region of Michigan, which is characterized by rolling hills and flat plains. The village is located in a rural area, with the nearest large city being Kalamazoo.
History
Augusta was first settled in 1837 by a group of settlers from New York. The village was named after Augusta, New York, the hometown of the settlers. The village was incorporated in 1867. In the late 19th century, Augusta was a thriving agricultural community, with many farms and orchards in the area. The village was also home to several mills, including a sawmill, a gristmill, and a woolen mill.
In the early 20th century, Augusta began to experience a decline in population as many of its residents moved away to larger cities. The village was also affected by the Great Depression, which caused many businesses to close. In the 1950s, the village experienced a resurgence in population as many people moved to the area to take advantage of the area’s natural beauty and recreational opportunities.
Economy
Augusta’s economy is largely based on agriculture and tourism. The village is home to several farms, orchards, and vineyards, which produce a variety of fruits and vegetables. The village is also home to several wineries, which produce a variety of wines.
The village is also home to several small businesses, including restaurants, retail stores, and service providers. The village is also home to several recreational opportunities, including fishing, boating, and camping.
Demographics
According to the 2010 census, Augusta has a population of 1,845 people. The village is predominantly white, with 95.3% of the population identifying as white. The village also has a small Hispanic population, with 2.2% of the population identifying as Hispanic or Latino. The median household income in Augusta is $45,938, and the median age is 43.
Conclusion
Augusta is a small village located in Kalamazoo County, Michigan. It is situated on the banks of the Kalamazoo River, approximately 10 miles south of the city of Kalamazoo. The village has a population of 1,845 people, according to the 2010 census. Augusta’s economy is largely based on agriculture and tourism, and the village is home to several small businesses, restaurants, and recreational opportunities. The village is predominantly white, with 95.3% of the population identifying as white. The median household income in Augusta is $45,938, and the median age is 43.
Common Questions
What is Per Capita Income in Augusta?
Per Capita income in Augusta is $27,241.
What is the Median Family Income in Augusta?
Median Family Income in Augusta is $66,463.
What is the Median Household income in Augusta?
Median Household Income in Augusta is $66,144.
What is Income or Wage Gap in Augusta?
Income or Wage Gap in Augusta is 21.8%.
Women in Augusta earn 78.2 cents for every dollar earned by a man.
What is Inequality or Gini Index in Augusta?
Inequality or Gini Index in Augusta is 0.30.
What is the Total Population of Augusta?
Total Population of Augusta is 955.
What is the Total Male Population of Augusta?
Total Male Population of Augusta is 410.
What is the Total Female Population of Augusta?
Total Female Population of Augusta is 545.
What is the Ratio of Males per 100 Females in Augusta?
There are 75.23 Males per 100 Females in Augusta.
What is the Ratio of Females per 100 Males in Augusta?
There are 132.93 Females per 100 Males in Augusta.
What is the Median Population Age in Augusta?
Median Population Age in Augusta is 29.5 Years.
What is the Average Family Size in Augusta
Average Family Size in Augusta is 3.0 People.
What is the Average Household Size in Augusta
Average Household Size in Augusta is 2.6 People.
How Large is the Labor Force in Augusta?
There are 559 People in the Labor Forcein in Augusta.
What is the Percentage of People in the Labor Force in Augusta?
76.9% of People are in the Labor Force in Augusta.
What is the Unemployment Rate in Augusta?
Unemployment Rate in Augusta is 9.0%.