Applegate, MI Map & Demographics
Applegate Map
Applegate Overview
$24,994
PER CAPITA INCOME
$54,250
AVG FAMILY INCOME
$60,417
AVG HOUSEHOLD INCOME
34.0%
WAGE / INCOME GAP [ % ]
66.0¢/ $1
WAGE / INCOME GAP [ $ ]
0.33
INEQUALITY / GINI INDEX
233
TOTAL POPULATION
116
MALE POPULATION
117
FEMALE POPULATION
99.15
MALES / 100 FEMALES
100.86
FEMALES / 100 MALES
38.1
MEDIAN AGE
2.9
AVG FAMILY SIZE
2.4
AVG HOUSEHOLD SIZE
126
LABOR FORCE [ PEOPLE ]
68.9%
PERCENT IN LABOR FORCE
8.7%
UNEMPLOYMENT RATE
Applegate Zip Codes
Applegate Area Codes
Income in Applegate
Income Overview in Applegate
Per Capita Income in Applegate is $24,994, while median incomes of families and households are $54,250 and $60,417 respectively.
| Characteristic | Number | Measure |
| Per Capita Income | 233 | $24,994 |
| Median Family Income | 59 | $54,250 |
| Mean Family Income | 59 | $60,993 |
| Median Household Income | 99 | $60,417 |
| Mean Household Income | 99 | $58,620 |
| Income Deficit | 59 | $0 |
| Wage / Income Gap (%) | 233 | 34.03% |
| Wage / Income Gap ($) | 233 | 65.97¢ per $1 |
| Gini / Inequality Index | 233 | 0.33 |
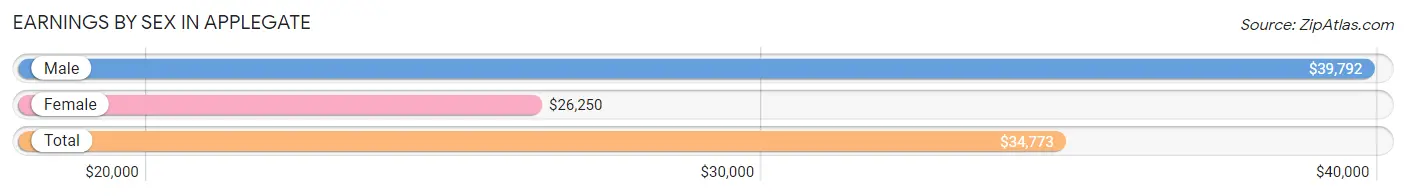
Earnings by Sex in Applegate
Average Earnings in Applegate are $34,773, $39,792 for men and $26,250 for women, a difference of 34.0%.
| Sex | Number | Average Earnings |
| Male | 57 (47.5%) | $39,792 |
| Female | 63 (52.5%) | $26,250 |
| Total | 120 (100.0%) | $34,773 |
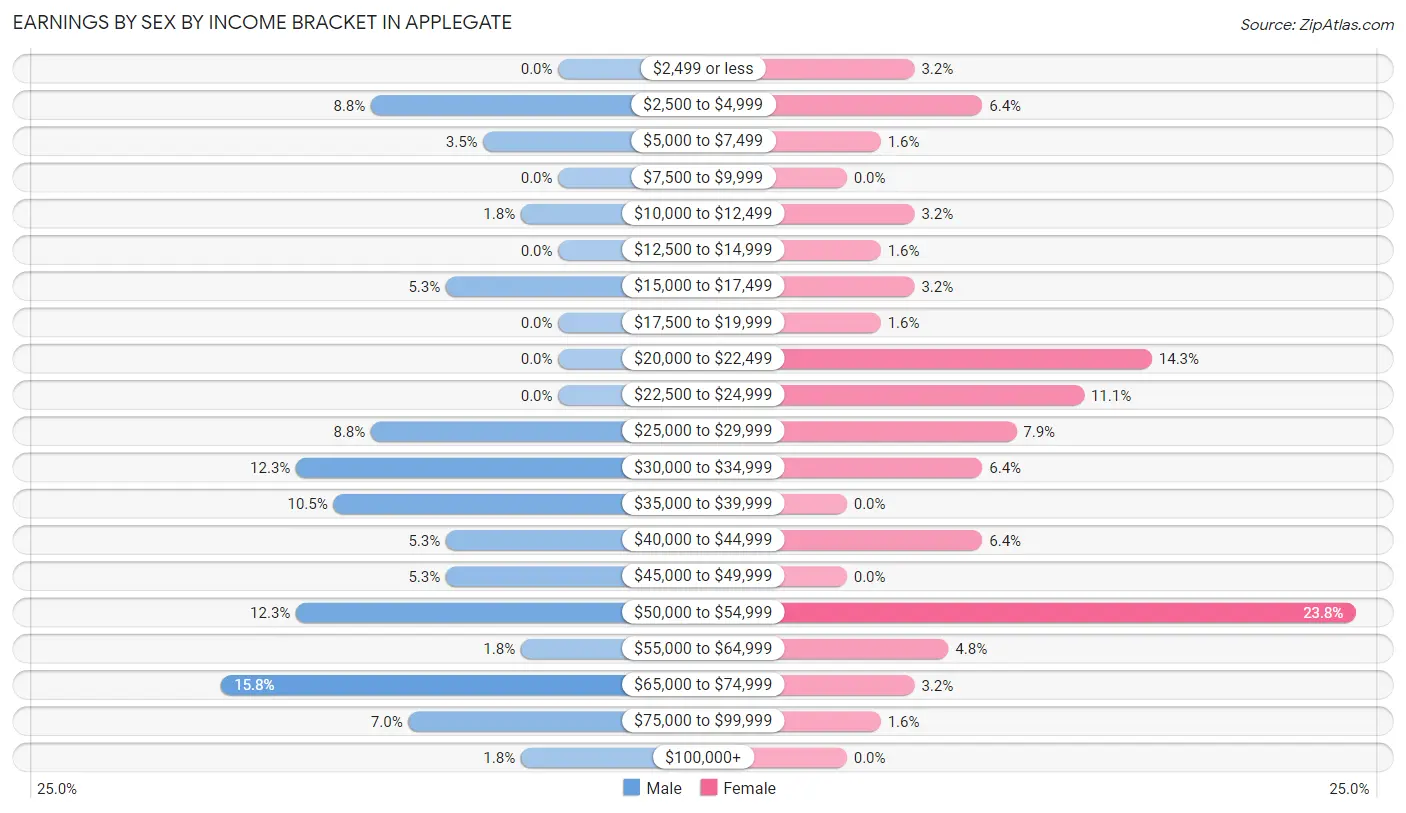
Earnings by Sex by Income Bracket in Applegate
The most common earnings brackets in Applegate are $65,000 to $74,999 for men (9 | 15.8%) and $50,000 to $54,999 for women (15 | 23.8%).
| Income | Male | Female |
| $2,499 or less | 0 (0.0%) | 2 (3.2%) |
| $2,500 to $4,999 | 5 (8.8%) | 4 (6.4%) |
| $5,000 to $7,499 | 2 (3.5%) | 1 (1.6%) |
| $7,500 to $9,999 | 0 (0.0%) | 0 (0.0%) |
| $10,000 to $12,499 | 1 (1.8%) | 2 (3.2%) |
| $12,500 to $14,999 | 0 (0.0%) | 1 (1.6%) |
| $15,000 to $17,499 | 3 (5.3%) | 2 (3.2%) |
| $17,500 to $19,999 | 0 (0.0%) | 1 (1.6%) |
| $20,000 to $22,499 | 0 (0.0%) | 9 (14.3%) |
| $22,500 to $24,999 | 0 (0.0%) | 7 (11.1%) |
| $25,000 to $29,999 | 5 (8.8%) | 5 (7.9%) |
| $30,000 to $34,999 | 7 (12.3%) | 4 (6.4%) |
| $35,000 to $39,999 | 6 (10.5%) | 0 (0.0%) |
| $40,000 to $44,999 | 3 (5.3%) | 4 (6.4%) |
| $45,000 to $49,999 | 3 (5.3%) | 0 (0.0%) |
| $50,000 to $54,999 | 7 (12.3%) | 15 (23.8%) |
| $55,000 to $64,999 | 1 (1.8%) | 3 (4.8%) |
| $65,000 to $74,999 | 9 (15.8%) | 2 (3.2%) |
| $75,000 to $99,999 | 4 (7.0%) | 1 (1.6%) |
| $100,000+ | 1 (1.8%) | 0 (0.0%) |
| Total | 57 (100.0%) | 63 (100.0%) |
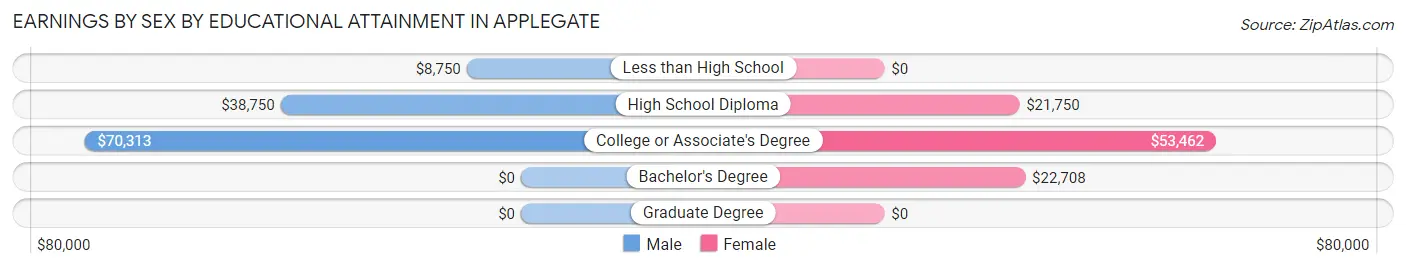
Earnings by Sex by Educational Attainment in Applegate
Average earnings in Applegate are $48,750 for men and $33,750 for women, a difference of 30.8%. Men with an educational attainment of college or associate's degree enjoy the highest average annual earnings of $70,313, while those with less than high school education earn the least with $8,750. Women with an educational attainment of college or associate's degree earn the most with the average annual earnings of $53,462, while those with high school diploma education have the smallest earnings of $21,750.
| Educational Attainment | Male Income | Female Income |
| Less than High School | $8,750 | $0 |
| High School Diploma | $38,750 | $21,750 |
| College or Associate's Degree | $70,313 | $53,462 |
| Bachelor's Degree | - | - |
| Graduate Degree | - | - |
| Total | $48,750 | $33,750 |
Family Income in Applegate
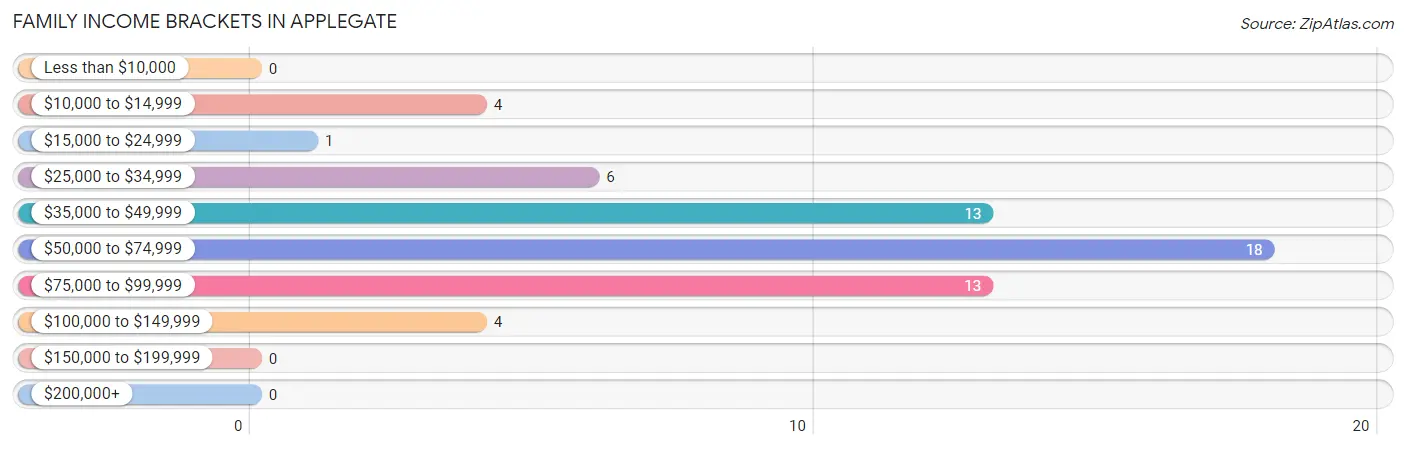
Family Income Brackets in Applegate
According to the Applegate family income data, there are 18 families falling into the $50,000 to $74,999 income range, which is the most common income bracket and makes up 30.5% of all families.
| Income Bracket | # Families | % Families |
| Less than $10,000 | 0 | 0.0% |
| $10,000 to $14,999 | 4 | 6.8% |
| $15,000 to $24,999 | 1 | 1.7% |
| $25,000 to $34,999 | 6 | 10.2% |
| $35,000 to $49,999 | 13 | 22.0% |
| $50,000 to $74,999 | 18 | 30.5% |
| $75,000 to $99,999 | 13 | 22.0% |
| $100,000 to $149,999 | 4 | 6.8% |
| $150,000 to $199,999 | 0 | 0.0% |
| $200,000+ | 0 | 0.0% |
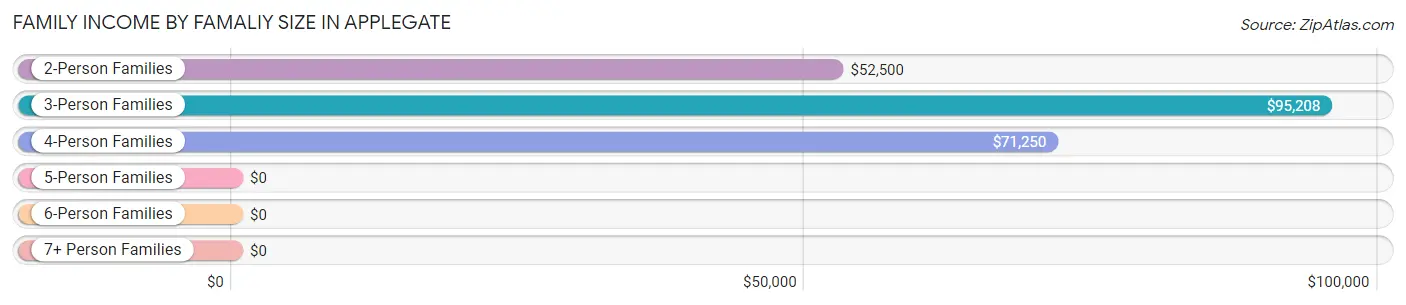
Family Income by Famaliy Size in Applegate
3-person families (11 | 18.6%) account for the highest median family income in Applegate with $95,208 per family, while 3-person families (11 | 18.6%) have the highest median income of $31,736 per family member.
| Income Bracket | # Families | Median Income |
| 2-Person Families | 28 (47.5%) | $52,500 |
| 3-Person Families | 11 (18.6%) | $95,208 |
| 4-Person Families | 19 (32.2%) | $71,250 |
| 5-Person Families | 0 (0.0%) | $0 |
| 6-Person Families | 0 (0.0%) | $0 |
| 7+ Person Families | 1 (1.7%) | $0 |
| Total | 59 (100.0%) | $54,250 |
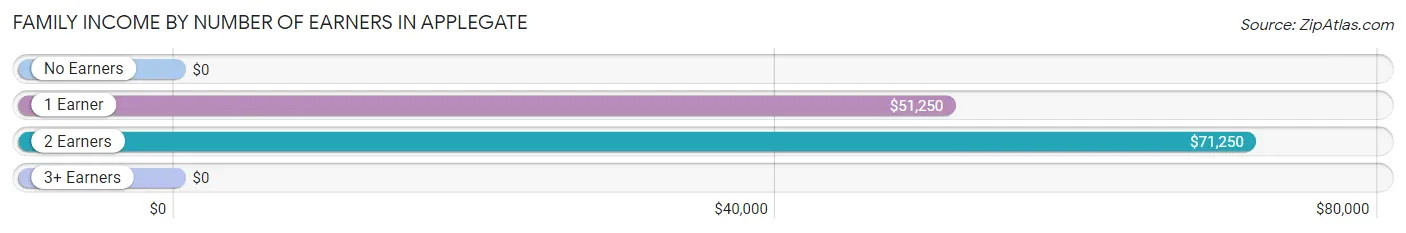
Family Income by Number of Earners in Applegate
| Number of Earners | # Families | Median Income |
| No Earners | 10 (17.0%) | $0 |
| 1 Earner | 24 (40.7%) | $51,250 |
| 2 Earners | 19 (32.2%) | $71,250 |
| 3+ Earners | 6 (10.2%) | $0 |
| Total | 59 (100.0%) | $54,250 |
Household Income in Applegate
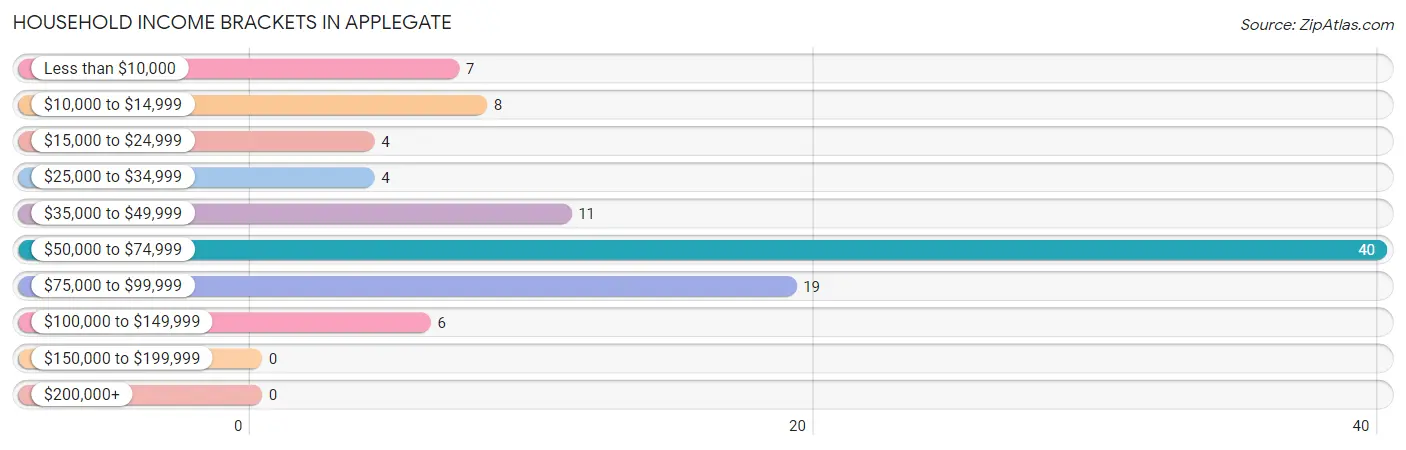
Household Income Brackets in Applegate
With 40 households falling in the category, the $50,000 to $74,999 income range is the most frequent in Applegate, accounting for 40.4% of all households.
| Income Bracket | # Households | % Households |
| Less than $10,000 | 7 | 7.1% |
| $10,000 to $14,999 | 8 | 8.1% |
| $15,000 to $24,999 | 4 | 4.0% |
| $25,000 to $34,999 | 4 | 4.0% |
| $35,000 to $49,999 | 11 | 11.1% |
| $50,000 to $74,999 | 40 | 40.4% |
| $75,000 to $99,999 | 19 | 19.2% |
| $100,000 to $149,999 | 6 | 6.1% |
| $150,000 to $199,999 | 0 | 0.0% |
| $200,000+ | 0 | 0.0% |
Household Income by Householder Age in Applegate
The median household income in Applegate is $60,417, with the highest median household income of $72,500 found in the 25 to 44 years age bracket for the primary householder. A total of 26 households (26.3%) fall into this category. Meanwhile, the 15 to 24 years age bracket for the primary householder has the lowest median household income of $37,188, with 7 households (7.1%) in this group.
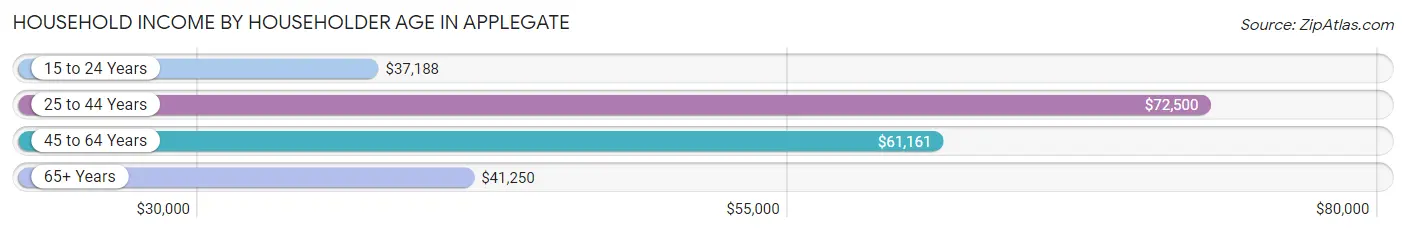
| Income Bracket | # Households | Median Income |
| 15 to 24 Years | 7 (7.1%) | $37,188 |
| 25 to 44 Years | 26 (26.3%) | $72,500 |
| 45 to 64 Years | 37 (37.4%) | $61,161 |
| 65+ Years | 29 (29.3%) | $41,250 |
| Total | 99 (100.0%) | $60,417 |
Poverty in Applegate
Income Below Poverty by Sex and Age in Applegate
With 6.0% poverty level for males and 20.9% for females among the residents of Applegate, under 5 year old males and 45 to 54 year old females are the most vulnerable to poverty, with 4 males (16.7%) and 8 females (53.3%) in their respective age groups living below the poverty level.
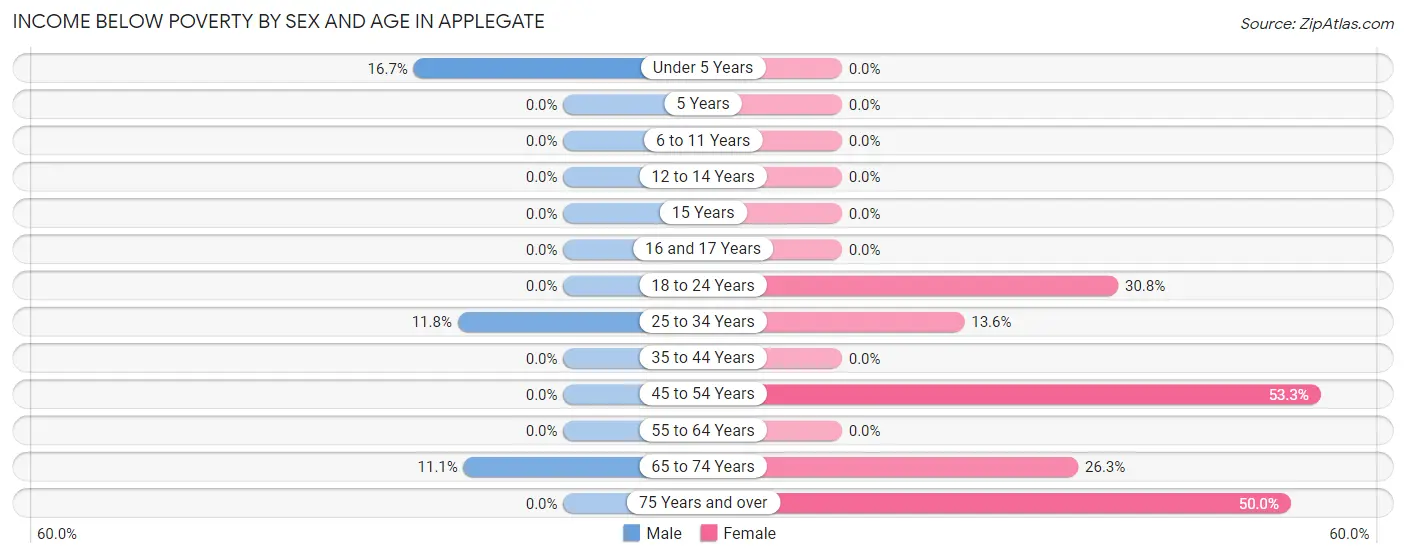
| Age Bracket | Male | Female |
| Under 5 Years | 4 (16.7%) | 0 (0.0%) |
| 5 Years | 0 (0.0%) | 0 (0.0%) |
| 6 to 11 Years | 0 (0.0%) | 0 (0.0%) |
| 12 to 14 Years | 0 (0.0%) | 0 (0.0%) |
| 15 Years | 0 (0.0%) | 0 (0.0%) |
| 16 and 17 Years | 0 (0.0%) | 0 (0.0%) |
| 18 to 24 Years | 0 (0.0%) | 4 (30.8%) |
| 25 to 34 Years | 2 (11.8%) | 3 (13.6%) |
| 35 to 44 Years | 0 (0.0%) | 0 (0.0%) |
| 45 to 54 Years | 0 (0.0%) | 8 (53.3%) |
| 55 to 64 Years | 0 (0.0%) | 0 (0.0%) |
| 65 to 74 Years | 1 (11.1%) | 5 (26.3%) |
| 75 Years and over | 0 (0.0%) | 4 (50.0%) |
| Total | 7 (6.0%) | 24 (20.9%) |
Income Above Poverty by Sex and Age in Applegate
According to the poverty statistics in Applegate, males aged 5 years and females aged under 5 years are the age groups that are most secure financially, with 100.0% of males and 100.0% of females in these age groups living above the poverty line.
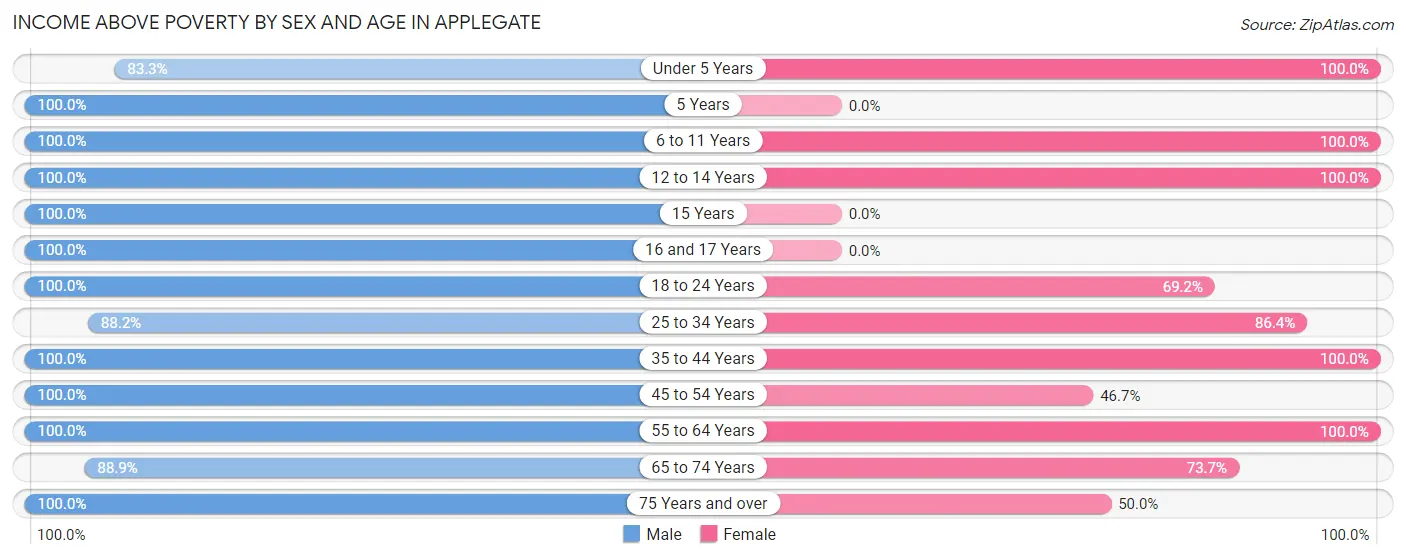
| Age Bracket | Male | Female |
| Under 5 Years | 20 (83.3%) | 2 (100.0%) |
| 5 Years | 1 (100.0%) | 0 (0.0%) |
| 6 to 11 Years | 7 (100.0%) | 3 (100.0%) |
| 12 to 14 Years | 4 (100.0%) | 3 (100.0%) |
| 15 Years | 4 (100.0%) | 0 (0.0%) |
| 16 and 17 Years | 4 (100.0%) | 0 (0.0%) |
| 18 to 24 Years | 8 (100.0%) | 9 (69.2%) |
| 25 to 34 Years | 15 (88.2%) | 19 (86.4%) |
| 35 to 44 Years | 12 (100.0%) | 8 (100.0%) |
| 45 to 54 Years | 18 (100.0%) | 7 (46.7%) |
| 55 to 64 Years | 6 (100.0%) | 22 (100.0%) |
| 65 to 74 Years | 8 (88.9%) | 14 (73.7%) |
| 75 Years and over | 2 (100.0%) | 4 (50.0%) |
| Total | 109 (94.0%) | 91 (79.1%) |
Income Below Poverty Among Married-Couple Families in Applegate
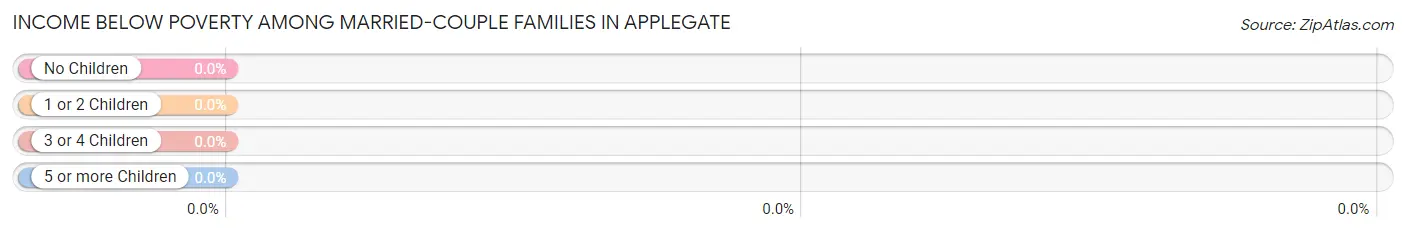
| Children | Above Poverty | Below Poverty |
| No Children | 16 (100.0%) | 0 (0.0%) |
| 1 or 2 Children | 17 (100.0%) | 0 (0.0%) |
| 3 or 4 Children | 0 (0.0%) | 0 (0.0%) |
| 5 or more Children | 0 (0.0%) | 0 (0.0%) |
| Total | 33 (100.0%) | 0 (0.0%) |
Income Below Poverty Among Single-Parent Households in Applegate
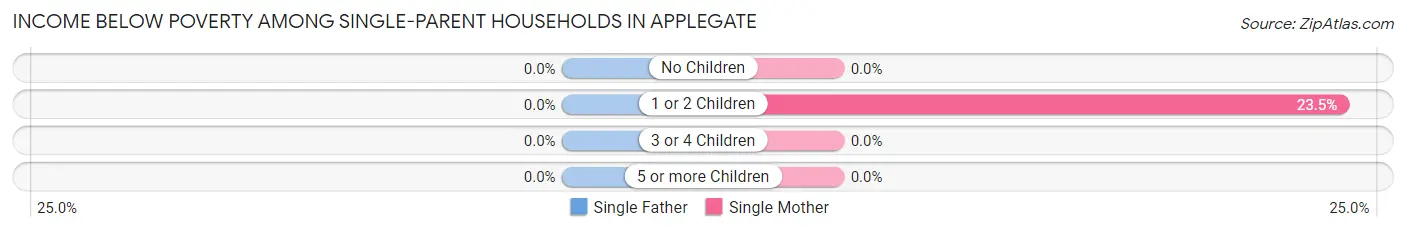
| Children | Single Father | Single Mother |
| No Children | 0 (0.0%) | 0 (0.0%) |
| 1 or 2 Children | 0 (0.0%) | 4 (23.5%) |
| 3 or 4 Children | 0 (0.0%) | 0 (0.0%) |
| 5 or more Children | 0 (0.0%) | 0 (0.0%) |
| Total | 0 (0.0%) | 4 (19.1%) |
Income Below Poverty Among Married-Couple vs Single-Parent Households in Applegate
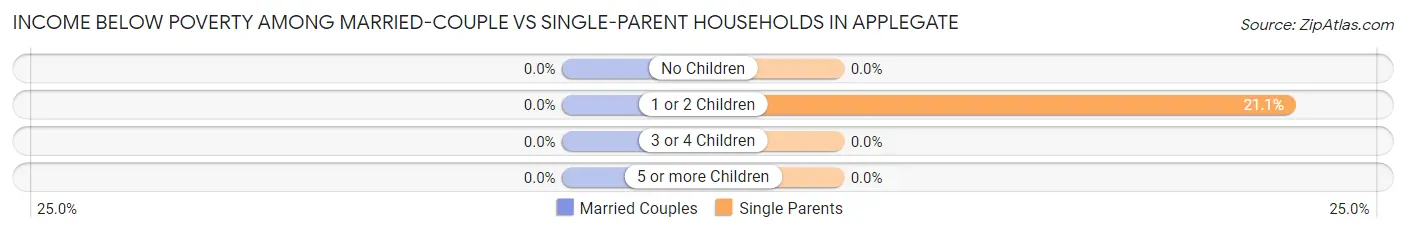
| Children | Married-Couple Families | Single-Parent Households |
| No Children | 0 (0.0%) | 0 (0.0%) |
| 1 or 2 Children | 0 (0.0%) | 4 (21.0%) |
| 3 or 4 Children | 0 (0.0%) | 0 (0.0%) |
| 5 or more Children | 0 (0.0%) | 0 (0.0%) |
| Total | 0 (0.0%) | 4 (15.4%) |
Race in Applegate
The most populous races in Applegate are White / Caucasian (230 | 98.7%), Asian (3 | 1.3%), and Hispanic or Latino (2 | 0.9%).
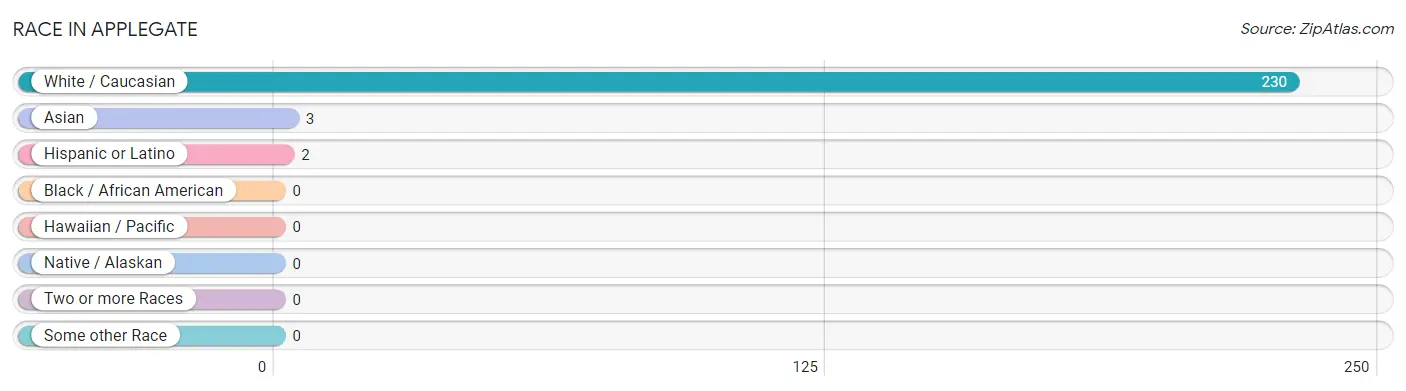
| Race | # Population | % Population |
| Asian | 3 | 1.3% |
| Black / African American | 0 | 0.0% |
| Hawaiian / Pacific | 0 | 0.0% |
| Hispanic or Latino | 2 | 0.9% |
| Native / Alaskan | 0 | 0.0% |
| White / Caucasian | 230 | 98.7% |
| Two or more Races | 0 | 0.0% |
| Some other Race | 0 | 0.0% |
| Total | 233 | 100.0% |
Ancestry in Applegate
The most populous ancestries reported in Applegate are German (70 | 30.0%), Irish (25 | 10.7%), English (21 | 9.0%), American (19 | 8.2%), and French (14 | 6.0%), together accounting for 63.9% of all Applegate residents.
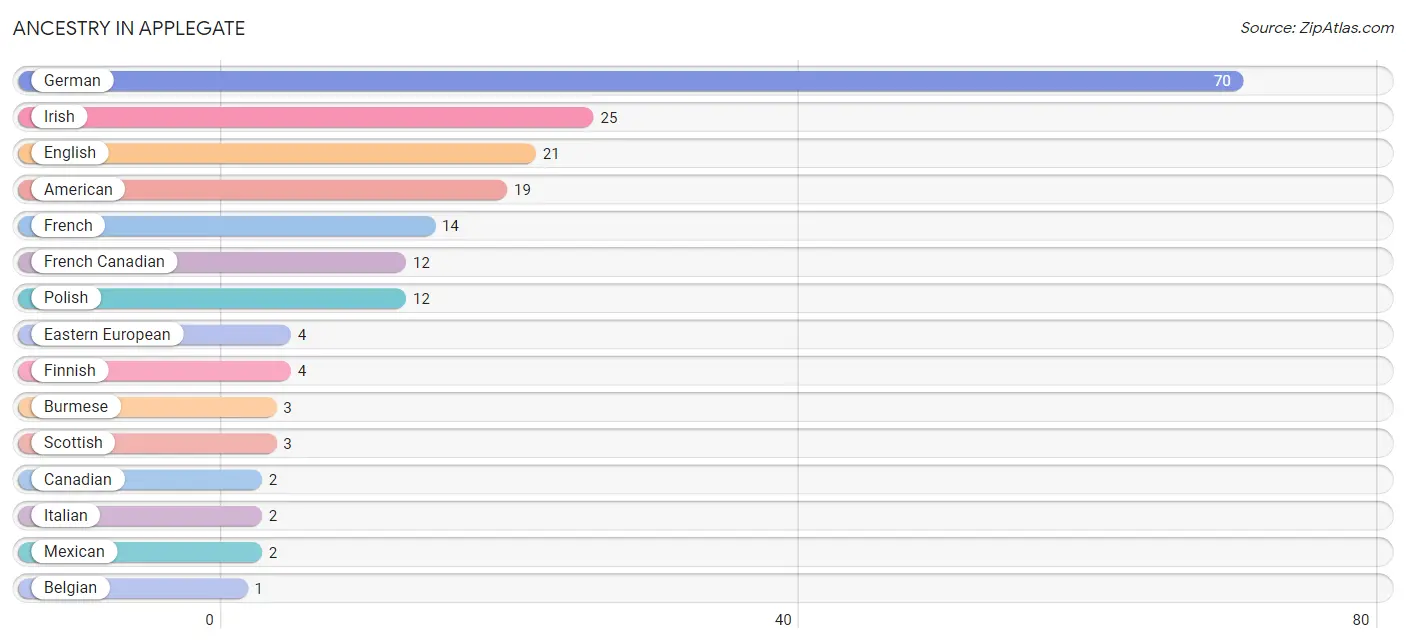
| Ancestry | # Population | % Population |
| American | 19 | 8.2% |
| Belgian | 1 | 0.4% |
| Burmese | 3 | 1.3% |
| Canadian | 2 | 0.9% |
| Eastern European | 4 | 1.7% |
| English | 21 | 9.0% |
| Finnish | 4 | 1.7% |
| French | 14 | 6.0% |
| French Canadian | 12 | 5.1% |
| German | 70 | 30.0% |
| Irish | 25 | 10.7% |
| Italian | 2 | 0.9% |
| Mexican | 2 | 0.9% |
| Polish | 12 | 5.1% |
| Scottish | 3 | 1.3% |
| Ukrainian | 1 | 0.4% |
| Welsh | 1 | 0.4% | View All 17 Rows |
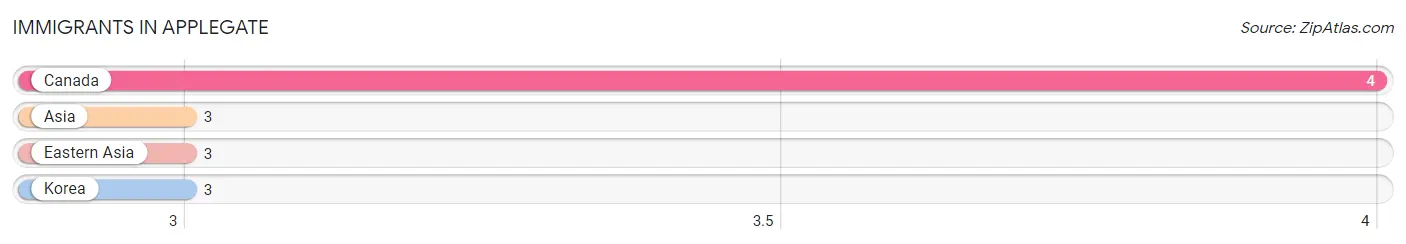
Immigrants in Applegate
The most numerous immigrant groups reported in Applegate came from Canada (4 | 1.7%), Asia (3 | 1.3%), Eastern Asia (3 | 1.3%), and Korea (3 | 1.3%), together accounting for 5.6% of all Applegate residents.
| Immigration Origin | # Population | % Population |
| Asia | 3 | 1.3% |
| Canada | 4 | 1.7% |
| Eastern Asia | 3 | 1.3% |
| Korea | 3 | 1.3% | View All 4 Rows |
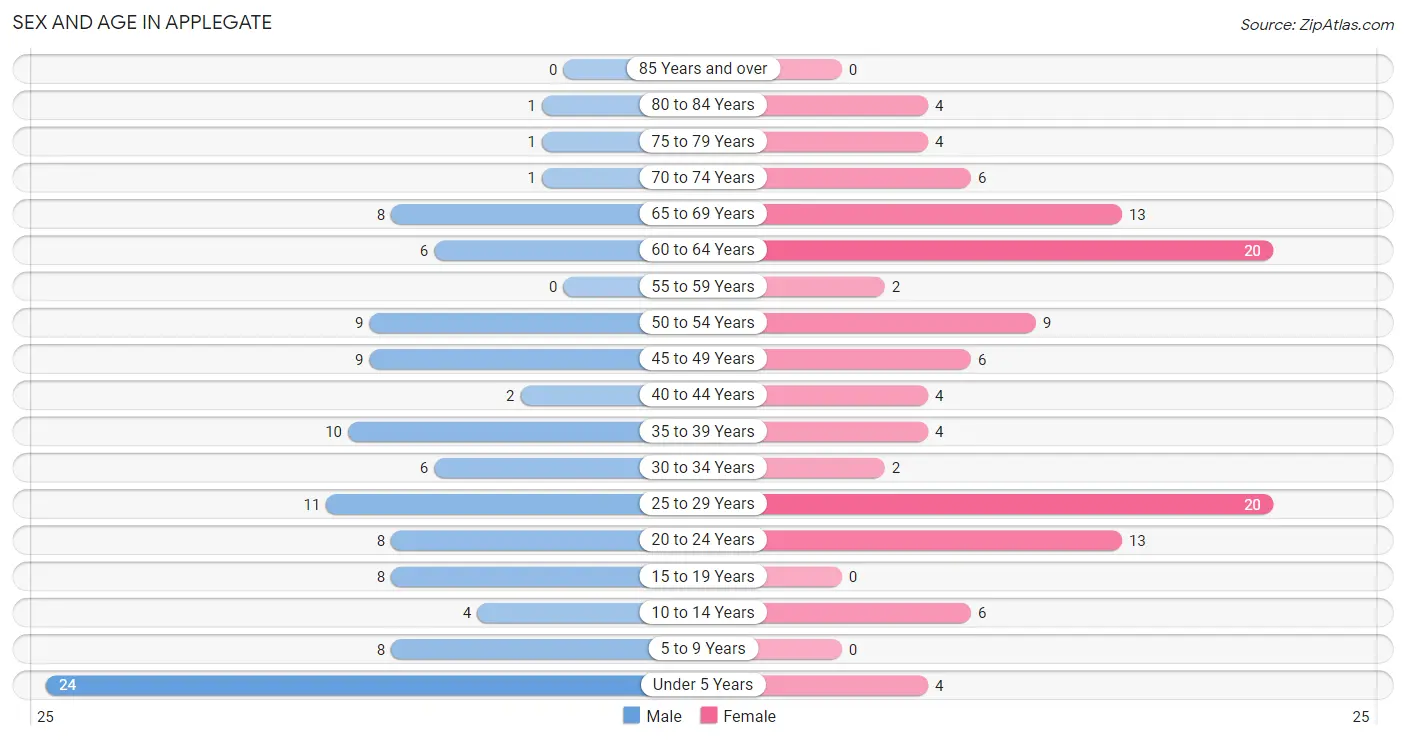
Sex and Age in Applegate
Sex and Age in Applegate
The most populous age groups in Applegate are Under 5 Years (24 | 20.7%) for men and 25 to 29 Years (20 | 17.1%) for women.
| Age Bracket | Male | Female |
| Under 5 Years | 24 (20.7%) | 4 (3.4%) |
| 5 to 9 Years | 8 (6.9%) | 0 (0.0%) |
| 10 to 14 Years | 4 (3.5%) | 6 (5.1%) |
| 15 to 19 Years | 8 (6.9%) | 0 (0.0%) |
| 20 to 24 Years | 8 (6.9%) | 13 (11.1%) |
| 25 to 29 Years | 11 (9.5%) | 20 (17.1%) |
| 30 to 34 Years | 6 (5.2%) | 2 (1.7%) |
| 35 to 39 Years | 10 (8.6%) | 4 (3.4%) |
| 40 to 44 Years | 2 (1.7%) | 4 (3.4%) |
| 45 to 49 Years | 9 (7.8%) | 6 (5.1%) |
| 50 to 54 Years | 9 (7.8%) | 9 (7.7%) |
| 55 to 59 Years | 0 (0.0%) | 2 (1.7%) |
| 60 to 64 Years | 6 (5.2%) | 20 (17.1%) |
| 65 to 69 Years | 8 (6.9%) | 13 (11.1%) |
| 70 to 74 Years | 1 (0.9%) | 6 (5.1%) |
| 75 to 79 Years | 1 (0.9%) | 4 (3.4%) |
| 80 to 84 Years | 1 (0.9%) | 4 (3.4%) |
| 85 Years and over | 0 (0.0%) | 0 (0.0%) |
| Total | 116 (100.0%) | 117 (100.0%) |
Families and Households in Applegate
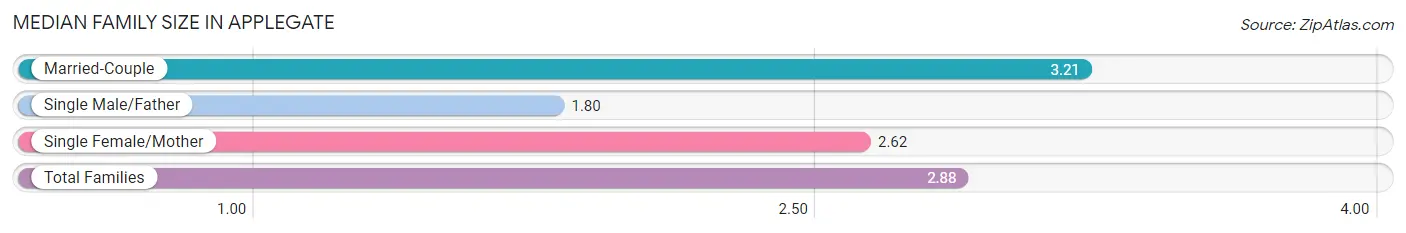
Median Family Size in Applegate
The median family size in Applegate is 2.88 persons per family, with married-couple families (33 | 55.9%) accounting for the largest median family size of 3.21 persons per family. On the other hand, single male/father families (5 | 8.5%) represent the smallest median family size with 1.80 persons per family.
| Family Type | # Families | Family Size |
| Married-Couple | 33 (55.9%) | 3.21 |
| Single Male/Father | 5 (8.5%) | 1.80 |
| Single Female/Mother | 21 (35.6%) | 2.62 |
| Total Families | 59 (100.0%) | 2.88 |
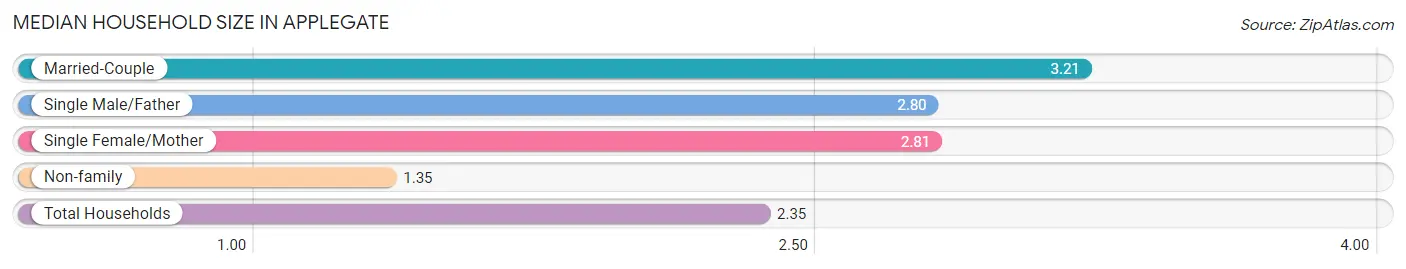
Median Household Size in Applegate
The median household size in Applegate is 2.35 persons per household, with married-couple households (33 | 33.3%) accounting for the largest median household size of 3.21 persons per household. non-family households (40 | 40.4%) represent the smallest median household size with 1.35 persons per household.
| Household Type | # Households | Household Size |
| Married-Couple | 33 (33.3%) | 3.21 |
| Single Male/Father | 5 (5.1%) | 2.80 |
| Single Female/Mother | 21 (21.2%) | 2.81 |
| Non-family | 40 (40.4%) | 1.35 |
| Total Households | 99 (100.0%) | 2.35 |
Household Size by Marriage Status in Applegate
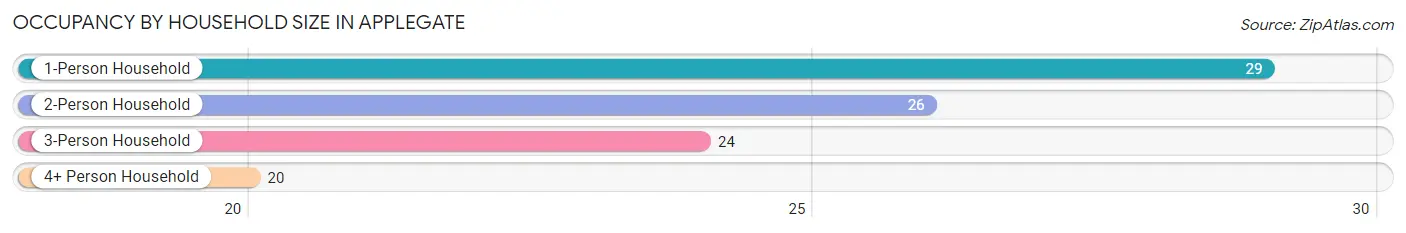
Out of a total of 99 households in Applegate, 59 (59.6%) are family households, while 40 (40.4%) are nonfamily households. The most numerous type of family households are 3-person households, comprising 20, and the most common type of nonfamily households are 1-person households, comprising 29.
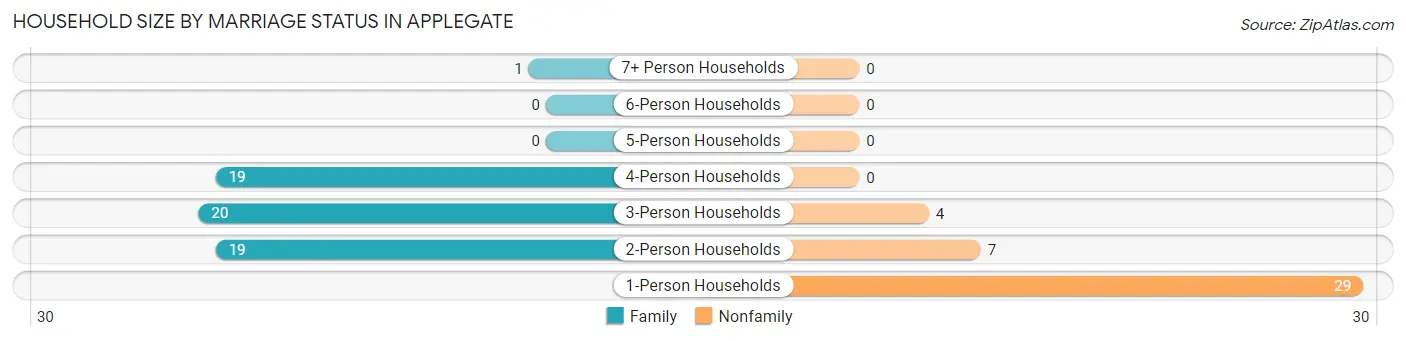
| Household Size | Family Households | Nonfamily Households |
| 1-Person Households | - | 29 (29.3%) |
| 2-Person Households | 19 (19.2%) | 7 (7.1%) |
| 3-Person Households | 20 (20.2%) | 4 (4.0%) |
| 4-Person Households | 19 (19.2%) | 0 (0.0%) |
| 5-Person Households | 0 (0.0%) | 0 (0.0%) |
| 6-Person Households | 0 (0.0%) | 0 (0.0%) |
| 7+ Person Households | 1 (1.0%) | 0 (0.0%) |
| Total | 59 (59.6%) | 40 (40.4%) |
Female Fertility in Applegate
Fertility by Age in Applegate
Average fertility rate in Applegate is 240.0 births per 1,000 women. Women in the age bracket of 35 to 50 years have the highest fertility rate with 267.0 births per 1,000 women. Women in the age bracket of 20 to 34 years acount for 66.7% of all women with births.
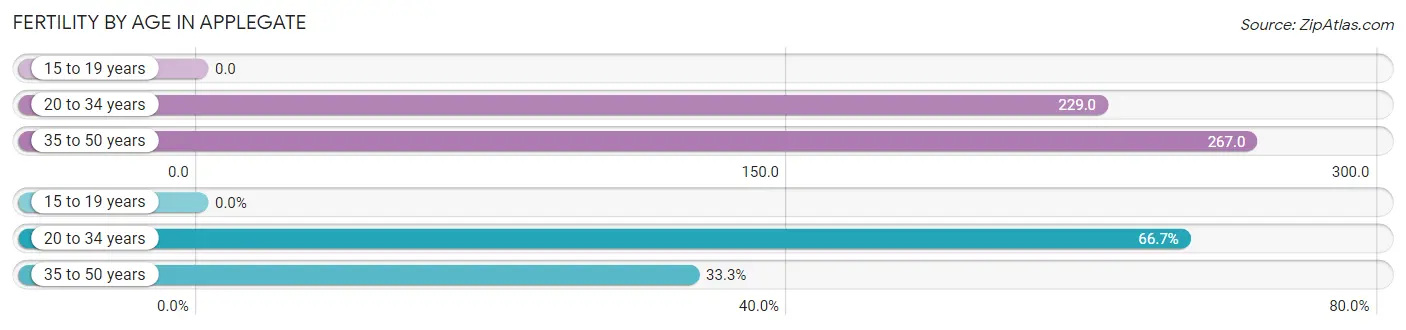
| Age Bracket | Women with Births | Births / 1,000 Women |
| 15 to 19 years | 0 (0.0%) | 0.0 |
| 20 to 34 years | 8 (66.7%) | 229.0 |
| 35 to 50 years | 4 (33.3%) | 267.0 |
| Total | 12 (100.0%) | 240.0 |
Fertility by Age by Marriage Status in Applegate
66.7% of women with births (12) in Applegate are married. The highest percentage of unmarried women with births falls into 20 to 34 years age bracket with 50.0% of them unmarried at the time of birth, while the lowest percentage of unmarried women with births belong to 35 to 50 years age bracket with 0.0% of them unmarried.
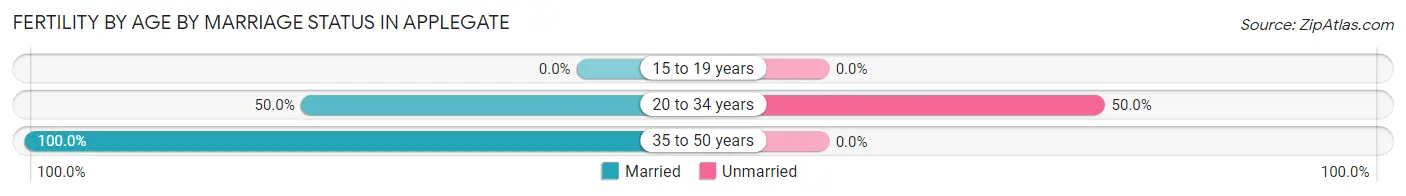
| Age Bracket | Married | Unmarried |
| 15 to 19 years | 0 (0.0%) | 0 (0.0%) |
| 20 to 34 years | 4 (50.0%) | 4 (50.0%) |
| 35 to 50 years | 4 (100.0%) | 0 (0.0%) |
| Total | 8 (66.7%) | 4 (33.3%) |
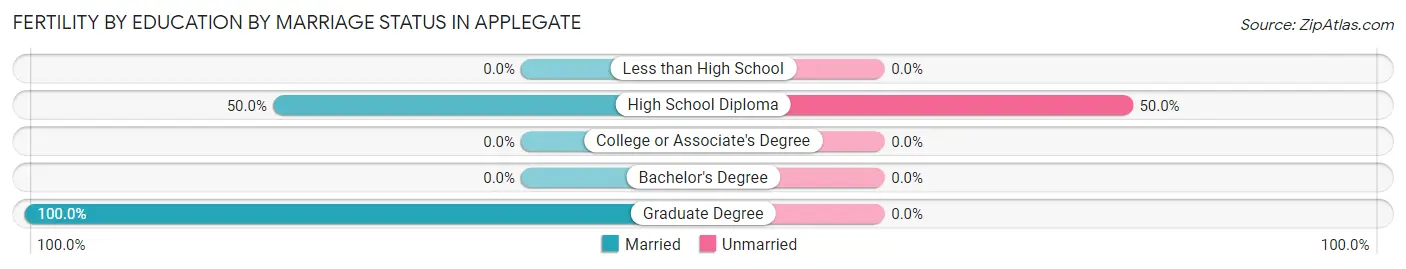
Fertility by Education in Applegate
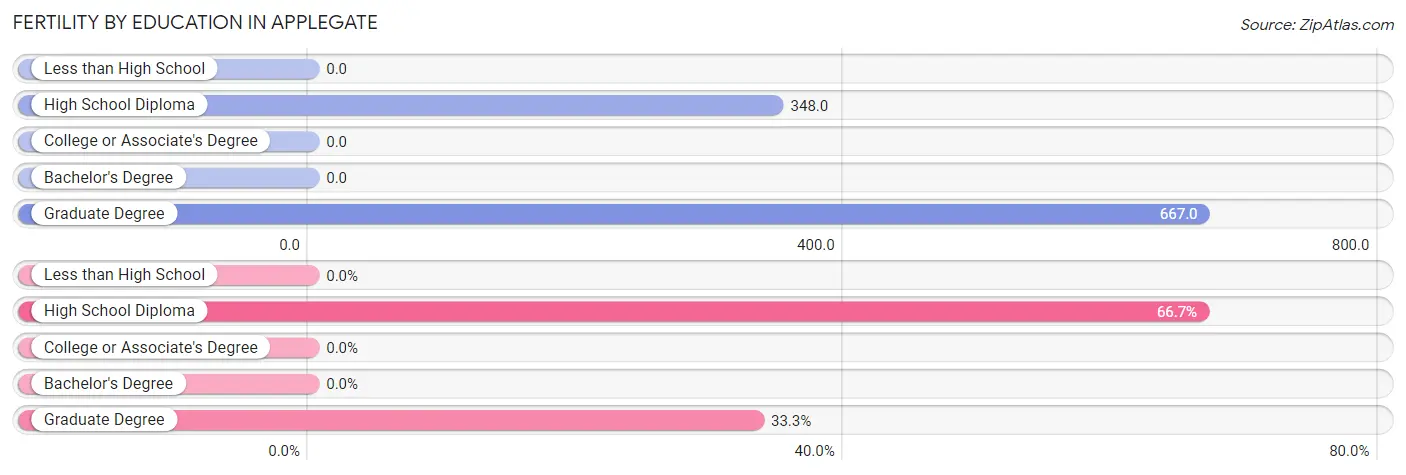
| Educational Attainment | Women with Births | Births / 1,000 Women |
| Less than High School | 0 (0.0%) | 0.0 |
| High School Diploma | 8 (66.7%) | 348.0 |
| College or Associate's Degree | 0 (0.0%) | 0.0 |
| Bachelor's Degree | 0 (0.0%) | 0.0 |
| Graduate Degree | 4 (33.3%) | 667.0 |
| Total | 12 (100.0%) | 240.0 |
Fertility by Education by Marriage Status in Applegate
33.3% of women with births in Applegate are unmarried. Women with the educational attainment of graduate degree are most likely to be married with 100.0% of them married at childbirth, while women with the educational attainment of high school diploma are least likely to be married with 50.0% of them unmarried at childbirth.
| Educational Attainment | Married | Unmarried |
| Less than High School | 0 (0.0%) | 0 (0.0%) |
| High School Diploma | 4 (50.0%) | 4 (50.0%) |
| College or Associate's Degree | 0 (0.0%) | 0 (0.0%) |
| Bachelor's Degree | 0 (0.0%) | 0 (0.0%) |
| Graduate Degree | 4 (100.0%) | 0 (0.0%) |
| Total | 8 (66.7%) | 4 (33.3%) |
Employment Characteristics in Applegate
Employment by Class of Employer in Applegate
Among the 113 employed individuals in Applegate, private company employees (79 | 69.9%), not-for-profit organizations (18 | 15.9%), and self-employed (not incorporated) (13 | 11.5%) make up the most common classes of employment.
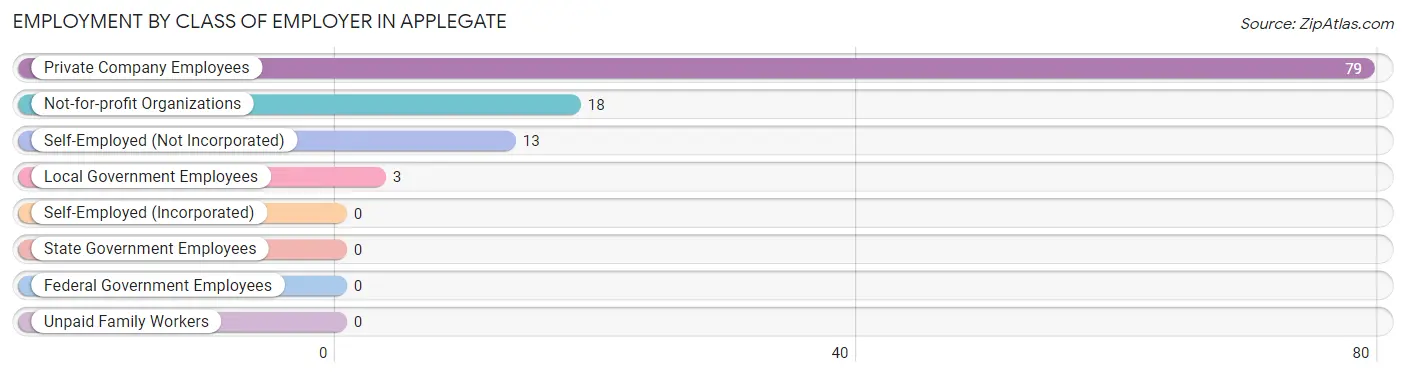
| Employer Class | # Employees | % Employees |
| Private Company Employees | 79 | 69.9% |
| Self-Employed (Incorporated) | 0 | 0.0% |
| Self-Employed (Not Incorporated) | 13 | 11.5% |
| Not-for-profit Organizations | 18 | 15.9% |
| Local Government Employees | 3 | 2.6% |
| State Government Employees | 0 | 0.0% |
| Federal Government Employees | 0 | 0.0% |
| Unpaid Family Workers | 0 | 0.0% |
| Total | 113 | 100.0% |
Employment Status by Age in Applegate
According to the labor force statistics for Applegate, out of the total population over 16 years of age (183), 68.9% or 126 individuals are in the labor force, with 8.7% or 11 of them unemployed. The age group with the highest labor force participation rate is 16 to 19 years, with 100.0% or 4 individuals in the labor force. Within the labor force, the 45 to 54 years age range has the highest percentage of unemployed individuals, with 22.7% or 5 of them being unemployed.
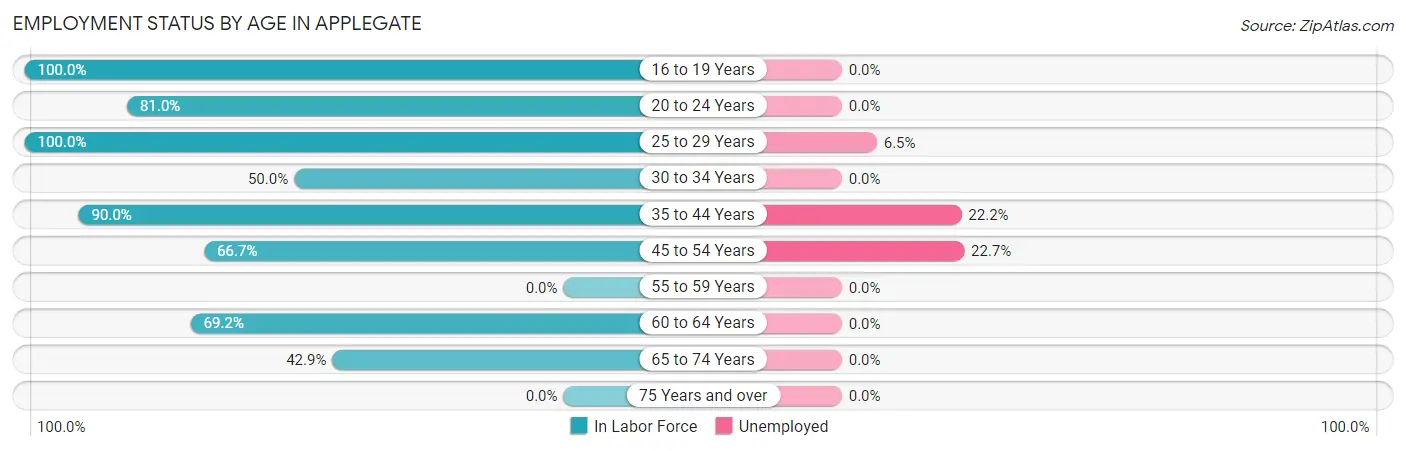
| Age Bracket | In Labor Force | Unemployed |
| 16 to 19 Years | 4 (100.0%) | 0 (0.0%) |
| 20 to 24 Years | 17 (81.0%) | 0 (0.0%) |
| 25 to 29 Years | 31 (100.0%) | 2 (6.5%) |
| 30 to 34 Years | 4 (50.0%) | 0 (0.0%) |
| 35 to 44 Years | 18 (90.0%) | 4 (22.2%) |
| 45 to 54 Years | 22 (66.7%) | 5 (22.7%) |
| 55 to 59 Years | 0 (0.0%) | 0 (0.0%) |
| 60 to 64 Years | 18 (69.2%) | 0 (0.0%) |
| 65 to 74 Years | 12 (42.9%) | 0 (0.0%) |
| 75 Years and over | 0 (0.0%) | 0 (0.0%) |
| Total | 126 (68.9%) | 11 (8.7%) |
Employment Status by Educational Attainment in Applegate
According to labor force statistics for Applegate, 77.5% of individuals (93) out of the total population between 25 and 64 years of age (120) are in the labor force, with 11.8% or 11 of them being unemployed. The group with the highest labor force participation rate are those with the educational attainment of bachelor's degree or higher, with 100.0% or 20 individuals in the labor force. Within the labor force, individuals with college / associate degree education have the highest percentage of unemployment, with 17.6% or 9 of them being unemployed.
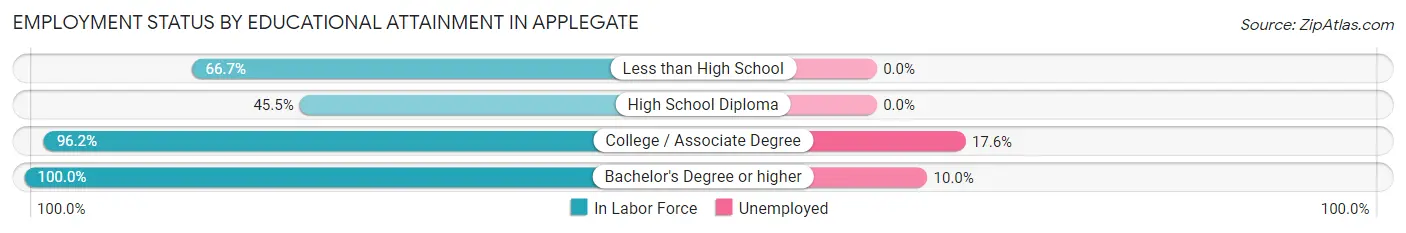
| Educational Attainment | In Labor Force | Unemployed |
| Less than High School | 2 (66.7%) | 0 (0.0%) |
| High School Diploma | 20 (45.5%) | 0 (0.0%) |
| College / Associate Degree | 51 (96.2%) | 9 (17.6%) |
| Bachelor's Degree or higher | 20 (100.0%) | 2 (10.0%) |
| Total | 93 (77.5%) | 14 (11.8%) |
Employment Occupations by Sex in Applegate
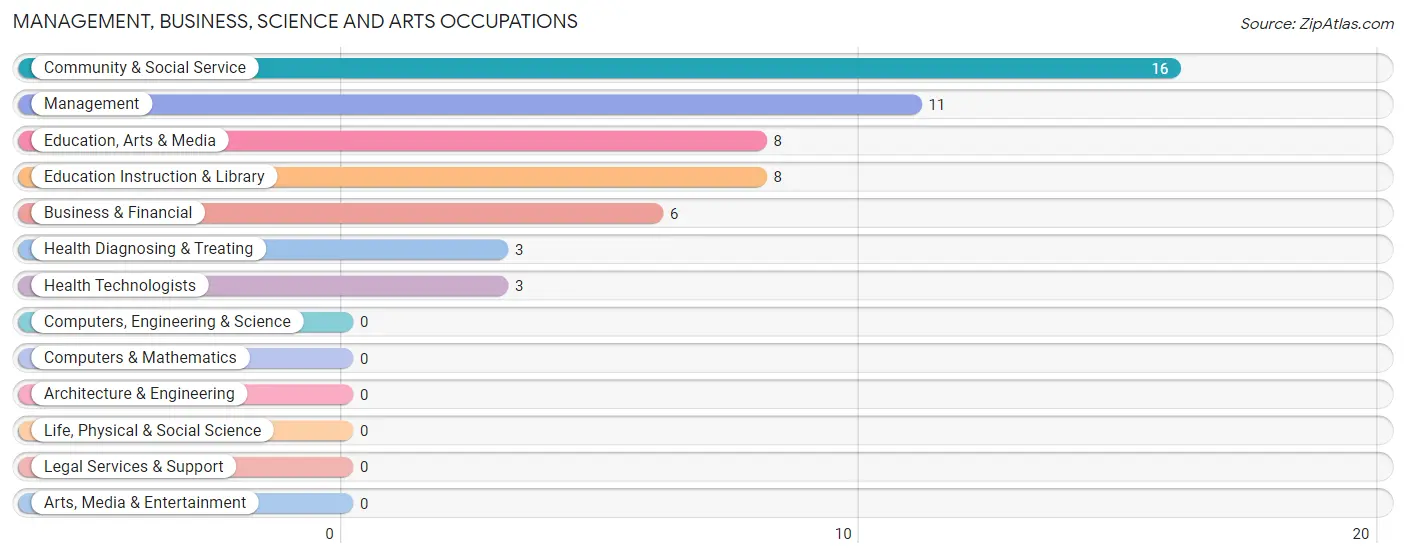
Management, Business, Science and Arts Occupations
The most common Management, Business, Science and Arts occupations in Applegate are Community & Social Service (16 | 13.9%), Management (11 | 9.6%), Education, Arts & Media (8 | 7.0%), Education Instruction & Library (8 | 7.0%), and Business & Financial (6 | 5.2%).
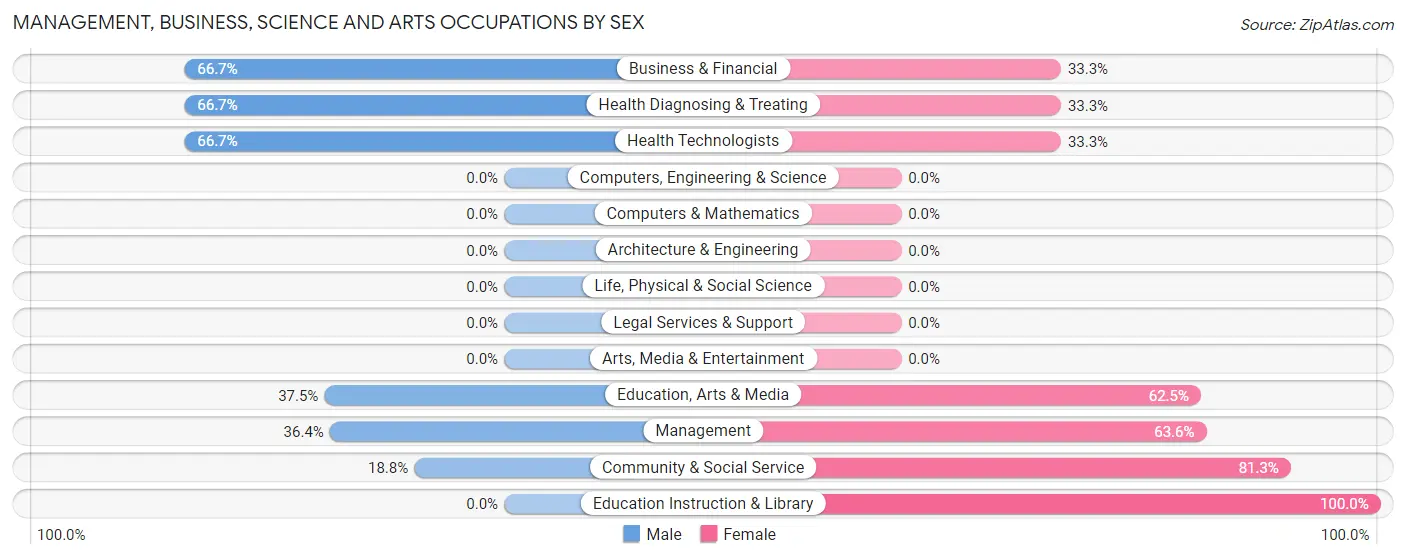
Management, Business, Science and Arts Occupations by Sex
Within the Management, Business, Science and Arts occupations in Applegate, the most male-oriented occupations are Business & Financial (66.7%), Health Diagnosing & Treating (66.7%), and Health Technologists (66.7%), while the most female-oriented occupations are Education Instruction & Library (100.0%), Community & Social Service (81.2%), and Management (63.6%).
| Occupation | Male | Female |
| Management | 4 (36.4%) | 7 (63.6%) |
| Business & Financial | 4 (66.7%) | 2 (33.3%) |
| Computers, Engineering & Science | 0 (0.0%) | 0 (0.0%) |
| Computers & Mathematics | 0 (0.0%) | 0 (0.0%) |
| Architecture & Engineering | 0 (0.0%) | 0 (0.0%) |
| Life, Physical & Social Science | 0 (0.0%) | 0 (0.0%) |
| Community & Social Service | 3 (18.8%) | 13 (81.2%) |
| Education, Arts & Media | 3 (37.5%) | 5 (62.5%) |
| Legal Services & Support | 0 (0.0%) | 0 (0.0%) |
| Education Instruction & Library | 0 (0.0%) | 8 (100.0%) |
| Arts, Media & Entertainment | 0 (0.0%) | 0 (0.0%) |
| Health Diagnosing & Treating | 2 (66.7%) | 1 (33.3%) |
| Health Technologists | 2 (66.7%) | 1 (33.3%) |
| Total (Category) | 13 (36.1%) | 23 (63.9%) |
| Total (Overall) | 53 (46.1%) | 62 (53.9%) |
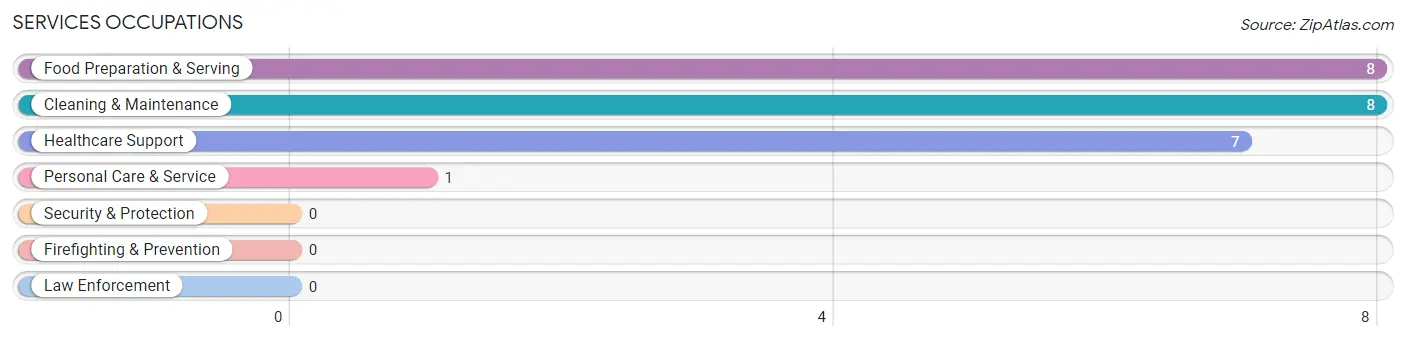
Services Occupations
The most common Services occupations in Applegate are Food Preparation & Serving (8 | 7.0%), Cleaning & Maintenance (8 | 7.0%), Healthcare Support (7 | 6.1%), and Personal Care & Service (1 | 0.9%).
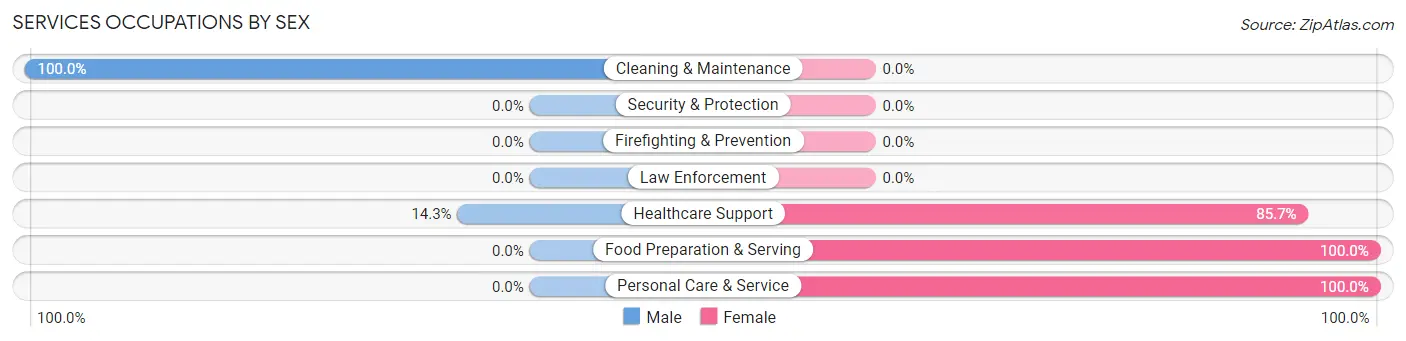
Services Occupations by Sex
Within the Services occupations in Applegate, the most male-oriented occupations are Cleaning & Maintenance (100.0%), and Healthcare Support (14.3%), while the most female-oriented occupations are Food Preparation & Serving (100.0%), Personal Care & Service (100.0%), and Healthcare Support (85.7%).
| Occupation | Male | Female |
| Healthcare Support | 1 (14.3%) | 6 (85.7%) |
| Security & Protection | 0 (0.0%) | 0 (0.0%) |
| Firefighting & Prevention | 0 (0.0%) | 0 (0.0%) |
| Law Enforcement | 0 (0.0%) | 0 (0.0%) |
| Food Preparation & Serving | 0 (0.0%) | 8 (100.0%) |
| Cleaning & Maintenance | 8 (100.0%) | 0 (0.0%) |
| Personal Care & Service | 0 (0.0%) | 1 (100.0%) |
| Total (Category) | 9 (37.5%) | 15 (62.5%) |
| Total (Overall) | 53 (46.1%) | 62 (53.9%) |
Sales and Office Occupations
The most common Sales and Office occupations in Applegate are Office & Administration (14 | 12.2%), and Sales & Related (6 | 5.2%).
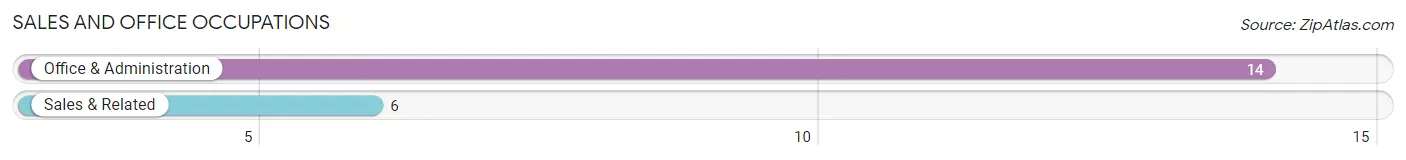
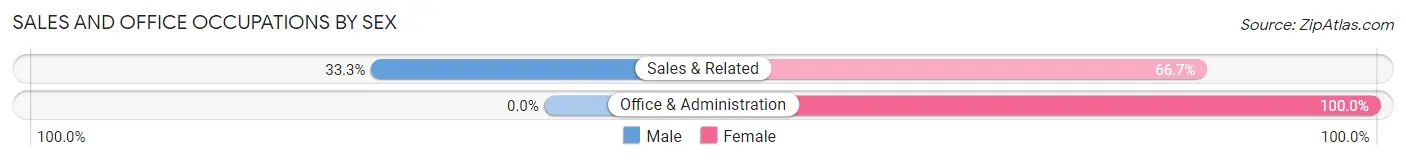
Sales and Office Occupations by Sex
| Occupation | Male | Female |
| Sales & Related | 2 (33.3%) | 4 (66.7%) |
| Office & Administration | 0 (0.0%) | 14 (100.0%) |
| Total (Category) | 2 (10.0%) | 18 (90.0%) |
| Total (Overall) | 53 (46.1%) | 62 (53.9%) |
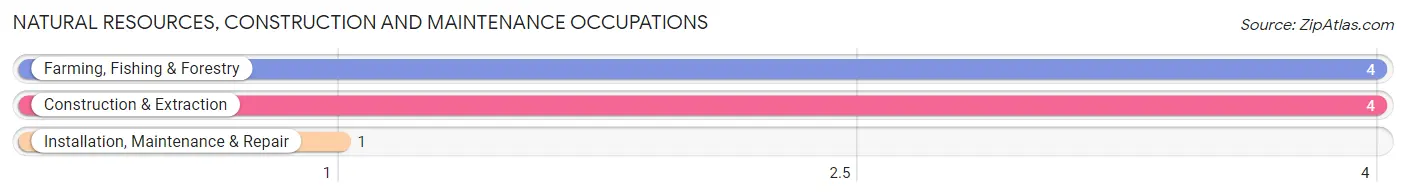
Natural Resources, Construction and Maintenance Occupations
The most common Natural Resources, Construction and Maintenance occupations in Applegate are Farming, Fishing & Forestry (4 | 3.5%), Construction & Extraction (4 | 3.5%), and Installation, Maintenance & Repair (1 | 0.9%).
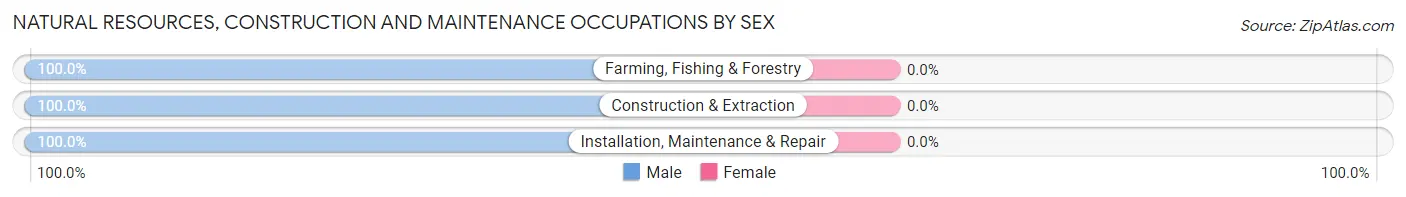
Natural Resources, Construction and Maintenance Occupations by Sex
| Occupation | Male | Female |
| Farming, Fishing & Forestry | 4 (100.0%) | 0 (0.0%) |
| Construction & Extraction | 4 (100.0%) | 0 (0.0%) |
| Installation, Maintenance & Repair | 1 (100.0%) | 0 (0.0%) |
| Total (Category) | 9 (100.0%) | 0 (0.0%) |
| Total (Overall) | 53 (46.1%) | 62 (53.9%) |
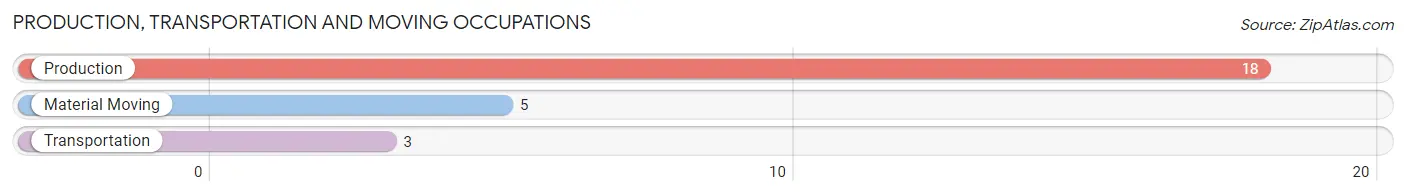
Production, Transportation and Moving Occupations
The most common Production, Transportation and Moving occupations in Applegate are Production (18 | 15.7%), Material Moving (5 | 4.3%), and Transportation (3 | 2.6%).
Production, Transportation and Moving Occupations by Sex
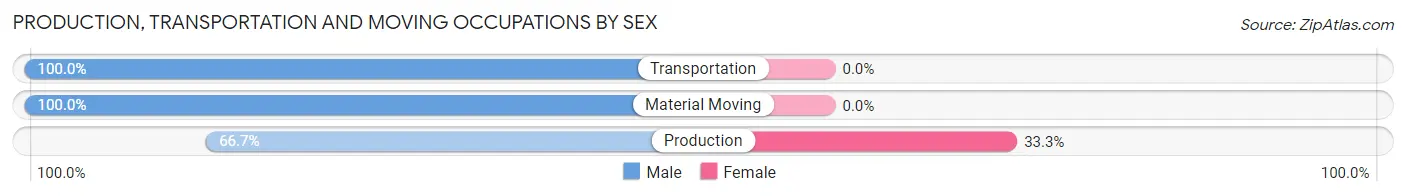
| Occupation | Male | Female |
| Production | 12 (66.7%) | 6 (33.3%) |
| Transportation | 3 (100.0%) | 0 (0.0%) |
| Material Moving | 5 (100.0%) | 0 (0.0%) |
| Total (Category) | 20 (76.9%) | 6 (23.1%) |
| Total (Overall) | 53 (46.1%) | 62 (53.9%) |
Employment Industries by Sex in Applegate
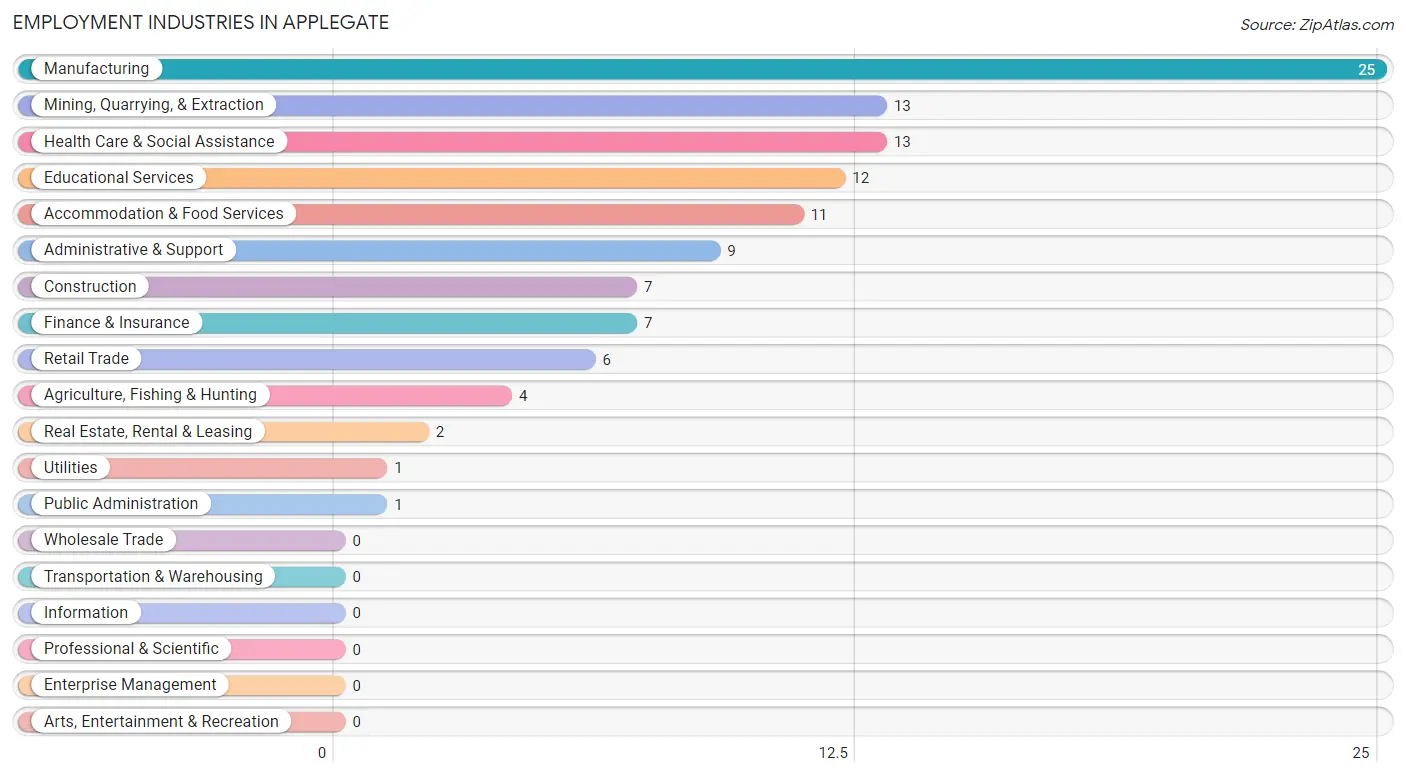
Employment Industries in Applegate
The major employment industries in Applegate include Manufacturing (25 | 21.7%), Mining, Quarrying, & Extraction (13 | 11.3%), Health Care & Social Assistance (13 | 11.3%), Educational Services (12 | 10.4%), and Accommodation & Food Services (11 | 9.6%).
Employment Industries by Sex in Applegate
The Applegate industries that see more men than women are Agriculture, Fishing & Hunting (100.0%), Construction (100.0%), and Utilities (100.0%), whereas the industries that tend to have a higher number of women are Mining, Quarrying, & Extraction (100.0%), Educational Services (100.0%), and Accommodation & Food Services (100.0%).
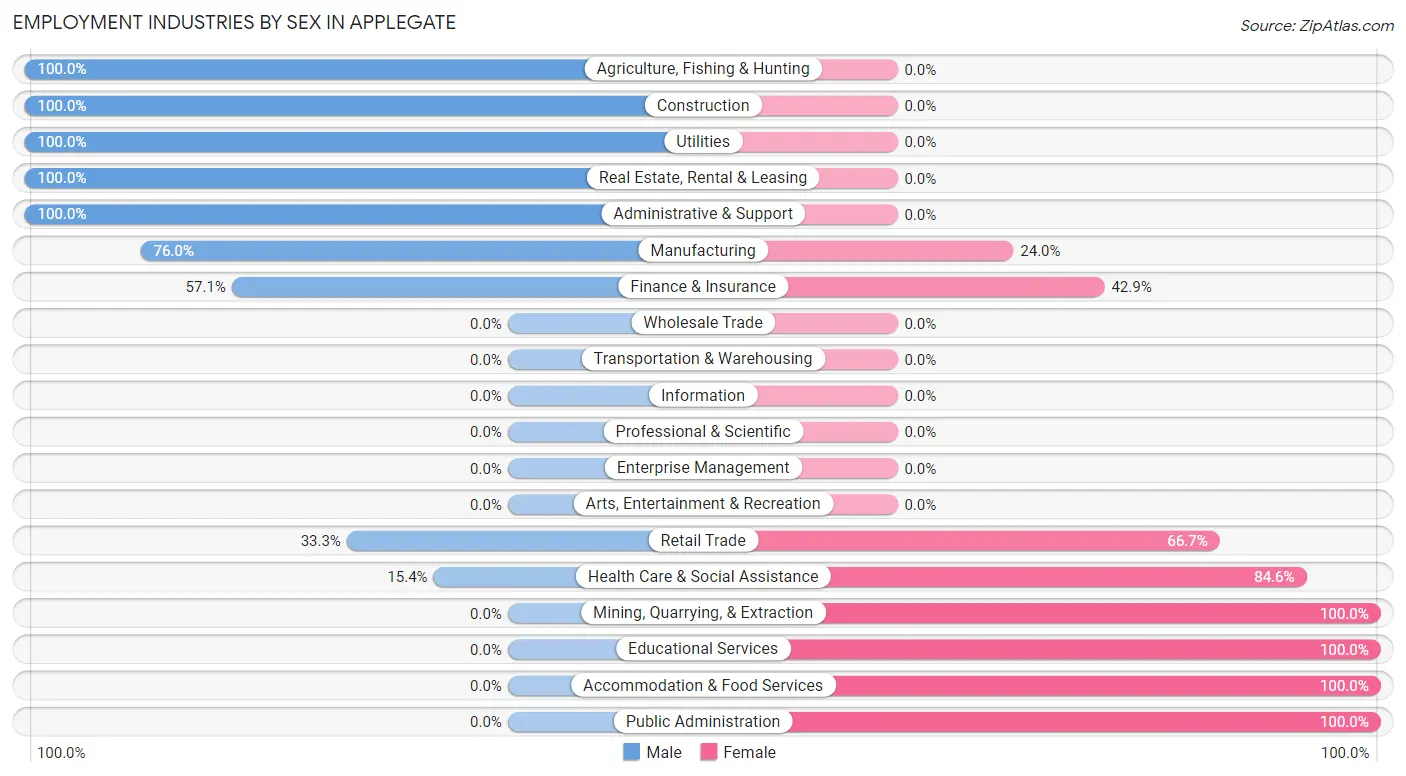
| Industry | Male | Female |
| Agriculture, Fishing & Hunting | 4 (100.0%) | 0 (0.0%) |
| Mining, Quarrying, & Extraction | 0 (0.0%) | 13 (100.0%) |
| Construction | 7 (100.0%) | 0 (0.0%) |
| Manufacturing | 19 (76.0%) | 6 (24.0%) |
| Wholesale Trade | 0 (0.0%) | 0 (0.0%) |
| Retail Trade | 2 (33.3%) | 4 (66.7%) |
| Transportation & Warehousing | 0 (0.0%) | 0 (0.0%) |
| Utilities | 1 (100.0%) | 0 (0.0%) |
| Information | 0 (0.0%) | 0 (0.0%) |
| Finance & Insurance | 4 (57.1%) | 3 (42.9%) |
| Real Estate, Rental & Leasing | 2 (100.0%) | 0 (0.0%) |
| Professional & Scientific | 0 (0.0%) | 0 (0.0%) |
| Enterprise Management | 0 (0.0%) | 0 (0.0%) |
| Administrative & Support | 9 (100.0%) | 0 (0.0%) |
| Educational Services | 0 (0.0%) | 12 (100.0%) |
| Health Care & Social Assistance | 2 (15.4%) | 11 (84.6%) |
| Arts, Entertainment & Recreation | 0 (0.0%) | 0 (0.0%) |
| Accommodation & Food Services | 0 (0.0%) | 11 (100.0%) |
| Public Administration | 0 (0.0%) | 1 (100.0%) |
| Total | 53 (46.1%) | 62 (53.9%) |
Education in Applegate
School Enrollment in Applegate
The most common levels of schooling among the 32 students in Applegate are middle school (10 | 31.2%), high school (8 | 25.0%), and graduate / professional (6 | 18.8%).
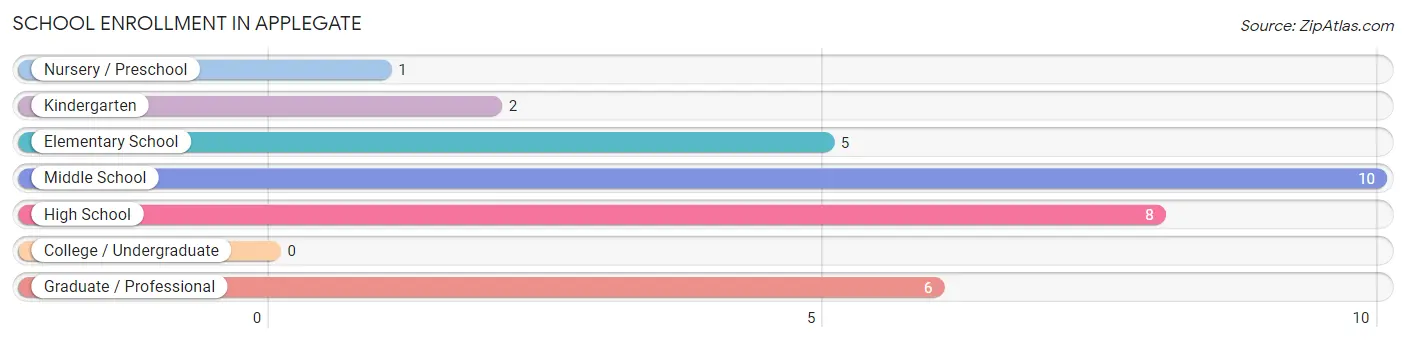
| School Level | # Students | % Students |
| Nursery / Preschool | 1 | 3.1% |
| Kindergarten | 2 | 6.2% |
| Elementary School | 5 | 15.6% |
| Middle School | 10 | 31.2% |
| High School | 8 | 25.0% |
| College / Undergraduate | 0 | 0.0% |
| Graduate / Professional | 6 | 18.8% |
| Total | 32 | 100.0% |
School Enrollment by Age by Funding Source in Applegate
Out of a total of 32 students who are enrolled in schools in Applegate, 1 (3.1%) attend a private institution, while the remaining 31 (96.9%) are enrolled in public schools. The age group of 5 to 9 year old has the highest likelihood of being enrolled in private schools, with 1 (12.5% in the age bracket) enrolled. Conversely, the age group of 10 to 14 year olds has the lowest likelihood of being enrolled in a private school, with 10 (100.0% in the age bracket) attending a public institution.
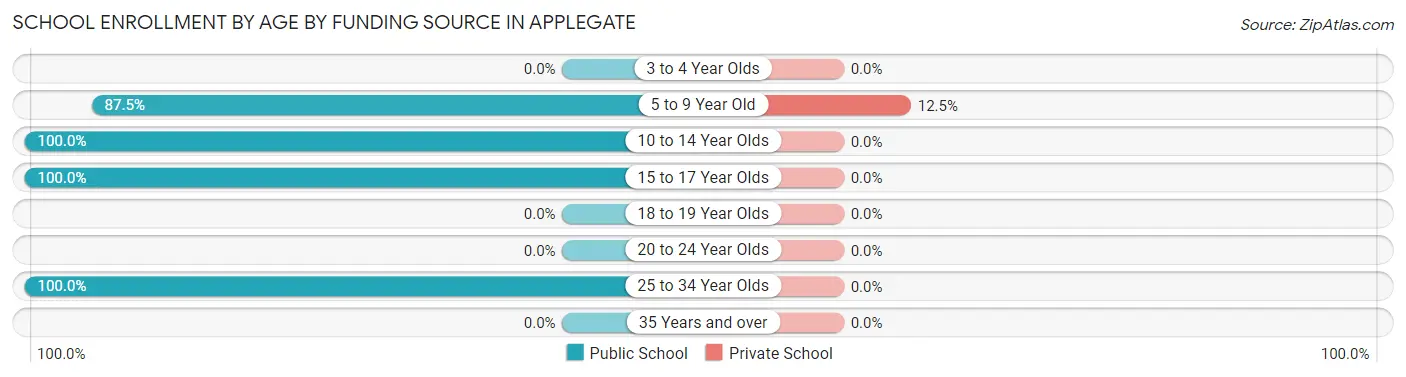
| Age Bracket | Public School | Private School |
| 3 to 4 Year Olds | 0 (0.0%) | 0 (0.0%) |
| 5 to 9 Year Old | 7 (87.5%) | 1 (12.5%) |
| 10 to 14 Year Olds | 10 (100.0%) | 0 (0.0%) |
| 15 to 17 Year Olds | 8 (100.0%) | 0 (0.0%) |
| 18 to 19 Year Olds | 0 (0.0%) | 0 (0.0%) |
| 20 to 24 Year Olds | 0 (0.0%) | 0 (0.0%) |
| 25 to 34 Year Olds | 6 (100.0%) | 0 (0.0%) |
| 35 Years and over | 0 (0.0%) | 0 (0.0%) |
| Total | 31 (96.9%) | 1 (3.1%) |
Educational Attainment by Field of Study in Applegate
Education (17 | 65.4%), liberal arts & history (3 | 11.5%), psychology (2 | 7.7%), social sciences (2 | 7.7%), and business (1 | 3.8%) are the most common fields of study among 26 individuals in Applegate who have obtained a bachelor's degree or higher.
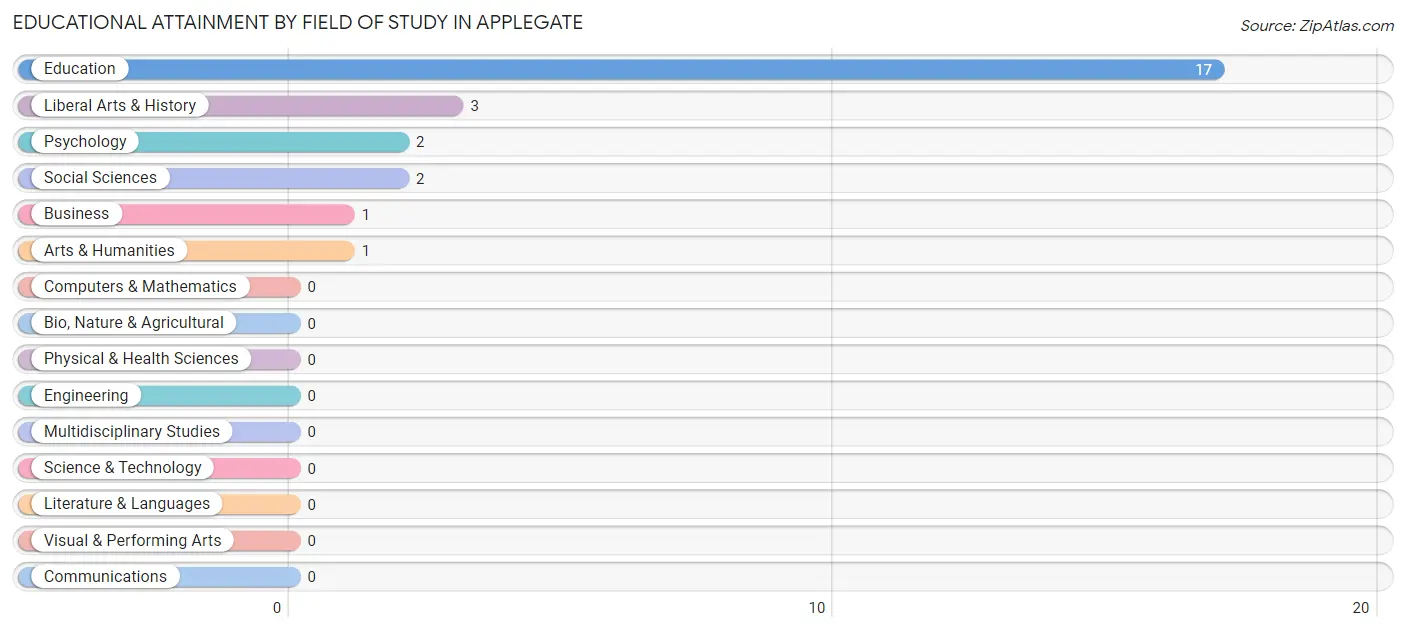
| Field of Study | # Graduates | % Graduates |
| Computers & Mathematics | 0 | 0.0% |
| Bio, Nature & Agricultural | 0 | 0.0% |
| Physical & Health Sciences | 0 | 0.0% |
| Psychology | 2 | 7.7% |
| Social Sciences | 2 | 7.7% |
| Engineering | 0 | 0.0% |
| Multidisciplinary Studies | 0 | 0.0% |
| Science & Technology | 0 | 0.0% |
| Business | 1 | 3.8% |
| Education | 17 | 65.4% |
| Literature & Languages | 0 | 0.0% |
| Liberal Arts & History | 3 | 11.5% |
| Visual & Performing Arts | 0 | 0.0% |
| Communications | 0 | 0.0% |
| Arts & Humanities | 1 | 3.8% |
| Total | 26 | 100.0% |
Transportation & Commute in Applegate
Vehicle Availability by Sex in Applegate
The most prevalent vehicle ownership categories in Applegate are males with 2 vehicles (24, accounting for 47.1%) and females with 2 vehicles (20, making up 38.7%).
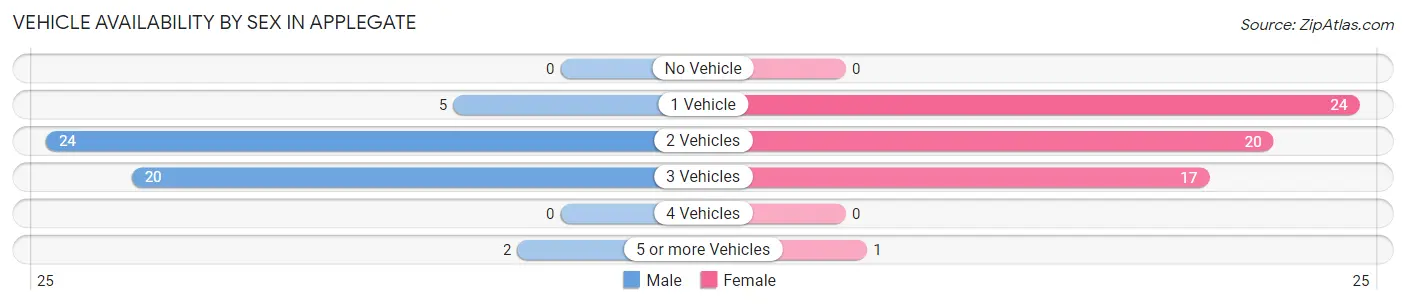
| Vehicles Available | Male | Female |
| No Vehicle | 0 (0.0%) | 0 (0.0%) |
| 1 Vehicle | 5 (9.8%) | 24 (38.7%) |
| 2 Vehicles | 24 (47.1%) | 20 (32.3%) |
| 3 Vehicles | 20 (39.2%) | 17 (27.4%) |
| 4 Vehicles | 0 (0.0%) | 0 (0.0%) |
| 5 or more Vehicles | 2 (3.9%) | 1 (1.6%) |
| Total | 51 (100.0%) | 62 (100.0%) |
Commute Time in Applegate
The most frequently occuring commute durations in Applegate are 20 to 24 minutes (29 commuters, 28.7%), 25 to 29 minutes (18 commuters, 17.8%), and 15 to 19 minutes (14 commuters, 13.9%).
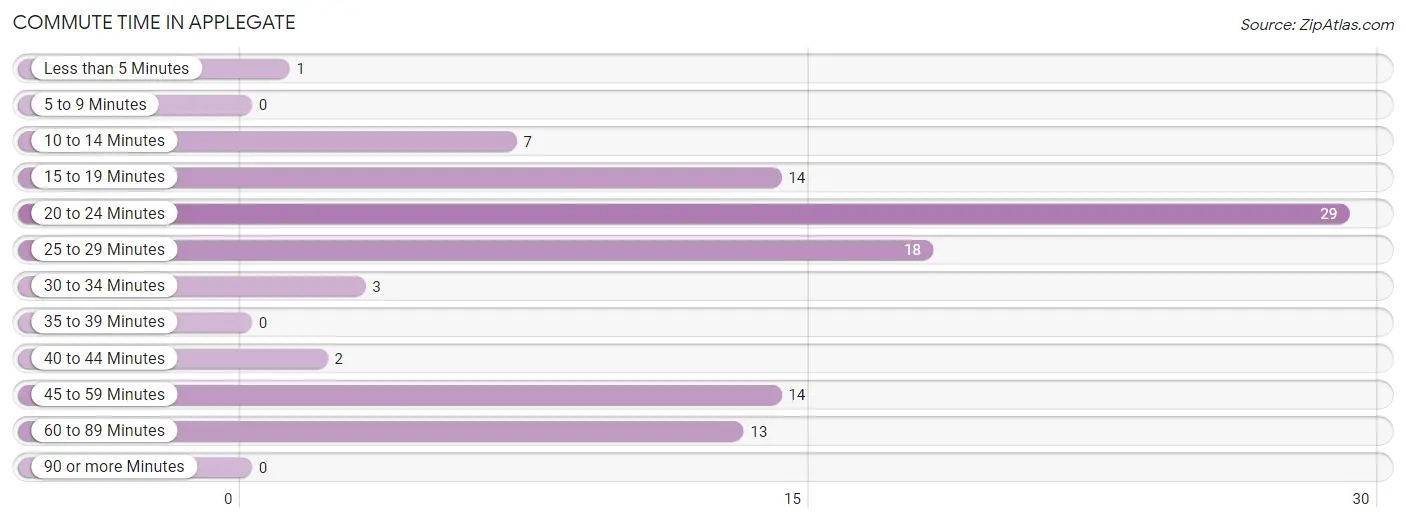
| Commute Time | # Commuters | % Commuters |
| Less than 5 Minutes | 1 | 1.0% |
| 5 to 9 Minutes | 0 | 0.0% |
| 10 to 14 Minutes | 7 | 6.9% |
| 15 to 19 Minutes | 14 | 13.9% |
| 20 to 24 Minutes | 29 | 28.7% |
| 25 to 29 Minutes | 18 | 17.8% |
| 30 to 34 Minutes | 3 | 3.0% |
| 35 to 39 Minutes | 0 | 0.0% |
| 40 to 44 Minutes | 2 | 2.0% |
| 45 to 59 Minutes | 14 | 13.9% |
| 60 to 89 Minutes | 13 | 12.9% |
| 90 or more Minutes | 0 | 0.0% |
Commute Time by Sex in Applegate
The most common commute times in Applegate are 20 to 24 minutes (9 commuters, 23.1%) for males and 20 to 24 minutes (20 commuters, 32.3%) for females.
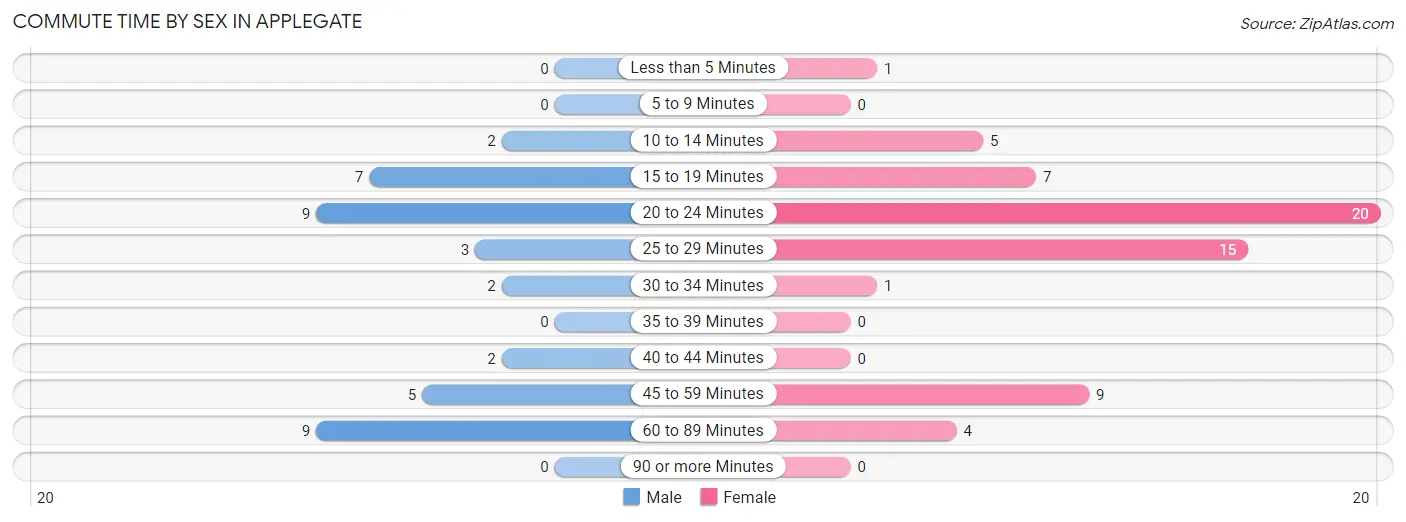
| Commute Time | Male | Female |
| Less than 5 Minutes | 0 (0.0%) | 1 (1.6%) |
| 5 to 9 Minutes | 0 (0.0%) | 0 (0.0%) |
| 10 to 14 Minutes | 2 (5.1%) | 5 (8.1%) |
| 15 to 19 Minutes | 7 (17.9%) | 7 (11.3%) |
| 20 to 24 Minutes | 9 (23.1%) | 20 (32.3%) |
| 25 to 29 Minutes | 3 (7.7%) | 15 (24.2%) |
| 30 to 34 Minutes | 2 (5.1%) | 1 (1.6%) |
| 35 to 39 Minutes | 0 (0.0%) | 0 (0.0%) |
| 40 to 44 Minutes | 2 (5.1%) | 0 (0.0%) |
| 45 to 59 Minutes | 5 (12.8%) | 9 (14.5%) |
| 60 to 89 Minutes | 9 (23.1%) | 4 (6.5%) |
| 90 or more Minutes | 0 (0.0%) | 0 (0.0%) |
Time of Departure to Work by Sex in Applegate
The most frequent times of departure to work in Applegate are 4:00 PM to 11:59 PM (16, 41.0%) for males and 7:30 AM to 7:59 AM (20, 32.3%) for females.
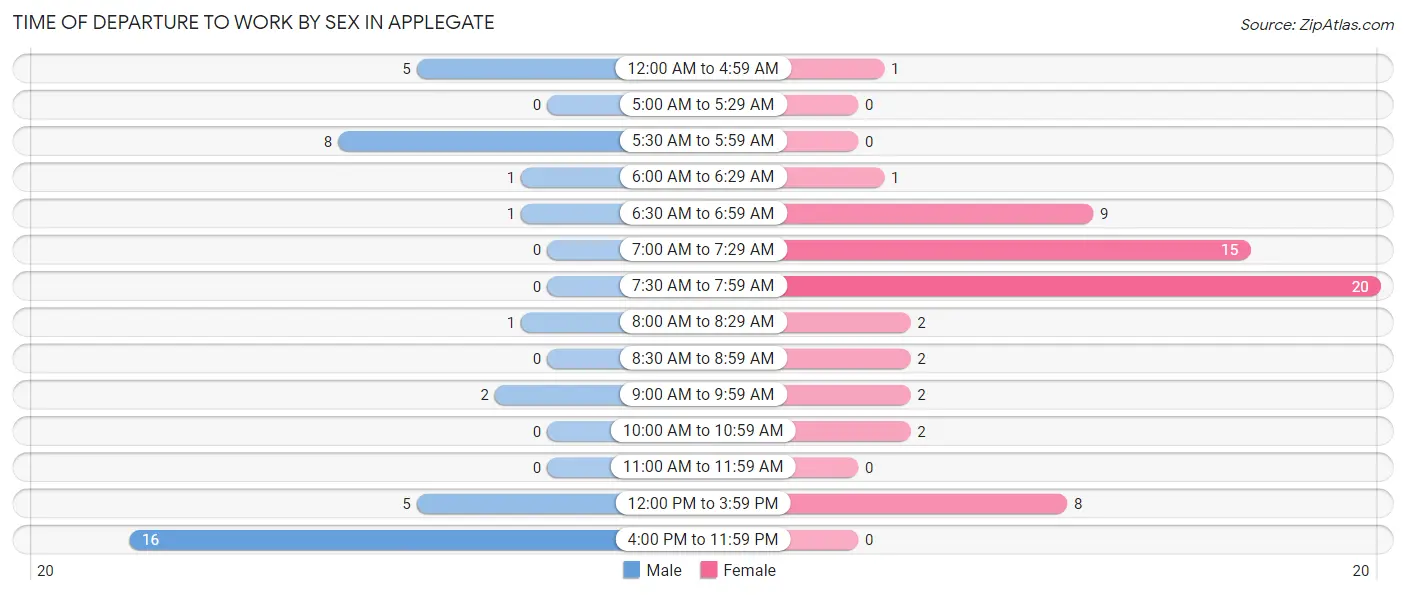
| Time of Departure | Male | Female |
| 12:00 AM to 4:59 AM | 5 (12.8%) | 1 (1.6%) |
| 5:00 AM to 5:29 AM | 0 (0.0%) | 0 (0.0%) |
| 5:30 AM to 5:59 AM | 8 (20.5%) | 0 (0.0%) |
| 6:00 AM to 6:29 AM | 1 (2.6%) | 1 (1.6%) |
| 6:30 AM to 6:59 AM | 1 (2.6%) | 9 (14.5%) |
| 7:00 AM to 7:29 AM | 0 (0.0%) | 15 (24.2%) |
| 7:30 AM to 7:59 AM | 0 (0.0%) | 20 (32.3%) |
| 8:00 AM to 8:29 AM | 1 (2.6%) | 2 (3.2%) |
| 8:30 AM to 8:59 AM | 0 (0.0%) | 2 (3.2%) |
| 9:00 AM to 9:59 AM | 2 (5.1%) | 2 (3.2%) |
| 10:00 AM to 10:59 AM | 0 (0.0%) | 2 (3.2%) |
| 11:00 AM to 11:59 AM | 0 (0.0%) | 0 (0.0%) |
| 12:00 PM to 3:59 PM | 5 (12.8%) | 8 (12.9%) |
| 4:00 PM to 11:59 PM | 16 (41.0%) | 0 (0.0%) |
| Total | 39 (100.0%) | 62 (100.0%) |
Housing Occupancy in Applegate
Occupancy by Ownership in Applegate
Of the total 99 dwellings in Applegate, owner-occupied units account for 82 (82.8%), while renter-occupied units make up 17 (17.2%).
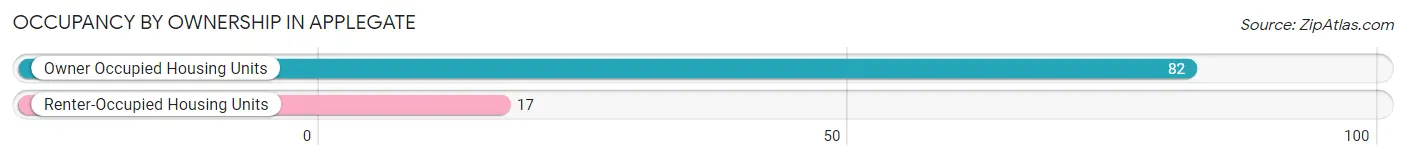
| Occupancy | # Housing Units | % Housing Units |
| Owner Occupied Housing Units | 82 | 82.8% |
| Renter-Occupied Housing Units | 17 | 17.2% |
| Total Occupied Housing Units | 99 | 100.0% |
Occupancy by Household Size in Applegate
| Household Size | # Housing Units | % Housing Units |
| 1-Person Household | 29 | 29.3% |
| 2-Person Household | 26 | 26.3% |
| 3-Person Household | 24 | 24.2% |
| 4+ Person Household | 20 | 20.2% |
| Total Housing Units | 99 | 100.0% |
Occupancy by Ownership by Household Size in Applegate
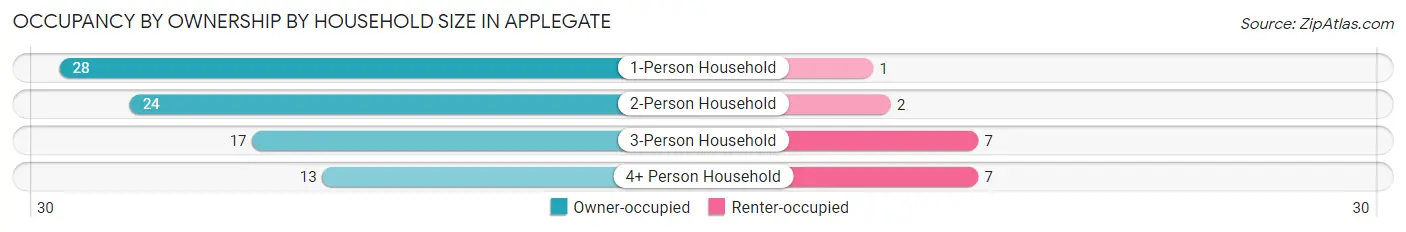
| Household Size | Owner-occupied | Renter-occupied |
| 1-Person Household | 28 (96.6%) | 1 (3.5%) |
| 2-Person Household | 24 (92.3%) | 2 (7.7%) |
| 3-Person Household | 17 (70.8%) | 7 (29.2%) |
| 4+ Person Household | 13 (65.0%) | 7 (35.0%) |
| Total Housing Units | 82 (82.8%) | 17 (17.2%) |
Occupancy by Educational Attainment in Applegate
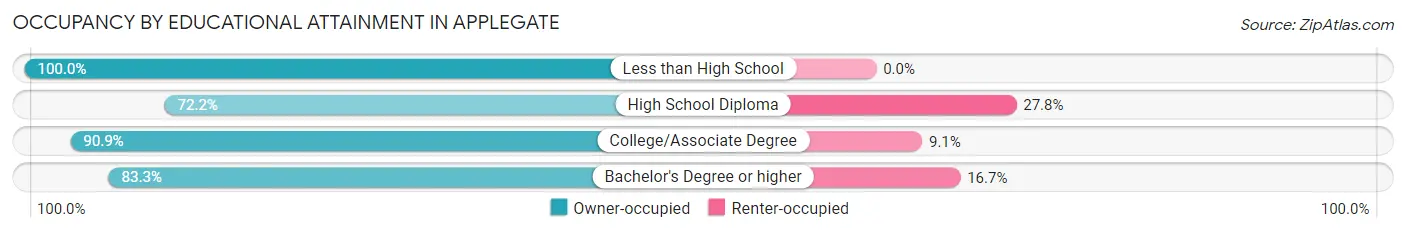
| Household Size | Owner-occupied | Renter-occupied |
| Less than High School | 1 (100.0%) | 0 (0.0%) |
| High School Diploma | 26 (72.2%) | 10 (27.8%) |
| College/Associate Degree | 40 (90.9%) | 4 (9.1%) |
| Bachelor's Degree or higher | 15 (83.3%) | 3 (16.7%) |
Occupancy by Age of Householder in Applegate
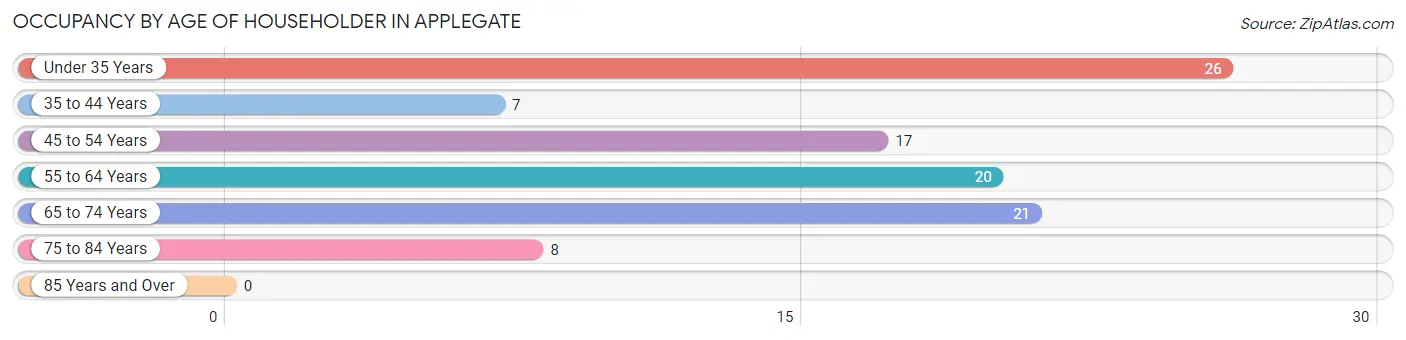
| Age Bracket | # Households | % Households |
| Under 35 Years | 26 | 26.3% |
| 35 to 44 Years | 7 | 7.1% |
| 45 to 54 Years | 17 | 17.2% |
| 55 to 64 Years | 20 | 20.2% |
| 65 to 74 Years | 21 | 21.2% |
| 75 to 84 Years | 8 | 8.1% |
| 85 Years and Over | 0 | 0.0% |
| Total | 99 | 100.0% |
Housing Finances in Applegate
Median Income by Occupancy in Applegate
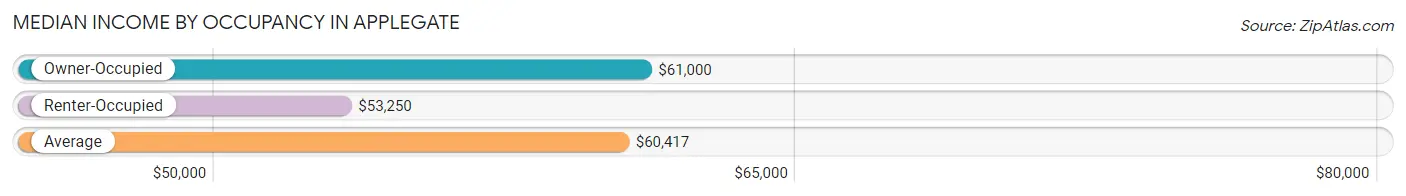
| Occupancy Type | # Households | Median Income |
| Owner-Occupied | 82 (82.8%) | $61,000 |
| Renter-Occupied | 17 (17.2%) | $53,250 |
| Average | 99 (100.0%) | $60,417 |
Occupancy by Householder Income Bracket in Applegate
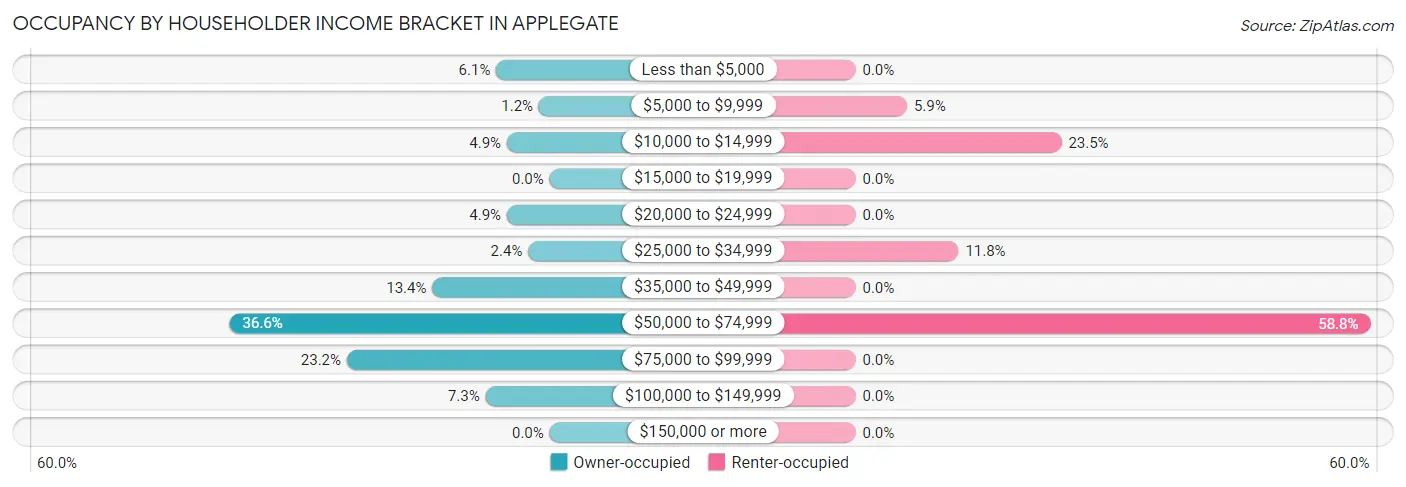
| Income Bracket | Owner-occupied | Renter-occupied |
| Less than $5,000 | 5 (6.1%) | 0 (0.0%) |
| $5,000 to $9,999 | 1 (1.2%) | 1 (5.9%) |
| $10,000 to $14,999 | 4 (4.9%) | 4 (23.5%) |
| $15,000 to $19,999 | 0 (0.0%) | 0 (0.0%) |
| $20,000 to $24,999 | 4 (4.9%) | 0 (0.0%) |
| $25,000 to $34,999 | 2 (2.4%) | 2 (11.8%) |
| $35,000 to $49,999 | 11 (13.4%) | 0 (0.0%) |
| $50,000 to $74,999 | 30 (36.6%) | 10 (58.8%) |
| $75,000 to $99,999 | 19 (23.2%) | 0 (0.0%) |
| $100,000 to $149,999 | 6 (7.3%) | 0 (0.0%) |
| $150,000 or more | 0 (0.0%) | 0 (0.0%) |
| Total | 82 (100.0%) | 17 (100.0%) |
Monthly Housing Cost Tiers in Applegate
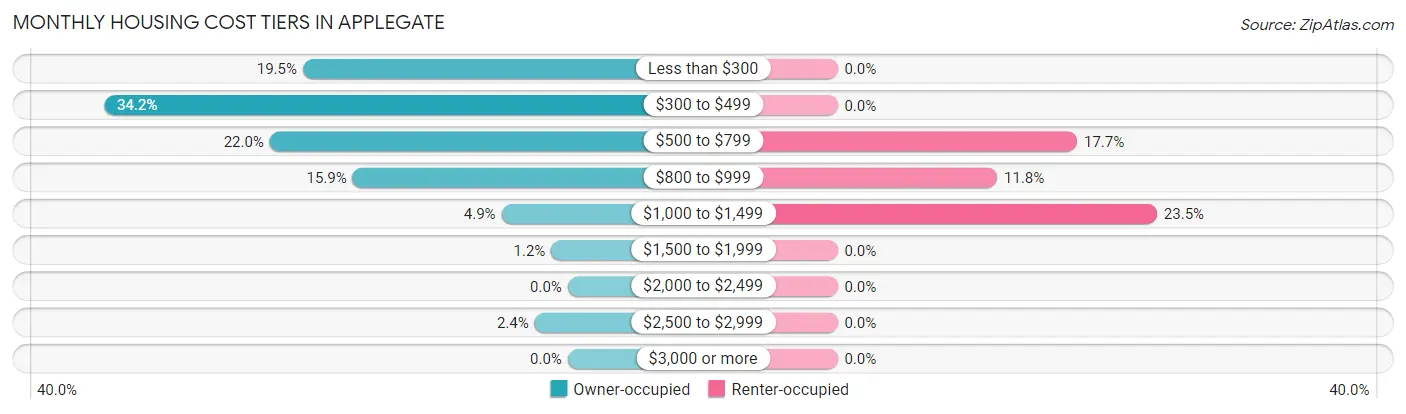
| Monthly Cost | Owner-occupied | Renter-occupied |
| Less than $300 | 16 (19.5%) | 0 (0.0%) |
| $300 to $499 | 28 (34.2%) | 0 (0.0%) |
| $500 to $799 | 18 (22.0%) | 3 (17.6%) |
| $800 to $999 | 13 (15.9%) | 2 (11.8%) |
| $1,000 to $1,499 | 4 (4.9%) | 4 (23.5%) |
| $1,500 to $1,999 | 1 (1.2%) | 0 (0.0%) |
| $2,000 to $2,499 | 0 (0.0%) | 0 (0.0%) |
| $2,500 to $2,999 | 2 (2.4%) | 0 (0.0%) |
| $3,000 or more | 0 (0.0%) | 0 (0.0%) |
| Total | 82 (100.0%) | 17 (100.0%) |
Physical Housing Characteristics in Applegate
Housing Structures in Applegate
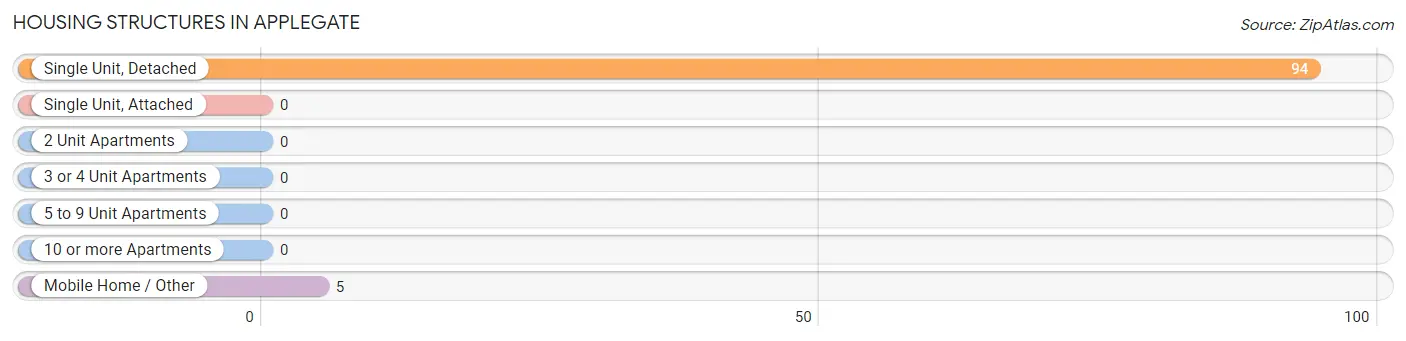
| Structure Type | # Housing Units | % Housing Units |
| Single Unit, Detached | 94 | 95.0% |
| Single Unit, Attached | 0 | 0.0% |
| 2 Unit Apartments | 0 | 0.0% |
| 3 or 4 Unit Apartments | 0 | 0.0% |
| 5 to 9 Unit Apartments | 0 | 0.0% |
| 10 or more Apartments | 0 | 0.0% |
| Mobile Home / Other | 5 | 5.1% |
| Total | 99 | 100.0% |
Housing Structures by Occupancy in Applegate
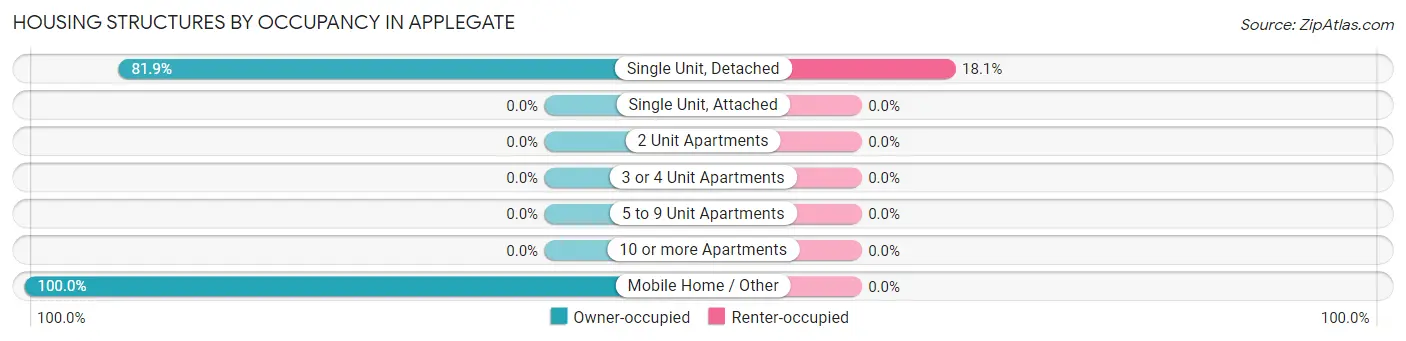
| Structure Type | Owner-occupied | Renter-occupied |
| Single Unit, Detached | 77 (81.9%) | 17 (18.1%) |
| Single Unit, Attached | 0 (0.0%) | 0 (0.0%) |
| 2 Unit Apartments | 0 (0.0%) | 0 (0.0%) |
| 3 or 4 Unit Apartments | 0 (0.0%) | 0 (0.0%) |
| 5 to 9 Unit Apartments | 0 (0.0%) | 0 (0.0%) |
| 10 or more Apartments | 0 (0.0%) | 0 (0.0%) |
| Mobile Home / Other | 5 (100.0%) | 0 (0.0%) |
| Total | 82 (82.8%) | 17 (17.2%) |
Housing Structures by Number of Rooms in Applegate
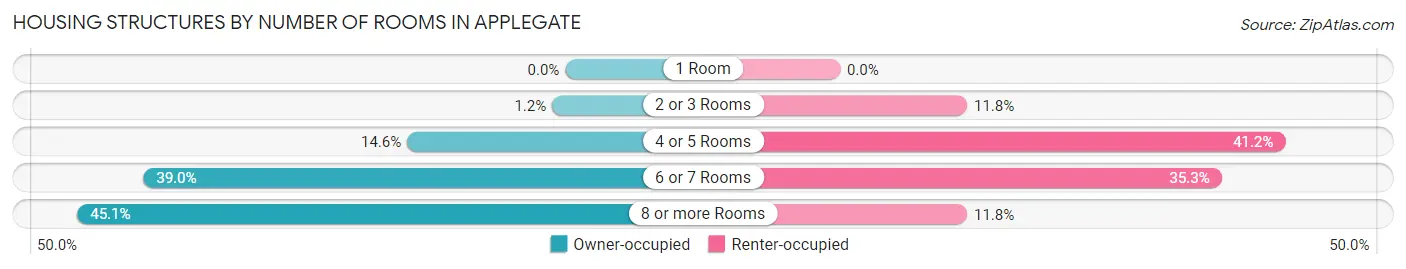
| Number of Rooms | Owner-occupied | Renter-occupied |
| 1 Room | 0 (0.0%) | 0 (0.0%) |
| 2 or 3 Rooms | 1 (1.2%) | 2 (11.8%) |
| 4 or 5 Rooms | 12 (14.6%) | 7 (41.2%) |
| 6 or 7 Rooms | 32 (39.0%) | 6 (35.3%) |
| 8 or more Rooms | 37 (45.1%) | 2 (11.8%) |
| Total | 82 (100.0%) | 17 (100.0%) |
Housing Structure by Heating Type in Applegate
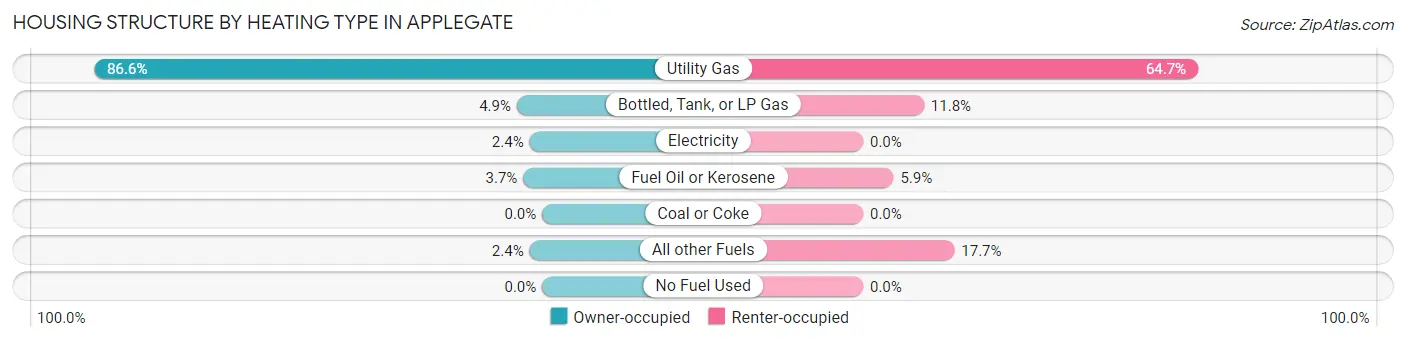
| Heating Type | Owner-occupied | Renter-occupied |
| Utility Gas | 71 (86.6%) | 11 (64.7%) |
| Bottled, Tank, or LP Gas | 4 (4.9%) | 2 (11.8%) |
| Electricity | 2 (2.4%) | 0 (0.0%) |
| Fuel Oil or Kerosene | 3 (3.7%) | 1 (5.9%) |
| Coal or Coke | 0 (0.0%) | 0 (0.0%) |
| All other Fuels | 2 (2.4%) | 3 (17.6%) |
| No Fuel Used | 0 (0.0%) | 0 (0.0%) |
| Total | 82 (100.0%) | 17 (100.0%) |
Household Vehicle Usage in Applegate
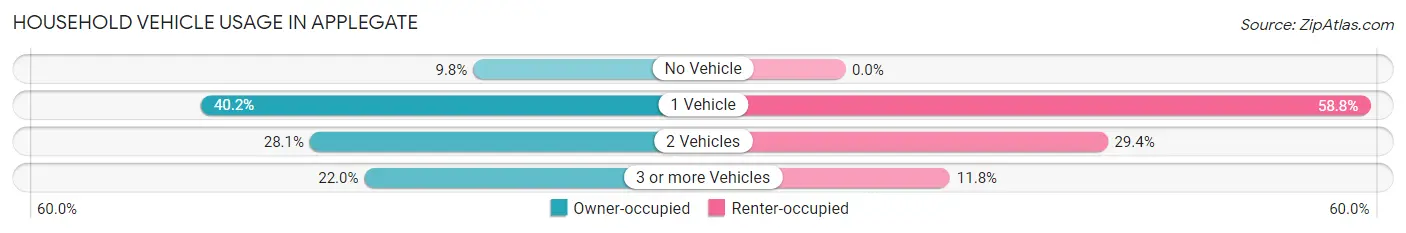
| Vehicles per Household | Owner-occupied | Renter-occupied |
| No Vehicle | 8 (9.8%) | 0 (0.0%) |
| 1 Vehicle | 33 (40.2%) | 10 (58.8%) |
| 2 Vehicles | 23 (28.1%) | 5 (29.4%) |
| 3 or more Vehicles | 18 (22.0%) | 2 (11.8%) |
| Total | 82 (100.0%) | 17 (100.0%) |
Real Estate & Mortgages in Applegate
Real Estate and Mortgage Overview in Applegate
| Characteristic | Without Mortgage | With Mortgage |
| Housing Units | 43 | 39 |
| Median Property Value | $85,000 | $82,500 |
| Median Household Income | $60,982 | $0 |
| Monthly Housing Costs | $395 | $0 |
| Real Estate Taxes | - | - |
Property Value by Mortgage Status in Applegate
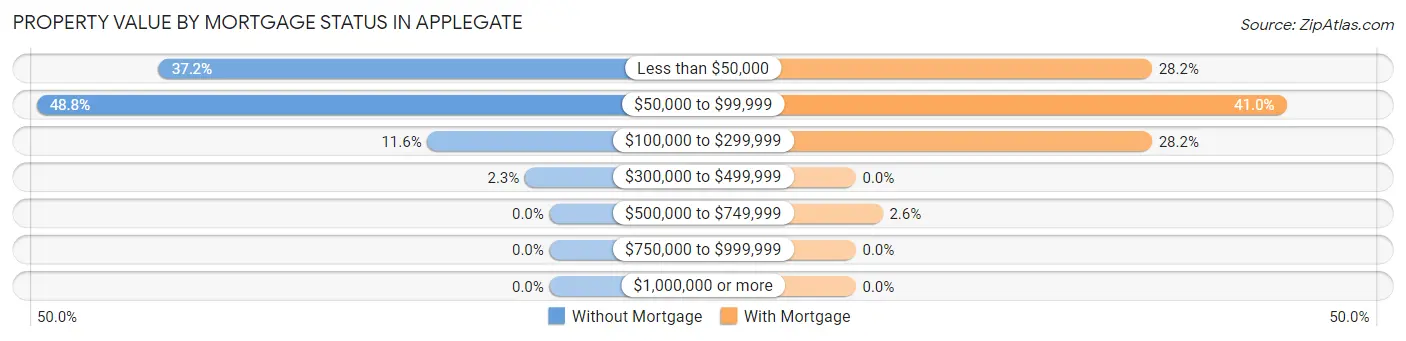
| Property Value | Without Mortgage | With Mortgage |
| Less than $50,000 | 16 (37.2%) | 11 (28.2%) |
| $50,000 to $99,999 | 21 (48.8%) | 16 (41.0%) |
| $100,000 to $299,999 | 5 (11.6%) | 11 (28.2%) |
| $300,000 to $499,999 | 1 (2.3%) | 0 (0.0%) |
| $500,000 to $749,999 | 0 (0.0%) | 1 (2.6%) |
| $750,000 to $999,999 | 0 (0.0%) | 0 (0.0%) |
| $1,000,000 or more | 0 (0.0%) | 0 (0.0%) |
| Total | 43 (100.0%) | 39 (100.0%) |
Household Income by Mortgage Status in Applegate
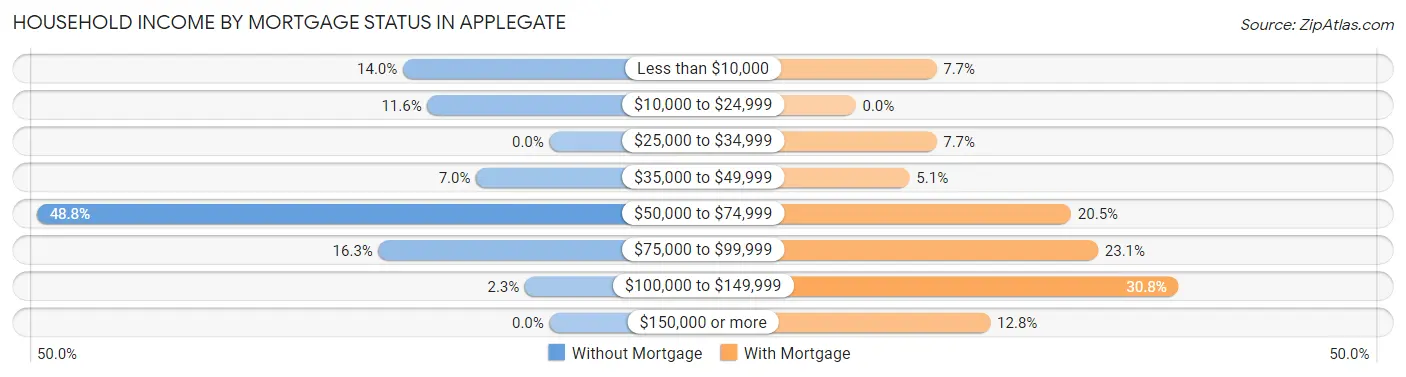
| Household Income | Without Mortgage | With Mortgage |
| Less than $10,000 | 6 (14.0%) | 3 (7.7%) |
| $10,000 to $24,999 | 5 (11.6%) | 0 (0.0%) |
| $25,000 to $34,999 | 0 (0.0%) | 3 (7.7%) |
| $35,000 to $49,999 | 3 (7.0%) | 2 (5.1%) |
| $50,000 to $74,999 | 21 (48.8%) | 8 (20.5%) |
| $75,000 to $99,999 | 7 (16.3%) | 9 (23.1%) |
| $100,000 to $149,999 | 1 (2.3%) | 12 (30.8%) |
| $150,000 or more | 0 (0.0%) | 5 (12.8%) |
| Total | 43 (100.0%) | 39 (100.0%) |
Property Value to Household Income Ratio in Applegate
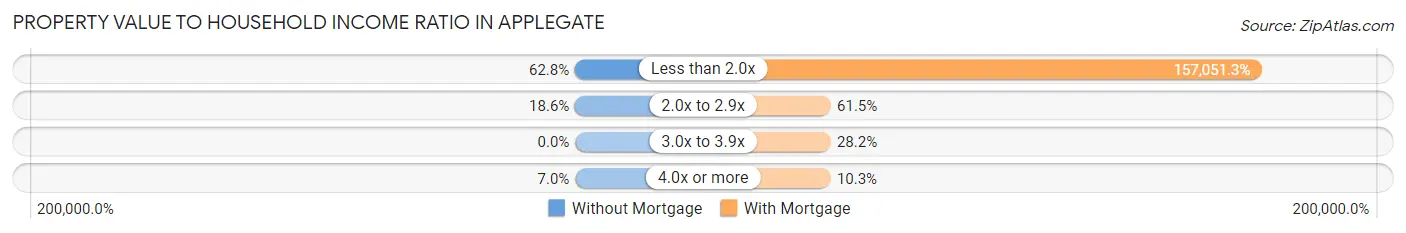
| Value-to-Income Ratio | Without Mortgage | With Mortgage |
| Less than 2.0x | 27 (62.8%) | 61,250 (157,051.3%) |
| 2.0x to 2.9x | 8 (18.6%) | 24 (61.5%) |
| 3.0x to 3.9x | 0 (0.0%) | 11 (28.2%) |
| 4.0x or more | 3 (7.0%) | 4 (10.3%) |
| Total | 43 (100.0%) | 39 (100.0%) |
Real Estate Taxes by Mortgage Status in Applegate
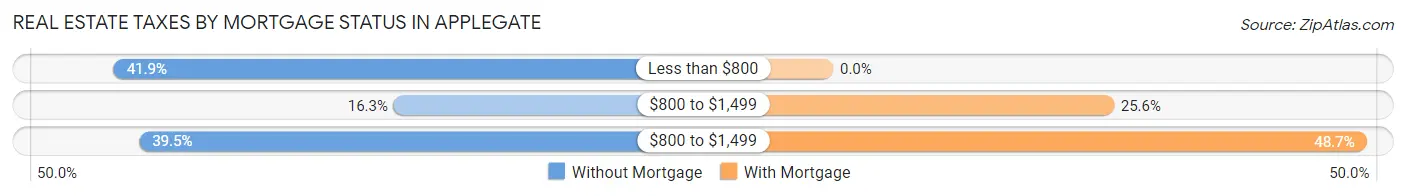
| Property Taxes | Without Mortgage | With Mortgage |
| Less than $800 | 18 (41.9%) | 0 (0.0%) |
| $800 to $1,499 | 7 (16.3%) | 10 (25.6%) |
| $800 to $1,499 | 17 (39.5%) | 19 (48.7%) |
| Total | 43 (100.0%) | 39 (100.0%) |
Health & Disability in Applegate
Health Insurance Coverage by Age in Applegate
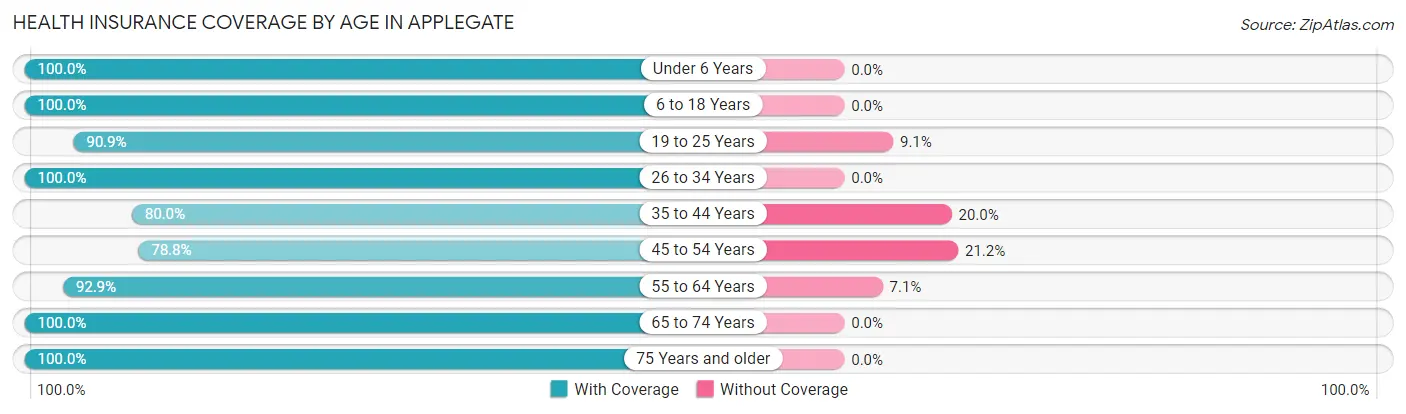
| Age Bracket | With Coverage | Without Coverage |
| Under 6 Years | 29 (100.0%) | 0 (0.0%) |
| 6 to 18 Years | 25 (100.0%) | 0 (0.0%) |
| 19 to 25 Years | 20 (90.9%) | 2 (9.1%) |
| 26 to 34 Years | 38 (100.0%) | 0 (0.0%) |
| 35 to 44 Years | 16 (80.0%) | 4 (20.0%) |
| 45 to 54 Years | 26 (78.8%) | 7 (21.2%) |
| 55 to 64 Years | 26 (92.9%) | 2 (7.1%) |
| 65 to 74 Years | 28 (100.0%) | 0 (0.0%) |
| 75 Years and older | 10 (100.0%) | 0 (0.0%) |
| Total | 218 (93.6%) | 15 (6.4%) |
Health Insurance Coverage by Citizenship Status in Applegate
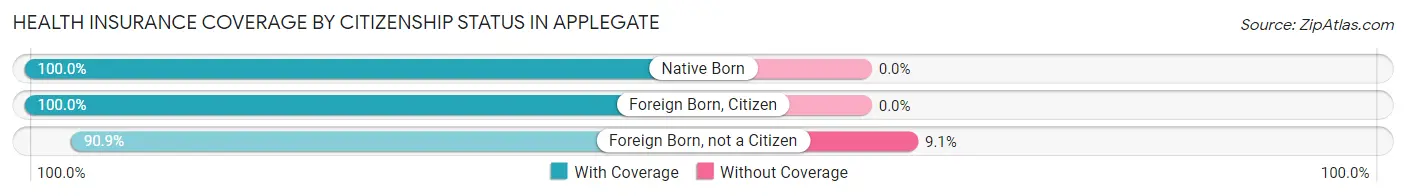
| Citizenship Status | With Coverage | Without Coverage |
| Native Born | 29 (100.0%) | 0 (0.0%) |
| Foreign Born, Citizen | 25 (100.0%) | 0 (0.0%) |
| Foreign Born, not a Citizen | 20 (90.9%) | 2 (9.1%) |
Health Insurance Coverage by Household Income in Applegate
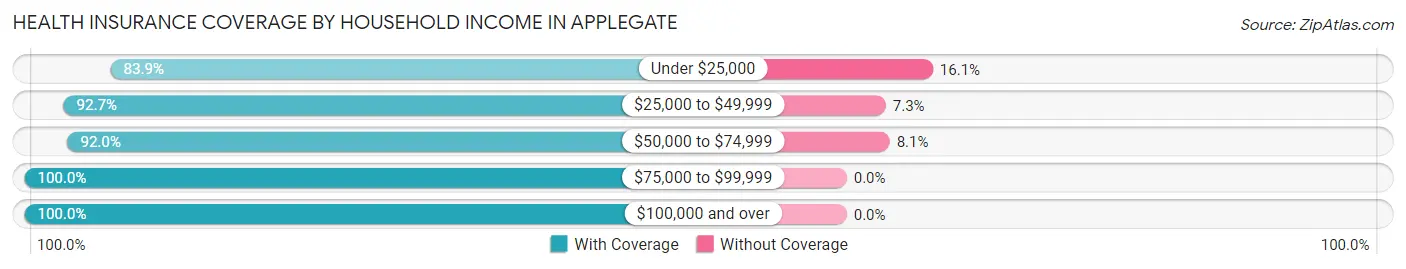
| Household Income | With Coverage | Without Coverage |
| Under $25,000 | 26 (83.9%) | 5 (16.1%) |
| $25,000 to $49,999 | 38 (92.7%) | 3 (7.3%) |
| $50,000 to $74,999 | 80 (91.9%) | 7 (8.1%) |
| $75,000 to $99,999 | 54 (100.0%) | 0 (0.0%) |
| $100,000 and over | 20 (100.0%) | 0 (0.0%) |
Public vs Private Health Insurance Coverage by Age in Applegate
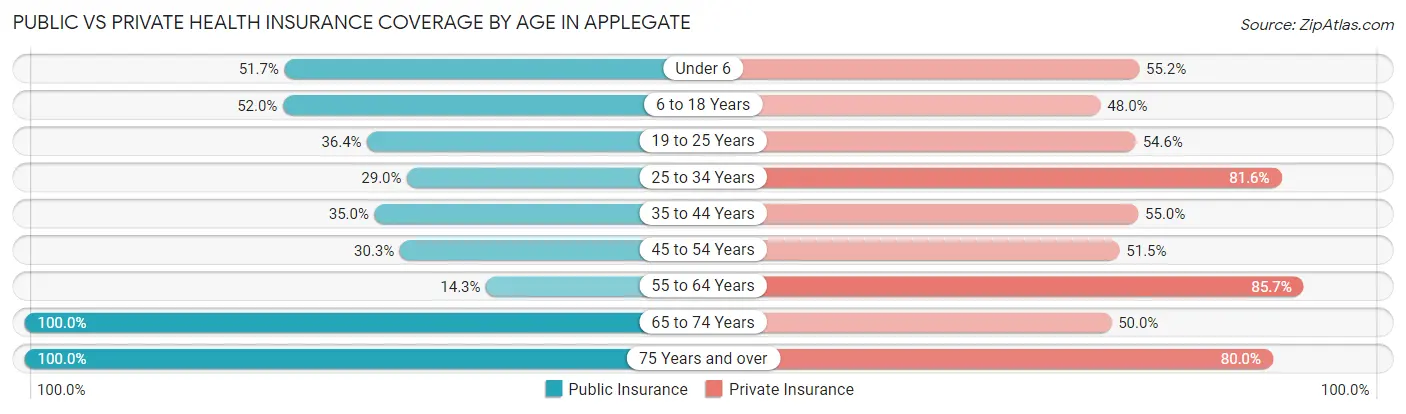
| Age Bracket | Public Insurance | Private Insurance |
| Under 6 | 15 (51.7%) | 16 (55.2%) |
| 6 to 18 Years | 13 (52.0%) | 12 (48.0%) |
| 19 to 25 Years | 8 (36.4%) | 12 (54.5%) |
| 25 to 34 Years | 11 (28.9%) | 31 (81.6%) |
| 35 to 44 Years | 7 (35.0%) | 11 (55.0%) |
| 45 to 54 Years | 10 (30.3%) | 17 (51.5%) |
| 55 to 64 Years | 4 (14.3%) | 24 (85.7%) |
| 65 to 74 Years | 28 (100.0%) | 14 (50.0%) |
| 75 Years and over | 10 (100.0%) | 8 (80.0%) |
| Total | 106 (45.5%) | 145 (62.2%) |
Disability Status by Sex by Age in Applegate
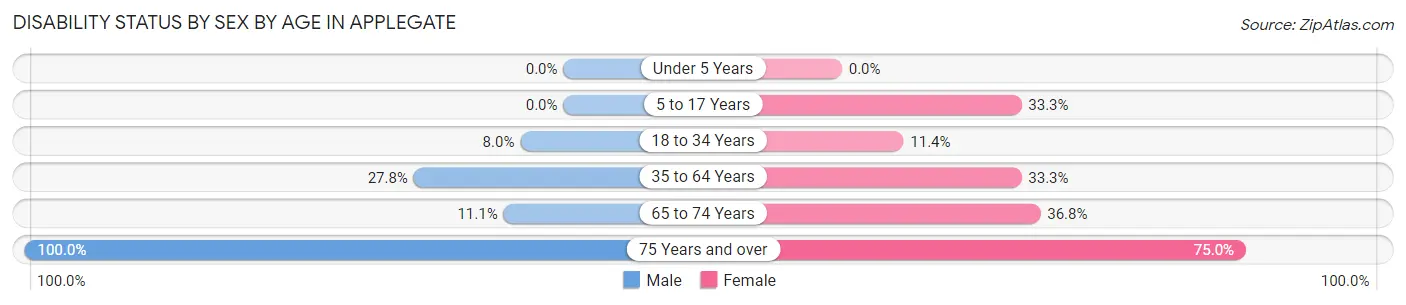
| Age Bracket | Male | Female |
| Under 5 Years | 0 (0.0%) | 0 (0.0%) |
| 5 to 17 Years | 0 (0.0%) | 2 (33.3%) |
| 18 to 34 Years | 2 (8.0%) | 4 (11.4%) |
| 35 to 64 Years | 10 (27.8%) | 15 (33.3%) |
| 65 to 74 Years | 1 (11.1%) | 7 (36.8%) |
| 75 Years and over | 2 (100.0%) | 6 (75.0%) |
Disability Class by Sex by Age in Applegate
Disability Class: Hearing Difficulty
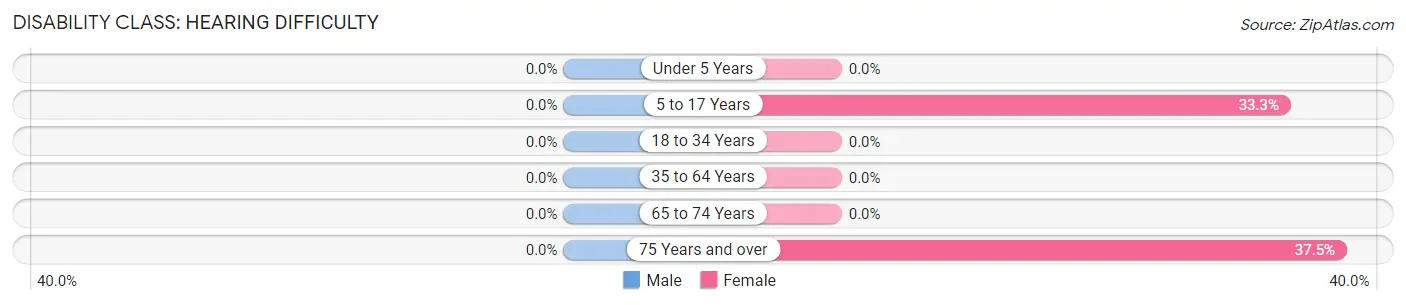
| Age Bracket | Male | Female |
| Under 5 Years | 0 (0.0%) | 0 (0.0%) |
| 5 to 17 Years | 0 (0.0%) | 2 (33.3%) |
| 18 to 34 Years | 0 (0.0%) | 0 (0.0%) |
| 35 to 64 Years | 0 (0.0%) | 0 (0.0%) |
| 65 to 74 Years | 0 (0.0%) | 0 (0.0%) |
| 75 Years and over | 0 (0.0%) | 3 (37.5%) |
Disability Class: Vision Difficulty
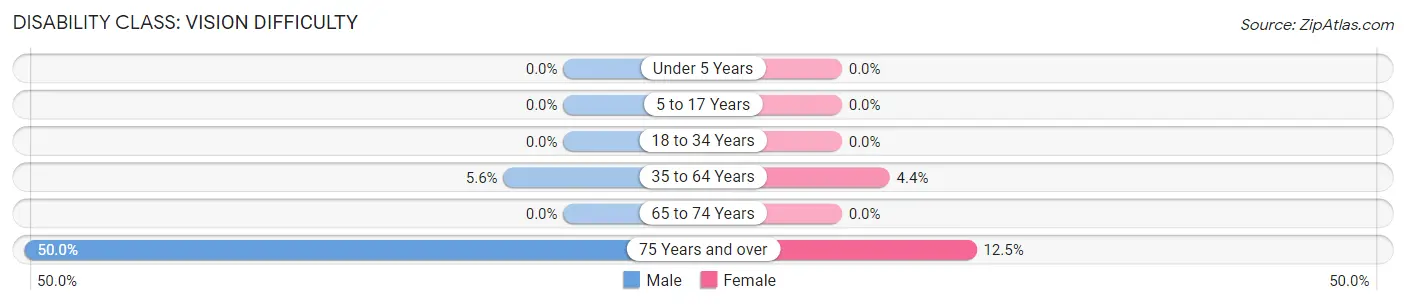
| Age Bracket | Male | Female |
| Under 5 Years | 0 (0.0%) | 0 (0.0%) |
| 5 to 17 Years | 0 (0.0%) | 0 (0.0%) |
| 18 to 34 Years | 0 (0.0%) | 0 (0.0%) |
| 35 to 64 Years | 2 (5.6%) | 2 (4.4%) |
| 65 to 74 Years | 0 (0.0%) | 0 (0.0%) |
| 75 Years and over | 1 (50.0%) | 1 (12.5%) |
Disability Class: Cognitive Difficulty
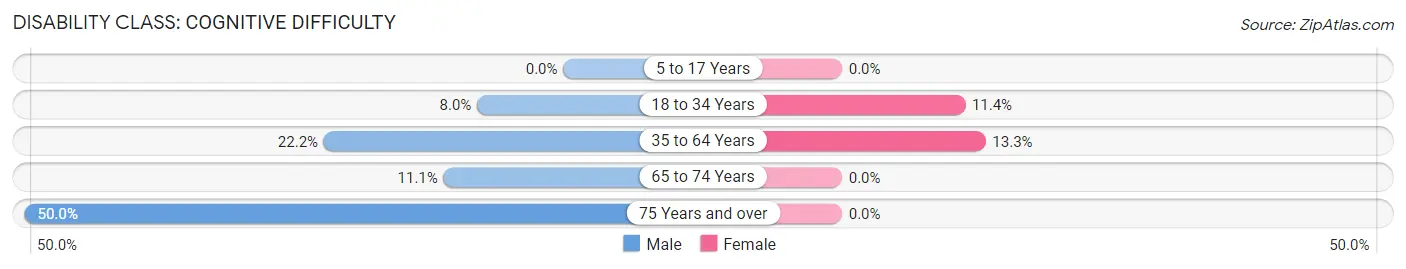
| Age Bracket | Male | Female |
| 5 to 17 Years | 0 (0.0%) | 0 (0.0%) |
| 18 to 34 Years | 2 (8.0%) | 4 (11.4%) |
| 35 to 64 Years | 8 (22.2%) | 6 (13.3%) |
| 65 to 74 Years | 1 (11.1%) | 0 (0.0%) |
| 75 Years and over | 1 (50.0%) | 0 (0.0%) |
Disability Class: Ambulatory Difficulty
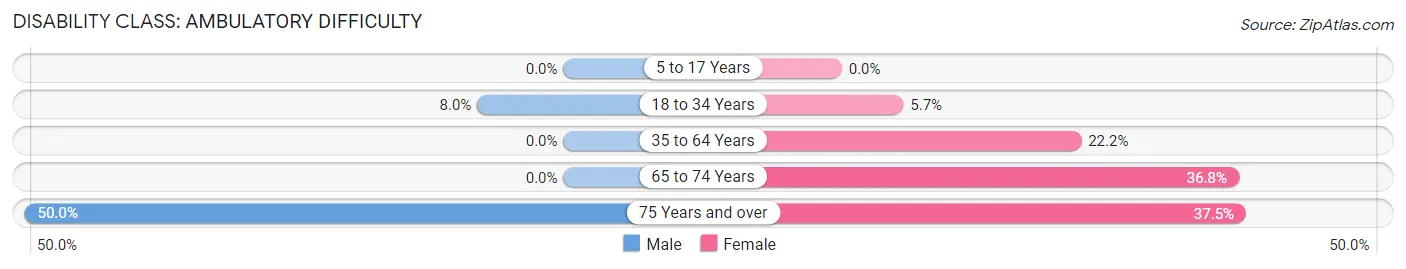
| Age Bracket | Male | Female |
| 5 to 17 Years | 0 (0.0%) | 0 (0.0%) |
| 18 to 34 Years | 2 (8.0%) | 2 (5.7%) |
| 35 to 64 Years | 0 (0.0%) | 10 (22.2%) |
| 65 to 74 Years | 0 (0.0%) | 7 (36.8%) |
| 75 Years and over | 1 (50.0%) | 3 (37.5%) |
Disability Class: Self-Care Difficulty
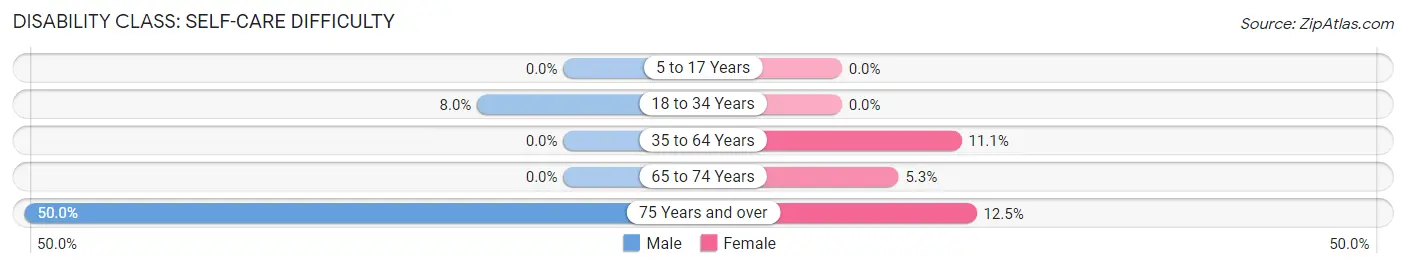
| Age Bracket | Male | Female |
| 5 to 17 Years | 0 (0.0%) | 0 (0.0%) |
| 18 to 34 Years | 2 (8.0%) | 0 (0.0%) |
| 35 to 64 Years | 0 (0.0%) | 5 (11.1%) |
| 65 to 74 Years | 0 (0.0%) | 1 (5.3%) |
| 75 Years and over | 1 (50.0%) | 1 (12.5%) |
Technology Access in Applegate
Computing Device Access in Applegate
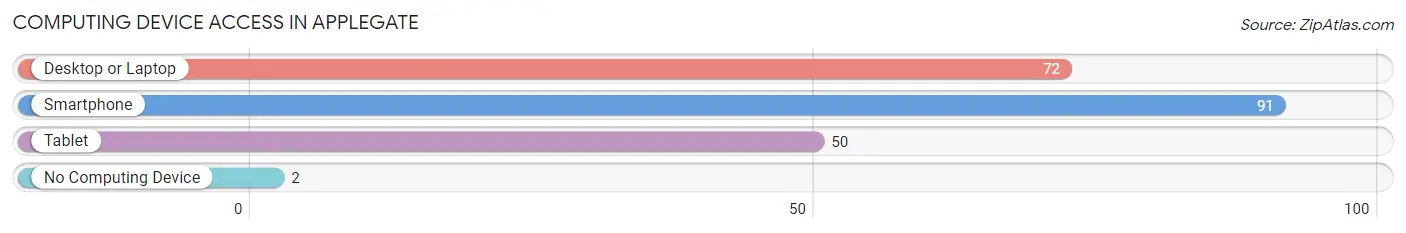
| Device Type | # Households | % Households |
| Desktop or Laptop | 72 | 72.7% |
| Smartphone | 91 | 91.9% |
| Tablet | 50 | 50.5% |
| No Computing Device | 2 | 2.0% |
| Total | 99 | 100.0% |
Internet Access in Applegate
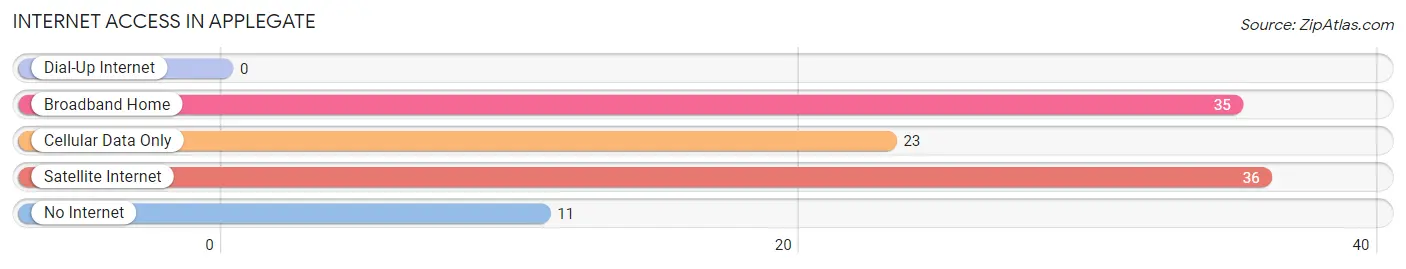
| Internet Type | # Households | % Households |
| Dial-Up Internet | 0 | 0.0% |
| Broadband Home | 35 | 35.3% |
| Cellular Data Only | 23 | 23.2% |
| Satellite Internet | 36 | 36.4% |
| No Internet | 11 | 11.1% |
| Total | 99 | 100.0% |
Applegate Summary
Applegate is a small unincorporated community located in the Upper Peninsula of Michigan. It is situated in the western part of the state, in the county of Menominee. The community is located on the banks of the Menominee River, and is surrounded by the towns of Powers, Carney, and Hermansville. Applegate is a rural community with a population of approximately 500 people.
History
Applegate was first settled in the late 1800s by a group of Finnish immigrants. The town was named after the Applegate family, who were among the first settlers. The Applegate family was originally from England, and had moved to the United States in the early 1800s. The family settled in the Upper Peninsula of Michigan, and eventually established a homestead in Applegate.
The town of Applegate was officially incorporated in 1891. At the time, the town was primarily a logging and farming community. The town was also home to a number of small businesses, including a general store, a blacksmith shop, and a sawmill.
In the early 1900s, Applegate began to experience a period of growth. The town was home to a number of new businesses, including a hotel, a bank, and a movie theater. The town also had a number of churches, including a Methodist church, a Lutheran church, and a Catholic church.
Geography
Applegate is located in the western part of the Upper Peninsula of Michigan. The town is situated on the banks of the Menominee River, and is surrounded by the towns of Powers, Carney, and Hermansville. The town is located approximately 30 miles north of Escanaba, and is approximately 40 miles south of Iron Mountain.
The town of Applegate is located in a rural area, and is surrounded by forests and farmland. The town is located in a hilly region, and is home to a number of small lakes and streams. The town is also home to a number of small parks, including Applegate Park and Applegate Lake Park.
Economy
The economy of Applegate is primarily based on agriculture and forestry. The town is home to a number of small farms, and is also home to a number of logging companies. The town is also home to a number of small businesses, including a general store, a hardware store, and a restaurant.
The town of Applegate is also home to a number of small manufacturing companies. The town is home to a number of small machine shops, and is also home to a number of small woodworking companies. The town is also home to a number of small construction companies.
Demographics
As of the 2010 census, the population of Applegate was approximately 500 people. The town is primarily a white community, with approximately 95% of the population being white. The town is also home to a small number of Native American residents, with approximately 5% of the population being Native American.
The town of Applegate is home to a number of small churches, including a Methodist church, a Lutheran church, and a Catholic church. The town is also home to a number of small businesses, including a general store, a hardware store, and a restaurant. The town is also home to a number of small parks, including Applegate Park and Applegate Lake Park.
Common Questions
What is Per Capita Income in Applegate?
Per Capita income in Applegate is $24,994.
What is the Median Family Income in Applegate?
Median Family Income in Applegate is $54,250.
What is the Median Household income in Applegate?
Median Household Income in Applegate is $60,417.
What is Income or Wage Gap in Applegate?
Income or Wage Gap in Applegate is 34.0%.
Women in Applegate earn 66.0 cents for every dollar earned by a man.
What is Inequality or Gini Index in Applegate?
Inequality or Gini Index in Applegate is 0.33.
What is the Total Population of Applegate?
Total Population of Applegate is 233.
What is the Total Male Population of Applegate?
Total Male Population of Applegate is 116.
What is the Total Female Population of Applegate?
Total Female Population of Applegate is 117.
What is the Ratio of Males per 100 Females in Applegate?
There are 99.15 Males per 100 Females in Applegate.
What is the Ratio of Females per 100 Males in Applegate?
There are 100.86 Females per 100 Males in Applegate.
What is the Median Population Age in Applegate?
Median Population Age in Applegate is 38.1 Years.
What is the Average Family Size in Applegate
Average Family Size in Applegate is 2.9 People.
What is the Average Household Size in Applegate
Average Household Size in Applegate is 2.4 People.
How Large is the Labor Force in Applegate?
There are 126 People in the Labor Forcein in Applegate.
What is the Percentage of People in the Labor Force in Applegate?
68.9% of People are in the Labor Force in Applegate.
What is the Unemployment Rate in Applegate?
Unemployment Rate in Applegate is 8.7%.