Alpha, MI Map & Demographics
Alpha Map
Alpha Overview
$25,415
PER CAPITA INCOME
$61,250
AVG FAMILY INCOME
$36,417
AVG HOUSEHOLD INCOME
43.3%
WAGE / INCOME GAP [ % ]
56.7¢/ $1
WAGE / INCOME GAP [ $ ]
0.37
INEQUALITY / GINI INDEX
210
TOTAL POPULATION
93
MALE POPULATION
117
FEMALE POPULATION
79.49
MALES / 100 FEMALES
125.81
FEMALES / 100 MALES
58.9
MEDIAN AGE
2.0
AVG FAMILY SIZE
1.7
AVG HOUSEHOLD SIZE
100
LABOR FORCE [ PEOPLE ]
49.5%
PERCENT IN LABOR FORCE
6.0%
UNEMPLOYMENT RATE
Alpha Zip Codes
Alpha Area Codes
Income in Alpha
Income Overview in Alpha
Per Capita Income in Alpha is $25,415, while median incomes of families and households are $61,250 and $36,417 respectively.
| Characteristic | Number | Measure |
| Per Capita Income | 210 | $25,415 |
| Median Family Income | 35 | $61,250 |
| Mean Family Income | 35 | $68,537 |
| Median Household Income | 122 | $36,417 |
| Mean Household Income | 122 | $42,778 |
| Income Deficit | 35 | $0 |
| Wage / Income Gap (%) | 210 | 43.26% |
| Wage / Income Gap ($) | 210 | 56.74¢ per $1 |
| Gini / Inequality Index | 210 | 0.37 |
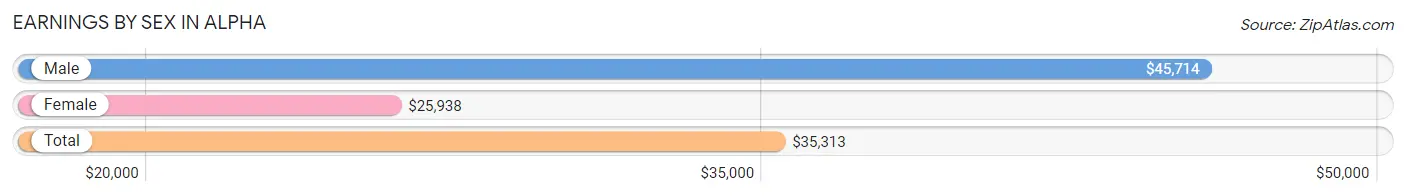
Earnings by Sex in Alpha
Average Earnings in Alpha are $35,313, $45,714 for men and $25,938 for women, a difference of 43.3%.
| Sex | Number | Average Earnings |
| Male | 42 (41.6%) | $45,714 |
| Female | 59 (58.4%) | $25,938 |
| Total | 101 (100.0%) | $35,313 |
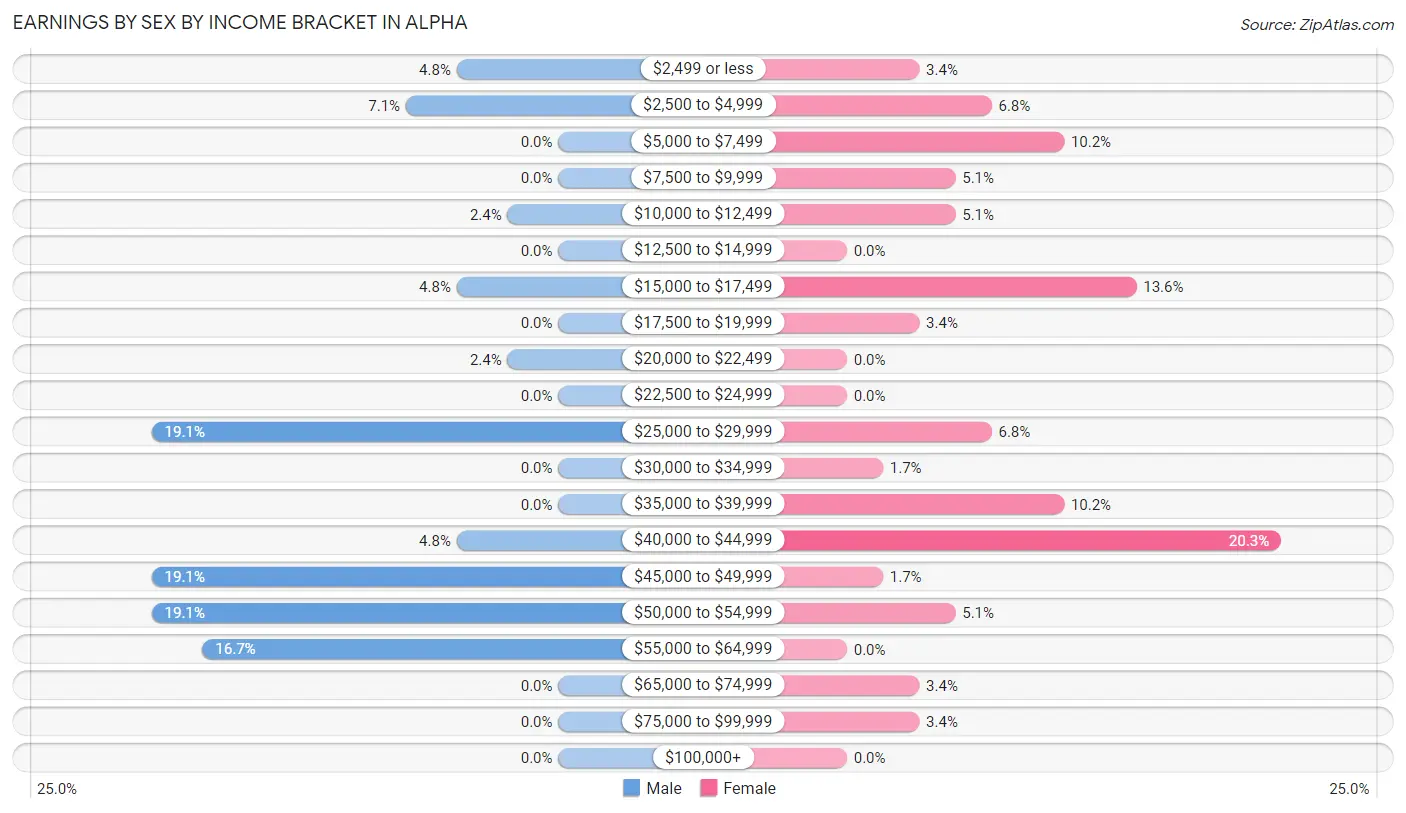
Earnings by Sex by Income Bracket in Alpha
The most common earnings brackets in Alpha are $25,000 to $29,999 for men (8 | 19.1%) and $40,000 to $44,999 for women (12 | 20.3%).
| Income | Male | Female |
| $2,499 or less | 2 (4.8%) | 2 (3.4%) |
| $2,500 to $4,999 | 3 (7.1%) | 4 (6.8%) |
| $5,000 to $7,499 | 0 (0.0%) | 6 (10.2%) |
| $7,500 to $9,999 | 0 (0.0%) | 3 (5.1%) |
| $10,000 to $12,499 | 1 (2.4%) | 3 (5.1%) |
| $12,500 to $14,999 | 0 (0.0%) | 0 (0.0%) |
| $15,000 to $17,499 | 2 (4.8%) | 8 (13.6%) |
| $17,500 to $19,999 | 0 (0.0%) | 2 (3.4%) |
| $20,000 to $22,499 | 1 (2.4%) | 0 (0.0%) |
| $22,500 to $24,999 | 0 (0.0%) | 0 (0.0%) |
| $25,000 to $29,999 | 8 (19.1%) | 4 (6.8%) |
| $30,000 to $34,999 | 0 (0.0%) | 1 (1.7%) |
| $35,000 to $39,999 | 0 (0.0%) | 6 (10.2%) |
| $40,000 to $44,999 | 2 (4.8%) | 12 (20.3%) |
| $45,000 to $49,999 | 8 (19.1%) | 1 (1.7%) |
| $50,000 to $54,999 | 8 (19.1%) | 3 (5.1%) |
| $55,000 to $64,999 | 7 (16.7%) | 0 (0.0%) |
| $65,000 to $74,999 | 0 (0.0%) | 2 (3.4%) |
| $75,000 to $99,999 | 0 (0.0%) | 2 (3.4%) |
| $100,000+ | 0 (0.0%) | 0 (0.0%) |
| Total | 42 (100.0%) | 59 (100.0%) |
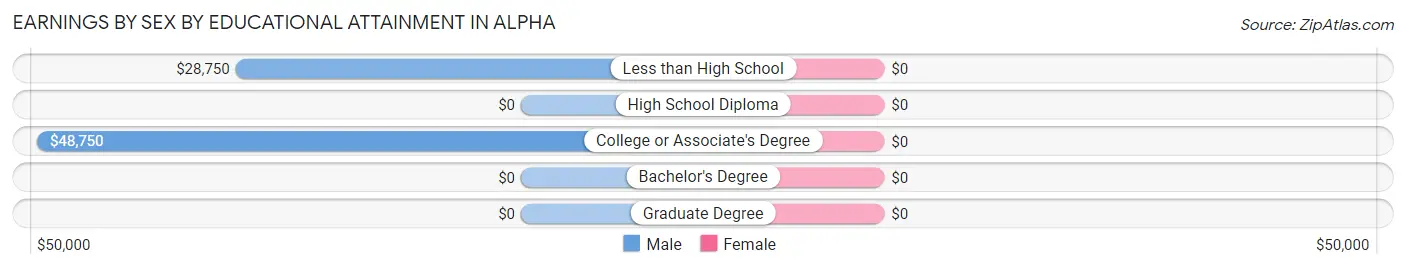
Earnings by Sex by Educational Attainment in Alpha
| Educational Attainment | Male Income | Female Income |
| Less than High School | $28,750 | $0 |
| High School Diploma | - | - |
| College or Associate's Degree | $48,750 | $0 |
| Bachelor's Degree | - | - |
| Graduate Degree | - | - |
| Total | $46,071 | $25,938 |
Family Income in Alpha
Family Income Brackets in Alpha
According to the Alpha family income data, there are 13 families falling into the $35,000 to $49,999 income range, which is the most common income bracket and makes up 37.1% of all families.
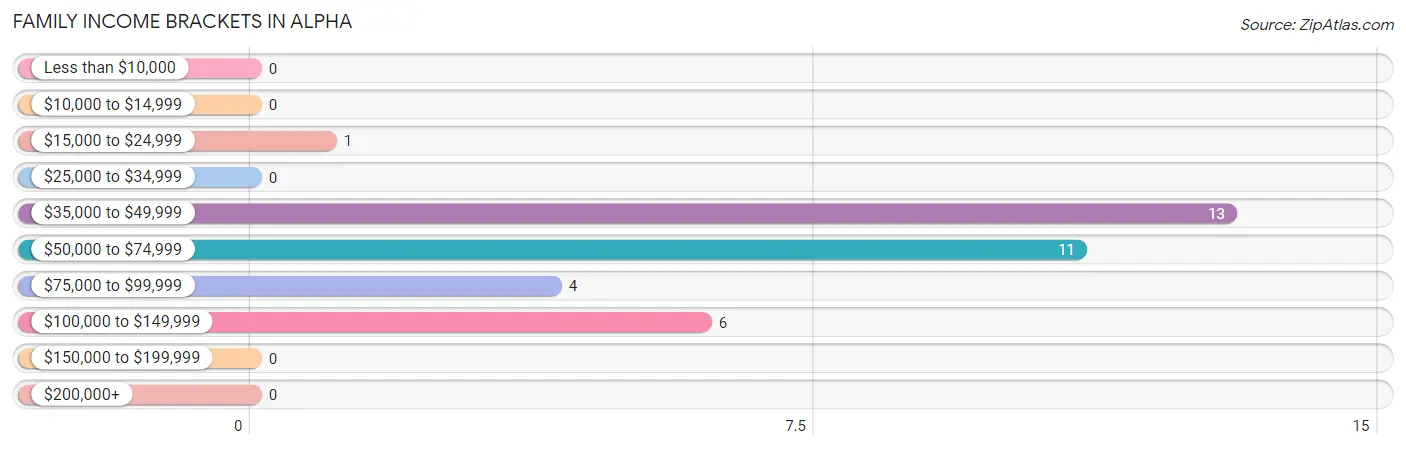
| Income Bracket | # Families | % Families |
| Less than $10,000 | 0 | 0.0% |
| $10,000 to $14,999 | 0 | 0.0% |
| $15,000 to $24,999 | 1 | 2.9% |
| $25,000 to $34,999 | 0 | 0.0% |
| $35,000 to $49,999 | 13 | 37.1% |
| $50,000 to $74,999 | 11 | 31.4% |
| $75,000 to $99,999 | 4 | 11.4% |
| $100,000 to $149,999 | 6 | 17.1% |
| $150,000 to $199,999 | 0 | 0.0% |
| $200,000+ | 0 | 0.0% |
Family Income by Famaliy Size in Alpha
2-person families (31 | 88.6%) account for the highest median family income in Alpha with $60,536 per family, while 2-person families (31 | 88.6%) have the highest median income of $30,268 per family member.
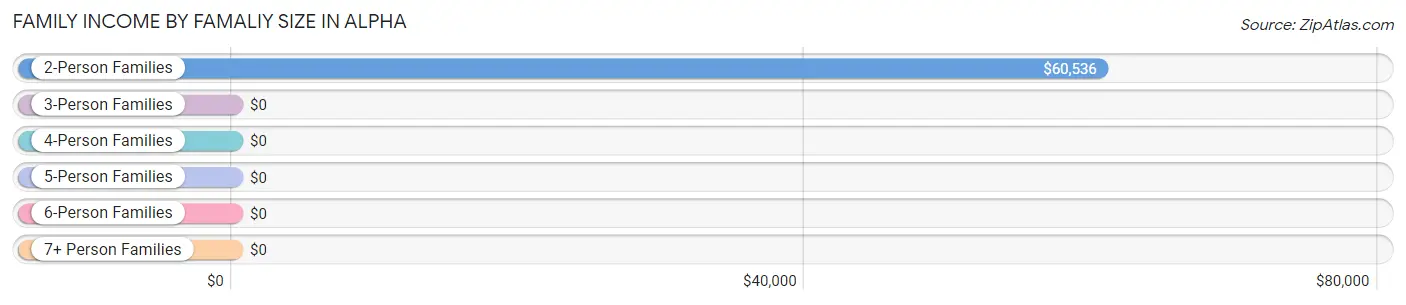
| Income Bracket | # Families | Median Income |
| 2-Person Families | 31 (88.6%) | $60,536 |
| 3-Person Families | 2 (5.7%) | $0 |
| 4-Person Families | 2 (5.7%) | $0 |
| 5-Person Families | 0 (0.0%) | $0 |
| 6-Person Families | 0 (0.0%) | $0 |
| 7+ Person Families | 0 (0.0%) | $0 |
| Total | 35 (100.0%) | $61,250 |
Family Income by Number of Earners in Alpha
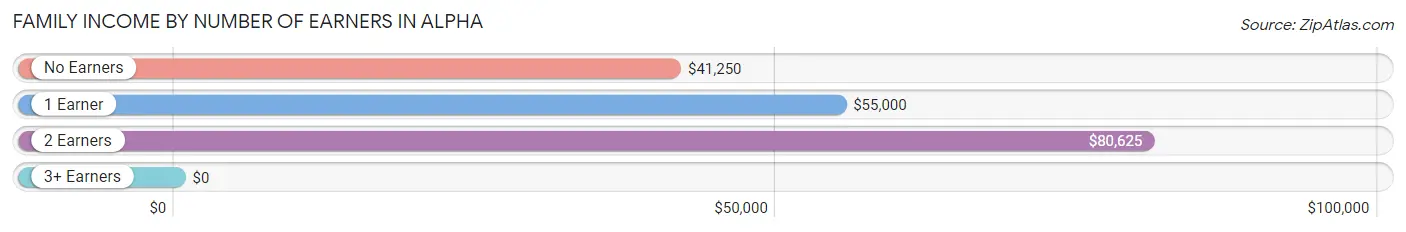
| Number of Earners | # Families | Median Income |
| No Earners | 4 (11.4%) | $41,250 |
| 1 Earner | 18 (51.4%) | $55,000 |
| 2 Earners | 11 (31.4%) | $80,625 |
| 3+ Earners | 2 (5.7%) | $0 |
| Total | 35 (100.0%) | $61,250 |
Household Income in Alpha
Household Income Brackets in Alpha
With 44 households falling in the category, the $35,000 to $49,999 income range is the most frequent in Alpha, accounting for 36.1% of all households.
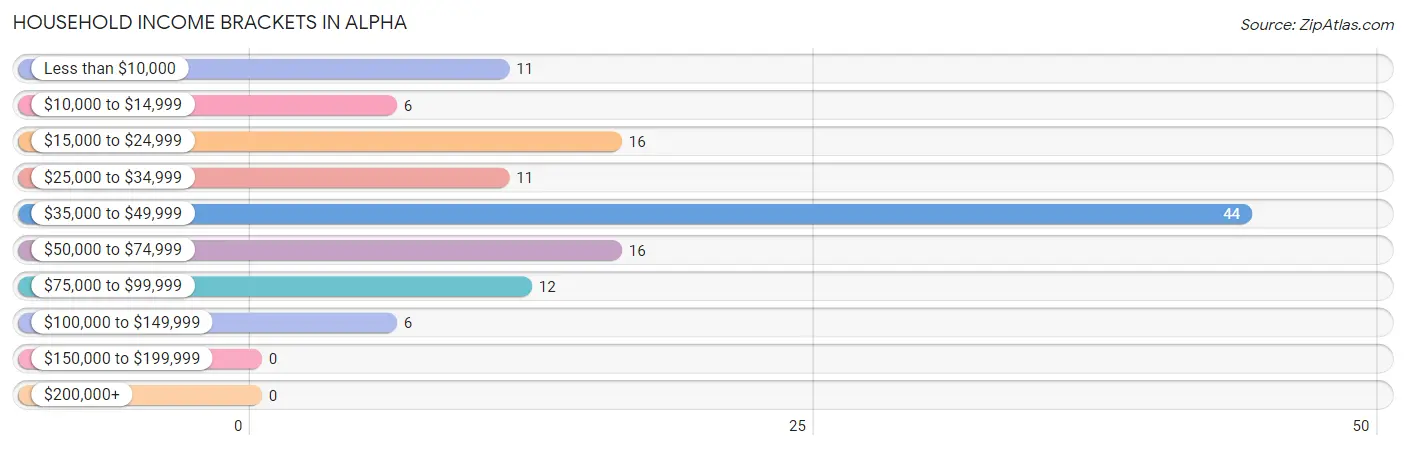
| Income Bracket | # Households | % Households |
| Less than $10,000 | 11 | 9.0% |
| $10,000 to $14,999 | 6 | 4.9% |
| $15,000 to $24,999 | 16 | 13.1% |
| $25,000 to $34,999 | 11 | 9.0% |
| $35,000 to $49,999 | 44 | 36.1% |
| $50,000 to $74,999 | 16 | 13.1% |
| $75,000 to $99,999 | 12 | 9.8% |
| $100,000 to $149,999 | 6 | 4.9% |
| $150,000 to $199,999 | 0 | 0.0% |
| $200,000+ | 0 | 0.0% |
Household Income by Householder Age in Alpha
The median household income in Alpha is $36,417, with the highest median household income of $61,429 found in the 25 to 44 years age bracket for the primary householder. A total of 28 households (23.0%) fall into this category. Meanwhile, the 15 to 24 years age bracket for the primary householder has the lowest median household income of $0, with 3 households (2.5%) in this group.
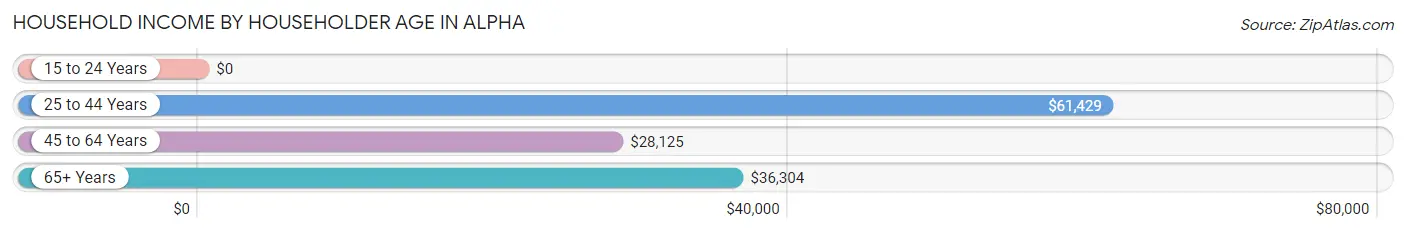
| Income Bracket | # Households | Median Income |
| 15 to 24 Years | 3 (2.5%) | $0 |
| 25 to 44 Years | 28 (23.0%) | $61,429 |
| 45 to 64 Years | 29 (23.8%) | $28,125 |
| 65+ Years | 62 (50.8%) | $36,304 |
| Total | 122 (100.0%) | $36,417 |
Poverty in Alpha
Income Below Poverty by Sex and Age in Alpha
With 7.5% poverty level for males and 31.6% for females among the residents of Alpha, 45 to 54 year old males and 45 to 54 year old females are the most vulnerable to poverty, with 3 males (27.3%) and 10 females (76.9%) in their respective age groups living below the poverty level.
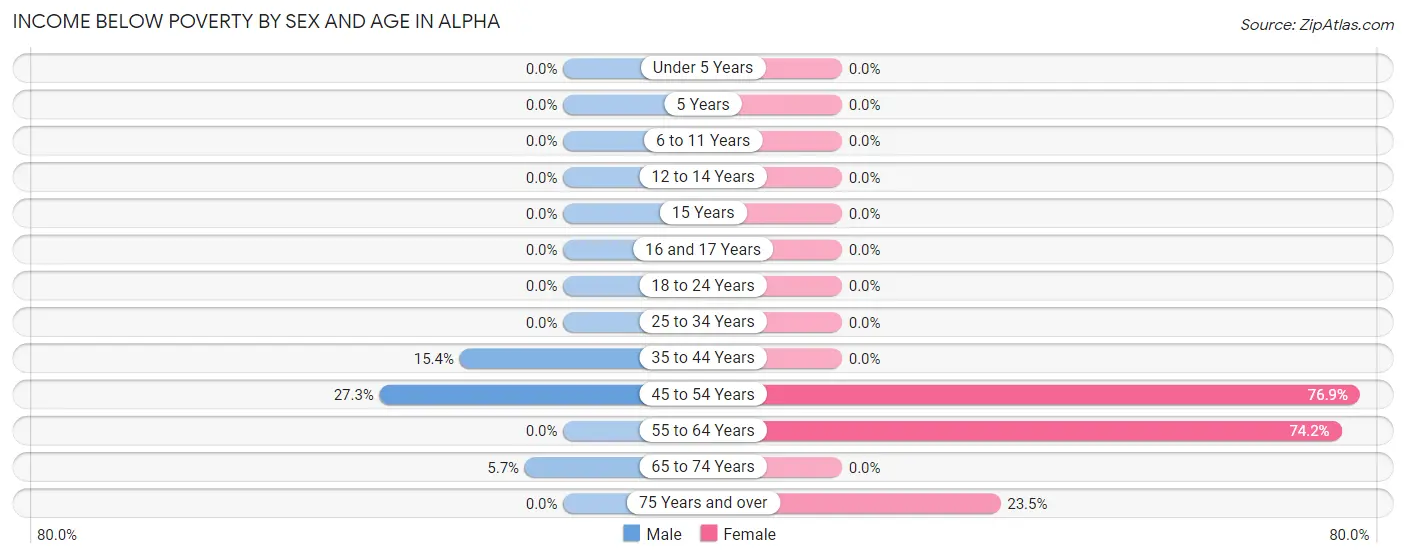
| Age Bracket | Male | Female |
| Under 5 Years | 0 (0.0%) | 0 (0.0%) |
| 5 Years | 0 (0.0%) | 0 (0.0%) |
| 6 to 11 Years | 0 (0.0%) | 0 (0.0%) |
| 12 to 14 Years | 0 (0.0%) | 0 (0.0%) |
| 15 Years | 0 (0.0%) | 0 (0.0%) |
| 16 and 17 Years | 0 (0.0%) | 0 (0.0%) |
| 18 to 24 Years | 0 (0.0%) | 0 (0.0%) |
| 25 to 34 Years | 0 (0.0%) | 0 (0.0%) |
| 35 to 44 Years | 2 (15.4%) | 0 (0.0%) |
| 45 to 54 Years | 3 (27.3%) | 10 (76.9%) |
| 55 to 64 Years | 0 (0.0%) | 23 (74.2%) |
| 65 to 74 Years | 2 (5.7%) | 0 (0.0%) |
| 75 Years and over | 0 (0.0%) | 4 (23.5%) |
| Total | 7 (7.5%) | 37 (31.6%) |
Income Above Poverty by Sex and Age in Alpha
According to the poverty statistics in Alpha, males aged under 5 years and females aged 6 to 11 years are the age groups that are most secure financially, with 100.0% of males and 100.0% of females in these age groups living above the poverty line.
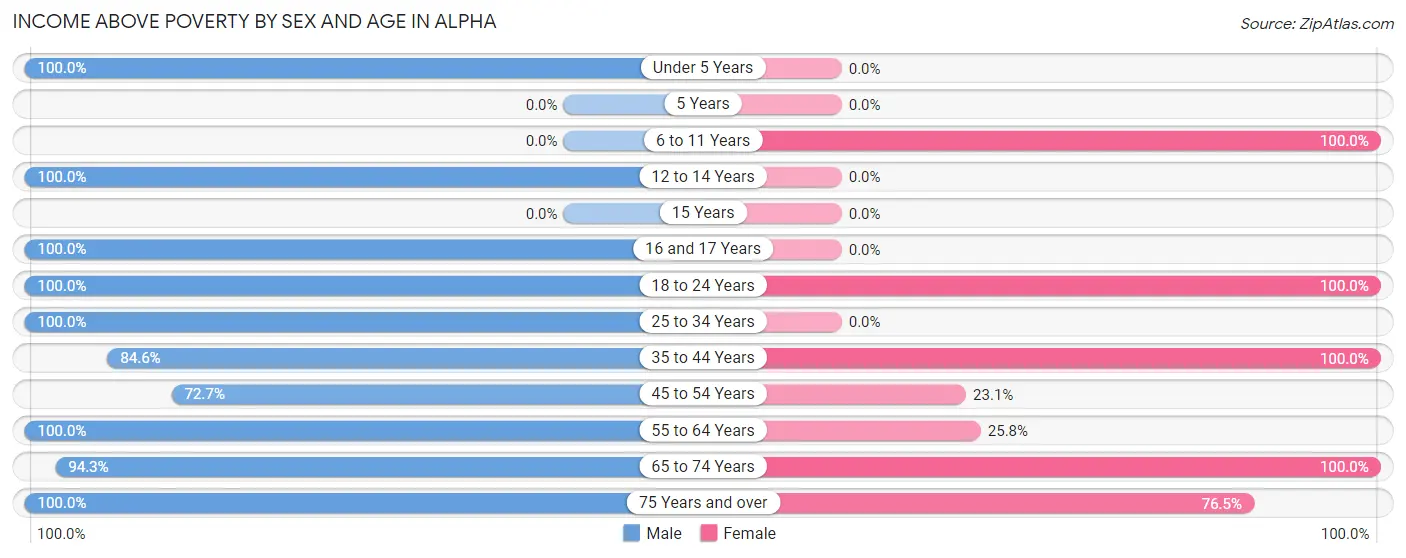
| Age Bracket | Male | Female |
| Under 5 Years | 3 (100.0%) | 0 (0.0%) |
| 5 Years | 0 (0.0%) | 0 (0.0%) |
| 6 to 11 Years | 0 (0.0%) | 2 (100.0%) |
| 12 to 14 Years | 3 (100.0%) | 0 (0.0%) |
| 15 Years | 0 (0.0%) | 0 (0.0%) |
| 16 and 17 Years | 1 (100.0%) | 0 (0.0%) |
| 18 to 24 Years | 3 (100.0%) | 20 (100.0%) |
| 25 to 34 Years | 10 (100.0%) | 0 (0.0%) |
| 35 to 44 Years | 11 (84.6%) | 18 (100.0%) |
| 45 to 54 Years | 8 (72.7%) | 3 (23.1%) |
| 55 to 64 Years | 8 (100.0%) | 8 (25.8%) |
| 65 to 74 Years | 33 (94.3%) | 16 (100.0%) |
| 75 Years and over | 6 (100.0%) | 13 (76.5%) |
| Total | 86 (92.5%) | 80 (68.4%) |
Income Below Poverty Among Married-Couple Families in Alpha
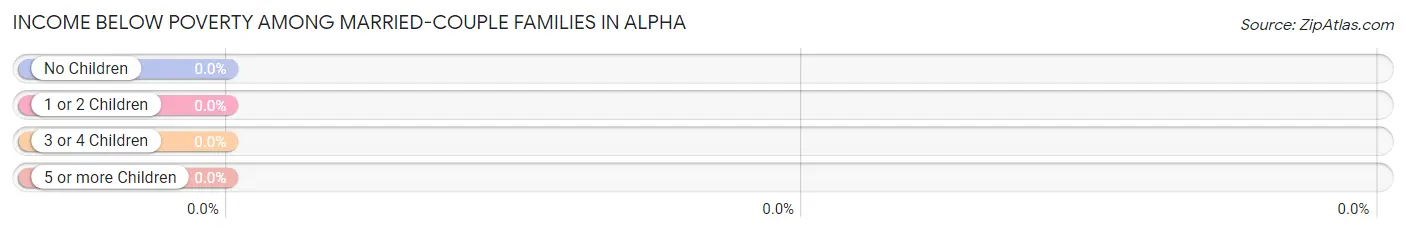
| Children | Above Poverty | Below Poverty |
| No Children | 19 (100.0%) | 0 (0.0%) |
| 1 or 2 Children | 4 (100.0%) | 0 (0.0%) |
| 3 or 4 Children | 0 (0.0%) | 0 (0.0%) |
| 5 or more Children | 0 (0.0%) | 0 (0.0%) |
| Total | 23 (100.0%) | 0 (0.0%) |
Income Below Poverty Among Single-Parent Households in Alpha
| Children | Single Father | Single Mother |
| No Children | 0 (0.0%) | 0 (0.0%) |
| 1 or 2 Children | 0 (0.0%) | 0 (0.0%) |
| 3 or 4 Children | 0 (0.0%) | 0 (0.0%) |
| 5 or more Children | 0 (0.0%) | 0 (0.0%) |
| Total | 0 (0.0%) | 0 (0.0%) |
Income Below Poverty Among Married-Couple vs Single-Parent Households in Alpha
| Children | Married-Couple Families | Single-Parent Households |
| No Children | 0 (0.0%) | 0 (0.0%) |
| 1 or 2 Children | 0 (0.0%) | 0 (0.0%) |
| 3 or 4 Children | 0 (0.0%) | 0 (0.0%) |
| 5 or more Children | 0 (0.0%) | 0 (0.0%) |
| Total | 0 (0.0%) | 0 (0.0%) |
Race in Alpha
The most populous races in Alpha are White / Caucasian (192 | 91.4%), Native / Alaskan (13 | 6.2%), and Two or more Races (5 | 2.4%).
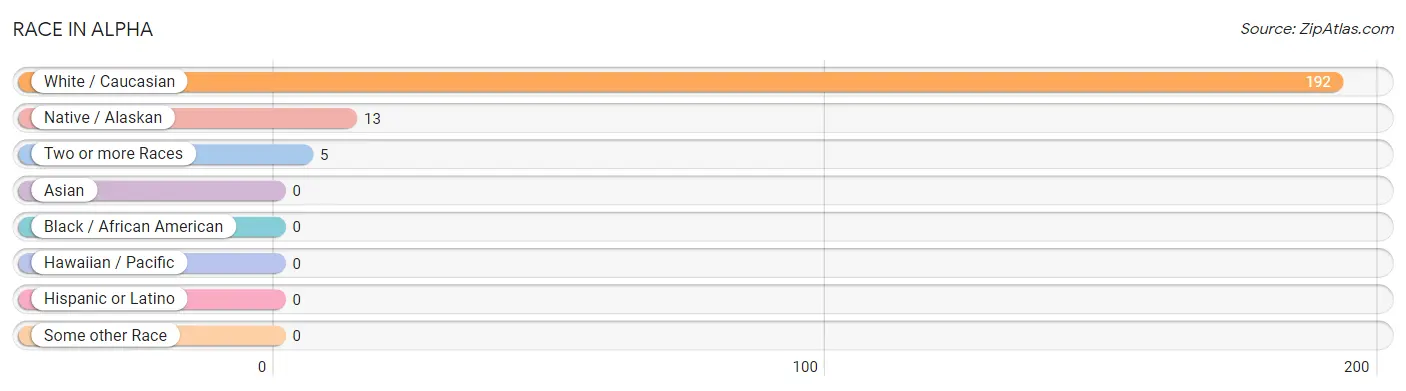
| Race | # Population | % Population |
| Asian | 0 | 0.0% |
| Black / African American | 0 | 0.0% |
| Hawaiian / Pacific | 0 | 0.0% |
| Hispanic or Latino | 0 | 0.0% |
| Native / Alaskan | 13 | 6.2% |
| White / Caucasian | 192 | 91.4% |
| Two or more Races | 5 | 2.4% |
| Some other Race | 0 | 0.0% |
| Total | 210 | 100.0% |
Ancestry in Alpha
The most populous ancestries reported in Alpha are German (60 | 28.6%), Irish (47 | 22.4%), Polish (42 | 20.0%), Finnish (17 | 8.1%), and English (13 | 6.2%), together accounting for 85.2% of all Alpha residents.
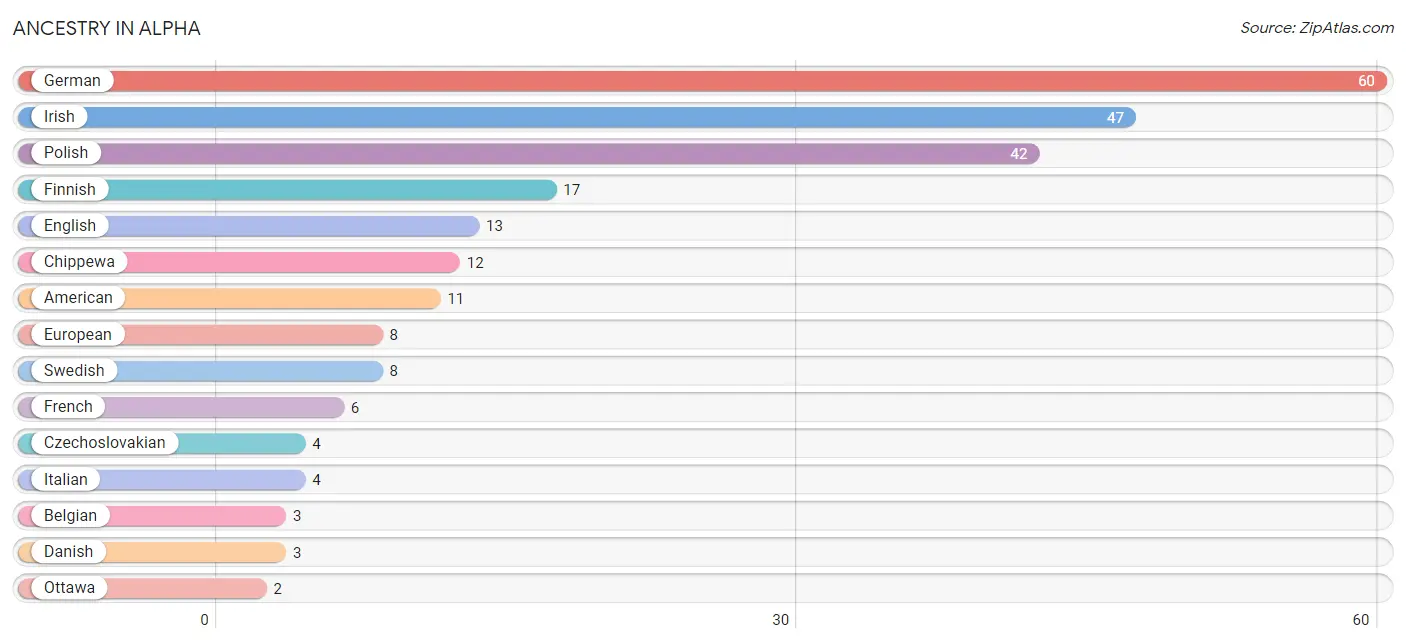
| Ancestry | # Population | % Population |
| American | 11 | 5.2% |
| Belgian | 3 | 1.4% |
| Chippewa | 12 | 5.7% |
| Czechoslovakian | 4 | 1.9% |
| Danish | 3 | 1.4% |
| English | 13 | 6.2% |
| European | 8 | 3.8% |
| Finnish | 17 | 8.1% |
| French | 6 | 2.9% |
| French Canadian | 1 | 0.5% |
| German | 60 | 28.6% |
| Irish | 47 | 22.4% |
| Italian | 4 | 1.9% |
| Norwegian | 1 | 0.5% |
| Ottawa | 2 | 0.9% |
| Polish | 42 | 20.0% |
| Scottish | 2 | 0.9% |
| Slavic | 1 | 0.5% |
| Swedish | 8 | 3.8% | View All 19 Rows |
Immigrants in Alpha

| Immigration Origin | # Population | % Population | View All 0 Rows |
Sex and Age in Alpha
Sex and Age in Alpha
The most populous age groups in Alpha are 65 to 69 Years (35 | 37.6%) for men and 60 to 64 Years (27 | 23.1%) for women.
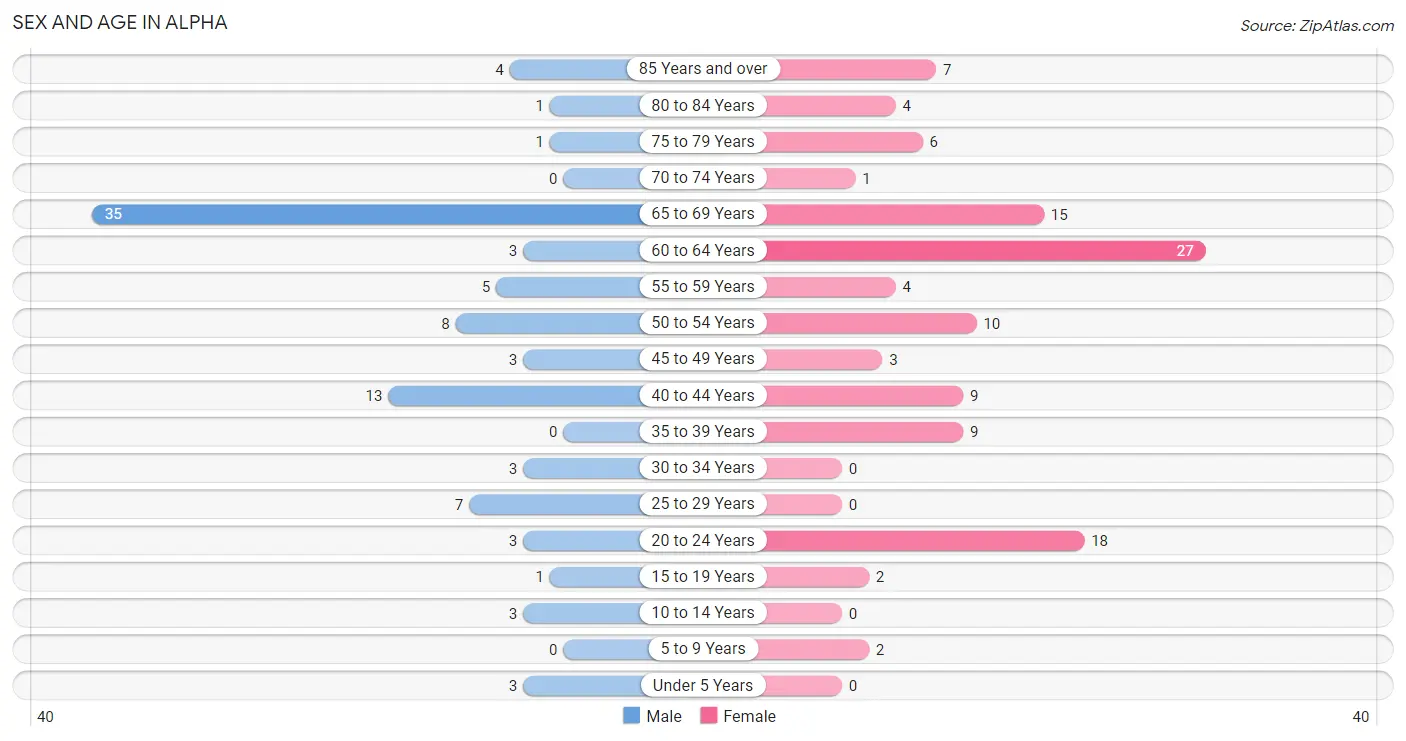
| Age Bracket | Male | Female |
| Under 5 Years | 3 (3.2%) | 0 (0.0%) |
| 5 to 9 Years | 0 (0.0%) | 2 (1.7%) |
| 10 to 14 Years | 3 (3.2%) | 0 (0.0%) |
| 15 to 19 Years | 1 (1.1%) | 2 (1.7%) |
| 20 to 24 Years | 3 (3.2%) | 18 (15.4%) |
| 25 to 29 Years | 7 (7.5%) | 0 (0.0%) |
| 30 to 34 Years | 3 (3.2%) | 0 (0.0%) |
| 35 to 39 Years | 0 (0.0%) | 9 (7.7%) |
| 40 to 44 Years | 13 (14.0%) | 9 (7.7%) |
| 45 to 49 Years | 3 (3.2%) | 3 (2.6%) |
| 50 to 54 Years | 8 (8.6%) | 10 (8.6%) |
| 55 to 59 Years | 5 (5.4%) | 4 (3.4%) |
| 60 to 64 Years | 3 (3.2%) | 27 (23.1%) |
| 65 to 69 Years | 35 (37.6%) | 15 (12.8%) |
| 70 to 74 Years | 0 (0.0%) | 1 (0.9%) |
| 75 to 79 Years | 1 (1.1%) | 6 (5.1%) |
| 80 to 84 Years | 1 (1.1%) | 4 (3.4%) |
| 85 Years and over | 4 (4.3%) | 7 (6.0%) |
| Total | 93 (100.0%) | 117 (100.0%) |
Families and Households in Alpha
Median Family Size in Alpha
The median family size in Alpha is 2.03 persons per family, with single female/mother families (5 | 14.3%) accounting for the largest median family size of 3 persons per family. On the other hand, single male/father families (7 | 20.0%) represent the smallest median family size with 1.43 persons per family.
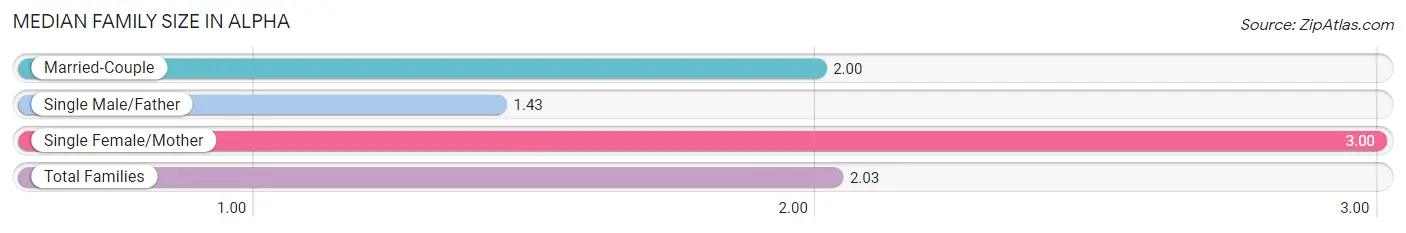
| Family Type | # Families | Family Size |
| Married-Couple | 23 (65.7%) | 2.00 |
| Single Male/Father | 7 (20.0%) | 1.43 |
| Single Female/Mother | 5 (14.3%) | 3.00 |
| Total Families | 35 (100.0%) | 2.03 |
Median Household Size in Alpha
The median household size in Alpha is 1.72 persons per household, with single female/mother households (5 | 4.1%) accounting for the largest median household size of 3.2 persons per household. non-family households (87 | 71.3%) represent the smallest median household size with 1.47 persons per household.
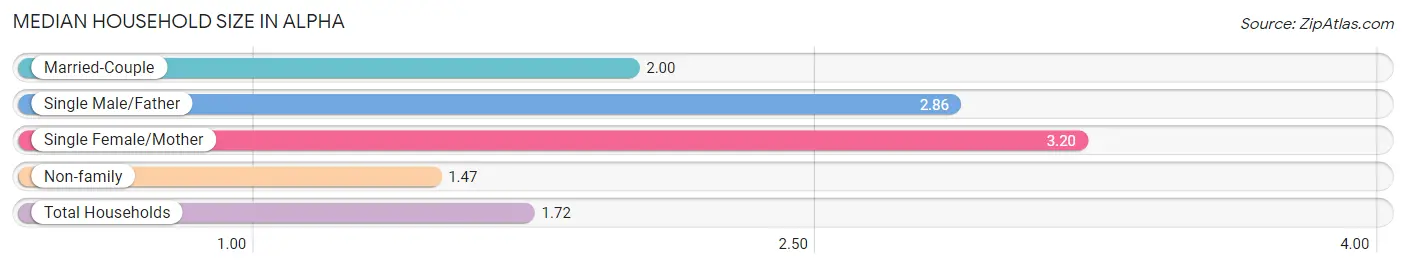
| Household Type | # Households | Household Size |
| Married-Couple | 23 (18.9%) | 2.00 |
| Single Male/Father | 7 (5.7%) | 2.86 |
| Single Female/Mother | 5 (4.1%) | 3.20 |
| Non-family | 87 (71.3%) | 1.47 |
| Total Households | 122 (100.0%) | 1.72 |
Household Size by Marriage Status in Alpha
Out of a total of 122 households in Alpha, 35 (28.7%) are family households, while 87 (71.3%) are nonfamily households. The most numerous type of family households are 2-person households, comprising 23, and the most common type of nonfamily households are 1-person households, comprising 52.
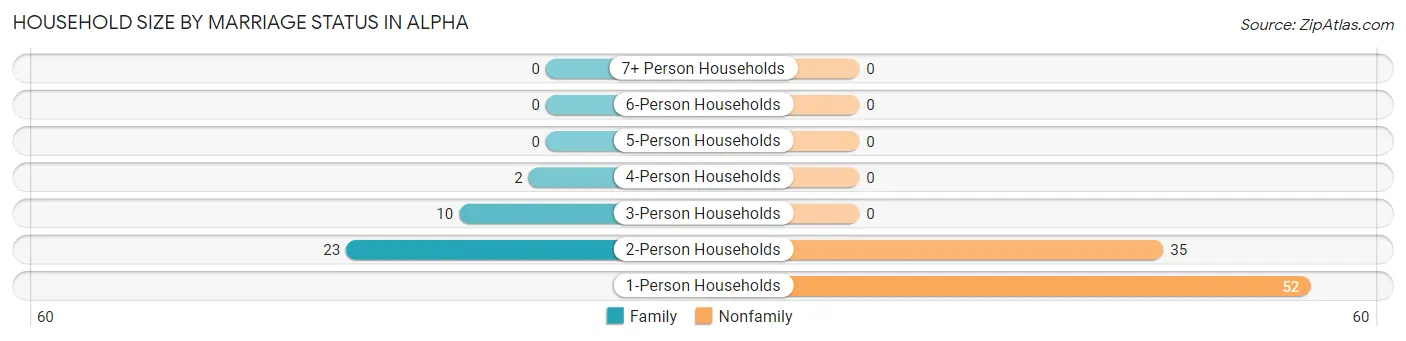
| Household Size | Family Households | Nonfamily Households |
| 1-Person Households | - | 52 (42.6%) |
| 2-Person Households | 23 (18.9%) | 35 (28.7%) |
| 3-Person Households | 10 (8.2%) | 0 (0.0%) |
| 4-Person Households | 2 (1.6%) | 0 (0.0%) |
| 5-Person Households | 0 (0.0%) | 0 (0.0%) |
| 6-Person Households | 0 (0.0%) | 0 (0.0%) |
| 7+ Person Households | 0 (0.0%) | 0 (0.0%) |
| Total | 35 (28.7%) | 87 (71.3%) |
Female Fertility in Alpha
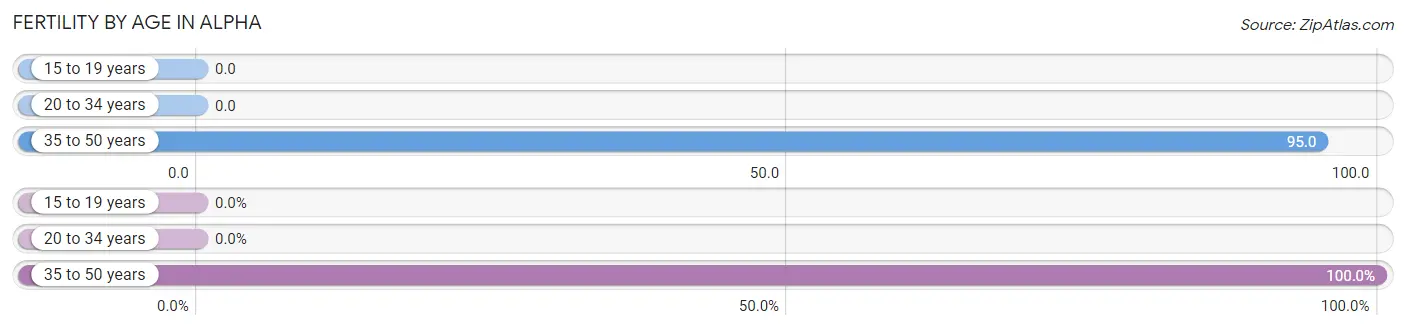
Fertility by Age in Alpha
Average fertility rate in Alpha is 49.0 births per 1,000 women. Women in the age bracket of 35 to 50 years have the highest fertility rate with 95.0 births per 1,000 women. Women in the age bracket of 35 to 50 years acount for 100.0% of all women with births.
| Age Bracket | Women with Births | Births / 1,000 Women |
| 15 to 19 years | 0 (0.0%) | 0.0 |
| 20 to 34 years | 0 (0.0%) | 0.0 |
| 35 to 50 years | 2 (100.0%) | 95.0 |
| Total | 2 (100.0%) | 49.0 |
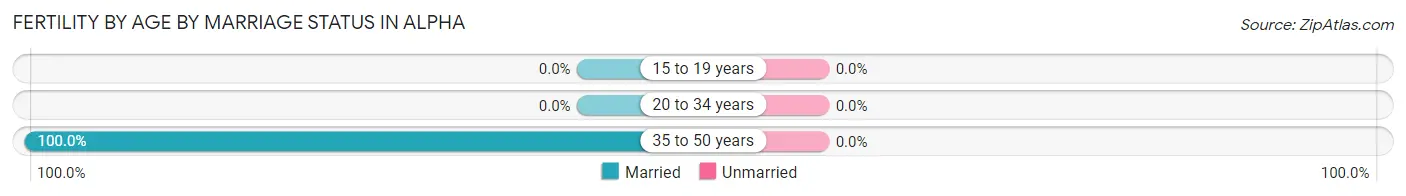
Fertility by Age by Marriage Status in Alpha
| Age Bracket | Married | Unmarried |
| 15 to 19 years | 0 (0.0%) | 0 (0.0%) |
| 20 to 34 years | 0 (0.0%) | 0 (0.0%) |
| 35 to 50 years | 2 (100.0%) | 0 (0.0%) |
| Total | 2 (100.0%) | 0 (0.0%) |
Fertility by Education in Alpha
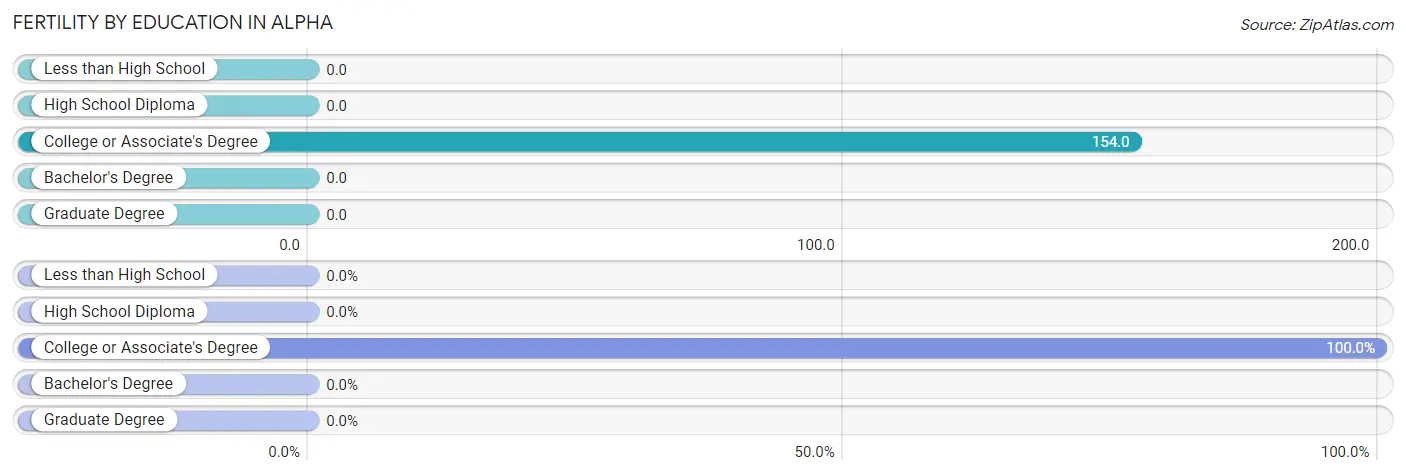
| Educational Attainment | Women with Births | Births / 1,000 Women |
| Less than High School | 0 (0.0%) | 0.0 |
| High School Diploma | 0 (0.0%) | 0.0 |
| College or Associate's Degree | 2 (100.0%) | 154.0 |
| Bachelor's Degree | 0 (0.0%) | 0.0 |
| Graduate Degree | 0 (0.0%) | 0.0 |
| Total | 2 (100.0%) | 49.0 |
Fertility by Education by Marriage Status in Alpha
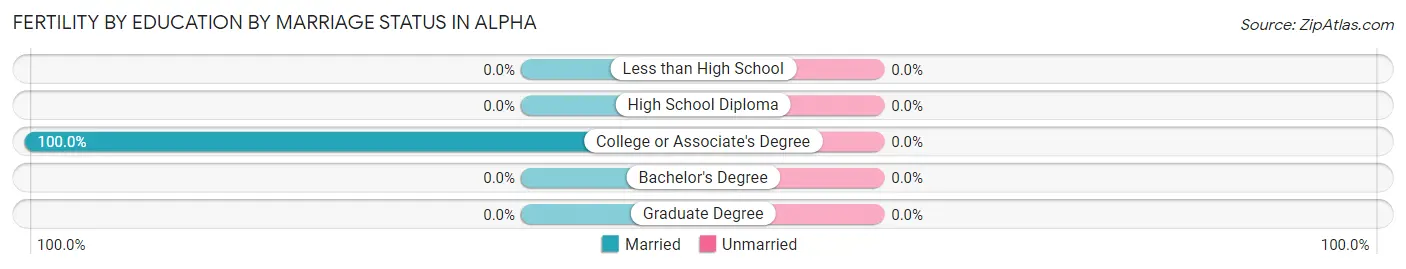
| Educational Attainment | Married | Unmarried |
| Less than High School | 0 (0.0%) | 0 (0.0%) |
| High School Diploma | 0 (0.0%) | 0 (0.0%) |
| College or Associate's Degree | 2 (100.0%) | 0 (0.0%) |
| Bachelor's Degree | 0 (0.0%) | 0 (0.0%) |
| Graduate Degree | 0 (0.0%) | 0 (0.0%) |
| Total | 2 (100.0%) | 0 (0.0%) |
Employment Characteristics in Alpha
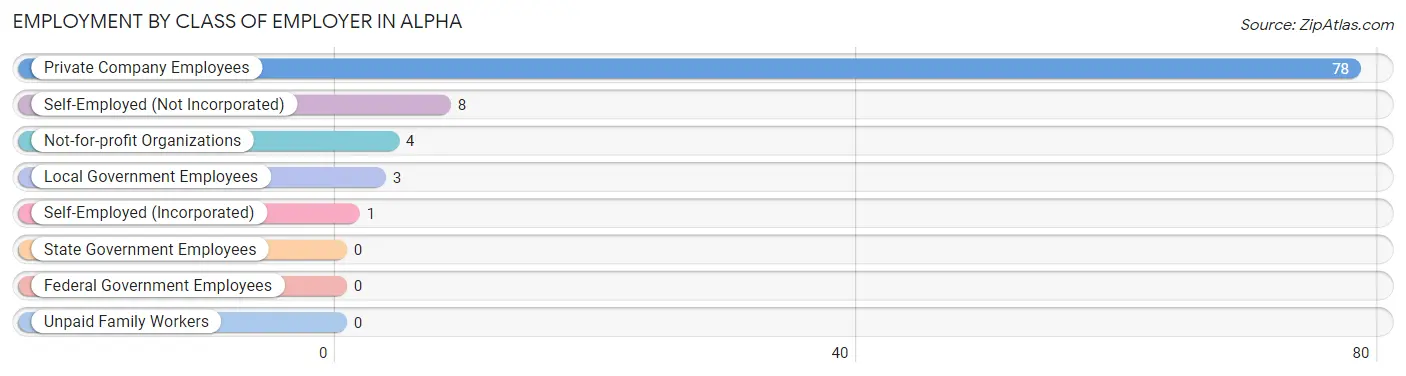
Employment by Class of Employer in Alpha
Among the 94 employed individuals in Alpha, private company employees (78 | 83.0%), self-employed (not incorporated) (8 | 8.5%), and not-for-profit organizations (4 | 4.3%) make up the most common classes of employment.
| Employer Class | # Employees | % Employees |
| Private Company Employees | 78 | 83.0% |
| Self-Employed (Incorporated) | 1 | 1.1% |
| Self-Employed (Not Incorporated) | 8 | 8.5% |
| Not-for-profit Organizations | 4 | 4.3% |
| Local Government Employees | 3 | 3.2% |
| State Government Employees | 0 | 0.0% |
| Federal Government Employees | 0 | 0.0% |
| Unpaid Family Workers | 0 | 0.0% |
| Total | 94 | 100.0% |
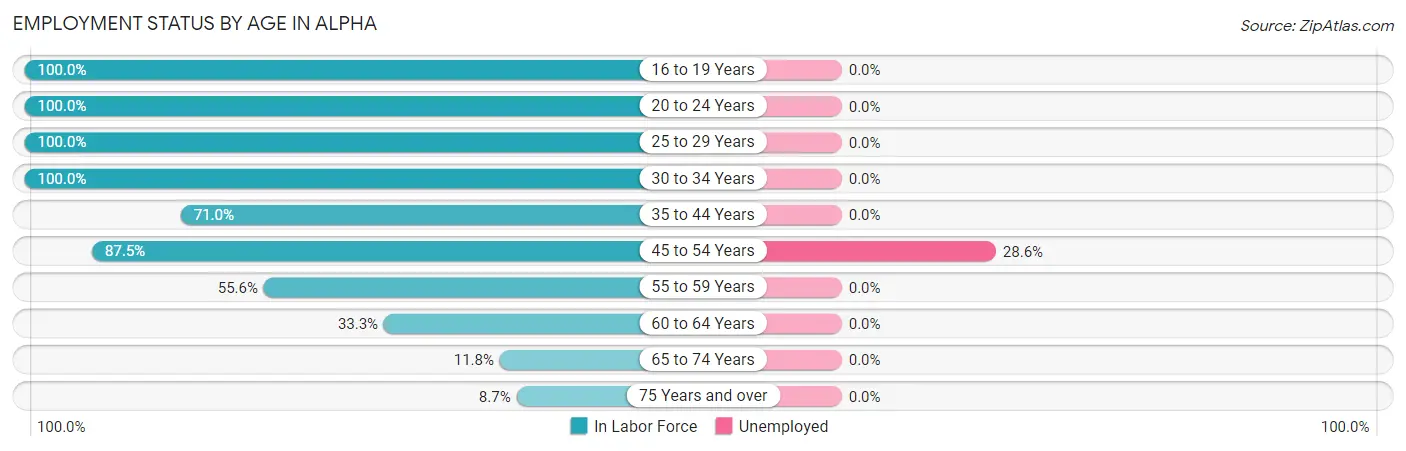
Employment Status by Age in Alpha
According to the labor force statistics for Alpha, out of the total population over 16 years of age (202), 49.5% or 100 individuals are in the labor force, with 6.0% or 6 of them unemployed. The age group with the highest labor force participation rate is 16 to 19 years, with 100.0% or 3 individuals in the labor force. Within the labor force, the 45 to 54 years age range has the highest percentage of unemployed individuals, with 28.6% or 6 of them being unemployed.
| Age Bracket | In Labor Force | Unemployed |
| 16 to 19 Years | 3 (100.0%) | 0 (0.0%) |
| 20 to 24 Years | 21 (100.0%) | 0 (0.0%) |
| 25 to 29 Years | 7 (100.0%) | 0 (0.0%) |
| 30 to 34 Years | 3 (100.0%) | 0 (0.0%) |
| 35 to 44 Years | 22 (71.0%) | 0 (0.0%) |
| 45 to 54 Years | 21 (87.5%) | 6 (28.6%) |
| 55 to 59 Years | 5 (55.6%) | 0 (0.0%) |
| 60 to 64 Years | 10 (33.3%) | 0 (0.0%) |
| 65 to 74 Years | 6 (11.8%) | 0 (0.0%) |
| 75 Years and over | 2 (8.7%) | 0 (0.0%) |
| Total | 100 (49.5%) | 6 (6.0%) |
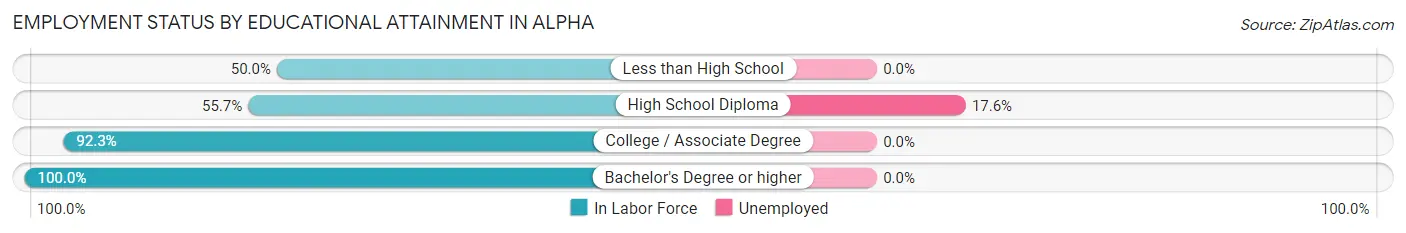
Employment Status by Educational Attainment in Alpha
According to labor force statistics for Alpha, 65.4% of individuals (68) out of the total population between 25 and 64 years of age (104) are in the labor force, with 8.8% or 6 of them being unemployed. The group with the highest labor force participation rate are those with the educational attainment of bachelor's degree or higher, with 100.0% or 3 individuals in the labor force. Within the labor force, individuals with high school diploma education have the highest percentage of unemployment, with 17.6% or 6 of them being unemployed.
| Educational Attainment | In Labor Force | Unemployed |
| Less than High School | 7 (50.0%) | 0 (0.0%) |
| High School Diploma | 34 (55.7%) | 11 (17.6%) |
| College / Associate Degree | 24 (92.3%) | 0 (0.0%) |
| Bachelor's Degree or higher | 3 (100.0%) | 0 (0.0%) |
| Total | 68 (65.4%) | 9 (8.8%) |
Employment Occupations by Sex in Alpha
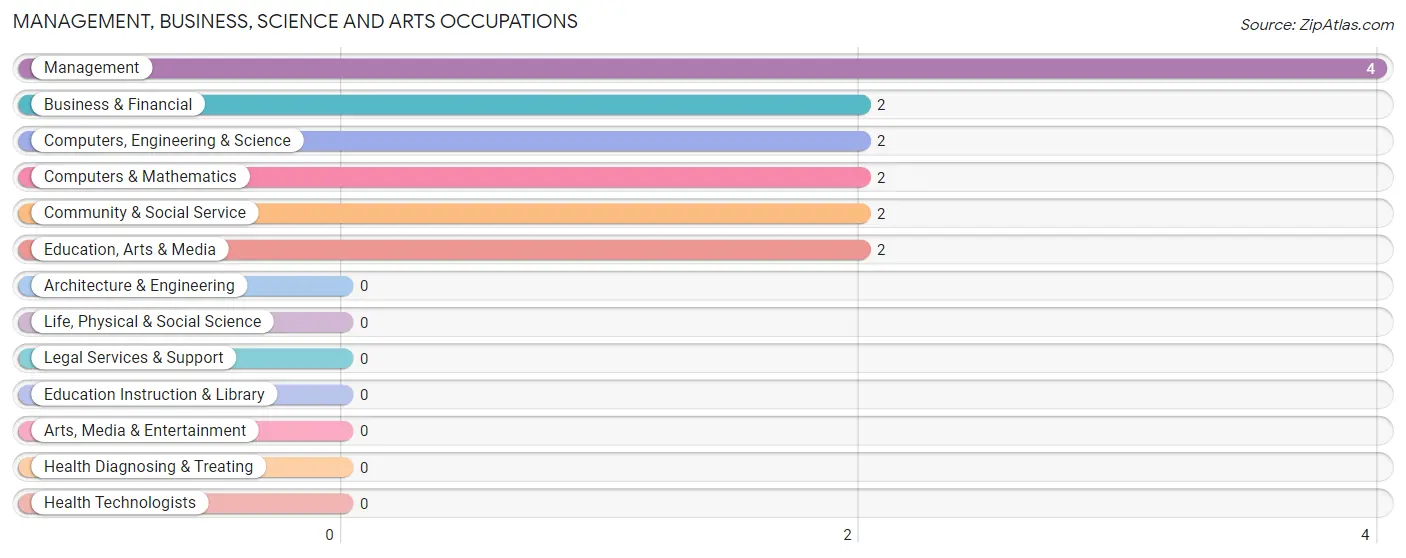
Management, Business, Science and Arts Occupations
The most common Management, Business, Science and Arts occupations in Alpha are Management (4 | 4.3%), Business & Financial (2 | 2.1%), Computers, Engineering & Science (2 | 2.1%), Computers & Mathematics (2 | 2.1%), and Community & Social Service (2 | 2.1%).
Management, Business, Science and Arts Occupations by Sex
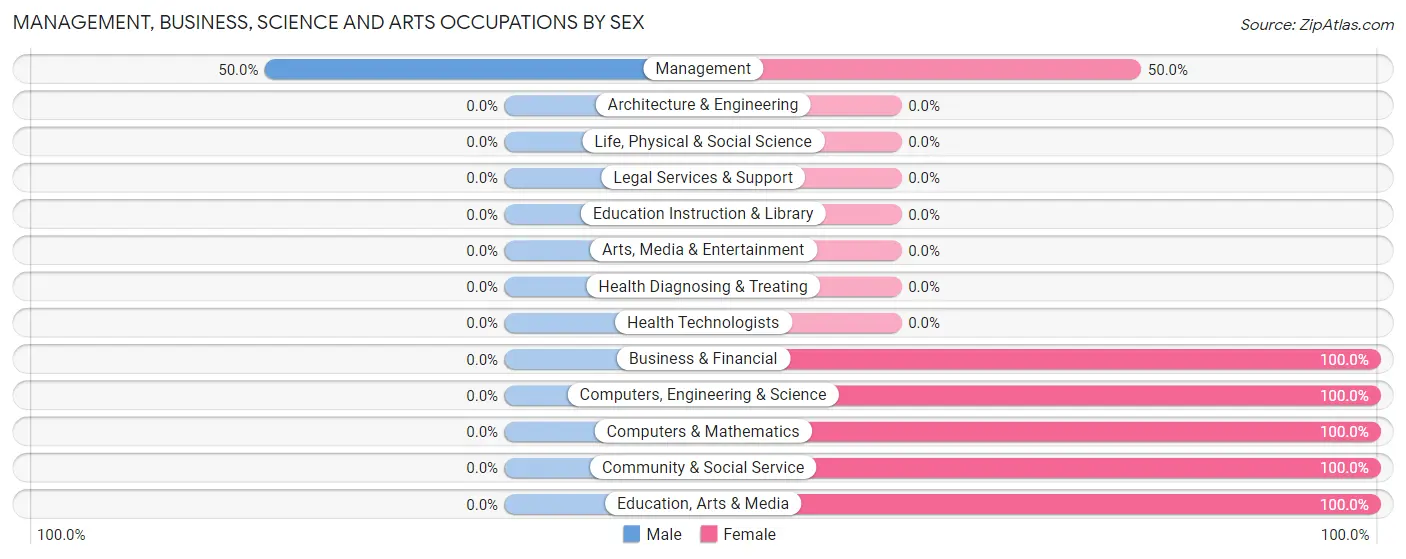
| Occupation | Male | Female |
| Management | 2 (50.0%) | 2 (50.0%) |
| Business & Financial | 0 (0.0%) | 2 (100.0%) |
| Computers, Engineering & Science | 0 (0.0%) | 2 (100.0%) |
| Computers & Mathematics | 0 (0.0%) | 2 (100.0%) |
| Architecture & Engineering | 0 (0.0%) | 0 (0.0%) |
| Life, Physical & Social Science | 0 (0.0%) | 0 (0.0%) |
| Community & Social Service | 0 (0.0%) | 2 (100.0%) |
| Education, Arts & Media | 0 (0.0%) | 2 (100.0%) |
| Legal Services & Support | 0 (0.0%) | 0 (0.0%) |
| Education Instruction & Library | 0 (0.0%) | 0 (0.0%) |
| Arts, Media & Entertainment | 0 (0.0%) | 0 (0.0%) |
| Health Diagnosing & Treating | 0 (0.0%) | 0 (0.0%) |
| Health Technologists | 0 (0.0%) | 0 (0.0%) |
| Total (Category) | 2 (20.0%) | 8 (80.0%) |
| Total (Overall) | 40 (42.5%) | 54 (57.5%) |
Services Occupations
The most common Services occupations in Alpha are Healthcare Support (10 | 10.6%), Security & Protection (10 | 10.6%), Firefighting & Prevention (10 | 10.6%), Food Preparation & Serving (10 | 10.6%), and Cleaning & Maintenance (7 | 7.4%).
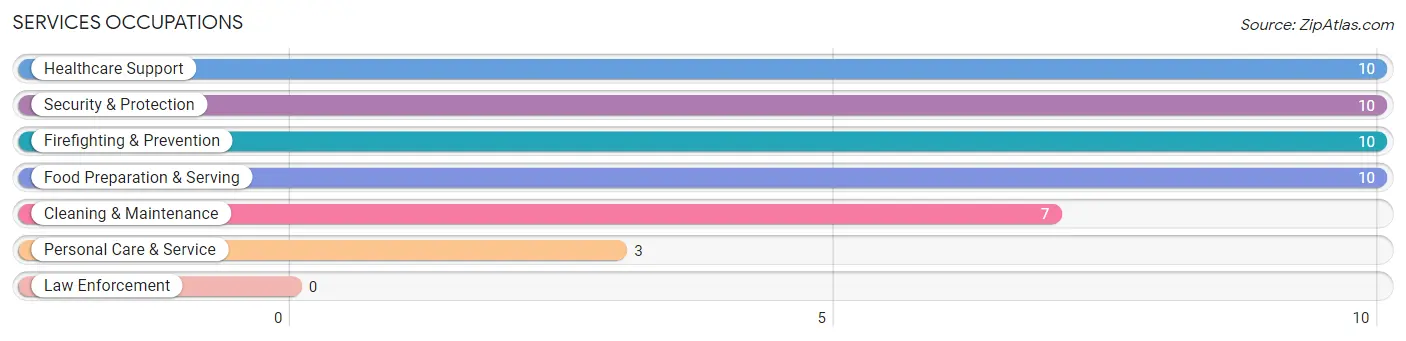
Services Occupations by Sex
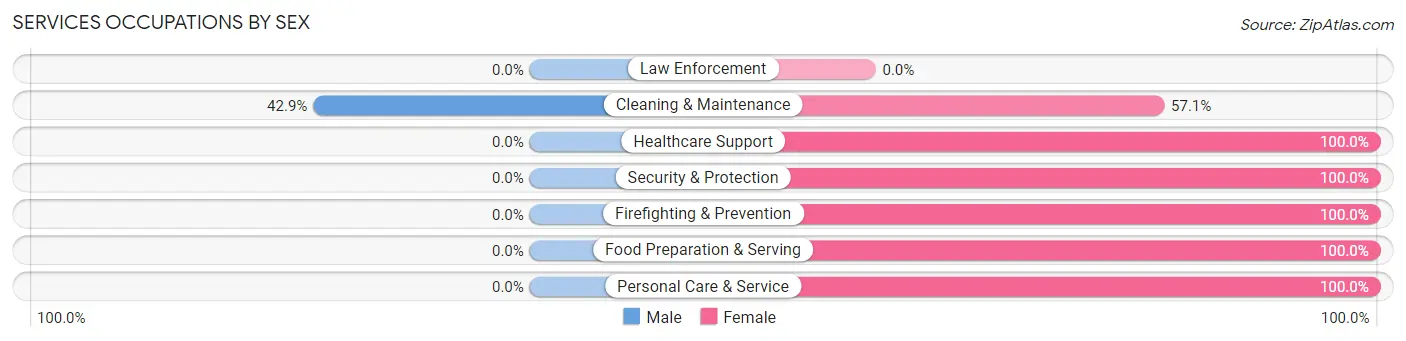
| Occupation | Male | Female |
| Healthcare Support | 0 (0.0%) | 10 (100.0%) |
| Security & Protection | 0 (0.0%) | 10 (100.0%) |
| Firefighting & Prevention | 0 (0.0%) | 10 (100.0%) |
| Law Enforcement | 0 (0.0%) | 0 (0.0%) |
| Food Preparation & Serving | 0 (0.0%) | 10 (100.0%) |
| Cleaning & Maintenance | 3 (42.9%) | 4 (57.1%) |
| Personal Care & Service | 0 (0.0%) | 3 (100.0%) |
| Total (Category) | 3 (7.5%) | 37 (92.5%) |
| Total (Overall) | 40 (42.5%) | 54 (57.5%) |
Sales and Office Occupations
The most common Sales and Office occupations in Alpha are Office & Administration (5 | 5.3%), and Sales & Related (2 | 2.1%).
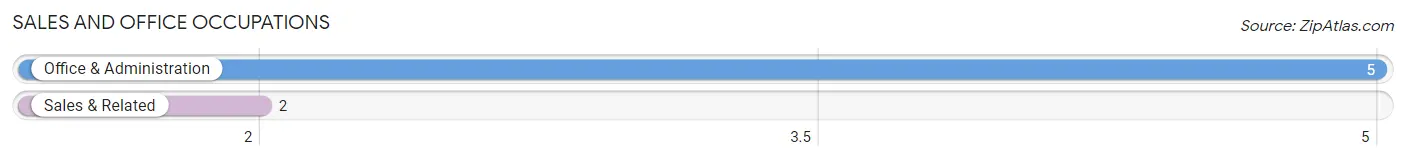
Sales and Office Occupations by Sex
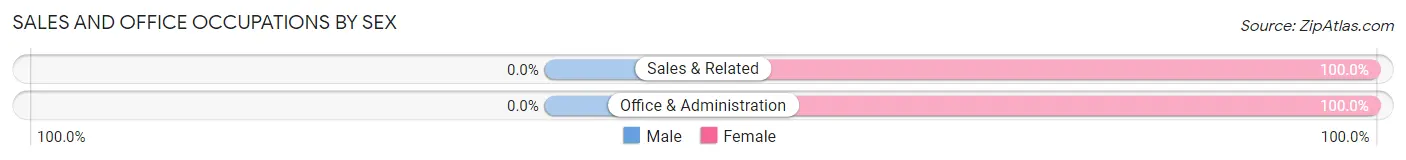
| Occupation | Male | Female |
| Sales & Related | 0 (0.0%) | 2 (100.0%) |
| Office & Administration | 0 (0.0%) | 5 (100.0%) |
| Total (Category) | 0 (0.0%) | 7 (100.0%) |
| Total (Overall) | 40 (42.5%) | 54 (57.5%) |
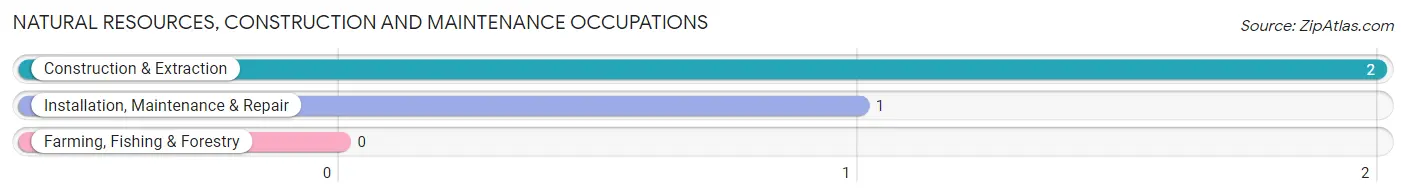
Natural Resources, Construction and Maintenance Occupations
The most common Natural Resources, Construction and Maintenance occupations in Alpha are Construction & Extraction (2 | 2.1%), and Installation, Maintenance & Repair (1 | 1.1%).
Natural Resources, Construction and Maintenance Occupations by Sex
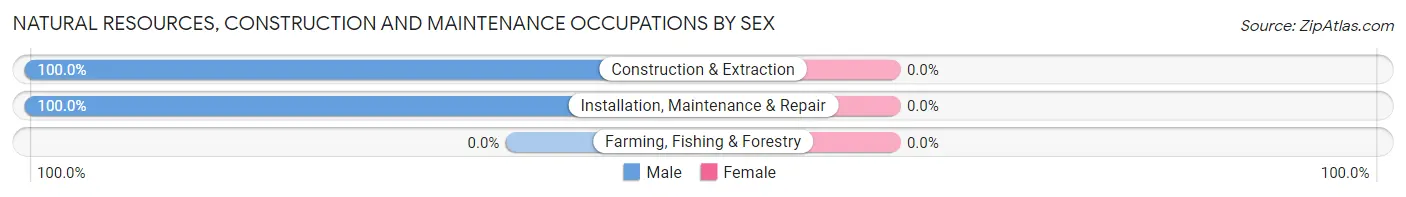
| Occupation | Male | Female |
| Farming, Fishing & Forestry | 0 (0.0%) | 0 (0.0%) |
| Construction & Extraction | 2 (100.0%) | 0 (0.0%) |
| Installation, Maintenance & Repair | 1 (100.0%) | 0 (0.0%) |
| Total (Category) | 3 (100.0%) | 0 (0.0%) |
| Total (Overall) | 40 (42.5%) | 54 (57.5%) |
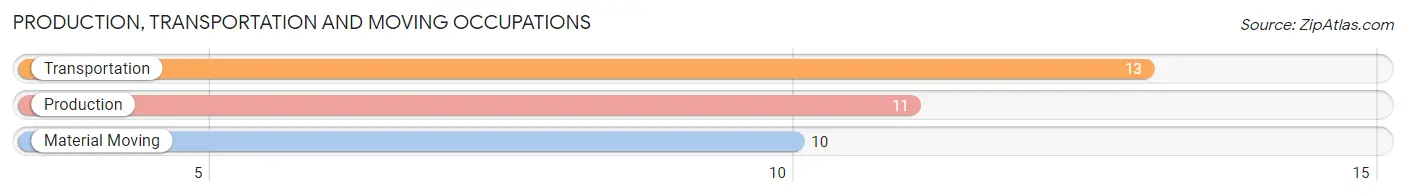
Production, Transportation and Moving Occupations
The most common Production, Transportation and Moving occupations in Alpha are Transportation (13 | 13.8%), Production (11 | 11.7%), and Material Moving (10 | 10.6%).
Production, Transportation and Moving Occupations by Sex
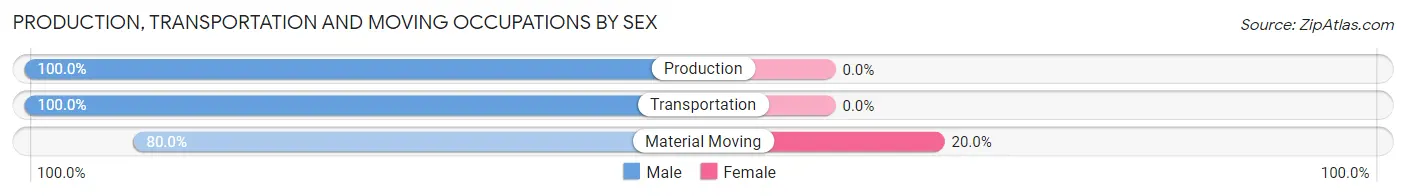
| Occupation | Male | Female |
| Production | 11 (100.0%) | 0 (0.0%) |
| Transportation | 13 (100.0%) | 0 (0.0%) |
| Material Moving | 8 (80.0%) | 2 (20.0%) |
| Total (Category) | 32 (94.1%) | 2 (5.9%) |
| Total (Overall) | 40 (42.5%) | 54 (57.5%) |
Employment Industries by Sex in Alpha
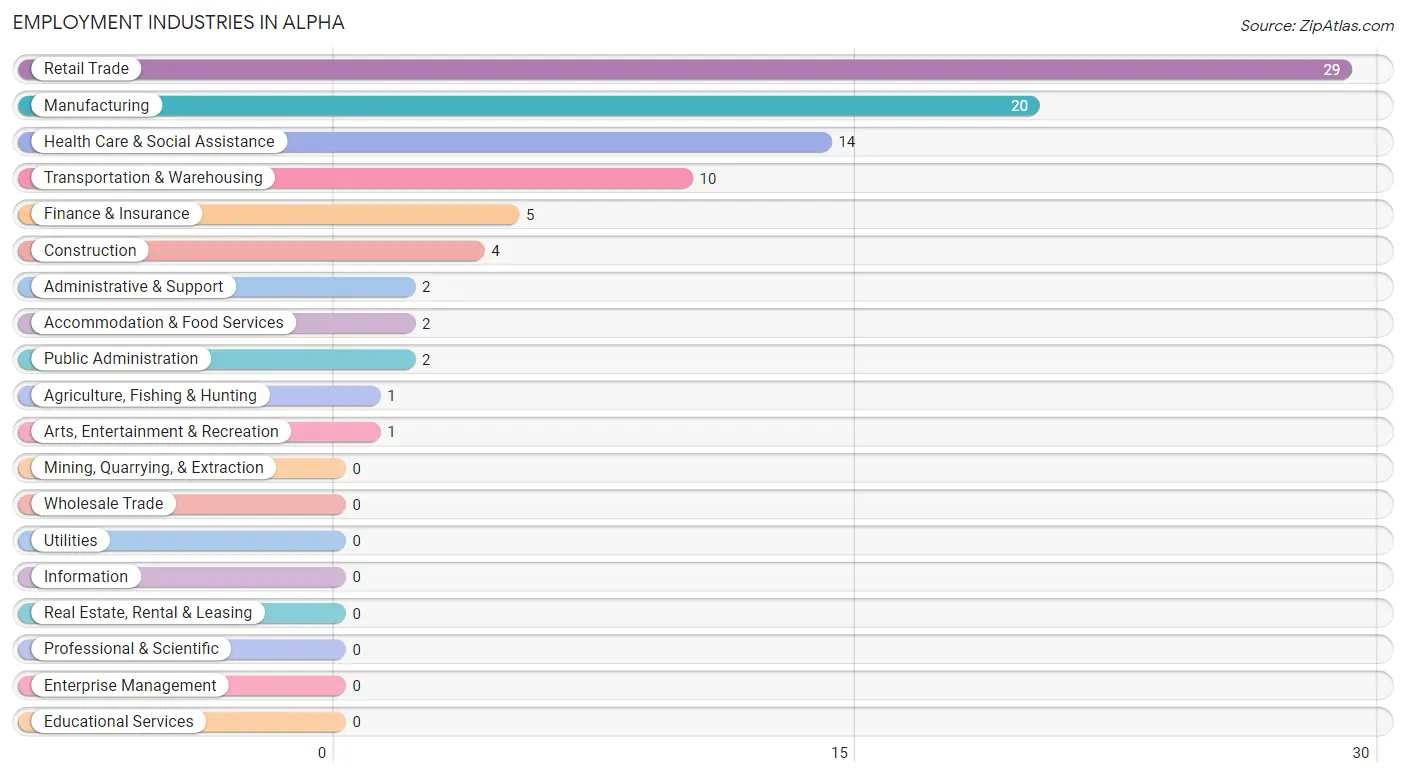
Employment Industries in Alpha
The major employment industries in Alpha include Retail Trade (29 | 30.8%), Manufacturing (20 | 21.3%), Health Care & Social Assistance (14 | 14.9%), Transportation & Warehousing (10 | 10.6%), and Finance & Insurance (5 | 5.3%).
Employment Industries by Sex in Alpha
The Alpha industries that see more men than women are Agriculture, Fishing & Hunting (100.0%), Construction (100.0%), and Administrative & Support (100.0%), whereas the industries that tend to have a higher number of women are Finance & Insurance (100.0%), Health Care & Social Assistance (100.0%), and Accommodation & Food Services (100.0%).
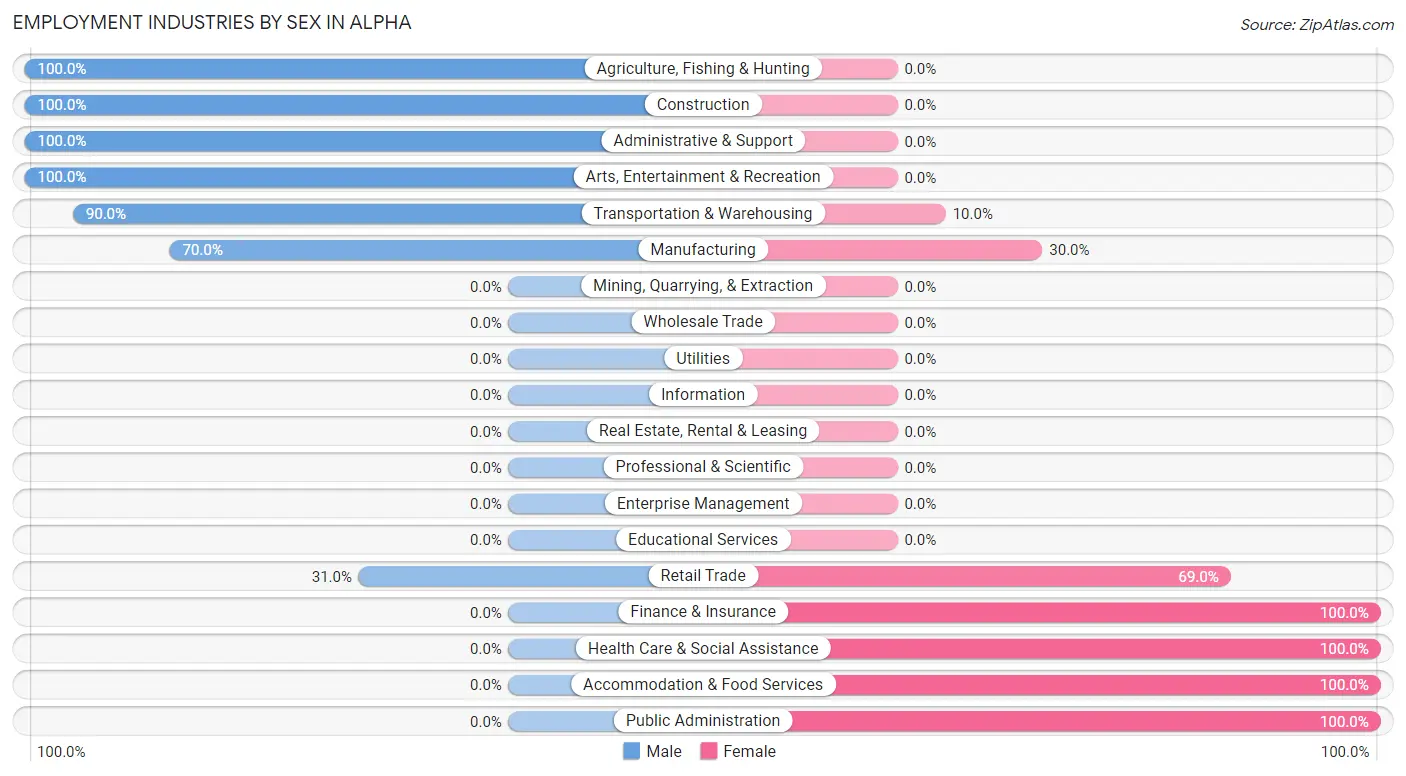
| Industry | Male | Female |
| Agriculture, Fishing & Hunting | 1 (100.0%) | 0 (0.0%) |
| Mining, Quarrying, & Extraction | 0 (0.0%) | 0 (0.0%) |
| Construction | 4 (100.0%) | 0 (0.0%) |
| Manufacturing | 14 (70.0%) | 6 (30.0%) |
| Wholesale Trade | 0 (0.0%) | 0 (0.0%) |
| Retail Trade | 9 (31.0%) | 20 (69.0%) |
| Transportation & Warehousing | 9 (90.0%) | 1 (10.0%) |
| Utilities | 0 (0.0%) | 0 (0.0%) |
| Information | 0 (0.0%) | 0 (0.0%) |
| Finance & Insurance | 0 (0.0%) | 5 (100.0%) |
| Real Estate, Rental & Leasing | 0 (0.0%) | 0 (0.0%) |
| Professional & Scientific | 0 (0.0%) | 0 (0.0%) |
| Enterprise Management | 0 (0.0%) | 0 (0.0%) |
| Administrative & Support | 2 (100.0%) | 0 (0.0%) |
| Educational Services | 0 (0.0%) | 0 (0.0%) |
| Health Care & Social Assistance | 0 (0.0%) | 14 (100.0%) |
| Arts, Entertainment & Recreation | 1 (100.0%) | 0 (0.0%) |
| Accommodation & Food Services | 0 (0.0%) | 2 (100.0%) |
| Public Administration | 0 (0.0%) | 2 (100.0%) |
| Total | 40 (42.5%) | 54 (57.5%) |
Education in Alpha
School Enrollment in Alpha
The most common levels of schooling among the 8 students in Alpha are middle school (3 | 37.5%), kindergarten (2 | 25.0%), and college / undergraduate (2 | 25.0%).
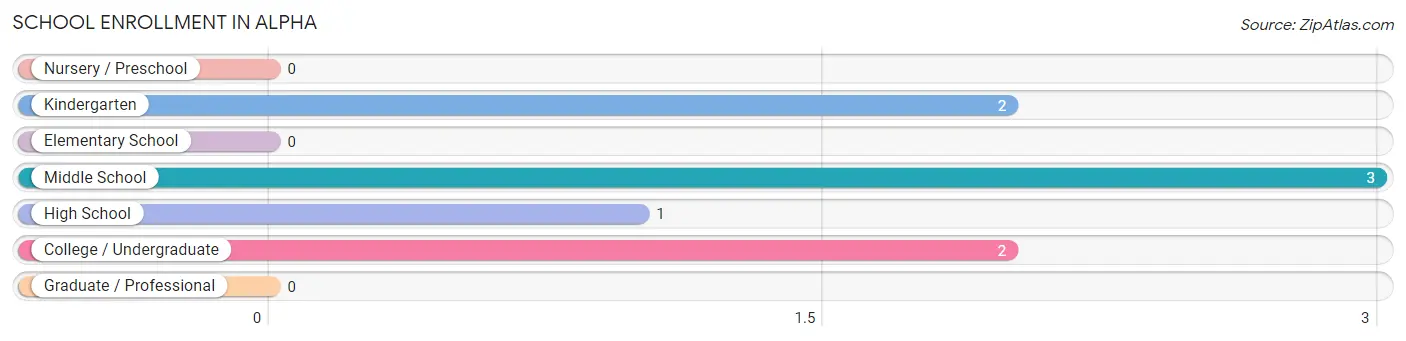
| School Level | # Students | % Students |
| Nursery / Preschool | 0 | 0.0% |
| Kindergarten | 2 | 25.0% |
| Elementary School | 0 | 0.0% |
| Middle School | 3 | 37.5% |
| High School | 1 | 12.5% |
| College / Undergraduate | 2 | 25.0% |
| Graduate / Professional | 0 | 0.0% |
| Total | 8 | 100.0% |
School Enrollment by Age by Funding Source in Alpha
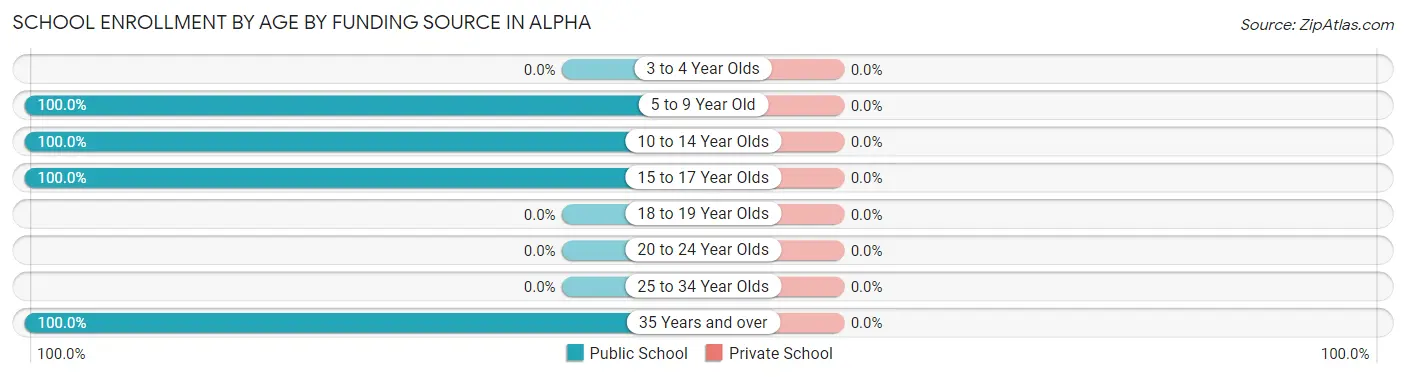
| Age Bracket | Public School | Private School |
| 3 to 4 Year Olds | 0 (0.0%) | 0 (0.0%) |
| 5 to 9 Year Old | 2 (100.0%) | 0 (0.0%) |
| 10 to 14 Year Olds | 3 (100.0%) | 0 (0.0%) |
| 15 to 17 Year Olds | 1 (100.0%) | 0 (0.0%) |
| 18 to 19 Year Olds | 0 (0.0%) | 0 (0.0%) |
| 20 to 24 Year Olds | 0 (0.0%) | 0 (0.0%) |
| 25 to 34 Year Olds | 0 (0.0%) | 0 (0.0%) |
| 35 Years and over | 2 (100.0%) | 0 (0.0%) |
| Total | 8 (100.0%) | 0 (0.0%) |
Educational Attainment by Field of Study in Alpha
Social sciences (2 | 25.0%), business (2 | 25.0%), education (2 | 25.0%), psychology (1 | 12.5%), and arts & humanities (1 | 12.5%) are the most common fields of study among 8 individuals in Alpha who have obtained a bachelor's degree or higher.
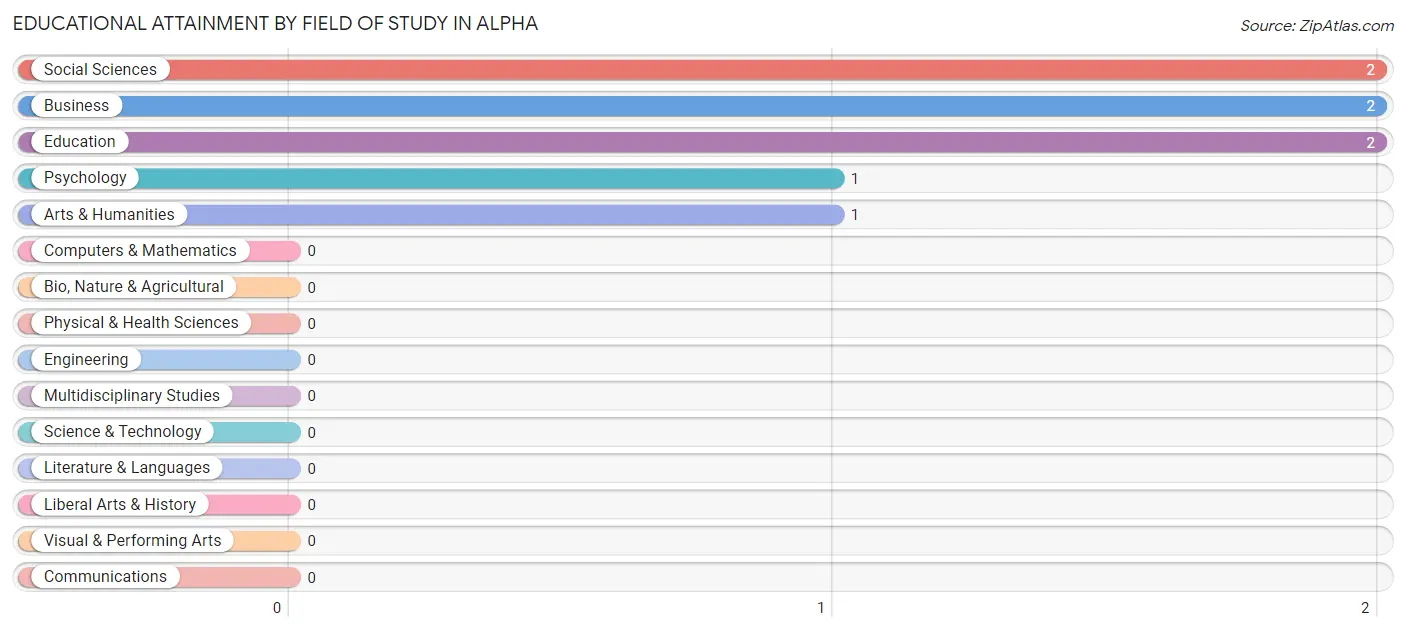
| Field of Study | # Graduates | % Graduates |
| Computers & Mathematics | 0 | 0.0% |
| Bio, Nature & Agricultural | 0 | 0.0% |
| Physical & Health Sciences | 0 | 0.0% |
| Psychology | 1 | 12.5% |
| Social Sciences | 2 | 25.0% |
| Engineering | 0 | 0.0% |
| Multidisciplinary Studies | 0 | 0.0% |
| Science & Technology | 0 | 0.0% |
| Business | 2 | 25.0% |
| Education | 2 | 25.0% |
| Literature & Languages | 0 | 0.0% |
| Liberal Arts & History | 0 | 0.0% |
| Visual & Performing Arts | 0 | 0.0% |
| Communications | 0 | 0.0% |
| Arts & Humanities | 1 | 12.5% |
| Total | 8 | 100.0% |
Transportation & Commute in Alpha
Vehicle Availability by Sex in Alpha
The most prevalent vehicle ownership categories in Alpha are males with 2 vehicles (21, accounting for 52.5%) and females with 2 vehicles (22, making up 38.9%).
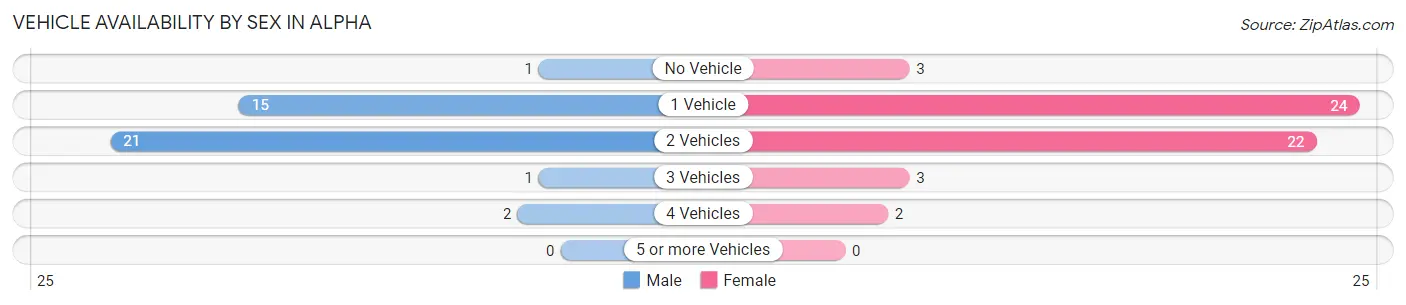
| Vehicles Available | Male | Female |
| No Vehicle | 1 (2.5%) | 3 (5.6%) |
| 1 Vehicle | 15 (37.5%) | 24 (44.4%) |
| 2 Vehicles | 21 (52.5%) | 22 (40.7%) |
| 3 Vehicles | 1 (2.5%) | 3 (5.6%) |
| 4 Vehicles | 2 (5.0%) | 2 (3.7%) |
| 5 or more Vehicles | 0 (0.0%) | 0 (0.0%) |
| Total | 40 (100.0%) | 54 (100.0%) |
Commute Time in Alpha
The most frequently occuring commute durations in Alpha are 5 to 9 minutes (20 commuters, 22.2%), 20 to 24 minutes (18 commuters, 20.0%), and 10 to 14 minutes (16 commuters, 17.8%).
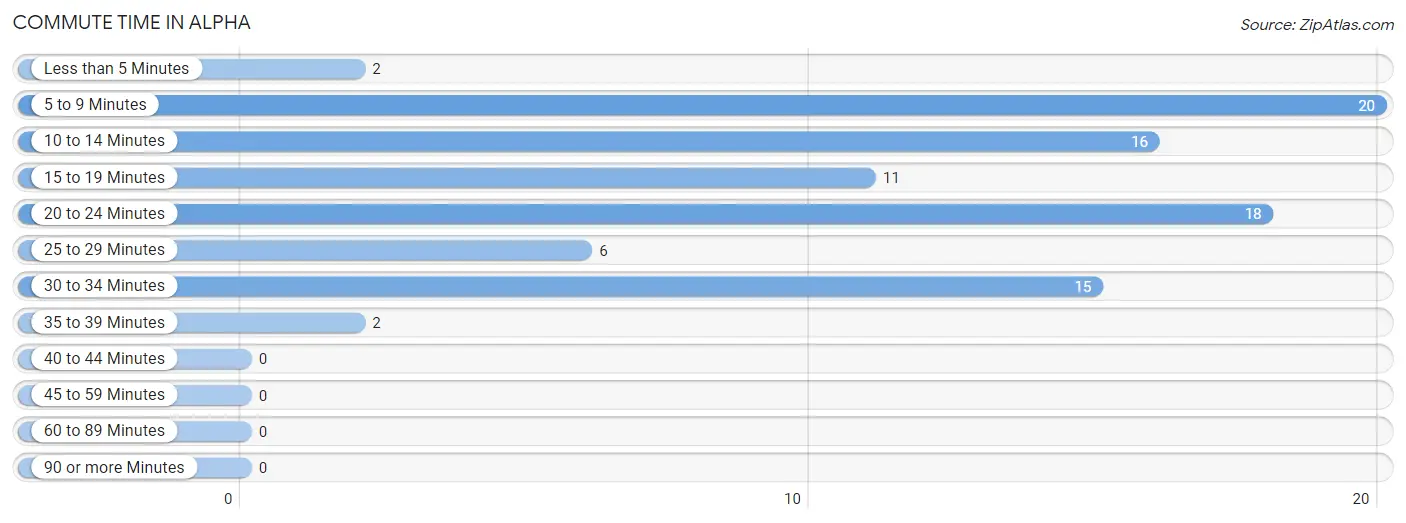
| Commute Time | # Commuters | % Commuters |
| Less than 5 Minutes | 2 | 2.2% |
| 5 to 9 Minutes | 20 | 22.2% |
| 10 to 14 Minutes | 16 | 17.8% |
| 15 to 19 Minutes | 11 | 12.2% |
| 20 to 24 Minutes | 18 | 20.0% |
| 25 to 29 Minutes | 6 | 6.7% |
| 30 to 34 Minutes | 15 | 16.7% |
| 35 to 39 Minutes | 2 | 2.2% |
| 40 to 44 Minutes | 0 | 0.0% |
| 45 to 59 Minutes | 0 | 0.0% |
| 60 to 89 Minutes | 0 | 0.0% |
| 90 or more Minutes | 0 | 0.0% |
Commute Time by Sex in Alpha
The most common commute times in Alpha are 30 to 34 minutes (10 commuters, 25.0%) for males and 5 to 9 minutes (12 commuters, 24.0%) for females.
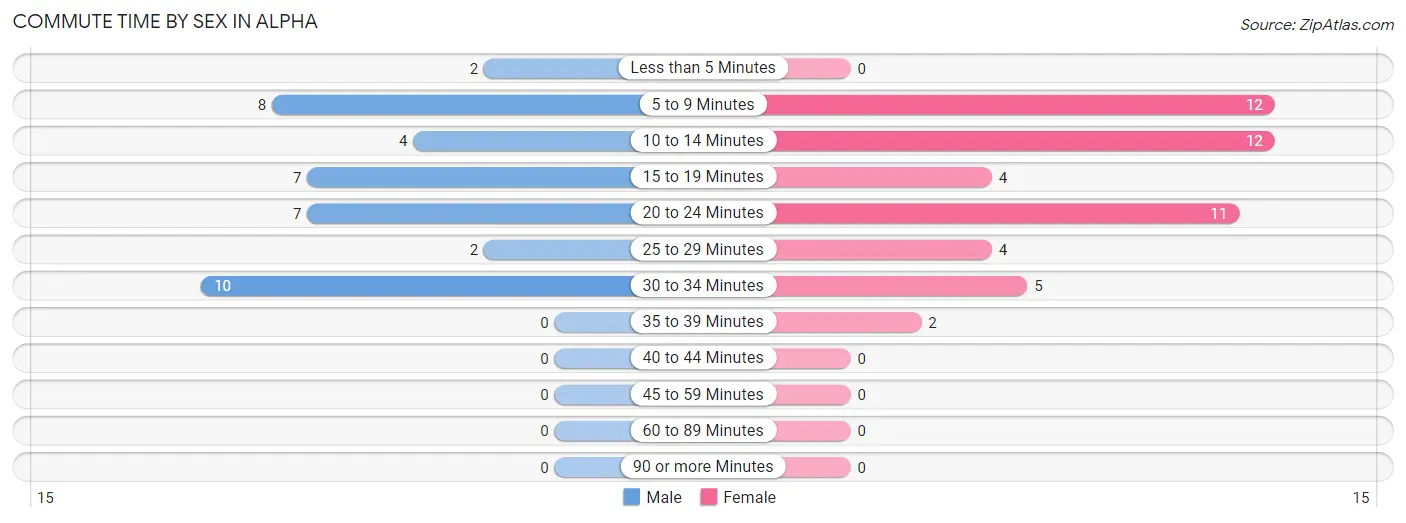
| Commute Time | Male | Female |
| Less than 5 Minutes | 2 (5.0%) | 0 (0.0%) |
| 5 to 9 Minutes | 8 (20.0%) | 12 (24.0%) |
| 10 to 14 Minutes | 4 (10.0%) | 12 (24.0%) |
| 15 to 19 Minutes | 7 (17.5%) | 4 (8.0%) |
| 20 to 24 Minutes | 7 (17.5%) | 11 (22.0%) |
| 25 to 29 Minutes | 2 (5.0%) | 4 (8.0%) |
| 30 to 34 Minutes | 10 (25.0%) | 5 (10.0%) |
| 35 to 39 Minutes | 0 (0.0%) | 2 (4.0%) |
| 40 to 44 Minutes | 0 (0.0%) | 0 (0.0%) |
| 45 to 59 Minutes | 0 (0.0%) | 0 (0.0%) |
| 60 to 89 Minutes | 0 (0.0%) | 0 (0.0%) |
| 90 or more Minutes | 0 (0.0%) | 0 (0.0%) |
Time of Departure to Work by Sex in Alpha
The most frequent times of departure to work in Alpha are 12:00 AM to 4:59 AM (20, 50.0%) for males and 5:00 AM to 5:29 AM (14, 28.0%) for females.
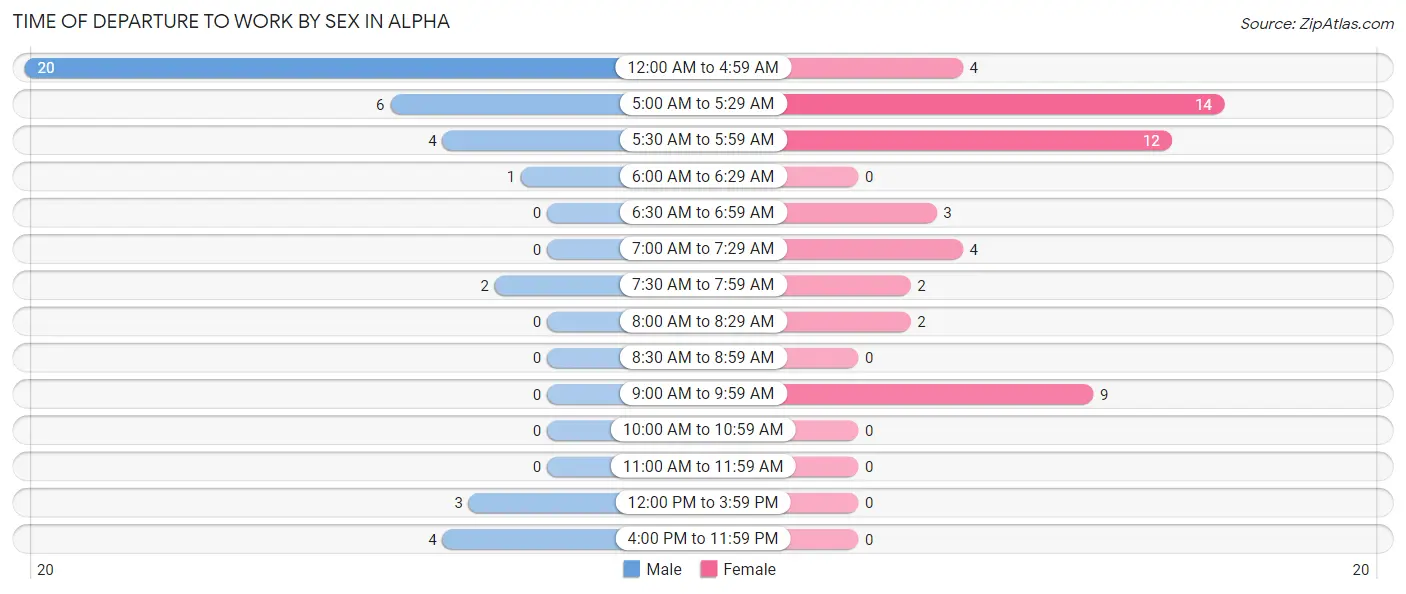
| Time of Departure | Male | Female |
| 12:00 AM to 4:59 AM | 20 (50.0%) | 4 (8.0%) |
| 5:00 AM to 5:29 AM | 6 (15.0%) | 14 (28.0%) |
| 5:30 AM to 5:59 AM | 4 (10.0%) | 12 (24.0%) |
| 6:00 AM to 6:29 AM | 1 (2.5%) | 0 (0.0%) |
| 6:30 AM to 6:59 AM | 0 (0.0%) | 3 (6.0%) |
| 7:00 AM to 7:29 AM | 0 (0.0%) | 4 (8.0%) |
| 7:30 AM to 7:59 AM | 2 (5.0%) | 2 (4.0%) |
| 8:00 AM to 8:29 AM | 0 (0.0%) | 2 (4.0%) |
| 8:30 AM to 8:59 AM | 0 (0.0%) | 0 (0.0%) |
| 9:00 AM to 9:59 AM | 0 (0.0%) | 9 (18.0%) |
| 10:00 AM to 10:59 AM | 0 (0.0%) | 0 (0.0%) |
| 11:00 AM to 11:59 AM | 0 (0.0%) | 0 (0.0%) |
| 12:00 PM to 3:59 PM | 3 (7.5%) | 0 (0.0%) |
| 4:00 PM to 11:59 PM | 4 (10.0%) | 0 (0.0%) |
| Total | 40 (100.0%) | 50 (100.0%) |
Housing Occupancy in Alpha
Occupancy by Ownership in Alpha
Of the total 122 dwellings in Alpha, owner-occupied units account for 104 (85.3%), while renter-occupied units make up 18 (14.7%).
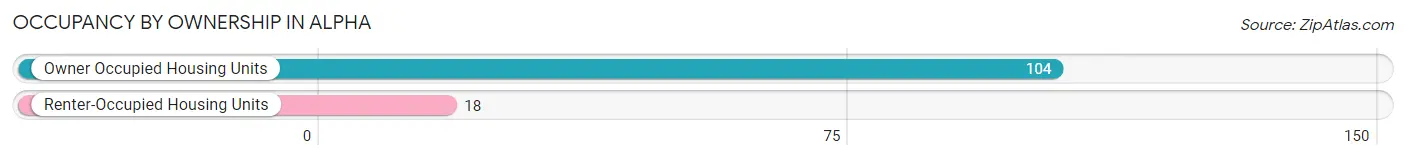
| Occupancy | # Housing Units | % Housing Units |
| Owner Occupied Housing Units | 104 | 85.3% |
| Renter-Occupied Housing Units | 18 | 14.7% |
| Total Occupied Housing Units | 122 | 100.0% |
Occupancy by Household Size in Alpha
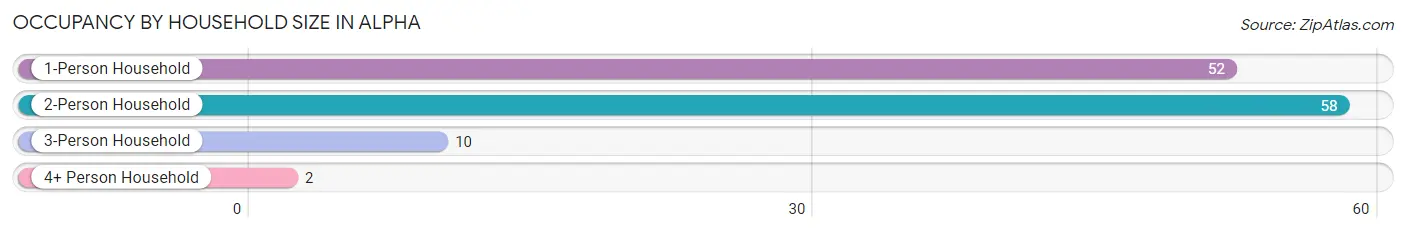
| Household Size | # Housing Units | % Housing Units |
| 1-Person Household | 52 | 42.6% |
| 2-Person Household | 58 | 47.5% |
| 3-Person Household | 10 | 8.2% |
| 4+ Person Household | 2 | 1.6% |
| Total Housing Units | 122 | 100.0% |
Occupancy by Ownership by Household Size in Alpha
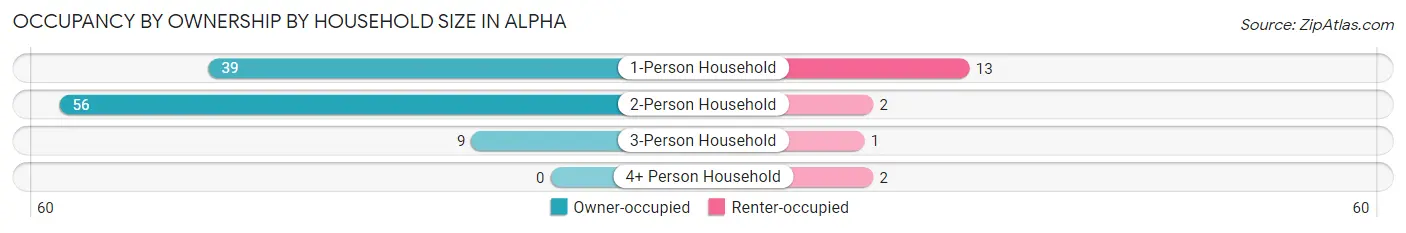
| Household Size | Owner-occupied | Renter-occupied |
| 1-Person Household | 39 (75.0%) | 13 (25.0%) |
| 2-Person Household | 56 (96.6%) | 2 (3.5%) |
| 3-Person Household | 9 (90.0%) | 1 (10.0%) |
| 4+ Person Household | 0 (0.0%) | 2 (100.0%) |
| Total Housing Units | 104 (85.3%) | 18 (14.7%) |
Occupancy by Educational Attainment in Alpha
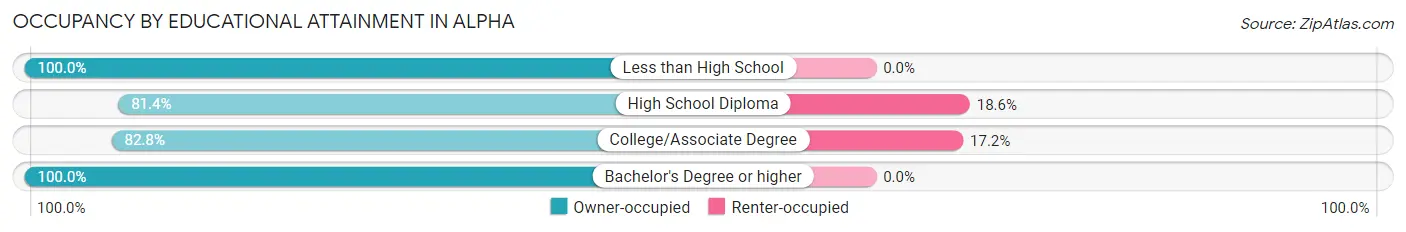
| Household Size | Owner-occupied | Renter-occupied |
| Less than High School | 16 (100.0%) | 0 (0.0%) |
| High School Diploma | 57 (81.4%) | 13 (18.6%) |
| College/Associate Degree | 24 (82.8%) | 5 (17.2%) |
| Bachelor's Degree or higher | 7 (100.0%) | 0 (0.0%) |
Occupancy by Age of Householder in Alpha
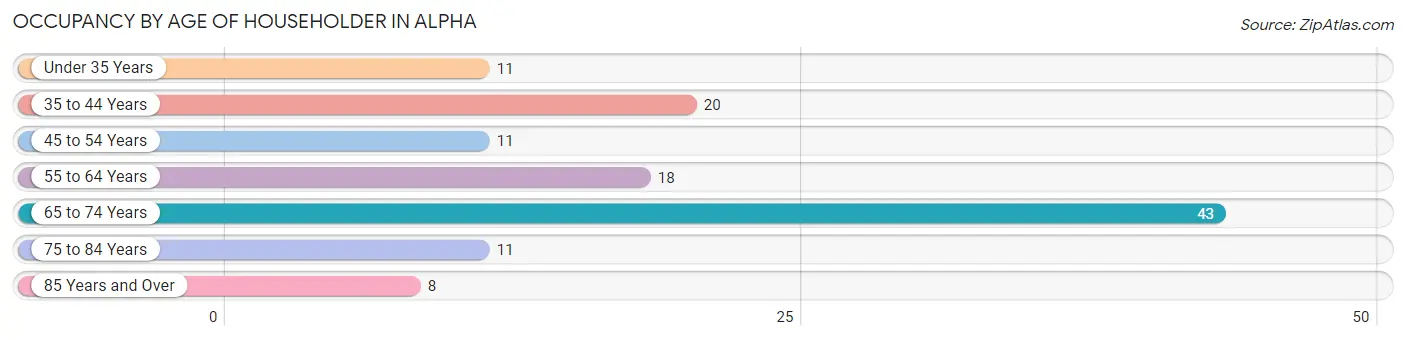
| Age Bracket | # Households | % Households |
| Under 35 Years | 11 | 9.0% |
| 35 to 44 Years | 20 | 16.4% |
| 45 to 54 Years | 11 | 9.0% |
| 55 to 64 Years | 18 | 14.7% |
| 65 to 74 Years | 43 | 35.2% |
| 75 to 84 Years | 11 | 9.0% |
| 85 Years and Over | 8 | 6.6% |
| Total | 122 | 100.0% |
Housing Finances in Alpha
Median Income by Occupancy in Alpha
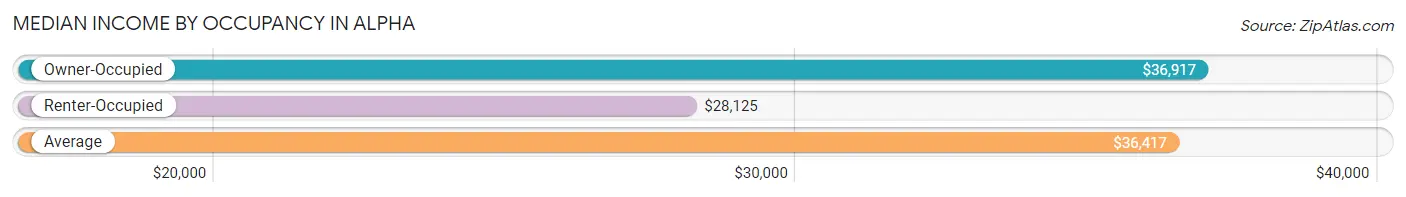
| Occupancy Type | # Households | Median Income |
| Owner-Occupied | 104 (85.3%) | $36,917 |
| Renter-Occupied | 18 (14.7%) | $28,125 |
| Average | 122 (100.0%) | $36,417 |
Occupancy by Householder Income Bracket in Alpha
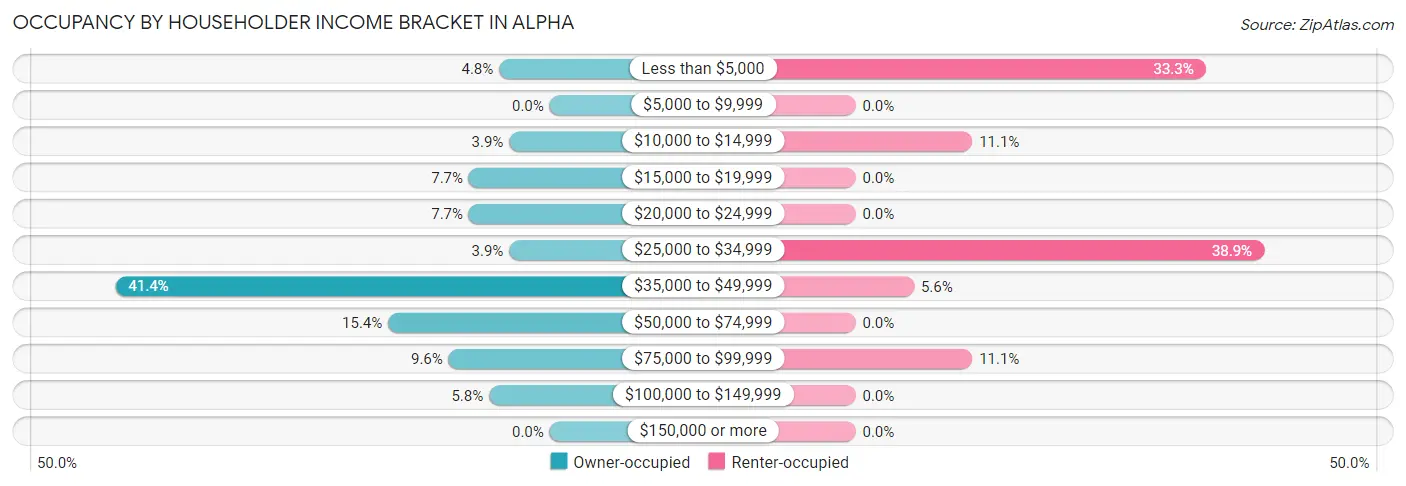
| Income Bracket | Owner-occupied | Renter-occupied |
| Less than $5,000 | 5 (4.8%) | 6 (33.3%) |
| $5,000 to $9,999 | 0 (0.0%) | 0 (0.0%) |
| $10,000 to $14,999 | 4 (3.8%) | 2 (11.1%) |
| $15,000 to $19,999 | 8 (7.7%) | 0 (0.0%) |
| $20,000 to $24,999 | 8 (7.7%) | 0 (0.0%) |
| $25,000 to $34,999 | 4 (3.8%) | 7 (38.9%) |
| $35,000 to $49,999 | 43 (41.3%) | 1 (5.6%) |
| $50,000 to $74,999 | 16 (15.4%) | 0 (0.0%) |
| $75,000 to $99,999 | 10 (9.6%) | 2 (11.1%) |
| $100,000 to $149,999 | 6 (5.8%) | 0 (0.0%) |
| $150,000 or more | 0 (0.0%) | 0 (0.0%) |
| Total | 104 (100.0%) | 18 (100.0%) |
Monthly Housing Cost Tiers in Alpha
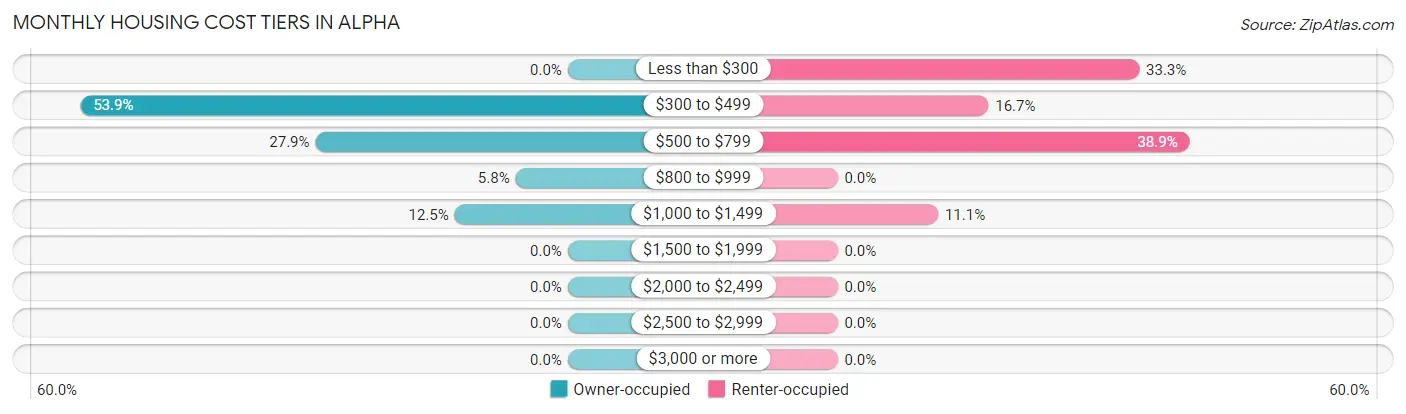
| Monthly Cost | Owner-occupied | Renter-occupied |
| Less than $300 | 0 (0.0%) | 6 (33.3%) |
| $300 to $499 | 56 (53.8%) | 3 (16.7%) |
| $500 to $799 | 29 (27.9%) | 7 (38.9%) |
| $800 to $999 | 6 (5.8%) | 0 (0.0%) |
| $1,000 to $1,499 | 13 (12.5%) | 2 (11.1%) |
| $1,500 to $1,999 | 0 (0.0%) | 0 (0.0%) |
| $2,000 to $2,499 | 0 (0.0%) | 0 (0.0%) |
| $2,500 to $2,999 | 0 (0.0%) | 0 (0.0%) |
| $3,000 or more | 0 (0.0%) | 0 (0.0%) |
| Total | 104 (100.0%) | 18 (100.0%) |
Physical Housing Characteristics in Alpha
Housing Structures in Alpha
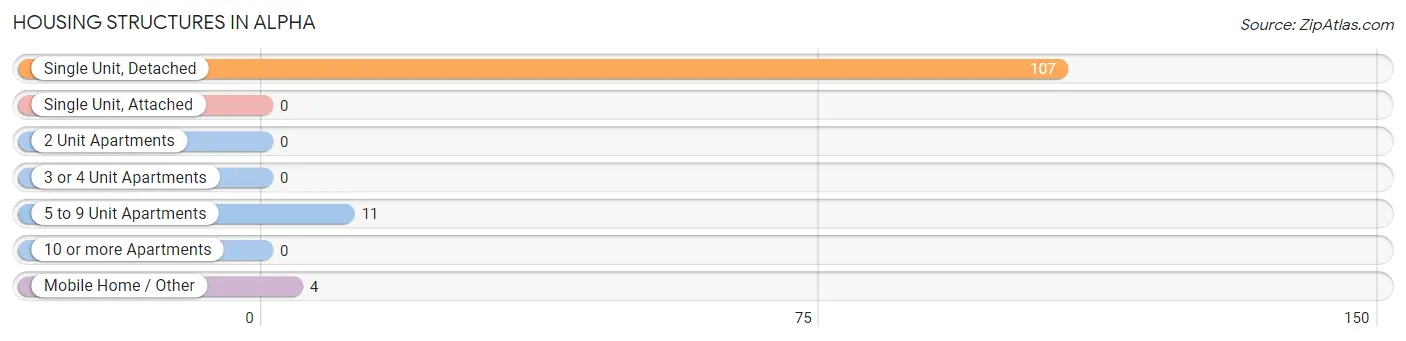
| Structure Type | # Housing Units | % Housing Units |
| Single Unit, Detached | 107 | 87.7% |
| Single Unit, Attached | 0 | 0.0% |
| 2 Unit Apartments | 0 | 0.0% |
| 3 or 4 Unit Apartments | 0 | 0.0% |
| 5 to 9 Unit Apartments | 11 | 9.0% |
| 10 or more Apartments | 0 | 0.0% |
| Mobile Home / Other | 4 | 3.3% |
| Total | 122 | 100.0% |
Housing Structures by Occupancy in Alpha
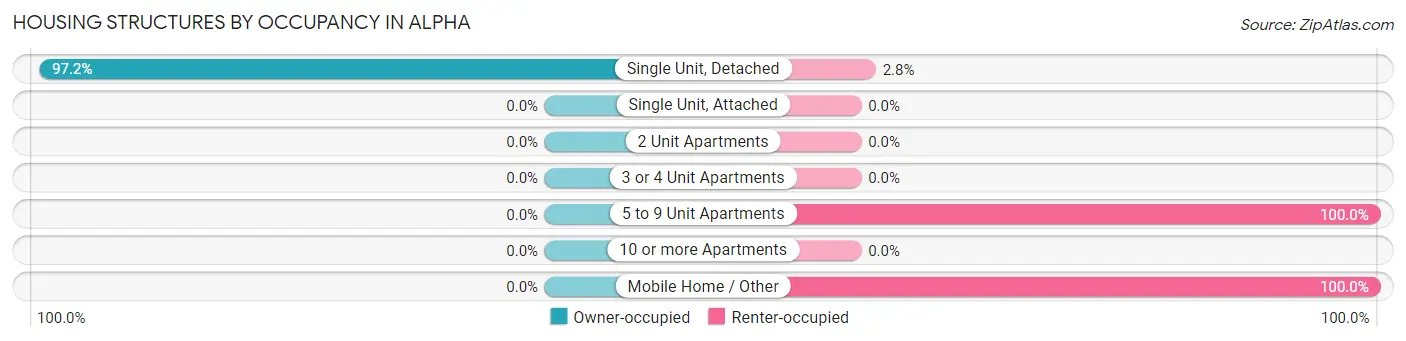
| Structure Type | Owner-occupied | Renter-occupied |
| Single Unit, Detached | 104 (97.2%) | 3 (2.8%) |
| Single Unit, Attached | 0 (0.0%) | 0 (0.0%) |
| 2 Unit Apartments | 0 (0.0%) | 0 (0.0%) |
| 3 or 4 Unit Apartments | 0 (0.0%) | 0 (0.0%) |
| 5 to 9 Unit Apartments | 0 (0.0%) | 11 (100.0%) |
| 10 or more Apartments | 0 (0.0%) | 0 (0.0%) |
| Mobile Home / Other | 0 (0.0%) | 4 (100.0%) |
| Total | 104 (85.3%) | 18 (14.7%) |
Housing Structures by Number of Rooms in Alpha
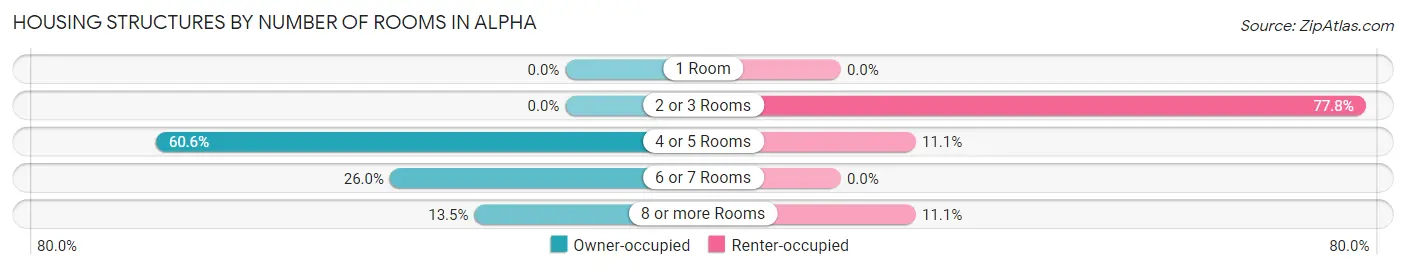
| Number of Rooms | Owner-occupied | Renter-occupied |
| 1 Room | 0 (0.0%) | 0 (0.0%) |
| 2 or 3 Rooms | 0 (0.0%) | 14 (77.8%) |
| 4 or 5 Rooms | 63 (60.6%) | 2 (11.1%) |
| 6 or 7 Rooms | 27 (26.0%) | 0 (0.0%) |
| 8 or more Rooms | 14 (13.5%) | 2 (11.1%) |
| Total | 104 (100.0%) | 18 (100.0%) |
Housing Structure by Heating Type in Alpha
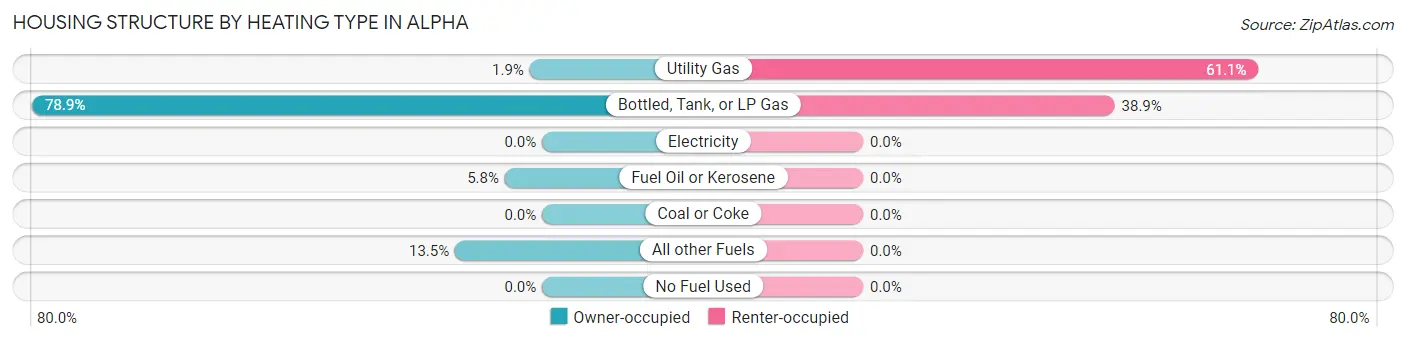
| Heating Type | Owner-occupied | Renter-occupied |
| Utility Gas | 2 (1.9%) | 11 (61.1%) |
| Bottled, Tank, or LP Gas | 82 (78.8%) | 7 (38.9%) |
| Electricity | 0 (0.0%) | 0 (0.0%) |
| Fuel Oil or Kerosene | 6 (5.8%) | 0 (0.0%) |
| Coal or Coke | 0 (0.0%) | 0 (0.0%) |
| All other Fuels | 14 (13.5%) | 0 (0.0%) |
| No Fuel Used | 0 (0.0%) | 0 (0.0%) |
| Total | 104 (100.0%) | 18 (100.0%) |
Household Vehicle Usage in Alpha
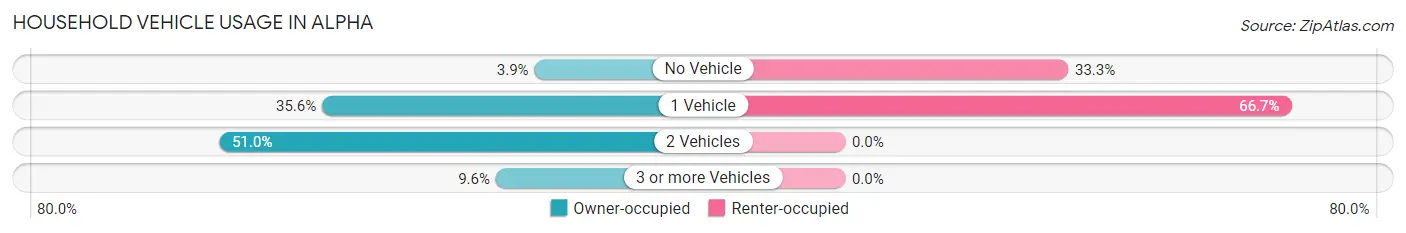
| Vehicles per Household | Owner-occupied | Renter-occupied |
| No Vehicle | 4 (3.8%) | 6 (33.3%) |
| 1 Vehicle | 37 (35.6%) | 12 (66.7%) |
| 2 Vehicles | 53 (51.0%) | 0 (0.0%) |
| 3 or more Vehicles | 10 (9.6%) | 0 (0.0%) |
| Total | 104 (100.0%) | 18 (100.0%) |
Real Estate & Mortgages in Alpha
Real Estate and Mortgage Overview in Alpha
| Characteristic | Without Mortgage | With Mortgage |
| Housing Units | 70 | 34 |
| Median Property Value | $29,500 | $36,700 |
| Median Household Income | $36,848 | $0 |
| Monthly Housing Costs | $435 | $0 |
| Real Estate Taxes | $545 | $2 |
Property Value by Mortgage Status in Alpha
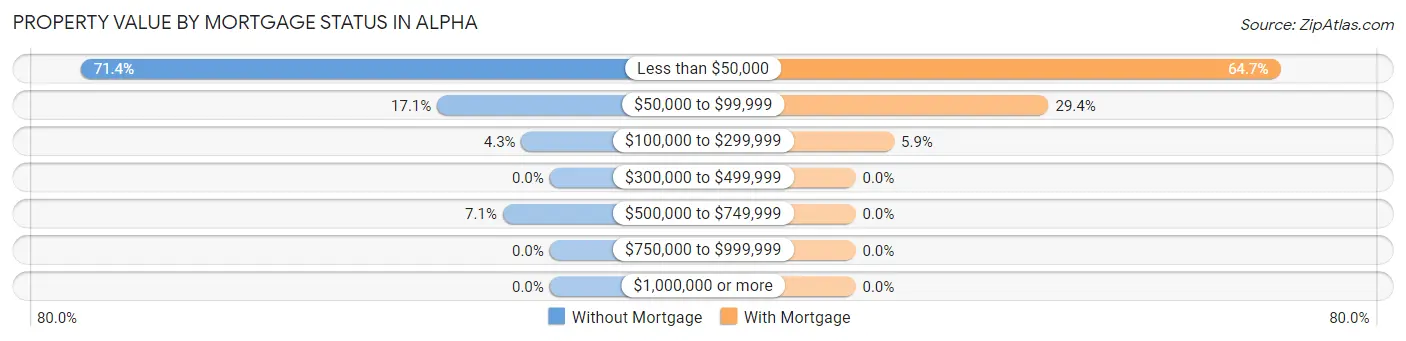
| Property Value | Without Mortgage | With Mortgage |
| Less than $50,000 | 50 (71.4%) | 22 (64.7%) |
| $50,000 to $99,999 | 12 (17.1%) | 10 (29.4%) |
| $100,000 to $299,999 | 3 (4.3%) | 2 (5.9%) |
| $300,000 to $499,999 | 0 (0.0%) | 0 (0.0%) |
| $500,000 to $749,999 | 5 (7.1%) | 0 (0.0%) |
| $750,000 to $999,999 | 0 (0.0%) | 0 (0.0%) |
| $1,000,000 or more | 0 (0.0%) | 0 (0.0%) |
| Total | 70 (100.0%) | 34 (100.0%) |
Household Income by Mortgage Status in Alpha
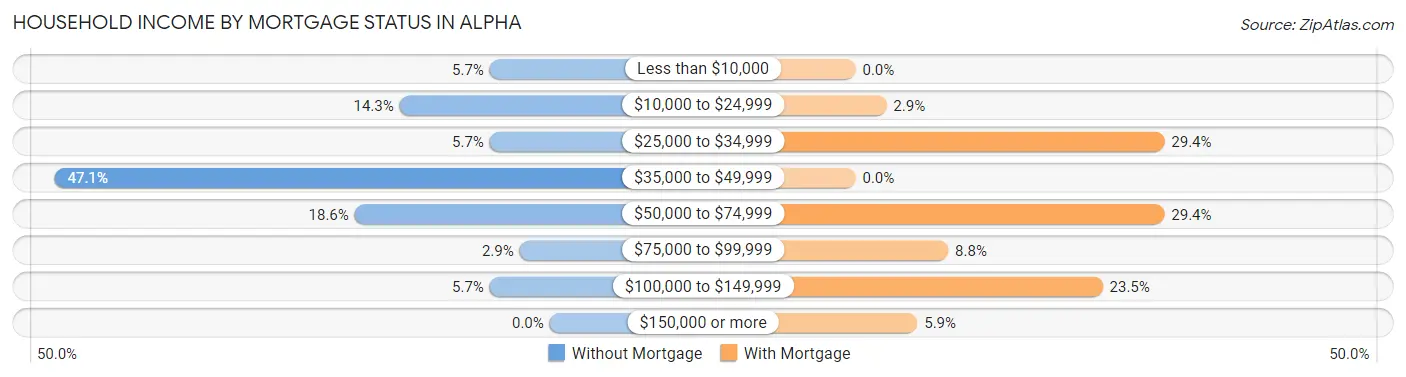
| Household Income | Without Mortgage | With Mortgage |
| Less than $10,000 | 4 (5.7%) | 0 (0.0%) |
| $10,000 to $24,999 | 10 (14.3%) | 1 (2.9%) |
| $25,000 to $34,999 | 4 (5.7%) | 10 (29.4%) |
| $35,000 to $49,999 | 33 (47.1%) | 0 (0.0%) |
| $50,000 to $74,999 | 13 (18.6%) | 10 (29.4%) |
| $75,000 to $99,999 | 2 (2.9%) | 3 (8.8%) |
| $100,000 to $149,999 | 4 (5.7%) | 8 (23.5%) |
| $150,000 or more | 0 (0.0%) | 2 (5.9%) |
| Total | 70 (100.0%) | 34 (100.0%) |
Property Value to Household Income Ratio in Alpha
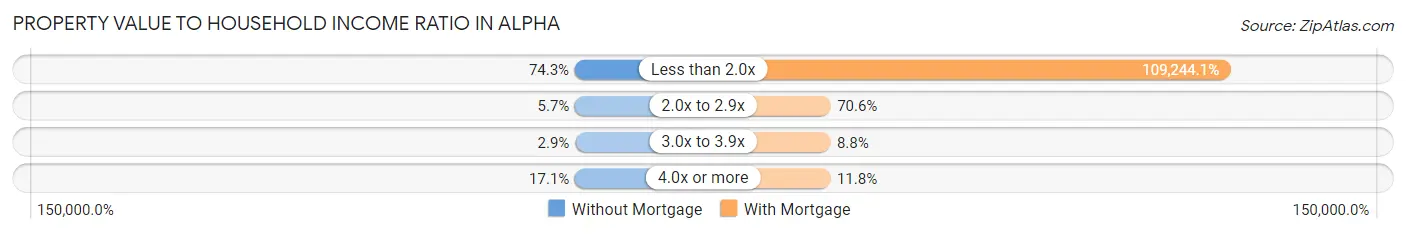
| Value-to-Income Ratio | Without Mortgage | With Mortgage |
| Less than 2.0x | 52 (74.3%) | 37,143 (109,244.1%) |
| 2.0x to 2.9x | 4 (5.7%) | 24 (70.6%) |
| 3.0x to 3.9x | 2 (2.9%) | 3 (8.8%) |
| 4.0x or more | 12 (17.1%) | 4 (11.8%) |
| Total | 70 (100.0%) | 34 (100.0%) |
Real Estate Taxes by Mortgage Status in Alpha
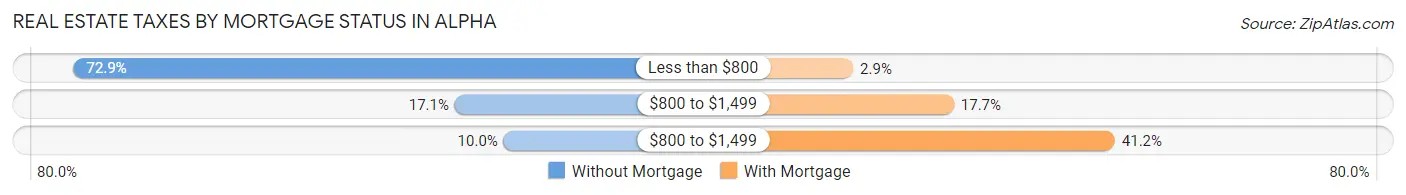
| Property Taxes | Without Mortgage | With Mortgage |
| Less than $800 | 51 (72.9%) | 1 (2.9%) |
| $800 to $1,499 | 12 (17.1%) | 6 (17.6%) |
| $800 to $1,499 | 7 (10.0%) | 14 (41.2%) |
| Total | 70 (100.0%) | 34 (100.0%) |
Health & Disability in Alpha
Health Insurance Coverage by Age in Alpha
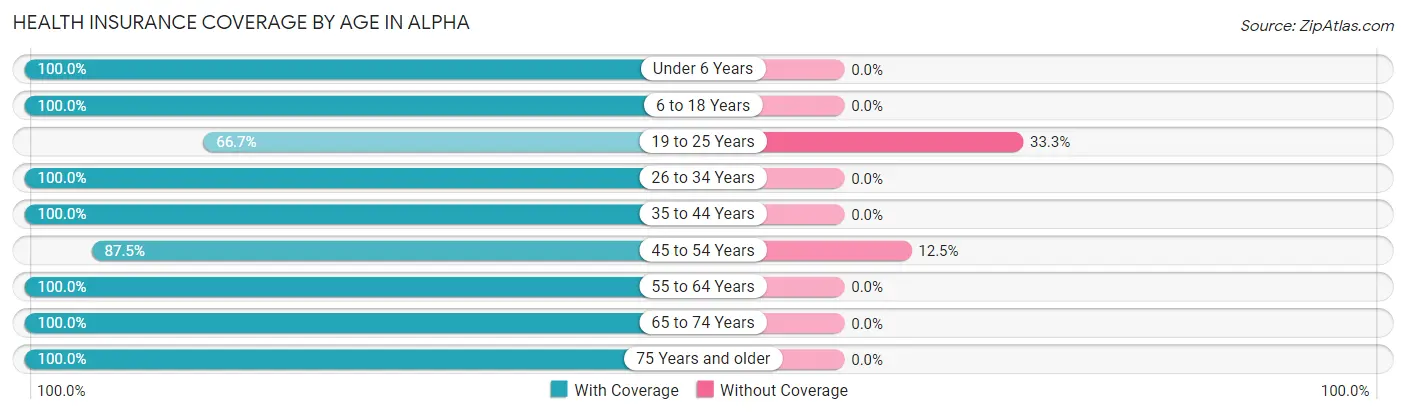
| Age Bracket | With Coverage | Without Coverage |
| Under 6 Years | 3 (100.0%) | 0 (0.0%) |
| 6 to 18 Years | 6 (100.0%) | 0 (0.0%) |
| 19 to 25 Years | 20 (66.7%) | 10 (33.3%) |
| 26 to 34 Years | 3 (100.0%) | 0 (0.0%) |
| 35 to 44 Years | 31 (100.0%) | 0 (0.0%) |
| 45 to 54 Years | 21 (87.5%) | 3 (12.5%) |
| 55 to 64 Years | 39 (100.0%) | 0 (0.0%) |
| 65 to 74 Years | 51 (100.0%) | 0 (0.0%) |
| 75 Years and older | 23 (100.0%) | 0 (0.0%) |
| Total | 197 (93.8%) | 13 (6.2%) |
Health Insurance Coverage by Citizenship Status in Alpha
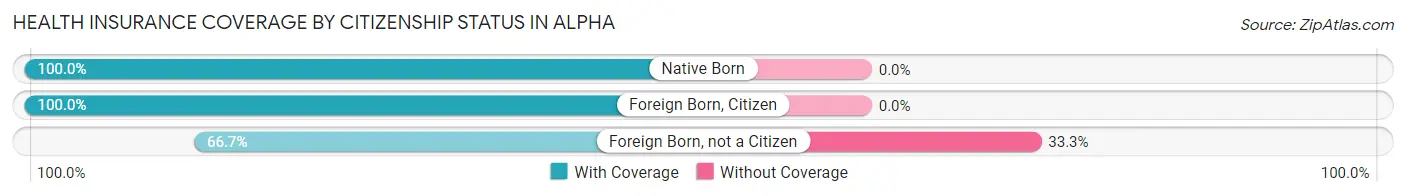
| Citizenship Status | With Coverage | Without Coverage |
| Native Born | 3 (100.0%) | 0 (0.0%) |
| Foreign Born, Citizen | 6 (100.0%) | 0 (0.0%) |
| Foreign Born, not a Citizen | 20 (66.7%) | 10 (33.3%) |
Health Insurance Coverage by Household Income in Alpha
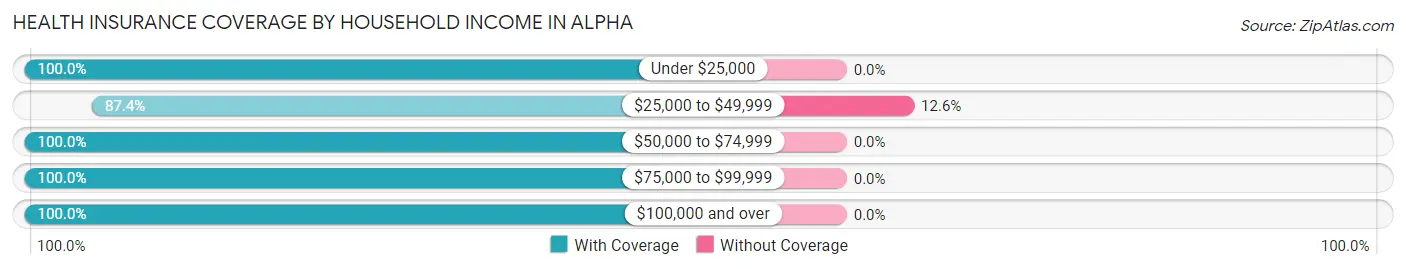
| Household Income | With Coverage | Without Coverage |
| Under $25,000 | 35 (100.0%) | 0 (0.0%) |
| $25,000 to $49,999 | 90 (87.4%) | 13 (12.6%) |
| $50,000 to $74,999 | 27 (100.0%) | 0 (0.0%) |
| $75,000 to $99,999 | 34 (100.0%) | 0 (0.0%) |
| $100,000 and over | 11 (100.0%) | 0 (0.0%) |
Public vs Private Health Insurance Coverage by Age in Alpha
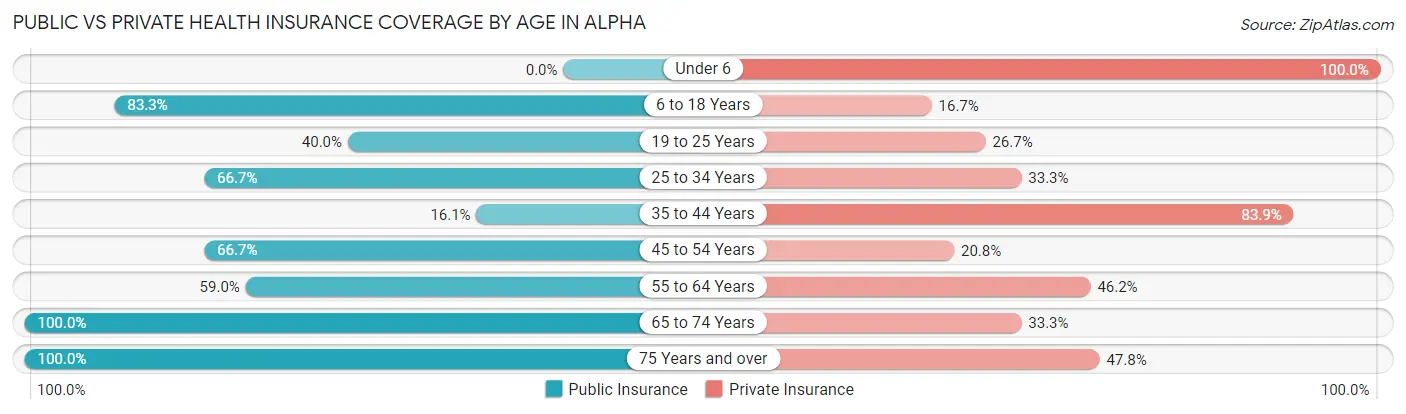
| Age Bracket | Public Insurance | Private Insurance |
| Under 6 | 0 (0.0%) | 3 (100.0%) |
| 6 to 18 Years | 5 (83.3%) | 1 (16.7%) |
| 19 to 25 Years | 12 (40.0%) | 8 (26.7%) |
| 25 to 34 Years | 2 (66.7%) | 1 (33.3%) |
| 35 to 44 Years | 5 (16.1%) | 26 (83.9%) |
| 45 to 54 Years | 16 (66.7%) | 5 (20.8%) |
| 55 to 64 Years | 23 (59.0%) | 18 (46.2%) |
| 65 to 74 Years | 51 (100.0%) | 17 (33.3%) |
| 75 Years and over | 23 (100.0%) | 11 (47.8%) |
| Total | 137 (65.2%) | 90 (42.9%) |
Disability Status by Sex by Age in Alpha
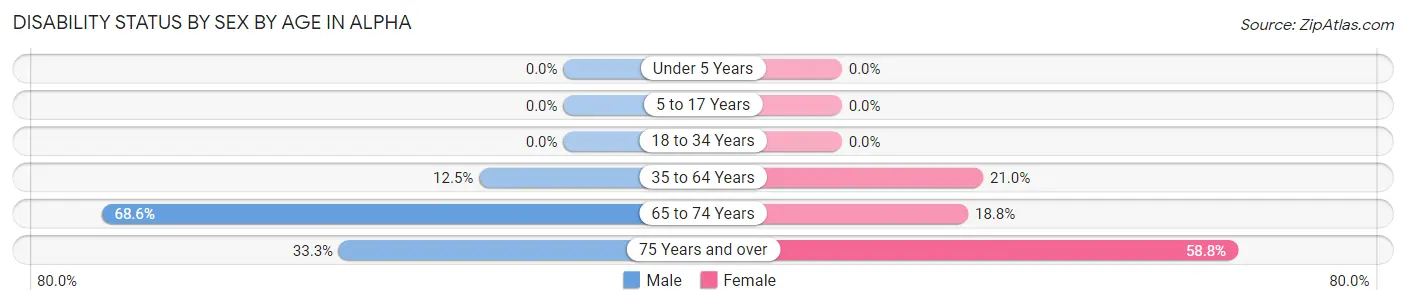
| Age Bracket | Male | Female |
| Under 5 Years | 0 (0.0%) | 0 (0.0%) |
| 5 to 17 Years | 0 (0.0%) | 0 (0.0%) |
| 18 to 34 Years | 0 (0.0%) | 0 (0.0%) |
| 35 to 64 Years | 4 (12.5%) | 13 (21.0%) |
| 65 to 74 Years | 24 (68.6%) | 3 (18.8%) |
| 75 Years and over | 2 (33.3%) | 10 (58.8%) |
Disability Class by Sex by Age in Alpha
Disability Class: Hearing Difficulty
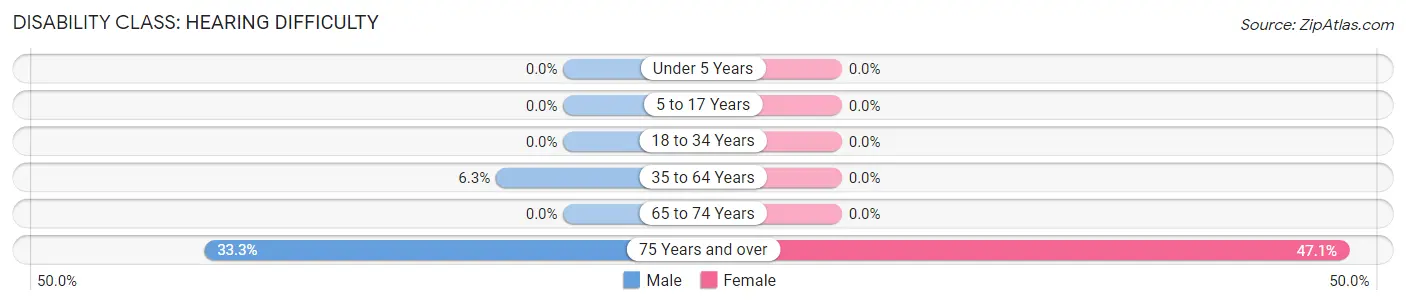
| Age Bracket | Male | Female |
| Under 5 Years | 0 (0.0%) | 0 (0.0%) |
| 5 to 17 Years | 0 (0.0%) | 0 (0.0%) |
| 18 to 34 Years | 0 (0.0%) | 0 (0.0%) |
| 35 to 64 Years | 2 (6.2%) | 0 (0.0%) |
| 65 to 74 Years | 0 (0.0%) | 0 (0.0%) |
| 75 Years and over | 2 (33.3%) | 8 (47.1%) |
Disability Class: Vision Difficulty
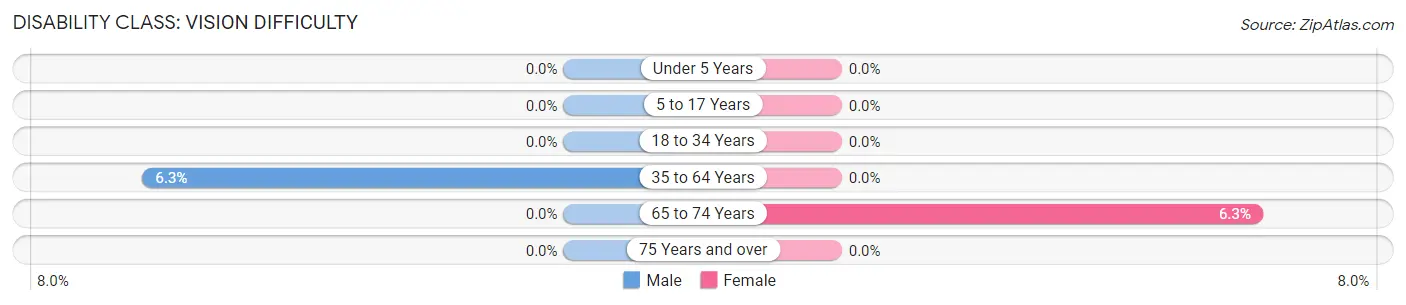
| Age Bracket | Male | Female |
| Under 5 Years | 0 (0.0%) | 0 (0.0%) |
| 5 to 17 Years | 0 (0.0%) | 0 (0.0%) |
| 18 to 34 Years | 0 (0.0%) | 0 (0.0%) |
| 35 to 64 Years | 2 (6.2%) | 0 (0.0%) |
| 65 to 74 Years | 0 (0.0%) | 1 (6.2%) |
| 75 Years and over | 0 (0.0%) | 0 (0.0%) |
Disability Class: Cognitive Difficulty
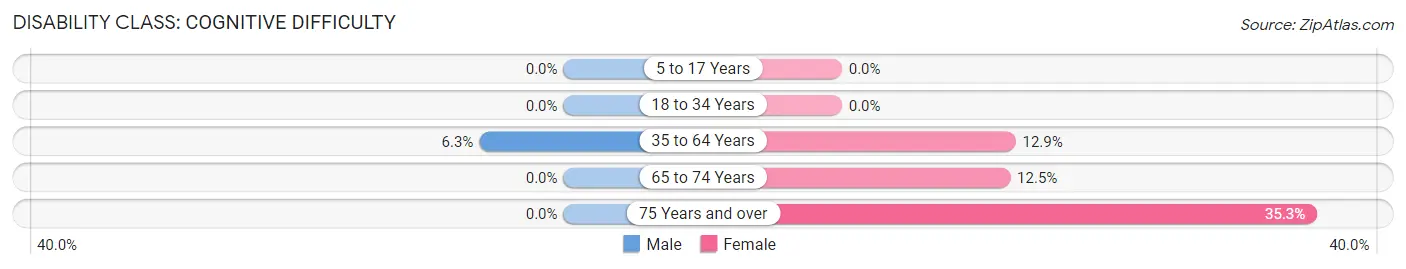
| Age Bracket | Male | Female |
| 5 to 17 Years | 0 (0.0%) | 0 (0.0%) |
| 18 to 34 Years | 0 (0.0%) | 0 (0.0%) |
| 35 to 64 Years | 2 (6.2%) | 8 (12.9%) |
| 65 to 74 Years | 0 (0.0%) | 2 (12.5%) |
| 75 Years and over | 0 (0.0%) | 6 (35.3%) |
Disability Class: Ambulatory Difficulty
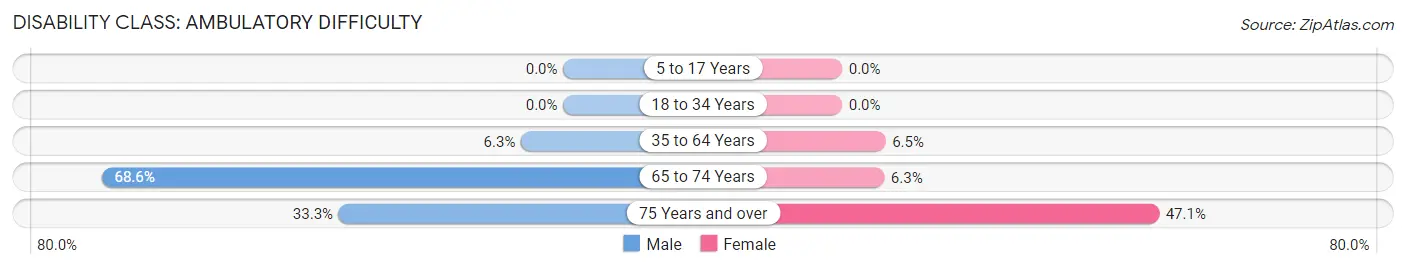
| Age Bracket | Male | Female |
| 5 to 17 Years | 0 (0.0%) | 0 (0.0%) |
| 18 to 34 Years | 0 (0.0%) | 0 (0.0%) |
| 35 to 64 Years | 2 (6.2%) | 4 (6.5%) |
| 65 to 74 Years | 24 (68.6%) | 1 (6.2%) |
| 75 Years and over | 2 (33.3%) | 8 (47.1%) |
Disability Class: Self-Care Difficulty
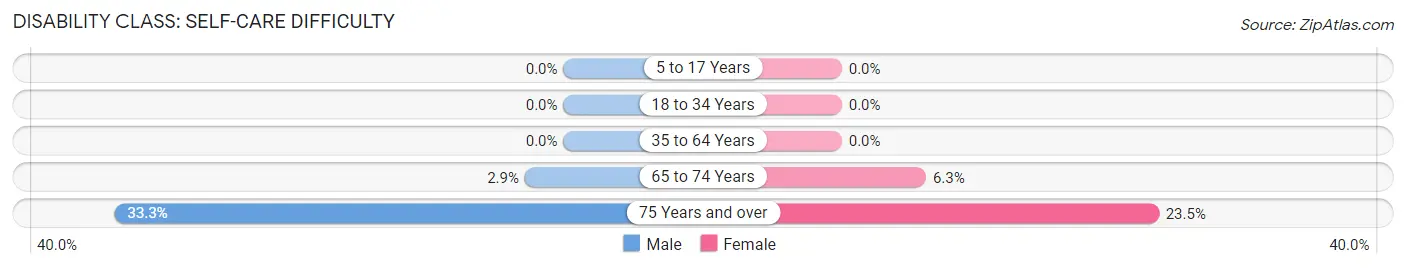
| Age Bracket | Male | Female |
| 5 to 17 Years | 0 (0.0%) | 0 (0.0%) |
| 18 to 34 Years | 0 (0.0%) | 0 (0.0%) |
| 35 to 64 Years | 0 (0.0%) | 0 (0.0%) |
| 65 to 74 Years | 1 (2.9%) | 1 (6.2%) |
| 75 Years and over | 2 (33.3%) | 4 (23.5%) |
Technology Access in Alpha
Computing Device Access in Alpha
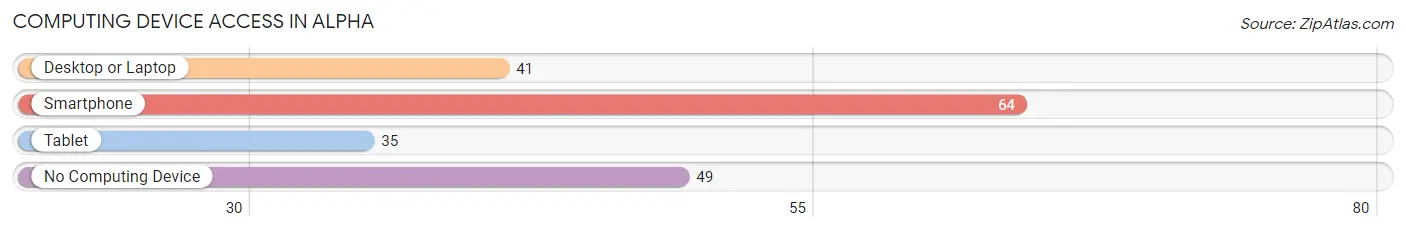
| Device Type | # Households | % Households |
| Desktop or Laptop | 41 | 33.6% |
| Smartphone | 64 | 52.5% |
| Tablet | 35 | 28.7% |
| No Computing Device | 49 | 40.2% |
| Total | 122 | 100.0% |
Internet Access in Alpha
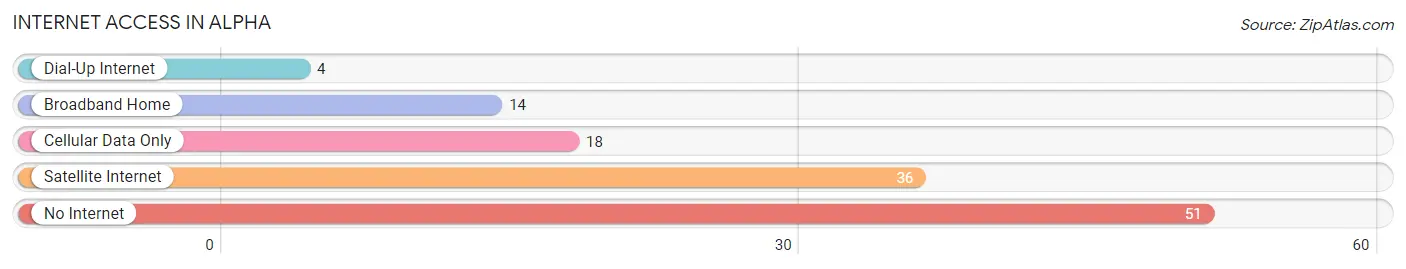
| Internet Type | # Households | % Households |
| Dial-Up Internet | 4 | 3.3% |
| Broadband Home | 14 | 11.5% |
| Cellular Data Only | 18 | 14.7% |
| Satellite Internet | 36 | 29.5% |
| No Internet | 51 | 41.8% |
| Total | 122 | 100.0% |
Alpha Summary
Alpha is a city located in the state of Michigan in the United States of America. It is located in the northern part of the state, in the Upper Peninsula, and is the county seat of Menominee County. The city has a population of approximately 1,500 people, according to the 2010 census.
History
The area that is now Alpha was first settled in the late 1800s by Finnish immigrants. The city was originally known as "Finn Town" and was later renamed Alpha in 1891. The name Alpha was chosen because it was the first letter of the Greek alphabet.
The city was incorporated in 1891 and was the first city in Menominee County. The city was a major lumbering center in the late 1800s and early 1900s. The lumber industry was the main source of employment for the city's residents.
Geography
Alpha is located in the Upper Peninsula of Michigan, in the northern part of the state. It is situated on the Menominee River, which is a tributary of Lake Michigan. The city is located about 30 miles east of Escanaba and about 40 miles west of Iron Mountain.
The city has a total area of 1.2 square miles, all of which is land. The terrain is mostly flat, with some rolling hills. The climate is humid continental, with cold winters and warm summers.
Economy
Alpha's economy is largely based on the lumber industry. The city is home to several lumber mills, which employ many of the city's residents. The city is also home to several small businesses, including restaurants, retail stores, and service providers.
The city is also home to a small airport, which serves the surrounding area. The airport is used for both commercial and private flights.
Demographics
According to the 2010 census, Alpha has a population of 1,500 people. The racial makeup of the city is 97.3% White, 0.7% African American, 0.3% Native American, 0.3% Asian, and 1.3% from other races. The median household income is $37,500, and the median age is 43.
Alpha is a small city with a close-knit community. The city is home to several churches, a library, and a museum. The city also hosts several annual events, including a Fourth of July parade and a Christmas parade.
Common Questions
What is Per Capita Income in Alpha?
Per Capita income in Alpha is $25,415.
What is the Median Family Income in Alpha?
Median Family Income in Alpha is $61,250.
What is the Median Household income in Alpha?
Median Household Income in Alpha is $36,417.
What is Income or Wage Gap in Alpha?
Income or Wage Gap in Alpha is 43.3%.
Women in Alpha earn 56.7 cents for every dollar earned by a man.
What is Inequality or Gini Index in Alpha?
Inequality or Gini Index in Alpha is 0.37.
What is the Total Population of Alpha?
Total Population of Alpha is 210.
What is the Total Male Population of Alpha?
Total Male Population of Alpha is 93.
What is the Total Female Population of Alpha?
Total Female Population of Alpha is 117.
What is the Ratio of Males per 100 Females in Alpha?
There are 79.49 Males per 100 Females in Alpha.
What is the Ratio of Females per 100 Males in Alpha?
There are 125.81 Females per 100 Males in Alpha.
What is the Median Population Age in Alpha?
Median Population Age in Alpha is 58.9 Years.
What is the Average Family Size in Alpha
Average Family Size in Alpha is 2.0 People.
What is the Average Household Size in Alpha
Average Household Size in Alpha is 1.7 People.
How Large is the Labor Force in Alpha?
There are 100 People in the Labor Forcein in Alpha.
What is the Percentage of People in the Labor Force in Alpha?
49.5% of People are in the Labor Force in Alpha.
What is the Unemployment Rate in Alpha?
Unemployment Rate in Alpha is 6.0%.